Embed Size (px)
Citation preview
UNIVERSITA’ CATTOLICA DEL SACRO CUORE
WORKING PAPER
DISCE Dipartimenti e Istituti di Scienze Economiche
On the determinants of the degree of openness of Open Source Firms: An entry model
Stefano Colombo Luca Grilli Cristina Rossi Lamastra
IEF0088 - May - 2009
UNIVERSITA’ CATTOLICA DEL SACRO CUORE - Milano -
QUADERNI DELL’ISTITUTO DI ECONOMIA E FINANZA
On the determinants of the degree of openness of Open Source Firms: An entry model
Stefano Colombo Luca Grilli Cristina Rossi Lamastra
n. 88 - maggio 2009
Quaderni dell’Istituto di Economia e Finanza numero 88 maggio 2009
On the determinants of the degree of openness of Open Source firms: An entry model
Stefano Colombo (*) Luca Grilli () Cristina Rossi Lamastra (^)
(*)Istituto di Economia e Finanza, Università Cattolica del Sacro Cuore, Largo Gemelli 1 – 20123 Milano, e-mail: [email protected] ()Politecnico di Milano, [email protected] (^)Politecnico di Milano, [email protected]
Comitato Scientifico Redazione Dino Piero Giarda Istituto di Economia e Finanza Michele Grillo Università Cattolica del S. Cuore Pippo Ranci Largo Gemelli 1 Giacomo Vaciago 20123 Milano tel.: 0039.02.7234.2976 fax: 0039.02.7234.2781 e-mail: [email protected] * Esemplare fuori commercio per il deposito legale agli effetti della Legge n. 106 del 15 aprile 2004. * La Redazione ottempera agli obblighi previsti dalla Legge n. 106 del 15.04.2006, Decreto del Presidente della Repubblica del 03.05.2006 n. 252 pubblicato nella G.U. del 18.08.2006 n. 191. * I quaderni sono disponibili on-line all’indirizzo dell’Istituto http://www.unicatt.it/istituti/EconomiaFinanza * I Quaderni dell’Istituto di Economia e Finanza costituiscono un servizio atto a fornire la tempestiva divulgazione di ricerche scientifiche originali, siano esse in forma definitiva o provvisoria. L’accesso alla collana è approvato dal Comitato Scientifico, sentito il parere di un referee.
1
On the determinants of the degree of openness of Open Source firms:
An entry model
Stefano Colombo, Luca Grilli■ and Cristina Rossi Lamastra
Abstract
This paper examines the relationship between the degree of openness that software start-ups choose and some of the main industrial features faced by new entrants. Hypotheses derived from a formal model are tested through the implementation of econometric techniques and information provided by a novel database (ELISS). Theoretical predictions and empirical results indicate that the choice by start-ups of the degree of openness is negatively influenced by the sensitivity of consumers to price and is positively related both to the strength of network externalities their products exhibit and to the competitive advantage of the incumbent.
Keywords: open-source software; network effects; entry
JEL codes: L13; L17; L86; 014
1. Introduction
Even though Open Source (OS) was born as an ideological oriented-movement, it is now rapidly transforming into a valuable business opportunity for software firms, which, in various ways, are taking advantage from the code and knowledge produced by communities of OS developers (Fitzgerald, 2006).
An increasing body of literature is addressing commercial companies’ involvement in the OS arena. Specifically, economic and managerial scholars have extensively explored: (i) business models built up to profit from the open code freely downloadable from the Web (Krishnamurthy, 2003; West, 2007); (ii) entrepreneurial processes activated out of successful OS programs (Gruber and Henkel, 2006; Dahlander, 2007); and (iii) firms’ relationships with OS communities (Dahlander and Wallin, 2006, Dahlander and Magnusson, 2008). As far this latter aspect, researchers have focused, in particular, on companies’ decision of revelling/not revelling their code back to OS developers (Henkel, 2006) and on firms’ active participation in OS community projects (Capra et al., 2009; Gosh et al., 2008; Lerner and Tirole, 2006).
In general, most of these works have adopted a descriptive approach, aiming at documenting, with rich and detailed qualitative and quantitative evidence, the puzzling phenomenon of for-profit agents’ participation in the private provision of a collective good (Johnson, 2005). Whereas, up to now, the theorising effort on the intriguing research questions posed by firms doing business out of Open Source have turned up to be unsatisfactory and several authors (Dalle et al., 2008; von Krogh et al., 2009) have pointed to the need of grounding the phenomenon in the mainstream economics and managerial discourse.
This paper aims at contributing in this direction by providing a theoretical model predicting the choice of the degree of openness by software start-up companies doing business out of OS and testing it on a dataset drawn from a large-scale survey taken, in 2004, on software firms in five European countries (Finland, Germany, Italy, Portugal, and Spain).
Università Cattolica del Sacro Cuore, Milano, e-mail: [email protected] ■ Politecnico di Milano, Milano, e-mail: [email protected] Politecnico di Milano, Milano, e-mail: [email protected]
2
In particular, following Bonaccorsi et al. (2006), we label as OS firms those companies providing solutions based on software produced by OS communities to their customers, either exclusively or in conjunction with proprietary products and services (hybrid firms). More specifically, we develop an entry model a là Armstrong and Vickers (1993) and test various hypotheses on the optimal degree of openness that software start-ups will choose depending on the characteristics of markets, products and consumers they deal with.
Degree of openness is computed as the weight of the OS offering over the total firm’s offering, as measured by the share of the turnover generated by the provision of OS solutions. The choice by start-ups of the degree of openness is posed in relation with the characteristics of the demand faced by companies (i.e. the sensitivity of consumers to price), the strength of the network externalities that their software products exhibit and, finally, the competitiveness of the market segments in which companies operate (i.e. the presence of a large incumbent in these segments).
In this respect, we extend previous contributions on the topic, thus adding to the current academic debate, in several respects.
As Casadesus-Masanell and Ghemawat (2006), we acknowledge the role of network externalities in shaping competition between OS and proprietary software. However, their contribution focuses on the interactions between a proprietary incumbent and a community producing open code, setting aside traditional competition among firms on the market. Moreover, no elements related to price competition (e.g. authors claim that the price of the OS product is zero) or to characteristics of market segments in which companies operate are included. At the same time, theoretical predictions are not tested through empirical data. Conversely, testing on determinants of firms’ degree of openness is included in the work of Bonaccorsi et al. (2006), but, on the one hand, they do not provide a theoretical model on which to ground their econometric analysis; on the other hand, they focus mainly on the impact on the degree of openness of firms’ structural characteristics and relationships with OS communities, setting the influence of the external environment in which companies are embedded aside.
To the best of our knowledge, this is the first contribution in the industrial organization stream of literature that aims at investigating, both theoretically and empirically, the impact of market, consumers, product characteristics on the degree of openness chosen by start-ups entering the software industry. In so doing, our model is not meant to supply a literal representation of the choice of the degree of openness by OS firms, which is related to a plethora of company-specific and idiosyncratic motives, but, instead to provide a stripped-down theoretical structure for weighing various claims about the competition between OS and proprietary mode of producing software.
The remainder of the paper is organised as follows. In Section 2, we formalize an entry model in a context characterized by network externalities, we predict how the optimal choice of the degree of openness chosen by entrants varies along with the investigated dimensions, and develop the theoretical hypotheses to be tested through the econometric analysis. In Section 3, we illustrate our sample and provide some descriptive statistics on degree of openness chosen by software start-ups, focusing also on demand characteristics and the structure of the market segments in which firms compete. In Section 4, we specify the econometric model and describe the variables used in the analysis. Section 5 is devoted to the illustration of the results of the econometric estimates, while some summarizing remarks in section 6 conclude the paper.
2. The model
In this section we develop a simple entry model in the spirit of Armstrong and Vickers (1993), in which a new entrant firm faces a well-established incumbent in a framework characterized by network externalities.
3
Let suppose that there are two firms, firm I (incumbent) and firm E (entrant), each offering a bundle of goods (for example, a software package). The goods composing the package cannot be sold separately, so both firms adopt a tying rather than a bundling commercial strategy. Firm I sells all goods composing the package in “proprietary” (P) format, while firm E may decide to offer some goods of the package in an “open source” (OS) format. There are two periods: period 1 (current period) and period 2 (future period). At period 1 firm E enters and decides the degree of openness, i.e. how many goods in the package shall be offered in the OS format. Firm I observes the degree of openness and sets the price.
We follow Armstrong and Vickers (1993) and we assume that the entrant is price taker. The market is characterized by network externalities. Following Casadesus-Masanell and Ghemawat (2006) and Jing (2007) network externalities imply that demand of each firm in each period is positively affected by the cumulative market share (or installed base). Since firm E enters at period 1, the installed base of firm E at period 1 is zero, while the incumbent, which was in the market before period 1, owns a positive installed base. Allegedly, the demand functions of firm I and firm E at period 1 are given respectively by:
)),,(( 111III pWebQQ
)( 111IEI QQQ
where 0 indicates the competitive advantage of firm I over firm E, 0e indicates the network externalities, and 0b indicates the installed base at period 1. Moreover, define oyW , where y measures the “incumbency advantage” (different from the installed base effect) of firm I and o is the degree of openness chosen by firm E1.
Assume: 01
1
I
I
p
Q, 01
IQ, 0
b
, 0
e
, 0W
and 0
1
1
I
E
Q
Q.
The first inequality is obvious and needs no explanation: parameter indicates the price sensitivity of the demand. The second inequality states that, ceteris paribus, the demand of I increases with the competitive advantage of firm I over firm E. The third inequality states that the competitive advantage of I increases with b: due to the existence of positive network externalities, the higher is the cumulative market share of firm I when firm E enters, the more firm I is advantaged (i.e. ceteris paribus, more consumers buy from it rather than E). The fourth inequality is the counterpart of the third inequality: due to the existence of a positive installed base of firm I, the higher are the externalities, the more firm I is advantaged from having a positive installed base. The fifth inequality states that the competitive advantage of I depends positively on W: that is, the competitive advantage of I depends positively on the incumbency advantage, y, and negatively on the degree of openness, o. The sixth inequality follows Armstrong and Vickers (1993), and characterizes firm E’ demand as a residual demand.
The fifth and the sixth inequality together imply that demand of firm E increases with the degree of openness, while demand of firm I decreases with the degree of openness. This, of course, is not a general assumption. It may be that consumers, on average, dislike OS-format: in this case, a positive degree of openness would reduce firm E demand and would increase firm I demand.
1 Parameter y has a quite general interpretation. For example, advertisement expenditures by the incumbent affect the “incumbency advantage”; similarly, high perceived quality of the incumbent’s product positively reflects on the “incumbency advantage”.

4
However, software markets (specifically those considered by us) are usually characterized by a general appraisal of consumers towards OS format (certainly consumers who exhibit an aprioristic dislike represent a minority), as can be inferred, for example, by the huge development of “open source communities” and the widespread diffusion of “free software”. Therefore, a firm which matches the consensus surrounding open source philosophy by offering some of its product in OS shall be likely to increase its demand to detriment of the firm which is fixed to proprietary format.
Define: )(* 12 egQQ II , where )(eg is a strictly-increasing function of e. Function )(eg captures the idea that the higher are the externalities, the more period 1 demand positively affects period 2 demand. Finally, in order to keep tractability, the following assumptions on the parameters of the model are introduced:
a) ]*
**
[ 22
11
I
EI
E pQ
pQ
b)
*
*
** 1
1
11I
I
II p
p
c)
*
*
** 1
1
11I
I
II p
p
2.1 Analysis
Define with *2Iq and *2
Ip respectively the equilibrium demand and the equilibrium price of firm I in period 2. When firm I sets the price in period 1, it anticipates that, due to the existence of network externalities, both *2
Iq and *2Ip shall depend on the quantity sold at time 1. Therefore, in
period 1 firm I maximizes the following function:
))),,((),,((*)),((*)),,(( 1122111IIIIIIII pWebQWebQWebppWebQp (1)
where )1,0( is the discount factor. By taking the derivative of (1) with respect to Ip1 , we get the first order condition for the maximization problem2:
0)),((*)(**)),,(( 21111
WebpegppWebQp
IIIII
I
(2)
From condition (2) we derive the impact of each variable on the equilibrium price set by firm I. Consider the derivative of (2) with respect to :
*
)( 21
1
2 II
I
I peg
Q
p (3)
2 It can be easily checked that the second-order condition is satisfied.

5
Conjecture for the moment that 0*2 Ip (we check later that this conjecture is indeed correct) and assume that the second derivatives are negligible in dimension.3 When externalities are
sufficiently low the first term in (3) dominates and
I
I
p1
2
is positive, while the reverse is true
when externalities are high. Therefore, 0*1
Ip when *ee and 0
*1
Ip when *ee , where
e* is given by 0*)(1
2
epI
I
. Hence, we can state the following result:
The incumbent’s first-period equilibrium price increases with the competitive advantage when externalities are low, while it decreases when externalities are high.
The intuition of the result is the following. When the competitive advantage of firm I increases there are two effects at work: a direct effect and an indirect effect. Higher implies that firm I can set a higher price today and in the future (direct effect). However, the higher price in the current period reduces the current demand, and, via externalities, it reduces also the future demand (indirect effect). When externalities are particularly high, the indirect effect dominates, and the impact of on the equilibrium price at time 1 is negative.
Turn now to the conjecture 0*2 Ip . Since in period 2 there is no future left, firm I has no incentive to decrease its price when increases in order to exploit higher future demand. That is, no indirect effect arises. It follows that, in equilibrium, the price in period 2 must increase with the competitive advantage. Therefore, conjecture 0*2 Ip is correct.
Now, note that, since is a positive function of W, e and b, the impact of these variables on *1Ip is
also positive when externalities are low and is negative when externalities are high. However, while the threshold value of the externalities in the case of b and W continues to be e*, the threshold value in case of e, due to the component g(e), may be different from e*. In fact, by taking the derivative of (2) with respect to e, we get:
e
gp
e
peg
e
Q
epI
II
I
I
**
)( 221
1
2
(4)
Therefore, the threshold value for the impact of e on the equilibrium price set by firm I in period 1
is given by e , where: 0)ˆ(1
2
eepI
I
. Assume for the moment that *ˆ ee . We will turn later to the
case *ˆ ee . Finally, note that higher implies a lower price in both periods.
The equilibrium demand of firm I at period 1 is:
3 Note that this is always true with linear demand functions.

6
)),,(*,(** 111 III pQQ
Assumptions b) – c) allow us to write:
),,(** 11 II QQ
with 0*1 IQ and 0*1 IQ 4. Firm E faces the following profit function:
**))(*(***)( 2122111IIIEIIEE pQQQpQQ
What does firm E choose? By choosing the degree of openness, firm E is able to alter the competitive advantage of firm I. Therefore, firm E maximizes E with respect to W5. The first order condition is:
**
**
*
*
*
**
*
*2
21
1
1
2
2
21
11
1
1
1 EI
II
I
I
I
EE
II
I
I
EE
QW
pp
W
Q
Q
Q
Q
W
pp
W
Q
Q
Q
W
(5)
Consider first *ee . Due to assumption a), equation (5) is always negative6. Therefore: WW min* where W is the set of all possible Ws.
Suppose now *ee . The first and the third term in (5) are negative, while the third and the fourth
term are positive. Assume that a W* such that: 0*)(
WW
E
exists. The second order condition
(disregarding the cross-derivatives) is:
]****
*
*
*[
***
*2211
1
2
2
21111
1
12
2
W
Q
W
p
W
p
W
Q
Q
Q
Q
Q
W
Q
W
p
W
p
W
Q
Q
Q
W
EIII
I
I
I
EEIII
I
EE
(6)
Since all terms in (6) are negative, W* is a maximum. Let consider the derivative of (5) with respect to e (disregarding the cross-derivatives). We get:
4 Additionally, it can be easily shown that 0*1 IQ . In fact, by taking the derivative of equation (2) with respect to
one gets: 0)),((*)( 2 Webpeg I . It follows 0*1 Ip , which yields 0*1 IQ . The intuition is
straightforward. The higher is the weight attached to the future (i.e. the higher is ), the higher is the incentive to keep the price low today in order to expand the current demand and, via externalities, the future demand. 5 Clearly, choosing the optimal W coincides with choosing the optimal degree of openness, o, once that the incumbency advantage, y, is exogenous. 6 If assumption a) – which amounts to require that the discount factor is not too high – does not hold, equation (5) may be positive or negative. More importantly, the satisfaction of the second order condition would require further assumptions on the parameters of the model, and no clear results could be obtained.
7
]***
*
*
*
*[
***
*2211
1
2
2
21111
1
12
e
Q
W
p
e
p
W
Q
Q
Q
Q
Q
e
Q
W
p
e
p
W
Q
Q
Q
eW
EIII
I
I
I
EEIII
I
EE
(7)
Note that all terms in (7) are negative. Therefore, 0* eW .
Let consider now the derivative of (5) with respect to :
]****
*
*
*
*[
***
*2211
1
2
2
21111
1
12
EIII
I
I
I
EEIII
I
EE Q
W
pp
W
Q
Q
Q
Q
W
pp
W
Q
Q
Q
W (8)
Note that all terms in (8) are positive. Therefore, 0* W .
Recalling that W depends negatively on the degree of openness, we can summarize the results in the following proposition:
When *ee , the entrant chooses the maximum degree of openness. When *ee , the equilibrium degree of openness increases with the externalities and in the competitive advantage of the incumbent, while it decreases in the price sensitivity.
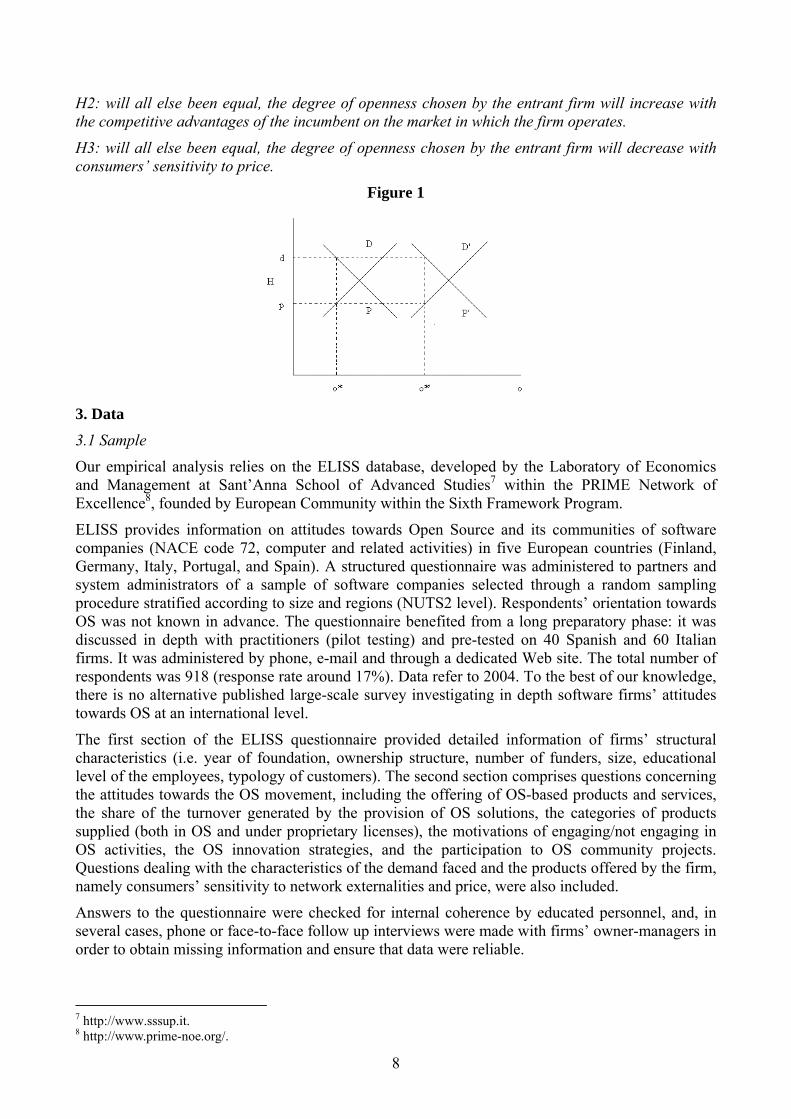
The intuition of the proposition can be obtained by looking at Figure 1. When *ee , higher degree of openness increases the demand of firm E but lowers the price set by firm I. Define with D the “demand” curve, i.e. the curve describing the effect of o on firm E’ demand, and with P the “price” curve, i.e. the curve describing the effect of o on firm I’ price. Suppose that optimal balancing between demand and price implies that the demand is equal to d and the price is equal to p, i.e. the distance between the D-curve and the P-curve is pdH . The equilibrium degree of openness is therefore o*. Suppose now that the externalities or the competitive advantage increase. Ceteris paribus, the higher is e or the lower is the demand of firm E and the higher is the price set by firm I. The D-curve shifts downward and the P-curve shifts upward. In order to maintain the same H-distance between D and P, the new equilibrium degree of openness, o*’, must be located at the right of o*. With regard to the price sensitivity the opposite reasoning holds. Instead, when *ee , firm E sets the highest possible o, since o increases both the demand of firm E and the price set by firm I.
Suppose now that *ˆ ee . Equation (7) has an ambiguous sign when: *],ˆmin[*],ˆmax[ eeeee . However, when *],ˆmin[ eee equation (7) is unambiguously negative. Therefore, for sufficiently low externalities, equilibrium degree of openness increases with externalities. Finally, when
*],ˆmax[ eee firm E chooses the maximum degree of openness.
Basing on the proposition of our theoretical model, we put forward the following hypotheses to be tested through econometric models.
H1: with all else been equal, the degree of openness chosen by the entrant firm will increase with the consumers’ sensitivity to network externalities.
8
H2: will all else been equal, the degree of openness chosen by the entrant firm will increase with the competitive advantages of the incumbent on the market in which the firm operates.
H3: will all else been equal, the degree of openness chosen by the entrant firm will decrease with consumers’ sensitivity to price.
Figure 1
3. Data
3.1 Sample
Our empirical analysis relies on the ELISS database, developed by the Laboratory of Economics and Management at Sant’Anna School of Advanced Studies7 within the PRIME Network of Excellence8, founded by European Community within the Sixth Framework Program.
ELISS provides information on attitudes towards Open Source and its communities of software companies (NACE code 72, computer and related activities) in five European countries (Finland, Germany, Italy, Portugal, and Spain). A structured questionnaire was administered to partners and system administrators of a sample of software companies selected through a random sampling procedure stratified according to size and regions (NUTS2 level). Respondents’ orientation towards OS was not known in advance. The questionnaire benefited from a long preparatory phase: it was discussed in depth with practitioners (pilot testing) and pre-tested on 40 Spanish and 60 Italian firms. It was administered by phone, e-mail and through a dedicated Web site. The total number of respondents was 918 (response rate around 17%). Data refer to 2004. To the best of our knowledge, there is no alternative published large-scale survey investigating in depth software firms’ attitudes towards OS at an international level.
The first section of the ELISS questionnaire provided detailed information of firms’ structural characteristics (i.e. year of foundation, ownership structure, number of funders, size, educational level of the employees, typology of customers). The second section comprises questions concerning the attitudes towards the OS movement, including the offering of OS-based products and services, the share of the turnover generated by the provision of OS solutions, the categories of products supplied (both in OS and under proprietary licenses), the motivations of engaging/not engaging in OS activities, the OS innovation strategies, and the participation to OS community projects. Questions dealing with the characteristics of the demand faced and the products offered by the firm, namely consumers’ sensitivity to network externalities and price, were also included.
Answers to the questionnaire were checked for internal coherence by educated personnel, and, in several cases, phone or face-to-face follow up interviews were made with firms’ owner-managers in order to obtain missing information and ensure that data were reliable.
7 http://www.sssup.it. 8 http://www.prime-noe.org/.
9
In this paper, we consider a sample extracted from the ELISS database and composed of all software firms satisfying the following conditions: (i) were founded after 2000; (ii) have no missing data in the variables we wish to include in the analysis. As far as the former condition, this extracts from the database only those firms which are still in a start-up phase and allegedly can be deemed as early entrants. In fact, on an empirical ground, it is difficult to define unambiguously when the entrant firm that founders have in mind actually materialize since time is needed to hire personnel and organize operations at the desired scale (for the same argument see Colombo et al. 2004). In this respect we adopted a conservative criterion including in the sample all the firms aged four years or less, controlling for their ages in the specification of the econometric model (see infra). The final sample was thus composed by 150 firms.9
The sample includes both firms working only with proprietary software (proprietary firms: 46 out of 150, 30.46%) and companies doing business out of Open Source (OS firms: 104 out of 150, 69.33%). Following Bonaccorsi et al. 2006, we define OS firms those companies that supply, in various ways, OS-based products and services to their customers. It is worth noting that a firm is labelled as OS even if its product portfolio includes proprietary solutions (hybrid firms: 75 out of 104, 73.08%). The degree of openness of firms working only with proprietary software is, by definition, zero.
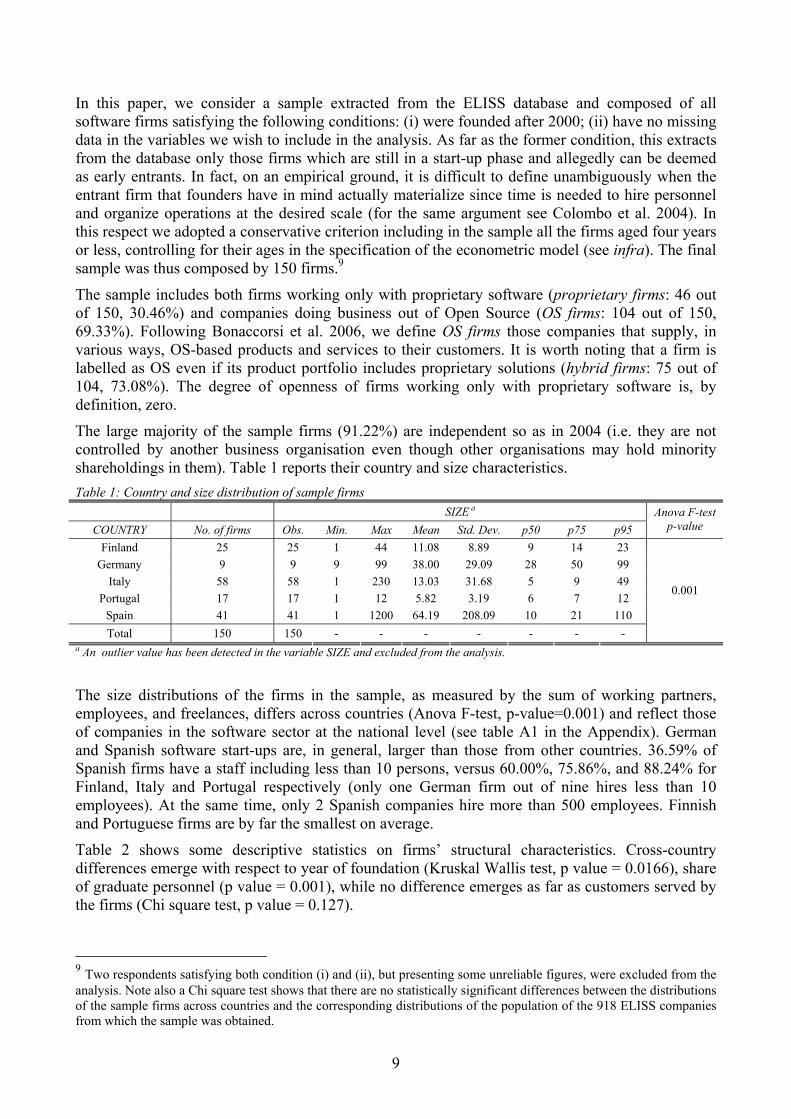
The large majority of the sample firms (91.22%) are independent so as in 2004 (i.e. they are not controlled by another business organisation even though other organisations may hold minority shareholdings in them). Table 1 reports their country and size characteristics.
Table 1: Country and size distribution of sample firms
SIZE a
COUNTRY No. of firms Obs. Min. Max Mean Std. Dev. p50 p75 p95
Anova F-test p-value
Finland 25 25 1 44 11.08 8.89 9 14 23
Germany 9 9 9 99 38.00 29.09 28 50 99
Italy 58 58 1 230 13.03 31.68 5 9 49
Portugal 17 17 1 12 5.82 3.19 6 7 12
Spain 41 41 1 1200 64.19 208.09 10 21 110
Total 150 150 - - - - - - -
0.001
a An outlier value has been detected in the variable SIZE and excluded from the analysis.
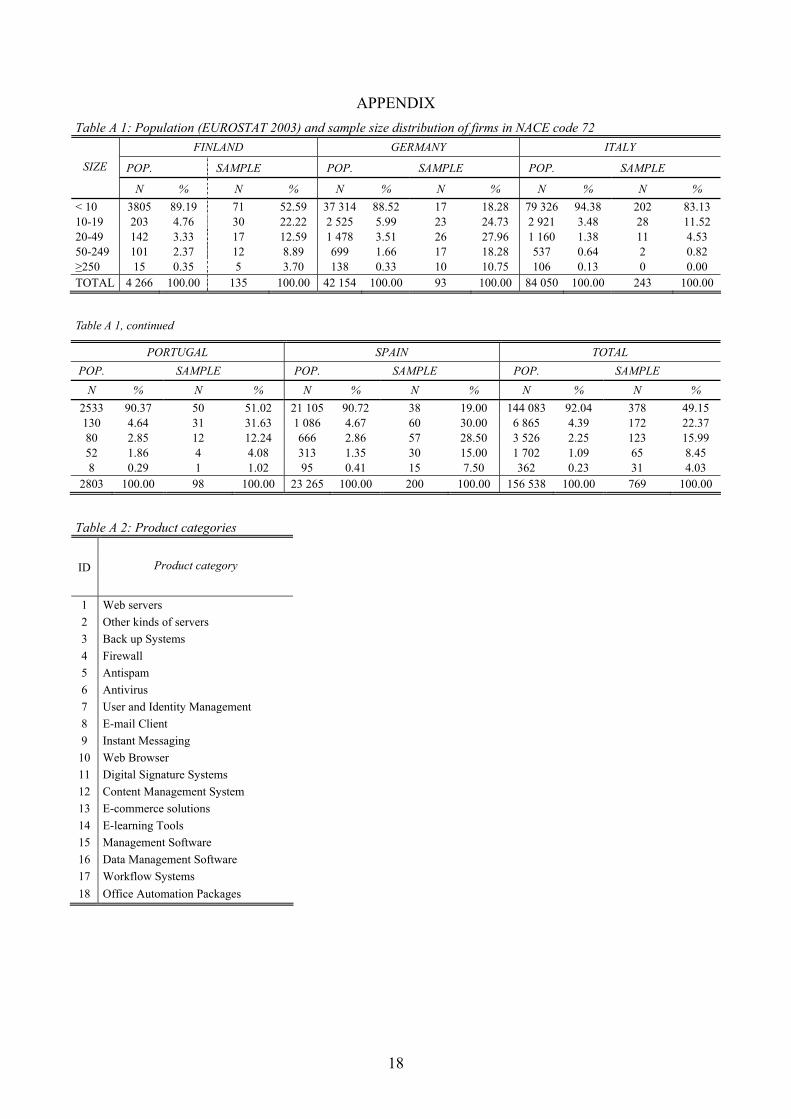
The size distributions of the firms in the sample, as measured by the sum of working partners, employees, and freelances, differs across countries (Anova F-test, p-value=0.001) and reflect those of companies in the software sector at the national level (see table A1 in the Appendix). German and Spanish software start-ups are, in general, larger than those from other countries. 36.59% of Spanish firms have a staff including less than 10 persons, versus 60.00%, 75.86%, and 88.24% for Finland, Italy and Portugal respectively (only one German firm out of nine hires less than 10 employees). At the same time, only 2 Spanish companies hire more than 500 employees. Finnish and Portuguese firms are by far the smallest on average.
Table 2 shows some descriptive statistics on firms’ structural characteristics. Cross-country differences emerge with respect to year of foundation (Kruskal Wallis test, p value = 0.0166), share of graduate personnel (p value = 0.001), while no difference emerges as far as customers served by the firms (Chi square test, p value = 0.127).
9 Two respondents satisfying both condition (i) and (ii), but presenting some unreliable figures, were excluded from the analysis. Note also a Chi square test shows that there are no statistically significant differences between the distributions of the sample firms across countries and the corresponding distributions of the population of the 918 ELISS companies from which the sample was obtained.
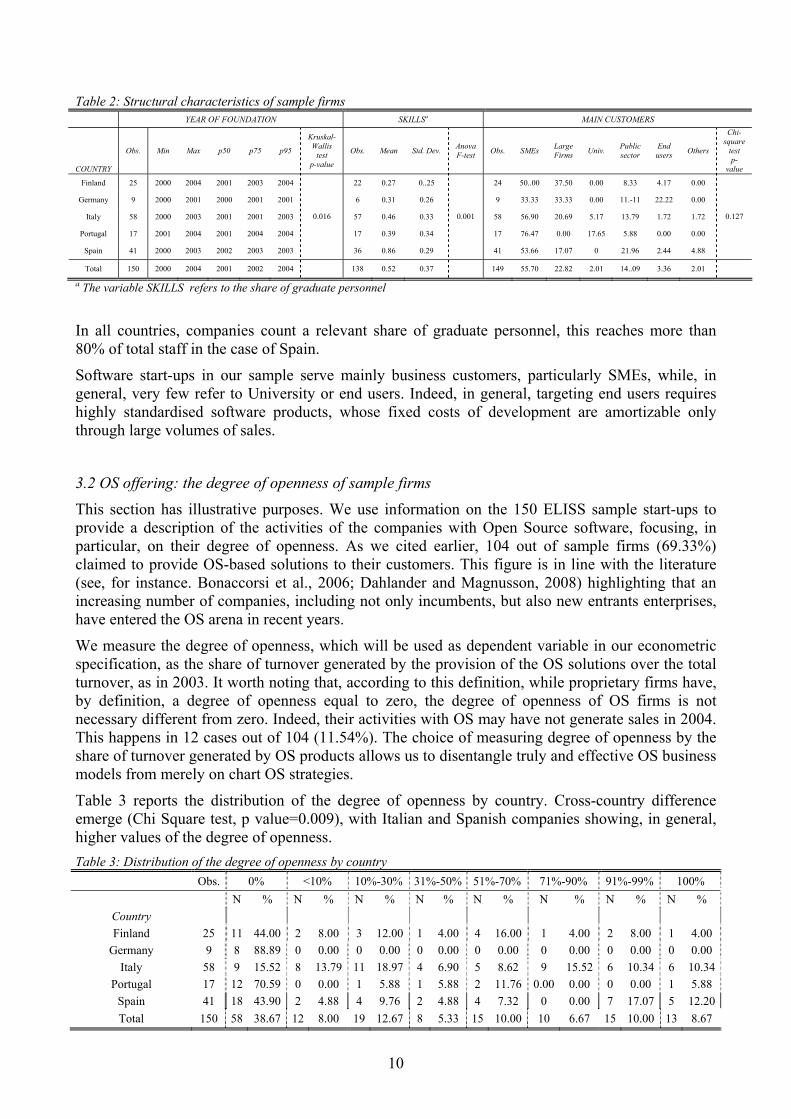
10
Table 2: Structural characteristics of sample firms YEAR OF FOUNDATION SKILLSa MAIN CUSTOMERS
COUNTRY
Obs. Min Max p50 p75 p95
Kruskal- Wallis
test p-value
Obs. Mean Std. Dev. Anova F-test
Obs. SMEs Large Firms
Univ. Public sector
End users
Others
Chi-square
test p-
value
Finland 25 2000 2004 2001 2003 2004 22 0.27 0..25 24 50..00 37.50 0.00 8.33 4.17 0.00
Germany 9 2000 2001 2000 2001 2001 6 0.31 0.26 9 33.33 33.33 0.00 11.-11 22.22 0.00
Italy 58 2000 2003 2001 2001 2003 57 0.46 0.33 58 56.90 20.69 5.17 13.79 1.72 1.72
Portugal 17 2001 2004 2001 2004 2004 17 0.39 0.34 17 76.47 0.00 17.65 5.88 0.00 0.00
Spain 41 2000 2003 2002 2003 2003
0.016
36 0.86 0.29
0.001
41 53.66 17.07 0 21.96 2.44 4.88
0.127
Total 150 2000 2004 2001 2002 2004 138 0.52 0.37 149 55.70 22.82 2.01 14..09 3.36 2.01
a The variable SKILLS refers to the share of graduate personnel
In all countries, companies count a relevant share of graduate personnel, this reaches more than 80% of total staff in the case of Spain.
Software start-ups in our sample serve mainly business customers, particularly SMEs, while, in general, very few refer to University or end users. Indeed, in general, targeting end users requires highly standardised software products, whose fixed costs of development are amortizable only through large volumes of sales.
3.2 OS offering: the degree of openness of sample firms
This section has illustrative purposes. We use information on the 150 ELISS sample start-ups to provide a description of the activities of the companies with Open Source software, focusing, in particular, on their degree of openness. As we cited earlier, 104 out of sample firms (69.33%) claimed to provide OS-based solutions to their customers. This figure is in line with the literature (see, for instance. Bonaccorsi et al., 2006; Dahlander and Magnusson, 2008) highlighting that an increasing number of companies, including not only incumbents, but also new entrants enterprises, have entered the OS arena in recent years.
We measure the degree of openness, which will be used as dependent variable in our econometric specification, as the share of turnover generated by the provision of the OS solutions over the total turnover, as in 2003. It worth noting that, according to this definition, while proprietary firms have, by definition, a degree of openness equal to zero, the degree of openness of OS firms is not necessary different from zero. Indeed, their activities with OS may have not generate sales in 2004. This happens in 12 cases out of 104 (11.54%). The choice of measuring degree of openness by the share of turnover generated by OS products allows us to disentangle truly and effective OS business models from merely on chart OS strategies.
Table 3 reports the distribution of the degree of openness by country. Cross-country difference emerge (Chi Square test, p value=0.009), with Italian and Spanish companies showing, in general, higher values of the degree of openness.
Table 3: Distribution of the degree of openness by country
Obs. 0% <10% 10%-30% 31%-50% 51%-70% 71%-90% 91%-99% 100%
N % N % N % N % N % N % N % N %
Country
Finland 25 11 44.00 2 8.00 3 12.00 1 4.00 4 16.00 1 4.00 2 8.00 1 4.00
Germany 9 8 88.89 0 0.00 0 0.00 0 0.00 0 0.00 0 0.00 0 0.00 0 0.00
Italy 58 9 15.52 8 13.79 11 18.97 4 6.90 5 8.62 9 15.52 6 10.34 6 10.34
Portugal 17 12 70.59 0 0.00 1 5.88 1 5.88 2 11.76 0.00 0.00 0 0.00 1 5.88
Spain 41 18 43.90 2 4.88 4 9.76 2 4.88 4 7.32 0 0.00 7 17.07 5 12.20
Total 150 58 38.67 12 8.00 19 12.67 8 5.33 15 10.00 10 6.67 15 10.00 13 8.67
11
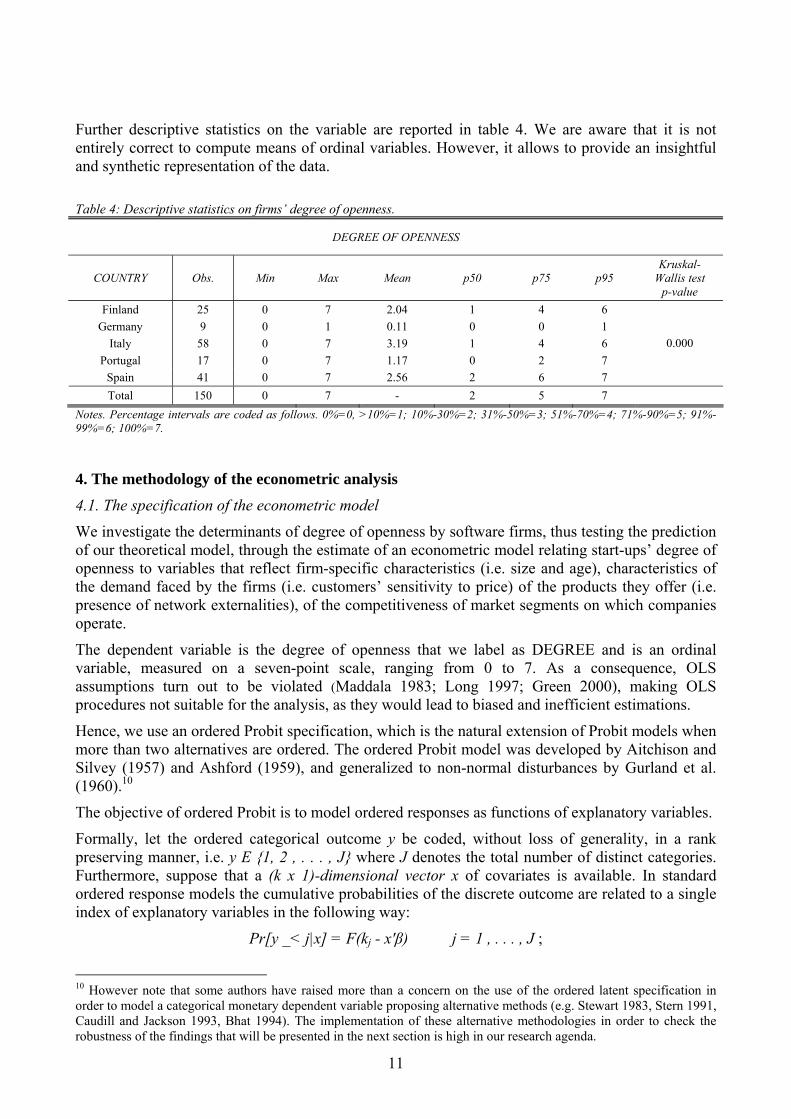
Further descriptive statistics on the variable are reported in table 4. We are aware that it is not entirely correct to compute means of ordinal variables. However, it allows to provide an insightful and synthetic representation of the data.
Table 4: Descriptive statistics on firms’ degree of openness.
DEGREE OF OPENNESS
COUNTRY Obs. Min Max Mean p50 p75 p95 Kruskal-
Wallis test p-value
Finland 25 0 7 2.04 1 4 6
Germany 9 0 1 0.11 0 0 1
Italy 58 0 7 3.19 1 4 6
Portugal 17 0 7 1.17 0 2 7
Spain 41 0 7 2.56 2 6 7
0.000
Total 150 0 7 - 2 5 7
Notes. Percentage intervals are coded as follows. 0%=0, >10%=1; 10%-30%=2; 31%-50%=3; 51%-70%=4; 71%-90%=5; 91%-99%=6; 100%=7.
4. The methodology of the econometric analysis
4.1. The specification of the econometric model
We investigate the determinants of degree of openness by software firms, thus testing the prediction of our theoretical model, through the estimate of an econometric model relating start-ups’ degree of openness to variables that reflect firm-specific characteristics (i.e. size and age), characteristics of the demand faced by the firms (i.e. customers’ sensitivity to price) of the products they offer (i.e. presence of network externalities), of the competitiveness of market segments on which companies operate.
The dependent variable is the degree of openness that we label as DEGREE and is an ordinal variable, measured on a seven-point scale, ranging from 0 to 7. As a consequence, OLS assumptions turn out to be violated (Maddala 1983; Long 1997; Green 2000), making OLS procedures not suitable for the analysis, as they would lead to biased and inefficient estimations.
Hence, we use an ordered Probit specification, which is the natural extension of Probit models when more than two alternatives are ordered. The ordered Probit model was developed by Aitchison and Silvey (1957) and Ashford (1959), and generalized to non-normal disturbances by Gurland et al. (1960).10
The objective of ordered Probit is to model ordered responses as functions of explanatory variables.
Formally, let the ordered categorical outcome y be coded, without loss of generality, in a rank preserving manner, i.e. y E {1, 2 , . . . , J} where J denotes the total number of distinct categories. Furthermore, suppose that a (k x 1)-dimensional vector x of covariates is available. In standard ordered response models the cumulative probabilities of the discrete outcome are related to a single index of explanatory variables in the following way:
Pr[y _< j|x] = F(kj - x'β) j = 1 , . . . , J ;
10 However note that some authors have raised more than a concern on the use of the ordered latent specification in order to model a categorical monetary dependent variable proposing alternative methods (e.g. Stewart 1983, Stern 1991, Caudill and Jackson 1993, Bhat 1994). The implementation of these alternative methodologies in order to check the robustness of the findings that will be presented in the next section is high in our research agenda.
12
where kj and β(k+1) are unknown model parameters, and F can be any monotonic increasing function mapping the real line onto the unit interval.
Although no further restrictions are imposed a priori on the transformation F it is standard to replace F by a distribution function, the most commonly used ones being the standard normal (which yields the ordered probit) and the logistic distribution (associated with the ordered logit model), and we assume in what follows that F represents the standard normal distribution. In order to ensure well-defined probabilities, we require that kj > kj-1, for every j, and it is understood that kj = such that F( ) = 1 as well as k0 = - such that F(- ) = 0.
Ordered response models are usually motivated by an underlying continuous but latent process y* together with a response mechanism of the form
y = j if and only if kj-1 ≤ y* = x’β +u < kj j = l , . . . , J ;
where k0 , . . . , kj are introduced as threshold parameters, discretizing the real line, represented by y*, into J categories. The latent variable y* is related linearly to observable and unobservable factors and the latter have a fully specified distribution function F(u) with zero mean and constant variance.
As common in this typology of model, the framework can be postulated without assuming the existence of a latent part and a threshold mechanism, though. Moreover, since y* cannot be observed and is purely artificial, its interpretation is not of interest.
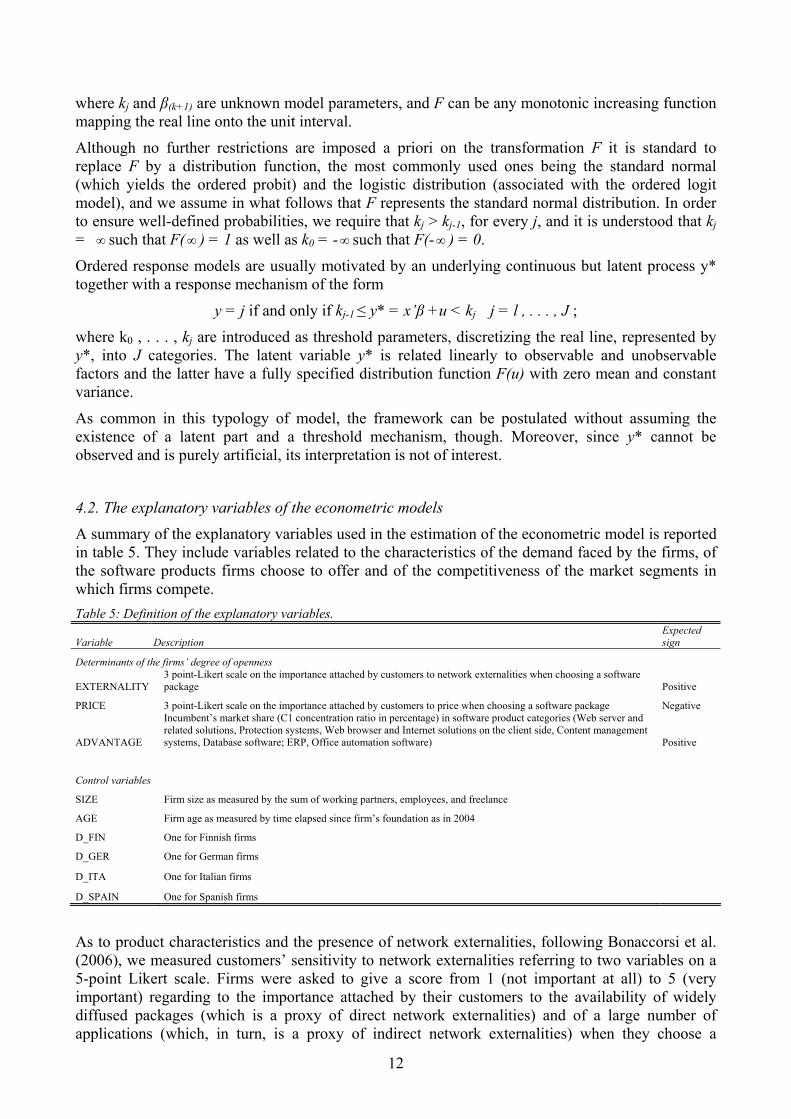
4.2. The explanatory variables of the econometric models
A summary of the explanatory variables used in the estimation of the econometric model is reported in table 5. They include variables related to the characteristics of the demand faced by the firms, of the software products firms choose to offer and of the competitiveness of the market segments in which firms compete.
Table 5: Definition of the explanatory variables.
Variable Description Expected sign
Determinants of the firms’ degree of openness
EXTERNALITY 3 point-Likert scale on the importance attached by customers to network externalities when choosing a software package Positive
PRICE 3 point-Likert scale on the importance attached by customers to price when choosing a software package Negative
ADVANTAGE
Incumbent’s market share (C1 concentration ratio in percentage) in software product categories (Web server and related solutions, Protection systems, Web browser and Internet solutions on the client side, Content management systems, Database software; ERP, Office automation software) Positive
Control variables
SIZE Firm size as measured by the sum of working partners, employees, and freelance
AGE Firm age as measured by time elapsed since firm’s foundation as in 2004
D_FIN One for Finnish firms
D_GER One for German firms
D_ITA One for Italian firms
D_SPAIN One for Spanish firms
As to product characteristics and the presence of network externalities, following Bonaccorsi et al. (2006), we measured customers’ sensitivity to network externalities referring to two variables on a 5-point Likert scale. Firms were asked to give a score from 1 (not important at all) to 5 (very important) regarding to the importance attached by their customers to the availability of widely diffused packages (which is a proxy of direct network externalities) and of a large number of applications (which, in turn, is a proxy of indirect network externalities) when they choose a
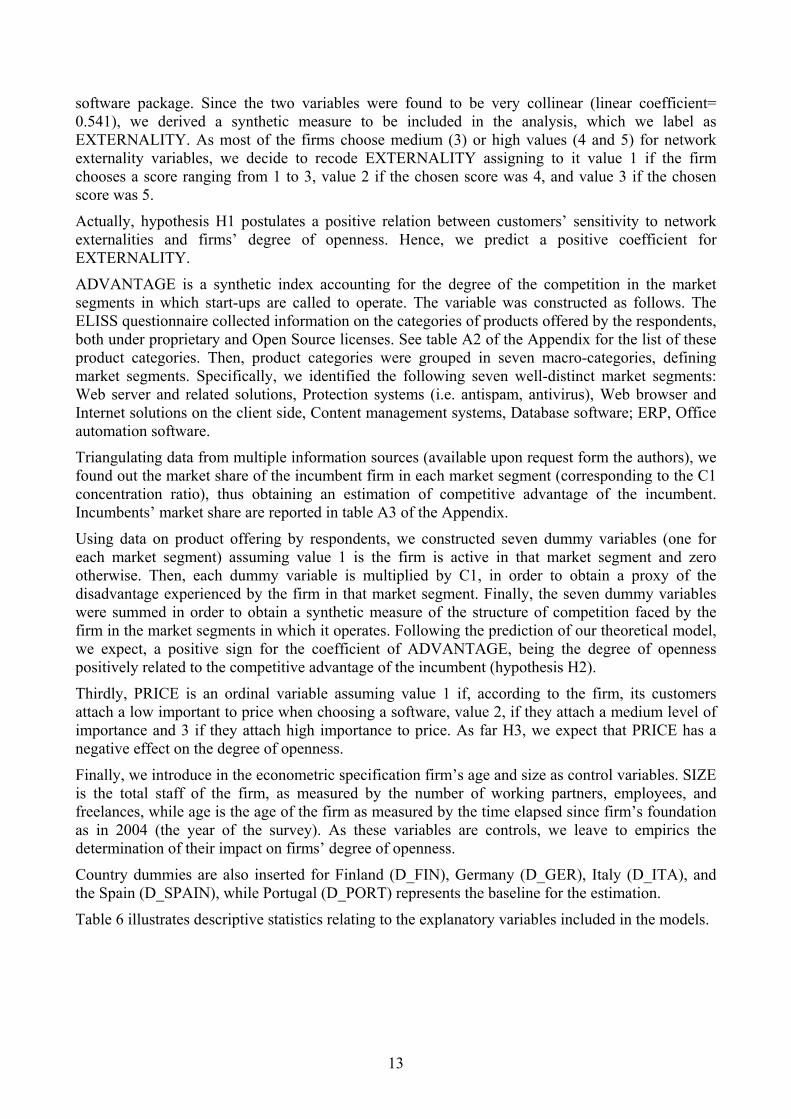
13
software package. Since the two variables were found to be very collinear (linear coefficient= 0.541), we derived a synthetic measure to be included in the analysis, which we label as EXTERNALITY. As most of the firms choose medium (3) or high values (4 and 5) for network externality variables, we decide to recode EXTERNALITY assigning to it value 1 if the firm chooses a score ranging from 1 to 3, value 2 if the chosen score was 4, and value 3 if the chosen score was 5.
Actually, hypothesis H1 postulates a positive relation between customers’ sensitivity to network externalities and firms’ degree of openness. Hence, we predict a positive coefficient for EXTERNALITY.
ADVANTAGE is a synthetic index accounting for the degree of the competition in the market segments in which start-ups are called to operate. The variable was constructed as follows. The ELISS questionnaire collected information on the categories of products offered by the respondents, both under proprietary and Open Source licenses. See table A2 of the Appendix for the list of these product categories. Then, product categories were grouped in seven macro-categories, defining market segments. Specifically, we identified the following seven well-distinct market segments: Web server and related solutions, Protection systems (i.e. antispam, antivirus), Web browser and Internet solutions on the client side, Content management systems, Database software; ERP, Office automation software.
Triangulating data from multiple information sources (available upon request form the authors), we found out the market share of the incumbent firm in each market segment (corresponding to the C1 concentration ratio), thus obtaining an estimation of competitive advantage of the incumbent. Incumbents’ market share are reported in table A3 of the Appendix.
Using data on product offering by respondents, we constructed seven dummy variables (one for each market segment) assuming value 1 is the firm is active in that market segment and zero otherwise. Then, each dummy variable is multiplied by C1, in order to obtain a proxy of the disadvantage experienced by the firm in that market segment. Finally, the seven dummy variables were summed in order to obtain a synthetic measure of the structure of competition faced by the firm in the market segments in which it operates. Following the prediction of our theoretical model, we expect, a positive sign for the coefficient of ADVANTAGE, being the degree of openness positively related to the competitive advantage of the incumbent (hypothesis H2).
Thirdly, PRICE is an ordinal variable assuming value 1 if, according to the firm, its customers attach a low important to price when choosing a software, value 2, if they attach a medium level of importance and 3 if they attach high importance to price. As far H3, we expect that PRICE has a negative effect on the degree of openness.
Finally, we introduce in the econometric specification firm’s age and size as control variables. SIZE is the total staff of the firm, as measured by the number of working partners, employees, and freelances, while age is the age of the firm as measured by the time elapsed since firm’s foundation as in 2004 (the year of the survey). As these variables are controls, we leave to empirics the determination of their impact on firms’ degree of openness.
Country dummies are also inserted for Finland (D_FIN), Germany (D_GER), Italy (D_ITA), and the Spain (D_SPAIN), while Portugal (D_PORT) represents the baseline for the estimation.
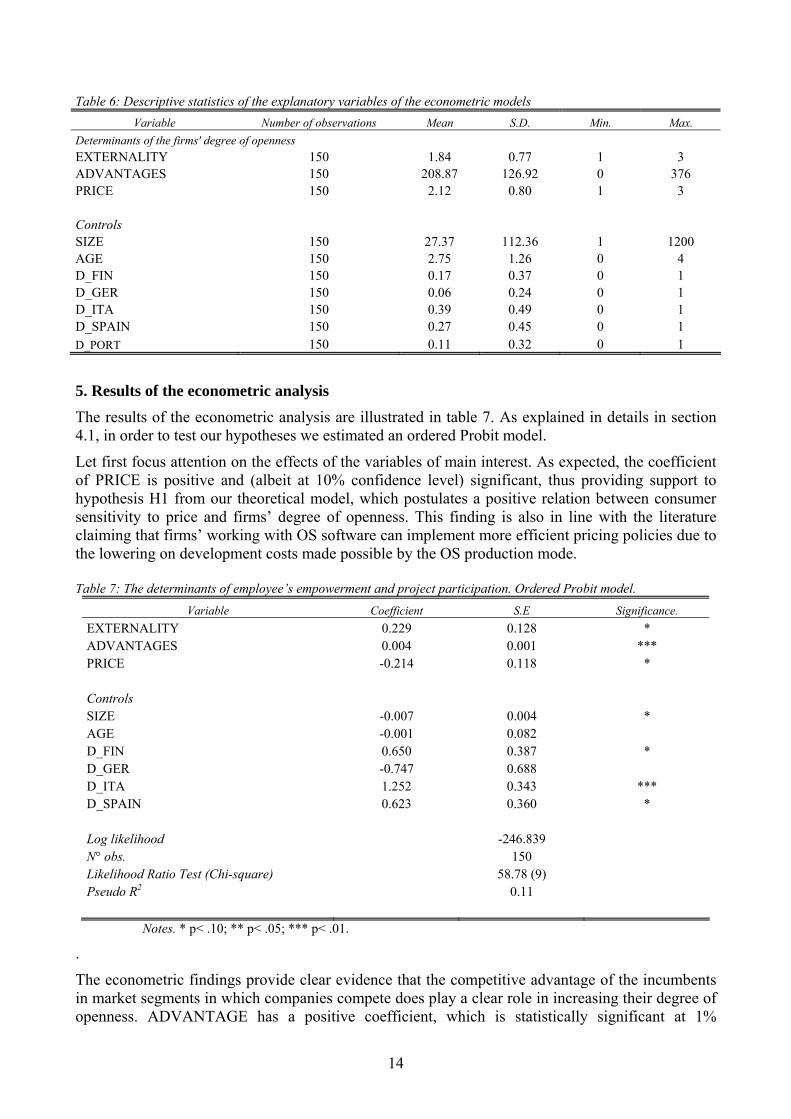
Table 6 illustrates descriptive statistics relating to the explanatory variables included in the models.
14
Table 6: Descriptive statistics of the explanatory variables of the econometric models
Variable Number of observations Mean S.D. Min. Max.
Determinants of the firms' degree of openness EXTERNALITY 150 1.84 0.77 1 3 ADVANTAGES 150 208.87 126.92 0 376 PRICE 150 2.12 0.80 1 3 Controls SIZE 150 27.37 112.36 1 1200 AGE 150 2.75 1.26 0 4 D_FIN 150 0.17 0.37 0 1 D_GER 150 0.06 0.24 0 1 D_ITA 150 0.39 0.49 0 1 D_SPAIN 150 0.27 0.45 0 1 D_PORT 150 0.11 0.32 0 1
5. Results of the econometric analysis
The results of the econometric analysis are illustrated in table 7. As explained in details in section 4.1, in order to test our hypotheses we estimated an ordered Probit model.
Let first focus attention on the effects of the variables of main interest. As expected, the coefficient of PRICE is positive and (albeit at 10% confidence level) significant, thus providing support to hypothesis H1 from our theoretical model, which postulates a positive relation between consumer sensitivity to price and firms’ degree of openness. This finding is also in line with the literature claiming that firms’ working with OS software can implement more efficient pricing policies due to the lowering on development costs made possible by the OS production mode. Table 7: The determinants of employee’s empowerment and project participation. Ordered Probit model.
Variable Coefficient S.E Significance.
EXTERNALITY 0.229 0.128 * ADVANTAGES 0.004 0.001 *** PRICE -0.214 0.118 * Controls SIZE -0.007 0.004 * AGE -0.001 0.082 D_FIN 0.650 0.387 * D_GER -0.747 0.688 D_ITA 1.252 0.343 *** D_SPAIN 0.623 0.360 * Log likelihood -246.839 N° obs. 150 Likelihood Ratio Test (Chi-square) 58.78 (9) Pseudo R2 0.11
Notes. * p< .10; ** p< .05; *** p< .01.
.
The econometric findings provide clear evidence that the competitive advantage of the incumbents in market segments in which companies compete does play a clear role in increasing their degree of openness. ADVANTAGE has a positive coefficient, which is statistically significant at 1%
15
confidence level, thus providing(strong) support to H2. This represents a fairly insightful result, which is in line with the anecdotic evidence pointing to the fact that Open Source is a valuable alternative for small and medium enterprises wishing to enter market segments dominated by large proprietary companies.
Our model provides also support to H3, as the coefficient of EXTERNALITY is found to significantly influence the degree of openness. Specifically, the higher importance attached by consumers to the availability of widely diffused packages and of complementary application, the higher the degree of openness chosen by the firm. This result mirrors that obtained by Casadesus-Masanell and Ghemawat (2006) in modelling the Linux vs. Window competition.
As far as control variables, we found a negative sign for AGE, which is in line with the literature claiming that degree of openness is inversely related to firms’ inertia, and then to their age. However, the coefficient is not significantly different from zero. The coefficient of SIZE is negative and slightly significant, pointing to the fact that SMEs might be more likely to adopt a business model highly oriented toward OSS. The coefficients of all the dummy variables but D_GER turn out to be significant, thus justifying their inclusion in the specification.
6. Conclusions and further development of the research
This work intends to establish some theoretical links between the degree of openness that start-ups firms choose and some of the main industrial characteristics faced by new entrants. More specifically, considering the software sector, a theoretical model is developed aiming at predicting the choice of the degree of openness by software start-up companies doing business out of OS depending on the characteristics of markets, products and consumers they deal with. Then, theoretical hypotheses are tested through the implementation of econometric techniques and information provided by a novel database (ELISS) obtained from a large-scale survey taken, in 2004, on software firms in five European countries (Finland, Germany, Italy, Portugal, and Spain).
Both theoretical predictions and empirical results suggest that the choice by start-ups of the degree of openness is negatively influenced by the characteristics of the demand faced by companies (i.e. the sensitivity of consumers to price), is positively related both to the strength of the network externalities that their software products exhibit and to the competitive advantage of the incumbent firm in the software market segments in which new companies operate.
We think that this study considerably extends our understanding of the determinants of the degree of openness of software start-ups. In particular, it relates this choice both from a theoretical and an empirical point of view to consumers, product and market elements that rarely have been considered by previous research in the field. However, we also are aware that it suffers from some limitations and its findings have to be regarded as highly preliminary. More specifically, the robustness of the empirical results needs further consideration through the implementation of alternative econometric techniques and a more appropriate operazionalization of the explanatory variables of main interest.
In spite of all these limitations, we believe that the findings of this study provide an interesting contribution to the scientific debate on OS strategies. In particular, this study clearly indicates how a high degree of openness may represent a perfect rationale strategy for a profit maximising firm dealing with a given industrial environment.

16
References
Aitchison J., Silvey S.D. (1957) The generalization of Probit analysis to the case of multiple responses. Biometrika, 44(1-2), 131-140.
Armstrong, M. and J. Vickers (1993) Price discrimination, Competition and Regulation, Journal of Industrial Economics, 41, 335-359.
Ashford (1959) An approach to the analysis of data for semi-quantal responses in biological assay. Biometrics, 15, 575-581.
Bhat, C.R. (1994) Imputing a continuous income variable from grouped and missing income observations. Economics Letters, 3, 357-361.
Bonaccorsi A., Giannangeli S., Rossi C. (2006) Entry strategies under competing standards. Hybrid business models in open source software industry. Management Science, 52(7), 1085-1098.
Caudill S.B., Jackson J.D. (1993) Heteroskedasticity and grouped data. Southern Economic Journal, 60, 128-135.
Casadesus-Masanell R., Ghemawat P. (2006) Dynamic mixed duopoly: a model motivated by Linux vs. Windows. Management Science, 32(7), 1072–1084.
Colombo M.G., Delmastro M., Grilli L. (2004) Entrepreneurs’ human capital and the start-up size of new technology-based firms. International Journal of Industrial Organization, 22, 1183-1211.
Dahlander L. (2007) Penguin in a new suit: a tale of how de novo entrants emerged to harness free and Open Source software communities. Industrial and Corporate Change, 16(5), 913-943.
Dahlander L., Magnusson M. (2008) How do firms make use of Open Source communities? Long Range Planning, 41, 629 – 649.
Dahlander L., Wallin M. W. (2006) A man on the inside: unlocking communities as complementary assets. Research Policy, 35(8), 1243-1259.
Dalle J.M., Rossi C., Rullani F. (2007) Toward a new industrial organization? OSS in economic and managerial perspective. Proceedings of the Third International Conference on Open Source Systems, Limerick, Ireland, 11-14 June.
Fitzgerald B. (2006) The transformation of Open Source Software. MIS Quarterly, 30(3), 587-598.
Greene W. H. (2000) Econometric analysis (Fourth edition). Prentice Hall, New York.
Gruber M., Henkel J. (2006) New ventures based on open innovation - an empirical analysis of start-up firms in embedded Linux. International Journal of Technology Management, 33(4), 256-372.
Gurland J., Ilbok L., Dahm P.A. (1960) Polychotomous quantal response in biological assay. Biometrics 16:382-98.
Jing B. (2007) Network externalities and Market Segmentation in a Monopoly, Economics Letters 95, 7-13.
Johnson J. P. (2004) Open Source Software: private provision of a public good. Journal of Economics and Management Strategy, 11(4), 637 – 662.
Krishnamurty S. (2005) An analysis of Open Source business models. In Feller J., Fitzgerald B., Hissam S.A, and Lakhani (eds.) Perspective on Free and Open Source Software. MIT Press, Cambridge, MA.
Long J. (1997) Regression models for categorical and limited dependent variables. Advanced quantitative techniques in the social sciences. Sage Publications, New York, NY.
17
Maddala, G. S. (1983) Limited dependent and qualitative variables in econometrics. Cambridge University Press, New York, NY.
Stern, S. (1991) Imputing a continuous income variable from a bracketed income variable with special attention to missing observations. Economics Letters, 37, 287-291.
Stewart, M.B. (1983) On the least squares estimation when the dependent variable is grouped. Review of Economic Studies, 55, 737-757.
Von Krogh G., Haefliger S., Rossi Lamastra C. (2009) Phenomena-based research in management and organization science: Towards a research strategy. Paper to be presented to AOM 2009.
West J. (2007) Value capture and value networks in Open Source vendor strategies. Proceedings of the 40th Annual Hawai’i International Conference on System Sciences, Waikoloa, Hawai’i January 1-4.
Boes S., Winkelmann R. (2006) Ordered response models. Allgemeines Statistisches Archiv 90, 167-181.
18
APPENDIX
Table A 1: Population (EUROSTAT 2003) and sample size distribution of firms in NACE code 72
FINLAND GERMANY ITALY
POP. SAMPLE POP. SAMPLE POP. SAMPLE SIZE
N % N % N % N % N % N %
< 10 3805 89.19 71 52.59 37 314 88.52 17 18.28 79 326 94.38 202 83.13 10-19 203 4.76 30 22.22 2 525 5.99 23 24.73 2 921 3.48 28 11.52 20-49 142 3.33 17 12.59 1 478 3.51 26 27.96 1 160 1.38 11 4.53 50-249 101 2.37 12 8.89 699 1.66 17 18.28 537 0.64 2 0.82 ≥250 15 0.35 5 3.70 138 0.33 10 10.75 106 0.13 0 0.00 TOTAL 4 266 100.00 135 100.00 42 154 100.00 93 100.00 84 050 100.00 243 100.00
Table A 1, continued
PORTUGAL SPAIN TOTAL
POP. SAMPLE POP. SAMPLE POP. SAMPLE
N % N % N % N % N % N %
2533 90.37 50 51.02 21 105 90.72 38 19.00 144 083 92.04 378 49.15 130 4.64 31 31.63 1 086 4.67 60 30.00 6 865 4.39 172 22.37 80 2.85 12 12.24 666 2.86 57 28.50 3 526 2.25 123 15.99 52 1.86 4 4.08 313 1.35 30 15.00 1 702 1.09 65 8.45 8 0.29 1 1.02 95 0.41 15 7.50 362 0.23 31 4.03
2803 100.00 98 100.00 23 265 100.00 200 100.00 156 538 100.00 769 100.00
Table A 2: Product categories
ID
Product category
1 Web servers
2 Other kinds of servers
3 Back up Systems
4 Firewall
5 Antispam
6 Antivirus
7 User and Identity Management
8 E-mail Client
9 Instant Messaging
10 Web Browser
11 Digital Signature Systems
12 Content Management System
13 E-commerce solutions
14 E-learning Tools
15 Management Software
16 Data Management Software
17 Workflow Systems
18 Office Automation Packages

19
Table A 3: Market segments and market share of the incumbent firm in each segment
Market Segment Acronym Market share of the incumbent firm Web server and related solutions WS 23.73
Protection systems PS 54.20 Web browser and related services WB 91.27
Content management system CMS 23.00 Database software DB 46.80
EPR EPR 42.00 Office automation software OA 95.00

Elenco Quaderni già pubblicati
1. L. Giuriato, Problemi di sostenibilità di programmi di riforma strutturale, settembre 1993. 2. L. Giuriato, Mutamenti di regime e riforme: stabilità politica e comportamenti accomodanti, settembre 1993. 3. U. Galmarini, Income Tax Enforcement Policy with Risk Averse Agents, novembre 1993. 4. P. Giarda, Le competenze regionali nelle recenti proposte di riforma costituzionale, gennaio 1994. 5. L. Giuriato, Therapy by Consensus in Systemic Transformations: an Evolutionary Perspective, maggio 1994. 6. M. Bordignon, Federalismo, perequazione e competizione fiscale. Spunti di riflessione in merito alle ipotesi di riforma della finanza regionale in Italia, aprile 1995. 7. M. F. Ambrosanio, Contenimento del disavanzo pubblico e controllo delle retribuzioni nel pubblico impiego, maggio 1995. 8. M. Bordignon, On Measuring Inefficiency in Economies with Public Goods: an Overall Measure of the Deadweight Loss of the Public Sector, luglio 1995. 9. G. Colangelo, U. Galmarini, On the Pareto Ranking of Commodity Taxes in Oligopoly, novembre 1995. 10. U. Galmarini, Coefficienti presuntivi di reddito e politiche di accertamento fiscale, dicembre 1995. 11. U. Galmarini, On the Size of the Regressive Bias in Tax Enforcement, febbraio 1996. 12. G. Mastromatteo, Innovazione di Prodotto e Dimensione del Settore Pubblico nel Modello di Baumol, giugno 1996. 13. G. Turati, La tassazione delle attività finanziarie in Italia: verifiche empiriche in tema di efficienza e di equità, settembre 1996. 14. G. Mastromatteo, Economia monetaria post-keynesiana e rigidità dei tassi bancari, settembre 1996. 15. L. Rizzo, Equalization of Public Training Expenditure in a Cross-Border Labour Market, maggio 1997. 16. C. Bisogno, Il mercato del credito e la propensione al risparmio delle famiglie: aggiornamento di un lavoro di Jappelli e Pagano, maggio 1997.
17. F.G. Etro, Evasione delle imposte indirette in oligopolio. Incidenza e ottima tassazione, luglio 1997.
18. L. Colombo, Problemi di adozione tecnologica in un’industria monopolistica, ottobre 1997.
19. L. Rizzo, Local Provision of Training in a Common Labour Market, marzo 1998. 20. M.C. Chiuri, A Model for the Household Labour Supply: An Empirical Test On
A Sample of Italian Household with Pre-School Children, maggio 1998. 21. U. Galmarini, Tax Avoidance and Progressivity of the Income Tax in an
Occupational Choice Model, luglio 1998. 22. R. Hamaui, M. Ratti, The National Central Banks’ Role under EMU. The Case
of the Bank of Italy, novembre 1998.

23. A. Boitani, M. Damiani, Heterogeneous Agents, Indexation and the Non Neutrality of Money, marzo 1999. 24. A. Baglioni, Liquidity Risk and Market Power in Banking, luglio 1999. 25. M. Flavia Ambrosanio, Armonizzazione e concorrenza fiscale: la politica della Comunità Europea, luglio 1999.
26. A. Balestrino, U. Galmarini, Public Expenditure and Tax Avoidance, ottobre 1999.
27. L. Colombo, G. Weinrich, The Phillips Curve as a Long-Run Phenomenon in a Macroeconomic Model with Complex Dynamics, aprile 2000.
28. G.P. Barbetta, G. Turati, L’analisi dell’efficienza tecnica nel settore della sanità. Un’applicazione al caso della Lombardia, maggio 2000.
29. L. Colombo, Struttura finanziaria delle imprese, rinegoziazione del debito Vs. Liquidazione. Una rassegna della letteratura, maggio 2000.
30. M. Bordignon, Problems of Soft Budget Constraints in Intergovernmental Relationships: the Case of Italy, giugno 2000.
31. A. Boitani, M. Damiani, Strategic complementarity, near-rationality and coordination, giugno 2000.
32. P. Balduzzi, Sistemi pensionistici a ripartizione e a capitalizzazione: il caso cileno e le implicazioni per l’Italia, luglio 2000.
33. A. Baglioni, Multiple Banking Relationships: competition among “inside” banks, ottobre 2000.
34. A. Baglioni, R. Hamaui, The Choice among Alternative Payment Systems: The European Experience, ottobre 2000.
35. M.F. Ambrosanio, M. Bordignon, La concorrenza fiscale in Europa: evidenze, dibattito, politiche, novembre 2000.
36. L. Rizzo, Equalization and Fiscal Competition: Theory and Evidence, maggio 2001.
37. L. Rizzo, Le Inefficienze del Decentramento Fiscale, maggio 2001. 38. L. Colombo, On the Role of Spillover Effects in Technology Adoption Problems,
maggio 2001. 39. L. Colombo, G. Coltro, La misurazione della produttività: evidenza empirica e
problemi metodologici, maggio 2001. 40. L. Cappellari, G. Turati, Volunteer Labour Supply: The Role of Workers’
Motivations, luglio 2001. 41. G.P. Barbetta, G. Turati, Efficiency of junior high schools and the role of
proprietary structure, ottobre 2001. 42. A. Boitani, C. Cambini, Regolazione incentivante per i servizi di trasporto
locale, novembre 2001. 43. P. Giarda, Fiscal federalism in the Italian Constitution: the aftermath of the
October 7th referendum, novembre 2001. 44. M. Bordignon, F. Cerniglia, F. Revelli, In Search for Yardstick Competition:
Property Tax Rates and Electoral Behavior in Italian Cities, marzo 2002. 45. F. Etro, International Policy Coordination with Economic Unions, marzo 2002. 46. Z. Rotondi, G. Vaciago, A Puzzle Solved: the Euro is the D.Mark, settembre
2002. 47. A. Baglioni, Bank Capital Regulation and Monetary Policy Transmission: an
heterogeneous agents approach, ottobre 2002. 48. A. Baglioni, The New Basle Accord: Which Implications for Monetary Policy
Transmission?, ottobre 2002. 49. F. Etro, P. Giarda, Redistribution, Decentralization and Constitutional Rules,
ottobre 2002. 50. L. Colombo, G. Turati, La Dimensione Territoriale nei Processi di
Concentrazione dell’Industria Bancaria Italiana, novembre 2002.

51. Z. Rotondi, G. Vaciago, The Reputation of a newborn Central Bank, marzo 2003.
52. M. Bordignon, L. Colombo, U. Galmarini, Fiscal Federalism and Endogenous Lobbies’ Formation, ottobre 2003.
53. Z. Rotondi, G. Vaciago, The Reaction of central banks to Stock Markets, novembre 2003.
54. A. Boitani, C. Cambini, Le gare per i servizi di trasporto locale in Europa e in Italia: molto rumore per nulla?, febbraio 2004.
55. V. Oppedisano, I buoni scuola: un’analisi teorica e un esperimento empirico sulla realtà lombarda, aprile 2004.
56. M. F. Ambrosanio, Il ruolo degli enti locali per lo sviluppo sostenibile: prime valutazioni, luglio 2004.
57. M. F. Ambrosanio, M. S. Caroppo, The Response of Tax Havens to Initiatives Against Harmful Tax Competition: Formal Statements and Concrete Policies, ottobre 2004.
58. A. Monticini, G. Vaciago, Are Europe’s Interest Rates led by FED Announcements?, dicembre 2004.
59. A. Prandini, P. Ranci, The Privatisation Process, dicembre 2004. 60. G. Mastromatteo, L. Ventura, Fundamentals, beliefs, and the origin of money: a
search theoretic perspective, dicembre 2004. 61. A. Baglioni, L. Colombo, Managers’ Compensation and Misreporting, dicembre
2004. 62. P. Giarda, Decentralization and intergovernmental fiscal relations in Italy: a
review of past and recent trends, gennaio 2005. 63. A. Baglioni, A. Monticini, The Intraday price of money: evidence from the e-
MID market, luglio 2005. 64. A. Terzi, International Financial Instability in a World of Currencies Hierarchy,
ottobre 2005. 65. M. F. Ambrosanio, A. Fontana, Ricognizione delle Fonti Informative sulla
Finanza Pubblica Italiana, gennaio 2006. 66. L. Colombo, M. Grillo, Collusion when the Number of Firms is Large, marzo
2006. 67. A. Terzi, G. Verga, Stock-bond correlation and the bond quality ratio: Removing
the discount factor to generate a “deflated” stock index, luglio 2006. 68. M. Grillo, The Theory and Practice of Antitrust. A perspective in the history of
economic ideas, settembre 2006. 69. A. Baglioni, Entry into a network industry: consumers’ expectations and firms’
pricing policies, novembre 2006. 70. Z. Rotondi, G. Vaciago, Lessons from the ECB experience: Frankfurt still
matters!, marzo 2007. 71. G. Vaciago, Gli immobili pubblici…..ovvero, purché restino immobili, marzo
2007. 72. F. Mattesini, L. Rossi, Productivity shocks and Optimal Monetary Policy in a
Unionized Labor Market Economy, marzo 2007. 73. L. Colombo, G. Femminis, The Social Value of Public Information with Costly
Information Acquisition, marzo 2007. 74. L. Colombo, H. Dawid, K. Kabus, When do Thick Venture Capital Markets
Foster Innovation? An Evolutionary Analysis, marzo 2007. 75. A. Baglioni, Corporate Governance as a Commitment and Signalling Device,
novembre 2007. 76. L. Colombo, G. Turati, The Role of the Local Business Environment in Banking
Consolidation, febbraio 2008.
77. F. Mattesini, L. Rossi, Optimal Monetary Policy in Economies with Dual Labor Markets, febbraio 2008.
78. M. Abbritti, A. Boitani, M. Damiani, Labour market imperfections, “divine coincidence” and the volatility of employment and inflation, marzo 2008.
79. S. Colombo, Discriminatory prices, endogenous locations and the Prisoner Dilemma problem, aprile 2008.
80. L. Colombo, H. Dawid, Complementary Assets, Start-Ups and Incentives to Innovate, aprile 2008.
81. A. Baglioni, Shareholders’ Agreements and Voting Power, Evidence from Italian Listed Firms, maggio 2008.
82. G. Ascari, L. Rossi, Long-run Phillips Curve and Disinflation Dynamics: Calvo vs. Rotemberg Price Setting, settembre 2008.
83. A. Baglioni, A. Monticini, The intraday interest rate under a liquidity crisis: the case of August 2007, ottobre 2008.
84. M. F. Ambrosanio, M. Bordignon, F. Cerniglia, Constitutional reforms, fiscal decentralization and regional fiscal flows in Italy, dicembre 2008.
85. S. Colombo, Product differentiation, price discrimination and collusion, marzo 2009.
86. L. Colombo, G. Weinrich, Persistent disequilibrium dynamics and economic policy, marzo 2009.
87. M. Bordignon, G. Tabellini, Moderating Political Extremism: Single Round vs Runoff Elections under Plurality Rule, aprile 2009.
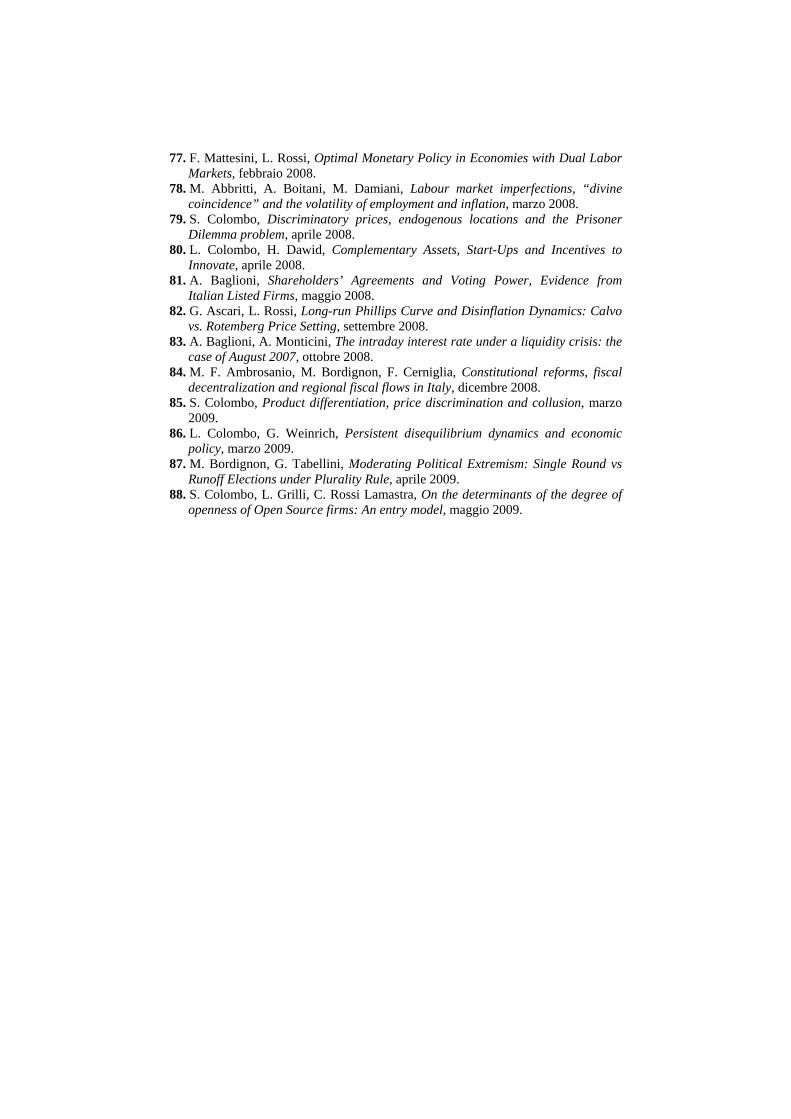
88. S. Colombo, L. Grilli, C. Rossi Lamastra, On the determinants of the degree of openness of Open Source firms: An entry model, maggio 2009.


