Embed Size (px)
Citation preview
Unveiling information on opportunity costs in REDD: who obtains
the surplus?
Philippe Delacote ∗†‡§, Charles Palmer ¶, Riyong Kim Bakkegaard ‖, Bo Jellesmark Thorsen ∗∗
Abstract
Improving information about individual opportunity costs of deforestation agents has the po-
tential to increase the efficiency of REDD when it takes the form of a payment for environmental
services scheme. In this paper, we show that the impact of increasing this type of information
depends on the type of policy maker. If the policy maker is an environmental agency, provid-
ing such information may increase the amount of forest conserved under REDD. By contrast,
if the policy maker aims at maximizing net income from REDD, improving information may
not increase forest but only change the distribution of the surplus. For a development agency
aiming to improve agents’ welfare, providing information makes no difference to forest outcomes
or welfare. These results are illustrated with data collected on opportunity costs in Amazonas
state, Brazil.
Keywords: deforestation, REDD, payment for environmental services, information, opportu-
nity costs.
∗Corresponding author: [email protected] . The research leading to these results has received funding
from the European Union’s Seventh Framework Programme (FP7/2007-2013) under grant agreement no 243950.
Riyong Kim Bakkegaard and Bo Jellesmark Thorsen acknowledges support and founding from Danish National Science
Foundation, NEWFOREX, FundacãoAmazonas Sustentavel, CIFORBrazil, CIFOR GCS, NEWFOREX, CIFOR,
Skovrider Mindefond, Torben and AliceFrimodts Fond, WWF REDD project, LIFE KU, Stiftelsen Løvstrupgaard,
Landbrugets Studie Fond, Jordbrugs Akademiker(JA),Denise Reis dos Nascimento, Simone Santos, Mario Acuna,
Ivan Zarros, and Patricia Gallo, Kaline Rossi do Nascimento. This paper was presented at the EAERE annual
conference (Rome, Italy, June 2011) and at a research seminar at the University of Copenhaguen (Denmark, October
2011).†INRA, UMR 356 Économie Forestière, F-54000 Nancy, France‡Agroparistech, Engref, Laboratoire d’économie forestière, F-54000 Nancy, France§Chaire d’économie du Climat, Paris, France¶Department of Geography and Environment, London School of Economics (LSE), Houghton Street, London
WC2A 2AE, United Kingdom‖University of Copenhagen
∗∗University of Copenhagen
1
1 Introduction
With tropical deforestation accounting for up to a fifth of global, anthropogenic CO2 emissions,
(van der Werf et al. (2009), IPCC (2007)) Reducing Emissions from Deforestation and Degrada-
tion (REDD) has been positioned as a potentially cost-effective climate change mitigation strategy
(Stern, 2007; Eliasch, 2008; Palmer and Engel, 2009). Incentive payments or payments for en-
vironmental services (PES) schemes are often promoted as a means of supplying REDD benefits
(Angelsen, 2010; Pattanayak et al.„ 2010; Palmer, 2011).1 While long-term finance continues to
be subject of discussion among REDD stakeholders, such schemes could be financed through an
international carbon market and/or voluntary funds (see Neeff and Ascui, 2009). One of the major
selling points of incentive payments is their cost-effectiveness compared to other policy options
(Ferraro and Kiss, 2002; Ferraro and Simpson, 2002; Muller and Albers, 2004; Groom and Palmer,
2010). Moreover, they are often proposed as efficient policy tools for achieving REDD in developing
countries (e.g. Angelsen (2008), Leplay et al. (2011)).
Increased knowledge about the opportunity costs of avoiding deforestation is often cited as
a prerequisite to the efficient implementation of payment schemes to curb deforestation (e.g.
Pagiola and Bosquet (2009)). In this paper, we investigate the impacts of improving informa-
tion on the opportunity costs of deforestation agents, and on business-as-usual deforestation. A
simple model of payments to reduce deforestation is developed in which a policy maker offers a
price to deforestation agents in order to reduce deforestation. The policy maker can be of three
types: a development agency aiming at maximizing the well-being of a country’s citizens; an
income-maximizing government maximizing net income from REDD, or an environmental agency
maximizing the amount of forest prevented from being deforested. It can then either sell the car-
bon credits derived on an international carbon market or can be retributed though an international
REDD fund.
Agricultural households, logging companies, and the agro-businesses obtain diverse benefits from
deforesting, and thus have very different opportunity costs of not deforesting. Thus, some agents
can provide environmental services from not deforesting at lower costs than others. Moreover,
agents are likely to have better information about the size of these costs than the policy maker.
This type of information asymmetry, known as hidden information (or adverse selection), can lead
to inefficiencies in payments schemes. If the payments are too high, then uniform contracts - the
1Wunder (2005) defines PES as a voluntary transaction between at least one buyer and at least one seller in which
payments are conditional on maintaining an ecosystem use that provides well-defined environmental services.
2
norm in many payments schemes around the world (see Engel et al., 2008) - can be a costly way
of inducing agents to participate. Yet such contracts can improve welfare. This is particularly
relevant in developing countries where donors and international agencies may be looking for a
double dividend of reducing poverty and increasing environmental services provision at the same
time (Bulte et al. (2008)).
To prevent informational rents accruing to low-cost agents, separating contracts can be used
to separate the low- from the high-cost agents.2 While offering a menu of contracts may be more
efficient than a uniform contract, they are rarely used in practice (Ferraro, 2008). Informational
requirements on the part of the policy maker may be substantial and the menu of contracts that
would be offered in the presence of complete information may not be incentive compatible in the
presence of information asymmetries (Arguedas and van Soest, 2011). Instead of offering a menu of
contracts, procurement auctions have been proposed and used in practice as a means of extracting
informational rents from agents (e.g. Stoneham et al., 2003). Thus, improving information on
agents’ opportunity costs is possible, although debate continues about the relative efficiency of
separating contracts vis-a-vis auctions.
In our framework, we explore the trade-offs between improving agents’ welfare and increasing
the supply of benefits from REDD as a result of improving information on agents’ opportunity
costs. The policy maker knows the distribution of BAU levels of deforestation among deforestation
agents and the distribution of agents’ opportunity costs. However, it may not infer the individual
agents’ BAU levels of deforestation nor their opportunity costs. The innovation of our framework
is to examine trade-offs and the impact of improvements in information according to the type of
policy maker. It can either aim at maximizing its citizens well-being, net income from REDD, or
quantity of avoided deforestation. While this simplifies often complex decision-making processes,
such processes will remain essentially unobservable to international sources of REDD finance. Yet
important differences in outcomes emerge, particularly if actual policy objectives are different from
stated ones. Tropical forest policy processes are often characterized by patronage politics and
the presence of powerful interest groups close to national policy makers, which obscures the true
motivations of policy makers (Mayers and Bass, 1998). Indeed, the recent finding government
officials in Liberia were bribed by carbon investors to secure carbon rights to a forest concession at
below-market values suggests that corruption is already playing an unwelcome role in REDD policy
2For classic examples of separating contracts as applied to agri-environmental schemes, see Smith (1995), Wu and
Babcock (1995,1996).
3
(Financial Times, 2010). Our framework accounts for possible rent-seeking and demonstrates how
improving information could exacerbate the problem.
We show that under incomplete information about the individual opportunity costs, the three
types of policy maker set the same level of REDD payment resulting in the same environmental
outcome. When information is improved, the development agency sets the same payment and
obtains the same outcome as in the incomplete information case. The income-maximizing policy
maker achieves the same outcome in terms of avoided deforestation as in the incomplete information
case. But this policy maker uses the information to increase its surplus, potentially to benefit
powerful interest groups. Finally, with improved information about agents’ opportunity costs, the
environmental agency is able to get a better outcome in terms of avoided deforestation while their
welfare remains unchanged.
These results are illustrated with data collected on households’ opportunity costs in the Brazilian
state of Amazonas. Land use is characterised by low agricultural productivity, which occurs through
the conversion of forest of high carbon content. We show that, as expected, the environmental
agency is able to buy up almost all the land that would otherwise be converted to agriculture, more
than either of the other two policy maker types. Under incomplete information, the environmental
agency achieves the highest aggregate welfare gain for agents. These naturally dissipate once
information is made available on their opportunity costs of keeping land in forest.
Overall, the impact of improving information about opportunity costs on welfare and avoided
deforestation depends on the type of policy maker. If the policy maker is a development agency,
improving information has no real impact, since citizens and the government have the same objective
of improving well-being. If the policy maker aims at maximizing profit from REDD, improving
information allows it to bind agents to their opportunity costs. Improving information thus reduces
well-being but with no change in avoided deforestation. For an environmental agency, improving
information improves scheme efficiency. Less money is spent on agents with low opportunity costs
and more is allocated to agents with higher opportunity costs. In this case, improving information
improves the outcome in terms of avoided deforestation.
In the remainder of the paper, Section 2 presents the incomplete information case while Section
3 shows the implications of improving information about agents’ opportunity costs. Section 4
illustrates the main points of the model with policy simulations using data collected in Amazonas,
Brazil. Section 5 concludes and discusses the policy implications, including the potential screening
benefits that a fund may provide compared to a global carbon market.
4
2 Payments for reducing deforestation with incomplete informa-
tion
In this section, we present an incentive payment scheme for reducing emissions from deforesta-
tion under a situation of incomplete information. We first present the deforestation agents and the
Business-As-Usual (BAU) deforestation baseline before moving to the payment scheme. Several
types of policy maker are considered and the equilibrium payment policy is inferred.
2.1 Deforestation agents and Business-As-Usual scenario
We consider a country in which deforestation agents, e.g. agricultural households, logging firms,
i ∈ [0, N ], are distributed according to f(i). The deforestation agents obtain some private benefit
(or net income) Yi ∈ [Y , Y ] from deforestation Di ∈ [D, D]. We implicitly assume that opportunity
costs and deforestation levels have the same order: agents with high income from deforestation
have high individual deforestation levels while low-income agents have lower ones. Where forest
clearing requires investment, high-income agents are more likely to have the capacity to clear forest
(Angelsen and Kaimowitz, 1999).3 Yet we do not discriminate among types of agent. Instead, we
only differentiate according to income. Thus, we assume that poorer agricultural households, for
example, obtain relatively low benefits from deforestation and thus have low individual levels of
deforestation. Palm oil firms, on the other hand, may obtain large profits from land conversion
and thus have higher individual levels of deforestation. Agents are also assumed to have no outside
options in the the form of off-farm income opportunities. This is a strong assumption that while
allowing for analytical crispness does not hold in our Brazilian case.
In our model, Di is the individual level of deforestation of agent i, and DBAU =∫ N
0Dif(i)di
is total deforestation in a BAU scenario. Moreover, agent i obtains private benefits Yi from defor-
estation Di, which are assumed to be known by the agent. Total benefits from deforestation are
given by Y BAU =∫ N
0Yif(i)di in a BAU scenario, which can also be interpreted as an aggregate
measure of deforestation agents’ welfare.
3We note, however, that empirical evidence on the link between poverty and deforestation is mixed. For example,
Zwane (2007) presents evidence from a household-level analysis in Peru showing that land clearing is positively
correlated with income but at a decreasing rate.
5
2.2 Introducing payments for reducing emissions from deforestation
The policy maker in the REDD host country establishes an incentive payment or PES scheme
to reduce emissions from deforestation. While it has knowledge of the distribution of deforestation
levels and incomes among all agents, it cannot observe their opportunity costs of land use, i.e. is
unable to distinguish between those with low or high opportunity costs. In response to this, it
offers a fixed, uniform payment as an incentive to avoid deforestation against the BAU baseline.
As noted in the introduction, this is a common feature of payment schemes around the world.
Any agent i may accept or refuse the offer. If it accepts, agent i reduces its deforestation from
Di to DP ESi . For simplicity, we assume that DP ES
i = 0 (in this sense, we consider DBAU as the
quantity of deforestation that is avoided). We assume perfect monitoring of deforestation levels
under the payment scheme, for example, using a combination of remote sensing data and ground
surveys. In exchange for avoiding deforestation the agent receives a fixed payment L. If it declines
participation in the scheme, agent i keeps receiving its BAU income Yi. Agent i accepts the offer
if and only if it makes it better off: L ≥ Yi.
2.3 The Policy Maker
The policy maker has incomplete information about the agents’ individual opportunity costs.
Since neither these nor the BAU deforestation rates of individual agents can be discerned, a fixed
payment L is offered to all agents. Agent i enters the scheme if and only if: L ≥ Yi.
In our framework, the indifferent agent ı is the one that separates total population, and is
defined as follows: Y = L. Agents with a low opportunity cost (i ∈ [0, ı]) participate in the scheme
while agents with a high opportunity cost (i ∈ [ı, N ]) choose to stay out.
Total income, total deforestation levels under the payment scheme, and avoided deforestation
are given by:
Y P ES =∫ N
ıYif(i)di +
∫ ı
0
Lf(i)di (1)
DP ES =∫ N
ıDif(i)di (2)
AD = DBAU − DP ES =∫ ı
0
Dif(i)di (3)
A situation of incomplete information implies that the policy maker only has to set the amount
of the payment L, which determines the indifferent agent and the number of agents entering the
scheme i ∈ [0, ı]. It cannot discriminate among deforestation agents. Thus, it follows that the
policy maker cannot capture the surplus from the REDD mechanism. Participants are assumed to
6
comply and deliver the benefits associated with their REDD contracts. Implicitly, there is perfect
and costless monitoring of REDD contracts through monitoring, measurement and verification
(MRV) procedures established in the REDD host country.
In our framework, third-party finance for REDD can be accessed by the policy maker from the
REDD host country. There are two options for channeling REDD finance. First, verifiable avoided
deforestation could create carbon (offset) credits, which can then be sold on an international carbon
market at price r. Alternatively, the country could be retributed through an international REDD
fund established by developed countries. In this case, r would represent the price offered by the
fund in exchange for a given, verified amount of avoided deforestation. The policy maker may be
of three types. First, we consider a development agency that aims to maximize the welfare of a
country’s citizens before considering one that aims to maximize net income from REDD. Finally,
the policy maker is an environmental agency that aims to maximize the size of the forest to be
protected under REDD.
2.3.1 Development agency
The development agency only cares about the community welfare. The policy maker thus
implements its payments scheme such that the deforestation agents’ welfare is maximized compared
to the BAU baseline, subject to a budget constraint, i.e. it cannot make a loss from implementing
the scheme:
maxL
WA = Y P ES − Y BAU =∫ ı
0
(L − Yi)f(i)di (4)
s.t
∫ ı
0
(rDi − L)f(i)di ≥ 0 (5)
The development agency tends to set the highest possible payment level. The equilibrium
payments scheme thus takes the form:
L = rD ∀i ∈ [0, N ]
ı : Y
D= r
∫ ı0(rDi − L)di = 0
(6)
2.3.2 Policy maker maximizing net income from REDD
In the second case, the policy maker maximizes net income derived from REDD. It might prefer
to increase social welfare by utilizing the income obtained from REDD rather than distributing it
to deforestation agents. Thus, income from REDD could be used to fund public services such as
7
education, health, and infrastructure, or even redistributed to the population at large. The latter
could apply in a situation where the social cost of public funds is small enough, i.e. implying
that the policy maker can improve social welfare using REDD finance for public services rather
than directly distributing it to agents. Alternatively, income could be redistributed to rent-seeking
groups through the policy maker’s client-patron networks.4
The maximization program of the policy maker is:
maxL
πP M = rAD −
∫ ı
0
Lf(i)di =∫ ı
0
(rDi − L)f(i)di
Since the policy maker cannot discriminate among agents according to their opportunity costs,
it cannot make a profit. There is not enough information available to claim the agents’ surplus.
With zero profit, we assume that the policy maker implements the policy that maximizes the
amount of deforestation avoided subject to the budget constraint.
Due to incomplete information, the income-maximizing policy maker is constrained to imple-
ment the same level of payment as the development agency. As shown in Section 2, with an income-
maximizing policy maker, incomplete information results in the same environmental outcome as
is achieved under complete information. However, the distribution of REDD rents is different.
Indeed, since the policy maker cannot discriminate among deforestation agents, the surplus from
REDD remains with deforestation agents.
2.3.3 Environmental agency
The environmental agency has the objective of maximizing the quantity of avoided deforestation.
Its program is:
maxL
AD = DBAU− DP ES =
∫ ı
0
Dif(i)di (7)
s.t rAD −
∫ ı
0
Ldi =∫ ı
0
(rDi − L)f(i)di ≥ 0 (8)
Again the policy maker is unable to discriminate among agents. Overall, the equilibrium pay-
ments scheme is the same as in the two previous cases (equation (6)). Asymmetric information
about agents’ opportunity costs prevents it from being able to redistribute the surplus from REDD.
Note that deforestation agents are better off under incomplete information. Indeed they benefit
from the asymmetric information about opportunity costs and increase their welfare relative to the
BAU baseline.4Therefore, we do not consider explicitly how the net income from REDD is used, whether it is in a positive
(public services) or negative (rent-seeking) way.
8
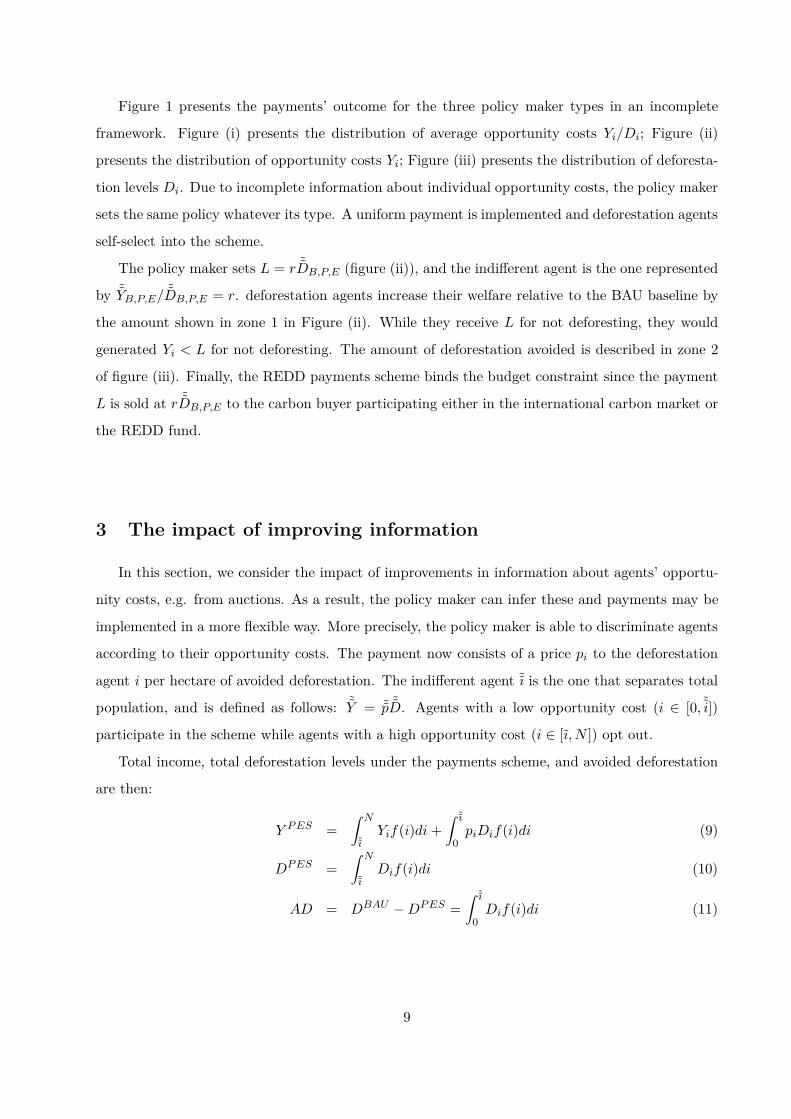
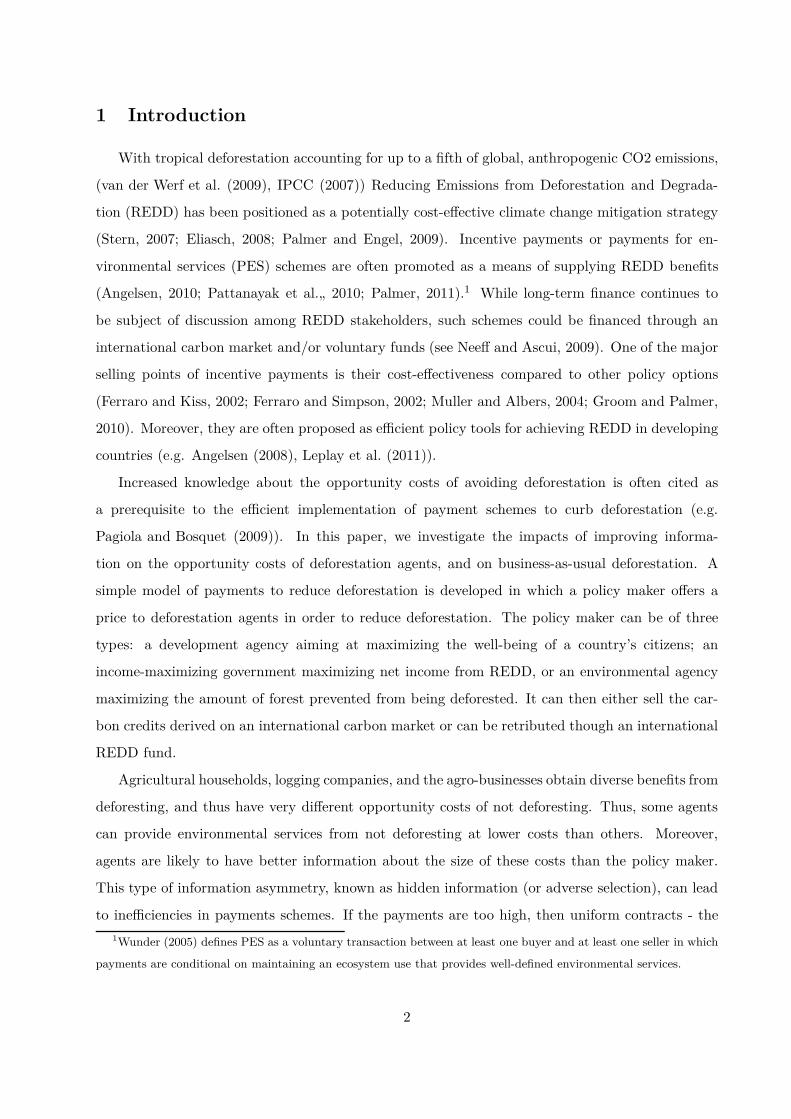
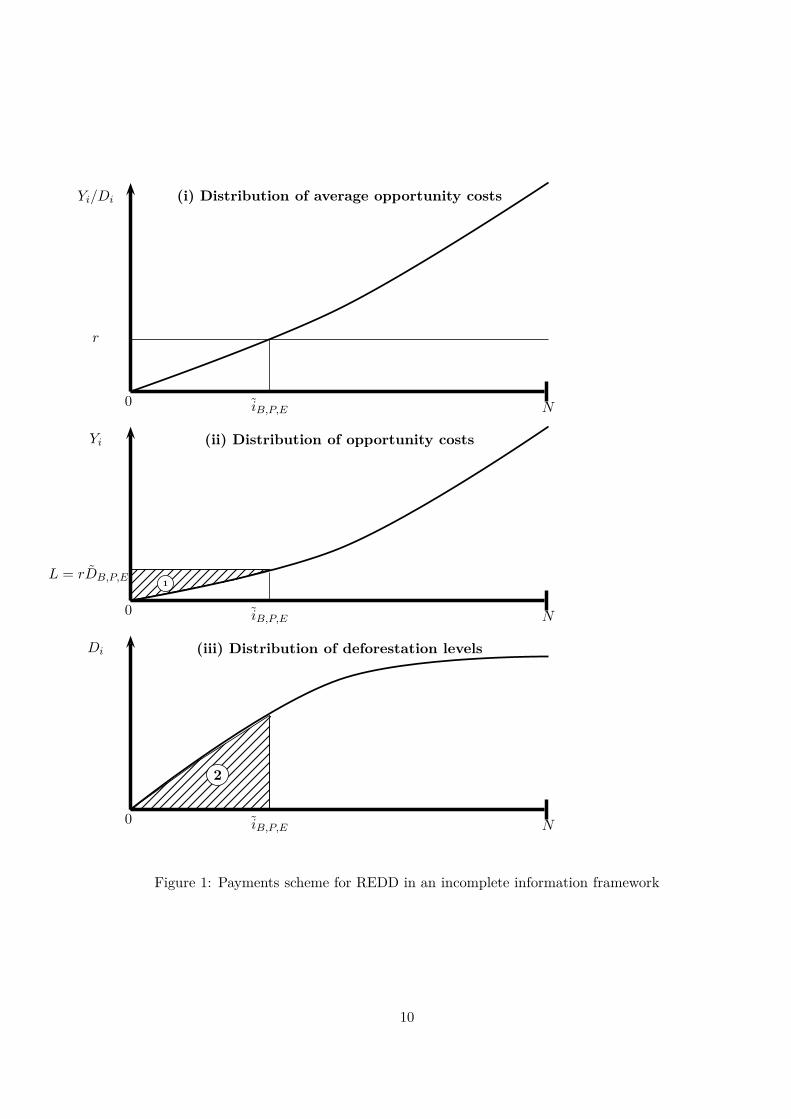
Figure 1 presents the payments’ outcome for the three policy maker types in an incomplete
framework. Figure (i) presents the distribution of average opportunity costs Yi/Di; Figure (ii)
presents the distribution of opportunity costs Yi; Figure (iii) presents the distribution of deforesta-
tion levels Di. Due to incomplete information about individual opportunity costs, the policy maker
sets the same policy whatever its type. A uniform payment is implemented and deforestation agents
self-select into the scheme.
The policy maker sets L = r ˜DB,P,E (figure (ii)), and the indifferent agent is the one represented
by ˜YB,P,E/ ˜DB,P,E = r. deforestation agents increase their welfare relative to the BAU baseline by
the amount shown in zone 1 in Figure (ii). While they receive L for not deforesting, they would
generated Yi < L for not deforesting. The amount of deforestation avoided is described in zone 2
of figure (iii). Finally, the REDD payments scheme binds the budget constraint since the payment
L is sold at r ˜DB,P,E to the carbon buyer participating either in the international carbon market or
the REDD fund.
3 The impact of improving information
In this section, we consider the impact of improvements in information about agents’ opportu-
nity costs, e.g. from auctions. As a result, the policy maker can infer these and payments may be
implemented in a more flexible way. More precisely, the policy maker is able to discriminate agents
according to their opportunity costs. The payment now consists of a price pi to the deforestation
agent i per hectare of avoided deforestation. The indifferent agent ˜ı is the one that separates total
population, and is defined as follows: ˜Y = ˜p ˜D. Agents with a low opportunity cost (i ∈ [0, ˜i])
participate in the scheme while agents with a high opportunity cost (i ∈ [ı, N ]) opt out.
Total income, total deforestation levels under the payments scheme, and avoided deforestation
are then:
Y P ES =∫ N
˜ıYif(i)di +
∫ ˜ı
0
piDif(i)di (9)
DP ES =∫ N
˜ıDif(i)di (10)
AD = DBAU − DP ES =∫ ˜ı
0
Dif(i)di (11)
9
N
N
N
0
0
0
r
iB,P,E
iB,P,E
iB,P,E
L = rDB,P,E
Yi/Di
Yi
Di
1
2
(i) Distribution of average opportunity costs
(ii) Distribution of opportunity costs
(iii) Distribution of deforestation levels
Figure 1: Payments scheme for REDD in an incomplete information framework
10
When setting the price schedule pi of the scheme, the policy maker has to make two choices.
First, it chooses the indifferent agent ˜ı, which is the final agent to participate in the scheme, setting
p˜ı. Second, it decides how much to pay agents entering the scheme, setting pi for agents i ∈ [0, ˜ı].
The choice of the indifferent agent determines the quantity of avoided deforestation: AD. The
price level determines how the surplus from REDD is distributed between the policy maker and
deforestation agents. Setting pi = Yi/Di implies that agents are retributed according to their
opportunity costs, which means that the surplus from REDD is entirely captured by the policy
maker. In other words, agents’ welfare remains as in the BAU baseline case. Setting pi > Yi/Di
implies that some share of the REDD surplus is distributed to deforestation agents. Thus, they are
better off under the scheme than in the BAU baseline case.
3.1 Development agency
The development agency maximization program becomes:
maxpi
WA = Y P ES − Y BAU =∫ ˜ı
0
(piDi − Yi)f(i)di (12)
s.t rAD −
∫ ˜ı
0
piDif(i)di =∫ ˜ı
0
(r − pi)Dif(i)di ≥ 0 (13)
When choosing the payment schedule, it is easy to see that this policy maker’s objective function
is strictly increasing in price offered to the deforestation agents. Moreover, so long as the offered
price pi is strictly larger than agent i’s opportunity cost, i will be better off under the scheme.
The policy maker then sets the highest possible price schedule that binds its budget constraint.
Moreover, it has no interest in offering more than the international price r to the agents. This is
because it would be unable to respect its budget constraint or would need to obtain rent from other
agents, i.e. paying them a lower price.
The equilibrium payments scheme thus takes the form:
pi = r ∀i ∈ [0, N ]
ı : Y
D= r
∫ ı0(r − pi)Dif(i)di = 0
(14)
The policy maker sets a uniform price to all agents, which is similar to the incomplete infor-
mation case. Low opportunity cost agents accept the payment, which improves their well being
(they lose Yi but get rDi > Yi). The policy maker then sells the avoided deforestation credits at
the same price r, and is thus able to finance the policy without loss. Note here that agents with a
high opportunity cost obtain the same welfare as in the BAU baseline.
11
It can be seen that the indifferent agent is the same as in the incomplete information case.
Then the outcome in terms of deforestation is also the same. Moreover, the complete information
case brings a uniform price to avoided deforestation when the policy maker is a development
agency (pi = r). Both welfare and the quantity of avoided deforestation are identical to that
achieved in the incomplete information case. This is due to the fact that the policy maker and
the deforestation agents have the same objective, which is to maximize agents’ welfare. Therefore,
improving information about agents’ true opportunity costs has no real impact on either outcome,
whether the quantity of avoided deforestation or agents’ welfare.
3.2 Policy maker maximizing net income from REDD
The policy maker’s maximization program is:
maxpi
πP M =∫ ˜ı
0
(r − pi)Dif(i)di (15)
In this case, it is straightforward to see that the policy maker will pay deforestation agents so
long as it makes profit on the scheme. Note that the price offered must remain lower than the
international price r. Moreover, it will pay them as little as possible. In the context of improved
information about agents’ opportunity costs, this means that it will bind them to these costs.
The equilibrium scheme is thus:
pi =
Yi
Di
∀i ∈ [0, ˜ı]
r ∀i ∈ [ı, N ]
˜ı :˜Y˜D
= r∫ ˜ı
0(r − pi)Dif(i)di > 0
(16)
Note that since the indifferent agent is the same, the profit-maximizing policy maker achieves
the same outcome in terms of avoided deforestation as the development agency. The only difference
is that, with complete information, the policy maker can bind agents to their opportunity costs,
which implies a different distribution of the surplus from REDD. The welfare of deforestation agents
is then exactly the same as in the BAU baseline case, and lower than in the incomplete information
case.
12
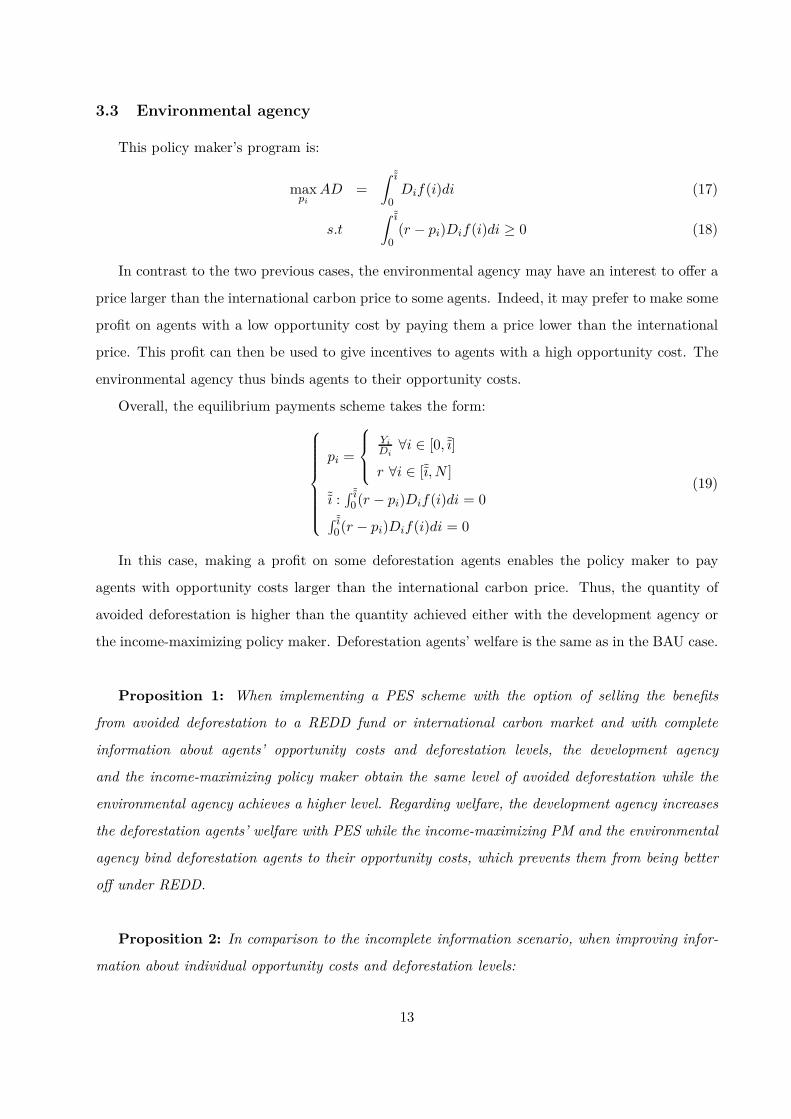
3.3 Environmental agency
This policy maker’s program is:
maxpi
AD =∫ ˜ı
0
Dif(i)di (17)
s.t
∫ ˜ı
0
(r − pi)Dif(i)di ≥ 0 (18)
In contrast to the two previous cases, the environmental agency may have an interest to offer a
price larger than the international carbon price to some agents. Indeed, it may prefer to make some
profit on agents with a low opportunity cost by paying them a price lower than the international
price. This profit can then be used to give incentives to agents with a high opportunity cost. The
environmental agency thus binds agents to their opportunity costs.
Overall, the equilibrium payments scheme takes the form:
pi =
Yi
Di∀i ∈ [0, ˜ı]
r ∀i ∈ [ı, N ]
˜ı :∫ ˜ı
0(r − pi)Dif(i)di = 0
∫ ˜ı0(r − pi)Dif(i)di = 0
(19)
In this case, making a profit on some deforestation agents enables the policy maker to pay
agents with opportunity costs larger than the international carbon price. Thus, the quantity of
avoided deforestation is higher than the quantity achieved either with the development agency or
the income-maximizing policy maker. Deforestation agents’ welfare is the same as in the BAU case.
Proposition 1: When implementing a PES scheme with the option of selling the benefits
from avoided deforestation to a REDD fund or international carbon market and with complete
information about agents’ opportunity costs and deforestation levels, the development agency
and the income-maximizing policy maker obtain the same level of avoided deforestation while the
environmental agency achieves a higher level. Regarding welfare, the development agency increases
the deforestation agents’ welfare with PES while the income-maximizing PM and the environmental
agency bind deforestation agents to their opportunity costs, which prevents them from being better
off under REDD.
Proposition 2: In comparison to the incomplete information scenario, when improving infor-
mation about individual opportunity costs and deforestation levels:
13
• The development agency sets the same level of payment, which results in the same outcome,
both in terms of avoided deforestation and welfare impacts.
• The profit-maximizing policy maker can profit from low opportunity cost agents, which results
in the same avoided deforestation outcome while the surplus from REDD is switched from the
deforestation agents to the policy maker.
• The environmental agency redistributes REDD rent from low opportunity cost agents to agents
with higher opportunity costs; the amount of deforestation avoided is larger while the welfare
of deforestation agents decreases.
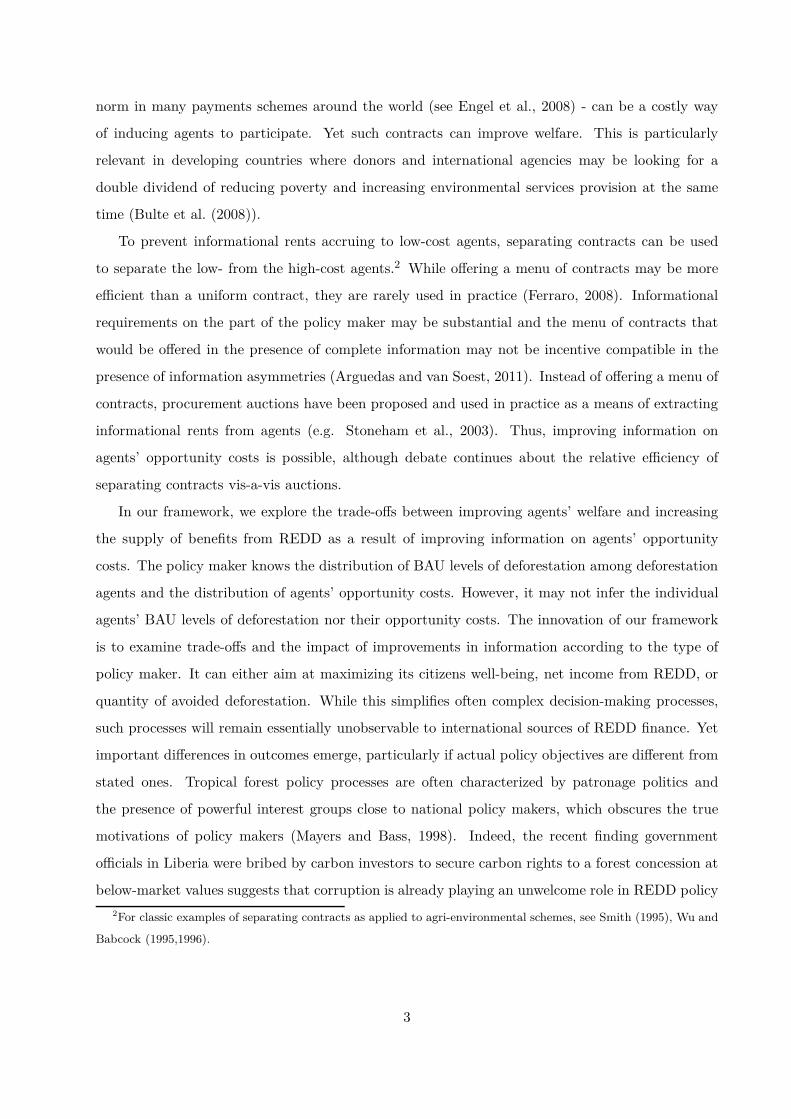
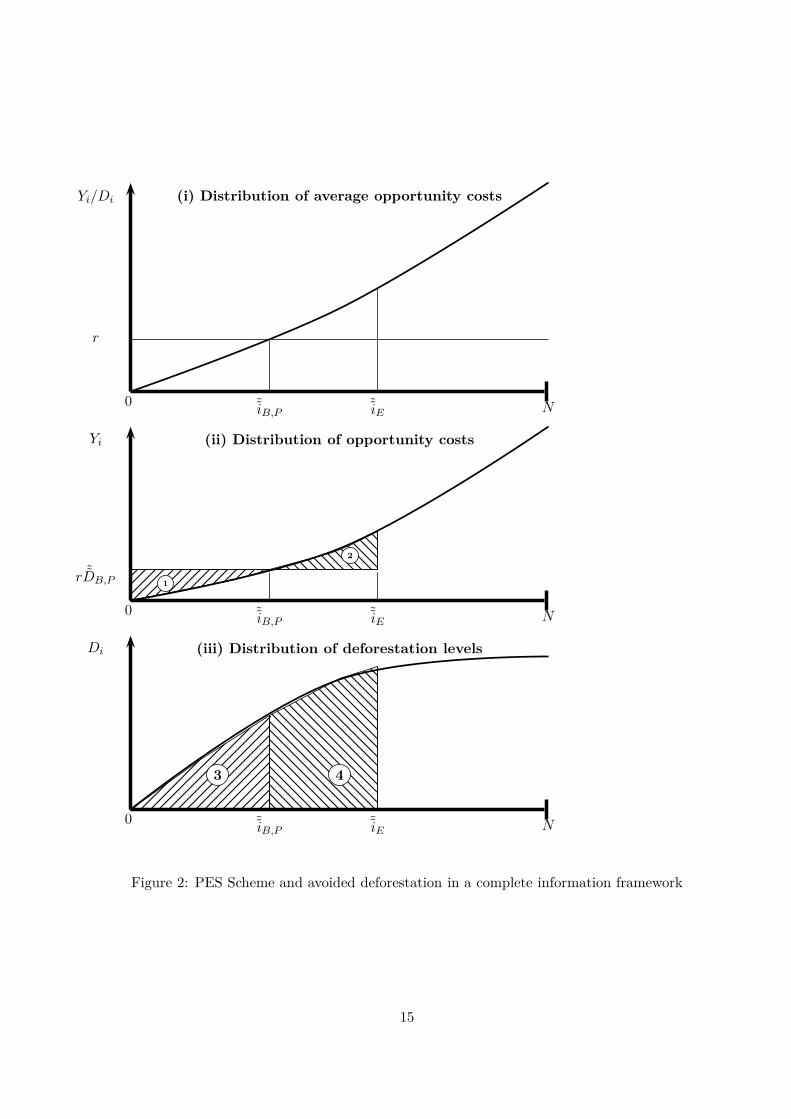
3.4 Graphic illustration
Table 1 and figure 2 illustrate the payments schemes and associated outcomes for the three types
of policy maker under complete information. As in figure 1, Figure (i) presents the distribution
of average opportunity costs Yi/Di; Figure (ii) presents the distribution of opportunity costs Yi;
Figure (iii) presents the distribution of deforestation levels Di.
The policy maker can now discriminate among deforestation agents. The development agency
sets pi = r, for all agents (figure (i)). As a result, the indifferent agent is ˜ıB,P . Their welfare
increases by the amount given in zone 1 (figure (ii)). This is the difference between the amount
received under the scheme and the amount received in the BAU baseline case (rDi − Yi). The
amount of deforestation avoided is illustrated in zone 3 in figure (iii). The scheme breaks even
since the amount spent (pi˜DB,P ) equals the amount received from international REDD finance
(rAD), as shown in zone 1 (figure (ii)).
The income-maximizing policy maker sets pi = Yi/Di, up to pi = r (figure (i)). As a conse-
quence, the indifferent agent remains ˜ıB,P , although the agents’ welfare is the same as under BAU.
Avoided deforestation is still equal to zone 3 in figure (iii). However, the scheme makes some profit
as illustrated in zone 1 (figure (ii)). The policy maker buys avoided deforestation at price Yi/Di
and sells the credit at price r > Yi/Di.
Finally, the environmental agency also makes some profit on low opportunity cost agents (zone
1 in figure (ii)). However, this profit is redistributed to agents with higher opportunity costs. The
indifferent agent here is ˜ıE , such that the area in zone 1 equals the area in zone 2 (figure (ii)),
that is the scheme makes no profit. A larger number of indifferent agents increases the amount of
avoided deforestation equivalent to both zone 3 + 4 (figure (iii)).
14
N
N
N
0
0
0
r
˜iB,P
˜iB,P
˜iB,P
˜iE
˜iE
˜iE
r ˜DB,P
Yi/Di
Yi
Di
1
2
3 4
(i) Distribution of average opportunity costs
(ii) Distribution of opportunity costs
(iii) Distribution of deforestation levels
Figure 2: PES Scheme and avoided deforestation in a complete information framework
15
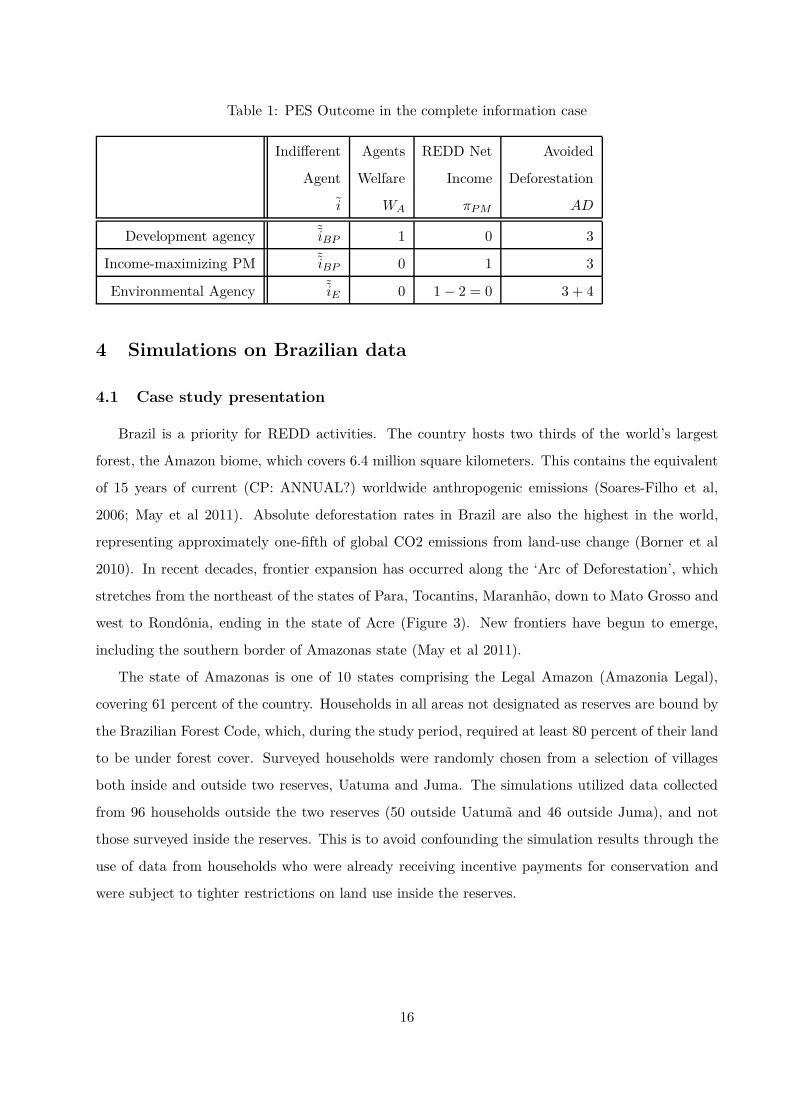
Table 1: PES Outcome in the complete information case
Indifferent Agents REDD Net Avoided
Agent Welfare Income Deforestation
i WA πP M AD
Development agency ˜iBP 1 0 3
Income-maximizing PM ˜iBP 0 1 3
Environmental Agency ˜iE 0 1 − 2 = 0 3 + 4
4 Simulations on Brazilian data
4.1 Case study presentation
Brazil is a priority for REDD activities. The country hosts two thirds of the world’s largest
forest, the Amazon biome, which covers 6.4 million square kilometers. This contains the equivalent
of 15 years of current (CP: ANNUAL?) worldwide anthropogenic emissions (Soares-Filho et al,
2006; May et al 2011). Absolute deforestation rates in Brazil are also the highest in the world,
representing approximately one-fifth of global CO2 emissions from land-use change (Borner et al
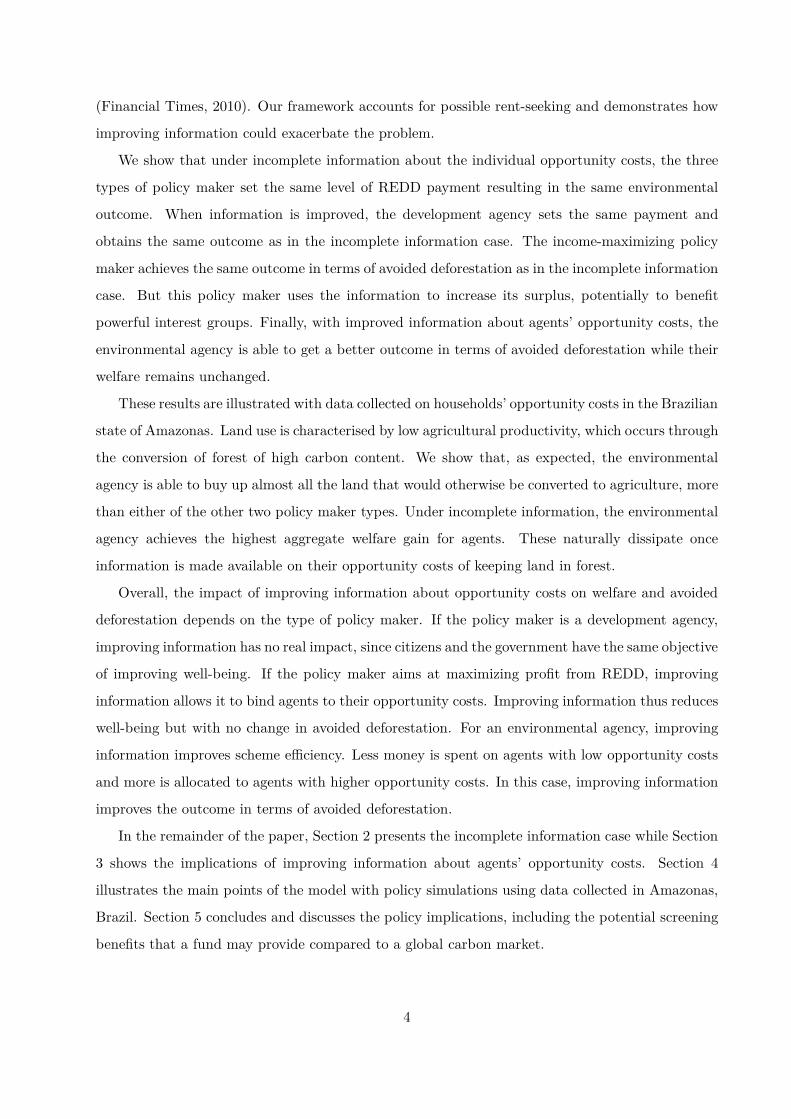
2010). In recent decades, frontier expansion has occurred along the ‘Arc of Deforestation’, which
stretches from the northeast of the states of Para, Tocantins, Maranhão, down to Mato Grosso and
west to Rondônia, ending in the state of Acre (Figure 3). New frontiers have begun to emerge,
including the southern border of Amazonas state (May et al 2011).
The state of Amazonas is one of 10 states comprising the Legal Amazon (Amazonia Legal),
covering 61 percent of the country. Households in all areas not designated as reserves are bound by
the Brazilian Forest Code, which, during the study period, required at least 80 percent of their land
to be under forest cover. Surveyed households were randomly chosen from a selection of villages
both inside and outside two reserves, Uatuma and Juma. The simulations utilized data collected
from 96 households outside the two reserves (50 outside Uatumã and 46 outside Juma), and not
those surveyed inside the reserves. This is to avoid confounding the simulation results through the
use of data from households who were already receiving incentive payments for conservation and
were subject to tighter restrictions on land use inside the reserves.
16
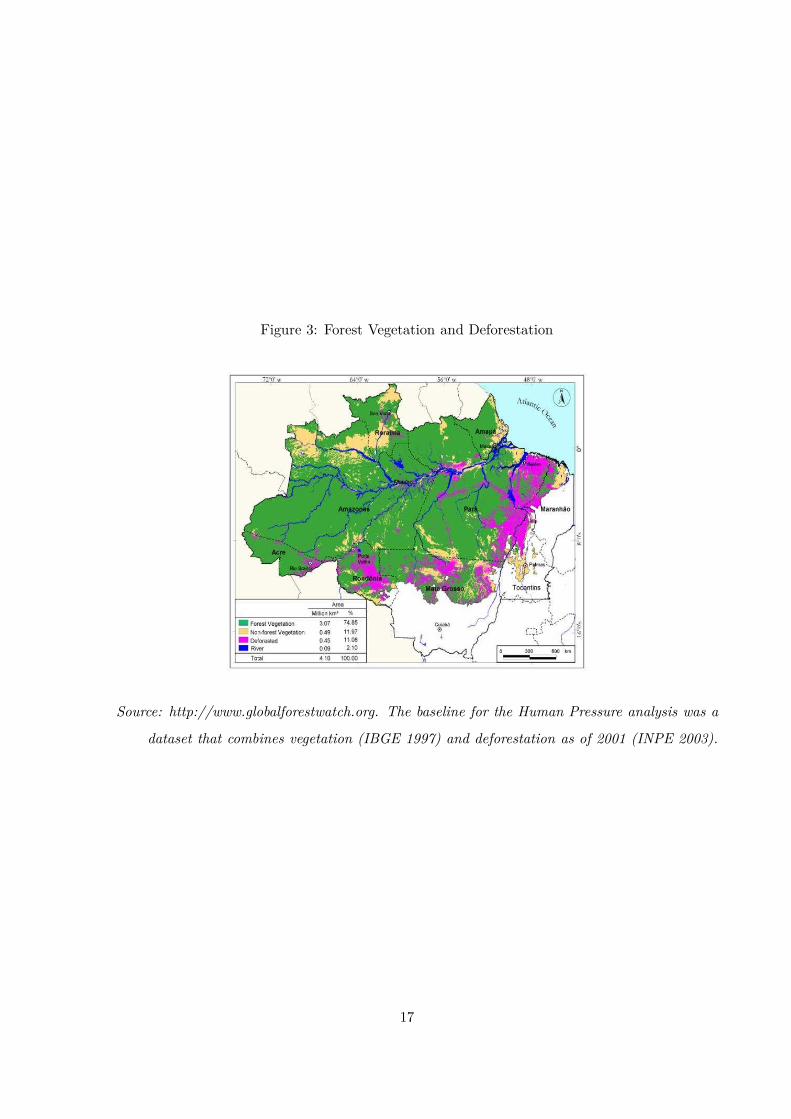
Figure 3: Forest Vegetation and Deforestation
Source: http://www.globalforestwatch.org. The baseline for the Human Pressure analysis was a
dataset that combines vegetation (IBGE 1997) and deforestation as of 2001 (INPE 2003).
17
4.2 Estimation of opportunity costs and BAU deforestation
Opportunity costs are estimated from the household survey, which included information on
household income earned and assets held in the year prior to the survey. Socio-demographic data
such as household composition, age, and education were collected as well as data on land clearing,
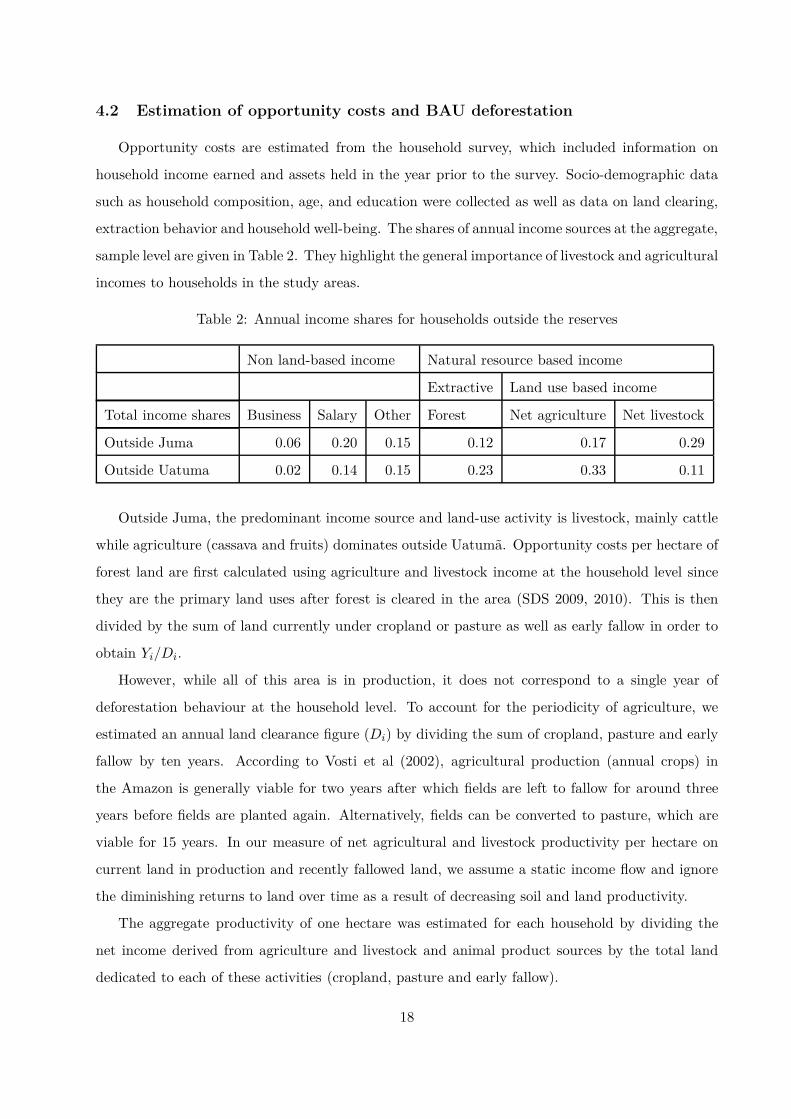
extraction behavior and household well-being. The shares of annual income sources at the aggregate,
sample level are given in Table 2. They highlight the general importance of livestock and agricultural
incomes to households in the study areas.
Table 2: Annual income shares for households outside the reserves
Non land-based income Natural resource based income
Extractive Land use based income
Total income shares Business Salary Other Forest Net agriculture Net livestock
Outside Juma 0.06 0.20 0.15 0.12 0.17 0.29
Outside Uatuma 0.02 0.14 0.15 0.23 0.33 0.11
Outside Juma, the predominant income source and land-use activity is livestock, mainly cattle
while agriculture (cassava and fruits) dominates outside Uatumã. Opportunity costs per hectare of
forest land are first calculated using agriculture and livestock income at the household level since
they are the primary land uses after forest is cleared in the area (SDS 2009, 2010). This is then
divided by the sum of land currently under cropland or pasture as well as early fallow in order to
obtain Yi/Di.
However, while all of this area is in production, it does not correspond to a single year of
deforestation behaviour at the household level. To account for the periodicity of agriculture, we
estimated an annual land clearance figure (Di) by dividing the sum of cropland, pasture and early
fallow by ten years. According to Vosti et al (2002), agricultural production (annual crops) in
the Amazon is generally viable for two years after which fields are left to fallow for around three
years before fields are planted again. Alternatively, fields can be converted to pasture, which are
viable for 15 years. In our measure of net agricultural and livestock productivity per hectare on
current land in production and recently fallowed land, we assume a static income flow and ignore
the diminishing returns to land over time as a result of decreasing soil and land productivity.
The aggregate productivity of one hectare was estimated for each household by dividing the
net income derived from agriculture and livestock and animal product sources by the total land
dedicated to each of these activities (cropland, pasture and early fallow).
18
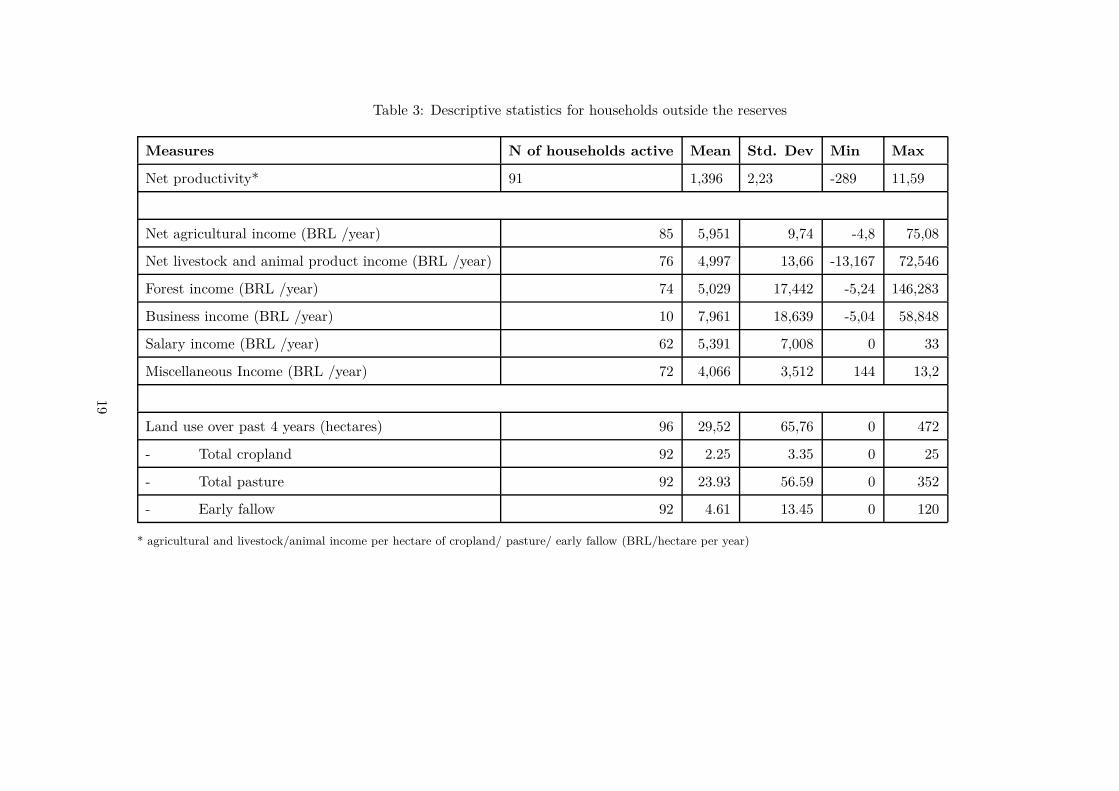
Table 3: Descriptive statistics for households outside the reserves
Measures N of households active Mean Std. Dev Min Max
Net productivity* 91 1,396 2,23 -289 11,59
Net agricultural income (BRL /year) 85 5,951 9,74 -4,8 75,08
Net livestock and animal product income (BRL /year) 76 4,997 13,66 -13,167 72,546
Forest income (BRL /year) 74 5,029 17,442 -5,24 146,283
Business income (BRL /year) 10 7,961 18,639 -5,04 58,848
Salary income (BRL /year) 62 5,391 7,008 0 33
Miscellaneous Income (BRL /year) 72 4,066 3,512 144 13,2
Land use over past 4 years (hectares) 96 29,52 65,76 0 472
- Total cropland 92 2.25 3.35 0 25
- Total pasture 92 23.93 56.59 0 352
- Early fallow 92 4.61 13.45 0 120
* agricultural and livestock/animal income per hectare of cropland/ pasture/ early fallow (BRL/hectare per year)
19
Summary statistics of the net productivity in Brazilian Real (BRL) are presented in Table 3,
showing the value of per hectare of cropland, pasture and early fallow.5 Mean incomes are also
provided in BRL. These also vary widely among individual households (CP: WHY ARE SOME MIN
INCOME VALUES IN TABLE 3 NEGATIVE? DUE TO HIGH COSTS?). The mean area under
cropland is much smaller than the area under pasture. Thus, income per hectare is on average much
higher for agriculture than for livestock, the latter being an extensive but land intensive activity.
4.3 Setting a carbon payment level
In order to generate a feasible international payment for avoiding deforestation (r), several fac-
tors need to be considered. First, a carbon price needs to be determined. Assuming that REDD
markets will likely be based on the sale of temporary credits (Borner and Wunder, 2008), we have
opted to use the crediting structure as used by afforestation and reforestation projects in the Clean
Development Mechanism (CDM). These projects allocate temporary Certified Emissions Reduc-
tions (tCERs), which typically fetch a price lower than that of permanent CERs. A conservative
estimate of 10 e/tCO2 is used. Second, a discount rate is chosen that will affect the value of tCERs
against permanent CERS. We opted to vary the discount rate between 5 and 15 percent, as seen
in Table 3. The relationship between the price of a tCER, P tCER0 , and that of a permanent CER,
P CER0 , is given by (see Dutschke et al. 2005):
P tCER0 = P CER
0 −P CER
T
(1 + ρ)T(20)
where ρ is the discount rate and T = 5.We convert this price into the corresponding annuity
over the five years before obtaining the eligible amount of CO2 per hectare (see below and Table
4). This enables a comparison with our estimates of annual per hectare opportunity costs.
Carbon content per hectare varies widely in the Amazon. We apply a conservative estimate of
110 Mg C/ha, corresponding to 403 tCO2 /ha (Houghton, 2001). In the calculations shown below,
we present payments for net carbon stock, of around 81.5 t C / ha (equivalent to around 75% of
gross stocking per ha).6
5One household claimed a total area of land, which seemed unreasonably small for the amount of agricultural pro-
duction, and is therefore excluded from the sample. Another four households who either had no recorded agricultural
or livestock income, or recorded land were also excluded.6The carbon content of 110Mg C (t) / ha includes the carbon content of secondary regrowth based on Fearnside’s
(1996) average biomass figure of 28.5 t C per hectare for all deforested areas in the Amazon.
20
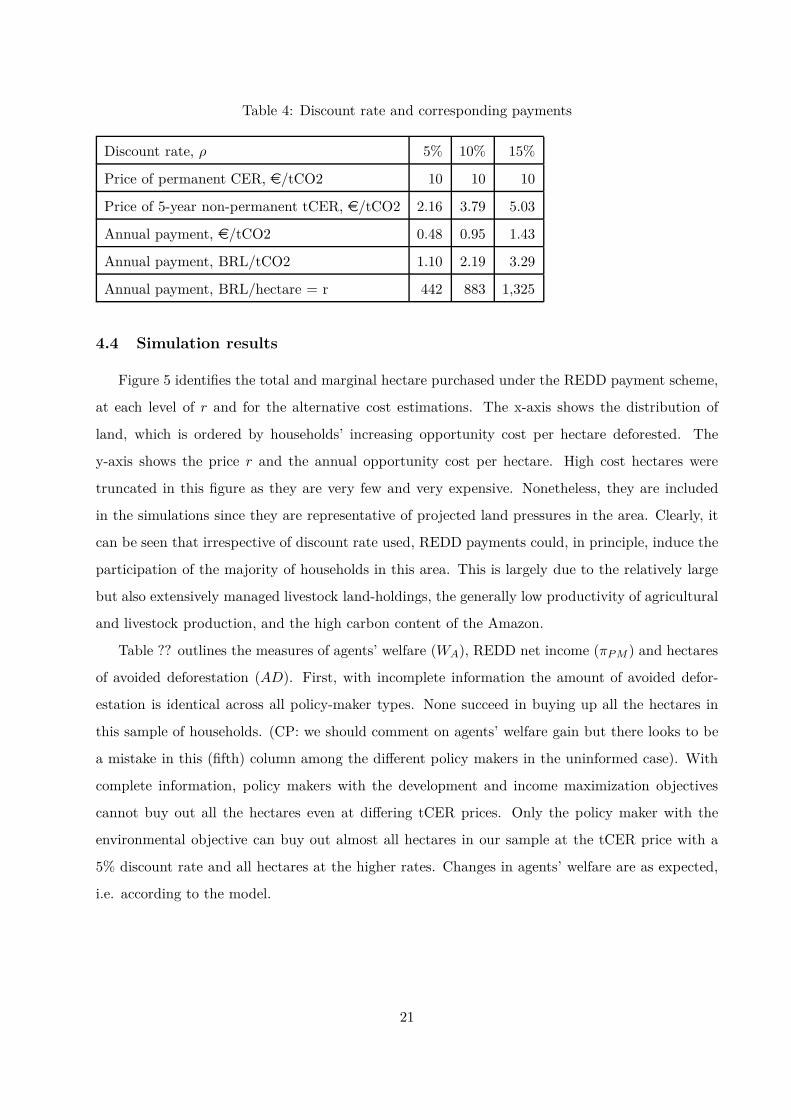
Table 4: Discount rate and corresponding payments
Discount rate, ρ 5% 10% 15%
Price of permanent CER, e/tCO2 10 10 10
Price of 5-year non-permanent tCER, e/tCO2 2.16 3.79 5.03
Annual payment, e/tCO2 0.48 0.95 1.43
Annual payment, BRL/tCO2 1.10 2.19 3.29
Annual payment, BRL/hectare = r 442 883 1,325
4.4 Simulation results
Figure 5 identifies the total and marginal hectare purchased under the REDD payment scheme,
at each level of r and for the alternative cost estimations. The x-axis shows the distribution of
land, which is ordered by households’ increasing opportunity cost per hectare deforested. The
y-axis shows the price r and the annual opportunity cost per hectare. High cost hectares were
truncated in this figure as they are very few and very expensive. Nonetheless, they are included
in the simulations since they are representative of projected land pressures in the area. Clearly, it
can be seen that irrespective of discount rate used, REDD payments could, in principle, induce the
participation of the majority of households in this area. This is largely due to the relatively large
but also extensively managed livestock land-holdings, the generally low productivity of agricultural
and livestock production, and the high carbon content of the Amazon.
Table ?? outlines the measures of agents’ welfare (WA), REDD net income (πP M ) and hectares
of avoided deforestation (AD). First, with incomplete information the amount of avoided defor-
estation is identical across all policy-maker types. None succeed in buying up all the hectares in
this sample of households. (CP: we should comment on agents’ welfare gain but there looks to be
a mistake in this (fifth) column among the different policy makers in the uninformed case). With
complete information, policy makers with the development and income maximization objectives
cannot buy out all the hectares even at differing tCER prices. Only the policy maker with the
environmental objective can buy out almost all hectares in our sample at the tCER price with a
5% discount rate and all hectares at the higher rates. Changes in agents’ welfare are as expected,
i.e. according to the model.
21
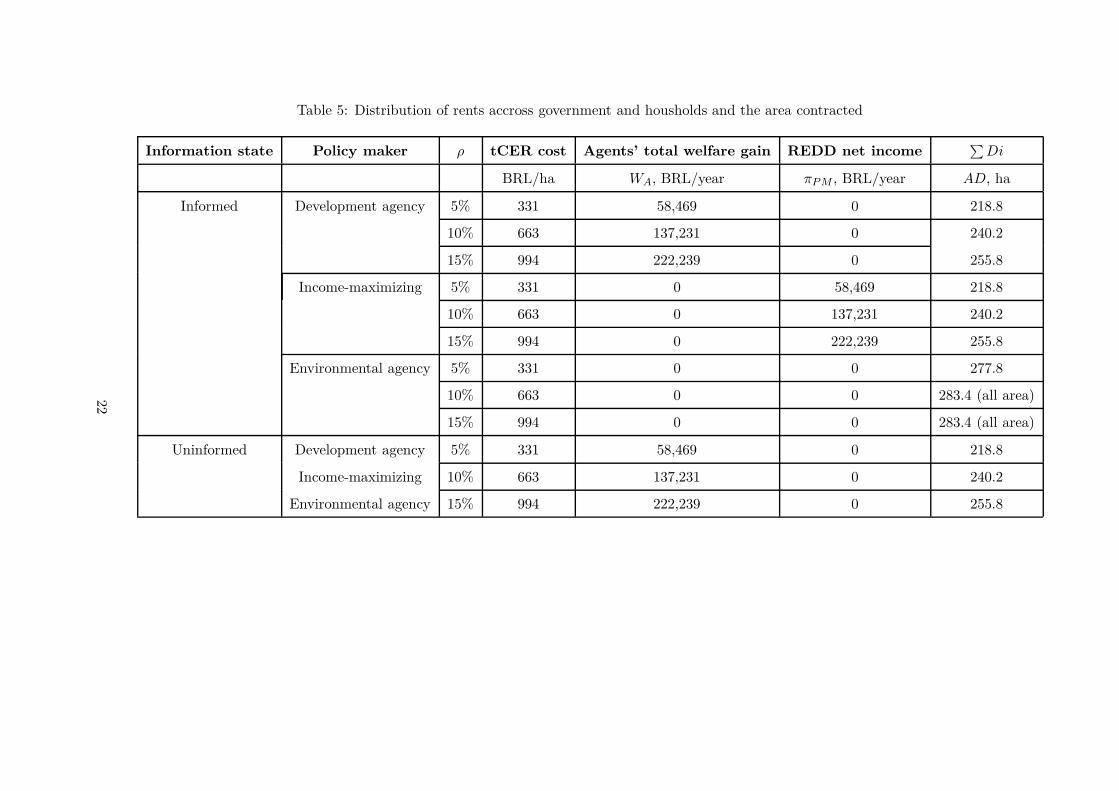
Table 5: Distribution of rents accross government and housholds and the area contracted
Information state Policy maker ρ tCER cost Agents’ total welfare gain REDD net income∑
Di
BRL/ha WA, BRL/year πP M , BRL/year AD, ha
Informed Development agency 5% 331 58,469 0 218.8
10% 663 137,231 0 240.2
15% 994 222,239 0 255.8
Income-maximizing 5% 331 0 58,469 218.8
10% 663 0 137,231 240.2
15% 994 0 222,239 255.8
Environmental agency 5% 331 0 0 277.8
10% 663 0 0 283.4 (all area)
15% 994 0 0 283.4 (all area)
Uninformed Development agency 5% 331 58,469 0 218.8
Income-maximizing 10% 663 137,231 0 240.2
Environmental agency 15% 994 222,239 0 255.8
22
5 Discussion and conclusion
In this paper, we develop a simple incentive payments framework for investigating the impacts
of improving information about agents? opportunity costs on agents? welfare and the level of
deforestation avoided. With growing interest from policy makers and practitioners in policies
to Reduce Emissions from Deforestation and Degradation (REDD), we focus on the claim that
improving information could lead to increased efficiency. First, an incentive payment is offered
by a policy maker in a REDD host country conditional on deforestation agents not deforesting.
Second, the carbon services supplied from avoided deforestation may be sold by the host country
either on an international carbon market (in the form of carbon credits) or to a fund, at a fixed
price. We then consider two cases: incomplete and complete information about individual agents?
opportunity costs and their deforestation levels. In both cases, the distribution of opportunity costs
and BAU deforestation are known to the policy maker.
We find that the results largely depend on the objective of the policy maker implementing the
payments scheme. It may be one of three types: development agency, income-maximizing or an
environmental agency. Under complete information, the environmental agency performs the best
in terms of the quantity of deforestation avoided as illustrated with the simulations performed
using household data collected in Brazil. Indeed, it uses the information on opportunity costs to
generate profit on low-cost agents, paying them less than the international price. This profit is then
used to retribute agents with larger opportunity costs who also deforest more. We note, however,
that by paying these agents more than the international price, such payments could be construed
as ’inefficient’. Yet the net effect aggregated across all deforestation agents is more deforestation
avoided for a given price.
The income-maximizing policy maker uses improved information on opportunity costs to in-
crease its income, which could be redistributed to the wider population. Alternatively, it could
retain rents from REDD for distribution among patron-client networks. The development agency
performs better than the other types of policy maker in terms of welfare improvements. In this case,
it pays as much as possible to deforestation agents setting a uniform price equivalent to the interna-
tional price. Note that agents are no better off under the scheme than in the BAU case. In contrast,
agents? welfare is the same as in the BAU case when the policy maker is income-maximizing or an
environmental agency due to binding agents to their opportunity costs.
An important point concerns the utility of improving information about individual opportunity
costs. Improving information in our framework only increases the efficiency of the REDD policy
23
if the policy maker is an environmental agency, that is setting the policy to maximize avoided
deforestation. In this case, improving information increases avoided deforestation. If the policy
maker is income maximizing, improving information allows it to capture the surplus from REDD,
which decreases the agents? welfare without increasing avoided deforestation. Thus, improving
information has no real environmental impact when the policy maker only aims at maximizing the
welfare of deforestation agents. Given the demands of stakeholders in the REDD policy debate to
improve the well-being of (often poor) forest dwellers, this is an important insight.
The model presented in this paper is, of course, very simple. For instance, we ignored any
possible types of transaction costs, which are likely to reduce the incentives for agents to participate.
Yet it demonstrates some of the possible trade-offs involved and hence, opens the door for thinking
about the real desirability of improving information about individual opportunity costs in the
context of REDD. Our results suggest that the actual motivations of the policy maker is key to
determining whether or not improving information will increase efficiency. But while obtaining
information about opportunity costs is obviously challenging, our results also raise the question
of ever knowing about policy makers? true motivations. First, whether it could be identified as
welfare, income or environmental service maximizing and second, for the income maximizers to
whom the rents from REDD might be distributed. Given endemic corruption among the natural
resource sectors of many developing countries, this latter point is particularly pertinent.
In our framework, we only assume that there is some international price for forest carbon sinks
that would otherwise be deforested. Funding for REDD could be obtained by the host country either
through an international (regulated) carbon market and/or some kind of (voluntary) fund. Where
the policy maker?s objective can be discerned (at least to some extent), the source of international
funding becomes relevant. An international market, like any market, will be indifferent to the
objective of the policy maker and hence, will not discriminate accordingly. A fund, on the other
hand, may have the ability to discriminate among types of policy maker. For example, it may
choose to avoid REDD host governments with a record of corruption or focus on those with well-
run environmental agencies. With this flexibility, a fund-based financing mechanism may be better
placed than a market to choose among competing policy objectives particularly if REDD is not to
focus only on maximizing forest carbon services alone.
24
References
Angelsen, A. (2008). REDD models and baselines. International Forestry Review, 10(3, Sp. Iss.
SI):465–475. International Workshop on the International Regime - Avoided Deforestation and
the Evolution of Public and Private Policies Towards Forests in Developing Countries, Paris,
FRANCE, NOV 21-23, 2007. 1
Angelsen, A. (2010). Policies for reduced deforestation and their impact on agricultural production.
Proc Natl Acad Sci U S A, 107(46):19639–44.
Angelsen, A. and Kaimowitz, D. (1999). Rethinking the causes of deforestation: Lessons from
economic models. World Bank Research Observer, 14(1):73–98.
Arguedas, C. and Soest, D. (2011). Optimal conservation programs, asymmetric information and
the role of fixed costs. Environmental & Resource Economics, 50(2):305–323.
Baylis, K., Peplow, S., Rausser, G., and Simon, L. (2008). Agri-environmental policies in the eu and
united states: A comparison. Ecological Economics, 65(4):753 – 764. Payments for Environmental
Services in Developing and Developed Countries.
Börner, J. and Wunder, S. (2008). Paying for avoided deforestation in the Brazilian Amazon: from
cost assessment to scheme design. International Forestry Review, 10(3):496–511+.
Bulte, E. H., Lipper, L., Stringer, R., and Zilberman, D. (2008). Payments for ecosystem services
and poverty reduction: concepts, issues, and empirical perspectives. Environment and Develop-
ment Economics, 13(03):245–254. 1
Börner, J., Wunder, S., Wertz-Kanounnikoff, S., Tito, M. R., Pereira, L., and Nascimento, N.
(2010). Direct conservation payments in the brazilian amazon: Scope and equity implications.
Ecological Economics, 69(6):1272 – 1282. <ce:title>Special Section - Payments for Environmental
Services: Reconciling Theory and Practice</ce:title>.
Cavendish, W. (2002). Quantitative methods for estimating the economic value of resource use to
rural households. B.M. Campbell, M.K. Luckert (Eds.), Uncovering the hidden harvest: valuation
methods for woodland and forest resources, Earthscan, London:17–65.
Claassen, R., Cattaneo, A., and Johansson, R. (2008). Cost-effective design of agri-environmental
payment programs: U.s. experience in theory and practice. Ecological Economics, 65(4):737 –
752. Payments for Environmental Services in Developing and Developed Countries.
25
Dutschke, M., Wong, J. L. P., and Rumberg, M. (2004). Value and risks of expiring carbon credits
from cdm afforestation and reforestation. Climate Policy, 5:109–125.
Eliasch, J. (2008). Climate change : financing global forests : the Eliasch review. Earthscan,
London ; Sterling, VA :.
Engel, S., Pagiola, S., and Wunder, S. (2008a). Designing payments for environmental services in
theory and practice: An overview of the issues. Ecological Economics, 65(4):663 – 674. Payments
for Environmental Services in Developing and Developed Countries.
Engel, S., Pagiola, S., and Wunder, S. (2008b). Designing payments for environmental services in
theory and practice: An overview of the issues. Ecological Economics, 65(4):663–674.
Engel, S. and Palmer, C. (2009). Avoided deforestation : prospects for mitigating climate change.
Routledge, New York, NY :.
Farley, J. and Costanza, R. (2010). Payments for ecosystem services: From local to global. Ecological
Economics, 69(11):2060 – 2068. Special Section - Payments for Ecosystem Services: From Local
to Global.
Fearnside, P. M. (1996). Amazonian deforestation and global warming: Carbon stocks in vegetation
replacing Brazil’s Amazon forest. Forest Ecology and Management, 80(1-3):21–34.
Ferraro, P. and Simpson, D. (2002). The cost-effectiveness of conservation performance payments.
Land Economics, 78(03):339–353.
Ferraro, P. J. (2008). Asymmetric information and contract design for payments for environmental
services. Ecological Economics, 65(4):810–821.
Ferraro, P. J. and Kiss, A. (2002). Direct Payments to Conserve Biodiversity. Science,
298(5599):1718–1719.
FinancialTimes (2010). Probe as carbon deal hit by bribe accusations. Financial Times, June
4th(www.ft.com/cms/s/0/61b50aa4-6f71-11df-9f43-00144feabdc0.html).
GlobalForestWatch (2012). Human pressure on the brazilian amazon forests.
http://www.globalforestwatch.org.
Gregersen, H., Lakany, H., Karsenty, A., and White, A. (2010). Does the opportunity cost approach
indicate the real cost of redd+? rights and realities of paying for redd+. Rights and Resources
Initiative.
26
Groom, B. and Palmer, C. (2010). Cost-effective provision of environmental services: the role of
relaxing market constraints. Environment and Development Economics, 15(02):219–240.
IBGE (1997). Diagnostico ambiental da amazonia legal. Rio de Janeiro, RJ, Brasil.
IPCC (2007). Fourth assessment report (ipcc ar4). Technical report, Geneva: Intergovernmental
Panel on Climate Change. 1
Leplay, S., Busch, J., Delacote, P., and Thoyer, S. (2011). Implementation of national and in-
ternational redd mechanism under alternative payments for environemtal services: theory and
illustration from sumatra. Working papers, LAMETA, Universtiy of Montpellier. 1
May, P., Milikan, B., and Gebara, M. (2011). The context of redd+ in brazil: Drivers, agents and
institutions. Occasional paper 55. 2nd edition. CIFOR, Bogor, Indonesia.
Mayers, J. and Bass, S. (1998). The role of policy and institutions. In Goldsmith et al. (eds.)
Tropical Rain Forest: A Wider Perspective, Springer, pp.269-302.
Muller, J. and Albers, H. J. (2004). Enforcement, payments, and development projects near pro-
tected areas: how the market setting determines what works where. Resource and Energy Eco-
nomics, 26(2):185–204.
Murray, B., Lubowski, R., and Sohngen, B. (2009). Including international forest carbon incentives
in climate policy: Understanding the economics. Technical report, NI R 09-03 Nicholas Institute
for Environmental Policy Solutions Duke University, Durham, NC.
Naucler and Enkvist (2009). Version 2 of the global greenhouse gas abatement cost curve. Technical
report, McKinsey.
Neeff, T. and Ascui, F. (2009). Lessons from carbon markets for designing an effective redd archi-
tecture. Climate Policy, 9(3):306–315.
Pagiola, S. (2008). Payments for environmental services in costa rica. Ecological Economics,
65(4):712 – 724. Payments for Environmental Services in Developing and Developed Countries.
Pagiola, S. and Bosquet, B. (2009). Estimating the costs of redd at the country level. MPRA Paper
13726, University Library of Munich, Germany. 1
Palmer, C. (2011). Property rights and liability for deforestation under redd+: Implications for
’permanence’ in policy design. Ecological Economics, 70(4):571–576.
27
Pascual, U., Muradian, R., RodrÃguez, L. C., and Duraiappah, A. (2010). Exploring the links
between equity and efficiency in payments for environmental services: A conceptual approach.
Ecological Economics, 69(6):1237 – 1244. Special Section - Payments for Environmental Services:
Reconciling Theory and Practice.
Pattanayak, S., Wunder, S., and Ferraro, P. J. (2010). Show me the money: Do payments supply
ecosystem services in developing countries? Review of Environmental Economics Policy, 04(02).
SDS, FAS, and CEUC (2010). Plano de gestão da reserva de desenvolvimento sustentavel do juma.
Volume 1 e 2. Série Técnica Planos de Gestão. Março 2010, Novo Aripuana, Amazonas.
Smith, R. (1995). The conservation reserve program as a least-cost land retirement mechanism.
American Journal of Agricultural Economics, 77:93–105.
Soares-Filho, B. S., Nepstad, D. C., Curran, L. M., Cerqueira, G. C., Garcia, R. A., Ramos, C. A.,
Voll, E., McDonald, A., Lefebvre, P., and Schlesinger, P. (2006). Modelling conservation in the
amazon basin. Nature, 440(7083):520–523.
Stern, N. (2007). The Economics of Climate Change: The Stern Review. Cambridge University
Press.
Stoneham, G., Chaudhri, V. H. A., and Strappazzon, L. (2003). Auctions for conservation contracts:
an empirical examination of victoria?s bushtender trial. Australian Journal of Agricultural and
Resource Economics, 47(004):477–500.
van der Werf, G. R., Morton, D. C., DeFries, R. S., Olivier, J. G. J., Kasibhatla, P. S., Jackson,
R. B., Collatz, G. J., and Randerson, J. T. (2009). Co2 emissions from forest loss. Nature Geosci,
2(11):737–738. 1
Vosti, S., Witcover, J., and Carpentier, C. (2002). Agricultural intensification by smallholders in
the western brazilian amazon. from deforestation to sustainable land use. Research Report 130.
International Food Policy Research Institute. Washington D.C.
Wu, J. and Babcock, B. A. (1995). Optimal design of a voluntary green payment program under
asymmetric information. Journal of Agricultural and Resource Economics, 20(02).
Wu, J. and Babcock, B. A. (1996). Contract design for the purchase of environmental goods from
agriculture. American Journal of Agricultural Economics, 78(4):935–945.
28
Wunder, S. (2005). Payments for environmental services: Some nuts and bolts. CIFOR Occasional
Paper No. 42, Center for International Forestry Research, Bogor.
Zwane, A. P. (2007). Does poverty constrain deforestation? econometric evidence from peru.
Journal of Development Economics, 84(1):330–349.
29


