Embed Size (px)
Citation preview

Urban Land Markets

“This page left intentionally blank.”
Urban Land MarketsImproving Land Management for Successful Urbanization
Editors
Somik V. LallWorld Bank, Washington, DC, USA
Mila FreireWorld Bank, Washington, DC, USA
Belinda YuenNational University of Singapore, Singapore
Robin RajackWorld Bank, Washington, DC, USA
Jean-Jacques HelluinWorld Bank, Washington, DC, USA
1 C
EditorsDr. Somik V. LallWorld Bank1818 H Street NW.,Washington DC [email protected]
Dr. Mila FreireWorld Bank1818 H Street NW.,Washington DC [email protected]
Dr. Belinda YuenNational University of SingaporeSchool of Design &Environment4 Architecture DriveSingapore [email protected]
Dr. Robin RajackWorld Bank1818 H Street NW.,Washington DC [email protected]
Dr. Jean-Jacques HelluinWorld Bank1818 H Street NW.,Washington DC [email protected]
ISBN 978-1-4020-8861-2 e-ISBN 978-1-4020-8862-9 DOI 10.1007/978-1-4020-8862-9Springer Dordrecht Heidelberg London New York
Library of Congress Control Number: 2009932909
© World Bank 2009All rights reserved. This work may not be translated or copied in whole or in part without the written permission of the publisher (World Bank, 1818 H Street NW., Washington DC 20433), except for brief excerpts in connection with reviews or scholarly analysis. Use in connection with any form of informa-tion storage and retrieval, electronic adaptation, computer software, or by similar or dissimilar methodo-logy now known or hereafter developed is forbidden. The use in this publication of trade names, trademarks, service marks, and similar terms, even if they are not identified as such, is not to be taken as an expression of opinion as to whether or not they are subject to proprietary rights.While the advice and information in this book are believed to be true and accurate at the date of going to press, neither the authors nor the editors nor the publisher can accept any legal responsibility for any errors or omissions that may be made. The publisher makes no warranty, express or implied, with respect to the material contained herein.
Cover design: deblik
Cover figure: Satellite picture from the IKONOS satellite, processed at the World Bank.
Printed on acid-free paper
Springer is part of Springer Science+Business Media (www.springer.com)
v
As urbanization progresses at a remarkable pace, policy makers and analysts come to understand and agree on key features that will make this process more efficient and inclusive, leading to gains in the welfare of citizens. Drawing on insights from economic geography and two centuries of experience in developed countries, the World Bank’s World Development Report 2009: Reshaping Economic Geography emphasizes key aspects that are fundamental to ensuring an efficient rural-urban transformation. Critical among these are land, as the most important resource, and well-functioning land markets.
Regardless of the stage of urbanization, flexible and forward-looking instituti-ons that help the efficient functioning of land markets are the bedrock of success-ful urbanization strategies. In particular, institutional arrangements for allocating land rights and for managing and regulating land use have significant implicati-ons for how cities deliver agglomeration economies and improve the welfare of their residents. Property rights, well-functioning land markets, and the management and servicing of land required to accommodate urban expansion and provide trunk infrastructure are all topics that arise as regions progress from incipient urbaniza-tion to medium and high density.
At early stages of urbanization it is recommended that the focus be on ensuring that property rights are recognized and that land markets function. These are fun-damental to aiding the mobility of labor, promoting specialization, and increasing density. At intermediate levels of urbanization the focus shifts to the need to ensure serviced land to accommodate urban expansion and to secure the rights of way to provide connective infrastructure. At high levels of urbanization, land regulation and dealing with divisions associated with formal and informal parts of the city are key additional concerns for policy makers and academics.
This book examines these aspects and ongoing debates around land policies in developing countries. Fifteen papers presented at the Fourth Urban Research Sym-posium in May 2007 have been assembled to inform readers and offer alternative solutions to long-discussed problems: how to make available serviced land to sup-port urban expansion, the role of property rights in the allocation of land, the role of public sector intervention and land use regulations (often blamed for skyrocketing prices), and options for managing land markets. Supported by a robust analytical foundation, the book reviews the main arguments, examines concrete cases, and
Foreword
synthesizes the political and administrative challenges to improving the efficiency of urban land markets. The book also suggests topics for future research, notably the use of land-based revenues or land value capture for public investment.
The World Bank is committed to developing and disseminating knowledge on worldwide good practices to assist its clients as they face the challenges and oppor-tunities of steady urbanization. We need to more fully understand the constraints faced by developing countries in understanding the importance of land and the sometimes counterintuitive idea that freeing land resources would help the market allocate those resources in line with their best collective use. At a time that countries are debating how much to regulate (or not), how to use land planning to protect cities from the ravaging effects of climate change, and how to balance efficiency with equity, this book may be particularly relevant for those looking for new ideas to promote prosperity and well-being in a world in rapid change. The challenge for our clients and partners is to share ideas and engage in productive debates. We welcome the prospect of contributing to this endeavor.
Vice President, Sustainable Development Katherine SierraThe World Bank
vi Foreword
vii
Today, for the first time in history, more than half of humanity lives in urban areas. During the present century, as more and more of the global population comes to live in cities, urban growth and development will remain a key challenge. The World Bank Urban Research Symposium provides a unique global forum for exploring current policy issues in this area, bringing together some of the world’s leading researchers as well as international and nongovernmental organizations to present their work, share knowledge, and conduct lively debates from both a research and a policy perspective. Prompted by clear evidence that poor people will make up a large part of future urban growth, an important aim is to broaden the scope of inter-national research on urban poverty in developed and developing countries alike.
Sponsored by the World Bank and partners and first convened in 2002, the sym-posium draws a wide range of participants—researchers, practitioners, academics, and policy makers from around the world as well as donor organizations. The Fourth Urban Research Symposium, held in Washington, D.C., in May 2007, focused on the theme of urban land use and land markets, including implications for city spatial growth, efficiency, and equity.
This book brings together a collection of 15 papers presented at the symposium, including commissioned research papers by preeminent researchers. The papers provide state-of-the-art knowledge, theoretical underpinnings, and in-depth analy-sis of issues facing cities. The authors set out to meet specific objectives:
• Clarify ongoing debates on the links between different aspects of urban land management and welfare by providing a robust analytical foundation for existing findings or supporting or questioning existing analytical work through empirical applications or case studies
• Examine the implications of commonly used urban land and related policies when a common methodological framework is used to scrutinize conventional wisdom
• Highlight priority questions for policy and program design or implementation that cannot be answered because of limited research and data, and propose a research agenda that sets out to address these questions
The 15 papers selected for publication in this book reflect those objectives, making the book a must-read for all those concerned with the future of cities and with urban
Preface
land use and land markets—an issue that is critical for urban poverty reduction and will become even more urgent as the world’s urban population grows.
The editors would like to thank Abha Joshi-Ghani, urban sector manager at the World Bank, and the Urban Sector Board members for their invaluable support to the Urban Research Symposium—contributing comments, chairing sessions, and encouraging the participation of World Bank staff. The Swedish International Development Cooperation Authority (Sida) and the Lincoln Institute of Land Policy provided both funding and other important contributions. Thomas Melin (Sida) as well as Gregory Ingram and Martim Smolka (both of the Lincoln Institute of Land Policy) contributed excellent comments and sustained support as the content of the symposium took shape. They ensured that the main papers reflected important policy issues and that the analytical framework was in line with the most recent developments in the literature. Additional funding was provided by the Cities Alli-ance, the German Agency for Technical Cooperation (GTZ), and the World Bank.
Special thanks are due to Laura de Brular, Maria Eugenia Quintero, Adelaide Barra, and Mercedes Aleman for their help in organizing the event, collecting the contributions, and coordinating with the authors.
The book was superbly copyedited by Alison Strong, who managed to bridge the different languages of coeditors and authors and impose a uniform style.
Washington DC Somik V. Lall, Mila FreireSingapore Belinda YuenWashington DC Robin Rajack, Jean-Jacques Helluin
viii Preface
ix
List of Editors and Contributors . . . . . . . . . . . . . . . . . . . . . . . . . . . . . . . . . . . xi
Acronyms and Abbreviations . . . . . . . . . . . . . . . . . . . . . . . . . . . . . . . . . . . . . .xvii
Introduction: What Do We Know About Urban Land Markets? . . . . . . . . xixRobin Rajack and Somik V. Lall
Part I Land Markets, Regulation, and Welfare 1 Government Land Use Interventions: An Economic Analysis . . . . . . . 3
Jan K. Brueckner 2 The Effect of Residential Land Market Regulations
on Urban Welfare . . . . . . . . . . . . . . . . . . . . . . . . . . . . . . . . . . . . . . . . . . . . 25J. Vernon Henderson
3 Land Use Regulation: Transferring Lessons from Developed Economies . . . . . . . . . . . . . . . . . . . . . . . . . . . . . . . . . . . . 51Christine Whitehead, Rebecca L. H. Chiu, Sasha Tsenkova and Bengt Turner
4 Making Urban Land Markets Work Better in South African Cities and Towns: Arguing the Basis for Access by the Poor . . . . . . . . . . . . . . 71Mark Napier
Part II Land Market Policies and the Urban Poor 5 The Formalization of Urban Land Tenure in Developing
Countries. . . . . . . . . . . . . . . . . . . . . . . . . . . . . . . . . . . . . . . . . . . . . . . . . . . 101Alain Durand-Lasserve and Harris Selod
6 Social and Economic Impacts of Land Titling Programs in Urban and Periurban Areas: A Short Review of the Literature . . . . . . . . . . . . 133Geoffrey Payne, Alain Durand-Lasserve and Carole Rakodi
7 Informal Neighborhoods in the Buenos Aires Metropolitan Region: Understanding the Effects of Land Regulation on the Welfare of the Poor . . . . . . . . . . . . . . . . . . . . . . . . . . . . . . . . . . . . . . . . . . . . . . . . . 163Cynthia Goytia and Gabriel Lanfranchi
Contents
8 Informal Rental Markets: The Low-Quality, High-Price Puzzle in Nairobi’s Slums . . . . . . . . . . . . . . . . . . . . . . . . . . . . . . . . . . . . . 191Sumila Gulyani and Debabrata Talukdar
9 Assessing Benefits of Slum Upgrading Programs in Second-Best Settings . . . . . . . . . . . . . . . . . . . . . . . . . . . . . . . . . . . . . . . 225Basab Dasgupta and Somik V. Lall
10 Housing Demand, Tenure Choice, and Housing Policy in Brazil . . . . . 253Maria da Piedade Morais and Bruno de Oliveira Cruz
11 Housing Conditions and Income Distribution: Evidence from São Paulo . . . . . . . . . . . . . . . . . . . . . . . . . . . . . . . . . . . . . . . . . . . . . . 283Emilio Haddad and João Fernando Pires Meyer
Part III Public Land Management12 Does Public Ownership and Management of Land Matter
for Land Market Outcomes? . . . . . . . . . . . . . . . . . . . . . . . . . . . . . . . . . . 305Robin Rajack
13 Taking Land Around the World: International Trends in Expropriation for Urban and Infrastructure Projects . . . . . . . . . . . 337Antonio Azuela and Carlos Herrera-Martín
14 Guiding Spatial Changes: Singapore Urban Planning. . . . . . . . . . . . . . 363Belinda Yuen
15 Aid, Density, and Urban Form: Anticipating Dakar . . . . . . . . . . . . . . . 385Michael Cohen
Index . . . . . . . . . . . . . . . . . . . . . . . . . . . . . . . . . . . . . . . . . . . . . . . . . . . . . . . . . . 399
x Contents
xi
Editors
Mila Freire is former senior adviser to the World Bank’s Sustainable Develop-ment Network, sector manager, and task team leader of several urban and housing development operations. She is a member of the core team for World Develop-ment Report 2009: Reshaping Economic Geography and has been editor of several publications on urban development, subnational finance, and decentralization. She currently teaches at Johns Hopkins University. e-mail: [email protected]
Jean-Jacques Helluin is a certified urban policy expert at the French Ministry of Sustainable Development and Spatial Planning. He is currently on secondment at the World Bank, Urban Anchor, where he is coordinating the organization of the Urban Research Symposia. He has previously led studies on the new strategic urban planning in France, at both the local and the national level, and was a lecturer at the French Institute of Urban Planning in Paris. e-mail: [email protected]
Somik V. Lall is a senior economist with the Spatial and Local Development Team of the World Bank’s Sustainable Development Network and a member of the core team for World Development Report 2009: Reshaping Economic Geography. Pre-viously he worked for the World Bank’s research department, where his research focused on empirical analysis of the effects of agglomeration economies and trans-port infrastructure on location decisions and productivity of businesses and identify-ing mechanisms for providing and financing local public goods in fiscally stressed urban areas. e-mail: [email protected]
Robin Rajack is a senior urban development specialist at the World Bank, where he engages in urban land operational, technical advisory, and research functions in most regions of the Bank’s work and cochairs the Housing and Land Thematic Group. Before joining the Bank, he served as a founding director and manager of the Land Settlement Agency in Trinidad and Tobago, where he was instrumental in the design and implementation of innovative national informal settlement regulari-zation and greenfield development programs. e-mail: [email protected]
List of Editors and Contributors
Belinda Yuen is a chartered town planner, an associate professor at the National University of Singapore, and past president (2005–2008) of the Singapore Institute of Planners. She has published widely in urban planning, most recently on planning vertical living, and has been editor or coauthor of several books that explicate Sin-gapore’s urban planning. e-mail: [email protected]
Contributors
Antonio Azuela is a professor at the Social Research Institute of the National Auto-nomous University of Mexico. A lawyer and sociologist, he conducts research on urban and environmental issues from a sociolegal perspective. He coordinates the International Research Group on Law and Urban Space (IRGLUS) of the Interna-tional Sociological Association. e-mail: [email protected]
Jan K. Brueckner is a professor of economics at the University of California at Irvine. He has published extensively in urban economics, public economics, hou-sing finance, and the economics of the airline industry. He served as editor of the Journal of Urban Economics from 1991 to 2007 and is an editorial board member for six other journals. e-mail: [email protected]
Rebecca L. H. Chiu is an associate professor in the Department of Urban Plan-ning and Design, Faculty of Architecture, the University of Hong Kong. She is also the founder chairman of the Asia Pacific Network for Housing Research. She has published extensively on housing policy issues in Asia, notably China, Hong Kong (China), and other Asian tiger economies. Her current research interests are sustai-nable housing development and the sustainability of China’s primate cities. e-mail: [email protected]
Michael Cohen is a professor of international affairs and director of the Graduate Program in International Affairs at the New School in New York. While working at the World Bank from 1972 to 1999, he was responsible for much of the Bank’s urban policy development. He has published widely, including several books on urban development. e-mail: [email protected]
Bruno de Oliveira Cruz is deputy director of regional and urban studies and a researcher at the Institute of Applied Economic Research (IPEA) in Brasília. He has worked on issues of growth, investment, and adoption of technologies in addition to urban and regional studies. e-mail: [email protected]
Basab Dasgupta works in the World Bank’s Poverty Reduction and Economic Management unit. His research interests include land and housing policies, cre-dit market imperfections, and governance issues in service provision in poor and middle-income countries. e-mail: [email protected]
xii List of Editors and Contributors
Alain Durand-Lasserve is a senior research fellow at the National Center for Scien-tific Research (CNRS) and attached to the SEDET Research Center at Université Denis Diderot in Paris. His research interests include land and housing policies for low-income groups in urban and periurban areas and customary land management. He gives particular attention to international comparisons and trends relating to tenure formalization and security of tenure. e-mail: [email protected]
Cynthia Goytia is a professor and researcher at Universidad Torcuato Di Tella in Buenos Aires, where she conducts, as associate director, the Graduate School of Urban Economics. Her research reflects a strong interest in policy analysis focused on urban land and housing markets, both formal and informal, as well as the effects of land use regulation and the welfare impacts of infrastructure and local develop-ment programs. e-mail: [email protected]
Sumila Gulyani is sector leader, sustainable development, in the Africa Region of the World Bank. She has served as director of the Infrastructure and Poverty Action Lab and as assistant professor of urban planning at Columbia University. She is the author of the book Innovating with Infrastructure and numerous journal articles on water, transport, electricity, and slums. Her current research projects include one focusing on analytical frameworks for understanding poverty and living conditions in slums, and another on inequality in access to infrastructure in four capital cities in Africa. e-mail: [email protected]
Emilio Haddad is a professor in the School of Architecture and Planning at the University of São Paulo as well as coordinator of the MBA in Real Estate Develop-ment Program at the Foundation for Environmental Research (FUPAM) in São Paulo. He is a past president of the Latin American Real Estate Society. His areas of interest include urban planning, real estate markets, and property and environmental valuation. e-mail: [email protected]
J. Vernon Henderson is Eastman Professor of Political Economy and a professor of economics and urban studies at Brown University and a research associate of the National Bureau of Econonomic Research. His present research activities include urban growth, urbanization in Asia, and sources of urban productivity, as well as post-tsunami recovery in Aceh, Indonesia. He has research projects under way in Brazil, China, and Indonesia. e-mail: [email protected]
Carlos Herrera-Martín has been a professor of urban law at the Autonomous Technological Institute of Mexico (ITAM). He has worked on consultancy projects on the relationship between land law and development and the land regularization process in Mexico and conducted extensive research on the legal and judicial fra-mework of eminent domain in that country. He is currently pursuing a PhD at Uni-versity College London. e-mail: [email protected]
Gabriel Lanfranchi is planning manager at Fundación Pro Vivienda Social and a professor in the Graduate School of Urban Economics at Universidad Torcuato Di
List of Editors and Contributors xiii
Tella in Buenos Aires. He previously worked as director of the Metropolitan Office at the Urban Planning and Housing Administration for the Province of Buenos Aires and is a cofounder of the Observatory of the Informal Urban Economy in Buenos Aires. His present research interests include infrastructure expansion in poor areas, microfinance, local development, and inclusive business. e-mail: [email protected]
João Fernando Pires Meyer is president of the Latin American Real Estate Society. He is also a professor of urban planning and regional planning in the School of Architecture and Urbanism at the Catholic University of Santos as well as at the University Fine Arts Center (FEBASP), and a professor of real estate market analy-sis at the Foundation for Environmental Research (FUPAM)—all in São Paulo. An architect, he conducts research on housing, urban planning, and real estate market analysis. e-mail: [email protected]
Maria da Piedade Morais is coordinator of urban sector studies and a researcher at the Institute of Applied Economic Research (IPEA) in Brasília. Her main areas of interest include urban economics, housing policy, housing rights, urban indicators, informal settlements, urban poverty, spatial segregation, and Millennium Develop-ment Goal reporting. e-mail: [email protected]
Mark Napier is program director at the Urban Land Markets Programme (Urban LandMark), a U.K. government–funded program in South Africa that focuses on making urban land markets work better for the poor. An architect by profession, he has conducted research and published in the areas of housing extensions, home-based enterprises, environmental aspects of informal settlements, and land and hou-sing markets. e-mail: [email protected]
Geoffrey Payne is a housing and urban development consultant and principal of Geoffrey Payne and Associates in London. He has taken on consultancy, research, and training assignments in most parts of the world and has been working on land tenure issues since 1989, when he was commissioned to undertake a review for the World Bank. He has taught at several universities, organized or participated in many international conferences and workshops, and written, edited, or contributed to many publications. e-mail: [email protected]
Carole Rakodi is a professor of international urban development in the Internatio-nal Development Department, School of Government and Society, University of Birmingham, England. She is a social scientist and town planner who has worked for many years as a professional and researcher on urban land, housing, and liveli-hoods, especially in Africa, and has published widely. Most recently she coordina-ted comparative research on informal channels for land delivery to the poor in five anglophone African cities. e-mail: [email protected]
Harris Selod is a senior economist in the Agriculture and Rural Development Department of the World Bank. He has been a researcher at the Institut National
xiv List of Editors and Contributors
de la Recherche Agronomique as well as an associate professor of economics at the Paris School of Economics and Ecole Polytechnique, France. His publications include many works in urban, public, and labor economics, with a particular focus on the spatial dimensions of poverty and inequality. His present research agenda focuses on land tenure and informal land markets. e-mail: [email protected]
Debabrata Talukdar is an associate professor in the School of Management at the State University of New York at Buffalo. His research interests lie in quantitative modeling and empirical analysis of issues related to market dynamics of both pri-vate and public goods. He has published widely in the leading journals in develop-ment economics and business management. e-mail: [email protected]
Sasha Tsenkova is a professor of international development at the University of Calgary, Canada. Her research has focused on housing market processes and urban planning in Europe and North America. She has published widely in international journals on these issues and is the author of several books on housing and urban development in Eastern Europe. e-mail: [email protected]
Bengt Turner was director of the Institute of Housing and Building Research at the University of Uppsala from its inception in 1994 until his early death in the spring of 2007. He was known across the world as chairman and cofounder of the European Network of Housing Research, where he did more to develop the housing research community in Europe and later in Asia and South America than any other person. In recent years his interests lay particularly in understanding housing mar-kets and policy in the transition economies.
Christine Whitehead is a professor of housing in the Department of Economics at the London School of Economics and director of the Cambridge Centre for Housing and Planning Research, University of Cambridge. She has worked in the fields of urban and housing economics, finance, and planning for many years. Her research concentrates particularly on the interface between theory and policy. She first wor-ked with the World Bank in the 1970s coediting the book Urban Land Markets: Issues and Opportunities. e-mail: [email protected]
List of Editors and Contributors xv

“This page left intentionally blank.”
xvii
AFH Agence Foncière d’Habitation (Tunisia)Arg$ Argentine PesoBDA Bangalore Development AuthorityBNH National Housing Bank (Brazil)BPN National Land Agency (Indonesia)CFAF CFA FrancCOFOPRI Commission for the Formalization of Informal Property (Peru)COHABs State Housing Companies (Brazil)EA Enumeration AreaEDA Electronic Development Application (system)EMBRAESP Empresa Brasileira de Estudos do PatrimônioFAR Floor Area RatioFGTS Fundo de Garantia por Tempo de Serviço (Employees Guarantee
Fund, of Brazil)GDP Gross Domestic ProductIAPs Institutes of Pension and Retirement Funds (Brazil)IBGE Brazilian Institute of Geography and StatisticsIIA Independence of Irrelevant AlternativesIIED International Institute for Environment and DevelopmentIMF International Monetary FundINDEC Argentine National Institute of Statistics and CensusesIPCA Extended National Consumer Price Index (Brazil)KLDC Korea Land Development CorporationK Sh Kenya ShillingNGO Nongovernmental OrganizationOECD Organisation for Economic Co-operation and DevelopmentOHLM Office des Habitations à Loyer Modéré (Senegal)OLS Ordinary Least SquaresPNAD IBGE’s National Household Sample SurveyPOF IBGE’s National Household Budget SurveyPPP Purchasing Power ParityR South African RandR$ Brazilian Real
Acronyms and Abbreviations

RDP Reconstruction and Development Programme (South Africa)S$ Singapore DollarSAC Section d’Assistance aux Communautés (of Senegal’s OHLM)SBPE Brazilian Savings and Loan SystemSEADE São Paulo State Statistical OfficeSFH Housing Finance System (Brazil) UGB Urban Growth BoundaryUN United NationsUN-Habitat United Nations Human Settlements ProgrammeURA Urban Redevelopment Authority (Singapore)USAID US Agency for International Development
xviii Acronyms and Abbreviations
xix
A metropolitan economy, if it is working well, is constantly transforming many poor people into middle-class people…. Cities don’t lure the middle class, they create it.
Jane Jacobs1
How can public policies help in facilitating an efficient and complete rural-urban transformation and, in the process, accelerate the churn through which the lives of local residents are improved? The World Bank’s World Development Report 2009: Reshaping Economic Geography, (2008) emphasizes that the policy problem of achieving greater economic density remains fundamental for areas at all stages of urbanization. And it identifies the main market failures relevant for urbanization policies as being those associated with land markets. The report uses the spatial dimensions of density, distance, and division to characterize the scope of the policy challenge in areas at different stages of urbanization:
• In an area with incipient urbanization the problem is mainly one of facilitating an increase in economic density, and policy makers should pay attention to insti-tutions to improve the functioning of (rural and urban) land markets and the provision of (rural and urban) social services.
• In areas of a country that are undergoing rapid urbanization, the policy problems are to facilitate the increase in density but also to alleviate the problem of dis-tance due to growing congestion. The response includes improvements in insti-tutions to facilitate rising density and investments in infrastructure to address the growing problem of economic distance in and around the rapidly growing cities.
• In highly urbanized areas of a country the problems of density and distance are compounded by divisions within urban areas, most noticeably between formally settled parts of a metropolis and slums, where land markets use informal con-ventions. An effective policy response includes institutions, infrastructure, and incentives that help in social integration.
1 As cited by Siegel (2000, p. 61).
Introduction: What Do We Know About Urban Land Markets?Robin Rajack and Somik V. Lall
Regardless of the stage of urbanization, flexible, and forward-looking institutions that help the efficient functioning of land markets are the bedrock of successful urba-nization strategies. In particular, institutional arrangements for allocating land rights and for managing and regulating land use have significant implications for how cities deliver agglomeration economies and improve the welfare of their residents.
This book provides fresh insights into these issues, compiling selected pieces of analytical and empirical research presented at the Fourth Urban Research Sympo-sium. Five chapters (1, 2, 5, 12, and 13) showcase research specially commissioned for the symposium. The commissioned papers helped develop a robust analytical foundation to clarify ongoing debates on urban land management and welfare and synthesized the political and administrative challenges in improving the efficiency of urban land markets.
This overview organizes the main insights from these research papers, deve-loping links with the key principles of World Development Report 2009. The first section discusses the allocation and economic implications of property rights. The second examines urban land regulations, and the third discusses the ownership and management of urban land. The final section identifies future research priorities. Among these is the topic of land-based revenues and the valuation and taxation of land. This topic, though not directly covered by the symposium, has important implications for how cities manage their form and how they finance infrastructure.
Allocation of Land Rights
The social and legal institutions that support enforcement of contracts and economic transactions are at the core of well-functioning market economies. As emphasized by North, winner of the 1993 Nobel Prize in Economics, “the inability of societies to develop effective, low-cost enforcement of contracts is the most important source of both historical stagnation and contemporary underdevelopment in the Third World” (1996, p. 54). Cross-country empirical research shows that where the rule of law is weak, economic activity will be plagued by inefficiency and low productivity.2 Where the social and legal institutions that support land and real estate transactions are weak, as in Africa, Latin America, and South Asia, the most urgent urban land policy issue may be to establish institutions (rule of law) that facilitate economic transactions and lower transaction costs.
In this context, lack of secure rights to land and property has been highlighted as a key factor in explaining the limited success of capital accumulation in many developing countries (Doebele, 1983; Jimenez, 1984; Friedman, Jimenez, & Mayo, 1988; de Soto, 1989, 2000). Yet there are growing concerns among researchers and practitioners that land titling tends to be complex, expensive, and slow to implement
2 See Kaufmann, Kraay, and Zoido-Lobatón (2002), who measure rule of law as a composite of the enforceability of contracts, the effectiveness and predictability of the judiciary, and the incidence of crime.
xx R. Rajack and S. V. Lall
and that it lacks unequivocal links with private investment and access to finance.3 Still, given the limited reach of formal land markets, formalization of property rights has often been a central tenet of government interventions to expand access to urban land markets. The potential impacts of formalization include appreciation in property values, greater frequency of land transactions, higher municipal revenues, and greater use of real property as collateral.
Economic Implications of Land and Property Rights
The chapters by Durand-Lasserve and Selod and by Payne, Durand-Lasserve, and Rakodi examine the economic impacts of strengthening private property rights. Both chapters find little evidence to support the claim that newly titled households are able to use their property as collateral for loans. Indeed, Durand-Lasserve and Selod note an aversion to jeopardizing one’s home by using it as collateral among newly formalized households in Mexico (Varley, 2002) and among households in planned settlements in Dar es Salaam (Byabato, 2005).
Payne et al. cite a survey of African countries showing little interest among poor people in using land titles as collateral (IIED, 2006). Similar evidence is found in Brazil and even in Peru, where a minority of newly titled households did get financing but almost entirely from state sources rather than private banks. Mitchell (2006) notes that four separate assessments of the largest titling program in Peru, managed by the Institute for Liberty and Democracy, found no discernible effect on the supply of business credit.
Informal Tenure and Insecure Tenure: Not the Same Thing
Part of the explanation for this mixed evidence lies in an inadequate understanding of the nature and context of informal tenure. Durand-Lasserve and Selod emphasize an important distinction between informal tenure and insecure tenure, noting that they are not always synonymous.4 An important consequence of this distinction is that behavioral changes that are theoretically linked to increased tenure security may not manifest from de jure tenure formalization if the preexisting tenure condi-tion, though informal, was relatively secure.
Equally significant, however, is the risk that uniformly administered initiatives of de jure tenure formalization can sometimes upset a relatively delicate balance of preexisting tenure security, associated, for example, with the social safety net function that customary tenure systems sometimes provide. In doing so, they may actually exacerbate insecurity for some households. In addition, Durand-Lasserve and Selod argue that titling “tends to consider all urban actors as having compatible
3 See, for example, Varley (1987); Atwood (1990); Carter and Wiebe (1990); Razzaz (1991, 1993); Gavian and Fafchamps (1996); Carter and Olinto (1996); Woodruff (2001).4 See Rajack (1997) for a detailed exposition of this distinction.
Introduction: What Do We Know About Urban Land Markets? xxi
interests, treating them as an undifferentiated group of urban stakeholders.” Howe-ver, as Morais and Cruz point out in their chapter, tenure status, particularly across the owner-renter divide, is correlated with a variety of demographic and socioeco-nomic characteristics, including stage in the life cycle, marital status, wealth, and education. Goytia and Lanfranchi, in their chapter on Buenos Aires, note a positive correlation between lack of land tenure and deficiencies in both housing conditions and surrounding infrastructure such as water supply.
The implications are several. They include a real risk that single-pronged inter-ventions can be either mistargeted, because of the varied demographic and socioe-conomic characteristics of subgroups in the settlement, or ineffective, because of the many constraints. A tangible example of constraints would be the inability, after property rights are strengthened, to install a flush toilet if the underlying infras-tructure deficiency is not also addressed. This caution is in line with Gulyani and Talukdar’s chapter, on Nairobi, where the authors call for careful consideration of the choice of interventions based on the socioeconomic and political economy cha-racteristics of slums.
Impact of Preexisting Distortions in Land and Credit Markets
Even if the heterogeneity of tenure, demographic, and socioeconomic characteristics of informal settlements is taken into account in the design of development interven-tions, the expectation of impacts poses a potential problem, as Dasgupta and Lall highlight in their chapter. Indeed, preexisting conditions such as distortions in land and credit markets reduce the benefits of interventions such as slum upgrading.
Dasgupta and Lall use a general equilibrium model to analyze the welfare impacts of three interventions—improvements in land, in infrastructure, and in building quality—in Brazilian cities. They conclude that the welfare impacts depend on the severity of land and credit constraints (such as land supply constraints, infrastructure bottlenecks, and credit rationing) and the extent to which these constraints are being addressed by complementary policy initiatives. Cohen illustrates this argument in his chapter, on a large World Bank–supported sites and services project in Dakar. He notes that until construction loans were added to the project, poor households were often unable to start (much less sustain) home improvements.
Importantly, Dasgupta and Lall also conclude that the rank ordering of preferred interventions in a given city changes depending on the severity of the market cons-traints. Given the prevalence and variety of land and credit market distortions in cities of the developing world, this is a significant finding.
Higher Property Values and More Transactions
The relationship between stronger property rights and higher property values is less than linear. Goytia and Lanfranchi note that the price appreciation of titled proper-
xxii R. Rajack and S. V. Lall
ties in Buenos Aires is offset by negative neighborhood externalities, most notably a lack of basic infrastructure in previously informal settlements. Gulyani and Taluk-dar similarly note the limiting impact on rent levels (and, by implication, property values) of infrastructure deficiencies in Nairobi slums, most notably lack of water and electricity connections but also lack of a public school facility. And Cohen claims that the sites and services project in Dakar, which included secure tenure, led to the investment of more than US $8 of private funds in housing in the project neighborhood for every US $1 of public funds.
Payne et al. find considerable support in the literature for the claim that titling significantly increases property values, citing examples from Brazil, Cambodia, Indonesia, Peru, and the Philippines. However, they question what such gains would mean for access to higher-value homeownership for future generations, suggesting that rising asset values could amount to a transfer of resources from future genera-tions to present ones.
Another trend, which Payne et al. note in Latin America, suggests that this fear may be unwarranted: newly titled households in such places as Colombia, Ecuador, and Mexico do not routinely sell their properties but instead continue to regard them primarily as homes to be bequeathed to their children. Even so, Durand-Las-serve and Selod note that titling in Phnom Penh was followed by an increase in the volume of land sales, possibly associated with speculation (Deutschk, 2006).
The research presented at the symposium suggests that while property values rise with the strengthening of private property rights, routine land market transactions do not always increase. And even when they do, the driving forces are not always the straightforward pathways of social mobility that are often predicted in the lite-rature. Instead, such sales may be more reflective of the lingering vulnerabilities of the urban poor even when they narrowly cross over into the formal sector—and of the delicate balancing act that it takes to remain there.
Regulation of Urban Land
Land markets are regulated in even the most market-driven economies. This regu-lation serves two purposes. It ensures that different types of land uses are separa-ted, so that “obnoxious” users (such as industrial, polluting users) are not in close proximity to others (such as residential users). And it integrates private land uses with public ones, such as for transport infrastructure, so that industry is served by highways and other transport nodes and so that residential users are near rail and bus facilities for commuting and shopping. In many instances, however, land regu-lations have negative side effects, leading to shortages in land supply and increases in prices.
The net impact of these interventions often is that the formal market provides solutions for only a small fraction of the urban population. Haddad and Meyer, in their chapter, use a rare data set reporting on new housing starts in a developing country city, São Paulo. They note that not only does the formal market fail to pro-duce solutions for low-income households (those with monthly earnings of 5 mini-
Introduction: What Do We Know About Urban Land Markets? xxiii
mum wages or less, which make up almost half the population); less than 20% of the formal housing supply is accessible to lower-middle-income households (those earning between 5 and 10 minimum wages).
The implications are at least twofold. First, the challenge of formalizing urban land markets is of a much larger scale than often anticipated. And second, even when subsidized interventions are targeted to the poorest sectors of the urban popu-lation, these groups are likely to face competition (or “downward raiding” pres-sures) from those who have more income yet still cannot afford the formal sector solutions.
How Regulations are Reflected in Land Values
The research in this book focuses on three avenues through which regulations are capitalized into the value of urban land: restricting land use, artificially limiting urban development, and raising standards.
Restricting Land Use
The basic constraint on urban land markets is that land use is so highly regulated that it becomes difficult for families and businesses to meet their needs for land. Among the most pernicious and frequently used land use regulations are restrictions on building heights, which result in highly restrictive markets that lead to inefficient use of land as well as adverse equity consequences. These restrictions increase the geographic size of a city; raise the cost of housing in the city, particularly for the poor; and create a demand for additional infrastructure investments required by a larger city size.
Consider Mumbai, whose restrictive land regulations have led to low per capita space consumption, high land prices, and poor competitiveness of the city. Building height restrictions in Mumbai are a fifth to a tenth of the level in other large cities. As a result, space consumption averages 4 m2 per capita, a third of the level in Shanghai and less than a fifth of that in Moscow. Housing prices have skyrocketed, forcing poor people to live in the city’s pervasive slums. In addition, limited land titling (only 10% of the housing stock has title) constrains housing redevelopment; and rent control has frozen 30% of the city’s housing stock, leading to extremely dilapidated buildings (Bertaud, Buckley, & Phatak, 2005). Significant blocks of strategically located port and mill lands also are often held off the market, artifici-ally limiting the supply of urbanized land.
The artificial shortage of office space has adversely affected the business poten-tial of Mumbai, which has fallen from 25th to 40th in the rankings of the best cities for business. By comparison, Shanghai has risen in the rankings from 24th to 9th (Buckley, Bertaud, & Phatak, 2006).
xxiv R. Rajack and S. V. Lall
Artificially Limiting Urban Development
Regulations that artificially limit the boundaries of urban development, or that prescribe generous open space requirements in urban areas, constrain the overall supply of developed land and built space, thereby inflating the price. Brueckner emphatically makes this point in his chapter in analyzing the merits of urban growth boundaries, which draw a ring around a city and outlaw urban development outside this ring. Urban growth boundaries prevent conversion of rural land and restrict supply of land for further development. Cities in the Republic of Korea, the United Kingdom, and the United States (Portland, Oregon) make extensive use of urban growth boundaries. The impact on land and housing prices has been particularly visible in Korea, where real housing prices increased by 10 times between 1974 and 1985.
Such regulations have general equilibrium effects on land markets. Henderson, in his chapter, cites Pollakowski and Wachter’s (1990) findings about the spillover effects of regulation, in which an increase in restrictiveness in one community leads to price spillovers in neighboring communities.
These regulations also can adversely affect the contiguity of built development. They sometimes do so through economically irrational zoning or through land con-version quotas as routinely applied in China, leading to leapfrogging in the footprint of the built environment. Other times they do so by overly limiting density in the city center, thereby displacing it to the periphery and creating a negative density gradient. Either way, households and sometimes firms are pushed farther away from the city center, thereby increasing welfare costs—through direct transportation costs but also through productivity costs associated with longer commutes. There are also broader efficiency costs to the city.
Brueckner points out that the few analyses of this type of regulatory impact have mostly been based on numerical simulations, although in Bertaud and Brueckner (2004) actual welfare losses were estimated for Bangalore. In that case, density-limiting regulations alone were estimated to be generating an annual welfare loss per household of between 1.5 and 4.5% of income—a very significant impact com-pared with those of other forms of intervention.
Increasing Minimum Development Standards
Regulations that raise the standards that land and shelter products must satisfy, or that increase the time required to gain regulatory approvals, increase the costs of serviced land and built development. These cost increases are passed on by deve-lopers to consumers through higher prices. Cost-increasing regulations and bure-aucratic impediments include requirements relating to width of streets, community buildings, and building and construction permits. Regulations are quite severe in such cases as Brazil and Malaysia. Housing construction costs in Brazil could be cut in half with less restrictive regulation.
Introduction: What Do We Know About Urban Land Markets? xxv
Henderson discusses the cost effects of such regulations in some depth in his chapter. Goytia and Lanfranchi also illustrate the effects, observing that low-income households were entirely driven out of the formal land market in Buenos Aires as a result of a new urban land use regulation promulgated in 1977. This regulation imposed subdivision standards far above the level of affordability for most house-holds and cut a lifeline of developer-supplied credit to low income earners.
Measurement Challenges and Policy Priorities
Measurement challenges have made identifying priorities for policy difficult. While the past two decades have seen growth in empirical evaluations of the impacts of land regulations, the metrics of these evaluations have seldom lent themselves to clear-cut, actionable policy advice. Henderson identifies several key limitations in his chapter. First, even when studies have focused exclusively on quantifying the costs of regulation, they have usually lumped together several regulations, often with equal weighting, into a single index. This common use of regulation indexes obscures the impact of specific regulations, making it difficult to generate actiona-ble recommendations for policy reform. Second, most studies have treated regu-lation as exogenous rather than as an endogenous policy decision, which leads to an overestimation of the impacts of regulation on prices. Finally, almost all studies fail to consider that regulations will have differential effects, depending on family incomes, education, or other household characteristics.
Metrics aside, Henderson reports that data limitations have restricted empirical work to North American markets, which are almost entirely formal. This limits the understanding of how regulations play out where there is a strong duality of for-mal and informal markets, often with several shades in between. The analysis of exclusionary restrictions in relation to the informal sector in Brazil that Henderson develops in the second half of his chapter is therefore a welcome addition.
Despite the difficulties in accurately estimating regulatory impacts, most resear-chers and commentators tend to agree that urban land markets in developing countries appear to be overregulated. On balance, they see regulatory frameworks as severely constraining access to formal land markets for large parts of the urban population. Growing slums and informal land markets testify to this limited access.
The policy agenda emerging from this research is a combination of outright deregulation in some cases and regulatory reform in others, with the emphasis on creating a less constraining, more agile regulatory environment. Brueckner sums up this policy view by asserting that “generally, government land use interventions that are designed to guide development rather than fundamentally diverting it from a free market path are likely to be socially beneficial.” Chiu, Tsenkova, Turner, and Whitehead reach a similar conclusion in their chapter, stating that “poorly specified regulation that is not based on the social costs and benefits of development often cannot adjust to changing circumstances and technologies and cannot enable appro-priate development to take place.”
xxvi R. Rajack and S. V. Lall
The Politics of Deregulating Land Markets
However strong the emerging consensus among researchers, actual regulatory reform is far from straightforward. Over time some urban actors—thanks to their wealth, political influence, or privileged access to information—learn to play the constrained system to their benefit. Any disruption in the status quo that seeks to level the playing field, thereby increasing access and competition, is seen, at least in the short run, to be to their disadvantage. They usually oppose such reforms, often with subtle but determined strategies. Such opposition is sometimes masked behind environmental, social, or public health facades.
Then there are bureaucrats, legislators, and intermediaries who either corpora-tely or individually benefit from the rents and revenues directly attributable to the administration of the current regulatory framework. Some of those revenues are a legitimate part of the system, derived from application charges, processing costs, impact fees, and the like. Where municipal revenues are scarce and undiversified, there is an understandable resistance to forgoing existing sources, especially when measures to replace those sources would have more indirect or longer-term revenue effects. Such revenue effects may occur through the freer operation of a land market accessible to many more players and households.
Other revenues are illegitimate, taking the form of illicit rents to individuals who exploit their office or asymmetric access to information for private gain or political campaign finance. These individuals too resist deregulation, but more out of self-interest or political party interest. In recent years, however, there has been growth in demand-side governance initiatives such as citizen scorecards, e-governance, and participatory budgeting, often with the active support of civil society groups or independent watchdog organizations. These initiatives have provided some insights into paths for mobilizing the social and political capital necessary for regulatory reforms.
Up to this point the observed negative effects of regulation have been characte-rized here as unintended side effects of a course of treatment generally intended for the public good. Brueckner and Henderson go to some lengths to argue that this is not always the case. In the context of urban growth boundaries, Brueckner consi-ders a model in which existing households and landowners in the city have a vested interest in preserving a regulatory framework that constrains the land made availa-ble for development, thereby increasing the value of their property. Henderson uses both modeling and data from Brazil to argue that “forcing lower-income migrants into the informal sector is in part a strategic device used by existing residents to limit population growth, to fiscally exploit migrants … and to avoid the fiscal exter-nalities imposed by migrants.” In these scenarios one can expect the interest groups that represent existing landowners to strongly oppose regulatory reforms.
Still others resist more liberal regulation on technical grounds. Brueckner explo-res a common argument that urban bureaucrats in India often use in defense of their opposition to higher floor area ratios (FARs): the inadequacy of existing infras-tructure to service higher density in the core areas of the city and the costliness of bolstering that capacity. Some have critiqued this position by arguing that concrete
Introduction: What Do We Know About Urban Land Markets? xxvii
and pipes will always be cheaper than underutilization of strategically located urban land. Brueckner goes further by looking at the overall impacts of FARs on urban equilibrium and the infrastructure costs implied by those impacts. In particular, he notes that a low FAR contributes to a spatially larger city with higher densities farther out, where the FAR restriction is not binding. This in turn creates additional infrastructure requirements away from the city center, thereby diminishing if not offsetting the savings on overall city infrastructure investment that occur as a result of the low FAR in central areas.
Even the technical counterposition offered by Brueckner in this scenario can be further countered on political economy grounds. One such counterargument would be that governance and associated investment responsibilities across a city-region are often defined along traditional narrow administrative boundaries that frequently do not coincide with the functional economic space that is a city-region. As a result, often there is no one administrative entity tracking or seeking to balance the overall cost of city infrastructure investments to which Brueckner refers. Instead, there is usually a variety of core government departments and parastatals, some with local and others with broader mandates. These often have differing sources of finance, varying authority, and divergent reporting relationships. In the absence of an ade-quately empowered coordinating agency, the result is an incongruity between the incentive structures of governing authorities and the overall governance needs of the city-region.
Add to all this the reality that regulation is not static but dynamic, and the poli-tical economy complexity increases. In particular, the public and behind-the-sce-nes negotiations associated with moves toward deregulation are often accompanied by market signals taking the form of gradual capitalization of anticipated reforms into prices before the reforms are established in statute. Simultaneously, influential players sometimes strategically reposition themselves to be among the first winners in a reformed system when reform seems inevitable. Perhaps these are among the reasons that simply removing particular constraints has little impact on behavior and outcomes, as Chiu et al. note in their chapter. The bottom line is that unless the complex political economy of regulatory reform is studied and well understood, there is little scope for implementing policy reforms that will truly expand market access by bolstering supply and managing price inflation.
Ownership and Management of Urban Land
In trying to steer urban land markets toward efficient and inclusive city outcomes, the state often goes beyond regulation and institutions and participates directly as a player. To do this, it either uses existing public landholdings, which in some cases are substantial, or acquires land from private owners through the power of eminent domain. On the surface, state intervention in the land market appears to have several merits. It may also carry some risks.
xxviii R. Rajack and S. V. Lall
Potential Merits, Potential Risks
First, in the most obvious of the potential merits, when land supply is highly constrai-ned, a direct interjection of public land into the market can increase supply, alleviating some of the pressure that bids up prices. Second, when financial returns to private investors are insufficient to motivate them to develop shelter solutions for those with relatively low incomes, the state can contribute its landholdings in joint-venture partnerships with the private sector. This approach can achieve greater affordability without asking the private sector to severely curtail profit margins. In addition, this in-kind subsidy may have less direct inflationary impacts than cash injections, which are in any case less feasible for resource-constrained governments. Third, compulsory acquisition of private land has been a long-standing element of infrastructure policy allowing for spatial connectivity, cost-efficient designs, and city efficiency.
However, public land interventions carry the risk of further distorting land mar-kets in unintended ways. Rajack, in his chapter, elaborates a conceptual framework through which such distortions may occur. There are several potential avenues of impact. First, the state may withhold land from the market through a failure to strategically interject parcels of land in a way that could bolster land supply when demand is high. Second, the state may be relatively inefficient as a supplier of land as a result of often complex and convoluted procedures that increase transaction costs. Third, public land management may be insufficiently decentralized and the-refore too far removed to be responsive to market needs. Finally, state agencies, particularly when they enjoy both regulatory and development powers, may create distortions through unfair competition with private developers.
Given these possibilities for public land management to influence urban land markets, one would expect there to be a rich body of empirical evaluations of this issue. But this is not the case. Indeed, Azuela and Herrera-Martín note an astonis-hing lack of basic data on the use of eminent domain. In their review they did not come across a single country that reports systematically on the use of this tool, capturing even basic data such as total area acquired, levels of compensation paid, and the average time to complete acquisitions. They also find that while there is a clear convergence in most countries toward using market value as the basis for compensation, most studies do not recognize the importance of the social costs of relocation, which can outweigh the market value of the land.
Research on managing existing public land, Rajack notes, has not focused on the impacts on land markets. Instead, reviews have looked at public land management from an asset management perspective, occasionally through a production function lens, and, from time to time, from the angle of comparative transaction costs and development outputs.
In addressing this empirical gap, Rajack uses data from a recent survey to pro-file public land management across cities in developing countries. His analysis highlights several key features: organizational arrangements and human resource capacity, land information management, and land management practices. He then assesses the potential roles of these features of public land management as well as
Introduction: What Do We Know About Urban Land Markets? xxix
the extent of public landownership against a number of land market outcome indica-tors. These indicators include estimates of house price to income ratios and shelter price inflation, a measure of the contiguity of recent spatial expansion, an estimate of the extent to which encroachment affects public rather than private land, and the percentage of firms citing access to land as a major constraint to their business.
Rajack’s analyses suggest tentative positive relationships between less dominant public sector involvement in land development and better land market outcomes. Supporting this result are findings that better and more conservative public land management practices (limited or no land banking; auctioning of land; and patrol of sites to detect encroachment) as well as decentralization are also correlated with better land market outcomes. These correlations are observed for indicators of affor-dability, encroachment, and access to land by firms.
Some of these findings resonate with aspects of the Singapore narrative as told by Yuen in her chapter, such as tight enforcement of development control. Others do not. The mixed bag includes the successful engagement of Singapore’s public sector in providing more than 900,000 housing units through a highly centralized adminis-trative system. But as Yuen and others have explained, Singapore is a unique envi-ronment, characterized by a city-state, highly centralized governance, extraordinary political stability, and, in contemporary times, enviable wealth. Still, as Yuen points out, at the time of independence informal shelter was widespread, housing more than half a million people.
Napier, in his chapter on South Africa, also provides a rich case study of the com-plexity associated with direct intervention in land and housing markets. His premise is that the distortions that existed by the end of the apartheid era were so pronounced that making South African towns and cities more inclusive requires a multiplicity of interventions beyond regulatory instruments. While few other countries experien-ced such extreme distortions, a similar argument can and is being made in many other places, especially former colonies, on the basis that the “starting point” of markets is not a fair one.
Napier traces the postapartheid government’s attempts to intervene on multiple fronts, notably land redistribution, land restitution, and tenure reform. The poster child of these efforts has been the government’s low-income housing program, which had produced more than 2 million houses by December 2006 (South Africa, Department of Housing, 2007). However, Napier emphasizes the difficulty in stri-king the appropriate balance, pointing to the distortionary effects of well-intended interventions. He contends that the heavy emphasis on almost free low-income hou-sing has stunted the production of serviced land and housing for households in the income range between those eligible for the low-cost subsidized houses and the lower end of where banks are willing to grant mortgages.
One outcome of the distortions appears to be a widening gap in property values: prices at the top end of the market reportedly doubled or tripled between 1999 and 2005 (Brown-Luthango, 2006, p. 9), while prices in other market segments have grown considerably more slowly. The contrast is greatest in the resale market for subsidized low-income housing, where there is a perception of substantial deprecia-tion in formal sale prices (Rust, 2006). While empirical study of these price gaps is limited, Napier suggests that potential causes include deficient levels of infrastruc-
xxx R. Rajack and S. V. Lall
ture servicing, monofunctional neighborhoods, remote locations, and the supply-dri-ven nature of the original allocations of the houses. He also notes the possible role of information asymmetry and lack of market familiarity in lower tiers of the market.
Public Land Management More Important for Market Outcomes
The question of how much the public sector should own land has created much tension in developing countries. Azuela and Herrera-Martín lament that debates on eminent domain have been lopsided and thus have failed to reconcile the range of issues at stake. They note that
housing rights campaigns, with all their moral force, have failed to acknowledge the econo-mic implications of policy options; development theories that inspire land tenure reforms in many countries ignore the human rights dimension; free trade agreements focus on the interests of investors.
The authors flag this imbalance as an important area of concern, especially for countries undergoing a transition from state ownership of land to private property, as in Eastern Europe.
In Singapore, Yuen observes, the overt pro-business orientation is “reopening the debate on the balance between the need for certainty and the scope for flexibility.” Rajack similarly cautions that the political economy of public land management and reform needs much closer attention. No matter what the economic arguments may be, he contends,
The asymmetric bargaining process that surrounds public land decisions as well as claims of entitlement and historical deprivation are key aspects of public land management that affect the choices the state makes with respect to an asset usually defined as “held in trust for the people.”
Given the widespread concern about the state’s ability to manage public land in a way that does not distort urban land markets, one might expect that large amounts of public land mean poorer land market outcomes. However, Rajack’s findings sug-gest that the obsession with the extent of public landownership may be misplaced—and that public land management policies may ultimately matter more. Among the range of indicators, the extent of public landownership did not feature as a reliable predictor of land market outcomes.
The findings call into question the inferences drawn from relative success stories such as Singapore, where public landownership is significant. They suggest that the success of Singapore land markets in attracting investment and satisfying the housing needs of the island’s population may have less to do with this dominant tenure feature and more to do with the policies that Yuen highlights. These include a reconceptualization of master planning; the introduction of flexible land use zones, blanket utility zones, and impact-based zoning; a streamlining of regulatory proce-dures, including greater self-regulation by the land development and construction industry; a growing reliance on technology; and strict anticorruption measures. As
Introduction: What Do We Know About Urban Land Markets? xxxi
Yuen suggests, these policies have worked well in a dynamic environment that has seen a doubling of the size of the built-up area in 30 years.
These findings also run counter to the expectations of those who envision that amassing large stocks of public land will help governments achieve more welfare-inducing land market outcomes. At the very least, they suggest a need for caution with respect to land banking, a subject of growing interest among policy makers in Latin America and elsewhere. As Azuela and Herrera-Martín point out, public land acquisition not only confronts growing costs, legal restrictions, and social resis-tance; the strategy also has questionable feasibility for achieving the desired land market outcomes.
Research Priorities
The research presented at the Fourth Urban Research Symposium provided new insights into the workings and implications of urban land markets. It also identified issues deserving further investigation. Some of these topics are discussed here.
Urban Data Quality in Developing Countries
There is an urgent need to define international standards for the compilation of urban data and to encourage countries to invest in data at the city and subcity levels. Pro-mising signs of progress are emerging on this front. For the past 5 years the World Bank and its partners have been tracking the spatial expansion of a representative sample of cities around the world under the Urban Growth Management Initiative. The expansion metrics, derived from careful analysis of time-series spatial images, are being reconciled with city data on land market policies, institutions, infrastruc-ture, and prices along with other powerful economic and demographic indicators. The Bank is also leading a coalition effort on the Global City Indicators Program, a new initiative aimed at creating a single, standard system for measuring city perfor-mance and quality of life. These and similar initiatives, together with the ongoing efforts of the United Nations Human Settlements Programme (UN-Habitat) through its global and regional observatories, offer the promise of a better information base for future research, though challenges remain.
Costs of Regulations in Fragmented Markets
On regulations, Henderson points to the need for more analysis of their impacts in environments where there is a pronounced duality of formal and informal land
xxxii R. Rajack and S. V. Lall
markets. Since regulatory research is fairly advanced, however, methodological improvements should take on greater priority in the agenda going forward. As sug-gested, these include treating regulation as endogenous; better quantifying regula-tory benefits to allow the estimation of net effects; recognizing the heterogeneity of demand and therefore the potential variations in impacts among subgroups; and differentiating among regulations to support the emergence of actionable policy recommendations.
The body of research on policies and institutions to assist the urban poor, while diverse, is less advanced than the study of regulation. Here the agenda should therefore focus in the short to medium term on more systematic study of the key questions of empirical impact evaluation along with gradual improvements in methodology. The most urgent need appears to be more consistent estimation of the counterfactual. Durand-Lasserve and Selod and Payne et al. also emphasize the need to study key hypotheses relating to a broader range of traditional and emerging tenure options beyond conventional titling. In addition, they note a gro-wing consensus on the need to consider differential impacts on different groups of stakeholders, including the urban poor, female-headed households, foreign inves-tors, and local businesses. Another emphasis is the need for a standard indicator of tenure security.
Impacts of Land Management on Market Efficiency
Empirical research on the land market effects of land management is in its infancy. As noted, the most basic data on the use of eminent domain are lacking. In addition, correlations between policy options for public land management and land market outcomes—such as affordability of shelter and access to land for firms—are largely unstudied. Here the research agenda for the next few years would do well to focus on building baseline data, creating typologies, and pursuing exploratory studies that can help define the focus of research in the medium term.
Azuela and Herrera-Martín emphasize the need for more empirical analyses of eminent domain to complement the legal analyses that have thus far dominated the field. And as noted, these authors, like Rajack, point to the need to study the broa-der political economy and institutional context of public land policies. In addition, Rajack makes a case for estimating the social and environmental benefits that may be derived from vacant public land, noting that these benefits are generally not factored into analyses favoring intensive, revenue-maximizing uses. He also calls for more research on whether particular institutional configurations of public land management are better suited to specific instruments of public land intervention and systems of land tenure—while noting that the state of the art may not be sufficiently refined to pursue such research in the short term.
Introduction: What Do We Know About Urban Land Markets? xxxiii
Land-Based Revenues to Finance Infrastructure and Guide Land Use
In noting that “cheap land is peripheral land,” Napier acknowledges the difficulty in getting the location of houses right relative to infrastructure and jobs, so that the population has effective access to the labor market. He and many others argue that metropolitan governments need to make better use of fiscal policy, raising revenues from land and land use to finance infrastructure in the areas under development. It is a point echoed by Chiu et al. in their chapter, particularly in their references to the experience of Hong Kong (China), where infrastructure finance benefits greatly from public land revenues.
Capturing land value has the virtue of recovering revenue from something that is fairly inelastic (land) while not discouraging building density.5 The approach also has a certain populist appeal, for two main reasons: First, it extracts from property owners value that might well have been created by society through improvements in infrastructure. And it tends to fall on the landed gentry, although it is certainly possible that the tax could be passed through to renters.
These concepts have influenced public finance, as they provide the rationale for the public sector’s capturing all or part of the increments in land value attribu-ted to public investments. Consider the case of transportation projects. These pro-jects improve the accessibility of adjacent land, and this improved accessibility is capitalized in property values, generating a windfall for private landowners. Public agencies can capture part of that windfall through a range of methods and use the revenues to finance public infrastructure. Methods of value capture include ad valo-rem taxation (the basic land tax based on the assessed market value and other forms of taxation based on old land taxes), public-private partnerships or joint develop-ment of infrastructure including mass transit (as used in the United States), leasing of real property (leasing of the newly developed land by the city to private interests for further development), and use of real property as a counterpart for public-private infrastructure development. Value capture was widely used to finance important infrastructure in the major capitals of Europe and Latin America.
Another approach is to auction public land outright, which can both guide the allocation of land according to its potential return and raise finance for infrastruc-ture. The examples of Cairo and Mumbai are often cited in the literature (Peterson, 2009).
Two recent World Bank–sponsored publications (Peterson, 2009; Peterson & Annez, 2007) have explored the worldwide experience with several of these met-hods of infrastructure finance. The Lincoln Institute of Land Policy has also been pioneering valuable work on this front, particularly in relation to China. Empirical
5 Capturing land value was first suggested by the American economist Henry George, who claimed that city governments should implement a land value tax so that future developments maximize the value of land and future tax revenues. The idea is that private land increases in value as a result of public infrastructure to which landowners rarely contribute. Consequently, the use of such a tax would be both efficient and fair.
xxxiv R. Rajack and S. V. Lall
research on the implications of instruments of land value capture, including insti-tutional and political economy aspects of their use, is in its early stages. Given the potential of these instruments to enhance economic density and finance pub-lic goods, new research on this topic will have great relevance for urban policy design.
Among the issues that future research should probe are how land values and the opportunity costs of land are estimated and how these estimates are then applied to different policy options for slums, including in situ regularization, land sharing, and outright relocation with appropriate compensation. Another issue relates to build-ing height restrictions and other density controls that have been put into place to manage congestion and preserve environmental quality. By using regulations rather than pricing to manage externalities, city planners often create a trade-off between environmental sustainability and greater economic efficiency of the city. An alter-native fiscal instrument based on capturing land values could facilitate economic density by sorting economic activities on the basis of the rents land users are willing to pay for urban proximity. Complementary mechanisms such as congestion pricing can be tried to manage environmental externalities without imposing trade-offs with the city’s potential to increase agglomeration economies.
A Look at Omissions
Finally, the research agenda also needs to give attention to areas that were not a significant focus at the Fourth Urban Research Symposium. Fiscal policy, including property taxation and the broader role of land in infrastructure finance, is clearly one of these. Also important are the driving forces behind urban spatial expansion and the correlation between spatial form and land market outcomes including land and housing prices. Other noteworthy topics include commercial real estate decisi-ons and the role of infrastructure in the efficiency of land markets and the functio-nality of cities. Fortunately, these are not areas devoid of research. In recent years notable contributions have been made by the World Bank and by such institutions as the Lincoln Institute of Land Policy.
References
Atwood, D. A. (1990). Land registration in Africa: The impact on agricultural production. World Development, 18(5), 659–671.
Bertaud, A., & Brueckner, J. K. (2004). Analyzing building-height restrictions: Predicted impacts, welfare costs, and a case study of Bangalore, India. Policy Research Working Paper 3290. Washington, DC: World Bank.
Bertaud, A., Buckley, R., & Phatak, V. K. (2005). Reforming Mumbai’s real estate raj: A prelude to a business plan. Unpublished report, World Bank, South Asia Region, Sustainable Develop-ment, Urban, Water & Sanitation, and Hazard Risk Management (SASDU), Washington, DC.
Introduction: What Do We Know About Urban Land Markets? xxxv
Brown-Luthango, M. (2006). Capturing unearned value/leakages to assist markets to work for the poor. Paper commissioned by Urban LandMark. from http://www.urbanlandmark.org.za/archive. Accessed March 10, 2007.
Buckley, R., Bertaud, A., & Phatak, V. K. (2006, January). Property rights and interlocking policy constraints in urban land markets: Reforming Mumbai’s real estate raj. Paper presented at the National Workshop on Land Policies and Administration for Accelerated Growth and Poverty Reduction in the 21st Century, New Delhi.
Byabato, K. A. (2005). Legal title to land and access to formal finance by the low-income house-holds: The case of Sinza C and Miburani neighbourhoods in Dar es Salaam. PhD dissertation, University of Dar es Salaam.
Carter, M. R., & Olinto, P. (1996). Getting institutions right for whom? The wealth-differentiated impact of property rights reform on investment and income in rural Paraguay. Unpublished manuscript, University of Wisconsin at Madison.
Carter, M. R., & Wiebe, K. D. (1990). Access to capital and its impact on agrarian structure and productivity in Kenya. American Journal of Agricultural Economics, 72(5), 1146–1150.
de Soto, H. (1989). The other path: The invisible revolution in the third world. London: I. B. Taurus.
de Soto, H. (2000). The mystery of capitalism: Why capitalism triumphs in the West and fails ever-ywhere else. New York: Basic Books.
Deutsch, R. (2006). Beneficiary assessment of land title recipients under the Land Management and Administration Project (LMAP). Report prepared for the Cambodian Ministry of Land Management, Urban Planning, and Construction, Phnom Penh.
Doebele, W. (1983). Concepts of urban land tenure. In H. B. Dunkerley & C. M. E. Whitehead (Eds.), Urban land policy: Issues and opportunities (pp. 63–107). New York: Oxford Uni-versity Press.
Dunkerley, H. B., & Whitehead, C. M. E. (Eds.). (1983). Urban land policy: Issues and opportu-nities. New York: Oxford University Press.
Friedman, J., Jimenez, E., & Mayo, S. (1988). The demand for tenure security in developing coun-tries. Journal of Development Economics, 29(2), 185–198.
Gavian, S., & Fafchamps, M. (1996). Land tenure and allocative efficiency in Niger. American Journal of Agricultural Economics, 78(2), 460–471.
IIED (International Institute for Environment and Development). (2006). Local innovation in securing land rights in Africa: Lessons from experience. Briefing paper. London: Author.
Jimenez, E. (1984). Tenure security and urban squatting. Review of Economics and Statistics, 66(4), 556–567.
Kaufmann, D., Kraay, A., & Zoido-Lobatón, P. (2002). Governance matters II: Updated indicators for 2000 / 01. Policy Research Working Paper 2772. Washington, DC: World Bank.
Mitchell, T. (2006). The properties of markets: Informal housing and capitalism’s mystery. Cultu-ral, Political Economy Working Paper Series, no. 2. Lancaster, England: Lancaster University, Institute for Advanced Studies in Social and Management Sciences.
North, D. C. (1996). Institutions, institutional change and economic performance. Cambridge: Cambridge University Press.
Peterson, G. (2009). Unlocking land values to finance urban infrastructure. Trends and Policy Options Series. Washington, DC: World Bank.
Peterson, G., & Annez, P. (Eds.). (2007). Financing cities: Fiscal responsibility and urban infras-tructure in Brazil, China, India, Poland and South Africa. New Delhi: Sage Publications India.
Pollakowski, H. O., & Wachter, S. M. (1990). The effects of land-use constraints on housing pri-ces. Land Economics, 66(3), 315–324.
Rajack, R. (1997). Tenurial security, property freedoms, dwelling improvements and squatter regu-larisation. Unpublished PhD dissertation, University of Cambridge.
Razzaz, O. M. (1991). Law, urban land tenure and property disputes in contested settlements: The case of Jordan. PhD dissertation, Harvard University, Cambridge, MA.
xxxvi R. Rajack and S. V. Lall
Razzaz, O. M. (1993). Examining property rights and investment in informal settlements: The case of Jordan. Land Economics, 69(4), 341–355.
Rust, K. (2006). A finance response to the missing middle? ACCESS Housing, 4, 1–2. from http://www.finmark.org.za/. Accessed March 9, 2007.
Siegel, F. (2000). The future once happened here: New York, D.C., L.A., and the fate of America’s big cities. New York: Encounter Books.
South Africa, Department of Housing. (2007). Housing delivery statistics as of December 2006. http://www.housing.gov.za. Accessed March 10, 2007.
Varley, A. (1987). The relationship between tenure legalization and housing improvements: Evi-dence from Mexico. Development and Change, 18(3), 463–481.
Varley, A. (2002). Private or public: Debating the meaning of tenure legalization. International Journal of Urban and Regional Research, 26(3), 449–461.
Woodruff, C. (2001). Review of de Soto’s The mystery of capital. Journal of Economic Literature, 39(4), 1215–1223.
World Bank. (2008). World development report 2009: Reshaping economic geography. New York: Oxford University Press.
Introduction: What Do We Know About Urban Land Markets? xxxvii

Part ILand Markets, Regulation, and Welfare

“This page left intentionally blank.”
3
Government interventions affect land use outcomes in cities around the world. These interventions are often well meaning, being designed to achieve ends that are thought to be socially desirable. However, since urban real estate markets are complex systems, land use interventions often generate subsidiary effects that are unanticipated by policy makers. These effects can be undesirable, offsetting the benefits that the interventions were intended to capture. The result can then be a net social loss, so that the land use intervention leaves the urban economy in a worse position than where it started.
The notion that land use interventions can be counterproductive has been a theme of World Bank research for several decades. This chapter offers another installment in this line of thinking. The chapter presents no new theories or new evidence. Instead, it offers an overview of the economics of land use interventions by com-bining a number of diverse elements from existing research into a single package. The aim is to help provide insights into land use interventions that would otherwise require synthesizing material and ideas from a wide variety of sources.
1.1 A Typology of Land Use Interventions
Urban economists and researchers have studied government land use interventions in many countries around the world. This section surveys the interventions consid-ered in these studies, providing a comprehensive picture of the ways in which gov-ernment actions can affect real estate markets. Once the nature of the interventions is clear, the discussion turns to an economic analysis of their likely effects.
S.V. Lall et al. (eds.), Urban Land Markets, DOI 10.1007/978-1-4020-8862-9_1, © World Bank 2009
Chapter 1Government Land Use Interventions: An Economic AnalysisJan K. Brueckner
J. K. Brueckner ( )Department of Economics University of California Irvine, CA 92697, USAe-mail: [email protected]
4 J. K. Brueckner
1.1.1 Urban Growth Boundaries
The first type of intervention, which is the easiest to visualize, is often referred to as an urban growth boundary (UGB). Under such a policy, the government effectively draws a ring around a city and outlaws urban development outside this ring. The urban growth boundary may be allowed to expand over time in response to popu-lation growth, but its presence nevertheless prevents conversion of rural land that would otherwise occur. One of the best-known examples of the use of UGBs is in the Republic of Korea, where greenbelt zones constrain the growth of cities. Korean greenbelts and their effects have been widely studied, with the World Bank involved in some of the research. Key contributions are by Hannah, Kim, and Mills (1993); Kim (1993); Son and Kim (1998); Green, Malpezzi, and Vandell (1994). These researchers conclude that Korean greenbelts are partly responsible, along with other elements of the country’s housing policy, for Korea’s relatively high housing prices. This conclusion is validated in the theoretical discussion in Sect. 1.2.
Land use is constrained by UGBs elsewhere in the world, including the United States. The American “smart growth” movement has made this kind of land use intervention more common, and the best-known example is the UGB surround-ing Portland, Oregon. UGBs also exist in the United Kingdom, as explained by Cheshire and Sheppard (2002).
1.1.2 Floor Area Ratio Restrictions
A second land use intervention is the regulation of development densities. The goal of lower densities can be achieved in several ways. One approach is a minimum lot size restriction, which limits densities in areas with detached houses by requiring that each structure be surrounded by an ample land area. While minimum lot size rules are common in the United States, this kind of regulation does not apply in areas where apartment living is the norm, as in most built-up areas in lower-income countries.
An alternative approach to density regulation, which does apply in such cases, is the imposition of building height limits. These limits are imposed through a restric-tion on a structure’s floor area ratio (FAR), which equals the total floor area in the building divided by the lot size. For example, a four-story building that covers half the lot area has an FAR of 2.0. A limit on the FAR prevents the developer from constructing a tall building.
Throughout the world, zoning regulations usually specify maximum FAR values in different parts of a city. But these FAR limits typically do not represent severe constraints on development, because they often roughly match the developer’s pre-ferred FAR value in a given location. In effect, FAR restrictions often “follow the market,” providing a way for city planners to ensure that the character of develop-ment does not greatly diverge from the norm in a given area.
But in many cases FAR restrictions severely constrain the nature of land use. In Washington, D.C., and Paris, for example, building height limits are imposed
51 Government Land Use Interventions: An Economic Analysis
for aesthetic reasons, and they result in FAR values near both city centers that are far below those that a free market would produce. Lower-income countries also provide examples of stringent FAR regulations, with a case in point being India. Maximum FAR values in the central areas of Mumbai, Bangalore, and other major Indian cities are much lower than free market values. The dramatic effect of FAR regulation is easily seen in Mumbai, a peninsular city with severe land constraints and a vast population. Without FAR limits, land use in Mumbai would probably resemble the high-intensity pattern seen in Hong Kong (China), a similarly situated city. Instead, Mumbai is mostly a low-rise city, with the occasional tall buildings having been constructed under exemptions from the FAR regulations.
Arnott and MacKinnon (1977) provide a theoretical analysis of the effects of FAR restrictions, and Bertaud and Brueckner (2004, 2005) provide a more recent analysis along with a case study of Bangalore. The authors show theoretically that FAR limits, like UGBs, tend to raise housing prices in cities in which they are imposed, a conclusion that is further explained in Sect. 1.2. This prediction matches the reality in Mumbai, whose real estate prices are among the highest in the world.
1.1.3 Cost-Increasing Regulations
A third category includes a variety of land use interventions that may raise the cost of development. This class of interventions is well illustrated in the analysis of Malpezzi and Mayo (1997) and Bertaud and Malpezzi (2001), who study the case of Malaysia. They focus on regulations that require excessive road widths in newly developed areas (including provision of back alleys), excessive street set-backs for structures, and excessive requirements for community facilities in new developments. These authors also identify another, less tangible cost-increasing factor, which grows out of the process for securing government approval of new projects. Long regulatory delays in the approval process raise the cost of develop-ment, as does uncertainty about the outcome of the process (Mayo & Sheppard, 2001 provide a theoretical analysis of this second effect). While the impact of these cost-increasing interventions is clear in the discussion of the Malaysian case, an analogous impact can be expected in any real estate market in which such interven-tions are present. A key aspect of the impact is an increase in the price of housing, as the burden of the interventions is passed on to consumers.
1.1.4 Bureaucratic Control of Development Decisions
Rather than intervening through regulation of a private market, governments may control land use outcomes by taking the place of the developer, constructing and operating real estate projects themselves. This type of intervention may lead to land use outcomes very different from those a private market would produce. Such a diver-
6 J. K. Brueckner
gence was strongly evident in some major cities of the former Soviet Union, which were the focus of considerable World Bank research. The most notable study, by Renaud and Bertaud (1997), shows that bureaucratic control of land use decisions led to a perverse, inverted population density pattern for the city of Moscow. The Soviet government constructed high-rise apartment buildings far from the city center while leaving land close to the center in low-intensity uses. This pattern, the opposite of the density pattern that would be produced by a free market, concentrated Moscow’s population far from its employment center, leading to highly inefficient land use.
1.1.5 Racially Based Land Use Interventions
A final government intervention is specific to South Africa, where it was part of that country’s apartheid policy. This intervention effectively controlled the residential locations of the black population, restricting black residents to living in townships on the fringes of the major cities and thus far from major employment centers. South Africa’s township policy effectively produced a land use outcome like that in Moscow, where households living at high densities were forced to locate far from the city center. The high densities in this case arose not from a government deci-sion to construct tall buildings on the fringe but from the poverty of the township residents, which dictated very low land consumption. South Africa’s apartheid land use pattern, besides being offensive for the oppression it represented, also imposed huge costs on the population, a consequence of the massive time and money costs incurred as remote township residents undertook long commutes to jobs nearer the city centers. The effect of apartheid on land use in South African cities is analyzed by Brueckner (1996) from a theoretical perspective.
Since the kind of land use intervention practiced in South Africa was intimately tied to its unique racial policies, it is unlikely to be repeated elsewhere. However, Sect. 1.2 includes a general analysis of this case.
1.2 Economic Analysis of Land Use Interventions
This section presents a simple economic analysis of the impacts of the different types of land use interventions, using a diagrammatic approach. The analysis uses the stand-ard urban model developed by Alonso (1964), Muth (1969), Mills (1967), and Whea-ton (1974), which provides the best framework for analyzing land use interventions in a spatial context. The diagrammatic analysis illustrates the conclusions derived from a mathematical analysis using the standard model, whose details are not reported.
The basic elements of the model are easily explained. Each urban resident com-mutes to a job in the center of the city, incurring time and money costs that increase with the distance x from his or her dwelling to the city center. Residents consume housing as well as a catchall nonhousing good, and the price of housing varies
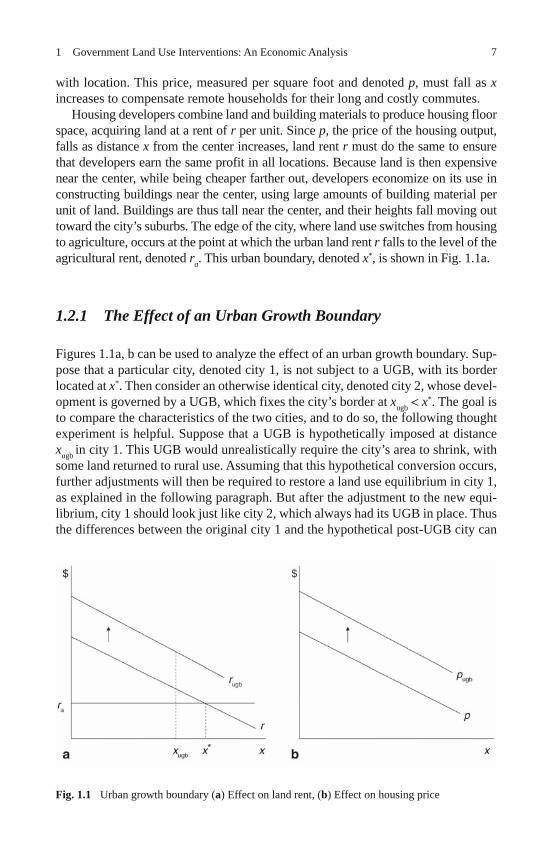
71 Government Land Use Interventions: An Economic Analysis
with location. This price, measured per square foot and denoted p , must fall as x increases to compensate remote households for their long and costly commutes.
Housing developers combine land and building materials to produce housing floor space, acquiring land at a rent of r per unit. Since p , the price of the housing output, falls as distance x from the center increases, land rent r must do the same to ensure that developers earn the same profit in all locations. Because land is then expensive near the center, while being cheaper farther out, developers economize on its use in constructing buildings near the center, using large amounts of building material per unit of land. Buildings are thus tall near the center, and their heights fall moving out toward the city’s suburbs. The edge of the city, where land use switches from housing to agriculture, occurs at the point at which the urban land rent r falls to the level of the agricultural rent, denoted r a . This urban boundary, denoted x * , is shown in Fig. 1.1a.
1.2.1 The Effect of an Urban Growth Boundary
Figures 1.1a, b can be used to analyze the effect of an urban growth boundary. Sup-pose that a particular city, denoted city 1, is not subject to a UGB, with its border located at x * . Then consider an otherwise identical city, denoted city 2, whose devel-opment is governed by a UGB, which fixes the city’s border at x ugb < x * . The goal is to compare the characteristics of the two cities, and to do so, the following thought experiment is helpful. Suppose that a UGB is hypothetically imposed at distance x ugb in city 1. This UGB would unrealistically require the city’s area to shrink, with some land returned to rural use. Assuming that this hypothetical conversion occurs, further adjustments will then be required to restore a land use equilibrium in city 1, as explained in the following paragraph. But after the adjustment to the new equi-librium, city 1 should look just like city 2, which always had its UGB in place. Thus the differences between the original city 1 and the hypothetical post-UGB city can
Fig. 1.1 Urban growth boundary (a) Effect on land rent, (b) Effect on housing price
8 J. K. Brueckner
be used to predict the differences between two existing cities (1 and 2), one with and one without a UGB.
In Fig. 1.1a the hypothetical imposition of the UGB in city 1 causes the land between x ugb and x * to be returned to rural use. While the original supply of housing in the city was adequate to house its population, this loss of developed land creates a situation in which the demand for housing exceeds the now smaller supply. In response to this excess demand, the price p per unit of housing rises throughout the city, causing the p curve in Fig. 1.1b to shift up to p ugb (recall that, like r , p declines with x ). 1 This housing price increase in turn raises the profits of housing develop-ers, causing them to compete more vigorously for the city’s land. Stiffer competi-tion then bids up the land rent r at each location in the city, causing the land rent curve in Fig. 1.1a to shift up to r ugb . In response to the higher land rent, developers build taller buildings. In addition, with the housing price higher, the city’s resi-dents choose smaller dwellings. With buildings taller and the dwellings within them smaller, population density rises throughout the city.
Recall that the post-UGB city can be used to predict the characteristics of city 2, which always had a UGB. Thus, compared with a city that has no UGB, a city that does have one is spatially smaller and has more expensive housing, higher land rents, taller buildings, and smaller dwellings. Since the incomes of the two cities are the same, the higher housing prices caused by the UGB lead to a lower standard of living, harming the city’s residents. Unless there are offsetting benefits (as dis-cussed further in Sect. 1.4), a UGB is a counterproductive land use intervention that makes consumers worse off.
1.2.2 The Effect of a Floor Area Ratio Restriction
The impact of an FAR limit can be analyzed using an analogous experiment. A new FAR limit is hypothetically imposed on a city without one, and the adjustments required to restore the land use equilibrium are analyzed. The features of the post-FAR-limit city can then be used to predict the characteristics of a city that always had an FAR limit in place.
Figure 1.2a shows the declining building height contour (denoted H ) for the pre-FAR-limit city as well as the flat line corresponding to the limit. Since buildings taller than the limit, which are located near the center, must be (hypothetically) rebuilt at a shorter height when the limit is imposed, the FAR limit reduces housing supply in the area out to distance x # in Fig. 1.2a. This supply loss creates excess demand for housing, which pushes up the housing price p throughout the city, just as in Fig. 1.1b. In response to this price increase, dwelling sizes shrink throughout the city.
Being unable to develop land to its highest and best use inside x # , where the FAR limit is binding, developers in this area offer less for the land than before, causing land
1 For simplicity, the various curves in the figures are drawn as straight lines even though they are convex under the model. In addition, curve shifts are drawn as parallel even though they are nonparallel in general.
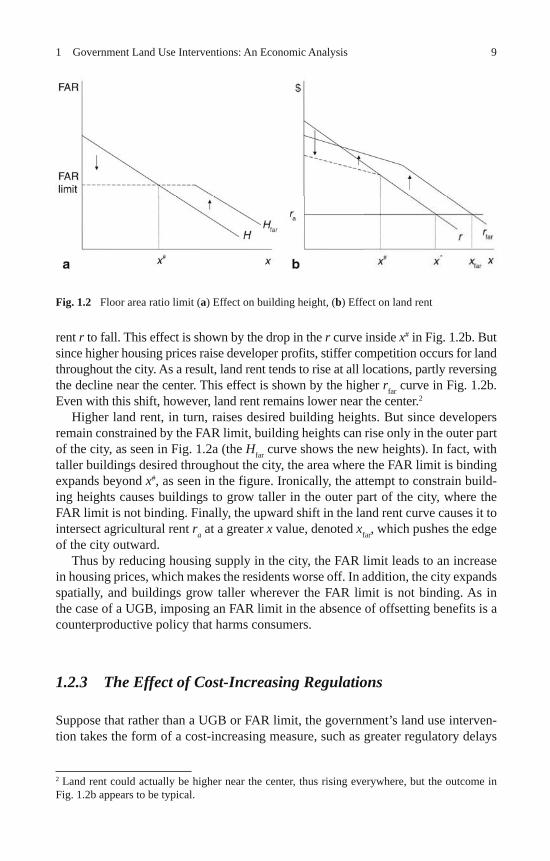
91 Government Land Use Interventions: An Economic Analysis
rent r to fall. This effect is shown by the drop in the r curve inside x # in Fig. 1.2b. But since higher housing prices raise developer profits, stiffer competition occurs for land throughout the city. As a result, land rent tends to rise at all locations, partly reversing the decline near the center. This effect is shown by the higher r far curve in Fig. 1.2b. Even with this shift, however, land rent remains lower near the center. 2
Higher land rent, in turn, raises desired building heights. But since developers remain constrained by the FAR limit, building heights can rise only in the outer part of the city, as seen in Fig. 1.2a (the H far curve shows the new heights). In fact, with taller buildings desired throughout the city, the area where the FAR limit is binding expands beyond x # , as seen in the figure. Ironically, the attempt to constrain build-ing heights causes buildings to grow taller in the outer part of the city, where the FAR limit is not binding. Finally, the upward shift in the land rent curve causes it to intersect agricultural rent r a at a greater x value, denoted x far , which pushes the edge of the city outward.
Thus by reducing housing supply in the city, the FAR limit leads to an increase in housing prices, which makes the residents worse off. In addition, the city expands spatially, and buildings grow taller wherever the FAR limit is not binding. As in the case of a UGB, imposing an FAR limit in the absence of offsetting benefits is a counterproductive policy that harms consumers.
1.2.3 The Effect of Cost-Increasing Regulations
Suppose that rather than a UGB or FAR limit, the government’s land use interven-tion takes the form of a cost-increasing measure, such as greater regulatory delays
2 Land rent could actually be higher near the center, thus rising everywhere, but the outcome in Fig. 1.2b appears to be typical.
Fig. 1.2 Floor area ratio limit (a) Effect on building height, (b) Effect on land rent
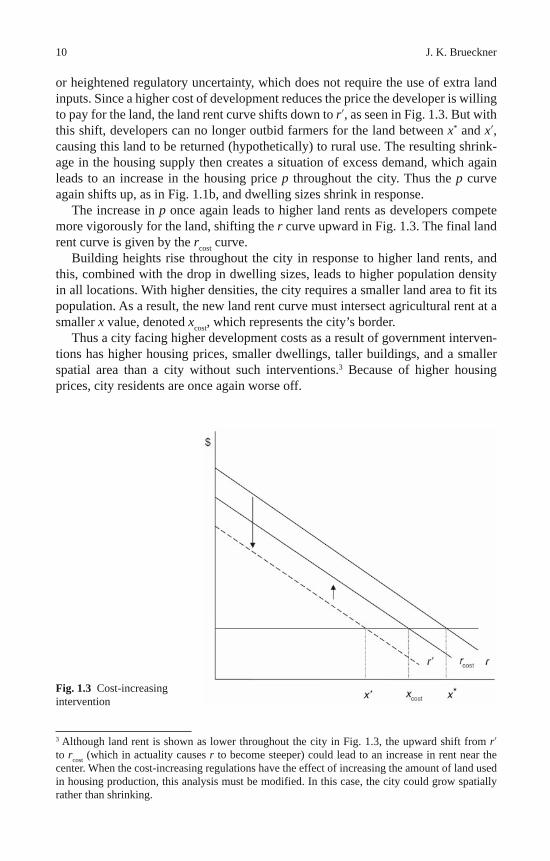
10 J. K. Brueckner
or heightened regulatory uncertainty, which does not require the use of extra land inputs. Since a higher cost of development reduces the price the developer is willing to pay for the land, the land rent curve shifts down to r � , as seen in Fig. 1.3. But with this shift, developers can no longer outbid farmers for the land between x * and x � , causing this land to be returned (hypothetically) to rural use. The resulting shrink-age in the housing supply then creates a situation of excess demand, which again leads to an increase in the housing price p throughout the city. Thus the p curve again shifts up, as in Fig. 1.1b, and dwelling sizes shrink in response.
The increase in p once again leads to higher land rents as developers compete more vigorously for the land, shifting the r curve upward in Fig. 1.3. The final land rent curve is given by the r cost curve.
Building heights rise throughout the city in response to higher land rents, and this, combined with the drop in dwelling sizes, leads to higher population density in all locations. With higher densities, the city requires a smaller land area to fit its population. As a result, the new land rent curve must intersect agricultural rent at a smaller x value, denoted x cost , which represents the city’s border.
Thus a city facing higher development costs as a result of government interven-tions has higher housing prices, smaller dwellings, taller buildings, and a smaller spatial area than a city without such interventions. 3 Because of higher housing prices, city residents are once again worse off.
3 Although land rent is shown as lower throughout the city in Fig. 1.3, the upward shift from r � to r cost (which in actuality causes r to become steeper) could lead to an increase in rent near the center. When the cost-increasing regulations have the effect of increasing the amount of land used in housing production, this analysis must be modified. In this case, the city could grow spatially rather than shrinking.
Fig. 1.3 Cost-increasing intervention
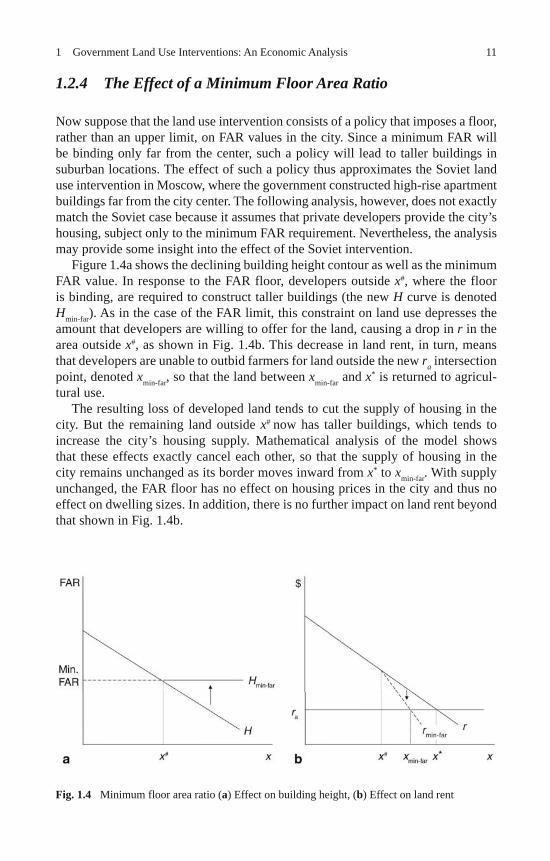
111 Government Land Use Interventions: An Economic Analysis
1.2.4 The Effect of a Minimum Floor Area Ratio
Now suppose that the land use intervention consists of a policy that imposes a floor, rather than an upper limit, on FAR values in the city. Since a minimum FAR will be binding only far from the center, such a policy will lead to taller buildings in suburban locations. The effect of such a policy thus approximates the Soviet land use intervention in Moscow, where the government constructed high-rise apartment buildings far from the city center. The following analysis, however, does not exactly match the Soviet case because it assumes that private developers provide the city’s housing, subject only to the minimum FAR requirement. Nevertheless, the analysis may provide some insight into the effect of the Soviet intervention.
Figure 1.4a shows the declining building height contour as well as the minimum FAR value. In response to the FAR floor, developers outside x # , where the floor is binding, are required to construct taller buildings (the new H curve is denoted H min-far ). As in the case of the FAR limit, this constraint on land use depresses the amount that developers are willing to offer for the land, causing a drop in r in the area outside x # , as shown in Fig. 1.4b. This decrease in land rent, in turn, means that developers are unable to outbid farmers for land outside the new r a intersection point, denoted x min-far , so that the land between x min-far and x * is returned to agricul-tural use.
The resulting loss of developed land tends to cut the supply of housing in the city. But the remaining land outside x # now has taller buildings, which tends to increase the city’s housing supply. Mathematical analysis of the model shows that these effects exactly cancel each other, so that the supply of housing in the city remains unchanged as its border moves inward from x * to x min-far . With supply unchanged, the FAR floor has no effect on housing prices in the city and thus no effect on dwelling sizes. In addition, there is no further impact on land rent beyond that shown in Fig. 1.4b.
Fig. 1.4 Minimum floor area ratio (a) Effect on building height, (b) Effect on land rent
12 J. K. Brueckner
Without offsetting benefits, a distortionary land use intervention such as an FAR floor must make society worse off. But the absence of a housing price effect means that consumer welfare is unaffected by the FAR floor. Losers must exist, and they consist of a group that has received no mention so far: the owners of the land on which the city is built. In the standard urban model, these owners are assumed for simplicity to be absentee, living outside the city, an assumption maintained in the analysis above. Imposition of an FAR floor creates a loss for these absentee land-owners because it lowers total land rent in the city. This outcome can be seen in Fig. 1.4b, since land rent falls in the outer part of the city, remaining unchanged elsewhere, while the city shrinks in area.
Absentee owners are also affected by the other government interventions ana-lyzed. When a UGB is imposed, total urban land rent rises, benefiting the absentee landowners, as long as the UGB does not restrict the spatial size of the city too severely. When an FAR limit is imposed, total land rent is also likely to rise. In both cases, however, losses for consumers outweigh the gains of landowners, so that society as a whole is worse off. When a cost-increasing measure is put into place, total land rent is likely (but not guaranteed) to fall, an outcome that reinforces the loss to consumers.
1.2.5 The Effect of a Racially Based Land Use Intervention
As noted, apartheid in South Africa forced the black population to live in remote townships on the edges of cities. Analysis of this land use intervention requires an urban model with two household groups, black and white. The key economic difference between these groups is their income, with blacks poor and whites com-paratively rich.
A standard urban model with two income groups usually predicts that the poor will live in the center and the rich in the suburbs, following the typical pattern in US cities. This outcome occurs because the low housing consumption of the poor gives them a comparative advantage in bidding for housing in locations where the price per square foot is high. Rich households, with much larger dwellings, are less able to tolerate high per-square-foot prices and are thus drawn to the suburbs, where a square foot of housing costs less.
Analytically, this difference is manifested in the land rent curves that relate to rich and poor (white and black) areas of the city. The black group’s land rent curve is steeper, falling more rapidly as x increases, than that of the white group. This slope difference means that the black rent curve (denoted r b ) will be highest in the central part of the city, while the white curve (denoted r w ) will be highest in the suburbs, as shown in Fig. 1.5a. When the government exerts no control over where people can live, land will be occupied by the highest bidder, and the pattern in Fig. 1.5a will result in the poor black group living near the center and the white group living in the suburbs, as indicated in the figure.
Under apartheid, government intervention reversed this locational pattern, with black households forced to live far from the center and white households free to
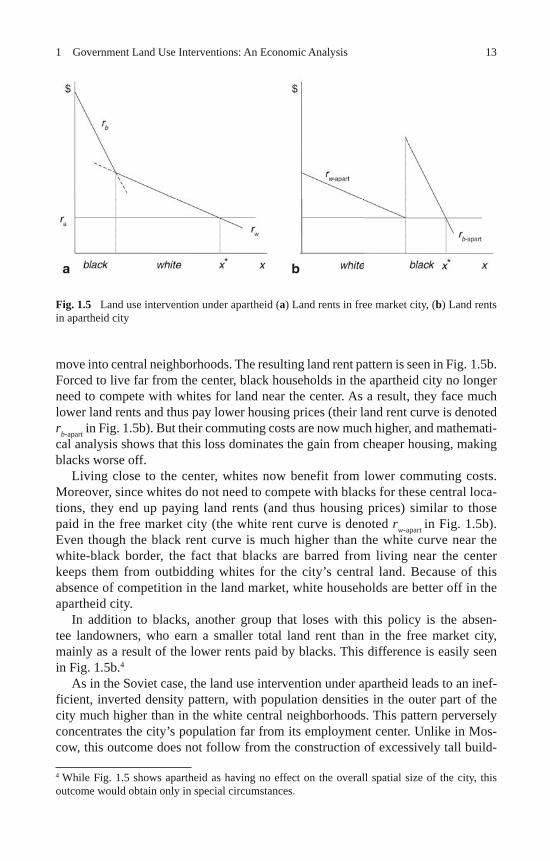
131 Government Land Use Interventions: An Economic Analysis
move into central neighborhoods. The resulting land rent pattern is seen in Fig. 1.5b. Forced to live far from the center, black households in the apartheid city no longer need to compete with whites for land near the center. As a result, they face much lower land rents and thus pay lower housing prices (their land rent curve is denoted r b -apart in Fig. 1.5b). But their commuting costs are now much higher, and mathemati-cal analysis shows that this loss dominates the gain from cheaper housing, making blacks worse off.
Living close to the center, whites now benefit from lower commuting costs. Moreover, since whites do not need to compete with blacks for these central loca-tions, they end up paying land rents (and thus housing prices) similar to those paid in the free market city (the white rent curve is denoted r w -apart in Fig. 1.5b). Even though the black rent curve is much higher than the white curve near the white-black border, the fact that blacks are barred from living near the center keeps them from outbidding whites for the city’s central land. Because of this absence of competition in the land market, white households are better off in the apartheid city.
In addition to blacks, another group that loses with this policy is the absen-tee landowners, who earn a smaller total land rent than in the free market city, mainly as a result of the lower rents paid by blacks. This difference is easily seen in Fig. 1.5b. 4
As in the Soviet case, the land use intervention under apartheid leads to an inef-ficient, inverted density pattern, with population densities in the outer part of the city much higher than in the white central neighborhoods. This pattern perversely concentrates the city’s population far from its employment center. Unlike in Mos-cow, this outcome does not follow from the construction of excessively tall build-
4 While Fig. 1.5 shows apartheid as having no effect on the overall spatial size of the city, this outcome would obtain only in special circumstances.
Fig. 1.5 Land use intervention under apartheid (a) Land rents in free market city, (b) Land rents in apartheid city
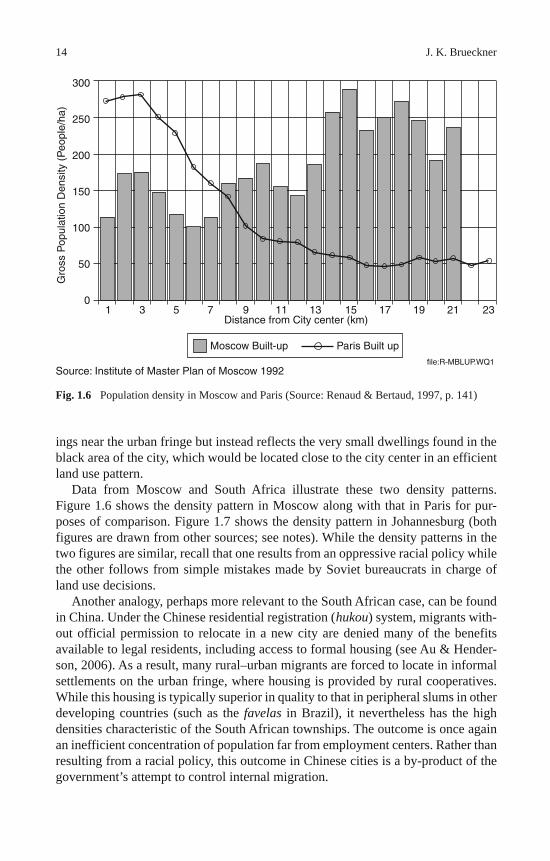
14 J. K. Brueckner
ings near the urban fringe but instead reflects the very small dwellings found in the black area of the city, which would be located close to the city center in an efficient land use pattern.
Data from Moscow and South Africa illustrate these two density patterns. Figure 1.6 shows the density pattern in Moscow along with that in Paris for pur-poses of comparison. Figure 1.7 shows the density pattern in Johannesburg (both figures are drawn from other sources; see notes). While the density patterns in the two figures are similar, recall that one results from an oppressive racial policy while the other follows from simple mistakes made by Soviet bureaucrats in charge of land use decisions.
Another analogy, perhaps more relevant to the South African case, can be found in China. Under the Chinese residential registration ( hukou ) system, migrants with-out official permission to relocate in a new city are denied many of the benefits available to legal residents, including access to formal housing (see Au & Hender-son, 2006). As a result, many rural–urban migrants are forced to locate in informal settlements on the urban fringe, where housing is provided by rural cooperatives. While this housing is typically superior in quality to that in peripheral slums in other developing countries (such as the favelas in Brazil), it nevertheless has the high densities characteristic of the South African townships. The outcome is once again an inefficient concentration of population far from employment centers. Rather than resulting from a racial policy, this outcome in Chinese cities is a by-product of the government’s attempt to control internal migration.
Fig. 1.6 Population density in Moscow and Paris (Source: Renaud & Bertaud, 1997, p. 141)
300
250
200
150
100
50
0
Gro
ss P
opul
atio
n D
ensi
ty (
Peo
ple/
ha)
1 3 5 7 9 11Distance from City center (km)
Source: Institute of Master Plan of Moscow 1992file:R-MBLUP.WQ1
13 15 17 19 21 23
Moscow Built-up Paris Built up
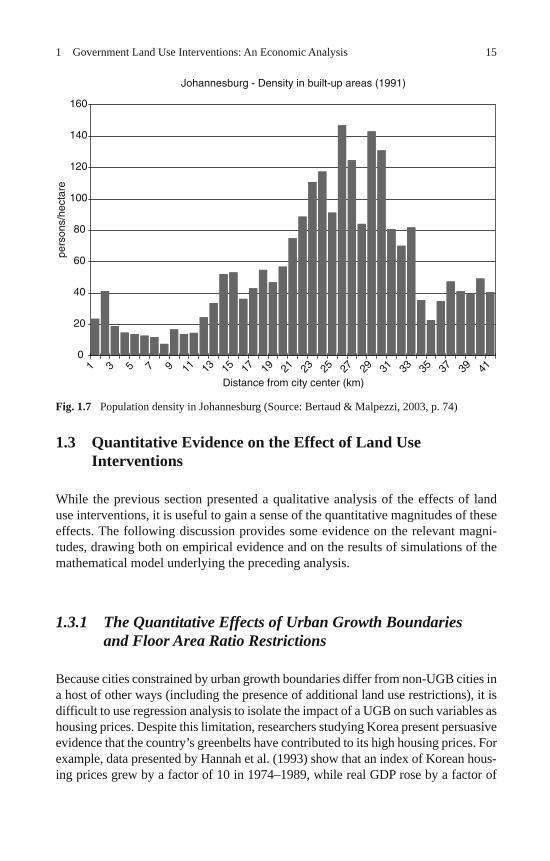
151 Government Land Use Interventions: An Economic Analysis
1.3 Quantitative Evidence on the Effect of Land Use Interventions
While the previous section presented a qualitative analysis of the effects of land use interventions, it is useful to gain a sense of the quantitative magnitudes of these effects. The following discussion provides some evidence on the relevant magni-tudes, drawing both on empirical evidence and on the results of simulations of the mathematical model underlying the preceding analysis.
1.3.1 The Quantitative Effects of Urban Growth Boundaries and Floor Area Ratio Restrictions
Because cities constrained by urban growth boundaries differ from non-UGB cities in a host of other ways (including the presence of additional land use restrictions), it is difficult to use regression analysis to isolate the impact of a UGB on such variables as housing prices. Despite this limitation, researchers studying Korea present persuasive evidence that the country’s greenbelts have contributed to its high housing prices. For example, data presented by Hannah et al. (1993) show that an index of Korean hous-ing prices grew by a factor of 10 in 1974–1989, while real GDP rose by a factor of
Fig. 1.7 Population density in Johannesburg (Source: Bertaud & Malpezzi, 2003, p. 74)
Johannesburg - Density in built-up areas (1991)
0
20
40
60
80
100
120
140
160
1 3 5 7 9 11 13 15 17 19 21 23 25 27 29 31 33 35 37 39 41
Distance from city center (km)
pers
ons/
hect
are
16 J. K. Brueckner
3.4. While rising incomes, by increasing housing demand, surely played a role in this price escalation, the economy also faced severe land constraints. Urban residential land in Korea grew by only 65% in 1973–1988 even though the urban population rose by more than 100% over this period. With the greenbelt policy slowing the growth in the supply of residential land, and with population and income both rising rapidly, the conditions were ripe for a rapid escalation in Korean housing prices.
Numerical simulations of the urban model can also give a quantitative picture of the effects of a UGB. The simulation presented by Brueckner (2001) portrays a city of 2 million people that has a radius of 30.8 miles in the absence of government intervention. The government then imposes a draconian UGB that forces the city to contract to a radius of 15 miles. In response, the price per square foot of housing rises by about 15% in all locations, and population densities rise by about 75%. The UGB imposes a welfare cost per household of US $2,950, equal to about 7% of income (assumed to be US $40,000). Compared with estimates of welfare losses from other government interventions (e.g., taxes on capital and labor), this is a very large loss.
To empirically isolate the effect of an FAR limit on housing prices and other variables is also difficult. Numerical simulations, however, can once again provide some evidence. Bertaud and Brueckner (2004, 2005) analyze a city of 2 million people that has an FAR value of 17.5 at the city center, implying a building height of about 30 stories, in the absence of government intervention. A draconian FAR limit of 3.75 is then imposed, which restricts buildings to about 8 stories. In response, the price per square foot of housing rises by about 30% throughout the city, and the city’s radius expands from 21.4 to 23.5 miles. In the new equilibrium, the FAR limit is binding out to a distance of 11.7 miles, beyond which FAR values drop below 3.75. Bertaud and Brueckner (2005) show theoretically that the consumer welfare loss from the FAR limit can be measured by the increase in commuting cost for a household living at the edge of the city. In the simulation this increase equals US $945 a year, or about 2% of household income (set at US $42,150).
Using these numerical results, Bertaud and Brueckner (2005) calculate the wel-fare loss generated by the very tight FAR restriction in Bangalore, which limits FAR values to about 1.5. This calculation requires an estimate of Bangalore’s spatial expansion in response to the FAR limit, which can then be used to compute the extra commuting cost for an edge resident. Using the numerical simulation results as a guide in estimating the expansion, and drawing on Indian data on the cost of intracity travel, Bertaud and Brueckner (2005) estimate that the FAR limit gener-ates an annual welfare loss per household of between 700 and 2,100 rupees, which represents between 1.5 and 4.5% of income. Once again, this welfare impact is large compared with impacts from other government interventions in the economy.
1.3.2 The Quantitative Effects of Other Land Use Interventions
Malpezzi and Mayo (1997), in their analysis of cost-increasing land use regulations in Malaysia, are able to generate a precise numerical estimate of the impact on cost
171 Government Land Use Interventions: An Economic Analysis
per dwelling. The authors focus on a representative dwelling with a delivery cost of about 28,000 Malaysian dollars. Malpezzi and Mayo attribute 4,000 Malaysian dollars of this amount to the effects of cost-increasing government regulations, a share of about 14%.
A number of papers take more systematic empirical approaches to measuring the effects of land use regulation, focusing mainly on US housing markets. One approach is to use land use regulation surveys, which ask local government officials to enumerate the regulations they employ, to generate a count of the regulations in place in various cities. This count index provides a measure of regulatory strin-gency, which can be used in a regression analysis to explain differentials in housing prices in a sample of cities.
This approach is followed by Ihlanfeldt (2007), Quigley and Raphael (2005), and Glaeser and Ward (2009). In Ihlanfeldt’s paper, which uses a Florida sample, the list of regulatory measures includes farm preservation policies, development impact fees, large lot zoning, open space zoning, population caps, environmental preserva-tion zoning, urban service boundaries, building permit limits, and a number of other policies. Ihlanfeldt’s results show that when the count index for a city increases by one, indicating that the city is using an additional policy from the list, its single-fam-ily home prices increase by 8%. Using an analogous regulatory index in a sample of California cities, Quigley and Raphael (2005) find that adding one extra regulatory policy in a city raises the price of owner-occupied housing by 3–4.5% and rents by 1.5–2.3%. Glaeser and Ward (2009), using a Massachusetts sample, find that an additional regulatory policy in a city raises owner-occupied housing prices by 10%. Although these estimates differ somewhat in size, they provide a similar picture and confirm the effect of land use regulation on housing prices.
Several other studies are based on regulatory indexes that are computed in a less transparent fashion but again use detailed information on city-level policies. In a study of regulatory impacts in Maryland , Pollakowski and Wachter (1990) find that an increase in their index of zoning stringency raises owner-occupied housing prices. Their results also show that, because of spillover effects, housing prices rise when zoning stringency increases in nearby areas. Malpezzi, Chun, and Green (1998) study the impact of land use regulation in a national sample of US cities. The results show that when their regulatory index increases from a value at the top of the first quartile to the top of the third, owner-occupied housing prices rise by 32–46% and rents by 13–26%.
Another group of studies focuses on the effect of land use regulation on housing supply, again using various regulatory indexes. Mayer and Somerville (2000), using data from a panel of US cities, show that an increase in a count index of regula-tory policies leads to a decline in housing permits. Quigley and Raphael (2005) find that an increase in their count index leads to smaller growth in the housing stock during 1990–2000 in their sample of California cities. Levine (1999), using the same California regulatory index, shows that an increase in the index reduces a city’s 1990 housing stock for a given size of the stock in 1980. Finally, Green, Malpezzi, and Mayo (2005) estimate the elasticity of housing supply for each of 45 US metropolitan statistical areas and then regress this variable on a number of
18 J. K. Brueckner
measures thought to be determinants of the supply elasticity. A regulatory index is one of these variables, and the regression results show that a higher index depresses the supply elasticity.
A final approach to analyzing the effect of land use regulations is indirect. Rather than relying on a measure of regulatory stringency, this approach focuses on the gap between house prices and construction costs. The approach attributes a large size for this gap to the supply-reducing effect of land use regulations (see Glaeser, Gyourko, & Saks, 2005).
1.4 Motivations for Land Use Interventions
Both the theoretical analysis of land use interventions in Sect. 1.2 and the empirical literature discussed in Sect. 1.3 focus on the effects of interventions while abstract-ing from the motives behind them. Since land use interventions may be motivated by an expectation of social benefits, a complete analysis must explore the sources of social benefits and whether the interventions actually produce the expected gains.
1.4.1 Motivations for Urban Growth Boundaries
Imposition of an urban growth boundary can be justified if urban expansion involves particular kinds of market failures. Suppose that the reduction in open space surround-ing a city, a consequence of urban spatial expansion, generates a social loss for the city’s residents, all of whom are assumed to be environmentally sensitive. 5 This loss must then be considered part of the cost of urban development, over and above the agricultural land rent that is forgone when development occurs. As a result, in deter-mining the socially optimal spatial size for the city, urban land rent r must be set equal to the agricultural opportunity cost r a plus an amount equal to the per-acre amenity value of open space. Since urban rent then exceeds r a at the optimal urban boundary, the situation is like that shown in Fig. 1.1a, with the optimal boundary in a position like x ugb , closer to the center than the free market boundary x * . As a result, the optimal spatial size for the city can be generated by an appropriately chosen UGB, although a development tax set equal to the land’s amenity value works equivalently. 6
5 For recent attempts to measure the benefits of open space, see Santerre and Bates (2001), Chesh-ire and Sheppard (2002), and Walsh (2007). Such studies usually attempt to measure the benefits of parks and other open space near residences, not the benefits from open space on the urban fringe. If consumers care only about the first type of open space, the environmental logic of UGBs (which are meant to make the urban fringe closer on average to households) is undermined. 6 UGBs may also be motivated by infrastructure cost considerations. If housing developers are not charged for the full cost of the infrastructure required by their projects, development appears to be artificially cheap and the city overexpands (see Brueckner, 2001). While impact fees (which levy appropriate infrastructure charges) are the best remedy for this distortion, UGBs can also restrain a city’s tendency toward excessive spatial growth.
191 Government Land Use Interventions: An Economic Analysis
This kind of environmental rationale appears to partly motivate the well-known UGB in Portland, Oregon, and it may help explain the UGBs in Korea and in the United Kingdom. If the motivation described above is accurate, a UGB produces social benefits from the preservation of open space that may offset the losses from the resulting increase in housing prices (recall Fig. 1.1b), leaving urban residents better off. However, if the supposed environmental gains are not perceived by con-sumers or are felt by only a small share of the population, the losses from the UGB will not be balanced by offsetting benefits, making urban residents as a whole worse off. This possibility reflects the potential danger of allowing urban land use policy to be set on the basis of principles (environmental or otherwise) that may not be widely shared in the population. 7
A less benign view of the motivations for UGBs comes from the theoretical literature on urban growth controls, which is surveyed by Brueckner (1999). This literature portrays the owners of urban land as attempting to enrich themselves by restricting the amount of land available for development through a UGB. To under-stand this rent seeking motive, recall that total urban land rent (and thus the income of landowners) rises when a UGB is imposed, as long as the UGB does not restrict the spatial size of the city too severely. Although the model used above, which assumes that landowners live outside the city, does not provide a realistic setting for the rent seeking scenario, Brueckner and Lai (1996) provide a more accurate picture. In their model, the city contains homeowners who collectively own all the city’s land (including the portion occupied by renters), and they attempt to increase the value of their property by limiting the land made available for development. This outcome is, of course, socially undesirable.
It is difficult to ascertain which view of the motivations for UGBs (environmen-tal or rent seeking) describes the actual reasons behind their use. However, even when the benign environmental view is appropriate, the potential for misuse of UGBs in the service of a minority viewpoint certainly exists. Thus a concern is that, on average, the use of UGBs may not be socially beneficial.
1.4.2 Motivations for Floor Area Ratio Limits
As noted, the FAR limits that prevail in Washington, D.C. and Paris are aesthetically motivated. The Washington limit, which requires that no building in the District of Columbia be taller than the US Capitol, is meant to showcase the city’s histori-cal buildings and monuments, while the Paris limit is meant to preserve the city’s unique character and ambience, possibly with an eye toward maintaining its tourist appeal. As explained, theory predicts that these FAR limits raise housing prices and
7 In contrast to the environmental motivation for a UGB, which has a logical basis, a UGB ration-ale based on farmland preservation is illegitimate. The reason is that the agricultural rent r a (which is forgone as a result of urban development) fully signals the scarcity of land in its food produc-tion role, which leads to socially correct decisions on conversion of the land in the absence of any market failures.
20 J. K. Brueckner
thus reduce the standard of living in the two cities. It is impossible to judge whether the associated aesthetic benefits justify these losses.
The draconian FAR limits imposed in Indian cities evidently are partly rooted in the subjective views of their city planners, who are reputed to dislike high urban densities. But a more practical concern related to urban infrastructure apparently plays a more significant role. The higher population densities that would emerge with looser FAR limits might require substantial upgrading of urban infrastruc-ture—including roads, gas mains, and sewerage lines—at a high cost. Avoidance of these higher infrastructure costs evidently is a key reason that Indian planners impose tight FAR restrictions. While this kind of calculation may look sensible, it ignores the overall impact of an FAR limit on the urban equilibrium, which involves a greater spatial size for the city along with higher densities in the areas in which the limit is not binding (recall Fig. 1.2a). Since both effects impose additional infra-structure needs away from the city center, it is not clear that a city lowers its overall investment requirements by imposing an FAR limit.
Thus, as in the case of a UGB, the potential offsetting benefits of an FAR limit are uncertain, making it hard to argue that the costs of a limit are worth incurring. As a result, it seems likely that the severe FAR limits observed in some cities are not socially desirable.
1.4.3 Motivations for Other Policies
Among the other land use interventions considered, Moscow’s inverted density pattern seems to be the simple result of poor land use decisions by Soviet bureau-crats, not the result of a conscious policy pursued to secure particular benefits. A benevolent motivation was obviously absent as well in South Africa’s apartheid land use intervention, a reprehensible policy designed to serve the goals of a racist government.
By contrast, the cost-increasing land use interventions discussed are consciously designed to improve land use from the perspective of urban planners. For example, the street width requirement imposed in Malaysian housing developments obviously reflected the planners’ view that wide streets increase the pleasantness of a residen-tial area. Similar regulations, both in Malaysia and around the world, are motivated by analogous planning standards. The question, of course, is whether the gains in livability that result from such regulations are worth the higher costs, and thus the higher housing prices, that they generate. If the answer is yes, another question arises: if consumers do indeed value particular residential features more than the cost of providing them, why is any government intervention needed? Profit-maximizing developers would presumably provide such features on their own without any need for regulations directing them to do so. While the market can thus be trusted to pro-vide residential features that are worth their cost, the danger is that well-meaning government interventions may lead to the opposite outcome, requiring developers to provide residential features that cost more than they are worth to consumers.
211 Government Land Use Interventions: An Economic Analysis
1.5 Land Use Interventions and Business Productivity
While the discussion so far has focused on the effects of land use interventions on consumers, the effects on firms may also be important. One type of impact, which operates through the cost of real estate inputs, emerges from extending the analysis of Sect. 1.2. That analysis shows that various land use interventions can be expected to raise the price per square foot of housing for consumers. Although the model does not consider business land use, assuming for simplicity that all jobs are con-centrated at a point in space (the city center), a more realistic model would depict a city with both business and residential areas. In such a model land use interventions such as a UGB or FAR limit would raise the cost of real estate for both consumers and businesses, putting upward pressure on the price per square foot for both types of floor space. The resulting cost increase for businesses could generate a number of secondary effects, such as an escalation of firms’ output prices along with a poten-tial decline in wages.
A new line of research suggests another avenue by which land use interventions might affect business operations. This research, part of the literature on the new economic geography, identifies a connection between the density of employment in a city and the productivity of its workers. This connection arises through agglom-eration economies, under which high densities foster interfirm interactions, which may raise productivity through a number of channels. These channels include more vigorous exchanges of knowledge between firms in dense environments as well as better matching of workers and jobs in areas with specialized, dense labor markets. Two studies using US data provide evidence for such an effect. Ciccone and Hall (1996) show that output per worker rises with employment density, while Carlino, Chatterjee, and Hunt (2007) show that patents per capita in a city (a measure of intellectual output) rise as the density of employment increases.
These findings suggest that government land use interventions designed to reduce densities may have a negative effect on firm productivity. For example, dra-conian FAR limits like those in India, by reducing both residential and employment densities, may make Indian firms less productive. Thus, the higher real estate costs due to density restrictions may be accompanied by a more fundamental negative impact on worker productivity. This conclusion reinforces the message of Sect. 1.4: since the unanticipated negative effects of government land use interventions may extend beyond consumers, affecting firms as well, a moderate approach that avoids draconian interventions is preferable.
1.6 Conclusions
The analysis in this chapter points to a potential pitfall in government land use interventions. Well-meaning interventions that cause land use outcomes to diverge substantially from free market outcomes run the risk of generating net social losses. The problem is that the expected benefits from large interventions may be swamped
22 J. K. Brueckner
by unanticipated losses, which may be overlooked by government officials who act with an incomplete understanding of the operation of real estate markets.
Despite this view, government interventions that are designed to foster orderly urban development are useful. Western-style zoning laws, whose main purpose is to segregate different land uses with the goal of limiting negative externalities, are beneficial. However, to avoid creating artificial scarcities, such zoning laws must respond to market forces in determining the overall allocation of land to residential, commercial, and industrial uses. In addition, the density regulations (including FAR limits) that are usually part of zoning ordinances can foster orderly land use by ensuring uniformity of development in an area. Ideally, however, such regulations should approximately match the area’s free market densities, serving more as a guide to development than as a binding constraint. Similarly, urban growth boundaries can play a beneficial role to the extent that they discourage scattered, noncontigu-ous development rather than serving as binding limits on the total amount of land available for conversion to urban use. Generally, government land use interventions that are designed to guide development rather than fundamentally diverting it from a free market path are likely to be socially beneficial. Draconian interventions, how-ever, may lead to a decline in social welfare.
Acknowledgments The author thanks Vernon Henderson, Gregory Ingram, and the other par-ticipants in the preconference workshop for helpful comments.
References
Alonso, W. (1964). Location and land use . Cambridge, MA: Harvard University Press. Arnott, R. J., & MacKinnon, J. G. (1977). Measuring the costs of height restrictions with a general
equilibrium model. Regional Science and Urban Economics , 7 (4), 359–375. Au, C. C., & Henderson, J. V. (2006). How migration restrictions limit agglomeration and produc-
tivity in China. Journal of Development Economics , 80 (2), 350–388. Bertaud, A., & Brueckner, J. K. (2004). Analyzing building-height restrictions: Predicted impacts,
welfare costs, and a case study of Bangalore , India . Policy Research Working Paper 3290. Washington, DC: World Bank.
Bertaud, A., & Brueckner, J. K. (2005). Analyzing building-height restrictions: Predicted impacts and welfare costs. Regional Science and Urban Economics , 35 (2), 109–125.
Bertaud, A., & Malpezzi, S. (2001). Measuring the costs and benefits of urban land use regula-tion: A simple model with an application to Malaysia. Journal of Housing Economics , 10 (3), 393–418.
Bertaud, A., & Malpezzi, S. (2003). The spatial distribution of population in 48 world cities: Implications for economies in transition . Madison, WI: University of Wisconsin, School of Business.
Brueckner, J. K. (1996). Welfare gains from removing land-use distortions: An analysis of urban change in post-apartheid South Africa. Journal of Regional Science , 36 (1), 91–109.
Brueckner, J. K. (1999). Modeling urban growth controls. In A. Panagariya, P. Portney, & R. M. Schwab (Eds.), Environmental and public economics: Essays in honor of Wallace E. Oates (pp. 151–168). London: Edward Elgar.
Brueckner, J. K. (2001). Urban sprawl: Lessons from urban economics. In J. R. Pack & W. G. Gale (Eds.), Brookings Wharton Papers on Urban Affairs (pp. 65–89). Washington, DC: Brookings Institution Press.
231 Government Land Use Interventions: An Economic Analysis
Brueckner, J. K., & Lai, F.-C. (1996). Urban growth controls with resident landowners. Regional Science and Urban Economics , 26 (2), 125–144.
Carlino, G. A., Chatterjee, S., & Hunt, R. M. (2007). Urban density and the rate of invention. Journal of Urban Economics , 61 (3), 381–419.
Cheshire, P., & Sheppard, S. (2002). The welfare economics of land use planning. Journal of Urban Economics , 52 (2), 242–269.
Ciccone, A., & Hall, R. E. (1996). Productivity and the density of economic activity. American Economic Review , 86 (1), 54–70.
Glaeser, E. L., Gyourko, J., & Saks, R. (2005). Why is Manhattan so expensive? Regulation and the rise in housing prices. Journal of Law and Economics , 48 (2), 331–369.
Glaeser, E. L., & Ward, B. A. (2009 ). The causes and consequences of land use regulation: Evi-dence from Greater Boston. Journal of Urban Economics, 65(3), 265–278 .
Green, R. K., Malpezzi, S., & Mayo, S. K. (2005). Metropolitan-specific estimates of the price elasticity of housing, and their sources. American Economic Review, Papers and Proceedings , 95 (2), 334–339.
Green, R. K., Malpezzi, S., & Vandell, K. (1994). Urban regulations and the price of land and housing in Korea. Journal of Housing Economics , 3 (4), 330–356.
Hannah, L., Kim, K.-H., & Mills, E. S. (1993). Land use controls and housing prices in Korea. Urban Studies , 30 (1), 147–156.
Ihlanfeldt, K. R. (2007). The effect of land use regulation on housing and land prices. Journal of Urban Economics , 61 (3), 420–435.
Kim, K.-H. (1993). Housing prices, affordability, and government policy in Korea. Journal of Real Estate Finance and Economics , 6 (1), 55–71.
Levine, N. (1999). The effects of local growth controls on regional housing production and popula-tion distribution in California. Urban Studies , 36 (12), 2047–2068.
Malpezzi, S., & Mayo, S. K. (1997). Getting housing incentives right: A case study of the effects of regulation, taxes, and subsidies on housing supply in Malaysia. Land Economics , 73 (3), 372–391.
Malpezzi, S., Chun, G. H., & Green, R. K. (1998). New place-to-place housing price indexes for U.S. metropolitan areas and their determinants. Real Estate Economics , 26 (2), 235–274.
Mayer, C. J., & Somerville, T. (2000). Land use regulation and new construction. Regional Science and Urban Economics , 30 (6), 639–662.
Mayo, S., & Sheppard, S. (2001). Housing supply and the effects of stochastic development con-trol. Journal of Housing Economics , 10 (2), 109–128.
Mills, E. S. (1967). An aggregative model of resource allocation in a metropolitan area. American Economic Review , 57 (2), 197–210.
Muth, R. F. (1969). Cities and housing . Chicago: University of Chicago Press. Pollakowski, H. O., & Wachter, S. M. (1990). The effects of land-use constraints on housing prices.
Land Economics , 66 (3), 315–324. Quigley, J. M., & Raphael, S. (2005). Regulation and the high cost of housing in California. Ameri-
can Economic Review, Papers and Proceedings , 95 (2), 323–328. Renaud, B., & Bertaud, A. (1997). Socialist cities without land markets. Journal of Urban Eco-
nomics , 41 (1), 137–151. Santerre , R. E., & Bates, L. J. (2001). The public demand for open space: The case of Connecticut
communities. Journal of Urban Economics , 50 (1), 97–111. Son, J.-Y., & Kim, K.-H. (1998). Analysis of urban land shortages: The case of Korean cities.
Journal of Urban Economics , 43 (3), 362–384. Walsh, R. (2007). Endogenous open space amenities in a locational equilibrium. Journal of Urban
Economics , 61 (2), 319–344. Wheaton, W. C. (1974). A comparative static analysis of urban spatial structure. Journal of Eco-
nomic Theory , 9 (2), 223–237.

“This page left intentionally blank.”
25
Developing countries, unlike most developed ones, may have a large informal hous-ing sector that exists outside the formal sector and outside direct regulation. At the extreme it may involve squatter settlements on invasions of land that originally might have been owned by the government or subject to title dispute. However, it may also involve illegal developments of private land, where the houses constructed do not meet regulatory standards and the properties sold may offer limited property rights over the housing and none over the land. The government may be politically unable to shut down the informal sector, and poor institutions may leave signifi-cant portions of urban land without proper title. While the informal sector avoids direct land use regulation, the local government may attempt to indirectly regulate the scope of its development by not providing it with certain public infrastructure services (such as connections to general road, water, and sewerage systems) or by threatening the tenure security of residents.
Economic outcomes from regulations commonly studied include the effects on housing prices, construction costs, and housing supply, effects that may vary by income group. But regulatory effects on local housing supply and prices may have intended or unintended effects on community population sizes and income com-position or on national and regional labor markets. Communities may use land use regulations as a way of restricting population growth or excluding lower-income migrants. There is a political economy of how these regulations arise.
To explore these issues, I start by reviewing the economics literature on the effects of regulations. I discuss the conceptual bases for regulation in the literature and then turn to empirical findings. Much of this literature examines developed countries. This is in part because there are excellent data in some countries, such as the United States, covering not just regulations but also construction costs, housing sales and rental prices, housing attributes, and counts of building permits (new sup-ply) across cities and time. While the recent US literature on land use regulations
S.V. Lall et al. (eds.), Urban Land Markets, DOI 10.1007/978-1-4020-8862-9_2, © World Bank 2009
Chapter 2The Effect of Residential Land Market Regulations on Urban WelfareJ. Vernon Henderson
J. V. Henderson ( )Department of Economics Brown University Providence, RI 02912, USAe-mail: [email protected]
26 J. V. Henderson
does not attempt to differentiate effects across income groups, a literature on the Republic of Korea, Malaysia, and Thailand does examine the effects of direct land use regulation on housing prices facing lower-income populations. There is almost no empirical literature on the political economy of land use regulations, despite the existence of a theoretical literature that captures the key effects in developed coun-tries. The empirical literature treats land use regulations as exogenous—in essence, as varying randomly across US cities. Finally, this literature covers only direct land use regulations, not issues of supply restriction due to poor institutions and lack of public infrastructure provision.
Following the literature review, I outline a conceptual framework relating to the political economy of indirect land use regulation in developing countries and exam-ine some of its implications in the context of Brazil. Informal markets are a major source of urban housing for migrants in many countries; as unregulated markets, they may supply housing fairly elastically, as Antwi and Adams ( 2003 ) argue for Ghana. However, local governments may use indirect land use regulation to try to limit population in-migration and affect the income composition of communities. I argue that this has occurred over recent decades in Brazil. I examine how indirect and direct land use regulations in Brazil have affected the living conditions of dif-ferent income groups and a variety of aspects of the housing market. I also look at what types of communities in Brazil impose certain types of regulations.
2.1 The Literature
In this section I start with a discussion of conceptual, textbook frameworks used to analyze the bases for land use regulations. Then I turn to the framework used to ana-lyze the effects of direct regulations on housing outcomes in the empirical literature, and summarize key findings in the recent literature.
2.1.1 Why Do We Have Land Use Regulations?
Land and housing market regulations have two bases in economics. An initially articulated basis involves neighborhood externalities (see e.g., Davis & Winston, 1964 ). In this context regulations, if properly applied, enhance economic welfare. Types of regulations include the following:
• Land use planning is and typically implemented through land use zoning and segments land uses so that, for example, residential uses are separated from industrial, “obnoxious” uses. This protects residents from noise and other pol-lution and places industrial areas near transport nodes or corridors. Such plan-ning can be made flexible through variances granted by zoning boards, hopefully through open, transparent processes. While planning may prohibit a gas station from locating in a residential neighborhood, a variance may be granted if the gas
272 The Effect of Residential Land Market Regulations on Urban Welfare
station owner can persuade the immediate neighbors affected by the obnoxious use to agree (perhaps with inducements) to the location.
• Density and open space regulations —including minimum lot size, setback and frontage standards, height restrictions, and land set-aside standards—are designed to deal with neighborhood crowding or congestion, ensure sufficient open space, and regulate impediments of building views and access to sunlight.
• Developer requirements for infrastructure help ensure adequate feeder roads, sewage disposal, and the like, so that developers do not free ride on public roads (as in strip development).
• Construction regulations set minimum quality standards with a regime of inspec-tions. These may help with problems of asymmetric information, such as when consumers may be unable to discern whether reasonable standards have been met or may not know what constitutes reasonable standards.
• Health and environmental standards include, for example, restrictions on the use and specifications of septic systems and the use of wetlands.
There is little empirical literature evaluating the appropriateness of externality-based land use regulations. Conceptually, this field of analysis falls between eco-nomics and urban planning, with little interchange between the two. Most of the recent empirical literature in the United States assumes that regulations are gener-ally excessive and too costly.
A first step is to study the different forms that regulations take, so as to learn about their unintended effects as well as their intended ones. Regulations often are crudely set. Bertaud and Brueckner ( 2005 ) examine the effect of building height restrictions in Mumbai. A uniform height restriction in a metropolitan area tends to lower heights in the center of the city, where land use would usually be most intense, and raise them at its edge. One calculation suggests that Mumbai’s city edge is much farther out than it would be without a uniform height restriction. While a height restriction can be externality based, it needs to be tailored to each neighborhood’s needs and market circumstances.
A second part of evaluating the appropriateness of regulations would account for the fact that standards and regulations are very costly not just because of their specific restrictions but because of the need to have inspection and permitting proc-esses with rights of appeal. The inspection, permitting, and appeal processes them-selves cost money and can also impose long delays on projects. Setting regulations to deal with housing, neighborhood, and environmental externalities involves trade-offs between the welfare gains from better regulating externalities and the costs of the regulations.
The second basis for regulation is exclusionary zoning. Exclusionary regulations are used to protect the interests of existing residents, who want to regulate the flow of people into their community, and may therefore not be welfare improving for the society as a whole. There are two aspects to exclusion. The first relates to a situa-tion in which a community has special natural amenities and public services. People may crowd into that community to take advantage of these amenities. That can lead to high levels of congestion and other diseconomies, reducing the welfare of exist-ing residents. Restricting inflows will then be optimal from the point of view of
28 J. V. Henderson
existing residents. However, restrictions have general equilibrium effects in terms of where the overall population lives. They force new residents into less desirable communities and for the society as a whole may be welfare reducing relative to no regulations. 1
The second, and more common, basis given for exclusionary zoning is strati-fication of the population by income into different communities, for the purposes of consuming local public goods. Epple and Nechyba ( 2004 ); Helsley ( 2004 ) have excellent reviews of the rationale for stratification, based on the Tiebout model. In this framework richer communities will want to exclude lower-income entrants because of fiscal externalities. Lower-income entrants who consume local public services would typically pay less than average local taxes and thus would be a tax burden for existing residents. In addition, they might influence voting outcomes and the level of public goods away from that desired by high-income people. Such exclusion and stratification of the population in a Tiebout world is efficient: each community gets to consume its desired levels of public services, which are likely to be income elastic. However, peer group effects and notions of equality or toler-ance as an argument in preferences generally alter the efficiency of the stratification result.
Exclusionary measures in land use regulation can take two general forms (see, e.g., the papers in Mills & Oates, 1975 ). The first are quantitative regulations that set minimum lot sizes, building height restrictions, and open space allocations. These can restrict the number of new housing units constructed in a community, limiting total population. They can also effectively set minimum housing consump-tion levels that are nonbinding for high-income people but exceed what lower-income people can afford, thus excluding them. The second are regulations that make all housing more expensive through costly permitting procedures. These raise construction costs for new housing, making the community less attractive to any in-migrants.
The exclusionary zoning literature is based to a large extent on the US experi-ence. Developing countries present an additional feature that may rule out straight-forward exclusion. Courts, politics, policing, and lack of land titling and property rights create an institutional environment that permits informal housing markets
1 This can be illustrated by a simple example, based on a simplified version of Flatters, Henderson, & Mieszkowski ( 1974 ). In a two-region country, suppose that region 0 has an inverted-U real wage function (see Sect. 2.2) w 0 ( N N 0 ), where N is the national population of identical people and N 0 is the population in region 0. Region 1 has a corresponding function but for any equal size has lower productivity. An optimal allocation of population in which real incomes are equalized across regions and S is the subsidy (positive or negative) received by people in region 0 solves the problem max w0(N − N1)+ S + λ{w0(N − N1)+ S − [w1(N1)− S(N − N1)/N1]}
.
An optimal allocation can be shown to satisfy 0 1 0 0 1 1( ) ( ) ( ( )) ( ( ))w w N w N w⋅ − ⋅ = − ⋅ − − ⋅′ ′ , so that the
gap in real wages between the two regions equals the gap in congestion, or the gap in the popula-tion externality. For example, if ′ ⋅ = ⋅w w1 10( ) , ( )so
is flat, then ′ ⋅ <w0 0( )
and wages in region 0
exceed those in region 1 by the marginal congestion externality in region 0; and there are transfers from region 0 to 1 to equalize incomes. A free-migration equilibrium would have more people in region 0 such that w w0 1( ) ( )⋅ = ⋅
. Without transfers, if region 0 strategically restricts population, it
would have less population and would be at the peak of its inverted U, where ′ ⋅ =w0 0( ) .
292 The Effect of Residential Land Market Regulations on Urban Welfare
to operate outside regulatory procedures. If regulations are set excessively, people operate outside the formal housing market—instead operating in the informal hous-ing market, where such regulations are ignored. Being in the informal sector may limit access to public infrastructure and necessitate higher-priced private alterna-tives. The prospect that formal regulations, if set too harshly, may have limited effectiveness complicates the standard analysis of exclusion, as shown in Sect. 2.2.
2.1.2 What Are the Direct Effects of Land Use Regulations?
There has been a resurgence in the economics literature on the costs of land use regulations in the past 5 years. This has been led by Glaeser, Gyourko, and Saks (2005a, 2005b), building on earlier US work by such researchers as Malpezzi ( 1996 ). As noted, this literature starts with a presumption that regulations are bad and impose costs. I focus on the US-based literature to start because it is the most sophisticated. This literature covers issues that arise everywhere and suggests ave-nues for research in developing countries. I also look at a slightly older literature by Mayo and coauthors, from 1996 to 1997, that follows an approach similar to aspects of the US literature in examining the costs of direct regulations in Korea, Malaysia, and Thailand. Unlike the recent US literature, this literature distinguishes effects for low-income consumers.
2.1.2.1 Implied Effects of Regulation
Glaeser et al. ( 2005a ) explore aspects of regulation that define critical issues as well as the increasing role of regulation in housing markets in the United States. While real construction costs remained stable over the 30 years from 1970 to 2000, housing prices rose, suggesting that regulation was driving up the cost of acquir-ing land along with the permission to build on it. This rise was very uneven across cities.
Table 2.1 shows the first point. Until 1970 housing price increases tended to reflect construction cost increases. From 1970 to 2000 real construction costs did
Table 2.1 Change in mean real housing prices and construction costs in selected US markets, 1950–2000 (percent)
1950–1960 1960–1970 1970–1980 1980–1990 1990–2000Housing pricesa 23.8 9.2 36.0 10.4 14.6Construction costs
per square footb17.7 8.7 2.8 –3.2 –2.7
Source: Glaeser et al., 2005a, Table 1, p. 226a 316 metropolitan areasb Modest, single-story house; 177 market areas
30 J. V. Henderson
not increase; in fact, they declined by about 3%. In contrast, housing prices rose substantially in each decade, with a cumulative rise of 72% over the 30 years.
The unevenness of the price rise across cities may reflect different degrees of local regulation. While the mean real housing price rose by 72% over the 30-year period, the standard deviation across metropolitan areas rose by 247% (Glaeser et al., 2005a ). Between 1950 and 2000, among the 50 largest metropolitan areas in 1950, average annual real price growth in the top 10 areas (ranked by price rise) ranged from 2.12 to 3.53%, while in the bottom 10 it ranged from 0.535 to 1.13% (Gyourko, Mayer, & Sinai, 2006 ). As a result of the cumulative growth over the 50-year period, the 2000 real price in the top city was 5.84 times the 1950 price, while in the bottom city it was 1.3 times the 1950 price.
Further suggestive of regulation, the response of supply to price has changed dramatically over time. Pooling data across 102 metropolitan areas for the 1960s, 1970s, 1980s, 1990s, and 2000s, after controlling for metropolitan area density and income, Glaeser et al. ( 2005a ) show that in the 1960s and 1970s increases in the ratio of price to construction cost were associated with strong increases in new residential construction—a strong positive supply elasticity. However, by 2000 that overall supply response to increased prices had fallen to zero.
A final piece of the puzzle hints at what may be driving this increased regula-tion. Gyourko, et al. ( 2006 ) argue that there are a set of about 20 “superstar” cities (e.g., Boston and San Francisco) that had both very large housing price increases and very small growth in housing units in 1980–2000. These superstar cities have also seen an increase in the share of higher-income families in their population. Poorer families have been priced out of the market and have moved out; richer families have moved in. As the number of rich families has increased nationally over time, the price premium in superstar cities has grown, along with the influx of rich to these cities, which tend to be in California and on the eastern seaboard. In contrast, a set of middle American cities (e.g., Brownsville, Las Vegas, and Phoenix) have grown rapidly, with little price increase and, typically, an income distribution heavily concentrated in the middle to low range. Gyourko et al. ( 2006 ) show that this is consistent with a model of high-amenity cities that impose regula-tions to limit entry and skew the population toward the highest-income households so as to enhance the welfare of the resident population. (The analysis in Sect. 2.2 starts with this premise.)
The literature argues that the price rise is due to increased regulation. But price increases could just reflect the “natural” scarcity value of land. In superstar cities, for example, the amount of developable land may be exhausted. In fact, Gyourko et al. ( 2006 ) model superstar cities as having a fixed number of dwelling units, whether because of pure scarcity or regulation. But while San Francisco, for exam-ple, has a limited capacity, a general view is that capacity has not been reached, or even necessarily strained, in land use or in the potential to increase (within reason-able limits) density and building heights. The perception is that the scarcity is cre-ated by regulation. This perception is based on two ways of measuring the effect of regulation on housing prices: through direct calculations and through indirect, econometric analysis.
312 The Effect of Residential Land Market Regulations on Urban Welfare
2.1.2.2 Direct Calculations: Effects of Regulations on Prices
In the recent US literature direct calculations treat the cost of regulation as a resid-ual—the unexplained increase in prices beyond construction costs and consumer valuation of land. In the literature on Malaysia the costs are calculated from physi-cal specification data given regulations.
For direct calculations Glaeser and Gyourko ( 2003 ) use city-by-city hedonic regression equations in which they estimate the shadow value of additional land to residential consumers—the value to consumers at the intensive margin of increas-ing lot size. If land is effectively divisible given new housing formation and urban redevelopment, the hedonic price should reflect the market value of land. (This notion ignores the fact that there is a fixed cost in producing a serviceable lot of any size that involves, for example, water and sewerage connections; and that is ignored in the hedonic shadow price of an additional unit of land for an existing lot.) In the empirics this shadow valuation varies enormously across cities. The cost of regula-tion is calculated as the difference between reported house value and the sum of construction costs (replacement costs specific to each house) plus the shadow valu-ation of land. While the details of calculations are debatable, in so-called superstar cities there are huge calculated costs of regulation. 2
In a related exercise Glaeser, Gyourko, and Saks (2005c) look at the costs of building height regulation in Manhattan. They compare the average cost per square foot of adding space (a floor) to a building with the market price per square foot of apartment space. The real construction cost at the high end of the market has remained at about US $300 per square foot over the past 20 years. The market price rose from US $373 in 1984 to US $621 in 2002—a huge increase that the authors attribute to artificial scarcity resulting from building height regulations.
In three papers on Malaysia, with some information on Korea and Thailand, Malpezzi and Mayo ( 1997 ); Mayo and Sheppard ( 1996 ); Bertaud and Malpezzi ( 2001 ) examine regulations in the Malaysian housing market. In addition to ethnic quotas (set-asides for ethnic Malays) and certain financial interventions, the market in the early 1980s was highly regulated, with excessive road area requirements, a large setback requirement, minimum lot size zoning, and requirements for the construction of community facilities. There were also lengthy approval processes for construction. In high-density developments in Malaysia only about 40–45% of the land under development was saleable in the 1980s. In general, say in (regulated) Europe, the saleable share is about 65%.
The papers argue that restrictions are costlier for lower-income families. Middle-income families may demand, and willingly pay for the setbacks and some of the extra roads (such as back alleys). For lower-income families some restrictions may be “forced consumption,” raising the land costs of housing. Bertaud and Malpezzi ( 2001 )
2 These calculations are used in Glaeser and Gyourko ( 2003 ) to show that the fraction of houses in a community for which price exceeds 140% of construction cost increases with the number of months it takes to issue a permit on a rezoning request—an indication that these price-cost diver-gences are indeed due to regulation.
32 J. V. Henderson
calculate that if restrictions on setbacks and roads were loosened so that 55% (rather than just 40–45%) of the land became saleable in high-density developments in Malay-sia, this would raise the ratio of the profitability of low-income housing to that of mid-dle-income housing from 0.85 to 1.17. That is, it would shift the incentive away from supplying middle-income housing and toward supplying low-income housing, which was in short supply in the mid-1980s as a result of the housing market restrictions. In part because of this research, many of these restrictions have since been lifted.
Several studies (Kironde, 2005 ; Malpezzi & Sa-Aadu, 1996 ; Wu, 2004 ; Zhu, 2005 ; Sivam, 2002 ) similarly argue that land and housing market restrictions dis-proportionately affect costs for lower-income people in formal housing markets in parts of Africa and in China and India. However, the overall effect on low-income consumers, usually migrants, is not necessarily to raise the housing prices they actu-ally pay but to force them into informal housing markets. In the informal sector, while housing may be elastically supplied at low cost, there may be a lack of public services as well as negative spillovers from these poor public services. These issues are discussed in Sect. 2.2.
2.1.2.3 Econometric Evidence: Effects of Regulations on Prices and Supply Elasticities
The second approach identifies econometrically the effects of regulations on prop-erty values, housing supply, or both. The typical framework for a community is given by the following equations:
QDi = f (pi, Xi) (2.1a)
QS
i = g(pi, Ri, Yi) (2.1b)
pi = p(Xi, Ri, Yi) (2.2) Equation (2.1a) is the demand for housing in community i , QD
i , which is a func-tion of price, p i , and a vector of demand shifters, X i , such as income and commu-nity population. Demand shifters reflect underlying conditions, in particular, the demand to live in the community on the basis of its industrial structure and fiscal conditions. Equation (2.1b) is housing supply, QS
i , which is a function of price; supply shifters, Y i , that depend on, say, local geography; and regulations, R i . In this framework regulation is treated as exogenous (an important issue discussed below). Equation (2.2) combines (2.1a) and (2.1b) to get the reduced form price equation. In the literature estimation tends to focus on either the supply Eq. (2.1b) or the price Eq. (2.2), or on both.
The effect of regulation is pictured in Fig. 2.1 (see Glaeser et al., 2006 ). Regula-tion acts to alter the price elasticity of supply. Let the initial demand situation be Demand 0 . When demand shifts out to Demand 1 , an unregulated community has the elastic supply curve, while a regulated community has the inelastic supply curve, with a much larger price response and a much smaller quantity response to the demand shock. That is one way to model regulation constraints—as affecting the
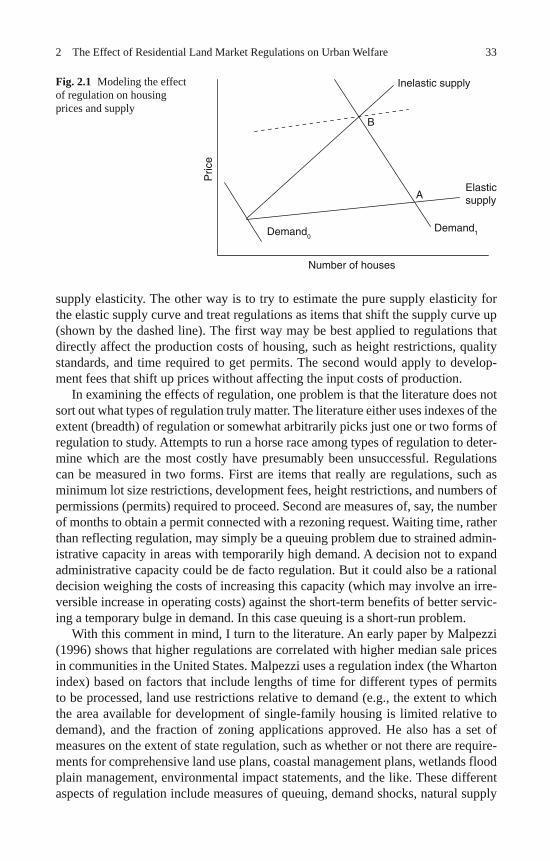
332 The Effect of Residential Land Market Regulations on Urban Welfare
supply elasticity. The other way is to try to estimate the pure supply elasticity for the elastic supply curve and treat regulations as items that shift the supply curve up (shown by the dashed line). The first way may be best applied to regulations that directly affect the production costs of housing, such as height restrictions, quality standards, and time required to get permits. The second would apply to develop-ment fees that shift up prices without affecting the input costs of production.
In examining the effects of regulation, one problem is that the literature does not sort out what types of regulation truly matter. The literature either uses indexes of the extent (breadth) of regulation or somewhat arbitrarily picks just one or two forms of regulation to study. Attempts to run a horse race among types of regulation to deter-mine which are the most costly have presumably been unsuccessful. Regulations can be measured in two forms. First are items that really are regulations, such as minimum lot size restrictions, development fees, height restrictions, and numbers of permissions (permits) required to proceed. Second are measures of, say, the number of months to obtain a permit connected with a rezoning request. Waiting time, rather than reflecting regulation, may simply be a queuing problem due to strained admin-istrative capacity in areas with temporarily high demand. A decision not to expand administrative capacity could be de facto regulation. But it could also be a rational decision weighing the costs of increasing this capacity (which may involve an irre-versible increase in operating costs) against the short-term benefits of better servic-ing a temporary bulge in demand. In this case queuing is a short-run problem.
With this comment in mind, I turn to the literature. An early paper by Malpezzi ( 1996 ) shows that higher regulations are correlated with higher median sale prices in communities in the United States. Malpezzi uses a regulation index (the Wharton index) based on factors that include lengths of time for different types of permits to be processed, land use restrictions relative to demand (e.g., the extent to which the area available for development of single-family housing is limited relative to demand), and the fraction of zoning applications approved. He also has a set of measures on the extent of state regulation, such as whether or not there are require-ments for comprehensive land use plans, coastal management plans, wetlands flood plain management, environmental impact statements, and the like. These different aspects of regulation include measures of queuing, demand shocks, natural supply
Fig. 2.1 Modeling the effect of regulation on housing prices and supply
Elasticsupply
Inelastic supply
Demand1Demand0
A
B
Pric
e
Number of houses
34 J. V. Henderson
restrictions (building on wetlands is costlier), and amenities (coastal management requires that the community be coastal). Thus they reflect items other than the pure costs of regulation. Still, many of the papers discussed below build on Malpezzi’s approach and measures. However, I start with Quigley and Raphael ( 2005 ), who use measures more directly related to regulation per se.
Supply Elasticities . Quigley and Raphael ( 2005 ) examine the two formulations in Fig. 2.1 , the one in which regulations affect the elasticity of supply and the one in which they shift the supply curve. For most regulations, as explained, the first seems to be conceptually the better formulation. As in Fig. 2.1 , more regulated communities should have lower elasticities, or lower responses of supply to price increases. Quigley and Raphael have measures of 15 different kinds of regulation and do a simple count of the number in each community (on average, two to three), all in California, a comparatively highly regulated state in recent years. Regulations include restrictions on the number of building permits in a period, infrastructure requirements, open space zoning, density restrictions, voter approval for residential up-zoning, height restrictions, and so on. The authors examine the effect of price changes on the number of building permits issued—in essence, new housing starts. They find a supply elasticity (the relative change in building permits, the dependent variable, for a relative change in the price index) of 0.17 in relatively unregulated cities in California, compared with –0.23 in more regulated cities. Thus, as pre-dicted, more regulated cities have lower supply price elasticities, though having a negative supply elasticity is problematic. Estimating the case in which restrictions shift the supply curve up (dashed line in Fig. 2.1 ), Quigley and Raphael find an overall supply elasticity of 0.11. They also find that increases in the number of regu-lations significantly reduce the building permits issued. In estimation, unlike almost all other studies, they generally instrument for price, recognizing its endogeneity (see below). However, they treat regulations as exogenous.
Malpezzi and Mayo ( 1997 ); Mayo and Sheppard ( 1996 ) compare supply elas-ticities in three countries, Thailand (with little regulation) and Korea and Malaysia (both with very strong regulation). They lack the data on housing starts to directly estimate the supply curve in Eq. (2.1b). Instead, they estimate the reduced form price Eq. (2.2), make assumptions about the numerical magnitudes of income and price demand elasticities in Eq. (2.1a), and then back out the supply elasticities in Eq. (2.1b). For a range of plausible demand elasticities, they calculate supply elasticities in heavily regulated Korea and Malaysia as lying between 0 (or negative) and 0.35. They calculate the elasticity in less regulated Thailand at well over 4 and a similarly very high elasticity nationally for the United States during their study period.
Short- and Long-Run Effects. Mayer and Somerville ( 2000 ) add two interesting features. For regulatory effects, they find that more months to receive subdivision approval, a higher count of growth management techniques (citizen referendum on growth proposals, use of legislative measures by different levels of government, and the like), and user development fees all reduce building permits issued, control-ling for prices. They then estimate the model in Fig. 2.1 to show that more regulated communities have lower supply elasticities.
A new feature is that the authors have quarterly panel data on cities, allowing them to lag prices to get short-run effects (current quarter) and longer-run effects
352 The Effect of Residential Land Market Regulations on Urban Welfare
(four to five quarters). They show that regulation affects supply elasticities in the longer run but not the short run. They point out that developers in more regulated situations tend to have larger stocks of approved lots available to develop so that they can respond to demand shocks in the short run, but they are more supply con-strained in the long run.
A second feature is that Mayer and Somerville are the only authors who attempt to instrument for regulation, treating regulation as endogenous. They do so in a time-differenced framework using some community measures (such as presidential voting patterns) as instruments.
Spillover Effects. Another aspect of regulation is suggested by Pollakowski and Wachter ( 1990 ), who create an index of density restrictions for 17 planning areas in Montgomery County, Maryland, for 1982–1989. The authors get the usual result that housing prices are higher in more regulated communities. What is unusual about their work is that they look for spillovers, showing that an increase in restrictiveness in one community leads to price increases in neighboring communities. These are more general equilibrium effects: restrictions in one community force people into other communities, where there may be upward-sloping supply curves of housing (see note 1 for a simple example).
Responses to Demand Shocks. Glaeser, Gyourko, and Saks ( 2006 ) estimate rela-tionships based on Fig. 2.1 for a sample of US cities, but use a different approach. Rather than trying to estimate supply elasticities directly, they look at the effects of measures of city demand shocks on prices. In more regulated communities (where supply is inelastic) there should be large price responses; in less regulated com-munities a more elastic supply should result in small price responses. The authors also look at the indirect effects of regulation on the size of population responses to city demand shocks: in more regulated communities population responses to posi-tive demand shocks are limited because the housing market cannot expand. (This approach is used in Sect. 2.3.) Glaeser et al. measure regulation in the same way as Malpezzi ( 1996 ), drawing on his work. They find that more regulated communities have much larger price increases in response to demand shocks, and much smaller quantity responses, than less regulated communities—in Fig. 2.1 , the difference between moving from Demand 0 to point B (more regulated) under Demand 1 and moving to point A (less regulated). Demand shocks are based on national growth rates in employment in different industries multiplied by the city’s share in each industry in the base period. A positive demand shock occurs if an industry in which a city is relatively specialized experiences a large increase in national employment.
2.1.2.4 Deficiencies in the Literature
This literature suffers from several drawbacks. First, it focuses only on the effect of direct land use regulations in formal sector markets, because the countries examined do not have significant informal markets and their institutions are rela-tively strong. Second, modeling in Eq. (2.1a) and almost all estimation assume a generic (representative consumer) demand side, meaning that there are no differ-ences in effects between high-income and low-income consumers. Moreover, the
36 J. V. Henderson
literature does not account for the fact that to some extent consumers in differ-ent income groups sort into different communities. So, for example, high-income communities could impose local regulations to exclude middle-income people, raising prices for newcomers in those communities, without having any effect on actual prices that low-income consumers pay in the area. And as noted, in Malaysia national restrictions limiting the intensity of land use affect low-income consumers who demand high-density developments more than they affect higher-income consumers.
Third, the literature treats regulation as exogenous rather than as an endogenous policy decision. Yet regulations are policy decisions of communities driven by their specific responses to local market conditions. Communities facing positive demand shocks that would lead to population expansion may impose building height restric-tions, minimum lot size zoning, requirements for more review processes or permits to proceed with new construction, and so on. These regulations are a response to the demand shocks, aimed at limiting their effects on population. If in response to a pos-itive (unobserved) demand shock to live in a community, the community imposes more regulations, the effect on prices is overstated (since the demand shock itself would raise prices, assuming that the unregulated supply of housing in a community is not perfectly elastic).
2.2 Exclusionary Restrictions and the Informal Sector
Many developing countries have a large informal housing sector. Here I explore the development of this sector, first through country examples and then conceptually.
2.2.1 Informal Sectors in Developing Countries
The informal housing sector generally serves lower-income migrants to cities. Today in China, for example, almost all rural–urban migrants are housed in employer-pro-vided dormitories or in the informal sector—on land owned and operated by rural “villages” within the city boundaries or on the urban fringe (Zhu, 2005 ; Wu, 2004 ; Zhou & Cai, 2008 ). These enclaves operate outside formal sector regulations and typically rely on a village patchwork of services. While some dormitories of large firms are formal housing units, in the service sector they are not. For example, res-taurant workers often sleep on the premises.
Historically in Brazil, migrants have been accommodated in several ways, as detailed in Sect. 2.3. As discussed in Dowall ( 2007 ); Avila ( 2006 ), these include workplace housing with typically very poor facilities and some high-density slums with rental housing in older parts of cities ( corticos ). Better known are favelas , or squatter settlements, where people live on land seized by invasion—historically, often government land or land under title dispute. In almost all countries squatter
372 The Effect of Residential Land Market Regulations on Urban Welfare
settlements involve people living on land they do not own, which the government is politically unable to reclaim. Squatter settlements tend to lack public services and have developed their own (costly) alternatives. Many Latin American countries are now working to grant secure tenure and even land property rights to people in such long-term settlements. As squatter settlements are regularized, part of the effort is to extend public services to them.
In many cases, however, informal sector housing is built on land legitimately owned by a land developer, but does not meet official housing regulations. Owners may have secure tenure and the ability to sell their homes, but not official title to the land. Moreover, there may be no requirement that the city provide services to housing not in the formal sector.
This appears to have been the situation in Brazil in the 1980s. In 1979 Brazil passed a national land use regulation setting a minimum lot size of 125 m 2 and front-age of 5 m, requirements viewed as excessive for low-income residents. Many subur-ban low-income developments failed to meet the 125-m 2 requirement, but they were built on land owned by the developer. Such developments, because they were outside the formal sector, could not legally be supplied public services by the city. Starting in the early 1980s, however, a few cities did provide services to these settlements.
After democratization in the late 1980s the environment changed. Cities were permitted and encouraged to provide services to the informal sector. While the national minimum lot size requirement remained in place, areas could be designated as special zones of social interest and exempted from the requirement as part of a policy initiative to secure tenure in such areas and improve their services. Moreo-ver, as a result of the general national growth in income, the 125-m 2 restriction was no longer so binding. Indeed, many cities raised minimum lot size restrictions well above this level.
2.2.2 Why Informal Sectors Develop
I now turn to a conceptual framework for the development of informal sectors. I view the city as acting strategically, deciding whether to let migrants flow into the informal sector with its poor conditions as a way of discouraging in-migration or to enact policies permitting or encouraging their entry into the formal sector.
2.2.2.1 Model Fundamentals
Wages. Consider a city with an existing population, N 0 , living in owner-occu-pied housing for which residents pay an implied rental price of p . The city faces a potential wave of migrants. Following standard urban analysis, cities exist because of agglomeration economies in firm production, but their overall size is limited because of diseconomies such as increased commuting times. To keep things sim-ple, this scale economy-diseconomy trade-off is summarized in a real wage func-
38 J. V. Henderson
tion. Let N be total city population, where N ≡ N0 + N1 and N 0 and N 1 represent respectively the existing population and the number of migrants who enter the city. The wage function is assumed to be
w N w N N w N N( ), ; .* *′ > ∀ < ′ < ∀ >0 0 (2.3) That is, the wage function is an inverted U with a single peak and a maximum at N * . Migrants could be subject to the same wage function, and that is what I assume for now. However, I also consider the implications of migrants having lower skills and earning lower wages.
Housing. If migrants enter the formal sector, they potentially face an unregulated unit cost of housing p the same as existing residents, but regulations facing migrants alone may be imposed that drive the price higher. Existing residents escape regula-tion either because they buy their housing before migrants arrive (at price p ) or live in areas defined as exempt from regulation. Migrants can always buy housing in the informal sector at a cost p 1 per unit of housing. While p 1 may equal p , it could be specified to be higher to represent insecurity of tenure and other problems associ-ated with being in the informal sector.
Local Public Services. In the city’s formal sector existing residents consume local public services, where per person local services, denoted as g , are financed out of an income tax at rate τ on real wages. Public services are produced with scale economies, so unit costs are c N c( ), ′ ≤ 0 . But it is assumed that such econo-mies are exhausted by the initial population, N 0 , so that thereafter unit costs in the city are simply c 0 . In the informal sector, if it exists, it is assumed that public serv-ices are privately provided without the benefit of scale economies at a unit cost of
c1, c1 � c0. (2.4)
I assume the public sector faces a balanced public budget constraint. If migrants are in the formal sector and migrants and nonmigrants earn the same incomes and pay the same taxes, the public budget is simple. Suppose that taxes are wage taxes. For a tax rate τ , the public budget constraint is then c0Ng = τwN , so that per person taxes equal per person public expenditures. In that case the “tax price” of a public good (∂τw/∂g) to any resident is c 0 . However, for later reference, note that if existing residents earn higher incomes and if public expenditures are done equally across existing residents and migrants, existing residents pay more than their public service costs while migrants pay less. In particular, from the public budget constraint, τ (w1N1 + w0N0) = c0Ng , for average wages w̄ ≡ (w0N0 + w1N1)/N , the total tax for an existing resident is w0τ = c0g(w0/w̄) , while for migrants it is w1τ = c0g(w1/w̄) . If existing residents are more highly skilled, w0/w̄ > 1 , while w1/w̄ < 1 , indicating differences in tax prices facing the two groups. If incomes are equal, integration into the formal sector gives migrants the benefit of a lower unit cost and (tax) price for production of public services ( c 0 < c 1 ). If migrants have lower incomes, they get an additional benefit when they are in the formal sector: subsidized tax prices, the usual fiscal externality.
If migrants enter the informal sector, in the base case, it is assumed that they avoid the wage tax and are left to their own devices in procuring public services.
392 The Effect of Residential Land Market Regulations on Urban Welfare
Existing residents in the city may still pay c0g in taxes. But in reality, having migrants in the informal sector may have additional fiscal benefits. If the informal sector is outside the city boundary, migrants may escape city taxes, as assumed, to the extent that the taxes are residence based. But general wage taxes (based on busi-ness location), sales taxes, or value added taxes mean that migrants in the informal sector pay taxes (and get no services), an attractive alternative for the city. Still, the idea that migrants escape taxes by living in the informal sector is clearly their best-case scenario. In general, migrants in the informal sector will contribute to city taxes in return for no services.
2.2.2.2 The Choices Facing Existing Residents, as Constrained by Migrant Choices
The basic question is whether existing residents make it possible for migrants to enter the formal sector rather than forcing them into the informal sector. In par-ticular, existing residents can impose regulations in the formal sector that drive the regulated unit cost of housing far above the unregulated cost or that force overcon-sumption of housing by regulating minimum lot size and floor space requirements to make consumption l z far beyond what migrants demand and can afford. In both cases, if the regulations are sufficiently costly, that will deter migrants from entering the formal sector. If migrants do enter the formal sector, it is assumed that the city must provide them with services—the g that existing residents get.
What determines the extent of migration? It is assumed that there is an upward-sloping supply curve of migrants to the city in utility, V , that the city can pay, so that N s
1 = N (V ), N ′> 0 . What can the city pay migrants? That depends on whether they enter the formal or informal sector.
Informal Sector and Migrants. If migrants are forced into the informal sector, they choose the amount of housing they want at price p 1 and the amount of services they want, bought privately, at a cost of c 1 per unit. In that case their indirect utility function is V (w(N0 + N1), c1, p1) and the number who enter is given by equating N Ns
1 1and in N s1 = N (V (w(N0 + N1), c1, p1)) to solve
N I1 = N I
1 (N0, c1, p1). (2.5a) The superscript I denotes the informal sector. Properties of this solution are exam-ined graphically below (since stability issues will arise). But note that N I
1 ( )⋅ should be decreasing in Eq. (2.5a) in p 1 and c 1 .
3 A key feature of the informal sector is that, because it is unregulated, people can
always enter it. That means that the minimum number of people who will migrate to the city is defined by N I
1 in Eq. (2.5a), regardless of how the formal sector is regulated.
3 From the implicit function theorem, noting that a well-behaved equilibrium rules out super scale economies, so that 1− N ′Vww′> 0
.
40 J. V. Henderson
Formal Sector and Migrants. It is assumed that when migrants enter the formal sector, they generally face zoning restrictions, though it is easy to generalize so that they face none. It is assumed that public services are chosen through some political process dominated by existing residents (to keep things simple). Here zon-ing is interpreted as forced high levels of land consumption. In that case the util-ity of migrants is given by V z (w(N0 + N1)− plz − c0g, lz, g) and the number of migrants by
N z1 = N z
1 (N0, lz, p, c0, g). (2.5b) Again it is presumed that N z
1 (⋅) is decreasing in p , c 0 , and l z , as long as lot size is set above the level that migrants would freely choose under price p . If l z is not regu-lated and is determined by price p , migrants for any population level will be better off in the formal sector given p< p1, c0 � c1 (assuming that they have the same tastes for public services as existing residents who set g , given the same incomes and prices).
Existing Residents. It is assumed that existing residents dominate the political process and choose public services on the basis of the tax price they face, so that it is as though they are choosing public services on a “free market” at price c 0 , whether migrants enter the formal sector or not. Then existing residents’ (indirect) utility function is described by
U (w(N0 + N1), p, c0). (2.6)
Thus their utility is a function of how many migrants enter the city. The p and c 0 that existing residents face are the same no matter which sector migrants enter, if existing residents and migrants have the same incomes and would pay the same taxes (when migrants are in the formal sector and are supplied with public services). Note that if V (⋅) and U (⋅) have the same shape, the utility of migrants and existing residents is the same if both are in the formal sector and earn identical incomes and if migrants face no zoning restrictions.
The key question is how many migrants enter. At a minimum N I1 enter, since
migration to the informal sector cannot be regulated. The issue for existing residents is then whether to set regulations in the formal sector so as to exclude migrants from that sector, in which case N I
1 enter the city, or to allow migrants to enter the formal sector either without restrictions or with zoning set to allow more than N I
1 to enter but less than the unrestricted level. The situation is depicted in Fig. 2.2 .
In Fig. 2.2 the utility path, U (⋅), of initial residents is drawn as a function of total city population, showing the typical inverted-U shape. Initially utility rises as a result of scale economies that allow firms to pay higher wages. But eventually, as congestion and high commuting costs set in, utility peaks and then declines with further increases in city size. U (⋅) also defines the utility levels of migrants if they enter the formal sector and have the same incomes (and tastes) as original residents and face no zoning restrictions. V I (⋅) defines the utility path of migrants as a function of total city population if they are forced into the informal sector with higher housing and service costs. I set the initial population at a low level N 0 , noting that over time, with technological change, the U (⋅) and V (⋅) curves
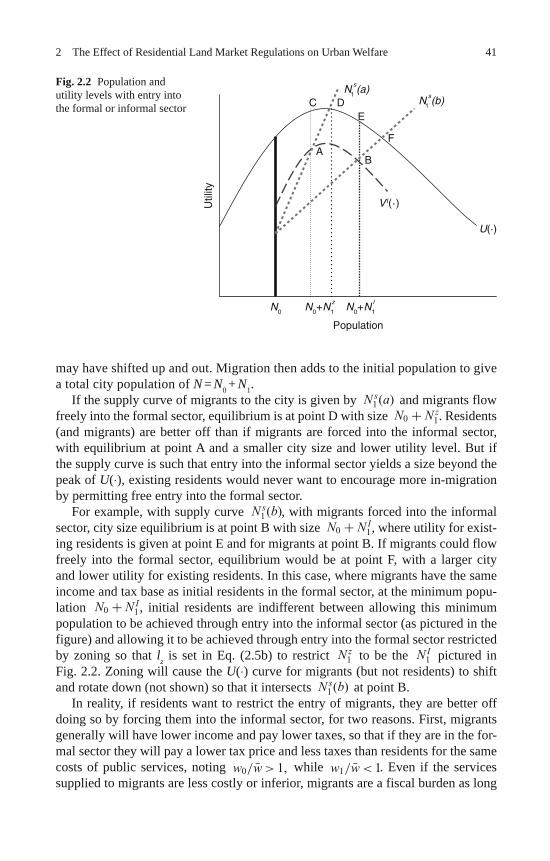
412 The Effect of Residential Land Market Regulations on Urban Welfare
may have shifted up and out. Migration then adds to the initial population to give a total city population of N = N 0 + N 1 .
If the supply curve of migrants to the city is given by N s1(a) and migrants flow
freely into the formal sector, equilibrium is at point D with size N0 + N z1 . Residents
(and migrants) are better off than if migrants are forced into the informal sector, with equilibrium at point A and a smaller city size and lower utility level. But if the supply curve is such that entry into the informal sector yields a size beyond the peak of U (⋅), existing residents would never want to encourage more in-migration by permitting free entry into the formal sector.
For example, with supply curve N s1(b) , with migrants forced into the informal
sector, city size equilibrium is at point B with size N0 + N I1 , where utility for exist-
ing residents is given at point E and for migrants at point B. If migrants could flow freely into the formal sector, equilibrium would be at point F, with a larger city and lower utility for existing residents. In this case, where migrants have the same income and tax base as initial residents in the formal sector, at the minimum popu-lation N0 + N I
1 , initial residents are indifferent between allowing this minimum population to be achieved through entry into the informal sector (as pictured in the figure) and allowing it to be achieved through entry into the formal sector restricted by zoning so that l z is set in Eq. (2.5b) to restrict N z
1 to be the N I1 pictured in
Fig. 2.2 . Zoning will cause the U (⋅) curve for migrants (but not residents) to shift and rotate down (not shown) so that it intersects N s
1(b) at point B. In reality, if residents want to restrict the entry of migrants, they are better off
doing so by forcing them into the informal sector, for two reasons. First, migrants generally will have lower income and pay lower taxes, so that if they are in the for-mal sector they will pay a lower tax price and less taxes than residents for the same costs of public services, noting w0/w̄ > 1, while w1/w̄ < 1 . Even if the services supplied to migrants are less costly or inferior, migrants are a fiscal burden as long
Fig. 2.2 Population and utility levels with entry into the formal or informal sector
Util
ity
A
Population
B
CE
F
VI(·)
N1
s(a)
N1
s(b)
U(·)
D
N0 N0+N1
zN0+N1
I
42 J. V. Henderson
as the tax gap exceeds the public service gap. Second, if migrants are in the informal sector, they probably will still contribute to the city tax base (through sales taxes, wage taxes, indirect contributions to value added tax revenues in manufacturing, and so on), while imposing no fiscal costs on residents.
There are, of course, other arguments for incorporating migrants into the formal sector and restricting their numbers through zoning. One argument for incorpo-ration is that poor service provision in the informal sector may generate nega-tive spillovers (such as groundwater contamination) in the formal sector. Rather than incorporating the informal sector, however, residents may be better off just improving public services in the informal sector in the dimensions that generate externalities (such as providing sewage disposal but not connecting roads to the sector).
Another consideration is that the analysis has allowed no transfer payments between migrants and existing residents. These could occur in the context of the for-mal sector being developed by land development companies. Companies pay devel-opment fees to the city, which they pass on to purchasers through higher prices. If these fees are not dissipated in the political process and instead are rebated to existing residents (through lower taxes or better services), that changes the analysis. For example, at the population N0 + N I
1 in Fig. 2.2 , migrants would be willing to pay much more to be in the formal sector, for the same lot priced in the infor-mal sector at p 1 , because services are cheaper given c0 < c1 ; and they will benefit from cross-subsidization if they have lower incomes than existing residents. Thus another potential solution is to admit migrants to the formal sector and charge high development fees both to restrict their entry to N I
1 and to recover the fiscal costs of admitting migrants to the community. That is, in Fig. 2.1 , rather than restricting supply through zoning (rotating the marginal cost curve), residents can restrict sup-ply by shifting up the supply curve through development fees.
Because of the substantial cost savings from being in the formal sector, migrants should be willing to pay very high development fees to be in the formal sector (far beyond the cost of any cross-subsidization unless the public service demands of migrants and residents diverge enormously). These fees are a boon to residents, who in essence are collecting monopoly rents as a cheaper supplier of public services. Since developers often pay substantial development fees, a key issue is whether these fees are returned to the community or dissipated. Dissipation occurs through corruption: if developers bribe city officials to approve their developments, the money raised accrues to local officials rather than to residents in general. If resi-dents perceive corruption, one reason to push for heavier zoning restrictions that make formal sector housing development too costly for migrants is to avoid approv-als whose proceeds do not revert to residents.
In principle, regulation could take a different form: rather than imposing mini-mum lot size zoning, the community might be able to limit the number of sites in the formal sector permitted for development to achieve the N I
1 in Fig. 2.2 . Then developers could charge high housing prices, capitalizing the benefits for migrants of being in the formal rather than the informal sector. However, for residents, hav-ing developers directly collect the monopoly rents is not desirable.
432 The Effect of Residential Land Market Regulations on Urban Welfare
A final consideration has to do with political regime changes. In Brazil much of the informal sector arose during the national nondemocratic era. In that era some mayors were elected while others were appointed. Under democracy, cities have incorporated the informal sector and provided it with services, both because of changes in national law and because of the introduction of greater democracy. The larger the informal sector and the greater its share of the electorate, the more likely such ex post incorporation may be.
2.3 Regulation in Brazil and the Informal Sector
Using the 2000 census for Brazil, I look at three issues. Is there any evidence of the emergence of “superstar” municipios in Brazil? (A municipio is the basic local jurisdictional unit in Brazil, corresponding in size to a smaller US county.) How do services provided to migrants in general differ from those provided to existing residents? Finally, and most critically, how do cities facing potential population growth respond in terms of underproviding services to migrants relative to the gen-eral population? Is underprovision connected with observable features of cities such as their wealth or size in ways that would be consistent with the model outlined in the previous section?
2.3.1 Superstar Municipios
I use two units of analysis—urban MCAs and urban areas that generally involve agglomerations of MCAs. MCAs are municipios based on boundaries as defined in 1970. Over time municipios have increased in number as old ones have been split into two or more new ones. Thus I combine some 2000 municipios so that they cor-respond to 1970 municipios (to have consistent geography over time) and call them MCAs. I look at 123 urban areas in Brazil covering 447 MCAs and focus on the urban population in those MCAs (about 92% of the population in the urban areas was urban in 2000).
Figure 2.3 graphs the growth rate for each MCA’s urban population in 1991–2000 ( x -axis) against the fraction of the MCA’s households that are in the top 10% by household income among all urban households in the national urban sample (the 123 urban areas). In essence, it plots the fraction of an MCA’s households that are “rich” against the MCA’s growth rate. MCAs above the horizontal line (at 0.10) have more than 10% of their households in the top 10% by income; those to the right of the vertical line (at 0.278) had a growth rate faster than the average for MCAs in 1991–2000. The figure distinguishes the largest 20% of MCAs (dots) from smaller MCAs (crosses).
The figure tells us that richer communities (above the horizontal line) are slower growing (to the left of the vertical line). Among the 80 richer MCAs, 80% had
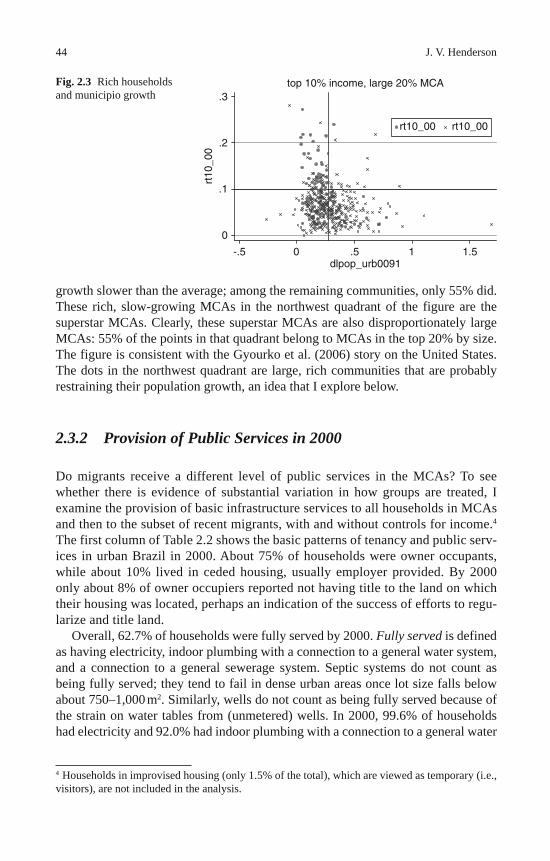
44 J. V. Henderson
growth slower than the average; among the remaining communities, only 55% did. These rich, slow-growing MCAs in the northwest quadrant of the figure are the superstar MCAs. Clearly, these superstar MCAs are also disproportionately large MCAs: 55% of the points in that quadrant belong to MCAs in the top 20% by size. The figure is consistent with the Gyourko et al. ( 2006 ) story on the United States. The dots in the northwest quadrant are large, rich communities that are probably restraining their population growth, an idea that I explore below.
2.3.2 Provision of Public Services in 2000
Do migrants receive a different level of public services in the MCAs? To see whether there is evidence of substantial variation in how groups are treated, I examine the provision of basic infrastructure services to all households in MCAs and then to the subset of recent migrants, with and without controls for income. 4 The first column of Table 2.2 shows the basic patterns of tenancy and public serv-ices in urban Brazil in 2000. About 75% of households were owner occupants, while about 10% lived in ceded housing, usually employer provided. By 2000 only about 8% of owner occupiers reported not having title to the land on which their housing was located, perhaps an indication of the success of efforts to regu-larize and title land.
Overall, 62.7% of households were fully served by 2000. Fully served is defined as having electricity, indoor plumbing with a connection to a general water system, and a connection to a general sewerage system. Septic systems do not count as being fully served; they tend to fail in dense urban areas once lot size falls below about 750–1,000 m 2 . Similarly, wells do not count as being fully served because of the strain on water tables from (unmetered) wells. In 2000, 99.6% of households had electricity and 92.0% had indoor plumbing with a connection to a general water
4 Households in improvised housing (only 1.5% of the total), which are viewed as temporary (i.e., visitors), are not included in the analysis.
Fig. 2.3 Rich households and municipio growth
0
.1
.2
.3
rt10
_00
-.5 0 .5 1 1.5dlpop_urb0091
rt10_00
top 10% income, large 20% MCA
rt10_00
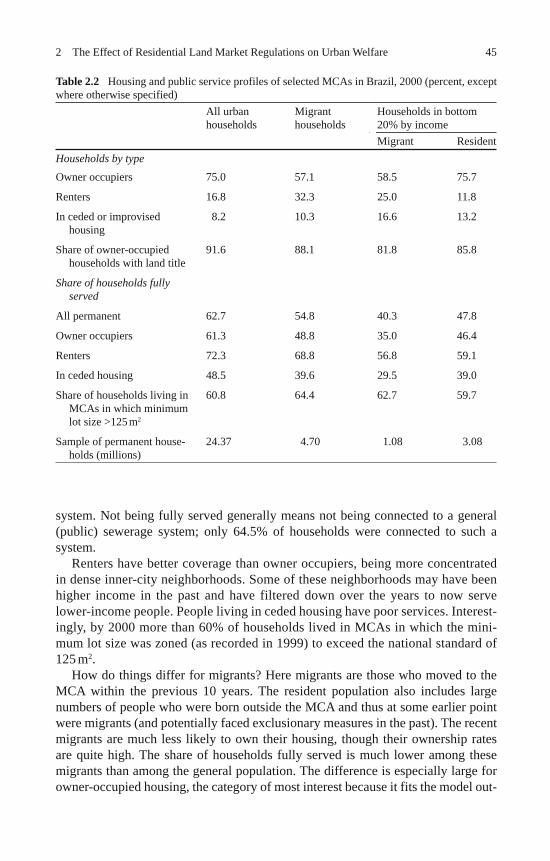
452 The Effect of Residential Land Market Regulations on Urban Welfare
system. Not being fully served generally means not being connected to a general (public) sewerage system; only 64.5% of households were connected to such a system.
Renters have better coverage than owner occupiers, being more concentrated in dense inner-city neighborhoods. Some of these neighborhoods may have been higher income in the past and have filtered down over the years to now serve lower-income people. People living in ceded housing have poor services. Interest-ingly, by 2000 more than 60% of households lived in MCAs in which the mini-mum lot size was zoned (as recorded in 1999) to exceed the national standard of 125 m 2 .
How do things differ for migrants? Here migrants are those who moved to the MCA within the previous 10 years. The resident population also includes large numbers of people who were born outside the MCA and thus at some earlier point were migrants (and potentially faced exclusionary measures in the past). The recent migrants are much less likely to own their housing, though their ownership rates are quite high. The share of households fully served is much lower among these migrants than among the general population. The difference is especially large for owner-occupied housing, the category of most interest because it fits the model out-
Table 2.2 Housing and public service profiles of selected MCAs in Brazil, 2000 (percent, except where otherwise specified) All urban
householdsMigrant households
Households in bottom 20% by income
Migrant ResidentHouseholds by type Owner occupiers 75.0 57.1 58.5 75.7
Renters 16.8 32.3 25.0 11.8
In ceded or improvised housing
8.2 10.3 16.6 13.2
Share of owner-occupied households with land title
91.6 88.1 81.8 85.8
Share of households fully served
All permanent 62.7 54.8 40.3 47.8
Owner occupiers 61.3 48.8 35.0 46.4
Renters 72.3 68.8 56.8 59.1
In ceded housing 48.5 39.6 29.5 39.0
Share of households living in MCAs in which minimum lot size >125 m2
60.8 64.4 62.7 59.7
Sample of permanent house-holds (millions)
24.37 4.70 1.08 3.08
46 J. V. Henderson
lined in the previous section. Migrants are disproportionately “choosing” to build in the informal sector (with poor public services) rather than in the formal sector (which is generally fully served).
The presumption is that migrants are priced out of the formal sector by zon-ing and land use restrictions. However, migrants are also poorer in general, and there may be income effects on the demand for being fully served and in the formal sector. Thus to control for income, I compare migrant with resident house-holds among the bottom 20% by household income in the national urban sample. Again, migrants are more poorly served than residents, especially among owner occupiers.
Finally, migrants are more likely to live in areas with stricter zoning regula-tions—MCAs in which the minimum lot size exceeds the national standard of 125 m 2 . The effect is modest, but then we would expect migrants (who are poorer) to be unable to afford housing in more strictly zoned areas and thus to be less likely to live in such areas. Here the suggestion is that areas facing high population growth impose zoning to try to stem the flow. The endogeneity of zoning is sufficient to reverse the expected patterns, so stricter zoning is associated with more in-migra-tion (but less than might be otherwise).
2.3.3 Response to Demand Shocks
What determines the extent to which migrants are served in MCAs? I investigate the determinants in the context of examining how MCAs respond to demand shocks that would increase their population. Given my belief that underprovision of serv-ices is a strategic device to discourage migration, I consider it most relevant to areas experiencing population growth pressure, which are already highly populated and richer (not wanting to share their tax base with poor migrants).
In this exploration the first issue is how to measure underprovision of services. I do so by comparing muncipios by the ratio of the fraction of local migrants served to the fraction of residents served. In some municipios the provision of services may be poor overall because of geographic conditions (e.g., a good water table allowing many households to still rely on wells), politics, or low regional income. What mat-ters here is the relative degree of service provision for migrants. I exclude MCAs in which the share of resident households fully served is less than 10% on the basis that nonprovision of services is unlikely to be a strategic decision in those cases, since few residents are served to begin with.
The next issue is how to measure the effect of demand shocks on population growth pressure. Only realized population growth is known, not the growth that would have happened if growth was unrestricted. Basic growth shocks are assumed to come from two sources—changes in the market potential facing an MCA and the MCA’s industrial base. If an MCA has a good manufacturing base and national manufacturing output grows, that will spur the MCA’s growth. So I estimate real-ized city growth as a function of changes in market potential in 1991–2000 and
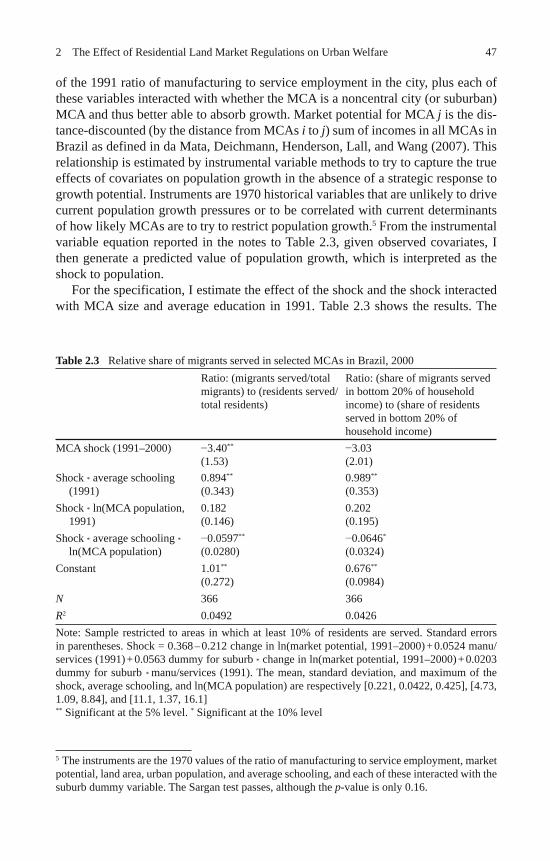
472 The Effect of Residential Land Market Regulations on Urban Welfare
of the 1991 ratio of manufacturing to service employment in the city, plus each of these variables interacted with whether the MCA is a noncentral city (or suburban) MCA and thus better able to absorb growth. Market potential for MCA j is the dis-tance-discounted (by the distance from MCAs i to j ) sum of incomes in all MCAs in Brazil as defined in da Mata, Deichmann, Henderson, Lall, and Wang ( 2007 ). This relationship is estimated by instrumental variable methods to try to capture the true effects of covariates on population growth in the absence of a strategic response to growth potential. Instruments are 1970 historical variables that are unlikely to drive current population growth pressures or to be correlated with current determinants of how likely MCAs are to try to restrict population growth. 5 From the instrumental variable equation reported in the notes to Table 2.3 , given observed covariates, I then generate a predicted value of population growth, which is interpreted as the shock to population.
For the specification, I estimate the effect of the shock and the shock interacted with MCA size and average education in 1991. Table 2.3 shows the results. The
5 The instruments are the 1970 values of the ratio of manufacturing to service employment, market potential, land area, urban population, and average schooling, and each of these interacted with the suburb dummy variable. The Sargan test passes, although the p -value is only 0.16.
Table 2.3 Relative share of migrants served in selected MCAs in Brazil, 2000 Ratio: (migrants served/total
migrants) to (residents served/total residents)
Ratio: (share of migrants served in bottom 20% of household income) to (share of residents served in bottom 20% of household income)
MCA shock (1991–2000) 3.40**
(1.53)3.03
(2.01)Shock * average schooling
(1991)0.894**
(0.343)0.989**
(0.353)Shock * ln(MCA population,
1991)0.182(0.146)
0.202(0.195)
Shock * average schooling * ln(MCA population)
0.0597**
(0.0280)0.0646*
(0.0324)Constant 1.01**
(0.272)0.676**
(0.0984)N 366 366R2 0.0492 0.0426Note: Sample restricted to areas in which at least 10% of residents are served. Standard errors in parentheses. Shock = 0.368 – 0.212 change in ln(market potential, 1991–2000) + 0.0524 manu/services (1991) + 0.0563 dummy for suburb * change in ln(market potential, 1991–2000) + 0.0203 dummy for suburb * manu/services (1991). The mean, standard deviation, and maximum of the shock, average schooling, and ln(MCA population) are respectively [0.221, 0.0422, 0.425], [4.73, 1.09, 8.84], and [11.1, 1.37, 16.1]** Significant at the 5% level. * Significant at the 10% level
48 J. V. Henderson
effect of the shock is to reduce service provision to migrants—both a capacity issue (time to respond to migration with public service provision to migrants) and a potential strategic response. The shock is dampened as schooling improves, an income effect where richer cities can afford to do better by migrants and may wish to do so (to reduce negative spillovers from unserved communities). The shock is also dampened in larger cities, with greater scale economies in providing services and potentially greater fiscal ability to fund public infrastructure investments. The key covariate is the last—the effect of the shock when interacted with both educa-tion and population. Cities that are both larger and richer (more highly educated) are more likely to reduce service provision to migrants. Once education exceeds 3–4 years (well below the mean of 4.7) in an MCA, population increases lead to reduced service provision to migrants.
2.4 Conclusions
The literature in economics focuses on how formal land and housing markets are regulated and the effects of those regulations on prices and housing supply. For developing countries the key issue is that many urban residents live in the infor-mal sector, which is both unregulated and poorly served with basic infrastructure services such as water and sewerage. Modeling and data from Brazil suggest that forcing lower-income migrants into the informal sector is in part a strategic device used by existing residents to limit population growth, to fiscally exploit migrants by taxing them in return for few public services, and to avoid the fiscal externalities imposed by migrants who pay less than the full cost of public services if admitted to the formal sector.
Acknowledgments The author gratefully acknowledges the research assistance of Kristin Aar-land and Hyoung Gun Wang.
References
Antwi, A. Y., & Adams, J. (2003). Rent-seeking behaviour and its economic costs in urban land transactions in Accra, Ghana. Urban Studies , 40 (10), 2083–2098.
Avila, P. C. (2006). Land use regulations in Brazil : Impacts on urban markets and access of low-income people to land and housing. Paper prepared for Lincoln Institute of Land Policy, Cam-bridge, MA.
Bertaud, A., & Brueckner, J. (2005). Analyzing building-height restrictions: Predicted impacts and welfare costs. Regional Science and Urban Economics , 35 (2), 109–125.
Bertaud, A., & Malpezzi, S. (2001). Measuring the costs and benefits of urban land use regula-tion: A simple model with an application to Malaysia. Journal of Housing Economics , 10 (3), 393–418.
da Mata, D., Deichmann, U., Henderson, J. V., Lall, S. V., & Wang, H. G. (2007). Determinants of city growth in Brazil. Journal of Urban Economics , 62 (2), 252–272.
492 The Effect of Residential Land Market Regulations on Urban Welfare
Davis, O. A., & Winston, A. B. (1964). The economics of complex systems: The case of municipal zoning. Kyklos , 17 , 419–445.
Dowall, D. (2007). Brazil’s urban land and housing markets: How well are they working? In G. Ingram (Ed.), Land policies and their outcomes . Cambridge, MA: Lincoln Institute of Land Policy.
Epple, D., & Nechyba, T. (2004). Fiscal decentralization. In J. V. Henderson & J.-F. Thisse (Eds.), Handbook of regional and urban economics (Vol. 4, pp. 2423–2480). Amsterdam: North Holland.
Flatters, F., Henderson, J. V., & Mieszkowski, P. (1974). Public goods, efficiency, and regional fiscal equalization. Journal of Public Economics , 3 (2), 99–122.
Glaeser, E. L., & Gyourko, J. (2003). The impact of zoning on housing affordability. Economic Policy Review , 9 (2), 21–39.
Glaeser, E. L., Gyourko, J., & Saks, R. (2005a). Why have housing prices gone up? NBER Work-ing Paper 11129. Cambridge, MA: National Bureau of Economic Research.
Glaeser, E. L., Gyourko, J., & Saks, R. (2005b). Why have housing prices gone up? American Economic Review , 95 (2), 329–333.
Glaeser, E. L., Gyourko, J., & Saks, R. (2005c). Why is Manhattan so expensive? Regulation and the rise in housing prices. Journal of Law and Economics , 48 (2), 331–370.
Glaeser, E. L., Gyourko, J., & Saks, R. (2006). Urban growth and housing supply. Journal of Eco-nomic Geography , 6 (1), 71–89.
G y o urko, J., Mayer, C. J., & Sinai, T. (2006). Superstar cities. NBER Working Paper 12355. Cam-bridge, MA: National Bureau of Economic Research.
Helsley, R. W. (2004). Urban political economics. In J. V. Henderson & J.-F. Thisse (Eds.), Hand-book of regional and urban economics (Vol. 4, pp. 2381–2422). Amsterdam: North Holland.
Kironde, J. M. L. (2005). The regulatory framework, unplanned development and urban poverty: Findings from Dar es Salaam, Tanzania. Land Use Policy , 23 (4), 460–472.
Malpezzi, S. (1996). Housing prices, externalities, and regulation in U.S. metropolitan areas. Jour-nal of Housing Research , 7 (2), 209–241.
Malpezzi, S., & Mayo, S. K. (1997). Getting housing incentives right: A case study of the effects of regulation, taxes, and subsidies on housing supply in Malaysia. Land Economics , 73 (3), 372–391.
Malpezzi, S., & Sa-Aadu, J. (1996). What have African housing policies wrought? Real Estate Economics , 24 (2), 133–160.
Mayer, C. J., & Somerville, C. T. (2000). Land use regulation and new construction. Regional Sci-ence and Urban Economics , 30 (6), 639–662.
Mayo, S., & Sheppard, S. (1996). Housing supply under rapid economic growth and varying regulatory stringency: An international comparison. Journal of Housing Economics , 5 (3), 274–289.
Mills, E. S., & Oates, W. E. (Eds.). (1975). Fiscal zoning and land use controls . Lexington, MA: Lexington Books.
Pollakowski, H. O., & Wachter, S. M. (1990). The effects of land-use constraints on housing prices. Land Economics , 66 (3), 315–324.
Quigley, J. M., & Raphael, S. (2005). Regulation and the high cost of housing in California. Ameri-can Economic Review , 95 (2), 323–329.
Sivam, A. (2002). Constraints affecting the efficiency of the urban residential land market in devel-oping countries: A case study of India. Habitat International , 26 (4), 523–537.
Wu, W. (2004). Sources of migrant housing disadvantage in urban China. Environment and Plan-ning A , 36 , 1285–1304.
Zhou, M., & Cai, G. (2008). Trapped in neglected corners of a booming metropolis: Residential patterns and marginalization of migrant workers in Guangzhou. In J. R. Logan (Ed.), Urban China in transition (pp. 226–249). Malden, MA: Blackwell.
Zhu, J. (2005). A transitional institution for the emerging land market in China. Urban Studies , 42 (8), 1369–1390.

“This page left intentionally blank.”
51
In the early days of the World Bank’s involvement in urban land issues, the Bank held a symposium to assist its staff in urban project and design activities for developing coun-tries. The symposium set out the major issues, identified the analytical approach, and suggested priorities and some ways forward. The papers from the symposium were developed into a text, Urban Land Policy: Issues and Opportunities (Dunkerley & Whitehead, 1983), that put the questions in a more transparent framework of economic analysis with the aim of bringing them into broader academic and policy discussion.
The issues raised look frighteningly similar to those still at the forefront of the debate today, not just for developing countries but also across the developed world: the rapidly rising price of urban land; the misallocation of land resources arising from constraints relating to title, finance, and regulation; the misspecification of prices and therefore opportunity costs, resulting in incorrect signals to major actors in development; the overwhelming importance of infrastructure provision in both making land available and in organizing the interaction between urban activities; the problems faced by governments in capturing land values for development and service provision; and the limited range of mechanisms that could be used in princi-ple and practice to provide the basis for sustained urban growth.
The major conclusions of the text were relatively straightforward—but funda-mental to the ways in which regulation might be used more effectively:
• Urban land systems are inherently inefficient if left to the market—and these market failures are large scale.
• Market failures can in principle be dealt with equally efficiently by regulation, taxation, subsidy, or direct intervention. Which approach is likely to be the most effective depends on the specifics of the situation and cannot be assessed without examining the practicalities and the ways in which the different interventions interact with one another.
S.V. Lall et al. (eds.), Urban Land Markets, DOI 10.1007/978-1-4020-8862-9_3 , © World Bank 2009
Chapter 3 Land Use Regulation: Transferring Lessons from Developed Economies Christine Whitehead, Rebecca L. H. Chiu, Sasha Tsenkova and Bengt Turner
C. M. E. Whitehead ( ) Department of EconomicsLondon School of Economics and Political ScienceHoughton StreetLondon WC2A 2AE, UKe-mail: [email protected]
52 C. Whitehead et al.
• Interventions have important—and often negative—impacts on the distribution of welfare, but so too do market inefficiencies. Trade-offs always have to be made, and measures to improve efficiency may often need to be accompanied by measures to improve distribution.
That land use regulation is necessary to address both market failures and inequi-ties was accepted. However, there was deep concern that existing regulatory frame-works in developing countries were themselves so inadequate that they were doing more harm than good. In particular:
• There was little evidence of capacity to simplify existing regulatory systems and to relate regulation more to local circumstances. Many systems had been trans-ferred from developed countries with little or no change and so were completely inappropriate on standards, technology, materials, and the like. As a result, most building was taking place outside the regulatory framework, reducing the poten-tial benefits of planning.
• Regulatory systems were inflexible, with no well-defined mechanisms for change—resulting in out-of-date regulations that could not readily take account of emerging opportunities.
• Even in countries with apparently strong regulatory frameworks, land title and property rights were ill defined, increasing risks and reducing the capacity to invest in the long-term physical assets required for effective growth as well as reducing the potential for debt finance.
• There were high costs of enforcement—and inadequate and overstretched admin-istrative systems with little access to funding to develop better arrangements.
• The potential benefits of regulation in providing a framework for taxation of property and development gains, and therefore finance for necessary infrastruc-ture and services, were not being realized.
• Regulatory and allocation systems tended to reinforce inequalities and exclusion by generating large-scale benefits to those able to develop in the formal sector while worsening conditions for those without the resources to do so.
• Regulatory systems also increased the potential for speculation and the manipula-tion of these systems by those with insider knowledge and adequate resources.
• Most fundamentally, regulatory systems tended to be oriented almost entirely toward constraining development rather than providing a positive environment in which the major actors could respond to opportunity.
Even so, in the context of housing, the World Bank has from an early time rec-ognized the benefits of a planned approach at the site level (World Bank, 1974; Angel, 2000).
3.1 Changing Emphases
In the intervening years the starting point for Bank policy advice has tended to be strongly market oriented, with much of the emphasis on improving property rights, getting rid of regulatory constraints, and encouraging the use of pricing both to
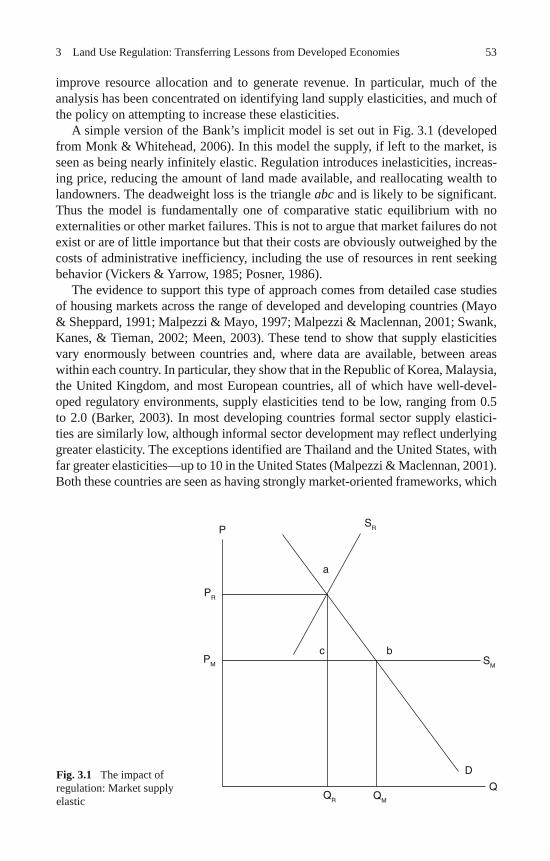
533 Land Use Regulation: Transferring Lessons from Developed Economies
improve resource allocation and to generate revenue. In particular, much of the analysis has been concentrated on identifying land supply elasticities, and much of the policy on attempting to increase these elasticities.
A simple version of the Bank’s implicit model is set out in Fig. 3.1 (developed from Monk & Whitehead, 2006). In this model the supply, if left to the market, is seen as being nearly infinitely elastic. Regulation introduces inelasticities, increas-ing price, reducing the amount of land made available, and reallocating wealth to landowners. The deadweight loss is the triangle abc and is likely to be significant. Thus the model is fundamentally one of comparative static equilibrium with no externalities or other market failures. This is not to argue that market failures do not exist or are of little importance but that their costs are obviously outweighed by the costs of administrative inefficiency, including the use of resources in rent seeking behavior (Vickers & Yarrow, 1985; Posner, 1986).
The evidence to support this type of approach comes from detailed case studies of housing markets across the range of developed and developing countries (Mayo & Sheppard, 1991; Malpezzi & Mayo, 1997; Malpezzi & Maclennan, 2001; Swank, Kanes, & Tieman, 2002; Meen, 2003). These tend to show that supply elasticities vary enormously between countries and, where data are available, between areas within each country. In particular, they show that in the Republic of Korea, Malaysia, the United Kingdom, and most European countries, all of which have well-devel-oped regulatory environments, supply elasticities tend to be low, ranging from 0.5 to 2.0 (Barker, 2003). In most developing countries formal sector supply elastici-ties are similarly low, although informal sector development may reflect underlying greater elasticity. The exceptions identified are Thailand and the United States, with far greater elasticities—up to 10 in the United States (Malpezzi & Maclennan, 2001). Both these countries are seen as having strongly market-oriented frameworks, which
Fig. 3.1 The impact of regulation: Market supply elastic
a
c b
SR
PR
P
PM SM
QR QM
Q
D
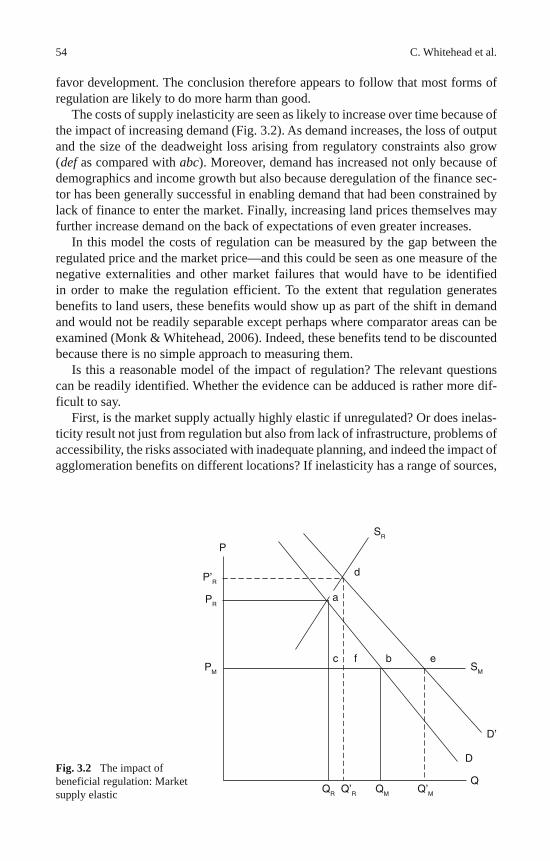
54 C. Whitehead et al.
favor development. The conclusion therefore appears to follow that most forms of regulation are likely to do more harm than good.
The costs of supply inelasticity are seen as likely to increase over time because of the impact of increasing demand (Fig. 3.2). As demand increases, the loss of output and the size of the deadweight loss arising from regulatory constraints also grow ( def as compared with abc ). Moreover, demand has increased not only because of demographics and income growth but also because deregulation of the finance sec-tor has been generally successful in enabling demand that had been constrained by lack of finance to enter the market. Finally, increasing land prices themselves may further increase demand on the back of expectations of even greater increases.
In this model the costs of regulation can be measured by the gap between the regulated price and the market price—and this could be seen as one measure of the negative externalities and other market failures that would have to be identified in order to make the regulation efficient. To the extent that regulation generates benefits to land users, these benefits would show up as part of the shift in demand and would not be readily separable except perhaps where comparator areas can be examined (Monk & Whitehead, 2006). Indeed, these benefits tend to be discounted because there is no simple approach to measuring them.
Is this a reasonable model of the impact of regulation? The relevant questions can be readily identified. Whether the evidence can be adduced is rather more dif-ficult to say.
First, is the market supply actually highly elastic if unregulated? Or does inelas-ticity result not just from regulation but also from lack of infrastructure, problems of accessibility, the risks associated with inadequate planning, and indeed the impact of agglomeration benefits on different locations? If inelasticity has a range of sources,
Fig. 3.2 The impact of beneficial regulation: Market supply elastic
ebc f
a
d
P
SR
P’R
PR
PM
QR Q’R QM Q’MQ
D
D’
SM
553 Land Use Regulation: Transferring Lessons from Developed Economies
which is the most important, and does addressing one particular constraint neces-sarily improve the situation?
Second, to what extent does the regulated supply curve reflect real negative externalities and other costs of excessive or ill-organized development—and to what extent an inefficient overconstraint arising from political tensions, slow adjust-ment, or other administrative failures? To the extent that it reflects the first, is the approach responsive enough to identify the differences in these negative externali-ties between particular locations?
Third, can more positive approaches to regulation produce win-win situations? That is, can the greater organization and certainty associated with a well-struc-tured regulatory framework support more efficient production of infrastructure and encourage greater investment as well as possibly enable the use of other instruments such as congestion charging?
Fourth, can regulation improve rather than worsen distribution? That is, can it enable the provision of public and social goods such as open space and affordable housing and effectively support the property tax base and the taxation of devel-opment gains, thus providing an income source for community development and services?
Nobody would suggest that regulation can cure all the ills of urban development. However, it is equally undesirable to reject the benefits of regulation because of the observed extent of bad regulation. Looking at more successful examples in the developed world may help to clarify some of the factors necessary to make land use regulation a more positive force.
3.2 Lessons from Developed Economies
Perhaps the most important issue relates to the elasticity of supply. If the evidence suggests that among developed economies only the United States has very elastic supply, a reasonable question must be, are there reasons that in most economies the supply is quite inelastic (Evans, 2004; Monk & Whitehead, 2006; Malpezzi & Mayo, 1997)?
The supply of raw land in most developed economies is undoubtedly potentially elastic, except in those countries with extreme physical constraints. Even Hong Kong (China) and Singapore have not fully developed all the land in their terri-tories. In most economies only a small part of the surface area has been subject to development. However, in most instances raw land is not the relevant variable. What matters is developable land with services and accessibility.
The most obvious reason that land may not be readily supplied is the provision of infrastructure. This normally requires a reasonably clear plan to reduce risk and ensure provision—as well as the capacity to finance investment with very long-term payouts and often very limited ability to raise revenue directly from the services provided (such as roads).
It is not always possible to replicate accessibility simply through constant levels of investment; thus the cost of land with similar attributes increases as the urban
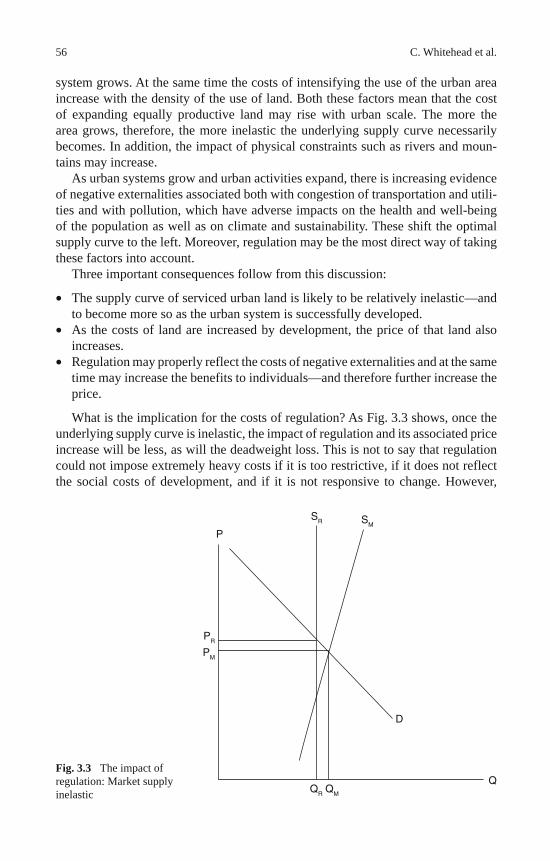
56 C. Whitehead et al.
system grows. At the same time the costs of intensifying the use of the urban area increase with the density of the use of land. Both these factors mean that the cost of expanding equally productive land may rise with urban scale. The more the area grows, therefore, the more inelastic the underlying supply curve necessarily becomes. In addition, the impact of physical constraints such as rivers and moun-tains may increase.
As urban systems grow and urban activities expand, there is increasing evidence of negative externalities associated both with congestion of transportation and utili-ties and with pollution, which have adverse impacts on the health and well-being of the population as well as on climate and sustainability. These shift the optimal supply curve to the left. Moreover, regulation may be the most direct way of taking these factors into account.
Three important consequences follow from this discussion:
• The supply curve of serviced urban land is likely to be relatively inelastic—and to become more so as the urban system is successfully developed.
• As the costs of land are increased by development, the price of that land also increases.
• Regulation may properly reflect the costs of negative externalities and at the same time may increase the benefits to individuals—and therefore further increase the price.
What is the implication for the costs of regulation? As Fig. 3.3 shows, once the underlying supply curve is inelastic, the impact of regulation and its associated price increase will be less, as will the deadweight loss. This is not to say that regulation could not impose extremely heavy costs if it is too restrictive, if it does not reflect the social costs of development, and if it is not responsive to change. However,
Fig. 3.3 The impact of regulation: Market supply inelastic
D
QQR QM
PR
PM
P
SR SM
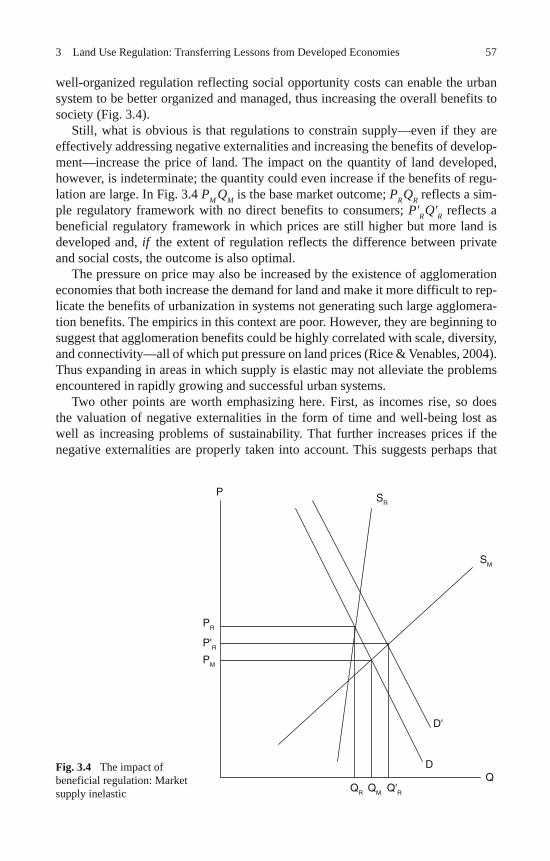
573 Land Use Regulation: Transferring Lessons from Developed Economies
well-organized regulation reflecting social opportunity costs can enable the urban system to be better organized and managed, thus increasing the overall benefits to society (Fig. 3.4).
Still, what is obvious is that regulations to constrain supply—even if they are effectively addressing negative externalities and increasing the benefits of develop-ment—increase the price of land. The impact on the quantity of land developed, however, is indeterminate; the quantity could even increase if the benefits of regu-lation are large. In Fig. 3.4 P M Q M is the base market outcome; P R Q R reflects a sim-ple regulatory framework with no direct benefits to consumers; P' R Q' R reflects a beneficial regulatory framework in which prices are still higher but more land is developed and, if the extent of regulation reflects the difference between private and social costs, the outcome is also optimal.
The pressure on price may also be increased by the existence of agglomeration economies that both increase the demand for land and make it more difficult to rep-licate the benefits of urbanization in systems not generating such large agglomera-tion benefits. The empirics in this context are poor. However, they are beginning to suggest that agglomeration benefits could be highly correlated with scale, diversity, and connectivity—all of which put pressure on land prices (Rice & Venables, 2004). Thus expanding in areas in which supply is elastic may not alleviate the problems encountered in rapidly growing and successful urban systems.
Two other points are worth emphasizing here. First, as incomes rise, so does the valuation of negative externalities in the form of time and well-being lost as well as increasing problems of sustainability. That further increases prices if the negative externalities are properly taken into account. This suggests perhaps that
Fig. 3.4 The impact of beneficial regulation: Market supply inelastic
SR
SM
D'
D
QR QM Q'RQ
P
PR
P'RPM
58 C. Whitehead et al.
well-organized planning may have smaller benefits in developing than in developed economies. However, to the extent that factors of production—whether labor or global capital—are mobile, effectively addressing negative externalities can have a significant effect on competitiveness.
Second, the increases in land prices associated with development will dispro-portionately affect the groups that do not directly benefit from the greater produc-tivity and incomes—notably those providing unskilled and service labor where immigration can hold down wages. This often puts further pressure on available housing for poorer groups and increases problems of affordability. Successful planning, just as much as poor planning, generates inequalities and a need for additional intervention to provide basic services. It is perhaps for this reason that economies seen as having been relatively effective in implementing positive approaches to land use planning, such as France and the Netherlands in Europe and Hong Kong (China) and Singapore in Asia, have all had a strong commitment to the provision not only of housing for the poorest but also of affordable housing for a wide range of households (Whitehead & Scanlon, 2007; Whitehead & Monk, 2008). Moreover, these are all economies in which the government intervenes strongly through master planning; regulation is linked to funding; and public-pri-vate partnership is well developed.
3.3 Case Studies
We now turn to three case studies that reflect some of the benefits and costs of land use regulation in different contexts. The first looks at the United Kingdom, which has what is probably the longest and most consistent history of land use planning in a developed market economy. The second discusses relatively successful experi-ence in an Eastern European country moving to modernize planning systems in the new market environment. The third examines how Hong Kong (China) has used planning and state ownership in partnership to increase the value of development—and asks whether China has similar opportunities.
3.3.1 The United Kingdom
The United Kingdom clearly fits the model set out in Figs. 3.3 and 3.4. The underly-ing market supply elasticity is inherently low because of overall densities of popu-lation and economic activity as well as the long history of development. At the same time land use planning acts as a strong constraint on that elasticity of supply. Whether the economic benefits to consumers are significant—thus increasing the demand for land—is a matter for empirical analysis. But it is also clear that there is significant loss of resources through rent seeking behavior.
In the United Kingdom, as in the rest of Europe and most developed economies, there is general political acceptance of the need for land use planning. That makes it
593 Land Use Regulation: Transferring Lessons from Developed Economies
relatively easy to implement constraints—but often more difficult to effect change. The land use planning legislation of 1947 has remained fundamentally unchanged for 60 years. It is still consistently supported by all political parties and by the gen-eral public even though most recognize that there are costs in terms of higher house prices and more limited transportation and employment opportunities.
The Town and Country Planning Act 1947 was the starting point for modern land use planning in the United Kingdom. It essentially nationalized development rights, giving to government the power to determine any change of use and the form of new development. This has constrained development, reduced urban sprawl, and maintained central urban areas—at the cost of reducing the elasticity of land sup-ply but with the benefit of higher density of population, more sustainable public transportation, and some capacity to organize urban regeneration (Barker, 2003; Whitehead & Monk, 2008).
One result of this level of control—and of the level of public acceptance of the approach—has been the capacity to use the land use planning system to generate revenues and other benefits for the community from the increase in value arising from granting planning permission. Because government owns the property rights to development, it can properly require the developer to provide infrastructure and other services, ultimately paid for by the landowner. The U. K. approach is particularly important in the context of affordable housing because it focuses on bringing together both the land and the finance required (Crook & Whitehead, 2002).
How has the system developed? Throughout the 1980s there was growing use of planning powers to require developers not only to provide the investment necessary to offset any immediate externalities associated with the site but also to provide for the broader needs of the community arising from development—often through a levy for transportation, education, and other services. The Town and Country Planning Act 1990, through Section 106, enabled broader negotiation, notably with respect to affordable housing. As long as a local authority has in place a local hous-ing needs assessment that shows a need for additional affordable housing, it can require residential developers to make a contribution toward the provision of this housing. This contribution is normally required on the site, thus supporting the goal of mixed-income communities. It can be in the form of social rented housing or low-cost shared ownership accommodation.
Depending on the size of the planning gain and the negotiations, the developer may be required to provide the land or indeed the housing free of charge—or there may be government subsidy available to make the housing affordable. In the more pressured parts of the country, where prices are high and affordable housing scarce, the contribution will normally be around 20–25% of units developed; in London the goal is between 35 and 50%. The requirement allows a significant developer contribution, which itself reduces the sale price of land—so that at least in principle the “tax” is paid by the landowner (Monk et al., 2006; Crook, Monk, Rowley, & Whitehead, 2006). The process is possible only because of the nature of the land use planning regulations—and because of the planning gain arising from permission. But as argued, this gain is almost inevitable in successful urban systems.
60 C. Whitehead et al.
The approach can also be effectively used to increase densities of development and therefore to support the sustainability agenda. In the United Kingdom there is a requirement that at least 60% of all new housing be located on brownfield land, much of which is being redeveloped at higher densities. Technically, the use of Sec-tion 106 is a separate contract that should not change the planning decision. But in practice, because of the on-site requirement, the mix of privately provided housing also changes, with a resultant increase in density.
New legislation has now been passed that introduces a more broadly based com-munity infrastructure levy, which will enable local authorities and subregions to require contributions from developers toward infrastructure necessary to support sustainable development. This approach will entail more transparent investment planning as a prerequisite for taxation (United Kingdom, Department of Communi-ties and Local Government, 2008).
The general approach to providing both infrastructure and affordable housing through a public-private partnership funded in large part from the enhancement of land values is being implemented in many other countries in Europe as well as Australia and Korea. It also bears some resemblance to local approaches in the United States. How well the system can operate depends heavily on the allocation of property rights within the land use planning system. In Australia and New Zea-land, for example, government negotiators use offers of greater density to secure larger contributions toward affordable housing from developers. Similarly, in Hong Kong (China) and China higher densities may be allowed in exchange for larger contributions (see Sect. 3.3.3).
3.3.2 Postsocialist Cities
Postsocialist cities have had to modify existing land use regulatory systems to enable land and finance markets to operate effectively. Overregulation massively restricted the elasticity of supply and generated large-scale rent seeking behavior.
Cities across postsocialist transition economies have borne the main brunt of recent economic and social transformation—urbanization; privatization of land, real estate, and retail sectors; and the rapid introduction of new planning and fiscal systems to manage urban development. While these trends vary greatly across cit-ies in the postsocialist world, a number of studies have pointed to three constraints commonly affecting the supply of serviced urban land:
• The absence of a recent regulatory land use plan leads to project-by-project approval, delays, and opportunities for corruption.
• The difficulty of acquiring undeveloped land—because of incomplete land reg-istration, disputes over title, or claims for restitution—leads to high transaction costs.
• The lack of municipal funding for primary infrastructure often transfers to devel-opers the costs of providing off-site links to the road network as well as exten-sions and upgrades (Stanley, 2007).
613 Land Use Regulation: Transferring Lessons from Developed Economies
The experience of Sofia, the capital of Bulgaria, demonstrates the importance of addressing these constraints systematically. Besides the need to go beyond orthodox planning and land title regulation, it illustrates the value of improving land manage-ment systems and increasing the operational efficiency of the municipal administra-tion for urban real estate markets.
Planning in Bulgaria is done at the national and regional levels through territo-rial spatial plans that define the broad planning framework for urban regulatory plans (master plans) at the local level. In line with these requirements, Sofia’s local government invested considerable resources in developing a new long-term plan, adopted in 2003. The process was lengthy, comprehensive, and participatory. In addition to this statutory land use plan, the municipal leadership developed a spa-tial strategy in 2001 with the assistance of the World Bank and the Cities Alliance (Tsenkova, 2007). These plans provided opportunities for future growth of the city in the context of cumulative infrastructure deficits and fiscal constraints on capi-tal investments. Moreover, they replaced planning documents dating to the 1960s that had numerous, often overlapping amendments with incomplete coverage of the urban area. Such urban plans are common in Bulgaria: when urban land, or farm-land within urban boundaries, is restituted, owners seek to introduce partial amend-ments that will allow development and increase the value of the land. There are no common rules for this process, which can take from a few days to several years. Moreover, corruption is widespread (Munro-Faure & Evtimov, 2000).
In addition to the lack of up-to-date plans, bureaucratic planning procedures in Sofia and other postsocialist cities are regarded as significant barriers to effi-cient land allocation. 1 The small and often underfunded departments that deal with building and occupancy permits must contend with frequent changes in the nor-mative and legal basis for land allocation; new construction laws, standards, and norms; and lack of enforcement capacity. A complex and nontransparent system for obtaining permits and licenses for construction contributes to delays and abuse. Sofia’s strategic plan recommended setting up “a one-stop shop” with a clear legal and technical framework for its operation to streamline the planning and building approvals process. This operational improvement, essential for implementing the plan, minimizes the costs and risks for investors.
In some postsocialist cities, in the absence of reformed regulatory instruments for strategic planning to guide land allocation, the prices of privatized urban land with clear title have reached historically high levels. The housing deficit, produced by largely artificial imbalances in the supply of land in growth areas, has led devel-opers to adopt strategies ranging from illegal development in periurban areas to illegal additions and infrastructure connections. In the Belgrade region the formal sector has recently been producing around 1,500 housing units a year, mostly for the upper segments of the market, while informal production has ranged around 50,000 a year (Tsenkova, 2008). 2
1 In Montenegro a recent study showed that obtaining a permit to build 1,000 m 2 required 15 approv-als, 3 certificates, and 2 official statements from 15 different institutions (Tsenkova, 2006). 2 In some countries (such as Albania, Croatia, and Serbia) nearly half the construction is illegal or has some informalities.
62 C. Whitehead et al.
Sofia has had more limited manifestations of illegality, but land prices in attractive locations have steadily increased to well above the average for the coun-try (Munro-Faure & Evtimov, 2000). The evidence suggests that urban land markets have become more fragmented, reflecting differential opportunities for develop-ment and profit. Land barter deals, common at the start of the transition, have lost their attractiveness, with the share of built residential floor space provided in exchange for land falling from 45% in the early 1990s to 12–15% today (Tsenkova, 2008). While the myriad ownership arrangements remain a barrier in some cases, the overall improvement and computerization of landownership records, cadastral mapping records, and urban planning records have provided better security for the real estate market.
In addition to the positive impact of improved land management systems on the supply of urban land, Sofia has experienced some transformation of land tenure as a result of restitution and privatization. Owners took immediate advantage of the opportunities offered by the market-based system, which is not surprising, given the city’s legacy of a high homeownership rate (more than 90%) 3 and private landown-ership in the case of single-family homes and small-scale residential developments. The liberalization of prices in the early 1990s quickly led to the development of real estate markets, mostly for residential properties, where the price map reflected the attractiveness of location, quality, and availability of services. Fifteen years later, sales of residential property and urban land for residential or mixed-use develop-ment still account for more than 80% of the transactions in Sofia’s real estate market, the most dynamic in the country. Since markets did not start from scratch, acceler-ating the development of a modern cadastre system—a precondition for effective land management—has been more manageable than in other postsocialist countries (such as Albania, the Russian Federation, and Serbia), where systems were often nonexistent or had limited coverage.
While Sofia’s experience demonstrates the effect of better planning and more streamlined procedures for building permits on the supply of urban land, the munic-ipality still faces significant challenges in providing basic infrastructure services. Like other postsocialist municipalities, it has acquired many new functions without the resources to fulfill its mandate under a new model of decentralized governance. This financial weakness, coupled with the inability to borrow in capital markets and the dependence on central government transfers, drastically reduces the capacity of local governments to develop and maintain services, leading to a shortage of serv-iced urban land for future development. Typically, even if developers have access to land with clear title, the cash-constrained municipality will shift infrastructure costs to these developers and demand contributions for upgrading water supply and sewerage systems. In Sofia this practice has led to higher costs for serviced land and a fragmented land market, particularly in locations with greater demand.
3 In countries in the Soviet Union private ownership of urban land was nonexistent. In the Russian Federation more than 50 million people and legal entities have acquired private ownership rights to land, and 129 million hectares, comparable to the area of Western Europe, were privatized within the first four years of the transition (Tsenkova, 2006).
633 Land Use Regulation: Transferring Lessons from Developed Economies
3.3.3 Hong Kong (China) and China
Hong Kong (China), and now China, provide examples of a strongly regulatory approach aimed at maximizing the productivity of land but taking a significant pro-portion of the benefits into the public domain in the form of infrastructure and affordable housing. Their special attribute is that land remains under public owner-ship but development is private in a strongly market-based economy in which the rules of the market are defined by the regulatory framework.
Hong Kong (China) is thus an example of a highly regulated system in which the incentives are generally closely aligned with the objectives of increasing develop-ment potential. At the same time there is strong governmental recognition of the need for affordable housing, which is enabled by planning controls, the revenues obtained from the sale of leases, and the proceeds from the sale of public housing. The regulatory process is reinforced by public landownership and by well-defined contractual relationships between the government and developers, which exemplify effective public-private partnership.
The planning system involves territorial and subregional development strate-gies and plans determined administratively after public consultation. At the dis-trict level almost all developable and developed land is covered by statutory land use zoning plans. Except for a tiny plot of land in the city center, all land is owned by the government. Land was leased to developers through regular land auctions before 1999. Since then, land auctions have been contingent on the successful triggering of sites from the reserved land list by developers offering open bid prices to the satisfaction of the government, making the system more responsive. Land leases are generally renewable long-term tenancies. A very small proportion of land is disposed of through private treaty grants or tenders for special land use purposes (Chiu, 2007).
The planning and development of new areas are administered by the govern-ment with the participation of relevant organizations (e.g., utility companies and mass transit companies). All new towns are connected by mass transit systems and other modes of public transportation, which are commercially run and account for 90% of travel trips (Hong Kong, China, Transport Department, 2003). Public utility companies, except water, are also commercially operated.
Within the limits set by density zoning (there are three density zones in Hong Kong, China), traffic capacity, sewerage capacity, and other planning controls such as building height restrictions and urban design guidelines, the planning authority usually maximizes the development intensity of new or redeveloped sites and speci-fies the intensity in the statutory outline zoning plans. This is significant because land premiums charged by the government increase in tandem with development intensity. Between 1989 and 2006 land revenue accounted for 10% on average of total annual government revenue (Hong Kong (China), Census and Statistics Depart-ment, various years). Stamp duty levied on property transactions also increases with development intensity, because greater intensity usually means higher buildings and thus more expensive units on high floors.
64 C. Whitehead et al.
The planning process is designed to provide a mechanism for creating better living environments and increasing certainty for developers and the community. At the macro level the planning of new growth areas (new towns), which translates the territorial spatial strategy and the subregional planning concepts into concrete reali-ties, is an active process for creating a living environment that meets contemporary standards, given constraints and other related policy directives. Planning on this scale is able to incorporate the provision of infrastructure and other urban services, especially transportation networks and community facilities, usually divided into a number of phases. In the initial phases, when the agglomeration effect is still lacking and infrastructure is incomplete, public housing development usually domi-nates. Land leases for private housing and commercial uses, which come at a later stage, are able to capitalize on agglomeration effects and a more mature planned environment. At the micro level the various land use zonings are aimed at provid-ing pleasant and compatible local living and working environments (Hong Kong, China, Town Planning Board, various years).
Planning controls undoubtedly restrict the supply of developable space in Hong Kong (China). They also increase development costs and risks where planning applications are necessary, particularly after project commencement. Such costs are often incurred on sites zoned as comprehensive development areas, where any change in the approved master plan requires planning permission. Given the scale of development, revisions are inevitable. Extra costs are also incurred as a result of conditions attached to planning approvals. Finally, planning controls facilitate the provision of affordable housing in three main ways: by the planning and devel-opment of new towns where serviced sites are provided for the construction of public housing for rent and sale; by the extent to which development intensities are increased to enable the supply of public housing; and by the stipulation in the plan-ning guidelines of provision standards for community and retail services based on population scales.
Land use planning could not be effective on its own in Hong Kong (China), any more than it could be anywhere else. Planning controls and approval con-ditions have to be supported through the land lease agreements between the government as landlord and the land user as lessee and through building plan approvals executed under the building ordinance. Equally, public ownership of land strongly supports the use of planning tools to enhance the supply of afford-able homes.
China uses a somewhat similar approach, though with clearer trade-offs because profit rates are specified. Land is publicly owned but leased or administratively allocated to land users under permanent or fixed-term leases. The relaxation of development controls on the intensity of use is one of the most important mecha-nisms for encouraging developers to participate in subsidized housing projects tar-geted at lower-middle-income families. While the gross profit rates are fixed in these projects, the development intensities of the commercial portions are increased to allow greater overall profit margins.
The state in the transition economy of China retains ownership of all land, strictly regulates land transactions (e.g., private deals on sale price are not permitted),
653 Land Use Regulation: Transferring Lessons from Developed Economies
and controls land development rights by requiring planning permission from the government for all development projects. Yet land is disposed of at market prices, and the housing sector is dominated by owner-occupied housing (80%), reflecting the general policy of privatization—including the massive sale of public housing in the 1990s and the policy emphasis on owner occupation since that time. Hous-ing is supplied by commercial development companies, which are often directly or indirectly associated with government or the collective sector. Subsidized housing is provided on only a limited scale.
The planning system has several tiers: national, provincial, and municipal plans outline strategic directions and infrastructure development, and districts and site plans specify land use requirements and development intensities (Chiu, 2007; China, Ministry of Construction, 2004). However, the conflicting roles of the government, as the owner and a major user of land, can hamper the effective exercise of planning controls. It is also generally acknowledged that unauthorized development is ram-pant in this transition economy, because the planning authorities are not adequately empowered within the bureaucratic setup (Ng & Tang, 1999).
Land sale exercises in new areas often are not synchronized with the develop-ment processes. On-site provision of infrastructure and affordable housing require-ments are the responsibility of developers. Moreover, although it is the government’s responsibility to provide off-site infrastructure (e.g., supplies of gas, water, and electricity) according to development plans, the poor coordination and institutional barriers among local authorities and state-owned utility companies may force devel-opers to take responsibility or may result in inadequate provision.
In the shift to a market-oriented housing system, state allocation of housing was terminated but housing subsidies for lower-income families were retained. However, the subsidies, although reemphasized since 2007, were not well engi-neered (China, State Council, 2007). There are continuing tensions between agricultural uses and development pressures, and compensation terms for farm-ers are only just being put into place (Shanghai Forum Organizing Committee, 2008). Government land is allocated free for rental housing but at cost price for sale housing. The sites for rental housing are usually in less desirable loca-tions because sites with better accessibility and greater agglomeration benefits are reserved for open land sales. Developers are invited to take on the subsidized owner-occupation projects, subject to both profit and price control. A fundamen-tal issue is how to organize the management and allocation of subsidized rental housing in a privatized environment. Districts often have more responsibilities than powers.
3.4 Implications
The three case studies point to a number of important implications with respect to the value of formal land use planning systems, the need for additional government support to achieve large-scale housing investment, the distinct challenges involved
66 C. Whitehead et al.
in urban regeneration rather than new building on greenfield sites, and who actually benefits.
First, the three examples show the importance of transparent and enforceable land use planning systems both in ensuring effective development and in allocat-ing the benefits of that development to local communities. They suggest that it is possible to use plans to help rather than hinder that development and to increase benefits to the consumers. However, they also show that, if successful, this will lead to higher land and house prices, implying a need for distributional policies to go hand-in-hand with regulation. Finally, they suggest that as economies become wealthier and market supply inherently less elastic, the benefits of good regulation can increase.
No one could suggest that any of these examples is a first-best solution. Indeed, the housing economist Stephen Mayo when at the World Bank often designated the U.K. system as Stalinist, and in the United Kingdom today there is much debate about how to increase supply elasticities without losing the benefits of planning.
Instead, the examples reflect different regulatory approaches to bringing together different instruments in a way that makes it possible to achieve development that is compatible with successful urban growth and with limiting negative externalities. Regulation can also provide a means to raise funds for the provision of infrastruc-ture and, particularly, of affordable housing. Both depend on political commitment and on government involvement. But the examples suggest ways forward in cir-cumstances in which the starting point is an existing planning system rather than an unregulated land market. Experience in past attempts at reform in these circum-stances shows that simply removing particular constraints has little impact on behav-ior and outcomes—so it is important to build on positive partnership approaches. Evidence also suggests that as incomes rise, the benefits of moving toward a better-organized regulatory system are likely to increase.
Second, experience suggests that in most regulated systems effective means of achieving large increases in investment in housing tend to require significant gov-ernment intervention either to provide publicly owned land or reduce the price of land for development and to provide services. The challenge is then to obtain a fair return on that investment through increased revenues over the longer term. Effec-tive planning is a necessary precondition for this.
Third, the most important emerging problem is effective organization of urban regeneration and redevelopment, especially in environments in which owner occu-pation and therefore fragmentation of landownership are prevalent. To generate higher-valued, higher-density developments in these circumstances requires effec-tive use of planning powers as well as appropriate compensation mechanisms. This is undoubtedly the major challenge facing the land use planning system in the 21st century.
Finally, there are the issues of who receives the benefits of planning; the poten-tial to use information and relative power to distort decisions and the allocation of benefits; and at the limit the impact of corruption. In well-developed legal and regulatory systems like those found in many developed economies, there are undoubtedly examples of successful rent seeking. But transferring such systems to
673 Land Use Regulation: Transferring Lessons from Developed Economies
rapidly developing countries with fewer enforcement powers can be fraught with the danger of enriching particular groups at the cost of the community as a whole. Yet even in these circumstances, if regulation enhances efficiency, government may have to accept rent seeking as a necessary cost—while at the same time attempting to improve enforcement procedures within general legal and taxation systems.
3.5 Conclusions
The discussion in this chapter suggests a number of conclusions. First, the World Bank is well aware of the benefits of good regulation. Much of its early work on sites and services policies reflected its understanding of the efficiency costs of low-density unplanned developments where reorganization of the land could signifi-cantly enhance values. At a broader level, the Bank has also recognized the benefits of putting into place systems that can capture some of the enhanced value of land to fund necessary infrastructure. However, in part because so many developing countries have inflexible regulatory systems that do not effectively relate to present conditions, the emphasis at the Bank has been mainly on reducing regulation and emphasizing the value of markets in allocating land resources.
In this context it is also well worth remembering that regulation is the easiest form of government intervention to introduce. This means that it is the first recourse for addressing issues. Equally, it suffers from being introduced as a knee-jerk response to crisis. But modifying established regulation is often far more difficult if only because those who gained from its existence are usually more powerful.
Second, poorly specified regulation that is not based on the social costs and bene-fits of development often cannot adjust to changing circumstances and technologies and cannot enable appropriate development to take place. Thus poor regulation gen-erates poor outcomes, although not necessarily worse ones than would be achieved through the market. Of particular relevance here is that in developed economies the incentives to enable development are often lacking because those who already have a stake in the system feel that they lose out when additional land and housing are provided. Regulation often reinforces this lack of response. However, even strongly market-oriented systems appear to become less flexible as urban systems develop. In this context the issues of NIMBYism no longer seem to be associated solely with traditional planned economies but apply as much to more market-based economies such as the United States, at least in the more desirable areas.
Third, the benefits of well-organized urban systems that provide a good living environment and enhance productivity increase with incomes and wealth. At the same time the costs of the negative impacts of growth—such as traffic conges-tion, overutilization of public services, and pollution—also increase. The benefits of getting the regulatory framework to operate effectively therefore increase with success.
Fourth, land use planning can provide a strong base from which to tax devel-opment gains and thus support infrastructure provision either directly through the
68 C. Whitehead et al.
revenue raised or by reducing the cost of land through the imposition of planning requirements.
Finally, land use planning cannot operate effectively except within a suite of complementary policies, which must include instruments to offset the negative dis-tributional impacts of even the most successful planning regimes.
Acknowledgements The idea for this chapter was developed by Bengt Turner and Christine Whitehead before Bengt’s untimely death in April 2007. The authors would like to dedicate the chapter to his memory.
References
Angel, S. (2000). Housing policy matters . Oxford: Oxford University Press. Barker, K. (2003). Review of housing supply: Interim report, analysis . London: HMSO. China, Ministry of Construction. (2004). Land management ordinance chapter 3 (in Chinese).
from http://www.realestate.gov.cn/law China, State Council. (2007). Guofa (2007) no. 24 [ State Council Announcement (2007), no. 24 ].
(in Chinese) Chiu, R. L. H. (2007). Planning land and affordable housing in Hong Kong. Housing Studies ,
22 (1), 63–81. Crook, A., Monk, S., Rowley, S., & Whitehead, C. (2006). Planning gain and the supply of new
affordable housing in England. Town Planning Review , 77 (3), 353–373. Crook, A., & Whitehead, C. (2002). Social housing and planning gain: Is this an appropriate way
of providing affordable housing? Environment and Planning A , 34 (7), 1259–1279. Dunkerley, H. B., & Whitehead, C. (Eds.). (1983). Urban land policy: Issues and opportunities.
Oxford: Oxford University Press. Evans, A. W. (2004). The land market and government intervention. In E. Mills & P. Cheshire
(Eds.), Handbook of regional and urban economics (Vol. 3, pp. 1637–1669). Amsterdam: Elsevier.
Hong Kong (China), Census and Statistics Department. (various years). Hong Kong annual digest of statistics. Hong Kong, China: Author.
Hong Kong (China), Town Planning Board. (various years). Annual report . Hong Kong (China): Author.
Hong Kong (China), Transport Department. (2003). Hong Kong : The facts—Transport. Hong Kong (China): Information Services Department.
Malpezzi, S., & Maclennan, D. (2001). The long-run price elasticity of supply of new residential construction in the United States and the United Kingdom. Journal of Housing Economics , 10 (3), 278–306.
Malpezzi, S., & Mayo, S. (1997). Housing and urban development indicators: A good idea whose time has returned. Real Estate Economics , 25 (1), 1–11.
Mayo, S., & Sheppard, S. (1991). Housing supply and the effects of stochastic development con-trol. [Oberlin Discussion Paper in Economics]. Oberlin, OH: Oberlin College, Economics Department.
Meen, G. (2003). Regional housing supply elasticities in England. Paper commissioned by the Barker Review, HM Treasury, London.
Monk, S., Crook, A., Lister, D., Lovatt, R., Ni Luanaigh, A., Rowley, S., et al. (2006). Deliver-ing affordable housing through Section 106: Outputs and outcomes. York, England: Joseph Rowntree Foundation.
Monk, S., & Whitehead, C. M. E. (2006). Spatial planning and value. London: Royal Town Plan-ning Institute.
693 Land Use Regulation: Transferring Lessons from Developed Economies
Munro-Faure, P., & Evtimov, V. (2000). Bulgaria urban property market study [Draft, May]. Washington, DC: World Bank, Europe and Central Asia Region.
Ng, M. K., & Tang, W. L. (1999). Land-use planning in “one country, two systems”: Hong Kong, Guangzhou and Shenzhen. International Planning Studies , 4 (1), 7–27.
Posner, R. (1986). The economic analysis of law. Boston: Little Brown. Rice, P., & Venables, A. J. (2004). Spatial determinants of productivity: Analysis for the regions
of Great Britain [CEP Discussion Paper 642]. London: London School of Economics, Centre for Economic Performance.
Shanghai Forum Organizing Committee. (2008). Regional economic growth and equity policy: Collection of papers. Shanghai: Fudan University.
Stanley, V. (2007, March). World Bank responses to the problem of informal development: Current projects and future action. Paper presented at the FIG (International Federation of Survey-ors) Commission 3 Workshop on Informal Settlements—Real Estate Market Needs Related to Good Land Administration and Planning, Athens, Greece.
Swank, J., Kanes, J., & Tieman, A. (2002). The housing ladder, taxation and borrowing con-straints. Amsterdam: Netherlands Central Bank.
Tsenkova, S. (2006). Beyond transitions: Understanding urban change in post-socialist cit-ies. In S. Tsenkova & Z. Nedovic-Budic (Eds.), The urban mosaic of post-socialist Europe (pp. 131–156). Heidelberg: Springer.
Tsenkova, S. (2007). Reinventing strategic planning in post-socialist cities: Experiences from Sofia. European Planning Studies , 15 (3), 295–317.
Tsenkova, S. (2008). The challenges of informal settlements in the ECE region . Geneva: United Nations Economic Commission for Europe.
United Kingdom, Department of Communities and Local Government. (2008). The community infrastructure levy. London: Author.
Vickers, J., & Yarrow, G. (1985). Privatization and the natural monopolies . London: Public Policy Centre.
Whitehead, C. M. E., & Scanlon, K. J. (2007). Social housing in Europe . London: London School of Economics.
Whitehead, C. M. E., & Monk, S. (2008). Achieving affordable housing through the planning system. In Shanghai Forum Organizing Committee, Regional economic growth and equity policy: Collection of papers (pp. 199–212). Shanghai: Fudan University.
World Bank. (1974). Sites and service projects . Washington, DC: Author.

“This page left intentionally blank.”
71
Despite a formidable land administration system and a strong land rights base, South African cities and towns continue to manifest the historical inequality of class and race in their spatial patterns of land use and ownership. This is reflected in, and reinforced by, unequal access to markets in land, housing, property in general, and development and use rights. This chapter discusses, at least in notional terms, in what balance market distortions and failures are to blame for the fact that the major-ity of the poor remain dislocated to the periurban fringes of cities and towns. It also addresses why it makes sense to open up access to well-located land through the market and government allocation.
4.1 Central Concepts
Because this chapter addresses the theme around “the implications of various land market distortions on urban welfare … particularly for the poor; and consequences of these distortions on the efficacy of … government interventions” (World Bank, 2006 , p. 1), it is necessary to clarify an applied definition of the term market distor-tion and to locate it within the broader notion of market fai l ure .
The term market distortion carries with it the implication that deliberate state regulation or intervention has prevented the “efficient allocation of productive resources” (DFID, 2005 , p. 8) by preventing the free establishment of a clearing price (Murphy, Shleifer, & Vishny, 1992 ).
Where the state fails to impose regulations in areas it is expected to—for exam-ple, in the registering of land titles—the resulting dysfunction of a market may also be said to be caused by a lack of market enablement (that is, a failure to make markets work).
S.V. Lall et al. (eds.), Urban Land Markets, DOI 10.1007/978-1-4020-8862-9_4, © World Bank 2009
Chapter 4Making Urban Land Markets Work Better in South African Cities and Towns: Arguing the Basis for Access by the PoorMark Napier
M. Napier ( )Urban Landmark Hatfield 0083, Tshwane, South Africae-mail: [email protected]
72 M. Napier
Where the regulatory framework is robust, but many members of a society still lack the ability to access a resource or good—an ability, it can be argued, that is fundamental to the alleviation of poverty—this may be referred to as an instance of market failure.
So, it may be said that markets can be distorted by state action, but that private sector activity is often complicit in market failure. It may just as truly be said that at one time or another markets fail in the equitable distribution of a resource, but so do states fail in addressing the needs of the poor and in creating the conditions in which the poor can effectively access markets (P. Draper, South African Institute of International Affairs, personal communication, March 23, 2007).
It has also been observed that governments have long recognised that market outcomes may not be pro-poor and have sought to intervene in markets. Unfortunately, traditional approaches to make markets work better frequently make things worse. This is because distortions are introduced that impair the efficiency of resource use and undermine growth. These distortions may reduce incentives for the private sector to grow and invest, and may not meet the needs of the poor. In the end, because of their costs, these interventions are not sustainable. (DFID, 2005 , p. 2).
Of course, the debates between free market ideologues and state interventionists are long and complex. Depending on the position adopted, the state or the private sector is cast as the villain. This chapter seeks to cast neither as the villain but to look at the cumulative impacts of state and private sector actions on the ability of the poor to access well-located urban land through the markets operating in South African cities and towns.
Urban land differs in some respects from other commodities that are typically addressed by market theory. To be developed, land (usually) requires the public sector to service it and, on application, zone it for development. Similarly, the state is typically (although not always) the body that keeps records of transactions and land titles. 1 In addition, land is not an expandable or fungible resource. Although it may be subdivided and used more efficiently, it remains finite, at least physi-cally. The private sector, the public sector, and civil society all trade in land as a commodity, and the state, if it is involved and has the capacity, acts as arbiter in cases of conflict around land use and, more progressively, in protecting parcels or tracts of land for the common good (such as special zones of social interest in Brazil; UN-Habitat, 2006 ). Land can be viewed as a simple resource, and in some countries access to land is viewed as a basic human right. Land, however, is also a complex commodity:
Usually people assume that land markets are the realm of human activity involved in buy-ing, selling, leasing and securing land. This focus stresses the physical and directs analysis away from the social and cognitive capacities supporting successful land markets. It can lead to a naïve assumption that land is the only ingredient. In fact, successful land markets gain their vitality from creating and marketing abstract land rights and complex commodi-ties, in addition to the land itself. (Wallace & Williamson, 2006 , p. 124).
1 In Portugal, for example, land titles and transaction records were historically held by land nota-ries, under a notary system that was hereditary (Dean, 1971 ).
734 Making Urban Land Markets Work Better in South African Cities and Towns
Thus land is sometimes seen as a basic resource to be distributed fairly (tribal land used for living and cultivation may be reducible to this), 2 and at other times understood as a complex commodity with abstract qualities imputed to it by the use and development rights that apply.
Because of market forces, it is increasingly recognized that if reasonably well-located land is to be secured for low-income housing, the state needs to intervene in some way in urban land markets. But are such interventions inevitably set to distort the market? Dowall ( 1993 ) implies that this need not be the case, observing that there are three generally accepted justifications for government interventions into urban land markets:
1. elimination of market imperfections and failures to increase operating efficiencies; 2. removing externalities so that the social costs of land market outcomes corre-
spond more closely to private costs; and 3. to redistribute society’s scarce resources so that disadvantaged groups can share
in society’s output. (p. 11)
Taking these starting points about market distortions, market failures, state inter-vention, and private sector complicity, this chapter moves from a brief discussion of how urban land markets may have been obviously distorted in the South African context to an examination of how they ultimately fail the poor, and then to a discus-sion of how the state and other actors might intervene to “eliminate” market imper-fections and failures, as suggested by Dowall.
4.2 How Has the South African Land Market Been Distorted?
The apartheid city and its hinterland have been described many times (e.g., Lemon, 1991 ; Smith, 1992; Swilling, Humphries, & Shubane, 1991). The history is one of actively dispossessing black people of their land and preventing them from owning land, through a variety of systems and over many centuries.
4.2.1 Some History
The fundamental elements of segregation and dispossession had already been put into place in South African urban areas during colonial (pre-1910) and postcolo-nial (1910–1948) times (Swanson, 1968) through the native reserve system of the early colonial towns, the 1913 Land Act (which prevented African people from owning land outside the native reserves of the time), and the Native (Urban Areas) Act of 1923 (Lemon, 1991 , p. 1). The Group Areas Act of 1950, introduced by the
2 But even tribal land has complex, often unwritten sets of use, inheritance, and access rights attached to it.
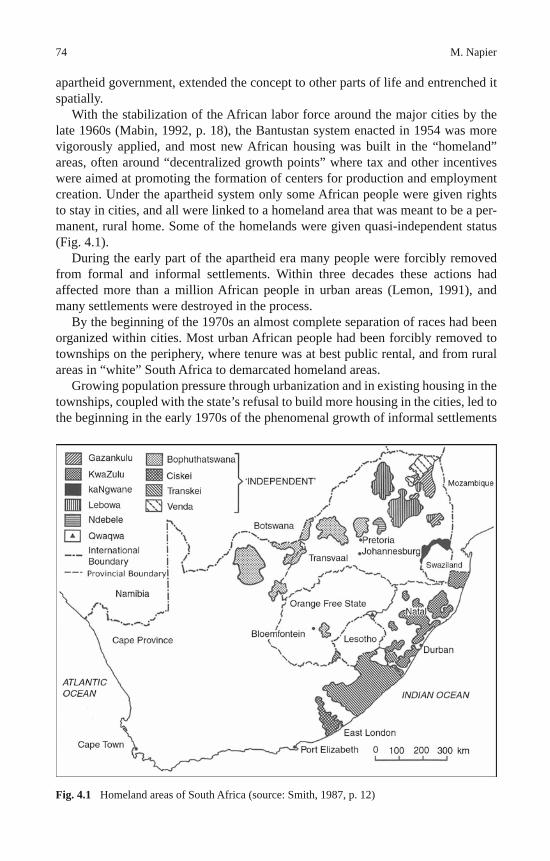
74 M. Napier
apartheid government, extended the concept to other parts of life and entrenched it spatially.
With the stabilization of the African labor force around the major cities by the late 1960s (Mabin, 1992, p. 18), the Bantustan system enacted in 1954 was more vigorously applied, and most new African housing was built in the “homeland” areas, often around “decentralized growth points” where tax and other incentives were aimed at promoting the formation of centers for production and employment creation. Under the apartheid system only some African people were given rights to stay in cities, and all were linked to a homeland area that was meant to be a per-manent, rural home. Some of the homelands were given quasi-independent status (Fig. 4.1).
During the early part of the apartheid era many people were forcibly removed from formal and informal settlements. Within three decades these actions had affected more than a million African people in urban areas (Lemon, 1991 ), and many settlements were destroyed in the process.
By the beginning of the 1970s an almost complete separation of races had been organized within cities. Most urban African people had been forcibly removed to townships on the periphery, where tenure was at best public rental, and from rural areas in “white” South Africa to demarcated homeland areas.
Growing population pressure through urbanization and in existing housing in the townships, coupled with the state’s refusal to build more housing in the cities, led to the beginning in the early 1970s of the phenomenal growth of informal settlements
Fig. 4.1 Homeland areas of South Africa (source: Smith, 1987, p. 12)
754 Making Urban Land Markets Work Better in South African Cities and Towns
on the borders of homelands located near the major cities. Faced with this growth on the urban periphery, the state gradually recognized the need to plan for movement to the cities, and it introduced policies aimed at promoting “orderly urbanization” in the 1980s (Reintges, 1992). The early 1990s saw low levels of production of low-cost housing, around 30,000 units a year, many of them in inappropriate locations and in homeland areas.
This history of exclusion from ownership of prime land and the rolling disposses-sion over centuries, where there had previously been ownership or occupation rights, is a sore point. As Reg Rumney (2005, p. 401) observes, “Discussion of ownership, particularly of land, stirs up all sorts of emotions in South Africa: above all, memo-ries of great wrongs wrought, resentment at theft on a grand scale, and insult on a pettier but no less wounding level.” Given the active dispossession, it can be said that the South African land market has not been based on a “fair start” and that the state may therefore be ideologically justified in taking action to distribute land more equi-tably and, in the process, producing a short-term distortion of the market. This would fit into Dowall’s third category of justification of state intervention cited above.
The government’s land reform program, built on just this kind of reasoning, seeks to address (rural and urban) land restitution, land redistribution, and tenure reform (see Centre for Development Enterprise, 2005). Under the land restitution component of the program, people previously owning land can make a claim on that land (although there is a time limit on the claims that can be made). The logic is that it is necessary to correct some of the “wrongs” of the past. This is possibly the ideological aspect of the issue, but what direct market distortions have resulted from the historical conditions?
Beyond very unequal landownership patterns for “black” and “white” South Africans, for want of a better set of descriptors, the colonial and postcolonial gov-ernments distorted the urban land market in these ways:
• By limiting full ownership for black people to Bantustan areas and the tenure of township houses to municipal rental, and thus denying them ownership in most cities and towns. As a result, the majority of South Africans have a relatively short history as direct participants in the market, and a large proportion remain excluded because of affordability constraints and the inability of state allocation of housing to meet demand.
• By limiting income earning capacity (by, e.g., denying access to adequate educa-tion). Poverty and unemployment levels have remained high, and the barriers to becoming landowners very real because of affordability constraints.
• By limiting the right to own a business. Many people were denied the experience of conducting business from their home or even from formal business premises (Napier & Mothwa, 2001).
• By dividing the city into group areas (white, Indian, “colored,” and African), each with its own administration system. The inherited landholding and land manage-ment systems are a mess of competing arrangements and regulations that are dif-ficult for anyone to navigate. “The highest degree of formal regulation (although not necessarily of regulatory compliance) is found in the areas of high land val-ues—predominantly the former white race zones—and it dissipates gradually as
76 M. Napier
the land values drop, with effectively no formal regulation in the former African townships and informal settlements” (Kihato & Berrisford, 2006, p. 3).
• By investing in high standards of infrastructure in white areas and much lower levels of service in historically colored, African, and Indian neighborhoods, as well as not allowing much in the way of economic infrastructure in these neigh-borhoods (resulting in “dormitory” townships; Napier & Mothwa, 2001). This had direct effects on property prices.
• By locating white group areas close to urban centers and transportation routes while locating townships in distant locations with long rail and road links into the city. This further distorted the market and led to a system of transportation subsidies required to underpin the system. These subsidies continue to this day and in some cities are twice the housing budget (Wilhelm’s, 2001 article as cited in Colnot, 2003; Brown-Luthango, 2006).
So by the end of the apartheid era in 1994, there was a set of unequal relationships between the potential players in the South African urban land market: the unfairly well-off and the dispossessed, the educated and those historically denied access, the well located and the peripherally located, the sophisticated navigators of the complex regulatory environment and those excluded by lack of knowledge of the system, the information rich and the information poor, those with the resources to afford land and those without, and the owners and the tenants. South African cities and towns were very unequal places. And it has now become evident that the market and spatial distortions of the past cannot easily be wiped away even with progressive intentions. But what attempts have been made to set the situation to rights?
4.2.2 The Shift to Democracy
The 1990s were a decade of fundamental change. A democratic system was intro-duced in 1994. The newly elected government began to remove racialist legislation and to establish a constitution guaranteeing a set of human rights, including the right of access to land and to adequate housing and services. 3 The government com-mitted itself to building a million houses in its first five-year term (Smit, 1999), and a housing grant (referred to as a housing subsidy) was introduced to assist those with low incomes. Government acted as facilitator, and private sector developers dominated the process of house building under the subsidy scheme (Napier, Du Plessis, Meiklejohn, Vosloo, & Lungu-Mulenga, 1999).
The removal of apartheid legislation occasioned a limited, short-term filtering of households according to income status (Maharaj, 1997). However, household mobility within urban areas has remained low, and in most areas a market in low-cost housing is only just beginning to develop.
3 The South African Constitution adopted in 2006 states in clause 25(5) that “the state must take reasonable legislative and other measures, within its available resources, to foster conditions which enable citizens to gain access to land on an equitable basis.”
774 Making Urban Land Markets Work Better in South African Cities and Towns
By December 2006 more than 2 million houses had been built through the gov-ernment grant system and allocated to qualifying households (South Africa, Depart-ment of Housing, 2007). 4 In a replication of apartheid spatial patterns, the vast majority of these are located on the urban periphery distant from city centers and in many cases divorced from economic opportunities and social amenities.
With a fixed amount of state funding available for the private sector to build each house, developers and local authorities have maximized expenditure on achieving a reasonable level of service and size of house and minimized expenditure on land. Cheap land is peripheral land, often located beyond the historical townships. During the first decade and a half under the current African National Congress government this approach has won votes and produced large numbers of houses. But it has exac-erbated the inefficiency and the (now economic) segregation of South African cities and towns. The land market sets land prices, and so strong is the inherited apartheid city pattern that the current housing program under a progressive government has fallen victim to the same market exclusions. Government housing and land pro-grams have addressed mass delivery and redistribution but have not until recently given enough attention to correcting market distortions. But what new distortions have arisen in the past decade?
4.2.3 Recent Market Distortions
While meeting a vast need and demand for housing, services, and land, the government system of housing allocation has led to some clear market distortions of its own.
First, because policies, programs, and promises to the electorate have been framed around the delivery of houses, provincial and local governments have focused their energy and attention on facilitating just that. This means that vacant, serviced land on which people could build their own houses is hardly ever available to middle- and low-income households. At best, where an informal settlement is recognized, residents may be able to remain on their land and receive services. Vacant, serviced land has gone seriously up-market, with high-cost land being available mainly in high-security luxury developments (Landman, 2005).
Second, in the formal market there is for the poor no means of expression of demand for location. The state housing program has essentially been a supply-side intervention, producing low-income housing in large quantities. The houses are allocated to households drawn from a municipal waiting list. Households and indi-viduals might have applied many years before, and a choice of where to receive one’s allocation (which city or town, which neighborhood, which house in the set-tlement) is almost never offered. The result is that for people whose circumstances (such as the location of their job) may have changed, there is often a mismatch between location and formal accommodation.
4 Official statistics from the South African Department of Housing indicate that by December 2006 some 2,306,087 houses were complete or under construction.
78 M. Napier
The visible expression of demand for land and housing is the establishment and growth of informal settlements, although this expression is neither perfect nor uncontested. In more recent times, what the supply-driven state intervention has sought to do in a sense is to follow that impulse by focusing on upgrading informal settlements.
Third, when households either are allocated state housing or invade land extral-egally, they are catapulted, often unwittingly, into a de facto commodity market in which their newly acquired resource or asset has a real value. The asset so acquired is often undervalued by both the seller and the buyer (South Africa, Department of Housing, 2004c). This occurs because of the lack of familiarity with the land and housing market as well as a series of other effects, such as degrading and monofunc-tional neighborhoods and badly located and integrated urban land.
Fourth, the current housing program has resulted in a market distortion locally referred to as the housing “gap.” Possibly as a result of the production of essentially free houses, there is very little housing production going on between the low-cost state-subsidized houses (a product cost of around R 35,000, or US $5,000) and the lower end of where banks are willing to mortgage a house (around R 160,000, or US $22,850; Banking Association of South Africa, 2005a, p. 16). 5 There is an inter-nal logic to this. Households earning less than a certain monthly income qualify for a state house that is transferred virtually without cost (although in the past few years a small entry payment has been required). If a household earns just above that qualifying threshold, it makes more sense to depress one’s income in an applica-tion than to try to afford the full cost of a house. In any case, bank finance is rarely available around this level.
Recent commitments by major South African banks to lend down-market (to households earning R 2,500–7,500, or US $360–1,070, a month) have revealed and confirmed the lack of production and thus availability of houses in this band (Bank-ing Association of South Africa, 2005a). Indeed, the state’s encouragement of banks to lend down-market and its proposal to create incentives or obligations for devel-opers to produce mixed-income developments (Smit, 2007) are attempts to correct the market distortions that have arisen as a result of the large volume of subsidized, low-income housing production.
Again, because local authorities focus at the low end of the “market” on sup-plying houses (not vacant land) and at the upper end on supplying land and bulk infrastructure to the much wealthier sector, serviced urban land as a commodity is rarely if ever available to low- and middle-income households. While the intent in this chapter is to look at a broader “access frontier” 6 than just ownership, becom-ing an owner of land or a house for the first time is important in building urban citizenship and, by securing a tradable asset, contributing to the urban economy.
5 US dollar equivalents calculated at US $1 to approximately seven South African rand. 6 “An important concept [in the thinking about markets for the poor] is the access frontier which is defined as ‘the maximum proportion of usage possible under existing structural conditions (of technology, infrastructure and regulation)’. The position of the frontier and the rate of movement towards it reflect market deepening and the extent to which the market is working for the poor” (DFID 2005 , p. 11, citing Porteous 2004).
794 Making Urban Land Markets Work Better in South African Cities and Towns
4.3 How Do Urban Land Markets and the State Fail the Poor?
As a result of these kinds of distortions, urban land markets ultimately fail the poor through a shortage or absence of available land for settlement and for commerce and industry. Where affordable land is available and can be serviced, it is rarely inte-grated very directly into existing urban economies. History does show that today’s peripheral land will become tomorrow’s core land as the urban boundaries extend to encompass outlying settlements (see discussion in Biermann, 2006). However, this may take a number of decades, and meanwhile maintaining a reasonable livelihood will be difficult and will involve many inherent costs. What then are the outcomes of the distorted land market?
4.3.1 “Two Economies”
One outcome of the distortions, which as we have seen do not derive only from the past decade of state intervention, is that house prices at the upper end of the market have seen unprecedented growth while those at the lower end have not seen similar gains.
This discussion of these market outcomes involves three categories of housing at the lower end of the market. Government (or “RDP”) 7 housing has an average production price of around R 35,000 (US $5,000); “affordable” housing, which commercial banks are now becoming more likely to mortgage, has an average price of around R 150,000 (US $21,430); and small “middle class” houses are valued at around R 600,000 (US $85,700).
Kecia Rust (2006, p. 1) observes that “while there is little research on the tradable value of subsidized housing, it is widely understood that there has been substantial depreciation in formal sales.” Other anecdotally informed sources put the resale value of an RDP house as low as R 5,000 (South Africa, Department of Housing, 2004c). “Between 2002 and [October 2006], ‘small’ houses in the ‘middle class’ market appreciated by 120% while ‘affordable’ houses appreciated by only 70%” (Rust, 2006, p. 2).
At the top end of the market house prices doubled or tripled between 1999 and 2005 (Brown-Luthango, 2006, p. 9). Property prices in township areas clearly have failed to keep pace with the upper end of the market. This is due to a range of factors, including limited bank lending, neighborhood effects, high conveyancing costs, and cultural views of housing and land as long-term assets (FinMark Trust, 2003). Parallel to the operation of the formal market in land and housing is a vibrant informal set of activities that include property exchanges and arrangements to use and rent land.
Adding to this picture of a growing gap between the two ends of the spectrum in the gains that can be realized through the property market, the cost of land doubled
7 Housing was originally funded through a national program called the Reconstruction and Devel-opment Programme (RDP), and the term RDP housing has stuck.
80 M. Napier
between 2004 and the third quarter of 2006 while building costs increased by an impressive 50% (Rust, 2006). That made it increasingly difficult to afford better-located land, particularly for lower-income people and for the state, attempting to build low-cost housing.
There is a key debate centering on whether lower-valued properties should mimic market booms at the upper end (thus potentially closing out first-time home buyers once markets begin to function better). But there is agreement that poorer households that receive government housing are unable to benefit much from higher property values and, as noted, are being released into a residential market with lit-tle preparation. Similarly, municipal governments in larger cities are not extracting sufficient value at the upper end of the market through property taxes, nor are they finding logical or defensible ways to redistribute these values at the lower end (see discussion below on Sect. 4.3.2).
The disparate gains at the two ends of the property market, along with other economic indicators, have given rise to a view that two economies operate along-side each other in South Africa. The Human Sciences Research Council (HSRC, 2004) has summed up the perceptions around the differences between the two economies:
The first economy is modern, integrated with the global economy, and produces the bulk of the country’s wealth. The second economy is underdeveloped, isolated from the first and global economies, contains a large percentage of people including the urban and rural poor, and contributes little to the country’s wealth. The two economies need different strategies but: transforming the second economy requires transfers from the first economy, [and] the first economy is unsustainable without the integration of the second economy.
The new rhetoric speaks of bridging the divide between the two economies (“First Economy”, 2004; South Africa, Department of Housing, 2004b; South Africa, Department of Finance, 2003)—or, indeed, whether it is correct to talk of two economies at all, with the real issue being increasing inequality within the one (growing) economy. Not least is the physical or spatial divide between people in where they can afford to live in urban areas and how that conditions their ability to cobble together a livelihood that is personally and collectively sustainable.
The debate was brought into housing in a speech by South African Minister of Housing Lindiwe Sisulu:
The reality of the second economy is that an RDP house can be bought for a mere R 5,000 despite the fact that government spends around R 25,000 to build it. 8 It has no real financial value. There is an almost non-existent housing secondary market in most, if not all, town-ships with owners failing to sell their properties even if they could afford to buy a better house in the suburbs. In a stagnant, non-active housing market where investors make losses, getting no return on their investment, where red lining means access to credit is virtually barred,… home ownership is a burden rather than representing wealth creation. (South Africa, Department of Housing, 2004c, p. 12)
As a result of this kind of reasoning, an intention was built into policy to apply mechanisms to try to bring the two economies together. And so a key objective of the housing strategy introduced by the state in 2004 was “supporting the func-
8 This was the subsidy amount at the time of this speech. It has since increased to Rs. 35,000.
814 Making Urban Land Markets Work Better in South African Cities and Towns
tioning of the entire single residential property market to reduce duality within the sector by breaking the barriers between the first economy residential property boom and the second economy slump” (South Africa, Department of Housing, 2004a, p. 7).
This can be interpreted to mean that the state intends to intervene to stimulate the housing market across the board, with the objective of increasing the value of lower-cost houses as assets, especially for the poor. Several approaches to doing this have since been debated. One proposed intervention is to establish a national housing development agency that would acquire better-located land for housing and release it to the private sector or municipalities for low-income and affordable housing (South African Parliament, 2007). Another is to introduce regulations on inclusionary housing that would oblige developers building more than a certain number of houses at a time to include a certain share (about 20–30%) in the afford-able housing band (Smit, 2007).
There is a vibrant debate in the press and in state caucuses on whether these measures would make the market more redistributive, as intended by the state, or whether they would distort the market and severely slow the production of middle- and upper-income housing. The South African Property Owners Association is on record as saying about inclusionary housing that “we would prefer an incentive-based approach rather than that it be done on a penalty basis” (EProp, 2006).
Also behind these proposals is the intention to socially and spatially integrate South African cities and towns. President Thabo Mbeki, in his state of the nation address to Parliament on May 21, 2004, referred to the need to “conduct a thorough review of the impact of socio-economic transformation on social cohesion within communities and across society as a whole, including such qualitative issues as non-racialism and non-sexism.” The president indicated that the government would address “the broader question of spatial settlement patterns and implications of this in our efforts to build a non-racial society.”
In addition, a government review mentions the “need to place greater emphasis on overcoming the spatial disjuncture between home and work by promoting more compact designs that increase residential densities and reduce long-distance com-muting” (South Africa, Office of the President, 2003, p. 109).
Thus there is a fairly developed understanding that the market is failing the poor and favoring the wealthy, and there are clearly stated intentions to address these issues at a fundamental level. But some of the intended corrective measures may well have the effect of further distorting the market if introduced without careful discussion with private sector agents.
4.3.2 Market Failures
If past legislation and current state subsidies distort the market, what is the state of the underlying regulatory environment? Does it enable or disrupt markets that should work for the poor?
82 M. Napier
In a complex and confused regulatory environment existing landowners and land “speculators” become the dominant players, and the poor are often the losers:
Regulatory systems may create… hurdles that negatively affect the ability of the urban poor to acquire land. Often, laws become potent instruments in the hands of better off neighbor-ing communities, determined to resist the integration of their communities with the poor. Government systems meant to assist the poor to acquire well located urban land may not work properly; regulatory systems create fragmented and uncoordinated consent mecha-nisms, which pose serious challenges to under-resourced and under-capacitated municipali-ties…. In addition, institutions involved in the process of providing land at local, provincial and national government level administer disparate and uncoordinated aspects of the proce-dures. This makes going through the process a daunting task, which has a negative impact on the poor. (Kihato & Berrisford, 2006, pp. 4–5)
The more sophisticated urban operators are able to manipulate the system to their own ends. Private land operators often acquire land from municipalities for higher-income settlements at below-market values (EProp, 2007). Or they buy up land ahead of the direction of urban growth more successfully than municipalities, which might do this with a more redistributive intention if the correct policies were in place. If no forms of value capture are in place, municipalities often invest in areas to the sole benefit of wealthier existing and new landowners.
Depending on the size of the city or town, municipal staff sometimes have little capacity and capability to strike deals with the private sector that would favor the poor by establishing more points of access to live, trade, and manufacture in bet-ter areas. The tools and instruments to make these kinds of deals and trade-offs are available in the international literature and best-practice lexicon, but rarely easily available to local officials.
As noted, the regulatory system also favors objection by existing landowners to new development. Such objections tend to be made when that new development is for residents at lower income levels than those currently living in the vicinity (see discussion in Bobo & Zubrinsky, 1996).
Another area of market failure is lack of information. There is evidence that a market in secondhand township houses is beginning to emerge. Estate agents (real estate brokers) are moving into traditionally neglected neighborhoods such as Soweto, near Johannesburg. However, because of a lack of information available to existing homeowners that would allow comparison of transactions—and a general lack of exposure to market transactions—the price is often set below market value. After a short time agents or middlemen resell at a more realistic price, often with no improvement to the property. “Anecdotally, some have suggested that for the Soweto market, a standard value of R 50,000 has been applied, irrespective of the property, its condition, its location within the township, etc. While the sizes reported of some more recent mortgages dispute this allegation, the impression remains that township properties are undervalued” (Banking Association of South Africa, 2005b, p. 32).
As commercial banks, estate agents, and valuers become more involved in areas of historically low market activity, more realistic values can be expected to emerge. This is likely to happen for several reasons. Banks have voluntarily set targets for lending to lower-income bands. Larger corporations are paying growing attention to potential “bottom of the pyramid” gains. And in the legislative arena a relatively
834 Making Urban Land Markets Work Better in South African Cities and Towns
new Property Rates Act obliges municipalities to base their rating of properties on the value of land and improvements. As this process rolls out in cities and towns, many properties not previously assessed will have a value placed on them that may give their occupants a more realistic notion of value.
This raises another area of failure: municipalities have not maximized possible gains and opportunities for cross-subsidization across urban areas through better value extraction. This may be a case more of state failure than of market failure. But it has a market effect because infrastructure investment in outlying areas where the poor live is inadequate, and this affects property values.
Brown-Luthango (2006) has written in detail on this subject, starting with the premise that “it can not be left up to the market to address the current development and spatial challenges as the current operation of the market reproduces and rein-forces marginality, exclusion and poverty” (p. 28). Brown-Luthango believes that “the development of mechanisms for value capture and shared growth from ben-efits of surplus values accruing from the ‘boom conditions’ in the upper end of the land and property market can generate the necessary additional resources for infra-structure investment that promotes densification, integration and the generation of resources for low income residential development on well-located land” (p. 29).
And the way to do this, Brown-Luthango (2006) suggests, is through value cap-ture, which “refers to a process by which all or a portion of increments in land value attributed to public and ‘community’ interventions are recouped by the public sector. Mechanisms to capture value include conversion of additional value into public revenues e.g., taxes, fees or through infrastructure developments to benefit the poor” (p. 10).
The degree to which value capture is applied will vary from place to place. Broader forms would include depressing market values in certain zones; less expan-sive forms would simply involve more realistic valuation and rating of property and linked reinvestment in underserviced parts of the city.
Whatever means are used to improve the functioning of the market, they need to be employed with a view to not distorting it further. Many commentators argue, however, that the fundamental inequality that has arisen from the colonial and apart-heid systems needs to be addressed directly with bold countermeasures (Brown-Luthango, 2006; Napier & Ntombela, 2006).
4.4 Why Should the Poor Get Access?
As has been shown, many people in South Africa have historically been excluded from using and owning urban land, and indeed from the urban land market, through dispossession, market distortions, and state failure. Recent pronouncements dem-onstrate that the state is seeking to make the market (in general) work for rich and poor alike. The outcome being sought in the built environment is integrated cities and towns (and, of course, sustainable human settlements) in which the segregation of classes is less stark and where less wealthy households are better located relative to urban opportunities.
84 M. Napier
But why is the integration of the poor into the city a good idea—ideologically, socially, and economically? Why do the poor have a place in the city?
4.4.1 The Social Justice Argument
Ideologically, at least in a context in which the right to access land is entrenched in a national constitution, it is important that all citizens (and even residents) be fairly granted the choice to own or use land.
Although this chapter does not intend to take on the entire land rights debate, it can be argued that property rights (for those who already own land) and rights of access (for those who aspire to acquire land or use rights over land or space) are key in building a stable land market. Wallace and Williamson ( 2006 ) clearly argue this point (as cited in Sect. 4.2). They see land, land rights (“rights, restrictions and responsibilities”), improved technical supports (“e.g., land registration and accurate spatial identification”), and the “cognitive capacity of market participants” as the building blocks of a functional land market (p. 124).
One of Hernando de Soto’s (2000) more appealing suggestions is that wealth (and a viable economy) can be created by “building a legal and political bridge from social contracts scattered ‘on the ground’ into one national law” (p. 183). This sug-gestion comes from his work addressing how formal property law and titles usually give little or no regard to the extralegal social contracts that exist in great variety in many countries and are the de facto basis for determining real property rights.
Royston (2006) holds that there is still poor understanding in South Africa of ways in which the poor access and hold urban land extralegally. She contends that a lack of recognition of current practices “perpetuates inequity,” as state actors and private sector players recognize and, by implication, legitimize only the “formal rules of the game” (p. 2).
Beyond social justice, which may suggest that the poor should be granted a fair bid at a place in the city because it is the right thing to do, there are also reasons that it makes good social sense to integrate cities and towns.
Landman and Ntombela (2006) point to the relevance and importance of public space in cities for promoting human contact, social interaction, and tolerance, in a context currently marked by growing inequalities—thus providing a social and moral argument for access to urban land by the poor. In a response to Landman and Ntombela’s paper, one commentator agreed that it was important to think about “more than just access to residential land for the poor; rather good public space, access to facilities, and more generally rights to the city are important” (A. Todes as cited in Charlton, 2006).
The obverse point can also be argued: What are the negative implications of the failure to integrate classes? Ongoing and even greater class segregation is taking place as better-off households leave peripheral township areas (where they were obliged to live under racist legislation) and informal settlements to take up oppor-tunities elsewhere in the city. Kitchin (2003) argues that this has negative social
854 Making Urban Land Markets Work Better in South African Cities and Towns
outcomes as a result of the increasing agglomeration of the poor and thus greater vulnerability to crime, violence, and exploitation. Poverty alleviation programs essentially cause people to move out of existing neighborhoods, leaving the com-munities to become socially and economically more homogeneous. This has been one of the critiques of South Africa’s subsidized housing policy, which forms homo-geneous neighborhoods through its use of narrow eligibility criteria for the subsidy (Huchzermeyer, 1999). Those who do not qualify, including a preponderance of foreign nationals and single people, can also be left behind in informal settlements. Reversing this homogenization is a stated intention of current housing policy.
Thus it can be argued that the poor should have access to well-located land so that there is more opportunity for social integration. However, because apartheid was one of the world’s most notorious cases of the social engineering of racial segregation, efforts to design interventions to address spatial inequality today may sometimes find it difficult to avoid accusations of reverse social engineering.
4.4.2 The Poverty Alleviation Argument
There is much discussion of land as an asset that households can use to alleviate poverty—either by using the property to trade up and achieve positive residential mobility or by using it as a location for trading or small manufacture. There is also a heated debate about whether property needs to be underpinned by formal title to be more efficient as an asset, for example, to enable its use as collateral for formal finance (de Soto, 2000; Royston, 2007; Tomlinson, 2005). Others point out that legalization of land and transfer of ownership rights may take a long time, curtailing the plans of households to remain mobile (Datta & Jones, 2001, p. 349).
Even so, the argument that land is a usable asset (whether it is owned or simply has defensible use rights attached to it), especially if it is located in neighborhoods that are well integrated into the urban economy, seems self-evident. For poor house-holds, Landman and Ntombela (2006) suggest, access to, and ideally integration with, public parts of higher-value areas provide some opportunity to “gain access to opportunities and facilities which are generated through the resources of the more wealthy” (p. 14, citing Dewar & Uytenbogaardt, 1991).
The state in South Africa allocates large numbers of land parcels through the land restitution process and the housing program. Cross (2006, p. 7) argues that the Department of Housing’s subsidy program is an essential initiative in the attack on poverty because it is the most effective program in distributing an asset with the potential to allow the poor to escape poverty in the medium term, thereby relieving the welfare strain on both the state and cities.
For Cross (2006), the main benefit of the housing program is in promoting asset accumulation through self-investment. She distinguishes this approach from “flashier strategies” that emphasize housing as a route to access to credit and to entrepreneurial risk taking, focusing instead on the potential for “household sav-ings and gradual capital formation” (p. 19). The importance of secure tenure, Cross
86 M. Napier
maintains, is in providing a poor household “with a reliable urban perch with which to build an asset base” (p. 19).
Kihato and Berrisford (2006) also highlight the influence of land on urban pov-erty. They concur that “traditional formal system” assumptions that urban land is an investment asset for trade or for raising collateral may not be the primary motiva-tion for the urban poor to acquire land (p. 4). The authors flag the need to better understand the importance of land “as a place that provides access to employment, income generation through home based industries and rental income or for purposes of building social networks” (p. 5).
Although the state supplies land in large quantities, we have seen that as a result of high land values and limited state funds the land is not well located. There is also evidence that people are sometimes hindered in using their land asset effectively to alleviate poverty. Sometimes politicians frown on the use of residential land to earn extra income. For example, a provincial politician was reported by the Johannes-burg Star to have said that “the government builds houses for people to live in, not to rent or erect shacks in their yards” (“RDP Houses”, 2005). This comment came as a result of a visit to Kagiso on the East Rand, where the politician determined that some residents were renting out their RDP houses while others had erected more than one shack in their backyard to rent to tenants.
The use of land or housing assets to escape poverty has been suppressed by inap-propriate regulations that the politician quoted here is probably tacitly enforcing. Throughout the colonial and apartheid eras there were restrictions on ownership and on initiating small businesses (Napier & Mothwa, 2001). Attention to ways in which mar-kets can be made to work better is needed so that pent-up demand can be released.
McCarthy (2006) emphasizes that the redistributive nature of the market should not be underestimated. According to Charlton (2006), McCarthy’s optimism relates to the phenomenon of residential filtering, in which established dwellings are sold on the secondary market, at below the replacement or new stock value, to poorer people as the rich move to other parts of the city. In McCarthy’s (2006) analysis.
It could be argued therefore that if it was more effectively planned for, the land use and residential filtering sequence that is beginning to unfold in South African cities could be the most efficient and redistributive form of market delivery for all class groups, including the poor. (p. 8)
In the context of land redistribution, the Centre for Development Enterprise (2005) observes that in certain provinces in the 1990s the value of land redistributed through the open mar-ket to black South Africans was five times higher than that redistributed by the state. This was also probably true in other provinces as well. While this is not widely known, the land market may well be the most effective mechanism for redistributing land from white to black in South Africa. (p. 15)
The discussion of market distortion and market failure suggests that effective redistribution will require a healthy balance between state allocation for the very poor and the excluded and the opening up of access to the market. Land as a com-modity is particularly sensitive to government regulation and administration—or the lack of it. It is also very susceptible to the framework of rights in a country and the degree to which these rights can be claimed and enforced.
874 Making Urban Land Markets Work Better in South African Cities and Towns
A timely piece of advice for national and local authorities working on land dis-tribution and titling comes from Geoffrey Payne (2001).
Tenure regularisation programmes which operate at city level are likely to reduce market distortions, but impose an excessive burden on land registries. Conversely, those imple-mented at the local level will be easier to cope with, but are likely to increase urban land market distortions. (p. 425)
However, the urban land markets managed by local authorities rarely give prec-edence to the needs of the poor in the allocation of valuable land. Marx (2006) has pointed out that there is a fundamental blind spot in valuing the economic contribu-tion of the poor and that for this reason valuable land is rarely zoned for the use of poorer communities.
Charlton (2006) outlines Marx’s position: researchers and policy makers perceive economic growth and urban land markets as closely related and therefore assume that growth is the outcome of competitive urban land markets through an interre-lated set of functions that these markets perform. Specifically, they see economic growth as depending on large-scale formal productive investments: “from the per-spective of local government planners, competitiveness is understood to depend on the incidence of advanced industries and land uses” and “the efficient distribution of land uses relies on an efficient urban land market” (Marx, 2006, p. 6). Because the poor are perceived to be predominantly consumers rather than producers, other land uses that are seen as being more productive inevitably win out when urban develop-ment priorities are determined. Marx argues that this is a wrong assessment of the contribution of poorer communities and that a proper assessment could change the mind-sets of urban planners.
What all this suggests is that the state has a central role in setting the conditions in which the market can fairly distribute land as a complex commodity. Moreover, the state has a direct role to play in land allocation. And in South Africa today the state has shown a growing tendency to make deals with the private sector to begin to achieve the integration and desegregation of the city. But the state as well as banks, property developers, and estate agents need to be prevailed upon to open up their systems and make market information available to people trying to get access to land and housing and to those trading, sometimes for the first time (at least formally), in these com-modities. Given these conditions, it is possible that landownership and access to land will become more effective tools for poverty alleviation in the hands of the poor.
4.4.3 The Urban Efficiency Argument
Opening up the market in well-located land to the poor also makes sense from an urban efficiency perspective. With large numbers of poor people located on the urban periphery, accessing employment and other urban opportunities generates a tremendous amount of movement and concomitant costs. The poor bear the brunt of this, with cities subsidizing only public forms of transportation. The high trans-portation spending has an adverse impact on the broader economy, exerting upward
88 M. Napier
pressure on wages and labor costs (F. Khan, personal communication, February 9, 2007).
About 67% of the demand for public transportation comes from township areas (South Africa, Department of Transport, 1999). The subsidies needed to prop up public transportation continue to pose a problem for national and local government. In addition, excessively long workdays for the poorest sectors of the population, a result of the long commutes, reduce productivity and increase the costs borne by consumers and by employers.
As Napier and Ntombela (2006) argue, In most government departments and agencies, amongst design professionals (i.e. planners, urban designers, architects, and geographers), development-oriented NGOs and CBOs, and the social sciences of academia, the normative position that there should be access for the poor to better location in cities and towns, as a matter of better practice, is mostly uncon-tested. This is based on the assertion that through accessing better urban location for the poor there will be greater chance of improvement in living and working conditions, greater participation in a variety of markets, and therefore ultimately some measure of upward social and economic mobility. It is also based upon the assumption that a sprawling city with the poorest living at the furthest periphery is both unjust and inefficient.
This normative position is not automatically shared by property developers and land own-ers (small and large). It is also not automatically shared by the property divisions of munici-palities and parastatal organisations for whom the sale of land in their possession represents much needed revenue. (p. 5)
The concept of periphery is not a simplistic calculation of distance from the central business district, and some outlying areas may be well integrated into transportation routes and close to other opportunity centers in a multinodal city structure. Indeed, Biermann’s work (2006) demonstrates that some locations that would at first glance appear to be peripheral turn out to be as integrated as central locations when analyzed from an empirical cost-benefit perspective. But most low-income housing areas and many informal settlements, in South Africa at least, are not optimally located.
Moreover, with the global emphasis on reducing carbon emissions, South Afri-can cities, towns, and regional geographies are seen as some of the world’s least efficient settlement formations. This is not only because the poor are dislocated to the periphery but also because the urban form is very low density.
Brown-Luthango (2006) notes the spatial dysfunction in how “apartheid poli-cies and urban management strategies affected the lives and life chances of the urban poor in very significant ways” (p. 2). She maintains that some postapartheid policies have tended to reinforce these patterns, such as the large transportation subsidies propping up spatial inefficiencies. The motives for these postapartheid approaches need to be questioned, she contends, as they “could be construed as a deliberate action by the state to continue to subsidise and reproduce capitalism” (p. 8). For Brown-Luthango, therefore, a major problem is that South Africa’s broad urban development policy mechanisms for spatial restructuring and inclusive cities are “insufficient to influence the behavior of land and property markets to work for the poor” (p. 15).
So, it is generally agreed that concerted effort needs to be put into addressing and reversing the apartheid city form at all levels. How can this be achieved?
894 Making Urban Land Markets Work Better in South African Cities and Towns
4.5 How Can We Achieve a More Functional Market? An Agenda for Change
This chapter argues for a balance between ongoing state programs that target the allocation of land, services, and housing to people who have been excluded from the formal economy and efforts to work toward a more functional urban land market system. Making urban land markets work for the poor will require (at least) a three-pronged approach:
• Working toward shared economic growth that leads to a real reduction in poverty and a shrinking gap between the rich and the poor, so that more people can afford to enter land and housing markets
• Working toward lowering barriers to access in the urban land market and widen-ing the access frontier so that the market works more efficiently, with market information that is more easily available and in more accessible language and with lower costs for trading and holding land
• Working on (mainly state) interventions to ensure that people who, despite these actions, still fall outside the market are granted access to land, housing, and services, primarily through state allocation, and can therefore ultimately become market players if they so wish. 9
Although there is a need for balance between state allocation and market allo-cation, there also needs to be a focus on making markets work better for the poor. Whether the route into the land market is through informal settlement (when the settlement is legally or practically recognized by urban authorities), through gov-ernment allocation under a state supply program, or through the purchase or rental of land, the entry thresholds remain high.
A goal statement for the South African context that balances these issues would be this: organizations should be working together to improve access to well-located urban land by making markets work for the poor and improving governance sys-tems, thus giving meaning and effect to the right to land.
There are four areas that need to be kept in dynamic tension: people, governance, market, and place (that is, the physical outcomes of a better market). The arguments outlined above on why including the poor in the city is a good idea suggest the pri-mary outcomes that need to be kept in view in each of these four areas:
• People— greater tenure security and the ability to assert rights and aspirations, leading to greater residential and income mobility (poverty alleviation)
• Governance— more pro-poor and responsive institutions, policies, and legisla-tion, with a lowering of the barriers to, and the costs of, holding and trading land formally and the general promotion of a functional, accessible market
9 The route into the land market may often be through informal means, and greater policy respon-siveness to and legal recognition for the extralegal routes to landholding are no doubt needed.
90 M. Napier
• Market— greater access by the poor to better-functioning urban land markets, allowing people to locate themselves more effectively relative to urban opportu-nities that enhance livelihoods
• Place— greater choice of urban location and type of tenure within ultimately more efficient cities and towns and more sustainable settlements
As this chapter has described, the different urban actors in South Africa—whether the state, the private sector, or civil society—differ in their understanding of urban land markets and in their motivations. The messages they need to take on board therefore also differ. The beginnings of a fairer land market need to be borne out of:
• A greater awareness by the state of the benefits of supporting a functional urban land market that the poor can access.
• A greater awareness by the private sector of the economic (and social) imperative of bringing the poor into the city and promoting more efficient urban forms.
• The promotion of multiple places for engaging members of civil society in assert-ing their positions and demanding their rights.
• The building of a more dependable empirical base for policies, strategies, and actions.
An agenda for change requires taking on these humble goals and outcomes sys-tematically. An achievable process would entail the following sequential tasks:
1. Convince the parties involved that this agenda is crucial to successful urban economies and viable societies (using the new empirical base as evidence)
2. Investigate what a functional market should look like in the view of the urban actors and, through analysis of the sector, establish points of commonality and difference between the variety of desired outcomes
3. Gather experience and best practice and generate creative ideas on how to move toward a more functional market by, in this case, broadening the access frontier for the poor
4. Disseminate these models of how to achieve a better land market and provide the actors with the new skills and capabilities they may need to implement them
Different countries have vastly different regulatory frameworks and types of (formal and informal) market activity, even within southern Africa. The work of Wallace and Williamson (2006) is particularly useful in defining where the nec-essary tipping points would be in building a more functional land market in dif-ferent situations. De Soto’s work in this respect is also well known (though not uncontested).
Using this agenda for change for the South African city requires investigating in more detail how the processes underpinning a functional land market actually oper-ate, and how they can be improved, without discarding the advantageous aspects of informal markets where these exist. Many minds have taken on the almost over-whelming challenge of reversing the apartheid city structure. But a diagrammatic analysis centering on a city with a peripheral settlement (such as a township and informal settlements) near the urban boundary points to the areas that need to be addressed in making urban land markets work better (Fig. 4.2).
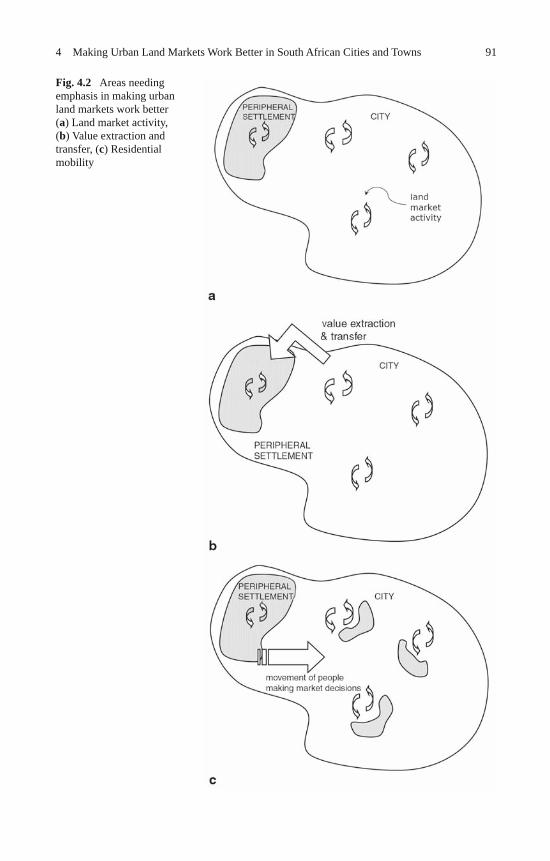
914 Making Urban Land Markets Work Better in South African Cities and Towns
Fig. 4.2 Areas needing emphasis in making urban land markets work better ( a ) Land market activity, ( b ) Value extraction and transfer, ( c ) Residential mobility
92 M. Napier
The first emphasis needs to be looking at how markets work in peripheral set-tlements. There is a great deal of extralegal trade in land and shacks in informal settlements. Similarly, there is formal and informal trade in the historical townships. But these markets differ in their operation from urban core markets (FinMark Trust, 2003). If regulatory systems are to become more responsive, it is essential to under-stand how peripheral markets operate.
The second emphasis needs to be value extraction. To improve the value of prop-erties in peripheral settlements, it is necessary to invest more in infrastructure, espe-cially since townships lack adequate services and many informal settlements lack services altogether. As a result of the property boom in much of the rest of the city, the rating of the property values and of the gains yields much-needed municipal revenues to fund infrastructure development.
The third issue is residential mobility. If poverty is not to become more and more concentrated on the periphery, opening up real choices of places to live in the city nearer other nexuses of market activity is crucial. Interventions such as state land banking, state housing and property agencies, and inclusionary housing regulations are some of the attempts being made to achieve this. As these different types of state interventions attempt to balance ownership and occupation patterns across the city, it is important that they not cause greater market distortions.
The discussions of redistribution in South Africa are couched in a context of economic growth, and the applied logic is that as growth is achieved, the benefits of that growth should be shared—or distributed between the rich and the poor. The concern is that much of the growth in recent years has been jobless growth. And while the statistics have been limited, what is known suggests that it has also been landless growth: patterns of landownership have transformed very little, and the main transformation has been through state allocation under the housing and land reform programs. The market may be the most powerful redistributive mechanism, as some commentators contend, but it does not yet appear to have performed optimally in achieving sufficient redistribution. It is therefore crucial that in a context of economic growth, patterns of landownership also begin to transform.
The intention to achieve transformation is there. Different sectors have drafted and adopted “charters”—voluntary agreements between the private sector and the state in South Africa—with this aim. These include the financial sector, the con-struction sector, and the property sector. For example, much of the banking activity in starting to lend down-market comes as a result of commitments made through the Financial Sector Services Charter.
The Property Sector Transformation Charter takes on the issue of addressing existing patterns of ownership:
To date the commercial activities surrounding property continue to reflect inequalities in ownership, with little transformation having taken place. The situation is further exacer-bated by skewed ownership patterns of property in general.
The charter aims to address the low levels of black ownership in property owning enter-prises and in property services, as well as unlock obstacles to ownership by black people of property assets. (South Africa, Department of Trade and Industry, 2007, p. 11)
934 Making Urban Land Markets Work Better in South African Cities and Towns
So there is a common intent among many of the actors. However, as this over-view has shown, the means to achieve a transformation in landownership patterns may emphasize state allocation in ways that distort the market—or they may balance the state’s action in fulfilling its developmental role and stimulate market activity so that the previously poor become market players themselves.
4.6 Conclusions
The systems of titling, registration, and cadastral recording in South Africa are well developed and sophisticated (though not always able to cope with the volume of transactions). However, at a local level the systems around urban land development and transfer remain complex and difficult to penetrate. This situation favors larger corporate players and individuals with the resources to navigate the systems, and the property boom at the high end of the market over the past 5–10 years is witness to the effectiveness of their activities. The situation does not favor the poor. Fully a quarter of urban South Africans live under informal tenure arrangements. 10 The danger is that the poor will remain poor, victims of jobless and landless growth, endless recipients of state allocation, and dislocated to the urban periphery. Crude attempts to bring the two economies together may simply undermine the property boom while not redistributing any tangible benefits.
There are many interventions that can begin to address the spatial disparity in South African cities and towns without distorting markets to the extent that they become unworkable. It is possible to “bend” markets slightly, with good enough motivations and with state interventions used circumspectly. The lessons for doing so can be drawn from best practice in many parts of the world and from success-ful practices locally. But if this is to happen, support is needed to give officials the capacity to negotiate with market players, to reduce the costs and complexities of administrative systems, to make market information available to potential buy-ers and sellers, to extract value and disburse it responsibly, to bring urban actors together around common actions, to transfer best practice, and to cleverly predict and monitor the effects of interventions.
In many cultures land is viewed as a resource to be used for the common good. As land becomes an increasingly complex commodity, elements of that viewpoint need not necessarily be lost nor militate against the stimulation of vibrant urban land markets that constantly open up opportunities for the poor to have a place in the city and thereby to become less poor. The challenge is to understand the com-plexities of the system sufficiently well to be able to address market failures without distorting the market to the detriment of all.
10 Some 60% of South African households live in urban areas. Of these urban households, only just over half (51%) own their property and have formal title to it. Another 20%nt live in formal rented accommodation. After some subcategories are discounted, this means that almost a quarter (24%) of South Africans are informally renting or squatting on land (Statistics South Africa 1999).
94 M. Napier
Acknowledgements The position developed in this chapter is based in part on eight papers com-missioned in late 2006 by the Urban Land Markets Programme (Urban LandMark) and funded by the southern African mission of the U.K. Department for International Development (DFID). The authors (who are referenced) and DFID as the program funder are gratefully acknowledged, along with many other people who have contributed ideas and perspectives. However, the author takes responsibility for the views expressed here.
References
Banking Association of South Africa. (2005a). Research into housing supply and functioning mar-kets: Research, findings and conclusions . Report prepared by Settlement Dynamics Project Shop and Matthew Nell & Associates, Johannesburg.
Banking Association of South Africa. (2005b). Research into housing supply and functioning mar-kets: Resource report 7—Secondary markets . Report prepared by Settlement Dynamics Project Shop and Matthew Nell & Associates, Johannesburg.
Biermann, S. (2006). A sustainable livelihood cost-benefit model to enhance the understanding of the dynamics between low income housing and location. Town and Regional Planning , December, 1–24. http://www.hdl.handle.net/10204/833.
Bobo, L., & Zubrinsky, C. L. (1996). Attitudes on residential integration: Perceived status differ-ences, mere in-group preference, or racial prejudice? Social Forces , 74 (3), 883–909.
Brown-Luthango, M. (2006). Capturing unearned value/leakages to assist markets to work for the poor. Paper commissioned by Urban LandMark. Accessed March 10, 2007, from http://www.urbanlandmark.org.za/archive.html.
Centre for Development Enterprise. (2005). Land reform in South Africa: A 21st century perspec-tive. Research Report 14. Johannesburg: Author.
Charlton, S. (2006). Making urban land markets work for the poor: Synthesis paper. Paper com-missioned by Urban LandMark. Accessed March 10, 2007, from http://www.urbanlandmark.org.za/archive.html.
Colnot, S. (2003). There shall be houses and security for all. Master’s thesis, Delft University of Technology.
Cross, C. (2006). Attacking urban poverty with housing: Toward more effective land markets. Paper commissioned by Urban LandMark. Accessed March 10, 2007, from http://www.urbanlandmark.org.za/archive.html.
Datta, K., & Jones, G. (2001). Housing and finance in developing countries: Invisible issues on research and policy agendas. Habitat International , 25 (3), 333–357.
de Soto, H. (2000). The mystery of capital: Why capitalism triumphs in the West and fails every-where else . London: Black Swan.
Dean, W. (1971). Latifundia and land policy in nineteenth-century Brazil. Hispanic American His-torical Review , 51 (4), 606–625.
Dewar, D., & Uytenbogaardt, R. (1991). South African cities: A manifesto for change . Cape Town: Urban Problems Research Unit; Urban Foundation.
DFID (U.K. Department for International Development). (2005, February). Making market sys-tems work better for the poor (M4P): An introduction to the concept. Discussion paper pre-pared for Asian Development Bank and DFID learning event, Manila.
Dowall, D. E. (1993, May). The role and function of urban land markets in market economies . Paper presented at the Ministry of Construction and Architecture, State Committee on Land Resources, and U.S. Agency for International Development workshop on privatization of land in Ukraine, Kiev.
EProp. (2006). Sapoa to put figure on low-cost housing ratio. Accessed September 20, 2006, from http://www.eprop.co.za/news/article.aspx?idArticle=7842.
EProp. (2007). Council “undersold land by millions.” Accessed February 16, 2007, from http://www.eprop.co.za/news/article.aspx?idArticle=8451.
954 Making Urban Land Markets Work Better in South African Cities and Towns
FinMark Trust. (2003). Workings of township residential property market: Findings, conclusions, and implications. Report prepared by Shisaka Management Services. Accessed October 17, 2006, from http://www.finmark.org.za.
First economy must help uplift its poorer fellow. (2004, June 4). Business Day (Johannesburg). from http://www.businessday.co.za/.
HSRC (Human Sciences Research Council). (2004). South African Regional Poverty Network readings on the second economy. Accessed June 30, 2004, from http://www.sarpn.org.za/documents/d0000830/index.php.
Huchzermeyer, M. (1999). Current informal settlement intervention in South Africa: Four case studies of people-driven initiatives . Cape Town: University of Cape Town, Department of Sociology.
Kihato, M., & Berrisford, S. (2006). Regulatory systems and making urban land markets work for the poor in South Africa. Paper commissioned by Urban LandMark. Accessed March 10, 2007, from http://www.urbanlandmark.org.za/archive.html.
Kitchin, F. (2003, May). The “normalisation” of the SA city. Paper presented at the annual confer-ence of the Association of American Geographers, New Orleans.
Landman, K. (2005, November). Private space—”private citizen”: What kind of cities are we creating? Paper presented at the seminar Enclosed Communities: Property and Public Space in Post-Apartheid South Africa, Constitutional Hill, Johannesburg.
Landman, K., & Ntombela, N. (2006). Opening up spaces for the poor in urban form: Trends, challenges and their implications for access to urban land. Paper commissioned by Urban LandMark. Accessed March 10, 2007, from http://www.urbanlandmark.org.za/archive.html.
Lemon, A. (Ed.). (1991). Homes apart: South Africa’s segregated cities . Cape Town: David Philip Publishers.
Mabin, A. (1992). Dispossession, exploitation and struggle: An historical overview of South Afri-can urbanisation. In D. M. Smith (Ed.), The apartheid city and beyond: Urbanisation and social change in South Africa (pp. 13–24) . London: Routledge.
Maharaj, B. (1997). Apartheid, urban segregation and the local state: Durban and the Group Areas Act in South Africa. Urban Geography , 18 (2), 135–154.
Marx, C. (2006). Conceptualising “the economy” to make urban land markets work for the poor. Paper commissioned by Urban LandMark. Accessed March 10, 2007, from http://www.urbanlandmark.org.za/archive.html.
Mbeki, T. (2004, May). Address of the president of South Africa, Thabo Mbeki, to the first joint sitting of the third democratic parliament (state of the nation address), Cape Town.
McCarthy, J. (2006). Land use differentiation, class differentiation, housing and the urban land market: International and SA frameworks in MMW4P perspective. Paper commissioned by Urban LandMark. Accessed March 10, 2007, from http://www.urbanlandmark.org.za/archive.html.
Murphy, K. M., Shleifer, A., & Vishny, R. W. (1992). The transition to a market economy: Pitfalls of partial reform. Quarterly Journal of Economics , 107 (3), 889–906.
Napier, M., Du Plessis, C., Meiklejohn, C., Vosloo, L., & Lungu-Mulenga, A. (1999). State of human settlements, South Africa 1994–1998. Report prepared for the South African Department of Housing. Pretoria: Department of Housing; Council for Scientific and Industrial Research.
Napier, M., & Mothwa, M. (2001). Push and pull factors in the initiation and maintenance of home work in two Pretoria settlements: The myths and realities of South African home-based enter-prises. Urban Forum , 12 (3–4), 336–351.
Napier, M., & Ntombela, N. (2006). Towards effective state interventions to improve access by the poor to urban land markets. Paper presented at the World Conference on Accelerating Excel-lence in the Built Environment 2006, University of Wolverhampton, Birmingham, England.
Payne, G. (2001). Urban land tenure policy options: Titles or rights? Habitat International , 25 (3), 415–429.
Porteous, D. J. (2004). Making financial markets work for the poor . Paper commissioned by Fin-Mark Trust, Johannesburg.
RDP houses not for renting. (2005, July 18). Johannesburg Star. Accessed November 2005 from http://www.thestar.co.za/.
96 M. Napier
Reintges, C. (1992). Urban (mis)management? A case study of the effects of orderly urbanisation on Duncan Village. In D. M. Smith (Ed.), The apartheid city and beyond: Urbanisation and social change in South Africa (pp. 99–109). London: Routledge.
Royston, L. (2006). Making urban land markets work for the poor in the context of existing local land access and transfer institutions. Paper commissioned by Urban LandMark. Accessed March 10, 2007, from http://www.urbanlandmark.org.za/archive.html.
Royston, L. (2007). Snakes and ladders: A housing perspective on de Soto and the first and second economy debate in South Africa. In Are Hernando de Soto’s views appropriate to South Africa? (pp. 32–43). P&DM Occasional Paper Series, no. 1. Johannesburg: University of the Witwa-tersrand, Graduate School of Public and Development Management.
Rumney, R. (2005). Who owns South Africa: An analysis of state and private ownership patterns. In Human Sciences Research Council, State of the nation 2004–2005 (pp. 401–422) . Cape Town: HSRC Press.
Rust, K. (2006). A finance response to the missing middle? ACCESS Housing , no. 4, 1–2. Accessed March 9, 2007, from http://www.finmark.org.za/.
Smit, D. (1999). Housing in South Africa: Significant government achievement based on public-pri-vate partnership. CDE Occasional Paper. Johannesburg: Centre for Development Enterprise.
Smit, D. (2007). Inclusionary Housing Policy (IHP) in South Africa. Report prepared for the South African Department of Housing. Accessed March 15, 2007, from http://www.housing.gov.za.
Smith, D. M. (1987). Update: Apartheid in South Africa . Cambridge: Cambridge University Press.
Smith, D. M. (Ed.). (1992). The apartheid city and beyond: Urbanisation and social change in South Africa . London: Routledge.
South Africa, Department of Finance. (2003, November). Budget speech by Minister of Finance Trevor Manuel to the National Assembly. Accessed June 30, 2004, from http://www.sarpn.org.za/documents/d0000830/index.php.
South Africa, Department of Housing. (2004a). A comprehensive plan for the development of sus-tainable human settlements. Cabinet memorandum tabled in August 2004. Pretoria: Author.
South Africa, Department of Housing. (2004b, July). Minister’s speech at the People’s Summit on Land and Housing, Midrand. Accessed August 1, 2004, from http://www.housing.gov.za.
South Africa, Department of Housing. (2004c, June). Speech by Minister of Housing L. N. Sisulu at the occasion of the tabling of the budget vote for the Department of Housing for the 2004/2005 financial year, Cape Town. Accessed October 2, 2006, from http://www.housing.gov.za.
South Africa, Department of Housing. (2007). Housing delivery statistics as of December 2006. Accessed March 10, 2007, from http://www.housing.gov.za.
South Africa, Department of Trade and Industry. (2007). Property sector charter on black eco-nomic empowerment. Republic of South Africa Government Gazette , Notice 1248 of 2007, from http://www.propertycharter.co.za/.
South Africa, Department of Transport. (1999). Moving South Africa: A transport strategy for 2020. Accessed December 7, 2000, from http://www.transport.gov.za/projects/msa/index.html.
South African Parliament. (2007). Ministry media briefing, 15 February 2007 social cluster 1: Health, housing, water and sanitation. Cape Town: Author.
South Africa, Office of the President. (2003). Towards a ten year review: Synthesis report on implementation of government programmes. Discussion document. Pretoria: Author.
Statistics South Africa. (1999). October household survey, 1999. Pretoria: Author. Swanson, M. W. (1968). Urban origins of separate development. Race & Class , 10 (1), 31–40.
(Oxford University Press for Institute of Race Relations) Swilling, M., Humphries, R., & Shubane, K. (Eds.). (1991). Apartheid city in transition . Cape
Town: Oxford University Press. Tomlinson, M. (2005, August 10). Title deeds not a magic wand. Business Day (Johannesburg).
from http://www.businessday.co.za/ UN-Habitat (United Nations Human Settlements Programme). (2006). Law and land tenure
review: Brazil. Nairobi: Author.
974 Making Urban Land Markets Work Better in South African Cities and Towns
Wallace, J., & Williamson, I. (2006). Building land markets. Land Use Policy , 23 (2), 123–135. World Bank. (2006). Fourth urban research symposium 2007: Urban land use and land mar-
kets—Call for papers. Circular dated July 25. World Bank, Lincoln Institute of Land Policy, Swedish International Development Cooperation Agency.

“This page left intentionally blank.”
Part IILand Market Policies and the Urban Poor

“This page left intentionally blank.”
101
The United Nations Human Settlements Programme (UN-Habitat, 2003) estimated that in 2001, 924 million people, about 32% of the world’s urban population, lived in slums. This figure could reach 1.7 billion by 2020—and 2.8 billion by 2030 (Lopez Moreno, 2003). Case studies in developing countries usually estimate that between 20 and 90% of a city’s population live in informal or illegal settlements. These fig-ures are debatable, given the criteria for defining slums (UN-Habitat, 2003). 1 Still, they suggest the magnitude of the problem and its alarming dynamics.
Tenure informality is a key characteristic of slums, and tenure issues are crucial in the analysis of urban poverty. While tenure informality allows quick access to land at a low cost for many poor households, it can have serious drawbacks by distort-ing land use and entrapping informal settlers in poverty. Tenure insecurity —which often accompanies tenure informality—plays a central role in this, notably because it discourages households and communities from investing in informal settlements and hinders the provision of urban services and infrastructure.
Addressing tenure informality is a major challenge. The objective can be to ensure the security of land tenure—through de facto protection against eviction or through de jure formalization of land tenure—while at the same time expect-ing more equitable access to land, improved investment incentives, or a reduction in the potential for conflicts. These justifications are clearly present in the Habi-tat Agenda, 2 which states that “access to land and security of tenure are strategic
1 UN-Habitat (2006) attempts to define slums by describing a slum household as “a group of individuals living under the same roof in an urban area who lack one or more of the following: durable housing, sufficient living area, access to improved water, access to sanitation and secure tenure” (p. 19). 2 The Habitat Agenda is the main political document that came out of the Habitat II conference, held June 3–14, 1996, in Istanbul. Adopted by 171 countries at what was called the City Summit, it contains more than 100 commitments and 600 recommendations on human settlements issues.
S.V. Lall et al. (eds.), Urban Land Markets, DOI 10.1007/978-1-4020-8862-9_5, © World Bank 2009
Chapter 5The Formalization of Urban Land Tenure in Developing CountriesAlain Durand-Lasserve and Harris Selod
A. Durand-Lasserve ( )National Center for Scientific Research Université Denis Diderot, Paris, Francee-mail: [email protected]
102 A. Durand-Lasserve and H. Selod
prerequisites for the provision of adequate shelter for all and the development of sustainable human settlements” (UN-Habitat 1996, Chap. IV, paragraph 75). But tenure formalization may also serve other important objectives, such as improving the functioning of urban land markets (World Bank, 1993).
In this chapter we discuss issues of de jure tenure formalization in the urban areas of developing countries. 3 We focus on a series of questions: What do we know about the links between property rights, insecure tenure, and poverty? What are the justifications and objectives for the programs designed to formalize land tenure? Are they sufficiently well designed and effective in attaining their objectives? What other types of formalization could be available to policy makers?
5.1 Key Concepts and Potential Effects
We begin by reviewing definitions and concepts related to urban land tenure infor-mality and the potential social and economic effects of land tenure formalization.
5.1.1 Definitions
Let us start with the definitions of land tenure, tenure informality, tenure security, and tenure formalization.
5.1.1.1 Land Tenure: A Bundle of Rights
Land tenure refers to the rights that individuals and communities have with respect to land—the right to occupy, to use, to develop, to inherit, and to transfer land. Land tenure should thus be viewed primarily as a social relationship involving a complex set of rules that govern land use and landownership. While some users may have access to the entire “bundle of rights,” with full use and transfer rights, others may be limited in their use of land resources (Fischer, 1995). The exact nature and con-tent of these rights, the extent to which people have confidence that these rights will be honored, and the various degrees of recognition of these rights by public authori-ties and the concerned communities have a direct impact on how land is used.
In practice, a continuum of land tenure rights can be observed, especially in developing countries, where different sources of law and different ownership pat-terns may coexist (Payne, 2002). Tenure situations range from the most informal types of possession and use to full ownership. Table 5.1 provides a synopsis of this continuum, detailing the prevailing level of rights (from no rights to the full bundle
3 Transition economies would require a separate analysis given the specificity of the former “socialist property rights structure” (Ho & Spoor, 2006, p. 583).
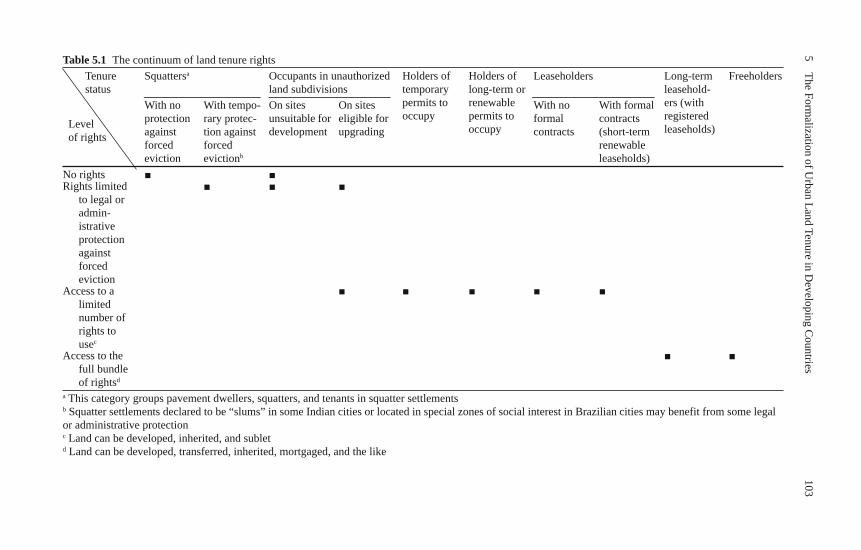
1035
The Formalization of U
rban Land Tenure in Developing C
ountriesTable 5.1 The continuum of land tenure rights Tenure
statusSquattersa Occupants in unauthorized
land subdivisionsHolders of temporary permits to occupy
Holders of long-term or renewable permits to occupy
Leaseholders Long-term leasehold-ers (with registered leaseholds)
Freeholders
Level of rights
With no protection against forced eviction
With tempo-rary protec-tion against forced evictionb
On sites unsuitable for development
On sites eligible for upgrading
With no formal contracts
With formal contracts (short-term renewable leaseholds)
No rights Rights limited
to legal or admin-istrative protection against forced eviction
Access to a limited number of rights to usec
Access to the full bundle of rightsd
a This category groups pavement dwellers, squatters, and tenants in squatter settlementsb Squatter settlements declared to be “slums” in some Indian cities or located in special zones of social interest in Brazilian cities may benefit from some legal or administrative protectionc Land can be developed, inherited, and subletd Land can be developed, transferred, inherited, mortgaged, and the like
104 A. Durand-Lasserve and H. Selod
of rights) associated with different tenure statuses (from squatters to freeholders). The table provides only a simplified description of the continuum, however. The level of rights may depend on other factors as well, including restrictions on the use of the land, the period of time for which rights are agreed on, whether these rights are renewable and transferable, and the degree of formality in rights agreements or lease contracts. 4 In addition, customary agreements may also exist, and these may provide various levels of rights depending on the local legal and regulatory framework.
5.1.1.2 Tenure Informality: A Wide Range of Situations
Informality designates particular types of land tenure common in the periurban areas of cities and, to a lesser extent, in city centers. Although there is a relative consensus about the characteristics of informal human settlements, the exact definitions of informal and formal settlements and the frontier between them remain blurred; a given type of settlement with particular characteristics relating to land tenure, urban planning, and housing could be considered either formal or informal, depending on the local context and the interpretations by the public authority.
Two main types of informal settlements can be distinguished on the basis of the type of development: unauthorized commercial land developments and squatter settlements . In unauthorized land developments private land is subdivided illegally, usually by informal developers, and sold as plots. The subdivision is illegal either because it violates zoning and planning regulations or because the required per-mission for land subdivision was not obtained. In squatter settlements the land is illegally occupied against the will of the landowner.
Another relevant distinction relates to the primary tenure rights on the land that is informally occupied. It is important to distinguish public land (the public or pri-vate domain of the state and of local governments) from land privately owned by individuals and institutions and from communal or customary land (on which the use and allocation of land are under the control of a community).
Tenure informality is the result of mechanisms of legal, political, and economic exclusion. The general view is that the expansion of informal settlements reflects the gap between the demand for land and its formal provision by the public and pri-vate sector, unable or unwilling to provide affordable land or housing to low-income groups. For example, unauthorized land developments may occur when local govern-ments fail to provide the needed infrastructure in certain areas of a city or in response to excessive and costly land use regulations (see Henderson in this volume). Squatter settlements may develop when weak enforcement of landlords’ property rights com-bines with a dissuasive price of formal land to encourage squatting (Jimenez, 1985). 5
4 Lease contracts can range from informal unwritten agreements to formal contracts between land-owners and occupants (i.e., leaseholds). 5 In Africa and Asia such processes of exclusion are fueled by rural–urban migration and urban population growth. In Latin America, especially Brazil, the expansion of informal settlements reflects mainly urban population growth.
1055 The Formalization of Urban Land Tenure in Developing Countries
5.1.1.3 Secure Tenure and Tenure Status
Secure tenure is the right of all individuals and groups to effective protection by the state against forced eviction, that is, “from involuntary removal from their land or residence, except in exceptional circumstances, and then only by means of a known and agreed upon legal procedure, which must itself be objective, equally applicable, contestable and independent” (UN-Habitat, 2003, p. 168). 6 In contrast, i nsecure ten-ure is the risk of forced eviction. 7
The level of tenure security depends on several related factors. First, tenure status is important, since the continuum of land tenure rights provides different degrees of protection against eviction. Insecure tenure is strongly associated with informality, and the degree of tenure insecurity varies with the type of informal settlement. 8 Second, the primary tenure rights of the land matter, since occupancy of public, private, or customary land can expose households and communities to different risks relating to land conflicts. Third, the occupancy status of the dwell-ing also matters, since tenants in informal settlements may have fewer rights than “owners” (Gilbert, 2003). Finally, tenure insecurity depends on the political and legal context , because it can be affected by the legal framework (the “right to hous-ing,” the existence of constitutional protections against eviction, or the recognition of the “social function of property”), the political will and commitment of gov-ernments, the regulatory framework (including planning and construction rules, norms, and standards), and the capacity of administrations to deal with the demand for secure tenure.
Informality does not automatically translate into tenure insecurity, however. Some forms of informal residential tenure arrangements can provide a reasonable level of security, even in squatter settlements.
5.1.1.4 Tenure Formalization
Formalization is a process by which informal tenure is integrated into a system rec-ognized by public authorities. Often presented as a means to ensure tenure security, it can be achieved through two different channels.
6 The leading legal interpretation of the right to be protected against forced eviction is General Comment No. 7 on the Right to Adequate Housing (E/C.12 / 1997 / 4), adopted by the United Nations Committee on Economic, Social and Cultural Rights in 1997. 7 Forced eviction is defined as “the permanent or temporary removal against their will of individu-als, families and/or communities from the home and/or the land they occupy, without the provision of, and access to, appropriate forms of legal or other protection” (United Nations, Office of the High Commissioner for Human Rights, 1997). 8 Whereas occupants in squatter settlements are highly exposed to forced eviction—especially when located on private land in prime urban areas subject to market pressures for development—owners in unauthorized land divisions may have more tenure security because they could be legally protected against eviction, especially when they can produce a deed of sale or a property title for the land they occupy.
106 A. Durand-Lasserve and H. Selod
First, the administrative recognition of occupancy rights —by the state or by local authorities—consists in delivering personal rights to households in informal settlements. It usually takes the form of an administrative permit to occupy or a short-term leasehold. Although such rights can be renewable, they are temporary (lasting from one year to several) and conditional (the land must be used or devel-oped according to standards set by public authorities). Some restrictions are usually imposed relating to the use of the land and its transfer.
Second, the delivery of real property rights —a process also known as land titling —consists in delivering freehold titles, surface rights, or registered long-term leaseholds. These rights can be opposed to a third party, transferred through sale and inheritance, and mortgaged. This type of formalization, which can be sporadic or systematic, provides rights that are authenticated and guaranteed by the state. 9
5.1.2 Potential Effects of Tenure Formalization
Land tenure formalization may have numerous effects through several potential channels. 10 Figure 5.1 represents these channels, distinguishing the effects of land tenure formalization from those of improved tenure security. While some effects of tenure formalization are likely to percolate through an increase in tenure security, others operate through such channels as enhanced administration or better-function-ing land markets. Which mechanism is at work depends on the type of rights deliv-ered. For example, while the delivery of real property rights (such as freeholds) could enable local investments by the private sector, the delivery of personal rights (such as permits to occupy) leads to fewer reasons for this outcome. In addition, the intensity of expected effects depends on the context in which formalization occurs.
5.1.2.1 Potential Effects on Tenure Security
Increasing tenure security through formalization can be a legitimate public policy objective in itself even in the absence of the trickle-down effects summarized in Fig. 5.1. By definition, as formalization suppresses a cause of tenure insecurity, it should improve tenure security, especially when the property titles delivered are recognized by courts and administrations during conflicts.
However, several arguments support the idea that formalization may in some cases reduce rather than increase tenure security:
9 There are also practices, such as political commitments or tolerance, that may improve tenure security without the provision of personal or real rights. We group these under the label “de facto recognition of occupancy.” One example is the acceptance of customary tenure in Sub-Saharan African cities by local or central authorities. 10 We focus on mechanisms that may operate in an urban or periurban context. For the rural con-text, see Besley (1995) or Deininger (2003).
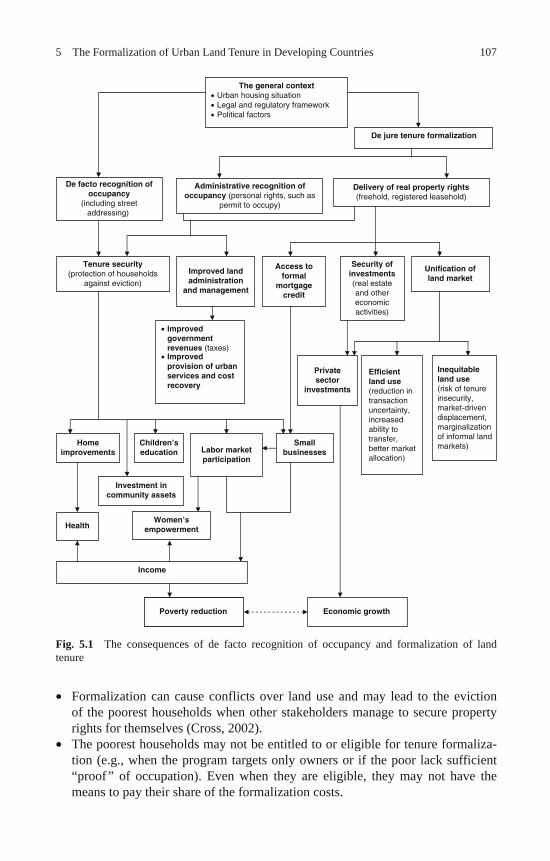
1075 The Formalization of Urban Land Tenure in Developing Countries
Formalization can cause conflicts over land use and may lead to the eviction of the poorest households when other stakeholders manage to secure property rights for themselves (Cross, 2002). The poorest households may not be entitled to or eligible for tenure formaliza-tion (e.g., when the program targets only owners or if the poor lack sufficient “proof ” of occupation). Even when they are eligible, they may not have the means to pay their share of the formalization costs.
•
•
Fig. 5.1 The consequences of de facto recognition of occupancy and formalization of land tenure
Administrative recognition ofoccupancy (personal rights, such as
permit to occupy)
The general context Urban housing situation Legal and regulatory framework Political factors
De jure tenure formalization
De facto recognition ofoccupancy
(including streetaddressing)
Delivery of real property rights(freehold, registered leasehold)
Tenure security(protection of households
against eviction)
Access toformal
mortgagecredit
Improvedgovernmentrevenues (taxes)Improvedprovision of urbanservices and costrecovery
Improved landadministration
and management
Homeimprovements Labor market
participation
Women’sempowerment
Investment incommunity assets
Health
Income
Smallbusinesses
Privatesector
investments
Security ofinvestments(real estateand othereconomicactivities)
Unification ofland market
Efficientland use(reduction intransactionuncertainty,increasedability totransfer,better marketallocation)
Inequitableland use(risk of tenureinsecurity,market-drivendisplacement,marginalizationof informal landmarkets)Children’s
education
Poverty reductionPoverty reduction Economic growth
108 A. Durand-Lasserve and H. Selod
Tenants, who are usually the poorest of the urban poor, may be unable to pay the higher rents that follow formalization and may be bid away to other informal locations. This is all the more harmful because tenants cannot apply for compen-sation and usually are not eligible for resettlement. Owners of formalized land may also have renewed incentives to evict tenants in favor of more profitable uses of their land. The bargaining power between small plot owners and developers is unbalanced so that newly formalized households may agree to sell their property to develop-ers under adverse terms and conditions. Regularized plots are sometimes sold at a very low price. This may be observed when newly formalized households cannot comply with planning and construc-tion norms and standards (e.g., when their plot is too small according to devel-opment plans) and are thus exposed to the risk of expropriation. In addition, compensation paid to evicted households may reflect not the market price but the lower value assessed by the administration. Formalization may become problematic if it is implemented without regard to existing tenure arrangements. For example, granting individual freehold titles may not be suitable for customary areas because freeholds cannot eas-ily accommodate extended family or group rights. Individual titling may then divide the population into two groups: households with land rights and those without. In the presence of customary rights, titling may increase insecurity “if it becomes unclear which system of rights will prevail” (Lanjouw & Levy, 2002, p. 988).
Although these remarks should not be downplayed, in what follows we consider favorable contexts in which formalization programs can improve the tenure security of targeted households.
Labor Market Outcomes . Households with insecure tenure may have to devote much time to looking after their home for fear of losing this asset during an absence. This may require the presence of an adult, reducing the amount of time available for work and providing an incentive for child labor outside the home. An increase in tenure security could thus result in an increase in labor force participation and the substitution of adult for child labor. And it could enable household members to shift to better-paying occupations outside the home.
Housing Investments: Income, Health, and Human Capital Effects . Occupants of dwellings in informal settlements lack incentives to invest in their houses because of the risk of eviction. When the probability of eviction decreases with formalization, the return to investment in housing increases and families have renewed incentives to improve their houses. Thus an improvement in tenure security may address an important market failure by providing a savings opportunity to the poor in the form of investment in own-housing stock. In addition, home improvements may improve the health of household members and the education of children, who benefit from a better learning environment at home.
The lower probability of eviction also increases the return on investment in home business activities, which can encourage home employment or the substitution of home
•
•
•
•
1095 The Formalization of Urban Land Tenure in Developing Countries
employment for outside activities. 11 In addition, improved tenure security in a neigh-borhood may provide incentives for households to also invest in community assets, because these improvements will be capitalized in the value of housing assets.
5.1.2.2 Potential Effects of Real Property Rights
Other expected effects following tenure formalization directly involve the charac-teristics of the transferred rights, such as their transferability or the possibility of mortgage in the case of an allocation of real property rights.
Access to Credit . Granting property titles is often presented as a means to provide credit-constrained households with better access to mortgage credit, thus stimulat-ing investment in business activities. This is a key idea in the literature on rural areas (Besley, 1995) and has systematically been put forward for urban areas as well (de Soto, 2000). The intuition is that real property rights should enable households to use their property as collateral to obtain credit—or should increase the value of their house as collateral or enable them to borrow at lower interest rates. This view rests on three assumptions: that the investment capacity of low-income households living in informal settlements is limited by credit constraints, that households would agree to pledge their land and house as collateral to finance business activities, and that financial institutions that would agree to provide mortgage credit to these households exist and would accept the property as collateral (Woodruff, 2001).
These conditions may not all be simultaneously met for a series of reasons. On the demand side, households in informal settlements might be reluctant to pledge their only asset in order to invest in risky businesses. On the supply side, lending institutions may not operate in informal settlements or may refuse to lend to house-holds in these areas (because of the low market value of mortgaged land or the high costs of managing small loans). Even if they did lend, the low value of housing in informal settlements might restrict the amount of funds that would be made avail-able to households. Finally, residents of informal settlements might have access to other, less formal types of credit that do not require them to pledge their home.
Local Provision of Services and Infrastructure . Although informal housing mar-kets may have advantages for the urban poor, they can be costly for the delivery of urban services and may be unattractive for private and public investments in busi-ness and infrastructure. Formalization can make informal settlements more attrac-tive for investment by enabling and securing land and property transactions, making investments more secure, and ensuring better cost recovery for service provision (by properly identifying the beneficiaries of urban services). Formalization may also facilitate planning and administration, resulting in access to basic services at a lower price or of a better quality than those potentially provided by the informal
11 This argument runs contrary to the argument that greater tenure security increases the incentive to work outside the home by freeing workers from home-monitoring duties. What the net effect is on presence at home is a matter for empirical investigation.
110 A. Durand-Lasserve and H. Selod
market. Finally, formalization can help lead to significant improvements in the pro-vision of urban services and infrastructure by generating tax revenue.
Land Market Effects . The absence of real property rights can hinder or prevent real estate transactions and distort prices for land. Titling should improve market efficiency by reducing transaction uncertainty, increasing the ability to transfer property, and enlarging trading opportunities and the possibility of exploiting gains from trade. It also integrates informal settlements within a unified formal market, enabling competition for land at the scale of an entire city. The competition with households residing in all parts of the city may lead to a more efficient spatial allocation of household types, though it can be argued that the change may not be equitable.
While most owners of regularized plots are likely to make a capital gain, some may be unable to pay the costs of tenure formalization or the cost of development imposed on regularized households. And as noted, some tenants may be unable to cope with the increase in rents induced by tenure formalization 12 and will be bid away to less desirable locations. Moreover, the unification of land markets may marginalize some other forms of informal land markets, such as customary land tenure.
Empowerment of Vulnerable Individuals and Communities . Granting property titles may empower vulnerable groups because it can free individuals from con-straining social relationships. Formalization can free households from a dependence on stakeholders who benefit from the perpetuation of informality and insecurity (local leaders, shack lords, or even municipal and government officials involved in the delivery of parallel informal land parcels). When title is granted to women or jointly to couples, it can increase the bargaining power of women in family decision making and affect their choices on fertility—potentially reducing it—or on their labor force participation—potentially increasing it.
5.2 Main Situations and Trends
We now briefly review the objectives and implementation of tenure formalization policies, emphasizing the diversity of existing approaches.
5.2.1 Justifications and Rationale for Tenure Formalization Policies
Policies of formalizing urban land tenure are based on two main sets of justifica-tions. The first emphasizes governments’ obligations to comply with international
12 See Brueckner and Selod (2009) for a welfare analysis in a theoretical model of formalization of squatter settlements.
1115 The Formalization of Urban Land Tenure in Developing Countries
treaties and covenants guaranteeing social stability and aiming to reduce poverty (Leckie, 2004). The second emphasizes the impact of tenure formalization on spe-cific planning, social, and economic objectives. This justification is put forward by international financial institutions and most aid and development agencies. Interna-tional financial institutions (the World Bank and regional development banks) tend to emphasize the role of tenure formalization in integrating informal markets into the formal economy and in increasing access to landownership (World Bank, 1993, 2001; Baharoglu, 2002; Buckley & Kalarickal, 2005, 2006). The United Nations (particularly the United Nations Development Programme and UN-Habitat) tends to put more emphasis on the social and economic integration of slums and infor-mal settlements (UN Millennium Project, 2005). This second position usually goes along with the recognition of “legal pluralism” regarding tenure (that is, the recog-nition of coexisting land rights systems).
5.2.2 Types of Tenure Formalization
In practice, tenure formalization programs are influenced by the general approaches and orientations defined by governments—implementing as well as funding agen-cies. They also depend on a set of other legal, social, and political factors. These include the constitutional, legal, and regulatory framework; the political balance of power at central and local levels of government; the state of the demand for tenure formalization; political will and commitment; pressures from the civil society in gen-eral and from concerned communities in particular; the perception of the legitimacy of the informal settlement by government institutions and the city’s population; and the financial and human resources available at government and city levels for imple-menting tenure formalization. Practices also vary depending on whether the main emphasis is security of tenure or whether other objectives are also pursued.
The diversity of local conditions results in a diversity of tools and policies for tenure formalization. Over the past decade, however, the focus has shifted from security of tenure to tenure regularization and access to landownership. This shift is noticeable in the international debate on tenure options and in the commitments made by United Nations member states—as expressed, for example, in the Habitat Agenda of 1996, at the review of the Habitat Agenda’s implementation by the Gen-eral Assembly of the United Nations (Habitat II+5) in 2001, and at the World Urban Forum in 2006. Until recently the policy discourse was dominated by the assertion of the primacy of individual title as the preferred form of tenure. Security of tenure was and still is often simplistically equated with the allocation of property titles to individuals.
The diversity of tenure formalization programs can be accounted for by applying a simple methodology based on a small number of criteria. We propose to consider the following criteria:
P rimary tenure status of the land illegally or informally occupied (whether pub-lic land and in the public or private domain, private land, or customary land)
•
112 A. Durand-Lasserve and H. Selod
T ype of informal settlement (unauthorized land development or subdivision or squatter settlement) T ype of rights delivered (personal rights or real rights, individual or collective) E ligibility criteria (occupancy status, length of occupation, conformity with planning norms) S cale and time frame of implementation (whether implemented at the settlement level, the city level, or nationwide, and whether systematic or sporadic)
Table 5.2 provides an overview of the diversity of formalization programs using our typology.
5.2.3 Main Practices in Tenure Formalization
Comparing the different practices in the formalization programs featured in Table 5.2 leads to four main comments. First, some governments clearly emphasize tenure formalization based on the systematic provision of real property rights (e.g., Mexico & Peru), while others resort to the sporadic delivery of property titles (e.g., Senegal & Thailand).
Second, tenure formalization may combine the provision of real rights with vari-ous forms of personal rights. While some informal settlements will be protected by a moratorium on evictions or benefit from a temporary permit to occupy, 13 others will receive leaseholds.
Third, while a continuum can usually be observed both in tenure situations and in formalization processes, clear legal and procedural discontinuities are identified between titling programs and programs delivering other types of rights over land. There are also ruptures between tenure formalizations of settlements occupying public land and formalizations of those occupying private land.
Finally, although tenure formalization may be carried out within a limited period—as in the case of systematic, sweeping titling—it is often an incremental process. The documents or titles that are delivered may be upgraded to give access to a wider range of rights over land. In some cases protection against eviction is a first step in the process—a process that starts with the delivery of an administrative permit to occupy that can be conditionally upgraded to a leasehold and, at a later stage, to a long-term registered freehold and possibly a freehold. 14
13 One example of a temporary permit to occupy is the one-year patta granted in Indian slums on public land unsuitable for tenure regularization. It is renewable until suitable relocation options are made available to the households. 14 For a more detailed operational typology of tenure formalization programs and a description of each of the examples in Table 5.2, see Appendixes 1 and 2 in the longer version of this chapter available at http://www.worldbank.org/urban/symposium2007/papers/durand_lasserve.pdf.
•
••
•
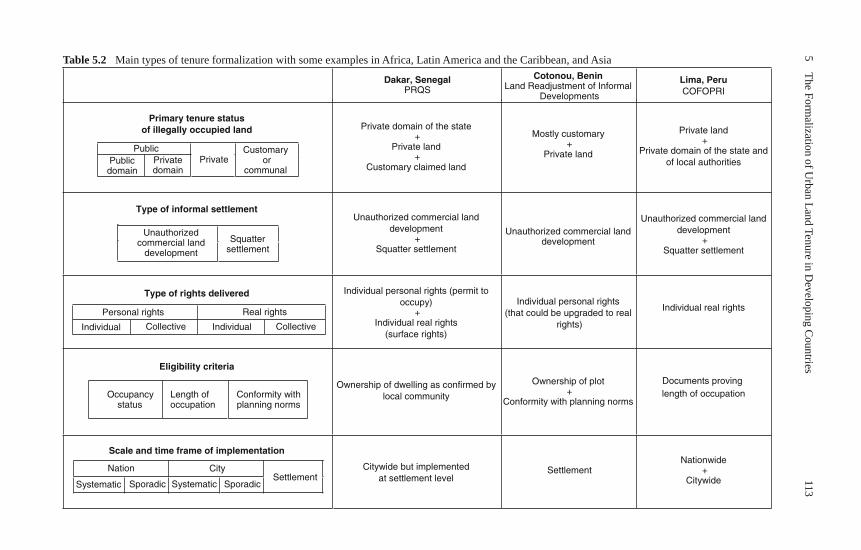
1135
The Formalization of U
rban Land Tenure in Developing C
ountriesTable 5.2 Main types of tenure formalization with some examples in Africa, Latin America and the Caribbean, and Asia
Dakar, Senegal PRQS
Cotonou, Benin Land Readjustment of Informal
Developments
Lima, Peru COFOPRI
Primary tenure status of illegally occupied land
Public Public domain
Private domain
PrivateCustomary
orcommunal
Private domain of the state +
Private land +
Customary claimed land
Mostly customary +
Private land
Private land +
Private domain of the state and of local authorities
Type of informal settlement
Unauthorized commercial land
development
Squatter settlement
Unauthorized commercial land development
+Squatter settlement
Unauthorized commercial land development
Unauthorized commercial land development
+Squatter settlement
Type of rights delivered
Personal rights
Individual personal rights (permit to occupy)
+Individual real rights
(surface rights)
Individual personal rights (that could be upgraded to real
rights)
Individual real rights
Eligibility criteria
Occupancy status
Length of occupation
Conformity with planning norms
Ownership of dwelling as confirmed by local community
Ownership of plot +
Conformity with planning norms
Documents proving length of occupation
Scale and time frame of implementation
NationSettlement
Citywide but implemented at settlement level
Settlement Nationwide
+Citywide
Real rights
Individual Collective Individual Collective
City
Systematic Sporadic Systematic Sporadic
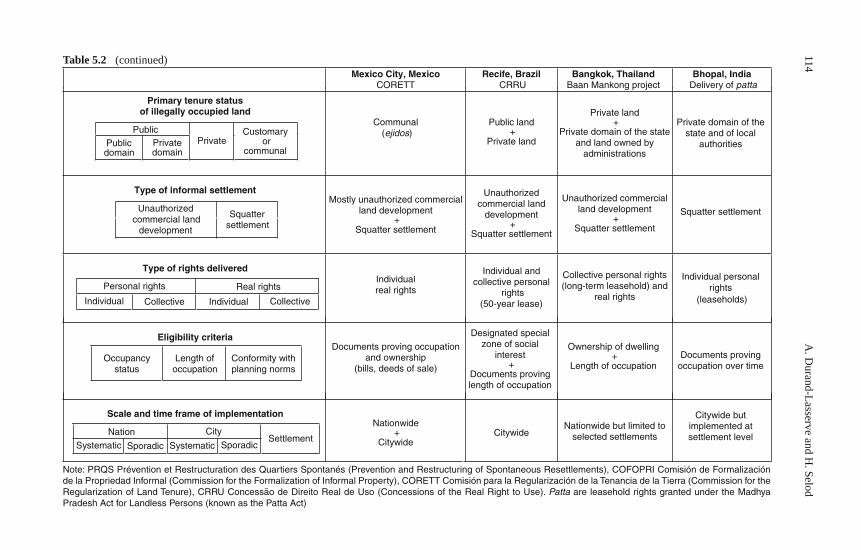
114A
. Durand-Lasserve and H
. Selod
Mexico City, Mexico CORETT
Recife, Brazil CRRU
Bangkok, Thailand Baan Mankong project
Bhopal, India Delivery of patta
Primary tenure status of illegally occupied land
Public Public domain
Private domain
Private Customary
orcommunal
Communal (ejidos)
Public land +
Private land
Private land +
Private domain of the state and land owned by
administrations
Private domain of the state and of local
authorities
Type of informal settlement
Unauthorized commercial land
development
Squatter settlement
Mostly unauthorized commercial land development
+Squatter settlement
Unauthorized commercial land
development +
Squatter settlement
Unauthorized commercial land development
+Squatter settlement
Squatter settlement
Type of rights delivered
Personal rightsIndividual real rights
Individual and collective personal
rights(50-year lease)
Collective personal rights (long-term leasehold) and
real rights
Individual personal rights
(leaseholds)
Eligibility criteria
Occupancy status
Length of occupation
Conformity with planning norms
Documents proving occupation and ownership
(bills, deeds of sale)
Designated special zone of social
interest +
Documents proving length of occupation
Ownership of dwelling +
Length of occupation Documents proving
occupation over time
Scale and time frame of implementation
NationSettlement
Nationwide +
Citywide Citywide
Nationwide but limited to selected settlements
Citywide but implemented at settlement level
Real rights
Individual Collective Individual Collective
City
Systematic Sporadic Systematic Sporadic
Note: PRQS Prévention et Restructuration des Quartiers Spontanés (Prevention and Restructuring of Spontaneous Resettlements), COFOPRI Comisión de Formalización de la Propriedad Informal (Commission for the Formalization of Informal Property), CORETT Comisión para la Regularización de la Tenancia de la Tierra (Commission for the Regularization of Land Tenure), CRRU Concessão de Direito Real de Uso (Concessions of the Real Right to Use). Patta are leasehold rights granted under the Madhya Pradesh Act for Landless Persons (known as the Patta Act)
Table 5.2 (continued)
1155 The Formalization of Urban Land Tenure in Developing Countries
5.3 Assessing the Effects of Urban Tenure Formalization Projects
Evaluations of the impact of tenure formalization programs should aim to iden-tify the socioeconomic effect on individual and community outcomes. Such impact evaluations are scarce, and those that exist raise serious methodological issues that must not be downplayed.
5.3.1 Methodological Issues
Evaluation of tenure formalization programs involves two major methodological issues. First, each evaluation is specific, focusing on a particular mechanism in a particular context. No general lessons can be derived from such evaluations, though their results should nevertheless help in orienting and designing formalization poli-cies. Second, evaluations hinge on a set of assumptions whose validity can at best be argued but can never be proved. The confidence we can have in an evaluation thus depends on a careful inspection of these assumptions.
5.3.1.1 The Main Issue: Selection Bias
The key issue in evaluating a formalization project is to be able to contrast the out-come in the presence of the project with the counterfactual socioeconomic outcome that would have been observed had the project not been implemented. For example, an evaluation may aim to observe whether a household that is granted a formal property title would work less in the absence of the titling program. Of course, no data set can provide this information, since a household cannot simultaneously be both a beneficiary and a nonbeneficiary of a program.
One solution is to compare the average outcome in a group of beneficiaries (the treatment group) with the average outcome in a group of nonbeneficiaries (the con-trol group) and attribute the difference to the formalization program. However, this interpretation is valid only under the assumption that the two groups have compa-rable characteristics that could be correlated with the outcome of interest (in our example, the number of hours worked). If the control and treatment groups differ with respect to some relevant unobserved characteristic (that is, one not present in the data), it will not be possible to identify whether the difference in outcome between the groups is attributable to the effects of the formalization program or to the preexisting differences in the composition of the groups.
Let’s say, for example, that households with the best labor market ability—a qual-ity that may not be observed and that is correlated with labor market outcomes—can manipulate the program so as to be granted property rights at the expense of others. In this case, finding that households that are granted property rights fare better than those that are not may reflect their labor market ability but not the true effects of
116 A. Durand-Lasserve and H. Selod
tenure formalization (if any). Since the result will be biased upward, it will not be possible to conclude that tenure formalization improves labor market outcomes.
In the evaluation of tenure formalization projects there are several reasons that this so-called selection bias can occur. Because households are residentially mobile, some might anticipate the program and selectively move into areas that are likely to be formalized. Households might also move after the program is implemented, so that treatment and control groups constituted ex post or data that fail to follow mov-ers might also suffer from a selection bias—especially since formalization could have an effect on mobility. Another issue is that tenure formalization may affect the control group because of spatial spillovers. This could be especially problematic when comparing similar neighborhoods, which are likely to be located in the same area.
5.3.1.2 Controlling for Selectivity
It is therefore necessary to ensure that the control and treatment groups are suf-ficiently comparable or to be able to satisfactorily address selection issues. Sev-eral approaches may be used, depending on the context and the implementation of the formalization program and on the nature of the data. These approaches can be experimental, quasi-experimental, or nonexperimental.
Experimental Approaches. Controlled experiments in which the treatment and control groups are randomly drawn—and thus comparable—provide the ideal data set for policy evaluation, provided that the randomization is correctly implemented. To our knowledge, however, controlled experiments have not been carried out in tenure formalization.
Quasi-Experimental Approaches . In the absence of controlled experiments, there can be natural experiments in the allocation of property rights that more or less sup-port the comparability of treatment and control groups. It is then possible to explain the selection between the treatment group and the control group without directly affecting the outcome of interest. One example is land titling in Buenos Aires in the 1980s as studied by Galiani and Schargrodsky (2004, 2006), who focus on the effects of property rights on child health. In this case squatters settled on some land only to find out later that it was private property. In 1984 the provincial government expropriated the land and transferred it to new occupants conditional on their pay-ing monetary compensation to the former owners. While some owners accepted the deal, others went to court, and lawsuits were still pending 20 years later. Galiani and Schargrodsky (2004) argue that this led to a random assignment of land titles, since settling households could not guess at the time of occupation which parcels of land would be transferred to them and which would be the subject of a dispute with the owners. 15
15 However, the assumption of an exogenous treatment can often be questioned. In the Buenos Aires natural experiment, plots might have different unobserved qualities that could both affect child health and deter owners from going to court. To address this problem, the authors can only
1175 The Formalization of Urban Land Tenure in Developing Countries
Natural experiments are exceptional cases. Most evaluations must be carried out on other types of nonexperimental data, which calls for the use of more sophisti-cated techniques.
Nonexperimental Approaches . In the absence of a natural experiment, one can try to use the available data to construct groups that are as comparable as possible and apply adapted econometrics techniques to compare these groups. One attrac-tive technique is difference in differences , which requires the use of panel data or repeated cross-sections. This technique involves comparing changes in the outcome of interest before and after the implementation of the project between the group of households that were granted property rights and the group of households that were not. It is then possible to identify the effects of the formalization program assum-ing that, in the absence of the program, the two groups would have experienced the same change in outcomes. This is a less stringent assumption because it allows beneficiaries and nonbeneficiaries to have different unobserved characteristics as long as the two groups are similarly affected by a common time trend (if any). Field (2003, 2005, 2007) and Field and Torero (2006) resort to such techniques to study the effects of a titling program in Peru on housing renovations, labor supply, and access to credit.
Even with difference in differences, however, there can still be problematic issues because our previous comments on mobility and sample attrition remain valid. Another important problem can occur when beneficiaries modify their behav-ior in a way that will affect the outcome of interest. For example, if households whose plot will be formalized can anticipate the policy and renovate their houses long before the program is implemented, it is possible that no effect of formalization will be observed between the two dates.
Nonrandomized evaluations should thus be considered with extreme care (Field & Kremer, 2006). Unfortunately, data constraints can limit the choice of techniques to be used for evaluation.
5.3.1.3 Measuring Tenure Security
Producing reliable and comparable measures of tenure security, a key variable in the formalization literature, is also problematic in empirical studies. Indeed, there is no consensus on what a good indicator of tenure security would be, and there is no such indicator in the Habitat Agenda, in the monitoring systems for the Millennium Development Goals, or in the set of indicators proposed by UN-Habitat to define slums.
In empirical studies researchers often use proxies of tenure security, such as the length of occupation of the dwelling, or rely on perceptions of tenure security, ask-ing occupants whether they think an eviction is possible. But these proxies can be criticized: using the length of occupation of the dwelling may indeed reveal a higher
provide statistics on parcel characteristics to try to convince readers that plots do not differ in this respect.
118 A. Durand-Lasserve and H. Selod
degree of tenure security ex post (because households were not evicted yet) but attributes a low security of tenure to newly established settlements regardless of the informal rights they might have. And perception-based data carry the risk of meas-urement error. Empirical inferences about tenure security should thus be examined with much caution.
5.3.2 Do We Observe the Expected Effects?
Let us now review the results obtained in the impact evaluation of formalization programs and suggested by case studies.
5.3.2.1 Tenure Security
Does formalization increase tenure security? There is usually no direct test of this in the literature because information on tenure security or its perception is usually not present in the data. The scarce evidence in this direction is that some households report seeking title to increase their security of tenure and that titled households are more likely than untitled ones to believe that an eviction is impossible (Lanjouw & Levy, 2002).
A few empirical studies have tried to provide an indirect measure of tenure secu-rity or its perception through capitalization in housing prices. These studies esti-mate a “security premium” associated with an increase in property rights or, more roughly, between informal and formal tenure, assuming that formal tenure is more secure than informal tenure. This approach usually raises two major issues. First, the unobserved characteristics of occupants and dwellings as well as the endogene-ity of property rights must be dealt with. And second, factors other than differences in tenure security may account for differences in price. When these other factors point to an increase in land prices, only an upper bound of the tenure security pre-mium can be estimated.
Several studies find a positive premium between formal and informal houses, usually higher for owners than for tenants. This difference probably reflects the higher costs borne by owners, who could lose housing capital if evicted (see Jimenez, 1982, 1984 or Friedman, Jimenez, Mayo, 1988 on the Philippines). These studies also suggest that low-income groups may have more to gain from formaliza-tion in terms of tenure security because the premium is greater for them. 16 Lanjouw and Levy (2002) find that titling significantly raises property values in Ecuador. But they argue that their measure is an upper bound to the market valuation of tenure
16 The authors’ explanation for this is that the poor sort spatially into places in which the risk of eviction is highest and thus having a formal title would be more valuable for them. Other explana-tions of the greater price differential for low-income groups could involve the weak bargaining power of low-income households or their low risk aversion, which leads them to outbid middle-income groups for riskier housing bundles.
1195 The Formalization of Urban Land Tenure in Developing Countries
security because the differences in market prices might also reflect a reduction in transaction uncertainty. 17
Kim (2004) goes beyond the formal–informal opposition, showing that in Viet-nam a freehold is not the most valuable form of property right, since houses with both a freehold and a “legal paper” sell for more. This suggests that the greatest security is reached through a combination of rights, including real property rights.
5.3.2.2 Access to Credit
The literature contains only weak evidence on the effect of urban land formalization on credit. 18 Field and Torero (2006) find that obtaining a property title in Peru has no effect on the loan approval rates of private banks and only a limited effect on those of public institutions. Moreover, the limited effect on the approval rates of public insti-tutions could simply reflect a simultaneous policy aimed at increasing lending. The weakness of these results is confirmed by Galiani and Schargrodsky’s (2006) finding that in Buenos Aires titling has only a minor effect on access to mortgage credit.
Case studies point to a similar conclusion. Varley (2002) observes that the ben-eficiaries of formalization in Mexico are not interested in formal credit but prefer to borrow from friends and relatives. They may also already rely on microcredit from community organizations that do not require the use of one’s home as collateral. This is confirmed by Byabato (2005), who observes that residents in a planned settlement in Dar es Salaam would not put their primary asset at risk by mortgaging it.
5.3.2.3 Labor Market Outcomes
Studies of the labor market effects of urban land tenure formalization—operating through the channel of improved access to credit or enhanced tenure security—are scarce. As noted, the evidence on the first channel is weak in urban areas, while the evidence on the second is mixed. Field (2007) finds that titling in urban Peru has freed up hours for work that were previously devoted to maintaining informal occupancy rights. Mitchell (2007), however, argues that this effect may not neces-sarily reflect greater availability of labor but could instead reflect the need for newly formalized households to increase their earnings so as to cover the costs of tenure formalization.
Field (2007) also finds that titling halves the probability of working at home by reallocating work hours from inside the home to the outside labor market. In addition, titling is found to reduce the probability of child labor. But it is not clear whether these results for urban Peru have a general validity. In an unpublished study on Ecuador, Rose (2006) confirms that titling reduces child labor. But in contrast
17 The authors’ result is obtained using an original data set in which titled and untitled households declare how much they would value their property with and without a title. 18 There is more evidence on the effect of land registration on access to credit in rural areas (see Feder & Nishio, 1999).
120 A. Durand-Lasserve and H. Selod
to Field (2007), Rose finds that titling has no effect on the number of hours worked and increases the probability of adults working at home. Galiani and Schargrodsky (2006) find no effects on labor income from a titling program in Argentina. Further econometric studies on this issue are clearly needed.
Case studies point toward a positive effect of formalization on investments in home-based activities and a drastic increase in activities within formalized settle-ments (see Banerjee, 2004 on India).
5.3.2.4 Other Effects
Local Effects on the Built Environment, Infrastructure, and Service Provision. Both case studies and statistical work point toward a positive effect of titling on housing improvements, possibly motivated by a reduction in the perceived threat of eviction (Banerjee, 2004 on India; Field, 2005 on Peru; Galiani & Schargrodsky, 2006 on Argentina). Confirming our previous comments, in both India and Peru improve-ments occurred without the use of credit. Investments may also occur at the commu-nity level, accompanying the upward filtering of the housing stock (Johnson, 1987).
However, these improvements may not comply with the planning norms and standards that apply to the settlement. This could be yet another reason that improve-ments occur without the use of credit, because complying with standards for building permission can be a requirement for obtaining a loan (Banerjee, 2004). Moreover, adequate investments in services and infrastructure may not be possible or sustain-able if residents find it difficult to pay for them, as in South Africa (Cousins et al., 2005); if the population grows beyond the capacity of the basic minimum services provided; or if population density makes it impossible to reorganize the layout of the settlement (Banerjee, 2004).
Effects on Health, Education, and Fertility. The few studies on health, education, and fertility outcomes find significant effects. Galiani and Schargrodsky (2004) find that land titling in Buenos Aires is associated with better child anthropometric out-comes (weight-for-height scores), a result that they speculate is related to better hygiene stemming from housing improvements.
Galiani and Schargrodsky (2006) find that titling also improves child education, by reducing both the delay in school achievement and the number of days children miss school.
Field (2003) estimates that the Peruvian urban titling program caused a decline in fertility among titled households. The author attributes this effect to the greater bargaining power in fertility decisions that women gain when granted a formal title as well as to a reduction in the “value” of children, who are no longer needed to secure informal ownership rights or claims to community resources and are less needed for their parents’ old age subsistence. Similarly, Galiani and Schargrodsky (2004) find that titling in Buenos Aires lowers the teenage pregnancy rate, a result that they attribute to a wealth effect.
Land Market Effects. Several empirical studies find that formalization has an impact on land markets through an increase in transactions and prices.
1215 The Formalization of Urban Land Tenure in Developing Countries
Lanjouw and Levy (2002) provide evidence that transaction uncertainty in the absence of real property titles impedes market transactions. Owners with strong informal, nontransferable rights would have difficulties selling their home because a potential buyer might fear that they could reassert their ownership after the sale. 19 In this context titling should increase the number of sales transactions. This is con-firmed by Macours, de Janvry, and Sadoulet (2005), who show that the insecurity of property rights in the Dominican Republic’s rural areas reduces activity in the rental market, and by Deutsch (2006), who observes that titling in Phnom Penh was followed by an increase in land sales. 20
It is hypothesized that the rise in housing prices associated with formalization may have segregating effects because of middle-class down-raiding and upward filtering (Payne, 1997; Augustinus, 2003). Such “market-driven displacements” are likely to occur as it becomes more difficult for low-income households to obtain housing in formalized areas or to afford even the subsidized cost of a formalized site, especially in valuable areas in city centers (Durand-Lasserve, 2006). The land price increase may also spread to informal areas and induce further segregation. Such reallocations following the formalization of land have been observed in a variety of contexts in case studies (Payne, 1997; Gravois, 2005).
5.4 Redefining Tenure Formalization Strategies and Practices
In this section we discuss the appropriateness of titling as a formalization option, the implementation difficulties that these programs face, and the responses of policy makers.
5.4.1 Is Land Titling the Most Appropriate Option?
The debate on land tenure formalization is fogged by some confusion surrounding the objectives of tenure formalization and its relevance as a means to achieve tenure security. Although regularization is often considered to be a prerequisite for establish-ing the market conditions necessary for economic development, 21 this view is now being questioned, and new models of establishing tenure security are being called for. It has been argued that while titling programs have so far focused on improving the efficiency of the land market, there is also a need for appropriate public regulation
19 Conversely, in the case of a rental the ability to transact is increased when the landlord has strong rights—because it is easier for the landlord to reclaim the property from a tenant. 20 The author conjectured, however, that the gains from these transactions were asymmetric and mostly benefited speculators. 21 This is the position of several institutions, including the World Bank, the Millennium Challenge Corporation, the Commission on Legal Empowerment of the Poor, the US Agency for Interna-tional Development, and the Inter-American Alliance for Real Property Rights.
122 A. Durand-Lasserve and H. Selod
to provide the poor some protection against market forces (Haldrup, 2003). 22 More attention is now being paid to the social impact of tenure regularization.
5.4.1.1 What Is Really at Stake in Land Titling?
Two broad types of objectives that may be pursued through titling can be distin-guished. What could be labeled efficiency objectives include the formalization and unification of land markets. They also include the promotion of property markets and private investments (real estate, commercial, and industrial), since titles can, in theory, be used as collateral for obtaining credit and provide legal protection for investments on titled properties. By contrast, equity objectives include, at least in theory, the improvement of tenure security and the empowerment of the poor.
Several policy documents combine both types of objectives in the justification for titling (see World Bank, 1993). But whether titling is really intended to serve both—and can do so successfully—has been questioned (Buckley & Kalarickal, 2006). As Brown et al. (2006, p. 23) observe, “the extent to which individual free-hold titles, rather than other instruments, should be provided in tenure granting programs, the mix of other infrastructure and services that must be included in such programs, and the ability of the poor to interact with the formal real-estate market to their own benefit once they obtain ownership documents are fundamental questions that are yet to be resolved.”
5.4.1.2 Critique of the Titling Approach
The property rights approach appears to have become dominant in donors’ thinking on land policy and administration (Daley & Hobley, 2005). Over the past decade leading international financial institutions and several bilateral cooperation agen-cies have promoted and supported titling programs in rural and urban areas. Access to property rights is also among the key objectives of the Commission on Legal Empowerment of the Poor, launched in September 2005 by a group of developing and developed countries.
But titling has been widely criticized (Mitchell, 2007; Bromley, 2005; Payne, 2004; Durand-Lasserve & Royston, 2002; von Benda-Beckmann, 2003). Several authors have warned against considering titling to be the panacea for defective land administration in developing countries (Zevenbergen, 1998). 23 It has been argued that de Soto’s intuition rested on a set of improbable assumptions (Woodruff, 2001), and there is indeed not much evidence that titling can stimulate access to credit for
22 This is the position of Cities Alliance, the Global Campaign for Secure Tenure, UN-Habitat, and the United Nations Development Programme (see Payne et al., 2007). 23 Gilbert (2002) denounces the idea of policy makers thinking that “all they have to do is offer title deeds, and that they can then leave the market to do everything else—providing services and infrastructure, offering formal credit and administering the booming property market” (p. 16).
1235 The Formalization of Urban Land Tenure in Developing Countries
urban households. 24 In some cases titling has been accused of weakening rather than strengthening tenure security (Bromley, 2005), compromising access to land for the urban poor.
Another objection to the titling approach is that it overlooks other options and ignores the preferences of households that may value some tenure category above freehold tenure (Payne, 2002). It tends to consider all urban actors as having com-patible interests, treating them as an undifferentiated group of urban stakeholders. Finally, titling policies may create a pattern of landownership that makes ownership less affordable than before.
Formalization in the context of dual legalism (i.e., where different land rights systems coexist) is particularly problematic. This is especially so in Sub-Saha-ran Africa, where land for housing the vast majority of the urban and periurban population is provided predominantly through customary and neocustomary land delivery channels. 25 Although customary practices are usually tolerated or de facto recognized by governments, they are rarely legalized (Rakodi & Leduka, 2004). This results in land policies that can reduce the access of poor households to shel-ter, such as when the registration of transactions under neocustomary practices is denied.
If governments do not recognize neocustomary tenure, public authorities can-not influence neocustomary practices and dynamics or correct their major short-comings. But integrating neocustomary land markets into formal markets “can disadvantage poor people who lose the security provided by customary tenure whilst being unable to complete the bureaucratic process of registration. In the worst cases this has created opportunities for the powerful to override customary or informal rights” (DFID, 2002, p. 8). This argument is clearly summarized by Royston (2006) in a discussion of a tenure formalization experience in Ekuthu-leni, South Africa: “For access to the formal economy and to services, the poor … must give up a functional tenure security that works for most of them, in exchange for a formal property system that does not because they are unlikely to maintain it” (p. 172).
5.4.2 Practical Problems of Property Rights Delivery
The gain from land titling may be reduced by a series of practical problems in implementation (Durand-Lasserve et al., 2002): an inappropriate legal and regula-tory framework; land administrations’ lack of capacity to cope with title registra-tion on the required scale; a judiciary system not adapted to land-related conflict
24 In Sect. 5.3.2 we present some mixed effects on health, education, and the labor market obtained in the few existing impact evaluations. 25 In neocustomary practices land can be allocated through processes that combine customary practices with other formal and informal practices. Individuals usually sell, as market commodi-ties, more rights than they initially received (Durand-Lasserve, 2005).
124 A. Durand-Lasserve and H. Selod
resolution; the duration and cost of land titling 26 (Woodruff, 2001; Payne et al. in this volume).
The difficulty of finding legal forms of regularization that are compatible with constitutional rules and the legal framework, acceptable to the actors involved, and in compliance with existing standards and procedures may also constitute a major obstacle. In particular, tenure regularization of informal settlements can be hin-dered by their noncompliance with planning, zoning, and construction norms and standards. 27
Another difficulty relates to the location of formalized settlements. Development agencies and international financial institutions tend to prefer in situ tenure formali-zation over displacement and resettlement. 28 But in situ tenure formalization may be in conflict with urban planning and development objectives, for example, because it would generate negative environmental externalities or because the land is not suit-able for residential development. In addition, the advantages of in situ formalization may be jeopardized by accelerated gentrification and market-driven displacements, especially in prime urban areas. 29
5.4.3 Practices That Work
The outright delivery of real property rights is not considered to be the only or the best response to tenure informality (Durand-Lasserve & Royston, 2002; Huchzermeyer & Karam, 2006; Brown et al., 2006). Experience suggests that an incremental process could be more appropriate, starting with protection against forced eviction and de facto recognition of informal settlements (through legal and administrative measures, possibly combined with the provision of basic services). For example, where cadastral information covers only a small share of the built land in urban areas and where bodies in charge of land management and administration cannot cope with the demand for land registration, street addressing could be con-sidered as a first step toward the recognition of informal settlements—and a pre-
26 Costs include adjudication and administrative costs, direct and incurred costs for beneficiar-ies, and costs related to the resolution of land-related disputes generated by the announcement of tenure regularization. 27 In Rwanda, for example, the minimum plot size of 300 m 2 , set by the new land law adopted in 2005, excluded nearly half the population of Kigali from the benefits of tenure formalization. The minimum plot size has since been reduced to 150 m 2 . 28 The World Bank, in its Operational Policy Statement 4.12 (April, 2004), requires states to avoid or minimize involuntary resettlements or provide viable alternatives for resettled households. 29 Surprisingly little attention has been devoted to this issue, although in situ formalization projects may involve large numbers of displaced households. In Phnom Penh, for example, despite the Cambodian government’s commitment in 2002 to upgrade and regularize all informal settlements within 5 years, most of the settlements have been exposed to increased market pressures, and their population is being expropriated or simply evicted (Durand-Lasserve, 2006). Similar observations have been made in Kigali, Rwanda.
1255 The Formalization of Urban Land Tenure in Developing Countries
condition for infrastructure provision and service delivery (see Farvacque-Vitkovic, Godin, Leroux, Verdet, & Chavez, 2005). 30
Incremental tenure formalization allows governments to build technical and administrative procedures over time and within the limits of their own resources, thus ensuring that the new approaches will be institutionalized. Measures should be aimed primarily at guaranteeing security of tenure so as to give communities time to consolidate their settlements, with a view to further improving their tenure status. At a later stage personal rights could be incrementally upgraded to real rights, such as freehold or long-term leases, if so desired (Christiensen, Hoejgaard, & Werner, 1999). This gives public authorities and communities some time to find a sustain-able alternative to in situ tenure formalization (if required) and limits the adverse impact of in situ formalization when it is in conflict with urban planning objec-tives. Payne (1997) suggests that a useful strategy for policy makers might be to consider “every step along the continuum from complete illegality to formal tenure and property rights as a move in the right direction, to be made on an incremental basis” (p. 29).
Community ownership and group titling can also be an alternative to the provi-sion of individual property rights, providing tenure security and maintaining social cohesion. Collective land tenure has been promoted in Voi, Kenya (Yahya, 2002); in Bogotá, Colombia (Aristizabal & Ortíz Gómez, 2004); and in the Baan Mankong Secure Housing Program in Thailand (Boonyabancha, 2005). If not combined with incremental upgrading, however, collective tenure may not be viable over the long term (because of problems with transfers, inheritance, and the like).
Another practice, used in Asia and Latin America, involves community partici-pation at different stages of the tenure formalization process, from the identification of needs to cost recovery (Imparato & Ruster, 2003; Magigi & Majani, 2006; Boon-yabancha, 2005). For example, assessing needs through “enumerations” provides not only a means of gathering data for local planning but also a process for building consensus and negotiating the inclusion of all residents. However, some successful tenure formalization programs have been implemented from the top, with limited involvement of community organizations (Morocco, Tunisia).
Yet another important practice is the decentralization of land administration and management responsibilities, as in Brazil since 2001 (Fernandes, 2006). Enabling municipalities to promote the upgrading and regularization of tenure can be desir-able. Setting up land registration procedures at the local level can be an essential tool for ensuring security of tenure, reducing land-related conflicts, and promoting tenure formalization policies (as long as local records are compatible with, and can later be integrated with, the formal land registration system).
Another useful tool for formalizing tenure at a reasonable cost is the rehabilita-tion of adverse possession procedures (see Fernandes, 2002, 2006 on Brazil).
30 Tenure regularization should not necessarily be considered a prior condition for providing services.
126 A. Durand-Lasserve and H. Selod
5.5 Lessons and Implications for Tenure Formalization Strategies
The review of a variety of existing programs suggests that the success of tenure formalization hinges on the following conditions: 31
• There must be political will, commitment, and continuity at the highest level. • Proper coordination is needed between national strategies and local policies.
This may require strategic guidelines and a legal framework at the national level combined with effective decentralization and local governance.
• Tenure formalization should not be reduced solely to its legal dimension but should instead be combined with other programs pursuing the economic integra-tion of the residents of informal settlements.
• Land administration must be adapted to the requirements of tenure formalization (Galal & Razzaz, 2001). The local management of tenure formalization must be compatible with the land registration system operating at the national level. 32
• Land allocation policies consistent with the needs and resources of low-income urban households must accompany tenure formalization. These policies should combine preventive measures aimed at avoiding the formation of new informal settlements with relocation options for households that are not eligible for tenure formalization.
• The existing financial system—including the availability of microcredit—should be adapted to the needs of low-income households, especially where tenure for-malization is combined with slum upgrading.
• The judiciary system should be responsive and independent, and there should be conflict resolution mechanisms at the local level.
The review of formalization programs also points to several key lessons. First, t he diversity of tenure situations in informal settlements may call for a
diversity of responses. Land rights are not restricted solely to registered rights—and especially not to individual property rights—but should be seen as a continuum. Thus options for formalization could range from various rights of use to conditional or full rights to dispose of the land. But it is important that the type of formalization chosen not hinder access to land for middle- and low-income groups. In some cases this may require adapting planning norms and standards.
Second, policies could aim to narrow the gap between formal and informal ten-ure rather than to implement rigid tenure regularization programs. Rigid tenure regularization may simply not work. In Sub-Saharan African cities, land policies
31 For more details, see the longer version of this chapter available at http://www.worldbank.org/urban/symposium2007/papers/durand_lasserve.pdf. 32 The failure of some nationwide titling programs (such as that in Egypt) can be attributed to the deficiency of land administration. Changing a country’s land administration system takes 15–20 years (Augustinus, Lemmen, & Van Oosterom, 2006). For many cities in developing and transition economies, given the constraints they face (lack of human and financial resources, limited mainte-nance capacity, lack of political continuity, corruption), it might take even longer.
1275 The Formalization of Urban Land Tenure in Developing Countries
that attempt to destroy neocustomary informal systems may end up making it more difficult for the poor to access land. If the main policy objective is to meet the land needs of the poor, it may be easier and more efficient to strengthen neocustomary systems than to attempt to improve formal land delivery systems.
One option that can make sense is to encourage those following neocustomary practices to ensure compatibility with formal procedures while making formal pro-cedures more accommodating to neocustomary practices (Durand-Lasserve, 2005). This occurs when neocustomary actors operate according to minimum rules and procedures regarding the registration of land rights and incorporate elements of planning, including the delivery of some basic services—and when national consti-tutions recognize customary rights (as in Ghana and South Africa, for example) or governments introduce land management procedures that allow formal recognition of claims originating from customary practices (as in Namibia and Uganda, for example).
Third, tenure formalization policies may not be transferable. Transferring tenure formalization experiences without regard to the local context may harm informal land delivery systems, reduce land supply for the urban poor, and increase tenure insecurity. It is thus necessary to define targeted policy objectives and priorities, taking into account the human and financial resources available, the national and local economic development policies, the existing tenure system (dual, customary) at both national and city levels, the existing continuum of land rights, the state of the local housing market (supply, demand, housing needs), and the links between formal and informal land and housing markets.
5.6 Conclusions
In this chapter we have analyzed the different contexts, objectives, effects, and debates relating to the formalization of urban land tenure and made suggestions for the future implementation of such programs. To conclude, we simply want to emphasize a few implications for research, operations, and policy.
For research, our review suggests that the knowledge we have of tenure formali-zation programs is far from complete. The few existing—and debatable—impact evaluations suggest that formalization programs improve land market efficiency and can have beneficial socioeconomic effects. But the scarcity of such evaluations contrasts with the abundance of case studies that point toward mixed conclusions. Moreover, the nearly exclusive focus on titling in quantitative impact evaluations has overshadowed other policy options. Systematic comparative research needs to be undertaken to evaluate the advantages and drawbacks of different options and practices in tenure formalization, taking into account the social and political context. Research should also focus on the costs, feasibility, and sustainability of alternative options, including group titles, short-term leases, and different types of occupancy or use permits. In particular, more attention should be given to the effects of incre-mental tenure formalization rather than systematic top-down titling processes. The impact on all stakeholder groups also needs to be assessed.
128 A. Durand-Lasserve and H. Selod
For operations, because tenure security is a key element in the design and imple-mentation of tenure formalization programs and projects, appropriate assessment and evaluation tools need to be developed to define an operationally relevant and comparable measure of tenure security—one that combines qualitative and quanti-tative information collected at national, urban, and settlement levels. An indicator of security of tenure should make it possible to identify trends and dynamics within a city or settlement over time and to establish international comparisons.
For policy, one important finding is that pilot projects may not always be rep-licable. Particular attention should thus be paid to issues of scaling up and to the prerequisites for shifting from projects to citywide or nationwide programs.
Acknowledgments The authors thank Luc Behaghel, the editors of this volume, and participants in the Fourth World Bank Urban Research Symposium for their useful comments and suggestions. The findings, interpretations, and conclusions expressed in this chapter are those of the authors and do not represent the view of the World Bank, its Executive Directors, or the countries they represent.
References
Aristizabal, N., & Ortíz Gómez, A. (2004). Improving security without titles in Bogotá. Habitat International , 28 (2), 245–258.
Augustinus, C. (2003, June). Surveying and land information management for secure land tenure. Paper presented at the Undungu Society of Kenya (USK), Commonwealth Association of Sur-veying and Land Economy (CASLE), and UN-Habitat Regional Seminar on Security of Land Tenure, Nairobi. From http://www.unhabitat.org/downloads/docs/1523_80316_land_informa-tion.pdf.
Augustinus, C., Lemmen, C., & Van Oosterom, P. (2006, March). Social tenure domain model requirements from the perspective of pro-poor land management. Paper presented at the 5th FIG (International Federation of Surveyors) Regional Conference on Promoting Land Admin-istration and Good Governance, Accra, Ghana.
Baharoglu, D. (2002). World Bank experience in land management and the debate on tenure secu-rity . Housing and land background series. Washington, DC: World Bank.
Banerjee, B. (2004, June). Maximising the impact of tenure and infrastructure programmes on housing conditions: The case of slums in Indian cities. Paper presented at the International Conference on Adequate and Affordable Housing for All: Research, Policy, Practice, Toronto, Canada.
Besley, T. (1995). Property rights and investment incentives: Theory and evidence from Ghana. Journal of Political Economy , 103 (5), 903–937.
Boonyabancha, S. (2005, December). Scaling up slums and squatter settlements upgrading in Thailand leading to community-driven integrated social development at citywide level. Paper presented at the World Bank conference New Frontiers of Social Policy, Arusha, Tanzania. From http://www.siteresources.worldbank.org/INTRANETSOCIALDEVELOPMENT/Resources/Boonyabanchapaper.rev.pdf.
Bromley, D. (2005). The empty promises of formal titling: Creating Potemkin villages in the trop-ics . Madison: University of Wisconsin, Department of Economics.
Brown, E., Dimitrova, D., Ehrenberg, D., Heyes, J., Kusek, P., Marchesi, G. et al. (2006). Regular-ization of informal urban settlements in Peru, Mexico and Brazil . Document prepared for the Inter-American Development Bank under the supervision of S. Angel. Princeton, NJ: Princeton University, Woodrow Wilson School of Public and International Affairs.
1295 The Formalization of Urban Land Tenure in Developing Countries
Brueckner , J., & Selod, H. (2009). A theory of urban squatting and land-tenure formalization in developing countries. American Economic Journal: Economic Policy 1(1), 28–51.
Buckley, R., & Kalarickal, J. (2005). Housing policy in developing countries: Conjectures and refutation. World Bank Research Observer , 20 (2), 233–257.
Buckley, R., & Kalarickal, J. (Eds.). (2006). Thirty years of World Bank shelter lending: What have we learned? Directions in development–infrastructure series. Washington, DC: World Bank.
Byabato, K. (2005). Legal title to land and access to formal finance by the low-income house-holds: The case of Sinza C and Miburani neighbourhoods in Dar es Salaam . PhD dissertation, University of Dar es Salaam.
Christiensen, S., Hoejgaard, P., & Werner, W. (1999). Innovative land surveying and land reg-istration in Namibia. Working Paper 93. London: University College London, Development Planning Unit.
Cousins, B., Cousins, T., Hornby, D., Kingwill, R., Royston, L., & Smit, W. (2005). Will formal-ising property rights reduce poverty in South Africa’s “second economy”? Questioning the mythologies of Hernando de Soto. PLAAS Policy Brief 18. Cape Town: University of the Western Cape, School of Government, Programme for Land and Agrarian Studies.
Cross, C. (2002). Why the urban poor cannot secure tenure: South African tenure policy under pressure. In A. Durand-Lasserve & L. Royston (Eds.), Holding their ground: Secure land ten-ure for the urban poor in developing countries (pp. 195–208). London: Earthscan.
Daley, E., & Hobley, M. (2005). Land: Changing contexts, changing relationships, changing rights. Paper commissioned by U.K. Department for International Development, London.
de Soto, H. (2000). The mystery of capital: Why capitalism triumphs in the West and fails every-where else. London: Black Swan Books.
Deininger, K. (2003). Land policies for growth and poverty reduction. World Bank Policy Research Report. Washington, DC: World Bank.
Deutsch, R. (2006). Beneficiary assessment of land title recipients under the Land Management and Administration Project (LMAP) in Cambodia. Paper prepared for the Cambodian Ministry of Land Management, Urban Planning, and Construction, Phnom Penh.
DFID (U.K. Department for International Development). (2002). Better livelihoods for poor peo-ple: The role of land policy. Consultation document. From http://www.dfid.gov.uk/Pubs/files/landpolicyconsult.pdf.
Durand-Lasserve, A. (2005). Land for housing the poor in African cities: Are neo-customary proc-esses an effective alternative to formal systems? In N. Hamdi (Ed.), Urban futures: Economic development and poverty reduction (pp. 160–174). London: ITDG Publishing.
Durand-Lasserve, A. (2006). Market-driven evictions and displacements: Implications for the perpetuation of informal settlements in developing cities. In M. Huchzermeyer & A. Karam (Eds.), Informal settlements: A perpetual challenge? (pp. 207–227). Cape Town: University of Cape Town Press.
Durand-Lasserve, A., Fernandes, E., Payne, G., & Smolka, M. (2002). Secure tenure for the urban poor. CIVIS: Learning from Cities (Cities Alliance), issue 3, September, from http://www.cit-iesalliance.org/.
Durand-Lasserve, A., & Royston, L. (Eds.). (2002). Holding their ground: Secure land tenure for the urban poor in developing countries. London: Earthscan.
Farvacque-Vitkovic, C., Godin, L., Leroux, H., Verdet, F., & Chavez, R. (2005). Street address-ing and the management of cities . Directions in Development series. Washington, DC: World Bank.
Feder, G., & Nishio, A. (1999). The benefits of land registration and titling: Economic and social perspectives. Land Use Policy , 15 (1), 25–43.
Fernandes, E. (2002). Providing security of land tenure for the urban poor: The experience of Bra-zil. In A. Durand-Lasserve & L. Royston (Eds.), Holding their ground: Secure land tenure for the urban poor in developing countries (pp. 101–126). London: Earthscan.
Fernandes, E. (2006). Principles, bases and challenges of the national programme to support sus-tainable urban land regularization in Brazil. In M. Huchzermeyer & A. Karam (Eds.), Informal settlements: A perpetual challenge? (pp. 62–83). Cape Town: University of Cape Town Press.
130 A. Durand-Lasserve and H. Selod
Field, E. (2003). Fertility responses to land titling: The roles of ownership security and the distri-bution of household assets. Unpublished manuscript, Harvard University, Department of Eco-nomics. From http://www.economics.harvard.edu/faculty/field/files/Field_Fertility_05.pdf.
Field, E. (2005). Property rights and investment in urban slums. Journal of the European Eco-nomic Association , Papers and Proceedings , 3 (2/3), 279–290.
Field, E. (2007). Entitled to work: Urban property rights and labor supply in Peru. Quarterly Jour-nal of Economics , 122 (4), 1561–1602.
Field, E., & Kremer, M. (2006). Impact evaluation for slum upgrading interventions. Doing impact evaluation series, no. 3. Washington, DC: World Bank, Thematic Group on Poverty Analysis, Monitoring, and Impact Evaluation.
Field, E., & Torero, M. (2006). Do property titles increase credit access among the urban poor? Evidence from a nationwide titling program. Unpublished manuscript, Harvard University, Department of Economics. From http://www.economics.harvard.edu/faculty/field/files/Field-Torerocs.pdf.
Fischer, J. (1995). Local land tenure and natural resources management systems in Guinea. Research findings and policy Options series. Madison: University of Wisconsin, Land Tenure Center.
Friedman, J., Jimenez, E., & Mayo, S. (1988). The demand for tenure security in developing coun-tries. Journal of Development Economics , 29 (2), 185–198.
Galal, A., & Razzaz, O. (2001). Reforming land and real estate markets. Policy Research Working Paper 2616. Washington, DC: World Bank.
Galiani, S., & Schargrodsky, E. (2004). Effects of land titling on child health. Economics and Human Biology , 2 (3), 353–372.
Galiani, S., & Schargrodsky, E. (2006). Property rights for the poor: Effects of land titling . Unpub-lished manuscript, Universidad Torcuato di Tella, Escuela de Negocios, Buenos Aires.
Gilbert, A. (2002). On the mystery of capital and the myths of Hernando de Soto: What difference does legal title make? International Development Planning Review , 24 (1), 1–19.
Gilbert, A. (2003). Rental housing: An essential option for the urban poor in developing countries. Nairobi: UN-Habitat.
Gravois, J. (2005, January 9). The de Soto delusion. Slate . From http://www.slate.com/id/2112792/. Haldrup, K. (2003, December). From elitist standards to basic needs: Diversified strategies to
land registration serving poverty alleviation objectives. Paper presented at the 2nd FIG (Inter-national Federation of Surveyors) Regional Conference, Marrakech, Morocco.
Ho, M., & Spoor, M. (2006). Whose land? The political economy of land titling in transitional economies. Land Use Policy , 23 (4), 580–587.
Huchzermeyer, M., & Karam, A. (Eds.). 2006. Informal settlements: A perpetual challenge? Cape Town: University of Cape Town Press.
Imparato, I., & Ruster, J. (2003). Participatory urban upgrading: A road map for going to scale—Lessons from Latin America. Washington, DC: World Bank.
Jimenez, E. (1982). The value of squatter dwellings in developing countries. Economic Develop-ment and Cultural Change , 30 (4), 739–752.
Jimenez, E. (1984). Tenure security and urban squatting. Review of Economics and Statistics , 66 (4), 556–567.
Jimenez, E. (1985). Urban squatting and community organization in developing countries. Journal of Public Economics , 27 (1), 69–92.
Johnson, T. (1987). Upward filtering of housing stock: A study of upward filtering of housing stock as a consequence of informal settlement upgrading in developing countries. Habitat Interna-tional , 11 (1), 173–190.
Kim, A. (2004). A market without the “right” property rights. Economics of Transition , 12 (2), 275–305.
Lanjouw, J., & Levy, P. (2002). Untitled: A study of formal and informal property rights in urban Ecuador. Economic Journal , 112 (482), 986–1019.
Leckie, S. (2004). Framing the discussion about housing rights . Geneva: Centre of Housing Rights and Eviction (COHRE).
1315 The Formalization of Urban Land Tenure in Developing Countries
Lopez Moreno, E. (2003). Slums of the world: The face of urban poverty in the new millennium? Monitoring the millennium development goals, target 11—World-wide slum dweller estima-tions. Nairobi: UN-Habitat, The Global Urban Observatory.
Macours, K., de Janvry, A., & Sadoulet, E. (2005). Insecurity of property rights and matching in the tenancy market. Berkeley: Department of Agriculture and Resource Economics, University of California. http://www.repositories.cdlib.org/are_ucb/992/.
Magigi, W., & Majani, B. (2006). Community involvement in land regularization for informal set-tlements in Tanzania: A strategy for enhancing security of tenure in residential neighborhoods. Habitat International , 30 (4), 1066–1081.
Mitchell, T. (2007). The properties of markets. In D. MacKenzie, F. Muniesa, & L. Siu (Eds.), Do economists make markets? On the performativity of economics (pp. 244–275). Princeton, NJ: Princeton University Press.
Payne, G. (1997). Urban land tenure and property rights in developing countries: A review . London: Intermediate Technology Publications; Overseas Development Administration (ODA).
Payne, G. (Ed.). (2002). Land, rights and innovation: Improving tenure security for the urban poor. London: ITDG Publishing.
Payne, G. (2004). Land tenure and property rights: An introduction. Habitat International , 28 (2), 167–179.
Rakodi, C., & Leduka, C. (2004). Informal land delivery processes and access to land for the poor: A comparative study of six African cities. Informal Land Delivery Processes in African Cities, Policy Brief 6. Birmingham, England: University of Birmingham, International Development Department.
Rose, S. (2006). Tenure security and household labor decisions: The effect of property titling on labor force participation in urban Ecuador. Master’s thesis, Georgetown University, Graduate School of Arts and Sciences. From http://dspace.wrlc.org/handle/1961/3614.
Royston, L. (2006). Barking dogs and building bridges: A contribution to making sense of Hernando de Soto’s ideas in the South African context. In M. Huchzermeyer & A. Karam (Eds.), Informal settlements: A perpetual challenge? (pp. 165–179). Cape Town: University of Cape Town Press.
UN-Habitat (United Nations Human Settlements Programme). (1996). The habitat agenda and Istanbul declaration. Second United Nations Conference on Human Settlements. From http://www.unhabitat.org/downloads/docs/1176_6455_The_Habitat_Agenda.pdf.
UN-Habitat . (1999). Implementing the habitat agenda: Adequate shelter for all. Global campaign for secure tenure. Nairobi: Author.
UN-Habitat. (2003). The challenge of slums: Global report on human settlements 2003. London: Earthscan.
UN-Habitat. (2006). State of the world’s cities 2006 / 7: The millennium development goals and urban sustainability. London: Earthscan.
United Nations, Office of the High Commissioner for Human Rights. (1997). The right to adequate housing (Article11.1 on the Covenant): Forced evictions, general comment 7. From http://www.unhchr.ch/tbs/doc.nsf/(symbol)/CESCR+General+Comment+7.En?OpenDocument.
UN Millennium Project. (2005). A home in the city. Task Force on improving the lives of slum dwellers. London: Earthscan.
Varley, A. (2002). Private or public: Debating the meaning of tenure legalization. International Journal of Urban and Regional Research , 26 (3), 449–461.
von Benda-Beckmann, F. (2003). Mysteries of capital or mystification of legal property? Euro-pean Journal of Anthropology , 41 , 187–191.
Woodruff, C. (2001). Review of de Soto’s The mystery of capital . Journal of Economic Literature , 39 (4), 1215–1223.
World Bank. (1993). Housing: Enabling markets to work. World Bank Policy Paper. Washington, DC: Author.
World Bank . (2001). Land, security, property rights and the urban poor: Twenty five years of World Bank experience. World Bank Briefing Note 8. Washington, DC: Author.
132 A. Durand-Lasserve and H. Selod
Yahya, S. (2002). Community land trusts and other tenure innovations in Kenya. In G. Payne (Ed.), Land, rights and innovation: Improving tenure security for the urban poor (pp. 233–263). London: ITDG Publishing.
Zevenbergen, J. (1998, January). Is title registration really the panacea for defective land adminis-tration in developing countries? Paper presented at the Cape Town Conference on Land Tenure Issues, University of Cape Town.
133
Tenure has been increasingly identified as a key issue in managing the growth of urban areas and reducing urban poverty. In May 1999 the United Nations Human Settlements Programme (UN-Habitat) launched its Global Campaign for Secure Ten-ure to address the need to increase protection against forced evictions and promote longer-term options for secure tenure. 1 Similarly, the Millennium Development Goals emphasize the impacts of insecure tenure and its links with poverty—and thus the role of secure tenure in poverty reduction—and Sclar and Garau (2003, p. 57) have argued that security of tenure is an effective tool for alleviating poverty in slums.
The World Bank has recognized the importance of secure tenure in promoting economic development and reducing poverty in both rural and urban areas. The Bank organized a series of regional conferences on land and tenure issues in 2002 to establish the basis for appropriate land tenure policies. These emphasized that land policies are of fundamental importance to sustainable growth, good governance, and the well-being of both rural and urban dwellers—particularly the poor.
6.1 The Evolving Debate on Land Titling
The increasing consensus on the importance of tenure policy in reducing rural and urban poverty was matched during the 1990s by an equal consensus on the form such policy should take. The allocation of individual land titles in existing informal
1 Augustinus and Benschop (2003, p. 2) note that “various definitions of secure tenure exist, but the most recent definition that was agreed upon during the Expert Group Meeting on Urban Indica-tors in October 2002, is: the right of all individuals and groups to effective protection by the state against forced evictions . Under international law, ‘forced eviction’ is defined as: the permanent or temporary removal against their will of individuals, families and/or communities from the homes and/or land which they occupy, without the provision of, and access to, appropriate form of legal or other protection. ”
S.V. Lall et al. (eds.), Urban Land Markets, DOI 10.1007/978-1-4020-8862-9_6 , © World Bank 2009
Chapter 6 Social and Economic Impacts of Land Titling Programs in Urban and Periurban Areas: A Short Review of the Literature Geoffrey Payne, Alain Durand-Lasserve and Carole Rakodi
G. Payne ( ) Geoffrey Payne and Associates, Ealing Common London , UK e-mail: [email protected]
134 G. Payne et al.
settlements and new development projects was seen as realizing several key policy objectives: increasing tenure security, increasing access to formal credit through the use of titles as collateral, stimulating investment in housing and local development, increasing municipal revenues, and promoting efficient and dynamic land and hous-ing markets.
Land titling programs have been promoted by several international donors and national governments for many years in rural areas. Since the early 1990s they have also been undertaken in urban and periurban areas, though in these cases the out-comes may differ substantially, even when the objectives are the same.
The World Bank was an early supporter of urban land titling programs and began funding a major program in Peru in 1998. A synthesis of World Bank policy on titling identified three stages of reform based on experience in East Asia and Pacific:
1. Achieving direct linkages to agricultural and urban investment—involving the definition of property rights in a coherent legal framework and the provision of administrative mechanisms to provide security of tenure for these property rights.
2. The emergence of formalized land markets in which land can easily be leased, purchased and sold, and gifted to achieve more efficient and higher-value use of the resource.
3. The use of land and real property as collateral for transactions (World Bank, 2004, pp. ii–iii).
A major boost to the discussion on the importance of tenure security and its implications for social and economic development came with the publication in 2000 of a book by Hernando de Soto. In this work de Soto claims a direct cor-relation between property ownership and affluence in the West and explains the continued poverty of developing countries in terms of their undeveloped property regimes. De Soto argues that the major stumbling block that keeps the rest of the world from benefiting from capitalism is its inability to produce capital, and that while the poor already possess the assets they need to make capitalism work for them, they hold these assets in defective forms. By this he means that they lack the title to their property, which they could use to invest in businesses, rendering their assets “dead” capital. He estimates that the total value of such “dead” capital is at least US $9.3 trillion. “They have houses but not titles, crops but not deeds, busi-nesses but not statutes of incorporation” (de Soto, 2000, p. 7).
De Soto has successfully focused attention on the role of tenure policy as a cen-tral factor in social and economic development. He has stimulated an important debate about the role that property ownership and land titling should play in devel-opment policy and has attracted widespread support from international financial institutions, development agencies, and several national governments, though many observers have also criticized his approach on conceptual, ideological, and meth-odological grounds.
Understandably, de Soto claims that his views have been misrepresented, and the recently established Commission on Legal Empowerment of the Poor (CLEP), of which he is co-chair, emphasizes that land titling is not the only option for reducing poverty. However, the commission (CLEP, 2006) also states that access to landown-
1356 Social and Economic Impacts of Land Titling Programs in Urban and Periurban Areas
ership is an essential component of poverty eradication in developing countries, and a central tenet of de Soto’s approach is that ownership is essential if a property is to be eligible for use as collateral for a loan. It is on this basis that many land titling programs have recently been proposed.
This debate on the merits and limitations of land titling in both urban and rural areas has yielded signs of a policy review within the international community. For example, in a study on land tenure and fixed investment Smith (2004) notes that the earlier consensus has changed and become more nuanced, with most policy analysts no longer simply assuming that formalization will necessarily increase tenure security and lead to collateralized lending. The original assumptions have now become questions for empirical research. Buckley and Kalarickal (2006) conclude that
it would be dangerous to promote formal titling programs as the sole solution necessary to solve the problems of the urban poor as some have suggested. In many cases, formal titles are unquestionably valuable. Nevertheless, in most developing countries, where the capital markets are undeveloped and a spectrum of ownership structures exist, titling alone will not “unlock” capital. While such property rights may often be a necessary condition to develop a fully functional housing market, they are not a sufficient condition to unlock the trillions that are now locked up in dead assets. (p. 23)
Of course, in an organization as large and diverse as the World Bank, changes in sectoral policy take time to permeate through to operational and regional departments, and the transformation is not always smooth and straightforward. Clearly, sections of the Bank concerned with promoting international investment, such as FIAS (Foreign Investment Advisory Service), are less likely to give priority to local residents in unauthorized settlements than to the investors they see as stimu-lating the economy and putting scarce land resources to “more efficient” use. The different interests of these key stakeholders may not always be easy to reconcile.
6.2 The Review
Given the intellectual and financial investments that have been made in land titling programs, it is surprising to note that there is a dearth of independent evidence to support or challenge the application of land titling as the most appropriate policy option for achieving the universally desired objectives of promoting social and economic development and reducing urban poverty. It was for this reason that we undertook a desk review of the social and economic impacts of land titling pro-grams in urban and periurban areas during 2006.
Materials obtained in the course of preparing this review identify examples of land titling programs in 35 countries and a wealth of more than 200 documents, some of which contain more general discussions of land titling policies and programs. A list of land-related projects funded by the World Bank since the 1990s shows that of the primary projects, about half have an urban dimension. Most of the urban projects are related to the preparation of a cadastre, the registration of land, or the development of
136 G. Payne et al.
administrative institutions to deal with land titling. Despite the promotion of titling by the World Bank, only 5 of 44 land projects seem to be related to the actual allocation of land titles in urban or periurban areas. Other programs have been undertaken with funding by different donor agencies or national governments.
6.2.1 Focus and Scope
What is a land title? It is clear from the papers reviewed that the term land title , and consequently the term titling , does not have a single, universal meaning. Instead, there are a number of interpretations, ranging from individual freehold to collec-tive freehold, individual or collective leasehold, and other forms in a given legal system. All these can be found under the name title in different countries. For the purpose of this review land titling is defined as the allocation of real property rights on land—that is, rights that are opposable to a third party and can be transferred, inherited, and mortgaged. 2
6.2.2 Methodological Issues
Social and economic impact assessments of land titling, like many other policy evaluations, are fraught with methodological problems. Identifying and measuring endogenous and exogenous factors relating to the social and economic impacts of titling requires an ability to measure individual variables that are themselves diffi-cult to quantify. For example, security of tenure involves perceptions of the de facto situation at least as much as definitions of legal status. Isolating the titling “gene” from a wide range of social and economic variables that affect access to land and security adds to this challenge. Another difficulty that arose in reviewing publica-tions was the limited information provided by many authors about their own meth-ods of collecting and analyzing data on the outcomes of titling programs. A notable exception is the paper by Lanjouw and Levy (2002, pp. 986–987), which includes a detailed explanation of their research methods, surveys, and data analysis.
Another methodological consideration is that titling has immediate, medium-term, and long-term impacts. One of the main limitations in any assessment of the impact of land titling comes from the fact that most titling programs are less than 15 years old.
Increases in land value have been used as proxies for project benefits, particu-larly in the evaluation of the World Bank–funded slum upgrading projects in such Indian cities as Chennai, Indore, Kanpur, and Kolkata (Lipton & Toye, 1990). This approach can be questioned, however—first, because of the extreme unreliability of
2 Many countries allocate forms of ownership according to local definitions, some of which refer to customary titles, some forms of leasehold titles, or use rights. Such variations are not included in this review.
1376 Social and Economic Impacts of Land Titling Programs in Urban and Periurban Areas
land value data in many cities, and second, because land value increases are likely to reflect the market potential rather than actual improvement in housing conditions.
6.2.3 Sources Used
The review has found disappointingly limited evidence of independent assessments of land titling programs in urban and periurban areas. A notable exception is the large-scale assessment that the US Agency for International Development (USAID) commissioned on its programs. The Land Tenure Center review (2002) provides bal-anced findings and conclusions. Its unique set of social, economic, institutional, and political impact assessments follow a standard format but also reflect the context of each case study location. The review, an impressively comprehensive appraisal of the successes and failures of different programs, can in many respects be considered a model for others of its kind.
There is a great disparity between the limited number of assessments of titling programs demonstrating actual outcomes and the considerable number of state-ments, critical analyses, or justifications using econometric models claiming what authors suggest titling should achieve.
Our review suggests that the efforts made by many institutions to promote titling and enforce titling programs are not backed by serious ex post assessments. This situation is as surprising as it is disturbing, since we cannot think of any other area in development aid and lending policies where a policy has been promoted for more than a decade without being subjected to rigorous evaluation of its ability to achieve the expected objectives.
6.2.4 Key Findings
Evidence on the many potential outcomes and impacts of titling is presented in the following sections, which group them loosely into social, economic, building and environmental, and administrative issues. In such a review the context in which particular outcomes and impacts have occurred can be referred to only briefly. However, the importance of contextual factors is discussed by Rebuelta-The (2005, pp. 12–13); Lanjouw and Levy (2002, p. 988); Benjaminsen, Holden, Lund, and Sjaastad (2006, p. 1), while Fernandes (2002, p. 212) notes that it is also important to consider historical influences.
6.3 Social Impacts
The social impacts of titling include tenure security, social status and inclusion, gendered outcomes, impacts on health and education, residential mobility, and gen-trification. Each is discussed briefly below.
138 G. Payne et al.
6.3.1 Security of Tenure
Perhaps the single most important justification for land titling programs is that they increase tenure security. Certainly, they transform what was previously unauthor-ized—though frequently tolerated—into a legally recognized entity. However, what does this mean in practice? As many observers have noted, tenure security cannot be considered as a simple matter of legal or illegal, formal or informal status; it is therefore a relative concept and a matter of perception as well as law.
The existence of de facto security before the issuance of titles in many coun-tries—such as Peru (Kagawa & Turkstra, 2002, p. 60; Ramirez Corzo & Riof-rio, 2005, p. 12), Mexico (Angel et al., 2006, p. 14), and South Africa (Allanic, 2004)—appears to severely restrict the perceived benefits of titling programs in increasing security. This is not to deny that the prospect of obtaining full owner-ship of a parcel of land is popular, especially if the land is free or inexpensive. Lanjouw and Levy (2002), in their impact assessment of titling in Guayaquil, Ecuador, find that “all but two [respondents] gave improved tenure security as the primary or secondary reason for their efforts… [however,] even untitled owners are not particularly worried about eviction by the government, at least in the short run” (p. 991). Cantuarias and Delgado (2004) report from Peru that “the main benefit of the formalization program is the juridical security given by the property title, [which] has improved the quality of life of the beneficiary families, specially of women and children” (p. 8).
Intriguingly, these and other examples appear to suggest that land titling programs are often proposed or implemented in countries or cities where residents in unauthor-ized settlements already enjoy a degree of de facto tenure security, such as Egypt, India, Mexico, Peru, South Africa, and Tanzania. The most significant challenge may therefore be to assess the increases in security experienced in countries or cities where such de facto rights do not exist. The evidence is surprisingly thin and mixed in the contexts of both customary and statutory land tenure systems. However, Payne (1997, p. 46) finds that “where there are numerous tenants in an informal settlement or customary area, freehold often forces existing low-income tenants out of an area, as they can no longer afford the rents, which rise dramatically after titling.”
It has even been argued that one outcome of titling programs is to reduce security of tenure. De Soto (2000, p. 55) suggests that among the benefits of legal prop-erty are the sanctions that can be applied if the rules associated with it are broken, specifically forfeiture. Experiences of titling actually reducing security of tenure are reported from Afghanistan, where the World Bank (2006, p. 2) finds that “the more valuable the property the more vulnerable it is to wrongful occupancy, the more formal the documentation the more vulnerable it is to formal dispute and to alteration.”
In India too, protection against forced eviction is not necessarily guaranteed by the possession of a land title (Sukumaran, 1999, p. 9). Market-driven displacement appears to be an increasingly common means by which land titles reduce security of tenure rather than increase it, as in Cambodia (Gravois, 2005, p. 2), Egypt (Sims, 2002, p. 82), and Rwanda (Durand-Lasserve, 2006).
1396 Social and Economic Impacts of Land Titling Programs in Urban and Periurban Areas
6.3.2 Social Status, Integration, and Inclusiveness
Titling transforms the legal status of an area and community by integrating them into the formal city. In Ahmedabad, India, the Slum Networking Programme claimed that residents requested that the local authority issue them with property tax demands,because they considered themselves newly legitimized citizens with rights and responsibilities equal even to those of the city’s mayor (TVE Inter-national, 2001). However, titling may induce gentrification, especially in settle-ments located in potentially high-value locations. This was the case in the Dalifort settlement in Dakar, Senegal, where tenure upgrading started in the late 1980s and which today can be considered a middle- and upper-middle-income settlement (Barbier, 2006; World Bank, 2004). What is less clear, as in many other cases reviewed, is whether the original residents have remained in place with gradually increasing incomes.
6.3.3 Gender
The most extensive coverage of gender impacts of titling programs is included in a series of reports by UN-Habitat published in 2005, which provide findings from many countries in Africa and Latin America. 3 Other publications also give the issue attention, however.
Evidence reinforcing women’s adverse position with respect to tenure rights comes from many countries. Typical is Albania, where the Land Tenure Center review (2002) notes that titles are registered in the name of the head of the family, “almost always the eldest male in the family” (p. 28). Procedural constraints are also reported from East Africa (UN-Habitat, 2002) and South Africa (Cousins et al., 2005, p. 3). As if legal and procedural factors were not enough to deny women justice, cultural factors are clearly an even more entrenched barrier—one that will take years, possi-bly even generations, to change (UN-Habitat, 2005b, pp. 122–123; Calderón, 2004, p. 297; Calderón, Paredes, & Quispe, 2002; Augustinus, 2003, p. 28).
On a more positive note, considerable efforts to improve the rights of women are reported from several countries, including Mexico (UN-Habitat, 2005b, pp. 78–79), Colombia (UN-Habitat, 2005a, p. 98), India (in Andhra Pradesh; Banerjee, 2004), Peru (Angel et al., 2006, p. 12; Kagawa & Turkstra, 2002, p. 65), the Lao People’s Democratic Republic (Land Equity International, 2006, p. 115), Cambodia (Deut-sch, 2006, p. ii), and Ecuador (Lanjouw & Levy, 2002, p. 1013). These examples reveal significant and welcome progress in strengthening women’s rights in prop-erty, which is to the wider benefit of society. However, the picture is not always one of progress and there is no room for complacency.
3 The UN-Habitat reports of 2005 include case studies of Brazil, Colombia, Lesotho, Mexico, Mozambique, Namibia, Nicaragua, and Zambia as well as references to many other countries.
140 G. Payne et al.
6.3.4 Health, Education, and Fertility
Few research projects have attempted to assess the health or education impacts of titling programs. One notable exception is the survey by Galiani and Schargrod-sky (2004), which assessed the effects of land titling on child health in a suburban area of Buenos Aires, Argentina. The authors found smaller household sizes among those living on titled parcels (as a result of lower fertility and accommodation of fewer extended family members) and a positive and significant effect on weight-for-height among the children of families living on the titled parcels (p. 364). They also found that rates of teenage pregnancy were substantially higher among residents on the untitled parcels (20.8%) than among those on the titled parcels (7.9%).
In seeking to explain this result, Galiani and Schargrodsky (2004) posit that titled households invested in home improvements at a time that their children were young, as well as in their children’s human capital. As a result, the children’s school attendance and educational attainment benefited, although “the child effects of land titling seem to be moderate” (p. 370).
The consequence of land titling for fertility, which may have an indirect impact on health and education issues, is analyzed by Field (2003). Her estimates indicate “up to a 22% reduction in fertility for squatter families who received a property title through the government program in Peru” (p. 23).
6.3.5 Residential Mobility, Gentrification, and Spatial Integration
An assumed benefit of titling is that it facilitates property transfers in an open and efficient land market. This is certainly the view of Lanjouw and Levy (2002), who state that “when a buyer cannot be sure that a household will honor the ‘sale’ of its property, and when a property owner cannot be sure that a renter will honor his commitment to leave, households have a more limited range of people with whom they can transact, perhaps including only friends and family members” (pp. 10–11). However, they also find that “most of [the] surveyed households expect to remain on their properties for a very long time, so the most important welfare considera-tion may simply be the increase in security that households derive from living on a property over which they feel they have stronger ownership rights” (p. 27).
Gilbert (2002) reports similar outcomes from Bogotá, Colombia, while Angel et al. (2006) report that in Mexico “there is very little buying and selling of homes in consolidated communities, except in desirable areas that are subject to gentrifica-tion” (p. 14). This suggests that while advocates of land titling may well wish to encourage an active land market in which households use property as a commodity like any other and move “up market” when possible to improve their social and eco-nomic status, newly titled households do not routinely adopt this practice. Instead, they continue to regard their property primarily as a home, the basis for family and community life and an asset to bequeath to their children.
1416 Social and Economic Impacts of Land Titling Programs in Urban and Periurban Areas
There are three situations in which post-titling sales do appear to be significant: distress sales (Cousins et al., 2005, p. 3), sales in periurban locations to which resi-dents have been relocated from informal inner-city settlements (Deutsch, 2006, pp. 34–35), and cases in which households are realizing the windfall gains of titled prop-erties in locations attractive to higher-income households or to private developers.
The literature therefore reveals two opposing approaches by governments to the integration of titled areas into the formal land and housing markets. In some cases transfers are encouraged, although they do not always happen for the reasons pre-dicted, while in other cases transfers are discouraged for social reasons, although the restrictions may not be effective. It is difficult to predict the impact of titling on property sales, perhaps because owners’ reactions to dramatic and sudden changes in property values are always unpredictable or because the view of property as a tradable investment does not reflect the priorities or needs of the groups affected. These uncertainties suggest that an incremental approach to changing the legal and economic status of informal land may be more appropriate than a complete trans-formation that integrates it rapidly and wholly into the legal and formal market. In summary, while the evidence is limited, titling does not appear from the literature either to have accelerated the integration of informal settlements into formal prop-erty markets in ways that benefit the poor as intended or to have protected them from exploitation.
6.4 Economic Impacts
Assessing the economic impacts of land titling programs is not easy because few independent studies have been undertaken. The following comments summarize key points.
6.4.1 Investment in Housing and Property
The superior tendency of land titling to stimulate investment in housing and prop-erty development has been advanced as a key factor justifying the promotion of titling rather than other forms of tenure. This is based on an assumption that house-holds will invest in property improvements only if they own their property and that such investments will be protected in law.
In Peru, Cantuarias and Delgado (2004) report, the Base Line Survey of COFOPRI [Commission for the Formalization of Informal Prop-erty] suggests… (i) 75% of the population with property titles has invested to improve their homes versus 39% of persons without property titles; (ii) between 1994 and 1999, the number of rooms per house increased in approximately 20% within the target sector; (iii) families with property titles have more rooms in their homes; and (iv) the families with property titles have better quality homes. Furthermore, the qualitative survey of the real estate market ordered by PDPU [Urban Property Rights Project]found that people from
142 G. Payne et al.
socio-economic levels C and D 4 consider that the property title increases the value of their property between 20 and 30%. (p. 9)
These conclusions should be treated with caution, however, because COFOPRI is the implementing agency for the land titling program and the authors do not give details about their survey methodology. Nonetheless, the most widely implemented and reviewed program is that undertaken since 1996 by COFOPRI. Moreover, papers by Field (2003, 2005, 2007) based on research on the program have been widely cited as evidence of the impact of land titling programs in increasing tenure security, investment in home improvement, and poverty reduction, and these papers provide a useful starting point for any review addressing this issue.
Field (2005) compares housing investment before and after the program among participating households with changes in investment among two samples of nonpar-ticipants. Evidence presented in her analysis suggests that strengthening property rights in urban slums leads to a significant increase in residential investment. The magnitude of the effect is more than two-thirds of the baseline level (p. 289).
This raises several important points. First, it is hardly unexpected that strength-ening property rights in urban slums has a significant effect on residential invest-ment, a finding that is supported by virtually all observers of land tenure and property rights. What is significant is that Field is not claiming that titling is the means of encouraging such investment, but that increased property rights are. The key issue is whether titles are the only form of rights that can achieve this objective. Significantly, similar to other observers of the situation in Peru, Calderón (2004, p. 298) notes that “when poor urban families feel secure about staying in the dwell-ing they occupy, in other words they know they will not be evicted, they are more likely to invest in housing construction and to establish contact with public or pri-vate service companies to obtain water, sewerage and electricity connections.” The relationship between tenure and investment is certainly not simple. Indeed, there is some evidence that households may invest in substantial renovations because they lack formal tenure and therefore seek to create de facto security through facts on the ground—for example, in Eldoret, Kenya (Musyoka, 2004), and in Albania (P. McAuslan, personal communication, January 2007).
Second, Field (2005) accepts that “changes over time reflect an increase in investment incentives related to the lower threat of eviction” (p. 278). She does not report whether investment also increased over time among households in older, established untitled settlements. Yet as Calderón (2004) demonstrates, such invest-ment has been observed throughout squatter settlements in Lima. These points seri-ously undermine the claims of the Peruvian program that titling represents the most effective means of increasing investment or access to formal credit—and suggest instead that it is simply one of several effective means.
Similarly, although Galiani and Schargrodsky (2005) conclude that in Buenos Aires “moving a poor household from usufructuary rights to full property rights
4 For institutions in charge of socioeconomic surveys, level C corresponds to clase popular (popu-lar classes), which today have a monthly income between US $230 and US $460. Most “invaders” of Villa El Salvador, 30 years ago, belonged to this category. Level D corresponds to clase baja (low classes), with a monthly income below US $230.
1436 Social and Economic Impacts of Land Titling Programs in Urban and Periurban Areas
substantially improves housing quality” (p. 21), they fail to recognize the extreme levels of insecurity experienced by the households in their sample in the years before titling. The Economist acknowledges that “title is not enough in itself to ani-mate the dead capital interred in land and property” (Property and Poverty, 2006). Conversely, where the threat of eviction or the perception of this threat is minimal or nonexistent, such as in Egypt, Morocco, Trinidad and Tobago, Turkey, and many West African cities, owners appear to be willing to invest whether or not they have formal tenure status. In other words, rather than titles themselves, it may be the perception of security and achievement of a minimum bundle of property rights that influence levels of investment and other benefits.
Kessides (1997, p. 11) states that “while formal land registration and titling have been a component in many Bank-supported projects and often a source of delay in implementation, experience has shown that infrastructure improvements provid-ing less than legal title can create a sufficient informal security of tenure to permit residents to invest and acquire other services.” Angel et al. (2006) came to the same conclusion in Mexico, where they note that “homeowners do not wait for titles to make improvements to their homes. Any lack of investment appears to be controlled more by limited income than lack of title” (p. 14).
The clear conclusion from the evidence is that titling is only one of many means of encouraging investment in housing and land. The evidence has not always confirmed that where investments in property improvement have followed the provision of land titles, those investments have been made by the original residents. Instead, they have sometimes been made by others, such as private investors or new households replac-ing the original families. While investments from these sources may improve the condition and increase the value of the property, they may have very different social impacts. This is another aspect on which additional research is required.
6.4.2 Property Values and Costs of Access
A common claim in favor of titling programs is that they generate a significant increase in property values. The literature provides considerable support for this claim.
Using data collected by COFOPRI, Cantuarias and Delgado (2004) find that in Peru “the marginal impact of a property title in each piece of land is approximately US $925. If it is considered that the average value of each lot with no property titles in the study is approximately US $3,680, this represents an increase of 25% or, put it in other words, a minimum impact of US $523,120,800” (p. 9). Angel et al. (2006, p. 6), also in Peru, find that property values increased by an average of 25% after titles were issued. Lanjouw and Levy (2002) report a significant increase in the value of titled properties compared with untitled ones in urban Ecuador: “hav-ing title is associated with a sizable increase in the expected market value of their properties—on average 23.5% of untitled property values” (p. 988).
Similarly, Dowall and Leaf (1991) find that in Jakarta residential plots with clear title sold for a 45% premium over comparable plots without clear title, while
144 G. Payne et al.
Dowall (1998) reports that in Manila the risk of eviction lowers the value of hous-ing units by 25%. Burns (2006, p. 4) cites the earlier research by Dowall and Leaf (1991), who interviewed land brokers in 128 districts of Jakarta and determined that registered land was up to 73% more valuable than similar land held under a weak claim. Deutsch (2006, p. iii) reports that in Cambodia 93% of respondents would pay more for land that has an official land title. Finally, Mitchell (2006, p. 17) quotes Alston, Libecap, and Schneider (1996), who report that “in Brazil, a property titling program led to a doubling in the value of land.” Another study, by Woodruff (2001), also cited by Mitchell (2006, p. 17), found an increase of 25%, while other estimates fell between these two figures.
The evidence suggests that price increases of 25% are common following the provision of land titles—and that in some cases the increases are even larger. What this also suggests, however, is that the lack of a formal title is a price that the urban poor pay to gain access to a residential plot that they otherwise could not afford. Of course, increases in land values are beneficial to owners planning to sell land, but they are less attractive to those seeking to acquire it, because average incomes do not increase at a rate similar to average urban land values. There is anecdotal evidence that the ability to sell land more easily and at a higher price may in itself be a motivation for some households seeking land titles. What they do with the capital acquired would make an interesting research study, since they will presum-ably need to obtain another parcel of land, either by paying a higher price for titled land or by occupying land informally and thus increasing the growth of informal settlements.
This point is taken up by Mitchell (2006), who questions whether higher prop-erty values are to everyone’s benefit. He points out that
the increase in property value comes from two sources, neither of which represents “dead” capital brought to life. In the short term, it comes from speculative investment. Such invest-ment simply draws existing capital away from more productive ventures, exacerbating broader problems caused by the lack of investment in activities that create employment. But the bulk of any increase in property value is realized only in the longer term, when the next generation of individuals seeks housing. The rising cost of land makes future hous-ing more expensive. It now carries the premium of paying the income of speculators and rentiers. So those saving in the present for a house they hope to build in the future must work harder and longer and save more funds. The outcome is an intergenerational transfer of wealth. (p. 18)
6.4.3 Access to (Mortgage) Credit
The ability to use property titles as collateral in accessing formal credit is widely considered to be a key reason for selecting land titling over other tenure options and is a central tenet in de Soto’s claims. The issue correspondingly receives consider-able attention in the literature, for reasons cited by Bromley (2005):
Titles are also said to permit individuals to gain access to official sources of credit—banks, credit unions, lending societies—using their new title as collateral for loans to accomplish several desirable outcomes: (1) start a business; (2) upgrade a dwelling; or (3) undertake investments so that agricultural production will be augmented. All of these outcomes are
1456 Social and Economic Impacts of Land Titling Programs in Urban and Periurban Areas
seen as a means whereby the poor can help themselves without the need for grants and various anti-poverty programs from the international donor community, or even the aid of national governments. It is simple, cheap, and effective. (p. 2)
Predictions about increased access to formal credit following titling are certainly ambitious. According to Graglia and Panaritis (2002),
Banco Sudamericano expects mortgage portfolios to expand by 5–10% within the [Peru-vian] banking system in 2001, with much of the growth generated among lower-income groups whose household income ranges from $200 to $300 a month…. Such customers tend to be less sensitive to political volatility than upper-income families, and better risks… [they are] Peruvian citizens who were previously unable to obtain such loans…. It does not seem unreasonable to assume that by the end of 2003, with hundreds of thousands of other properties formalized, more mortgages will be granted, more bonds will be issued and international capital will be flowing into Peru. (pp. 13–14)
Apart from the intriguing comment that the poor represent a better risk than high-income families, this suggests that the financial system in Peru was gearing up to meet an anticipated massive increase in demand for formal credit from the newly titled poor. Certainly, land is recognized as a common form of collateral for securing a mortgage: Land Equity International (2006, p. 53) cites World Bank reports that in Zambia 95% of commercial bank loans to businesses are secured by land, in Indonesia 80%, and in Uganda 75%. A more pertinent question, however, is what impact land titling programs have on access to mortgage credit by the poor. The outcomes appear on balance to be less impressive than the forecasts, though reports vary.
In the well-known and influential example of Peru, Cantuarias and Delgado (2004, p. 10) report that “the total number of mortgages constituted between 1999 and December 2003 is approximately 65,000.” That represents an average of approximately 13,000–15,000 a year, a somewhat modest level compared with the scale of the program. Graglia and Panaritis’s study in Peru (2002, pp. 12, 20, 22) claims that 45% of property owners with recently formalized titles have solicited loans, and that this group includes both the poor and the middle class. Two quali-fications appear to be in order for these claims. First, the owners of recently for-malized land have solicited loans, rather than actually obtaining them, and second, demand is from both the poor and the middle class. No evidence is provided on the relative proportions of these two groups.
Field and Torero (2006) cite outcomes for Peru that are very different from the predictions. They find that the odds of households obtaining a private loan did not improve after titling, and that more than a third could not get a loan or would not take one. In particular, they find that although the loan approval rate of the govern-ment-owned Materials Bank was 12% higher when the bank requested a title as collateral, “there is no evidence that titles increase the likelihood of receiving credit from private sector banks” (p. 1). 5 They conclude that “banks are not using property titles to securitize loans” (p. 22).
5 Field and Torero (2006, p. 3) also note that “households with no legal claim to property are 9–10% points less likely to secure a loan from a public-sector bank for housing construction materials... though we find no effect of formal property ownership on approval rates of private sector banks.”
146 G. Payne et al.
This evidence is important, since the Materials Bank was established by the gov-ernment primarily to allocate loans to the poor and therefore operates under dif-ferent criteria than private banks. Field and Torero (2006) do not mention that the Materials Bank suffered significant loan defaults, at a rate no private bank could sustain. 6 The Peruvian land titling program has been widely touted as the world’s most successful in reducing urban poverty. This experience suggests, however, that in countries where access to formal mortgage credit is available only through pri-vate banks, titling may not necessarily increase access to such credit.
This point is confirmed by Gravois (2005): In various parts of the Third World, newly legalized squatters on the outskirts of cities are discovering that a property title supplies little of the benefit de Soto projects. Government studies out of de Soto’s native Peru suggest that titles don’t actually increase access to credit much after all. Out of the 200,313 Lima households awarded land titles in 1998 and 1999, only about 24% had gotten any kind of financing by 2002—and in that group, financ-ing from private banks was almost nil. In other words, the only capital infusion—which was itself modest—was coming from the state (p. 1).
Reports from Turkey, Mexico, South Africa, and Colombia suggest similar trends. With respect to Colombia, Gilbert (2002, p. 16) concludes that “in Bogotá’s self-help settlements, property titles seem to have brought neither a healthy hous-ing market nor a regular supply of formal credit. The uncomfortable truth is that in practice, granting legal title has made very little difference.”
Elsewhere the impacts of titling on credit appear to be equally modest. In Argentina Galiani and Schargrodsky (2004, 2005) find that while no households without titles had obtained a mortgage, the figure for those with titles was only slightly higher, at 4%. The Economist , a long-standing supporter of titling, has more recently moderated its support in a leader that accepts that “poor people with title are no more likely to obtain a loan from a commercial bank [than those without]” (Property and Poverty, 2006).
Similarly, a survey of several African countries by the International Institute for Environment and Development (IIED, 2006, p. 12) notes that “while more research is required, there is no evidence in the case studies that poor groups seek to use land titles as collateral. The risk of losing land is felt to be too great, and employment and income are key factors to obtain loans…. There is little evidence that smallholder farmers or low-income urban residents use land titles to secure capital.” A survey in Dar es Salaam, Tanzania, by Byabato (2005, p. 72) found that “80% of households interviewed would not seek formal credit from a bank if they had to use their title deeds as collateral. The main reason was that they feared losing their prime asset—their property.” Similar views were expressed by
6 Kagawa and Turkstra (2002) report that 25% of residents with loans from the Materials Bank were said to have defaulted, either unable or unwilling to repay their loan. The bank, they note, attributed the defaults “to COFOPRI because it, and RPU [Urban Property Registry], have given land for free, giving the beneficiaries the illusion that anything given by the state is for free and therefore there is no need to pay back” (p. 68).
1476 Social and Economic Impacts of Land Titling Programs in Urban and Periurban Areas
owners with informal property rights in several cities studied in anglophone Africa (Rakodi & Leduka, 2004).
Angel et al. (2006) cite a lack of increase in access to mortgage credit for newly titled households in Mexico, where they report that “although a title is a neces-sary precondition for access to loans in the formal market, utilization of credit does not appear to be widespread among regularized communities, even after titles are issued” (p. 15). They also report a lack of take-up in Brazil. McAuslan (2006) pro-vides an equally sobering comment, warning that “the use of land as security and an engine of wealth creation in Africa will continue to be problematic until more creative mortgage systems and laws are applied” (p. 10). This suggests that the poor are as reluctant to borrow from banks as the banks are to lend to the poor, whether applicants possess titles or not.
The literature cites two other factors that significantly influence the impact of titling on access to mortgage credit. The first is the form of title or, in the case of long leases, their duration. The second is that an inability to satisfy all the official standards may preclude owners not only from legalizing their property but also from accessing institutional credit. In India, for example, planning rules and con-struction norms do not always allow legal building improvements (Banerjee, 2004, p. 9), while in informal settlements in Kampala, Uganda, plots that are smaller than the prescribed minimum cannot be legalized (Nkurunziza, 2004).
The thrust of the literature reviewed therefore suggests that titling has not gen-erated any significant improvement in access to formal credit. However, there is a hint that in Argentina and Peru flows of credit have increased within a few years of titling programs having been introduced. A key research question is therefore to what extent this additional credit has been allocated to newly titled households in previously informal or unauthorized settlements rather than to higher-income purchasers. A second question is the extent to which such credit has been invested in home improvements or other productive investments. A third relates to the socio-economic characteristics and motivations of plot owners who choose to mortgage their property compared with those who do not.
6.4.4 Household Incomes, Employment, and Labor Mobility
Do titling programs increase labor mobility and employment? Surprisingly little comment is provided in the reviewed publications, though Graglia and Panaritis (2002) certainly predicted a glowing future in Peru:
An entire, relatively large, local capital market, the MBS [mortgage-backed securities], is only one year old. As that market increases in size and complexity, jobs will need to be created and the level of employee sophistication increased. Increased demand for services ranging from insurance to utilities will also contribute to favorable employment statistics. Entrepreneurs will have newfound capital sources and enjoy a higher degree of mobility. These are just a few examples that illustrate how the registry will touch and benefit many levels of society within the region. (p. 14)
148 G. Payne et al.
Labor market effects are addressed in widely cited papers on titling programs in Peru by Field (2003, 2007), who finds that newly titled households work an aver-age of 17% more hours than squatter households awaiting a title. They are also 38% more likely to participate in organized activities outside the home. However, Mitchell (2006) claims that Field is not comparing like with like and states that “the paper’s footnotes and appendices make clear that neighborhoods were chosen for titling first because of ease of titling, including proximity to commercial centers. More than half the titled neighborhoods were in Lima, whereas a majority of the untitled neighborhoods were in provincial cities” (p. 19), where labor market oppor-tunities differed considerably.
Galiani and Schargrodsky (2005), in their study in a suburb of Buenos Aires, find no evidence that titling generated an increase in “household head income, total household income, total household income per capita, total household income per adult and employment status of the household head” (p. 28). Twenty years after titles were allocated, they report, “in spite of land titling, these families are still very poor… their household income amounts to only 38% of the official poverty line, and 94% of households are below this line” (p. 29).
According to Yose (1999), in a case study of Cape Town, South Africa, “some socio-economic impacts [of land titling] have been negative. Informal economic activities have been displaced (and sometimes relocated to nearby informal settle-ments). Social networks were disrupted as the allocation of plots ignored kinship ties and social networks” (quoted by Cousins et al., 2005, p. 3).
Finally, despite the advantages of titling in many respects, Fernandes (2006, p. 78) notes that “even when they have titles following the completion of regularisation programmes, the residents of informal settlements are still perceived—and see themselves—as favela dwellers and, as such, they are discriminated against by the labour market.”
It is difficult to draw any general conclusions from this mixed evidence. In the case of Peru clarification appears to be necessary to confirm or refute Field’s find-ings. In addition, it appears that an indirect consequence of changing the legal sta-tus of land and housing from unofficial to official in Peru and elsewhere is that previously dynamic unofficial economic activities, such as home-based economic enterprises, may not be permitted, seriously undermining the livelihoods of newly titled households.
6.4.5 Costs of Titling
Are land titling programs expensive? The answer depends in part on the intrinsic costs (and benefits) of alternative options, the ability to afford the costs, and, of course, who is paying. It also depends on the number of steps in the land registration procedures and the efficiency of the administrations involved in the titling process. The answer also should take into account subsequent increases in revenue streams generated by property taxes and possible indirect benefits to urban land and housing markets following the allocation of titles.
1496 Social and Economic Impacts of Land Titling Programs in Urban and Periurban Areas
According to Augustinus (2003), Freehold is generally the most expensive legal tenure type because it uses professionals to create the right, transfer it and maintain the registration records over time. It also often takes the longest to register. This is because firstly, there is a lack of human and financial capac-ity , especially of public sector professionals (Williamson, 1998). Secondly, underlying title/deed ambiguities have to be solved first, e.g., obtaining the correct land use permissions, sorting out any deceased estate issues, and establishing whether there are any other claim-ants to the land. As a result of the length of time it takes, and the lack of human and financial capacity in government, most countries do not have universal coverage, and in fact in most developing countries only 10% of land sites or plots are documented. (p. 26)
Augustinus and Benschop (2003, p. 3) similarly note that “only a small pro-portion of households can afford even the subsidized cost of a site with a title. Those who can afford that cost often realize the true market value and sell to higher income groups.”
Buckley and Kalarickal (2006, p. 22) also consider that “titling is often a costly process. It is not just a matter of formalizing informal arrangements that already exist. Very often, contradictory claims of ownership succeed the announcements of titling programs. As Woodruff (2001) shows, the costs of adjudicating these claims may abrogate the gains from titling.” IIED (2006) reports similar conclu-sions, stating that “formal land tenure registration systems, particularly titling, tend to be expensive, not necessarily tailored to local contexts and inaccessible for poor groups” (p. 11). Stanfield and Bloch (2002, p. 6) express concern that titling can provoke disputes between claimants, which raise program costs.
Cantuarias and Delgado (2004, pp. 11–12) provide specific costs for titling and first registration for the COFOPRI program in Peru. These costs are shown to have risen between 2000 and 2003, though they need to be related to affordability to have any significance and such data are not provided. Lanjouw and Levy (2002) find that in Ecuador “the estimated cost of obtaining a title represents, on average, 102% of annual household per capita consumption…. Although the costs may be spread over time, they clearly represent a substantial expense for squatter households” (pp. 1012–1013).
The costs of formal titling programs also have to be considered in the context of the costs of informality or informal costs in obtaining titles. In Cambodia, the World Bank (2002, p. 7) reports, there is a strong demand for titles, and people already pay US $200–300 and more (in informal fees) for title to land in urban areas.
Costs do not stop with the acquisition and registration of titles. In Cape Town, Cousins et al. (2005, p. 3) note, new property owners also became liable for pay-ing rates and service charges, around 200 rand (R) a month. In some cases in India households receive titles free of charge, and the government picks up the bill. The total cost to the government of issuing free titles can be substantial. In Peru, Angel et al. (2006, p. 11) report, “the cost of the first phase of COFOPRI’s operation (1996–2004) was US $66.3 million.”
According to Palmer (1998, p. 87), the costs of titling can be reduced by chang-ing formalization procedures and reducing other inefficiencies. He also suggests that title insurance schemes should complement, rather than duplicate, registra-tion systems (p. 92). Clichevsky (2003, p. 55) finds that where titling costs were
150 G. Payne et al.
charged partly or wholly to beneficiaries, the costs had negative impacts on both titled households and titling agencies because cost recovery was often poor.
6.4.6 Tax Revenues
The integration of informal settlements into formal urban land and housing markets is widely held to increase tax revenues to local governments, finance the provision of those services that cannot be directly paid for by users, and create a virtuous circle of improved local governance and competence. To this has to be added the question of what short- and long-term impacts taxes and their use have on low-income groups.
The literature does not provide a clear indication of the impact of titling on tax revenues. However, Burns (2006, p. 3) claims that in the Thailand Land Titling Project, which began in late 1984, annual revenues increased from about US $150 million in 1985 to a peak of more than US $1.2 billion in 1996. Even after the prop-erty market crash of 1997, revenues continued to average almost US $400 million a year nationally, a substantial sum.
Information on the basis for determining property taxes is rarely stated in the studies reviewed. In cases where property values rise substantially following titling, taxes based on such values will theoretically generate correspondingly large reve-nues. However, this would place heavy demands on newly titled households, whose incomes may remain low and irregular. In such cases the only means of paying such taxes and administrative charges may be to sell the property, as is reported in South Africa and elsewhere. Conversely, if taxes are set according to the costs of allocat-ing and registering titles, the consequent net increase in revenues may be small. Revenue depends both on maintaining accurate and up-to-date valuation rolls and on collection rates. However, Lunnay (2005, p. 9) suggests that land titling projects implemented in Asian countries have all experienced problems, to a greater or lesser degree, with property valuation.
6.5 Building and Environmental Impacts
Most advocates of land titling in urban areas refer to outcomes at societal and indi-vidual levels, but rarely at the community level. Yet if titling is intended to turn illegal settlers into full citizens, as well as assessing expenditure on individual home improvements, it is relevant to assess impacts on the local environment, for exam-ple, levels of infrastructure and service provision. The literature reviewed, however, does not offer clear evidence on access to urban infrastructure and services.
Sims (2002, p. 95) reports that “the provision in urban Egypt of basic infra-structure and public services to residential areas has only the most tenuous link to the type or degree of formality of tenure.” In Colombia the constitution entitles all citizens, regardless of their tenure status, to receive all public services, on the sole
1516 Social and Economic Impacts of Land Titling Programs in Urban and Periurban Areas
condition that they can afford them (Aristizabal & Ortíz Gómez, 2002, p. 103), and even new informal settlements are well serviced.
Banerjee (2004) reports a positive impact of titling on access to services in India, noting that “families with individual latrines increased from 11.8 to 21.7% and indi-vidual electricity connections increased from 34.5 to 89.3%” (p. 7). In fact, Banerjee points out that investments generated by improved security of tenure in Indian cities may create new problems relating to planning and the provision of infrastructure in very densely populated settlements, where only basic infrastructure improvements have been made. Despite this, three- or four-storey buildings have been constructed in some settlements to cater to the growing demand for cheap rental housing and workshops. Banerjee (2004, p. 10) states that “as a result, the basic services originally provided become progressively inadequate for the growing population and changing uses.”
One reason for the apparently limited impact of titling on access to services may be that costs are simply too high for residents to afford, even with subsidies. According to Cross (2002), this is a major consideration in South Africa, where
tenure security through housing also has a catch to it: obtaining and maintaining tenure means remaining in the serviced settlements. This entails being able to pay user charges for the services delivered, and there are likely to be hidden poverty thresholds involved…. In settlements where the average household income is often less than R600, very few could afford [the costs of service improvements]. (p. 197)
Even if subsidies are affordable for the government, another consideration when titles are allocated in existing informal settlements is that the settlements may be in environmentally vulnerable locations. As Clichevsky (2003, p. 56) notes, many programs regularize areas with deficient environmental conditions because there is no other land available. The improvement of such areas is costly, inhibiting the installation of services.
6.6 Administrative, Institutional, Legal, and Political Impacts
The impacts of land titling programs on the administrative, institutional, legal, and political environments into which they are introduced will depend on whether they impose a quantum change or a modest readjustment in the ways in which land is held or in the relationships between people and land. Disaggregating these multi-faceted aspects is problematic, especially since many writers address several or all of them in the same paragraph.
6.6.1 Administrative Impacts
As reported, land titling programs place heavy demands on land administration agencies, many of which are already overstretched in performing routine tasks. Adapting to new challenges in a dynamic policy and economic climate imposes further demands.
152 G. Payne et al.
Concerns about administrative capacity are raised by Augustinus (2003, p. 9), who states that large-scale and sweeping tenure reform can lead to a loss of ten-ure security through underestimation of the record-keeping requirements required to implement reforms and by putting pressure on already weak administrations to carry out tasks (land survey, adjudication, title, and deed registration) for which they lack the human and financial resources.
Land titling programs involve a number of administrative procedures:
• Surveying the areas to be titled • Recording survey information • Checking areas to be titled for conformity with official planning norms • Identifying claimants • Resolving conflicting claims • Preparing and allocating title documents • Preparing the land registry • Updating the registry as transfers occur • Communicating with other authorities about land taxation and the like.
The initial titling process therefore involves different teams and departments undertaking new tasks and operating within agreed, and possibly new, procedural guidelines. Such changes inevitably take time to operationalize and can cause seri-ous delays that alone can prejudice program outcomes. In Indonesia, for example, a World Bank report (2004, p. 5) indicated that weak administrative capacity had so slowed the pace of land titling that only 30% of all plots had been registered in the 40 years since registration began. Unless the pace quickened, the report pointed out, titling would never catch up with the total number of parcels, since these were increasing by more than a million a year.
Similar observations have been made in Dakar, Senegal. The tenure regulariza-tion program in Dalifort was launched in 1987, but by June 2006 fewer than 1,280 titles had been issued, and at the current pace, it was estimated, decades would be needed to respond to the needs (République du Sénégal, Présidence de la Répub-lique and APIX, 2006). As Durand-Lasserve, Fernandes, Payne, & Smolka (2002, p. 3) emphasize, “in a fairly typical city of 6 million in which 50% of the population lives in irregular settlements, it would be necessary for the administration to issue 400 titles per working day, for 10 years, to remove the backlog.”
According to Land Equity International (2006, p. 60), “the land titling activity in Thailand was planned over a 20 year timeframe and the activity in Indonesia was planned over 25 years. The techniques adopted in Thailand are very flexible and relatively low cost, but even so the Department had 3–5,000 personnel deployed on project activities for long periods over many years.” Sellers-Firmin and Sell-ers (1999) report that in Cameroon title recipients “waited an average of 6.3 years between their initial application and the actual receipt of title… [and since] titling is a long, uncertain process, nationally, only 6% of all applicants successfully navigate the titling process” (p. 1119).
Speeding up the regularization process is clearly crucial, and sometimes this has been achieved. In Peru, for example, where it used to take a household years to com-
1536 Social and Economic Impacts of Land Titling Programs in Urban and Periurban Areas
plete the formalization process, the highly effective COFOPRI program has reduced the time required to between a few hours and five days (Graglia & Panaritis, 2002, p. 12). This is undoubtedly a major achievement, though a large proportion of the titled plots were on government-owned periurban land that was relatively simple to develop and title. Such advantages do not exist in other developing countries.
Once titles have been allocated, they have to be recorded in the land registry, which then needs to be permanently updated if titles are to retain their legal validity. As Feder and Noronha (1987, p. 164) note, “there is no point in introducing a system of title registration where the capacity continuously to update the registers does not exist.”
The impact of titling on staff competence and working practices is also rarely reported. However, the Land Tenure Center (2002) notes that in urban areas of Albania, “for many project staff and government officials, the project has become a mechanism for generating personal income rather than an instrument for achieving broad social and economic goals” (p. 36).
6.6.2 Institutional Impacts
The relative merits and limitations of centralized and decentralized titling programs are discussed in the South American context by Clichevsky (2003, p. 59), who notes that large-scale centralized programs, as in Mexico and Peru, have been success-ful in terms of the number of titles given. However, the agencies responsible have not necessarily worked well with local communities, and the Peruvian program is now administered by local governments. Decentralized programs usually have an important element of community participation, though this can make implementa-tion slower and more expensive. Another constraint with decentralized programs is that local institutions often lack sufficient staff with the necessary skills. Moreover, municipalities and provincial governments may be as bureaucratic and inflexible in working with civil society organizations as the central government, and this creates a major obstacle to effective implementation.
Cantuarias and Delgado (2004, p. 1) consider a major factor in the rapid imple-mentation of the Peruvian titling program to be the fact that COFOPRI and the Urban Property Registry enjoyed full independence, meaning that they had techni-cal, functional, and administrative autonomy. This, together with high-level political support, certainly helped the Peruvian program to achieve its ambitious numerical objectives, and the decision to decentralize the maintenance of land registries to the local level may strike the right long-term balance, since it will be easier for residents to register transfers at a local office.
6.6.3 Legal Impacts
Titling programs may require a change in the laws relating to land and therefore to land policy. Clichevsky (2003) observes that in Latin America “legalization
154 G. Payne et al.
processes are complex and slow because of the different types of illegality and several stakeholders involved and also because of the institutional problems, since there is no updated cadastre in many cities, nor trained staff” (p. 32). In the case of Argentina’s Programa Arraigo, she notes that attempts to avoid legal delays had failed, and between 1983 and 1997 only 10 of an intended 119 projects were completed (p. 38).
Policies that seek to replace customary legal practices and traditions with statu-tory legal systems can increase rather than reduce problems. According to Land Equity International (2006, p. 135), “there are examples such as Indonesia and Ghana where developing countries have sought to dismiss traditional forms of ten-ure and customary land practices in the belief this would speed the path to develop-ment. This fails to recognise reality and ultimately presents more problems than solutions.” Graglia and Panaritis (2002) also reflect on the dangers of replacing established institutional structures with new ones, stating that “the Rwanda example illustrates what happens when the principle of adopting a framework reflecting the reality of an informal system is overlooked” (p. 15).
6.6.4 Political Impacts
As a valuable resource, access to land is an important political issue in most coun-tries. Land reform affects existing interests with differing levels of influence in the political system, affecting the scope for change and the balance of costs and benefits of reform. Land Equity International (2006), for example, notes that
the formal land registration system in most countries is often not neutral and where titling is implemented, people with customary tenure may in fact lose their rights. Women and overlapping rights holders are very vulnerable in these circumstances. It is because of this situation that African countries are introducing new forms of land tenure which are more appropriate…. [However, it continues,] systematic titling for much of Africa is not consid-ered an option for a range of reasons, largely related to the experience from the mid 1950s in Kenya, where systematic land titling led to a range of problems including “land grab-bing” by the urban elite. (pp. 23–24)
Given the enormous profits that titling can generate, it is not uncommon for gov-ernments to manipulate it for individual and group benefit. Such practices have a long history. For example, the Ndungu Commission, established in Kenya in 2003, found evidence that at least 200,000 illegal titles had been created between 1962 and 2002. Furthermore, Ndungu (2006), the chair of the commission, reports, “ille-gal allocations were done on the orders of the President, other senior public offi-cials and well connected politicians or businessmen; beneficiaries of grabbed land included ministers, senior civil servants, politicians, politically connected business-men, and even churches and mosques” (p. 5). Ndungu notes sadly that although the new government undertook to implement all its recommendations, “the report has not been implemented in the structured manner we had recommended” (p. 6). Even more sadly, Kenya is far from the only example of land titling being subject to political manipulation for party and personal gain.
1556 Social and Economic Impacts of Land Titling Programs in Urban and Periurban Areas
On a more general level, McAuslan (2003) has observed that while governments should attempt to enable land markets to operate efficiently and transparently, they must also direct their attention to considerations of equity and social justice.
6.6.5 Impact on Demand
While there is widespread anecdotal evidence that titling is popular, the sources reviewed do not report demand as often as the need to obtain and maintain popu-lar support for titling programs. Reflecting on the Peruvian experience, Land Equity International (2006, p. 60) notes that projects need to build stakeholder support. Angel et al. (2006, p. 12) report that COFOPRI worked closely with elected community lead-ers to build community acceptance. Grant (1999, p. 5) also emphasizes the importance of obtaining and maintaining community support for land titling programs, while the Land Tenure Center (2002, p. 33) acknowledges that in Albania there was no evidence of support for the titling project beyond the project employees and contractors.
There is also a possibility that any new formal tenure system will expose sections of a population to risk. In Tanzania, for example, Byabato (2005, p. 69) states that “it appears that households, especially those whose level of education is up to pri-mary school, do not know some of the detailed information on the title deed.” As the detailed information on the title deed is in English, he comments, it is unsurprising that illiterate households are unaware of important information.
6.7 Conclusions and Issues for Further Analysis
Wallace and Williamson (2006) express the challenge facing international donors and national governments in the rapid introduction of comprehensive administra-tive reforms in land administration and the incorporation of a range of informal set-tlements into formal markets. They claim that Western democracies took hundreds of years to create land markets, while developing countries are trying to compress the experience into decades. They emphasize that
the evolutionary stages in market development operate like building blocks; each stage must be developed before the next is possible and all earlier stages must all operate success-fully to support the most complex stage. The stages are not empirically pure, and probably never can be. Much of the activity involved in the processes of evolution is unplanned, and when deliberate planning attends evolution, it frequently produces outcomes which surprise its designers. (p. 126)
Drawing on extensive practical and theoretical experience, Wallace and William-son caution against forcing the pace of change:
The invisible aspects of land rights must mature. Each right needs sufficient explication to form a comprehensive conceptual framework for thinking about an opportunity set or activity related to land. Rights must be announced, refined and comprehended by members of the rights holding group and by outsiders. The social recognition of land must be trans-
156 G. Payne et al.
formed from land as a physical thing to abstract concepts of rights and powers in relation to land-based activities. (p. 128)
The authors conclude that rather than imposing new land management systems in countries that are not ready to assimilate and adapt them to meet local conditions, “a country may get more immediate economic improvement by making its labour or product market more effective, while it delivers tenure security through instruments other than tenures suitable for a land market, say by recognition of traditional and informal land arrangements” (p. 133).
Burns (2006) similarly notes that programs to strengthen land administration can take many decades to complete: “the process of converting from deeds to title reg-istration [in Australia] took over 100 years and was only completed when a system-atic approach was adopted” (p. 4). He concludes that it is better to have complete coverage at a lower level of accuracy than high standards and a lower level of cov-erage. What matters is the degree of confidence that those involved in land markets have in the efficiency and equity of the processes by which land is obtained, held, developed, and transferred.
The review of the literature also suggests the need for a multifaceted approach, in which titling or other tenure options are integrated with ways of improving urban governance, spatial planning, and access to basic services and credit (e.g., Kingwill et al., 2006, p. 1; Calder n, 2004, p. 300).
The World Bank adopted the cautious approach of piloting land titling in Ghana, where it was recognized that titling might risk altering or abolishing customary interests in land and thus creating new problems. The Bank also demonstrated a pragmatic approach based on lessons drawn from experience since its 1975 land policy paper (World Bank, 1975; Deininger, 2003). This reflected a rediscovery of the value of traditional land rights arrangements.
The need to recognize and work within available institutional resources is a key consideration everywhere, suggesting that an incremental approach to integrating informal settlements into formal land markets is generally more appropriate (Payne, 2002, 2005, pp. 140–141).
Finally, Kingwill et al. (2006) draw on case studies and the literature to show that poverty reduction efforts of the scale required in South Africa and elsewhere require a great deal more than securing property rights in the manner prescribed:
Tenure reform remains necessary and important, but is far from sufficient. In addition, it must be recognized that restructuring the dominant frameworks of property law and admin-istration, so that they work to support the interests of the poor, is no easy task. We must build a better understanding of the complexity of multiple, informal tenures within the “extra-legal” sector, in all their diversity, and acknowledge at the outset that they are fun-damentally different to the individualized, exclusive, private property systems of Western capitalism. (p. 1)
Moreover, to address the differential gender impacts of tenure reform, other legislation, including that governing marital relationships and inheritance, must be considered at the same time.
The central conclusion from this review is that titles appear to be particularly popular when people feel vulnerable to eviction or where they perceive that titling
1576 Social and Economic Impacts of Land Titling Programs in Urban and Periurban Areas
has given significant advantages to other social groups compared with those liv-ing under other tenure regimes. When people feel relatively secure, however, the priority appears to be to obtain services and community facilities as a means of improving their lives. At present, the literature does not enable policy makers or administrators to anticipate what role titling can play in the wider objectives of promoting social and economic development, reducing urban poverty, or increasing social and gender equity and inclusion.
It is also clear that many of the advantages for which titles are promoted, such as stimulating investment in property improvements, have also been realized by less formal increases in tenure status. Moreover, these less formal means may be much cheaper and easier to implement given limited institutional and human resources.
Finally, it is to be hoped that impact assessments will be routinely incorporated into the terms of reference for future land formalization programs so that policy makers can be aware of possible outcomes when formulating or reviewing tenure policy applicable in urban and periurban areas.
Acknowledgements The authors are grateful to the Norwegian Ministry of Foreign Affairs for the financial support to undertake this review—and for its continued support with the Swedish International Development Cooperation Agency (Sida) and the Global Land Tool Network at the United Nations Human Settlements Programme (UN-Habitat) to extend the research to include case studies of Senegal and South Africa as a contribution to the Global Land Tool Network, the Commission on Legal Empowerment of the Poor, and related initiatives. They also gratefully acknowledge the contribution of many colleagues, especially Edesio Fernandes, for providing advice and materials. The views expressed are those of the authors alone.
References
Allanic, B. (2004). La nouvelle coutume urbaine: Évolution comparée des filières coutumières de la gestion foncière urbaine dans les pays d’Afrique subSaharienne. Le cas de Mandela Village, South Africa. Unpublished research report, Institut des Sciences et des Techniques de l’Equipement et de l’Environnement pour le Développement (ISTED), Paris; U.K. Department for International Development, London.
Alston, L., Libecap, G., & Schneider, R. (1996). The determinants and impact of property rights: Land titles on the Brazilian frontier. Journal of Law, Economics, and Organization , 12 (1), 1569–1614.
Angel, S., Brown, E., Dimitrova, D., Ehrenberg, D., Heyes, J., Kusek, P., et al. (2006). Secure tenure in Latin America and the Caribbean: Regularization of informal urban settlements in Peru, Mexico and Brazil . Princeton, NJ: Princeton University, Woodrow Wilson School of Public and International Affairs.
Aristizabal, N., & Ortíz Gómez, A. (2002). Are services more important than titles in Bogotá? In G. Payne (Ed.), Land, rights and innovation: Improving tenure security for the urban poor (pp. 100–113). London: ITDG Publishing.
Augustinus, C. (2003). Handbook on best practices: Security of tenure and access to land—Imple-mentation of the Habitat Agenda . Nairobi: UN-Habitat.
Augustinus, C., & Benschop, M. (2003, June). Security of tenure: Best practices . Paper presented at the UN-Habitat Regional Seminar on Secure Tenure, Nairobi.
Banerjee, B. (2004, June). Maximising the impact of tenure and infrastructure programmes on housing conditions: The case of slums in Indian cities . Paper presented at the International
158 G. Payne et al.
Conference on Adequate and Affordable Housing for All: Research, Policy, Practice, Toronto, Canada.
Barbier, J. (2006). Programme de Restructuration des Quartiers Spontanés, PRQS, Évaluation . Unpublished background paper for République du Sénégal, Présidence de la République & APIX (Agence Nationale Chargée de la Promotion de l’Investissement et des Grands Travaux), Élaboration du plan de restructuration des quartiers de Pikine Sud traversés par l’autoroute Dakar-Diamniadio. Tâche 1: Analyse des interventions passées et actuelles (Rapport d’études, Urbaplan, Lausanne; Ingesahael, Dakar, 2006).
Benjaminsen, T. A., Holden, S., Lund, C., & Sjaastad, E. (2006, May). The emerging formalisa-tion agenda and some empirical evidence from Africa . Paper presented at the international symposium At the Frontiers of Land Issues: Social Embeddedness of Rights and Public Policy, Ecole Nationale Superieure Agronomique de Montpellier– Institut National de Recherche Agronomique, Montpellier, France.
Bromley, D. (2005). The empty promises of formal titles: Creating Potemkin villages in the tropics . Madison: University of Wisconsin, Department of Agricultural and Applied Economics.
Buckley, R. M., & Kalarickal, J. (Eds.). (2006). Thirty years of World Bank shelter lending: What have we learned? Directions in Development–Infrastructure series. Washington, DC: World Bank.
Burns, T. (2006, January). International experience with land administration projects: A frame-work for monitoring of pilots . Paper presented at the National Workshop on Land Policies and Administration for Accelerated Growth and Poverty Reduction in the 21st Century, New Delhi.
Byabato, K. A. (2005). Legal title to land and access to formal finance by the low-income house-holds: The case of Sinza C and Miburani neighbourhoods in Dar es Salaam . PhD dissertation, University of Dar es Salaam—Tanzania.
Calderón, C. J. (2004). The formalisation of property in Peru 2001–2002: The case of Lima. Habi-tat International , 28 (2), 289–300.
Calderón, C. J., Paredes, U., & Quispe, J. (2002). Dinámica de los asentamientos humanos . Lima, Peru: Commission for the Formalization of Informal Property (COFOPRI).
Cantuarias, F., & Delgado, M. (2004). Peru’s urban land titling program . Case Studies in Scaling Up Poverty Reduction. Washington, DC: World Bank.
CLEP (Commission on Legal Empowerment of the Poor). (2006). Overview paper . New York: Author.
Clichevsky, N. (2003). Pobreza y acceso al suelo urbano. Algunas interrogantes sobre las políti-cas de regularización en América Latina. Santiago, Chile: United Nations Economic Commis-sion for Latin America and the Caribbean.
Cousins, B., Cousins, T., Hornby, D., Kingwill, R., Royston, L., & Smit, W. (2005). Will formal-ising property rights reduce poverty in South Africa’s “second economy?” Questioning the mythologies of Hernando de Soto (PLAAS Policy Brief 18). Cape Town: University of the Western Cape, School of Government, Programme for Land and Agrarian Studies.
Cross, C. (2002). Why the urban poor cannot secure tenure: South African tenure policy under pressure. In A. Durand-Lasserve & L. Royston (Eds.), Holding their ground: Secure land ten-ure for the urban poor in developing countries (pp. 195–208). London: Earthscan.
de Soto, H. (2000). The mystery of capital: Why capitalism triumphs in the West and fails every-where else . New York: Basic Books.
Deininger, K. (2003). Land policies for growth and poverty reduction World Bank Policy Research Report. Washington, DC: World Bank.
Deutsch, R. (2006). Beneficiary assessment of land title recipients under the Land Management and Administration Project (LMAP) . Report prepared for the Cambodian Ministry of Land Management, Urban Planning, and Construction, Phnom Penh.
Dowall, D. E. (1998). Making urban land markets work . Working paper. Berkeley: University of California, Institute of Urban and Regional Development.
Dowall, D. E., & Leaf, M. (1991). The price of land for housing in Jakarta. Urban Studies , 28 (5), 707–722.
1596 Social and Economic Impacts of Land Titling Programs in Urban and Periurban Areas
Durand-Lasserve, A. (2006). Market-driven evictions and displacements: Implications for the perpetuation of informal settlements in developing cities. In M. Huchzermeyer & A. Karam (Eds.), Informal settlements: A perpetual challenge? (pp. 207–227). Cape Town: University of Cape Town Press.
Durand-Lasserve, A., Fernandes, E., Payne, G., & Smolka, M. (2002, September). Secure tenure for the urban poor. CIVIS: Learning from Cities (Cities Alliance), issue 3. Retrieved from http://www.citiesalliance.org/
Feder, G., & Noronha, R. (1987). Land rights systems and agricultural development in Sub-Saha-ran Africa. World Bank Research Observer , 2 (2), 143–169.
Fernandes, E. (2002). Combining tenure policies, urban planning and city management in Brazil. In G. Payne (Ed.), Land, rights and innovation: Improving tenure security for the urban poor (pp. 209–232). London: ITDG Publishing.
Fernandes, E. (2006). Principles, bases and challenges of the national programme to support sus-tainable urban land regularization in Brazil. In M. Huchzermeyer & A. Karam (Eds.), Informal settlements: A perpetual challenge? (pp. 62–83). Cape Town: University of Cape Town Press.
Field, E. (2003). Fertility responses to urban land titling programs: The roles of ownership secu-rity and the distribution of household assets . Unpublished manuscript, Harvard University, Department of Economics, Cambridge, MA.
Field, E. (2005). Property rights and investment in urban slums. Journal of the European Eco-nomic Association , 3 (2/3), 279–290.
Field, E. (2007). Entitled to work: Urban property rights and labor supply in Peru. Quarterly Jour-nal of Economics , 122 (4), 1561–1602.
Field, E., & Torero, M. (2006). Do property titles increase credit access among the urban poor? Evidence from a nationwide titling program . Unpublished manuscript, Harvard University, Department of Economics, Cambridge, MA.
Galiani, S., & Schargrodsky, E. (2004). Effects of land titling on child health. Economics and Human Biology , 2 (3), 353–372.
Galiani, S., & Schargrodsky, E. (2005). Property rights for the poor: Effects of land titling (Working Paper 29). Stanford, CA: Stanford University, Stanford Center for International Development.
Gilbert, A. G. (2002). On the mystery of capital and the myths of Hernando de Soto: What differ-ence does legal title make? International Development Planning Review , 24 (1), 1–20.
Graglia, J. M., & Panaritis, E. (2002). At the end of the beginning: The formalization of property rights in emerging markets. Chazen Web Journal of International Business (Columbia Busi-ness School), fall. Retrieved from http://www.gsb.columbia.edu/chazenjournal
Grant, C. (1999, October). Lessons from SE Asian cadastral reform, land titling and land adminis-tration projects in supporting sustainable development in the next millennium . Paper presented at the United Nations–FIG (International Federation of Surveyors) Conference on Land Tenure and Cadastral Infrastructures for Sustainable Development, Melbourne, Australia.
Gravois, J. (2005, January 29). The de Soto delusion. Slate . Retrieved from http://www.slate.com/id/2112792
IIED (International Institute for Environment and Development). (2006). Local innovation in securing land rights in Africa: Lessons from experience (Briefing paper). London: Author.
Kagawa, A., & Turkstra, J. (2002). The process of land tenure formalisation in Peru. In G. Payne (Ed.), Land, rights and innovation: Improving tenure security for the urban poor (pp. 57–75). London: ITDG Publishing.
Kessides, C. (1997). World Bank experience with the provision of infrastructure services for the urban poor: Preliminary identification and review of best practices . Washington, DC: World Bank, Transportation, Water, and Urban Development Department.
Kingwill, R., Cousins, B., Cousins, T., Hornby, D., Royston, L., & Smit, W. (2006). Mysteries and myths: De Soto, property and poverty in South Africa (Gatekeeper Series 124). London: International Institute for Environment and Development.
Land Equity International. (2006). Land administration: Indicators of success, future challenges . Wollongong, Australia: Author.
160 G. Payne et al.
Land Tenure Center. (2002). An assessment of USAID’s investments in land markets and property rights in Albania: Documentary evidence . Madison: University of Wisconsin.
Lanjouw, J., & Levy, P. (2002). Untitled: A study of formal and informal property rights in urban Ecuador. Economic Journal , 112 (482), 986–1019.
Lipton, M., & Toye, J. (1990). Does aid work in India? London: Routledge. Lunnay, C. (2005, December). Land administration in the Asian region: Challenges and oppor-
tunities . Paper presented at the Expert Group Meeting on Secure Land Tenure: New Legal Frameworks and Tools, United Nations Economic and Social Commission for Asia and the Pacific (UNESCAP), Bangkok.
McAuslan, P. (2003). Bringing the law back in: Essays in land, law and development . Aldershot, England: Ashgate.
McAuslan, P. (2006). Legal pluralism as a policy option: Is it desirable? Is it doable? Land rights for African development: From knowledge to action (pp. 9–10). CAPRI Policy Briefs. Wash-ington, DC: CGIAR Systemwide Program on Collective Action and Property Rights.
Mitchell, T. (2006). The properties of markets: Informal housing and capitalism’s mystery (Cul-tural, Political Economy Working Paper Series, No. 2). Lancaster, England: Lancaster Univer-sity, Institute for Advanced Studies in Social and Management Sciences.
Musyoka, R. (2004). Informal land delivery processes in Eldoret, Kenya. Informal Land Delivery Processes in African Cities (Policy Brief 3). Birmingham, England: University of Birmingham, International Development Department. Retrieved from http://www.idd.bham.ac.uk/research/researchprojs.htm
Ndungu, P. N. (2006). Tackling land related corruption in Kenya . Unpublished manuscript. Nkurunziza, E. (2004). Informal land delivery processes in Kampala, Uganda: Summary of findings
and policy implications (Informal Land Delivery Processes in African Cities, Policy Brief 5). Birmingham, England: University of Birmingham, International Development Department. Retrieved from http://www.idd.bham.ac.uk/research/researchprojs.htm
Palmer, D. (1998). Security, risk and registration. Land Use Policy , 15 (1), 83–94. Payne, G. (1997). Urban land tenure and property rights in developing countries: A review . London:
Intermediate Technology Publications, Overseas Development Administration (ODA). Payne, G. (2002). Conclusion: The way forward. In G. Payne (Ed.), Land, rights and innovation:
Improving tenure security for the urban poor (pp. 300–308). London: ITDG Publishing. Payne, G. (2005). Getting ahead of the game: A twin-track approach to improving existing slums
and reducing the need for future slums. Environment and Urbanization , 17 (1), 135–145. Property and Poverty. (2006, August 24). Economist . Retrieved from http://www.defeatpoverty.
com/articles/Economist%20Mystery%20Deepens.pdf Rakodi, C., & Leduka, C. (2004). Informal land delivery processes and access to land for the poor:
A comparative study of six African cities . Informal Land Delivery Processes in African Cities (Policy Brief 6. Birmingham). England: University of Birmingham, International Development Department. Retrieved from http://www.idd.bham.ac.uk/research/researchprojs.htm
Ramirez Corzo, D., & Riofrio, G. (2005, September). Land titling a path to urban inclusion? Policy and practice of the Peruvian model . Paper presented at the Sixth Annual N-AERUS (Network-Association of European Researchers on Urbanisation in the South) Conference, Lund University, Sweden.
Rebuelta-The, A. (2005, December). Land administration and management in the Philippines: Reforms and innovations—Lessons learnt in implementing policy and systems reforms . Paper presented at the Expert Group Meeting on Secure Land Tenure: New Legal Frameworks and Tools, United Nations Economic and Social Commission for Asia and the Pacific (UNES-CAP), Bangkok.
République du Sénégal, Présidence dela République & APIX (Agence Nationale Chargee de la Promotion de l’Investissement et des Grands Travaux). (2006). Élaboration du plan de restruc-turation des quartiers de Pikine Sud traversés par l’autoroute Dakar-Diamniadio. Tâche 1: Analyse des interventions passées et actuelles. Rapport d’études, Urbaplan, Lausanne; Inge-sahael, Dakar.
1616 Social and Economic Impacts of Land Titling Programs in Urban and Periurban Areas
Sclar, E. D., & Garau, P. (2003). Interim report of the Task Force 8 on Improving the Lives of Slum Dwellers . New York: UN Millennium Project.
Sellers-Firmin, K., & Sellers, P. (1999). Expected failures and unexpected successes of land titling in Africa. World Development , 27 (7), 1115–1128.
Sims, D. (2002). What is secure tenure in Egypt? In G. Payne (Ed.), Land, rights and innovation: Improving tenure security for the urban poor (pp. 79–99). London: ITDG Publishing.
Smith, R. E. (2004). Land tenure, fixed investment, and farm productivity: Evidence from Zam-bia’s Southern Province. World Development , 32 (10), 1641–1661.
Stanfield, D., & Bloch, P. (2002). USAID investments in land markets and property rights: Interim assessment based on secondary sources . Madison: University of Wisconsin, Land Tenure Center.
Sukumaran, K. (1999). Hunted, hounded and homeless in Indore: A report on large-scale forced evictions . Indian People’s Tribunal on Environment and Human Rights. Retrieved from http://www.iptindia.org
TVE International. (2001). Land rites [Video film produced for the BBC World Television Earth Report V]. Retrieved from http://www.tve.org/earthreport/archive/landrites.html
UN-Habitat (United Nations Human Settlements Programme). (2002). Rights and reality: Are women’s equal rights to land, housing and property implemented in East Africa? Nairobi: Author.
UN-Habitat. (2005a). Land tenure, housing rights and gender: National and urban framework—Colombia . Law, Land Tenure and Gender Review Series: Latin America. Nairobi: Author.
UN-Habitat. (2005b). Land tenure, housing rights and gender: National and urban framework—Mexico . (Law, Land Tenure and Gender Review Series: Latin America). Nairobi: Author.
Wallace, J., & Williamson, I. (2006). Building land markets. Land Use Policy , 23 (2), 123–135. Williamson, I. (1998). The Bogor Declaration for Cadastral Reform and the Global Workshop on
Land Tenure and Cadastral Infrastructures to Support Sustainable Development. Proceedings of the FIG XXI International Congress: Developing the Profession in a Developing World (Vol. 7, pp. 113–129). Copenhagen: International Federation of Surveyors (FIG).
Woodruff, C. (2001). Review of de Soto’s The mystery of capital. Journal of Economic Literature , 39 (4), 1215–1223.
World Bank. (1975). Land reform (Sector Policy Paper). Washington, DC: Author. World Bank. (2002). Project appraisal document on a proposed credit in the amount of SDR 19.3
million (US $24.3 millions equivalent) to the Kingdom of Cambodia for a land management and administration project (East Asia and Pacific Region, Rural Development and Natural Resources Sector Unit). Washington, DC: Author.
World Bank. (2004). Regional study on land administration, land markets, and collateralized lending. East Asia and Pacific Region. Washington, DC: Author.
World Bank. (2006). Will formal documents of title and the courts resolve all land disputes? (Kabul Urban Policy Notes Series, no. 5). Washington, DC: Author.
Yose, C. (1999). From shacks to houses: Space usage and social change in a Western Cape shanty town . Unpublished master’s of social science thesis, University of Cape Town.

“This page left intentionally blank.”
163
The formal submarket for sales of individual plots financed in monthly installments has helped make it possible for a large segment of the low-income population of the Buenos Aires Metropolitan Region to gain access to housing. However, this submarket has been practically dismantled since 1977, when Decree-Law 8912, regulating urban land use, was enacted. With this new law in place, private sec-tor finance—which had been provided by the land developers themselves—disap-peared. As a result, low-income households have been forced to rely on informal mechanisms to access housing, such as purchasing land in illegal subdivisions or squatting on public land and building their dwellings incrementally.
In the absence of housing policies addressing the needs of the lowest-income households, progressive self-construction was the principal means by which such households could afford housing. In effect, because low-income families could not afford to buy finished housing units, they obtained housing through “progressive” methods—by acquiring a plot and constructing their dwelling incrementally over time, as their savings allowed. This strategy, as Turner (1972) argues, allows house-holds to use their own labor and increase their wealth.
By supplying plots on the installment basis, private developers had made it pos-sible for families to acquire the land on which they built their dwellings.
Large shares of housing units in many areas of the metropolitan region have been created through this process of self-construction. But while these houses have been built on legal lots with secure land tenure and meet adequate construction standards, they often lack access to infrastructure services whose provision requires some kind of public coordination.
Enactment of the new land use law was originally motivated by the perceived need for urban planning in the province of Buenos Aires as well as the need to halt the development of subdivisions with low quality standards and no infrastructure. In this sense the objective of the law was to modify the way in which the supply of land operated, ending the market trend toward producing new plots of land through
S.V. Lall et al. (eds.), Urban Land Markets, DOI 10.1007/978-1-4020-8862-9_7, © World Bank 2009
Chapter 7Informal Neighborhoods in the Buenos Aires Metropolitan Region: Understanding the Effects of Land Regulation on the Welfare of the PoorCynthia Goytia and Gabriel Lanfranchi
C. Goytia ( )Universidad Torcuato Di Tella Buenos Aires, Argentinae-mail: [email protected]
164 C. Goytia and G. Lanfranchi
the subdivision of rural areas without providing these plots with infrastructure serv-ices. For that purpose the law set new standards for minimum plot sizes, affecting the new parceling processes. In addition, it made the developer responsible for pro-viding the necessary infrastructure services (water supply, sewerage, rain drains, paved roads, electricity networks) to newly authorized land subdivisions.
The essential effect of the new land use law was to put an end to the vitality of an important segment of the land market that had facilitated access to housing for low-income households in Buenos Aires. The new subdivision standards—requiring full provision of services and a minimum lot size of 300 m 2 —far exceed the ability of most households to pay. That has pushed settlement into the informal sector.
Enacted in 1977, the land use law set the urbanization parameters for the prov-ince of Buenos Aires. Thirty years later these parameters are still in place despite the significant transformations that have occurred throughout this period of urban development. What is most interesting is that the land use law not only led to effects undermining the housing situation of the poor but also failed to solve the problems that it was intended to address in the previously created neighborhoods. First, the law did not anticipate the mechanisms necessary for the consolidation of the neigh-borhoods whose expansion it was intended to restrain. These neighborhoods have remained marginalized areas, reached neither by public policies—whether national, provincial, or municipal—nor by the private sector. Second, they have not benefited from neighborhood improvement programs (such as those implemented in some shantytowns of Greater Buenos Aires) 1 or from the programs aimed at increasing access to basic infrastructure. 2
In this chapter we describe how the new law has affected the land market for the poor, showing the difficulties it has created in access to basic infrastructure, ten-ure, and housing. The focus is on informal neighborhoods and the determinants of their informality. We present evidence based on georeferenced census information about the magnitude of the problem. We also present a case study of the informal neighborhoods of Cuartel V, in the municipality of Moreno, describing the socio-economic characteristics of households and providing a preliminary evaluation of land and housing markets in these neighborhoods.
The problem of irregular land tenure is not caused only by a lack of income that pushes households into living in deficient housing units located on plots with some degree of informality. Instead, the essential problem is the lack of a formal land market that would allow low-income households to have access to serviced land as well as to suitable financing. This scenario forces low-income house-holds to settle in neighborhoods in which they can afford the cost of access to land—neighborhoods that have been developed and subdivided on the margins of legality.
1 Through Programa Mejoramiento de Barrios (PROMEBA), the neighborhood improvement pro-gram financed in part by the Inter-American Development Bank. 2 In some of these informal neighborhoods, however, there have been novel initiatives that have created mechanisms for cooperation among private service companies, the municipal public sec-tor, and civil society organizations that, with extensive community participation, have enabled the expansion of basic infrastructure services.
1657 Informal Neighborhoods in the Buenos Aires Metropolitan Region
7.1 An Overview of the Issues
In this study of the effect of land use regulation in the Buenos Aires Metropolitan Region we focus on two territorial configurations with distinct scales of analysis. One is Greater Buenos Aires, a group of municipalities that belong to the province of Buenos Aires and are adjacent to the city of Buenos Aires. These municipalities form the first and second metropolitan rings.
Beyond this agglomeration is a third ring of municipalities that, while they still have some rural areas, are undergoing a dynamic process of growing urban integra-tion. Adding the municipalities of the third ring to those of the first two, along with the city of Buenos Aires, introduces the notion of the Buenos Aires Metropolitan Region. The metropolitan region covers an area of 8,235 km 2 and has a population of about 12 million. The first ring is the most populated area, with 4.73 million inhabitants, followed by the second ring, with 3.84 million. The city of Buenos Aires has 2.77 million inhabitants, while the third ring has 0.80 million.
7.1.1 Demographic Dynamics
Understanding the expansion of the metropolitan region requires recognizing its demographic dynamism. The region incorporated 5 million new inhabitants into its territory in the past four decades, bringing its population to the present 12 mil-lion—or 30% of the national population. More than half this population growth—2.86 million new inhabitants—was in the municipalities of the second ring, whose population tripled during this period. This growth is explained by the large increase in the number of low-income households. These households, unable to afford to buy a plot of land in the city center, instead bid for land without infrastructure outside the city center, which allowed them to become homeowners. This location choice was favored by subsidized railway transportation costs.
Although the growth rates have slowed in recent decades, in 1991–2001 the region incorporated another million new inhabitants into its territory. While some municipalities in the region have grown by five times (such as Florencio Varela), the city of Buenos Aires lost 7% of its population in 1991–2001 (Table 7.1).
If we consider the demographics of the metropolitan region at the time of the initial application of the 1977 land use law, we see that between 1980 and 2001 the population in the first and second metropolitan rings increased by 1.75 million, with 70% of the new inhabitants settling in the second ring. Thus 5% of the national population has settled in this area. It is the municipalities in the second ring that today have the most precarious welfare and quality of life in the region.
7.1.2 Housing Conditions
Housing conditions in the Buenos Aires Metropolitan Region are below the average standards at the national and provincial level. This marks a reversal of the situa-
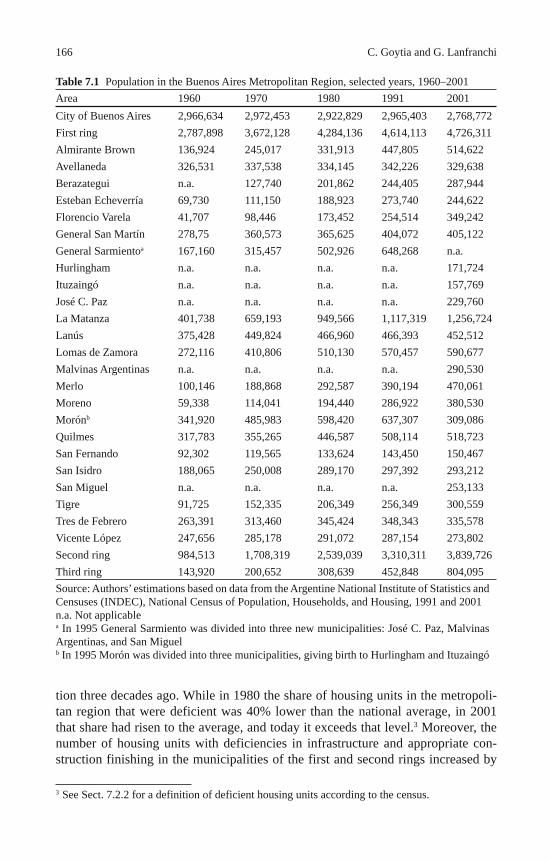
166 C. Goytia and G. Lanfranchi
tion three decades ago. While in 1980 the share of housing units in the metropoli-tan region that were deficient was 40% lower than the national average, in 2001 that share had risen to the average, and today it exceeds that level. 3 Moreover, the number of housing units with deficiencies in infrastructure and appropriate con-struction finishing in the municipalities of the first and second rings increased by
3 See Sect. 7.2.2 for a definition of deficient housing units according to the census.
Table 7.1 Population in the Buenos Aires Metropolitan Region, selected years, 1960–2001Area 1960 1970 1980 1991 2001City of Buenos Aires 2,966,634 2,972,453 2,922,829 2,965,403 2,768,772First ring 2,787,898 3,672,128 4,284,136 4,614,113 4,726,311Almirante Brown 136,924 245,017 331,913 447,805 514,622Avellaneda 326,531 337,538 334,145 342,226 329,638Berazategui n.a. 127,740 201,862 244,405 287,944Esteban Echeverría 69,730 111,150 188,923 273,740 244,622Florencio Varela 41,707 98,446 173,452 254,514 349,242 General San Martín 278,75 360,573 365,625 404,072 405,122General Sarmientoa 167,160 315,457 502,926 648,268 n.a.Hurlingham n.a. n.a. n.a. n.a. 171,724Ituzaingó n.a. n.a. n.a. n.a. 157,769José C. Paz n.a. n.a. n.a. n.a. 229,760La Matanza 401,738 659,193 949,566 1,117,319 1,256,724Lanús 375,428 449,824 466,960 466,393 452,512Lomas de Zamora 272,116 410,806 510,130 570,457 590,677Malvinas Argentinas n.a. n.a. n.a. n.a. 290,530Merlo 100,146 188,868 292,587 390,194 470,061Moreno 59,338 114,041 194,440 286,922 380,530Morónb 341,920 485,983 598,420 637,307 309,086Quilmes 317,783 355,265 446,587 508,114 518,723San Fernando 92,302 119,565 133,624 143,450 150,467San Isidro 188,065 250,008 289,170 297,392 293,212San Miguel n.a. n.a. n.a. n.a. 253,133Tigre 91,725 152,335 206,349 256,349 300,559Tres de Febrero 263,391 313,460 345,424 348,343 335,578Vicente López 247,656 285,178 291,072 287,154 273,802Second ring 984,513 1,708,319 2,539,039 3,310,311 3,839,726Third ring 143,920 200,652 308,639 452,848 804,095Source: Authors’ estimations based on data from the Argentine National Institute of Statistics and Censuses (INDEC), National Census of Population, Households, and Housing, 1991 and 2001n.a. Not applicablea In 1995 General Sarmiento was divided into three new municipalities: José C. Paz, Malvinas Argentinas, and San Miguelb In 1995 Morón was divided into three municipalities, giving birth to Hurlingham and Ituzaingó
1677 Informal Neighborhoods in the Buenos Aires Metropolitan Region
76% (155,000 new housing units) in 1980–2001, while the number of housing units of good quality and with adequate infrastructure rose by only 41%. The increasing shift of low-income households to the suburbs has driven a process of progres-sive home building, fluctuating with income because of lack of access to credit. As a consequence, many of these new housing units still lack some construction finishes.
Coverage by infrastructure services remains inadequate. The urban growth and sprawl were not followed by an expansion of infrastructure networks. The housing units self-constructed by low-income households have gone up on plots of land without infrastructure services.
In addition, after the promulgation of the land use act, informal neighborhoods have continued to become more densely populated as a result of informal sales of vacant lots. In one informal neighborhood in Moreno, for example, the population expanded by 50% in the decade from 1991 to 2001.
7.1.3 Deficiencies in Basic Infrastructure Services and Their Determinants
The Buenos Aires Metropolitan Region still shows substantial spatial imbalance in coverage by and access to infrastructure services. This imbalance mainly affects the areas of informal urban development, where low-income households live.
What explains this disparity in access to infrastructure services? We need to consider three determinants: the demographic dynamics discussed, the land market development in the form of gated communities, and the institutional framework that guided investment and planning for infrastructure services.
7.1.3.1 Constraints on Expanding Infrastructure Coverage
The situation had its origins in a lack of investment at the time that the path of urban growth demanded extensions of public infrastructure networks. Utility companies, at that time operated by the state, had been underfinancing the expansion of the infrastructure networks for years. But since enactment of the land use act in 1977, financing growth has depended on developers transferring gains in land value. The change in land use regulation has also led to a significant shift in the supply of land, with developers now seeking the profitability of the upper segments of the land market by supplying land in gated communities. As a result, the low-income seg-ment has been driven out of the formal land market.
More recently, the concessions of utility companies to the private sector have failed to solve the problem of providing for the expansion of access to infrastructure networks, especially for the lowest-income households. Although privatization has led to an increase in service coverage, informal urban neighborhoods still suffer deficiencies in coverage and access.
168 C. Goytia and G. Lanfranchi
This failure reflects severe limitations in the institutional framework that guided investment and planning for infrastructure services. The regulation governing the granting of licenses to newly privatized utility companies did not adequately take into account the legal, logistical, and institutional constraints that utilities confront in low-income areas. In particular, the service concessions granted to the private sector did not provide institutional instruments for extending coverage to the low-est-income households. The concession agreements included neither a model nor a precise scheme for dealing with the special situations in informal urban neigh-borhoods. Neither the private companies nor the different levels of government have operating guidelines for areas characterized by varying levels of informality. Lack of regular tenure has been the main constraint. As a result of regulatory con-straints, the utility companies have not been licensed to provide services in informal developments.
In addition, the discontinuous, “leapfrog” growth in more recent years has imposed additional costs on the expansion of basic infrastructure services. Since extensions of the main infrastructure networks would pass through vast areas that still had not been developed, the profitability of the investments would be very low. That gave the public sector little incentive to participate in the financing of these networks, which could be financed only privately thanks to the large increase in the value of the land involved in the projects.
Similarly, since the residents of the gated neighborhoods did not pay municipal fees, because it is understood that it is the development that provides the services to its residents, the municipalities faced a reduction in their revenue base. That eventu-ally put a stop to any expectation of expanding service coverage in the rest of the city and thus in the informal neighborhoods.
7.1.3.2 Effect of Infrastructure Deficiencies
Infrastructure services are widely acknowledged to have a significant impact on the quality of life and sanitary conditions for the population. 4 In addition, studies have shown that poor families living in neighborhoods without coverage by basic infra-structure services must devote a significant share of their income to obtaining substi-tute goods (e.g., Estache, Foster, & Wodon, 2002). These households eventually pay more for basic infrastructure services than those with access to infrastructure networks, even though they receive services of lower quality (Goytia & Sanguinetti, 2007).
A first analysis of the deficiency in average coverage of basic services in the Buenos Aires Metropolitan Region shows that 38.5% of households lack coverage by the water supply network, 24.35% by the natural gas network, and 3.2% by the
4 Several studies have identified these effects and shown that reduction in the deficiency of water supply and sewerage led to a reduction in the cases of gastrointestinal diseases among infants in neighborhoods of Greater Buenos Aires (Galiani, González-Rozada, & Schargrodsky, 2008) as well as in the postneonatal mortality rate (Galiani, Gertler, & Schargrodsky, 2005). The impact of these services can also be observed in other dimensions, such as labor productivity and children’s performance at school.
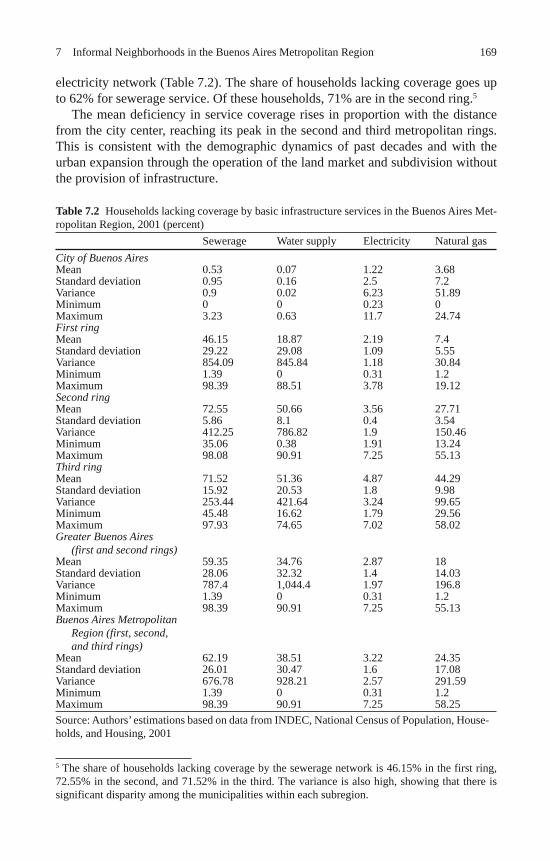
1697 Informal Neighborhoods in the Buenos Aires Metropolitan Region
electricity network (Table 7.2). The share of households lacking coverage goes up to 62% for sewerage service. Of these households, 71% are in the second ring. 5
The mean deficiency in service coverage rises in proportion with the distance from the city center, reaching its peak in the second and third metropolitan rings. This is consistent with the demographic dynamics of past decades and with the urban expansion through the operation of the land market and subdivision without the provision of infrastructure.
5 The share of households lacking coverage by the sewerage network is 46.15% in the first ring, 72.55% in the second, and 71.52% in the third. The variance is also high, showing that there is significant disparity among the municipalities within each subregion.
Table 7.2 Households lacking coverage by basic infrastructure services in the Buenos Aires Met-ropolitan Region, 2001 (percent) Sewerage Water supply Electricity Natural gasCity of Buenos Aires Mean 0.53 0.07 1.22 3.68Standard deviation 0.95 0.16 2.5 7.2Variance 0.9 0.02 6.23 51.89Minimum 0 0 0.23 0Maximum 3.23 0.63 11.7 24.74First ring Mean 46.15 18.87 2.19 7.4Standard deviation 29.22 29.08 1.09 5.55Variance 854.09 845.84 1.18 30.84Minimum 1.39 0 0.31 1.2Maximum 98.39 88.51 3.78 19.12Second ring Mean 72.55 50.66 3.56 27.71Standard deviation 5.86 8.1 0.4 3.54Variance 412.25 786.82 1.9 150.46Minimum 35.06 0.38 1.91 13.24Maximum 98.08 90.91 7.25 55.13Third ring Mean 71.52 51.36 4.87 44.29Standard deviation 15.92 20.53 1.8 9.98Variance 253.44 421.64 3.24 99.65Minimum 45.48 16.62 1.79 29.56Maximum 97.93 74.65 7.02 58.02Greater Buenos Aires
(first and second rings)
Mean 59.35 34.76 2.87 18Standard deviation 28.06 32.32 1.4 14.03Variance 787.4 1,044.4 1.97 196.8Minimum 1.39 0 0.31 1.2Maximum 98.39 90.91 7.25 55.13Buenos Aires Metropolitan
Region (first, second, and third rings)
Mean 62.19 38.51 3.22 24.35Standard deviation 26.01 30.47 1.6 17.08Variance 676.78 928.21 2.57 291.59Minimum 1.39 0 0.31 1.2Maximum 98.39 90.91 7.25 58.25Source: Authors’ estimations based on data from INDEC, National Census of Population, House-holds, and Housing, 2001
170 C. Goytia and G. Lanfranchi
The deficiencies in the supply of all these services are correlated spatially. Several informal neighborhoods still show the lack of access to basic infrastructure services that characterized their initial development. There is a strong spatial association between the magnitude of the deficiency in infrastructure services such as water, sewerage, and natural gas and the deficiency in other urban services, including pavement, public lighting, garbage collection, and public transportation. Further-more, these neighborhoods show a high spatial correlation between the deficiency in service coverage and the irregular status of land tenure.
7.1.4 Land Tenure
Before discussing the magnitude of the problem in land tenure status, it is important to point out the weaknesses in the census methodology used to gather information on this issue. Three problems have been acknowledged even in the reports prepared by the public organizations working in the housing sector. First, the methodology underestimates housing informality because it relies on self-declaration by the respondents. Second, no other information is gathered, such as on the existence of land titles or evidence of de facto tenure security. Third, the census form includes only one question asking households about their occupancy status with respect to the housing and land they occupy: whether they are the owners only of the housing unit or of both the housing unit and the plot of land. Other options are occupancy related to employment, occupancy due to a loan for use, or occupancy as a tenant. Households are not asked about the documents they hold—or about the relationship of the head of household to the beneficiary named on them—that would prove their status as legal owners of the land.
In addition, given the potential for conflict over land occupancy and tenure infor-mality, the methodology used to gather this information does not create incentives for households to accurately declare their tenure status, particularly for those that are squatters on a plot of land and might fear eviction if they accurately reported their status. Indeed, households have an incentive to declare that they are the owners of the housing and land they occupy even if they have no documents to prove their status. As a result, official data on tenure status underestimate the share of house-holds with irregular land tenure.
According to the national census data, 16% of households in Greater Buenos Aires declared some form of irregular tenure in 2001 (Table 7.3). In some munici-palities, particularly in the second ring, such as Moreno and Florencio Varela, the share of households declaring an irregular tenure status averaged as much as 20%, without taking into account problems of underdeclaration. Moreover, these aver-ages hide significant imbalances within municipalities. In some neighborhoods more than half the housing units have an irregular status.
Despite the existence of irregular ownership status, the real estate market has con-tinued to operate, resulting in the transfer of rights in the face of legal uncertainty.
There is a positive correlation between lack of land tenure and the existence of a deficiency in a housing unit, such as a lack of construction finishes, a deficient
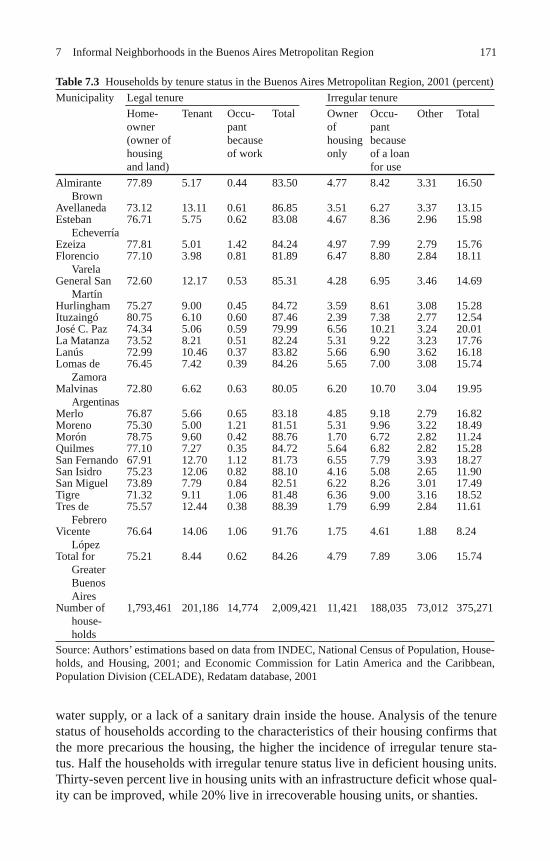
1717 Informal Neighborhoods in the Buenos Aires Metropolitan Region
water supply, or a lack of a sanitary drain inside the house. Analysis of the tenure status of households according to the characteristics of their housing confirms that the more precarious the housing, the higher the incidence of irregular tenure sta-tus. Half the households with irregular tenure status live in deficient housing units. Thirty-seven percent live in housing units with an infrastructure deficit whose qual-ity can be improved, while 20% live in irrecoverable housing units, or shanties.
Table 7.3 Households by tenure status in the Buenos Aires Metropolitan Region, 2001 (percent)Municipality Legal tenure Irregular tenure
Home-owner (owner of housing and land)
Tenant Occu-pant because of work
Total Owner of housing only
Occu-pant because of a loan for use
Other Total
Almirante Brown
77.89 5.17 0.44 83.50 4.77 8.42 3.31 16.50
Avellaneda 73.12 13.11 0.61 86.85 3.51 6.27 3.37 13.15Esteban
Echeverría76.71 5.75 0.62 83.08 4.67 8.36 2.96 15.98
Ezeiza 77.81 5.01 1.42 84.24 4.97 7.99 2.79 15.76Florencio
Varela77.10 3.98 0.81 81.89 6.47 8.80 2.84 18.11
General San Martín
72.60 12.17 0.53 85.31 4.28 6.95 3.46 14.69
Hurlingham 75.27 9.00 0.45 84.72 3.59 8.61 3.08 15.28Ituzaingó 80.75 6.10 0.60 87.46 2.39 7.38 2.77 12.54José C. Paz 74.34 5.06 0.59 79.99 6.56 10.21 3.24 20.01La Matanza 73.52 8.21 0.51 82.24 5.31 9.22 3.23 17.76Lanús 72.99 10.46 0.37 83.82 5.66 6.90 3.62 16.18Lomas de
Zamora76.45 7.42 0.39 84.26 5.65 7.00 3.08 15.74
Malvinas Argentinas
72.80 6.62 0.63 80.05 6.20 10.70 3.04 19.95
Merlo 76.87 5.66 0.65 83.18 4.85 9.18 2.79 16.82Moreno 75.30 5.00 1.21 81.51 5.31 9.96 3.22 18.49Morón 78.75 9.60 0.42 88.76 1.70 6.72 2.82 11.24Quilmes 77.10 7.27 0.35 84.72 5.64 6.82 2.82 15.28San Fernando 67.91 12.70 1.12 81.73 6.55 7.79 3.93 18.27San Isidro 75.23 12.06 0.82 88.10 4.16 5.08 2.65 11.90San Miguel 73.89 7.79 0.84 82.51 6.22 8.26 3.01 17.49Tigre 71.32 9.11 1.06 81.48 6.36 9.00 3.16 18.52Tres de
Febrero75.57 12.44 0.38 88.39 1.79 6.99 2.84 11.61
Vicente López
76.64 14.06 1.06 91.76 1.75 4.61 1.88 8.24
Total for Greater Buenos Aires
75.21 8.44 0.62 84.26 4.79 7.89 3.06 15.74
Number of house-holds
1,793,461 201,186 14,774 2,009,421 11,421 188,035 73,012 375,271
Source: Authors’ estimations based on data from INDEC, National Census of Population, House-holds, and Housing, 2001; and Economic Commission for Latin America and the Caribbean, Population Division (CELADE), Redatam database, 2001
172 C. Goytia and G. Lanfranchi
At the same time, it is important to point out that the other 43% of the households with irregular tenure status live in housing units of good construction quality or have connections to sewerage and a water supply with good bacteriological quality, suggesting a suitable substitution for infrastructure networks. The explanation may be that neighbors, to replace the sanitary services they lack, invest progressively in the acquisition of good-quality substitute goods—such as water supply through wells of an appropriate depth and operated with an electric pump or the installation of a toilet connected to a septic tank and blind drain.
The improvements made indicate the magnitude of household investment through progressive housing improvements, which becomes a savings channel for the house-hold. Moreover, these improvements point to two important issues. First, households are capable of generating sufficient savings for the progressive improvement of their houses, which would enable them to support network improvements in the neigh-borhoods in which they live. Second, this reveals the lack of access to credit and savings instruments that would enable households to accelerate the improvements in their housing—and shows the opportunity for implementing housing microfinance programs for progressive upgrading and expansion of housing units. 6
7.2 Informal Neighborhoods in the Buenos Aires Metropolitan Region
In the previous section we described the deficiencies in access to land, housing, and services that affect low-income households in the Buenos Aires Metropolitan Region. In this section we estimate the magnitude of the problem and show its ter-ritorial dimensions. We also show the spatial correlation of the deficiencies in the informal neighborhoods of the metropolitan region. The importance of this task lies in the lack of consolidated information about the size and characteristics of these neighborhoods, about their location in the metropolitan region, and about their pub-lic policy needs.
7.2.1 Coverage of Infrastructure Services
The data for our analysis are from the 2001 National Census of Population, House-holds, and Housing, conducted by the Argentine National Institute of Statistics and Censuses (INDEC). We take census tracks that have approximately the physical dimensions of a neighborhood, as each has about 330 housing units. The universe of analysis consists of the urban census tracks belonging to the 40 municipalities
6 There are several successful housing microfinance programs being implemented in informal neighborhoods of the Buenos Aires Metropolitan Region, targeted to low-income households that wish to improve their dwellings as well as basic infrastructure (Fidanza, 2005).
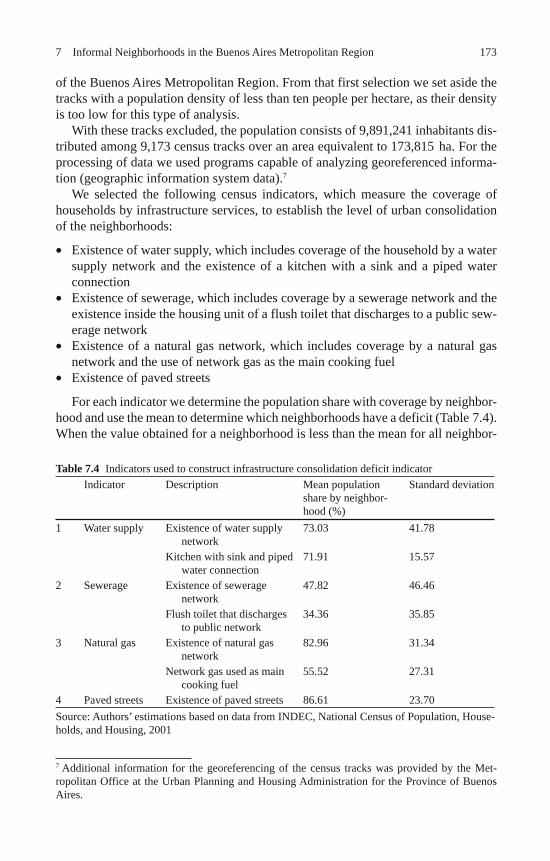
1737 Informal Neighborhoods in the Buenos Aires Metropolitan Region
of the Buenos Aires Metropolitan Region. From that first selection we set aside the tracks with a population density of less than ten people per hectare, as their density is too low for this type of analysis.
With these tracks excluded, the population consists of 9,891,241 inhabitants dis-tributed among 9,173 census tracks over an area equivalent to 173,815 ha. For the processing of data we used programs capable of analyzing georeferenced informa-tion (geographic information system data). 7
We selected the following census indicators, which measure the coverage of households by infrastructure services, to establish the level of urban consolidation of the neighborhoods:
Existence of water supply, which includes coverage of the household by a water supply network and the existence of a kitchen with a sink and a piped water connection Existence of sewerage, which includes coverage by a sewerage network and the existence inside the housing unit of a flush toilet that discharges to a public sew-erage network Existence of a natural gas network, which includes coverage by a natural gas network and the use of network gas as the main cooking fuel Existence of paved streets
For each indicator we determine the population share with coverage by neighbor-hood and use the mean to determine which neighborhoods have a deficit (Table 7.4). When the value obtained for a neighborhood is less than the mean for all neighbor-
7 Additional information for the georeferencing of the census tracks was provided by the Met-ropolitan Office at the Urban Planning and Housing Administration for the Province of Buenos Aires.
•
•
•
•
Table 7.4 Indicators used to construct infrastructure consolidation deficit indicator Indicator Description Mean population
share by neighbor-hood (%)
Standard deviation
1 Water supply Existence of water supply network
73.03 41.78
Kitchen with sink and piped water connection
71.91 15.57
2 Sewerage Existence of sewerage network
47.82 46.46
Flush toilet that discharges to public network
34.36 35.85
3 Natural gas Existence of natural gas network
82.96 31.34
Network gas used as main cooking fuel
55.52 27.31
4 Paved streets Existence of paved streets 86.61 23.70Source: Authors’ estimations based on data from INDEC, National Census of Population, House-holds, and Housing, 2001
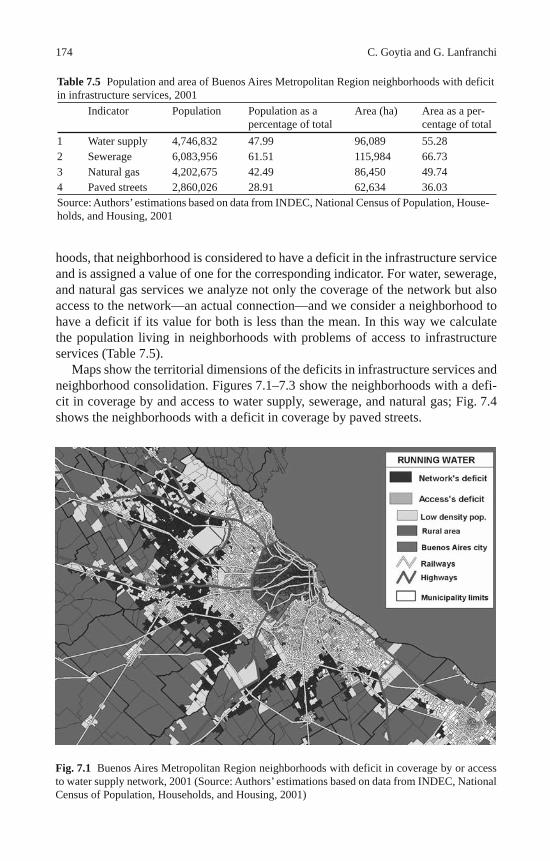
174 C. Goytia and G. Lanfranchi
hoods, that neighborhood is considered to have a deficit in the infrastructure service and is assigned a value of one for the corresponding indicator. For water, sewerage, and natural gas services we analyze not only the coverage of the network but also access to the network—an actual connection—and we consider a neighborhood to have a deficit if its value for both is less than the mean. In this way we calculate the population living in neighborhoods with problems of access to infrastructure services (Table 7.5).
Maps show the territorial dimensions of the deficits in infrastructure services and neighborhood consolidation. Figures 7.1–7.3 show the neighborhoods with a defi-cit in coverage by and access to water supply, sewerage, and natural gas; Fig. 7.4 shows the neighborhoods with a deficit in coverage by paved streets.
Table 7.5 Population and area of Buenos Aires Metropolitan Region neighborhoods with deficit in infrastructure services, 2001 Indicator Population Population as a
percentage of totalArea (ha) Area as a per-
centage of total1 Water supply 4,746,832 47.99 96,089 55.282 Sewerage 6,083,956 61.51 115,984 66.733 Natural gas 4,202,675 42.49 86,450 49.744 Paved streets 2,860,026 28.91 62,634 36.03Source: Authors’ estimations based on data from INDEC, National Census of Population, House-holds, and Housing, 2001
Fig. 7.1 Buenos Aires Metropolitan Region neighborhoods with deficit in coverage by or access to water supply network, 2001 (Source: Authors’ estimations based on data from INDEC, National Census of Population, Households, and Housing, 2001)
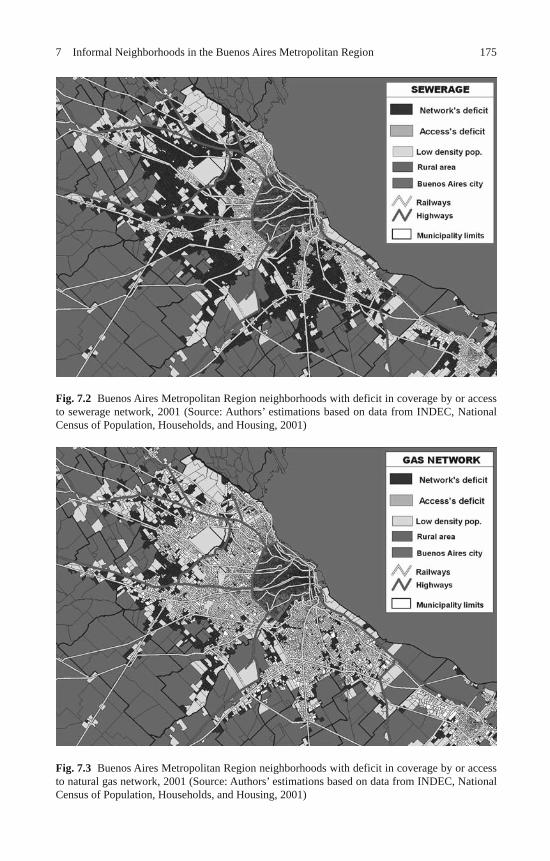
1757 Informal Neighborhoods in the Buenos Aires Metropolitan Region
Fig. 7.2 Buenos Aires Metropolitan Region neighborhoods with deficit in coverage by or access to sewerage network, 2001 (Source: Authors’ estimations based on data from INDEC, National Census of Population, Households, and Housing, 2001)
Fig. 7.3 Buenos Aires Metropolitan Region neighborhoods with deficit in coverage by or access to natural gas network, 2001 (Source: Authors’ estimations based on data from INDEC, National Census of Population, Households, and Housing, 2001)
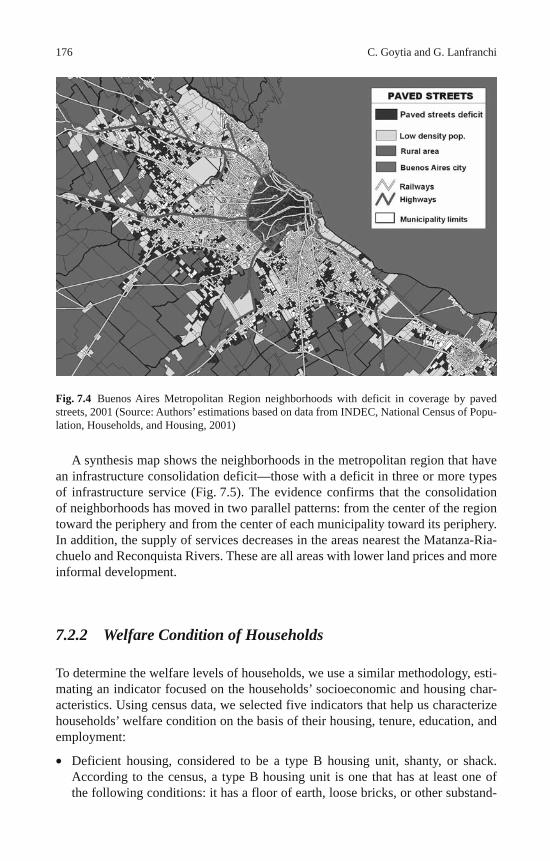
176 C. Goytia and G. Lanfranchi
A synthesis map shows the neighborhoods in the metropolitan region that have an infrastructure consolidation deficit—those with a deficit in three or more types of infrastructure service (Fig. 7.5). The evidence confirms that the consolidation of neighborhoods has moved in two parallel patterns: from the center of the region toward the periphery and from the center of each municipality toward its periphery. In addition, the supply of services decreases in the areas nearest the Matanza-Ria-chuelo and Reconquista Rivers. These are all areas with lower land prices and more informal development.
7.2.2 Welfare Condition of Households
To determine the welfare levels of households, we use a similar methodology, esti-mating an indicator focused on the households’ socioeconomic and housing char-acteristics. Using census data, we selected five indicators that help us characterize households’ welfare condition on the basis of their housing, tenure, education, and employment:
Deficient housing, considered to be a type B housing unit, shanty, or shack. According to the census, a type B housing unit is one that has at least one of the following conditions: it has a floor of earth, loose bricks, or other substand-
•
Fig. 7.4 Buenos Aires Metropolitan Region neighborhoods with deficit in coverage by paved streets, 2001 (Source: Authors’ estimations based on data from INDEC, National Census of Popu-lation, Households, and Housing, 2001)
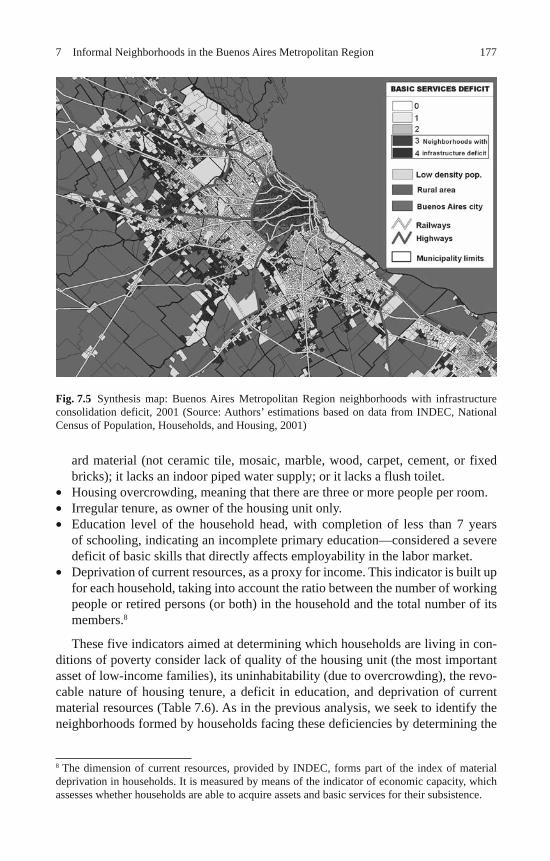
1777 Informal Neighborhoods in the Buenos Aires Metropolitan Region
ard material (not ceramic tile, mosaic, marble, wood, carpet, cement, or fixed bricks); it lacks an indoor piped water supply; or it lacks a flush toilet. Housing overcrowding, meaning that there are three or more people per room. Irregular tenure, as owner of the housing unit only. Education level of the household head, with completion of less than 7 years of schooling, indicating an incomplete primary education—considered a severe deficit of basic skills that directly affects employability in the labor market. Deprivation of current resources, as a proxy for income. This indicator is built up for each household, taking into account the ratio between the number of working people or retired persons (or both) in the household and the total number of its members. 8
These five indicators aimed at determining which households are living in con-ditions of poverty consider lack of quality of the housing unit (the most important asset of low-income families), its uninhabitability (due to overcrowding), the revo-cable nature of housing tenure, a deficit in education, and deprivation of current material resources (Table 7.6). As in the previous analysis, we seek to identify the neighborhoods formed by households facing these deficiencies by determining the
8 The dimension of current resources, provided by INDEC, forms part of the index of material deprivation in households. It is measured by means of the indicator of economic capacity, which assesses whether households are able to acquire assets and basic services for their subsistence.
•••
•
Fig. 7.5 Synthesis map: Buenos Aires Metropolitan Region neighborhoods with infrastructure consolidation deficit, 2001 (Source: Authors’ estimations based on data from INDEC, National Census of Population, Households, and Housing, 2001)
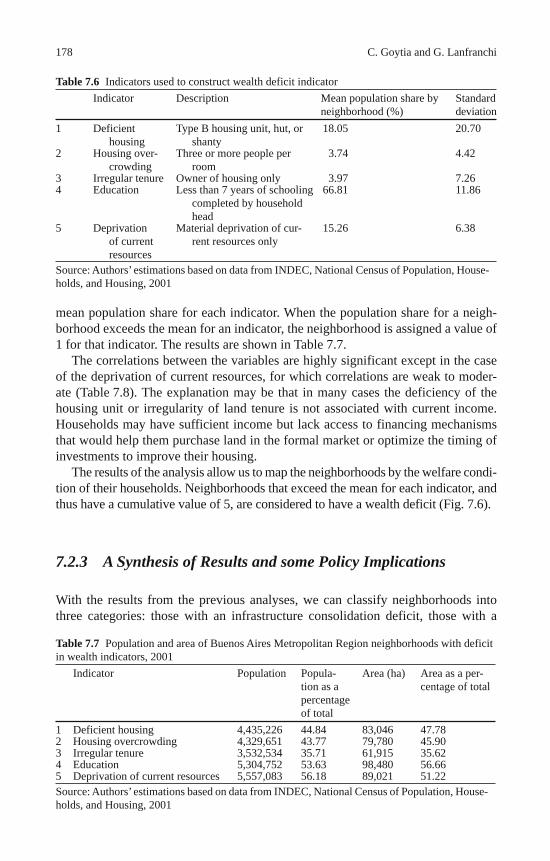
178 C. Goytia and G. Lanfranchi
mean population share for each indicator. When the population share for a neigh-borhood exceeds the mean for an indicator, the neighborhood is assigned a value of 1 for that indicator. The results are shown in Table 7.7.
The correlations between the variables are highly significant except in the case of the deprivation of current resources, for which correlations are weak to moder-ate (Table 7.8). The explanation may be that in many cases the deficiency of the housing unit or irregularity of land tenure is not associated with current income. Households may have sufficient income but lack access to financing mechanisms that would help them purchase land in the formal market or optimize the timing of investments to improve their housing.
The results of the analysis allow us to map the neighborhoods by the welfare condi-tion of their households. Neighborhoods that exceed the mean for each indicator, and thus have a cumulative value of 5, are considered to have a wealth deficit (Fig. 7.6).
7.2.3 A Synthesis of Results and some Policy Implications
With the results from the previous analyses, we can classify neighborhoods into three categories: those with an infrastructure consolidation deficit, those with a
Table 7.6 Indicators used to construct wealth deficit indicator Indicator Description Mean population share by
neighborhood (%)Standard deviation
1 Deficient housing
Type B housing unit, hut, or shanty
18.05 20.70
2 Housing over-crowding
Three or more people per room
3.74 4.42
3 Irregular tenure Owner of housing only 3.97 7.264 Education Less than 7 years of schooling
completed by household head
66.81 11.86
5 Deprivation of current resources
Material deprivation of cur-rent resources only
15.26 6.38
Source: Authors’ estimations based on data from INDEC, National Census of Population, House-holds, and Housing, 2001
Table 7.7 Population and area of Buenos Aires Metropolitan Region neighborhoods with deficit in wealth indicators, 2001 Indicator Population Popula-
tion as a percentage of total
Area (ha) Area as a per-centage of total
1 Deficient housing 4,435,226 44.84 83,046 47.782 Housing overcrowding 4,329,651 43.77 79,780 45.903 Irregular tenure 3,532,534 35.71 61,915 35.624 Education 5,304,752 53.63 98,480 56.665 Deprivation of current resources 5,557,083 56.18 89,021 51.22Source: Authors’ estimations based on data from INDEC, National Census of Population, House-holds, and Housing, 2001
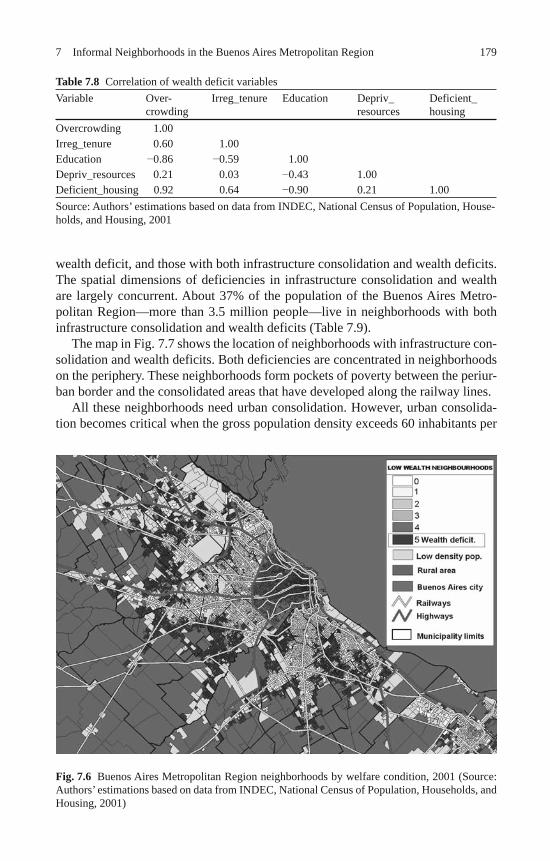
1797 Informal Neighborhoods in the Buenos Aires Metropolitan Region
wealth deficit, and those with both infrastructure consolidation and wealth deficits. The spatial dimensions of deficiencies in infrastructure consolidation and wealth are largely concurrent. About 37% of the population of the Buenos Aires Metro-politan Region—more than 3.5 million people—live in neighborhoods with both infrastructure consolidation and wealth deficits (Table 7.9).
The map in Fig. 7.7 shows the location of neighborhoods with infrastructure con-solidation and wealth deficits. Both deficiencies are concentrated in neighborhoods on the periphery. These neighborhoods form pockets of poverty between the periur-ban border and the consolidated areas that have developed along the railway lines.
All these neighborhoods need urban consolidation. However, urban consolida-tion becomes critical when the gross population density exceeds 60 inhabitants per
Table 7.8 Correlation of wealth deficit variablesVariable Over-
crowdingIrreg_tenure Education Depriv_
resourcesDeficient_housing
Overcrowding 1.00 Irreg_tenure 0.60 1.00 Education 0.86 0.59 1.00 Depriv_resources 0.21 0.03 0.43 1.00 Deficient_housing 0.92 0.64 0.90 0.21 1.00Source: Authors’ estimations based on data from INDEC, National Census of Population, House-holds, and Housing, 2001
Fig. 7.6 Buenos Aires Metropolitan Region neighborhoods by welfare condition, 2001 (Source: Authors’ estimations based on data from INDEC, National Census of Population, Households, and Housing, 2001)
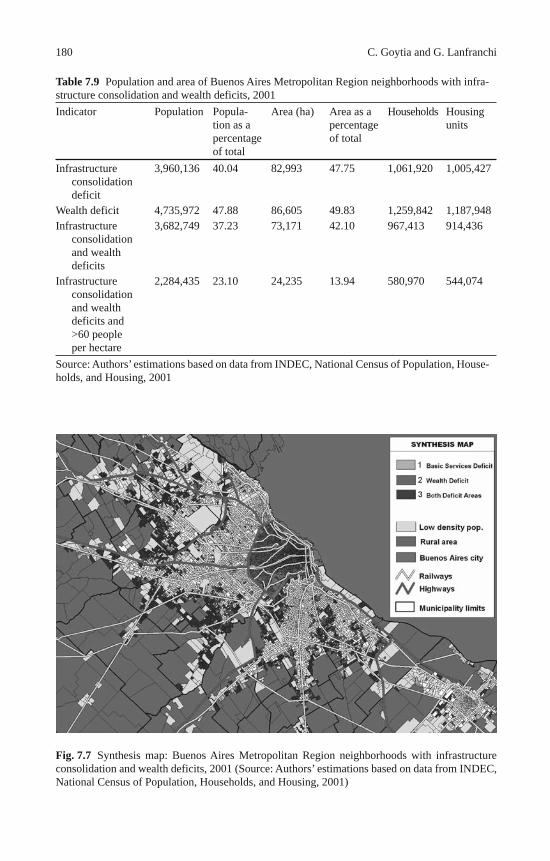
180 C. Goytia and G. Lanfranchi
Table 7.9 Population and area of Buenos Aires Metropolitan Region neighborhoods with infra-structure consolidation and wealth deficits, 2001Indicator Population Popula-
tion as a percentage of total
Area (ha) Area as a percentage of total
Households Housing units
Infrastructure consolidation deficit
3,960,136 40.04 82,993 47.75 1,061,920 1,005,427
Wealth deficit 4,735,972 47.88 86,605 49.83 1,259,842 1,187,948Infrastructure
consolidation and wealth deficits
3,682,749 37.23 73,171 42.10 967,413 914,436
Infrastructure consolidation and wealth deficits and >60 people per hectare
2,284,435 23.10 24,235 13.94 580,970 544,074
Source: Authors’ estimations based on data from INDEC, National Census of Population, House-holds, and Housing, 2001
Fig. 7.7 Synthesis map: Buenos Aires Metropolitan Region neighborhoods with infrastructure consolidation and wealth deficits, 2001 (Source: Authors’ estimations based on data from INDEC, National Census of Population, Households, and Housing, 2001)
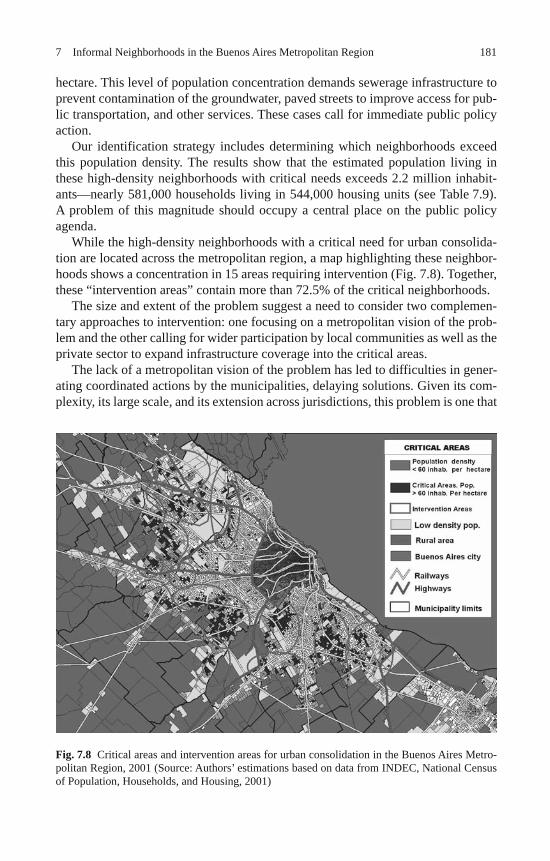
1817 Informal Neighborhoods in the Buenos Aires Metropolitan Region
hectare. This level of population concentration demands sewerage infrastructure to prevent contamination of the groundwater, paved streets to improve access for pub-lic transportation, and other services. These cases call for immediate public policy action.
Our identification strategy includes determining which neighborhoods exceed this population density. The results show that the estimated population living in these high-density neighborhoods with critical needs exceeds 2.2 million inhabit-ants—nearly 581,000 households living in 544,000 housing units (see Table 7.9). A problem of this magnitude should occupy a central place on the public policy agenda.
While the high-density neighborhoods with a critical need for urban consolida-tion are located across the metropolitan region, a map highlighting these neighbor-hoods shows a concentration in 15 areas requiring intervention (Fig. 7.8). Together, these “intervention areas” contain more than 72.5% of the critical neighborhoods.
The size and extent of the problem suggest a need to consider two complemen-tary approaches to intervention: one focusing on a metropolitan vision of the prob-lem and the other calling for wider participation by local communities as well as the private sector to expand infrastructure coverage into the critical areas.
The lack of a metropolitan vision of the problem has led to difficulties in gener-ating coordinated actions by the municipalities, delaying solutions. Given its com-plexity, its large scale, and its extension across jurisdictions, this problem is one that
Fig. 7.8 Critical areas and intervention areas for urban consolidation in the Buenos Aires Metro-politan Region, 2001 (Source: Authors’ estimations based on data from INDEC, National Census of Population, Households, and Housing, 2001)
182 C. Goytia and G. Lanfranchi
should be tackled at the metropolitan level, with an appropriate institutional, legal, and regulatory framework.
Investment by the private sector has been discouraged by the lack of knowledge about the socioeconomic characteristics of households, their poverty levels, and their ability to pay. In the case of infrastructure services, the market failure is sur-prising, since households that lack access to network services must spend a larger share of their incomes to purchase substitute goods. Although the companies with infrastructure service concessions see a potential market in these neighborhoods, they also perceive serious risks in extending access to services to the poorest house-holds. This is a market segment in which little is known about consumption habits and payment patterns.
Wider participation by local communities can help in developing this market. In the past few years NGO programs involving communities in housing and infra-structure interventions have had strong positive effects. Through this approach, the efforts of NGOs active in the area may help in organizing demand, which would enable the market to operate (Goytia & Sanguinetti, 2007).
7.3 Case Study: The Informal Neighborhoods of Cuartel V, Municipality of Moreno
As we have explained, urban land is a crucial bottleneck for low-income housing. Despite the fundamental role of urban land in addressing the housing needs of the poor, however, this issue is not adequately dealt with by public policy. In this sec-tion we provide evidence on land market outcomes, focusing on some informal neighborhoods of the Buenos Aires Metropolitan Region.
In the previous section we estimated the deficit in access to public services in neighborhoods with greater housing and tenure informality, neighborhoods that had been developed before the land use regulation implemented through Decree-Law 8912. The neighborhoods analyzed in this section are located in Cuartel V, a district in the municipality of Moreno, and are part of the second metropolitan ring, an area characterized by significant population growth in the past two decades. 9 Our analysis focuses on an area encompassing 5.5 km 2 (400 blocks) inhabited by 8,000 households, a total of 40,000 inhabitants.
Data from the 2001 National Census of Population, Households, and Hous-ing show that these neighborhoods lack coverage by basic infrastructure services (Table 7.10). The supply of other urban services, such as paved streets and public lighting, is also low. While responsibility for supplying basis infrastructure serv-ices such as water, sewerage, and natural gas has alternated between the public and private sectors, the responsibility for supplying other urban services lies with
9 The area of informal development extends beyond the limits of Moreno into the municipalities of José C. Paz, San Miguel, and Pilar. This area is known as “the backyards” because it has lagged far behind the rest of the neighborhoods in these municipalities.
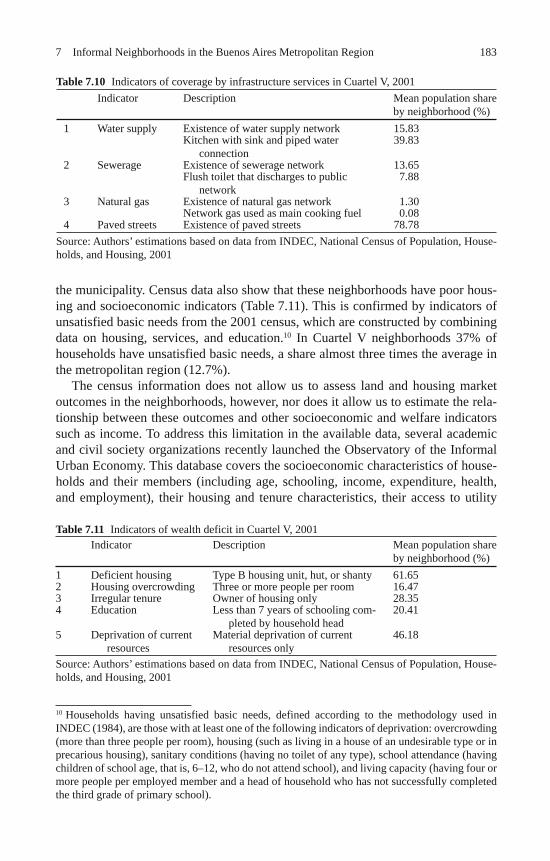
1837 Informal Neighborhoods in the Buenos Aires Metropolitan Region
the municipality. Census data also show that these neighborhoods have poor hous-ing and socioeconomic indicators (Table 7.11). This is confirmed by indicators of unsatisfied basic needs from the 2001 census, which are constructed by combining data on housing, services, and education. 10 In Cuartel V neighborhoods 37% of households have unsatisfied basic needs, a share almost three times the average in the metropolitan region (12.7%).
The census information does not allow us to assess land and housing market outcomes in the neighborhoods, however, nor does it allow us to estimate the rela-tionship between these outcomes and other socioeconomic and welfare indicators such as income. To address this limitation in the available data, several academic and civil society organizations recently launched the Observatory of the Informal Urban Economy. This database covers the socioeconomic characteristics of house-holds and their members (including age, schooling, income, expenditure, health, and employment), their housing and tenure characteristics, their access to utility
10 Households having unsatisfied basic needs, defined according to the methodology used in INDEC (1984), are those with at least one of the following indicators of deprivation: overcrowding (more than three people per room), housing (such as living in a house of an undesirable type or in precarious housing), sanitary conditions (having no toilet of any type), school attendance (having children of school age, that is, 6–12, who do not attend school), and living capacity (having four or more people per employed member and a head of household who has not successfully completed the third grade of primary school).
Table 7.10 Indicators of coverage by infrastructure services in Cuartel V, 2001 Indicator Description Mean population share
by neighborhood (%)1 Water supply Existence of water supply network 15.83 Kitchen with sink and piped water
connection39.83
2 Sewerage Existence of sewerage network 13.65 Flush toilet that discharges to public
network7.88
3 Natural gas Existence of natural gas network 1.30 Network gas used as main cooking fuel 0.084 Paved streets Existence of paved streets 78.78
Source: Authors’ estimations based on data from INDEC, National Census of Population, House-holds, and Housing, 2001
Table 7.11 Indicators of wealth deficit in Cuartel V, 2001 Indicator Description Mean population share
by neighborhood (%)1 Deficient housing Type B housing unit, hut, or shanty 61.652 Housing overcrowding Three or more people per room 16.473 Irregular tenure Owner of housing only 28.354 Education Less than 7 years of schooling com-
pleted by household head20.41
5 Deprivation of current resources
Material deprivation of current resources only
46.18
Source: Authors’ estimations based on data from INDEC, National Census of Population, House-holds, and Housing, 2001
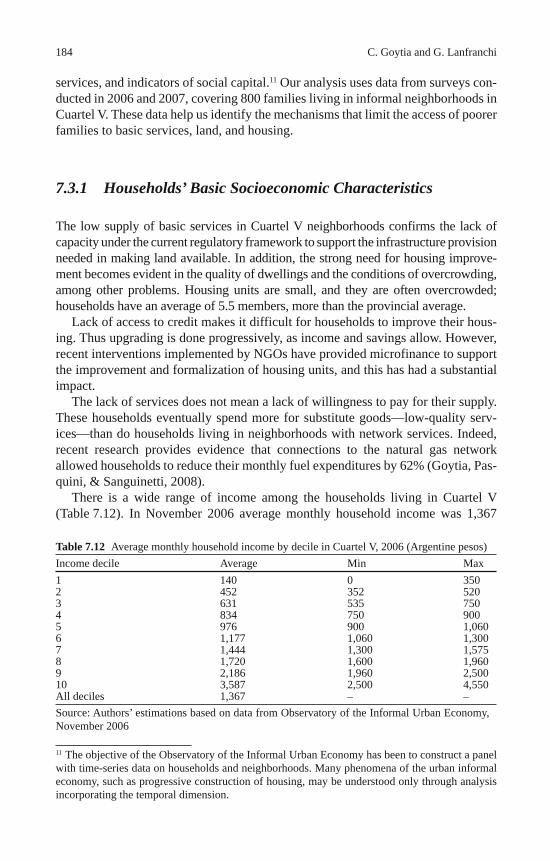
184 C. Goytia and G. Lanfranchi
services, and indicators of social capital. 11 Our analysis uses data from surveys con-ducted in 2006 and 2007, covering 800 families living in informal neighborhoods in Cuartel V. These data help us identify the mechanisms that limit the access of poorer families to basic services, land, and housing.
7.3.1 Households’ Basic Socioeconomic Characteristics
The low supply of basic services in Cuartel V neighborhoods confirms the lack of capacity under the current regulatory framework to support the infrastructure provision needed in making land available. In addition, the strong need for housing improve-ment becomes evident in the quality of dwellings and the conditions of overcrowding, among other problems. Housing units are small, and they are often overcrowded; households have an average of 5.5 members, more than the provincial average.
Lack of access to credit makes it difficult for households to improve their hous-ing. Thus upgrading is done progressively, as income and savings allow. However, recent interventions implemented by NGOs have provided microfinance to support the improvement and formalization of housing units, and this has had a substantial impact.
The lack of services does not mean a lack of willingness to pay for their supply. These households eventually spend more for substitute goods—low-quality serv-ices—than do households living in neighborhoods with network services. Indeed, recent research provides evidence that connections to the natural gas network allowed households to reduce their monthly fuel expenditures by 62% (Goytia, Pas-quini, & Sanguinetti, 2008).
There is a wide range of income among the households living in Cuartel V (Table 7.12). In November 2006 average monthly household income was 1,367
11 The objective of the Observatory of the Informal Urban Economy has been to construct a panel with time-series data on households and neighborhoods. Many phenomena of the urban informal economy, such as progressive construction of housing, may be understood only through analysis incorporating the temporal dimension.
Table 7.12 Average monthly household income by decile in Cuartel V, 2006 (Argentine pesos)Income decile Average Min Max1 140 0 3502 452 352 5203 631 535 7504 834 750 9005 976 900 1,0606 1,177 1,060 1,3007 1,444 1,300 1,5758 1,720 1,600 1,9609 2,186 1,960 2,50010 3,587 2,500 4,550All deciles 1,367 – –Source: Authors’ estimations based on data from Observatory of the Informal Urban Economy, November 2006
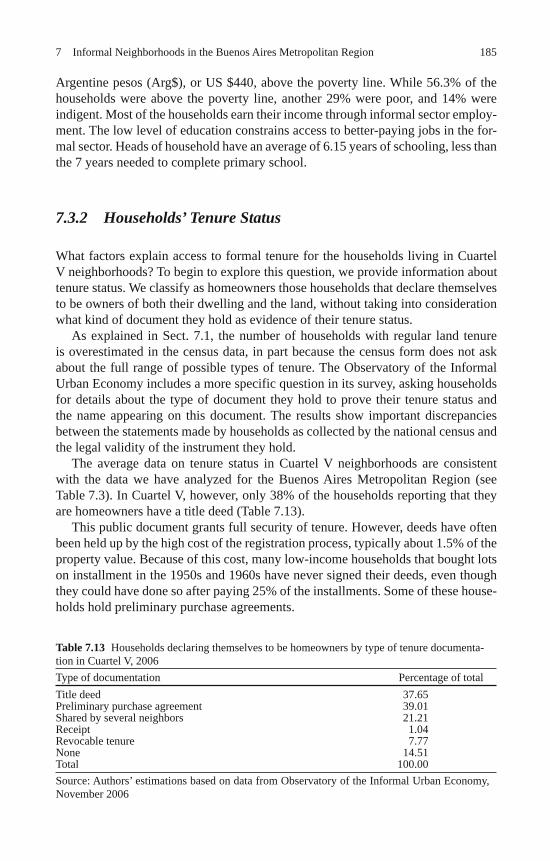
1857 Informal Neighborhoods in the Buenos Aires Metropolitan Region
Argentine pesos (Arg$), or US $440, above the poverty line. While 56.3% of the households were above the poverty line, another 29% were poor, and 14% were indigent. Most of the households earn their income through informal sector employ-ment. The low level of education constrains access to better-paying jobs in the for-mal sector. Heads of household have an average of 6.15 years of schooling, less than the 7 years needed to complete primary school.
7.3.2 Households’ Tenure Status
What factors explain access to formal tenure for the households living in Cuartel V neighborhoods? To begin to explore this question, we provide information about tenure status. We classify as homeowners those households that declare themselves to be owners of both their dwelling and the land, without taking into consideration what kind of document they hold as evidence of their tenure status.
As explained in Sect. 7.1, the number of households with regular land tenure is overestimated in the census data, in part because the census form does not ask about the full range of possible types of tenure. The Observatory of the Informal Urban Economy includes a more specific question in its survey, asking households for details about the type of document they hold to prove their tenure status and the name appearing on this document. The results show important discrepancies between the statements made by households as collected by the national census and the legal validity of the instrument they hold.
The average data on tenure status in Cuartel V neighborhoods are consistent with the data we have analyzed for the Buenos Aires Metropolitan Region (see Table 7.3). In Cuartel V, however, only 38% of the households reporting that they are homeowners have a title deed (Table 7.13).
This public document grants full security of tenure. However, deeds have often been held up by the high cost of the registration process, typically about 1.5% of the property value. Because of this cost, many low-income households that bought lots on installment in the 1950s and 1960s have never signed their deeds, even though they could have done so after paying 25% of the installments. Some of these house-holds hold preliminary purchase agreements.
Table 7.13 Households declaring themselves to be homeowners by type of tenure documenta-tion in Cuartel V, 2006Type of documentation Percentage of totalTitle deed 37.65Preliminary purchase agreement 39.01Shared by several neighbors 21.21Receipt 1.04Revocable tenure 7.77None 14.51Total 100.00Source: Authors’ estimations based on data from Observatory of the Informal Urban Economy, November 2006
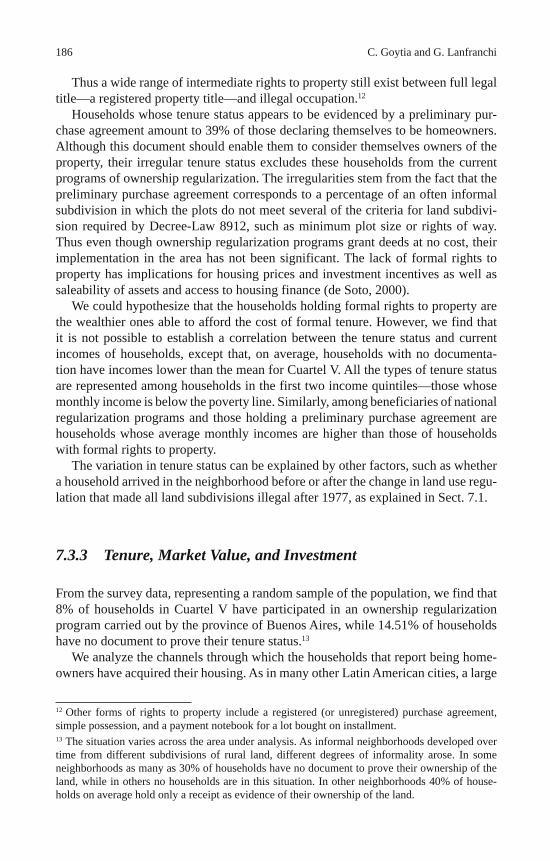
186 C. Goytia and G. Lanfranchi
Thus a wide range of intermediate rights to property still exist between full legal title—a registered property title—and illegal occupation. 12
Households whose tenure status appears to be evidenced by a preliminary pur-chase agreement amount to 39% of those declaring themselves to be homeowners. Although this document should enable them to consider themselves owners of the property, their irregular tenure status excludes these households from the current programs of ownership regularization. The irregularities stem from the fact that the preliminary purchase agreement corresponds to a percentage of an often informal subdivision in which the plots do not meet several of the criteria for land subdivi-sion required by Decree-Law 8912, such as minimum plot size or rights of way. Thus even though ownership regularization programs grant deeds at no cost, their implementation in the area has not been significant. The lack of formal rights to property has implications for housing prices and investment incentives as well as saleability of assets and access to housing finance (de Soto, 2000).
We could hypothesize that the households holding formal rights to property are the wealthier ones able to afford the cost of formal tenure. However, we find that it is not possible to establish a correlation between the tenure status and current incomes of households, except that, on average, households with no documenta-tion have incomes lower than the mean for Cuartel V. All the types of tenure status are represented among households in the first two income quintiles—those whose monthly income is below the poverty line. Similarly, among beneficiaries of national regularization programs and those holding a preliminary purchase agreement are households whose average monthly incomes are higher than those of households with formal rights to property.
The variation in tenure status can be explained by other factors, such as whether a household arrived in the neighborhood before or after the change in land use regu-lation that made all land subdivisions illegal after 1977, as explained in Sect. 7.1.
7.3.3 Tenure, Market Value, and Investment
From the survey data, representing a random sample of the population, we find that 8% of households in Cuartel V have participated in an ownership regularization program carried out by the province of Buenos Aires, while 14.51% of households have no document to prove their tenure status. 13
We analyze the channels through which the households that report being home-owners have acquired their housing. As in many other Latin American cities, a large
12 Other forms of rights to property include a registered (or unregistered) purchase agreement, simple possession, and a payment notebook for a lot bought on installment. 13 The situation varies across the area under analysis. As informal neighborhoods developed over time from different subdivisions of rural land, different degrees of informality arose. In some neighborhoods as many as 30% of households have no document to prove their ownership of the land, while in others no households are in this situation. In other neighborhoods 40% of house-holds on average hold only a receipt as evidence of their ownership of the land.
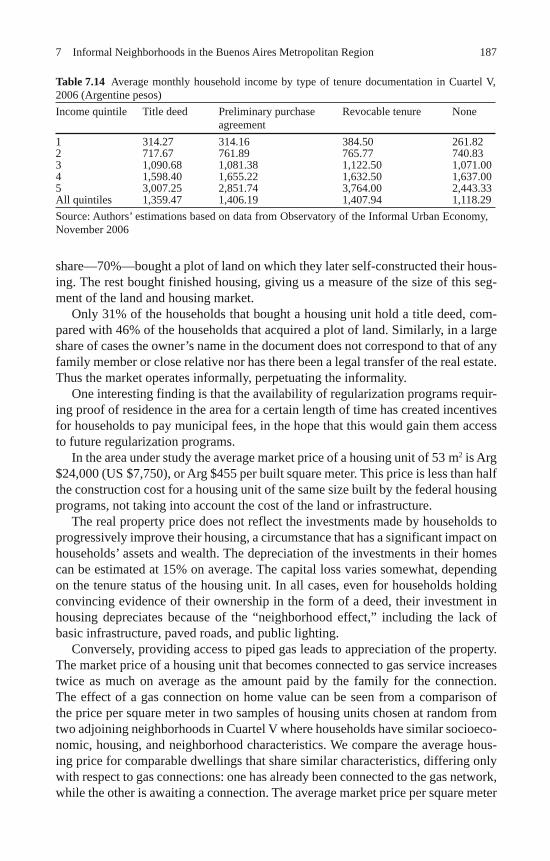
1877 Informal Neighborhoods in the Buenos Aires Metropolitan Region
share—70%—bought a plot of land on which they later self-constructed their hous-ing. The rest bought finished housing, giving us a measure of the size of this seg-ment of the land and housing market.
Only 31% of the households that bought a housing unit hold a title deed, com-pared with 46% of the households that acquired a plot of land. Similarly, in a large share of cases the owner’s name in the document does not correspond to that of any family member or close relative nor has there been a legal transfer of the real estate. Thus the market operates informally, perpetuating the informality.
One interesting finding is that the availability of regularization programs requir-ing proof of residence in the area for a certain length of time has created incentives for households to pay municipal fees, in the hope that this would gain them access to future regularization programs.
In the area under study the average market price of a housing unit of 53 m 2 is Arg $24,000 (US $7,750), or Arg $455 per built square meter. This price is less than half the construction cost for a housing unit of the same size built by the federal housing programs, not taking into account the cost of the land or infrastructure.
The real property price does not reflect the investments made by households to progressively improve their housing, a circumstance that has a significant impact on households’ assets and wealth. The depreciation of the investments in their homes can be estimated at 15% on average. The capital loss varies somewhat, depending on the tenure status of the housing unit. In all cases, even for households holding convincing evidence of their ownership in the form of a deed, their investment in housing depreciates because of the “neighborhood effect,” including the lack of basic infrastructure, paved roads, and public lighting.
Conversely, providing access to piped gas leads to appreciation of the property. The market price of a housing unit that becomes connected to gas service increases twice as much on average as the amount paid by the family for the connection. The effect of a gas connection on home value can be seen from a comparison of the price per square meter in two samples of housing units chosen at random from two adjoining neighborhoods in Cuartel V where households have similar socioeco-nomic, housing, and neighborhood characteristics. We compare the average hous-ing price for comparable dwellings that share similar characteristics, differing only with respect to gas connections: one has already been connected to the gas network, while the other is awaiting a connection. The average market price per square meter
Table 7.14 Average monthly household income by type of tenure documentation in Cuartel V, 2006 (Argentine pesos)Income quintile Title deed Preliminary purchase
agreementRevocable tenure None
1 314.27 314.16 384.50 261.822 717.67 761.89 765.77 740.833 1,090.68 1,081.38 1,122.50 1,071.004 1,598.40 1,655.22 1,632.50 1,637.005 3,007.25 2,851.74 3,764.00 2,443.33All quintiles 1,359.47 1,406.19 1,407.94 1,118.29Source: Authors’ estimations based on data from Observatory of the Informal Urban Economy, November 2006
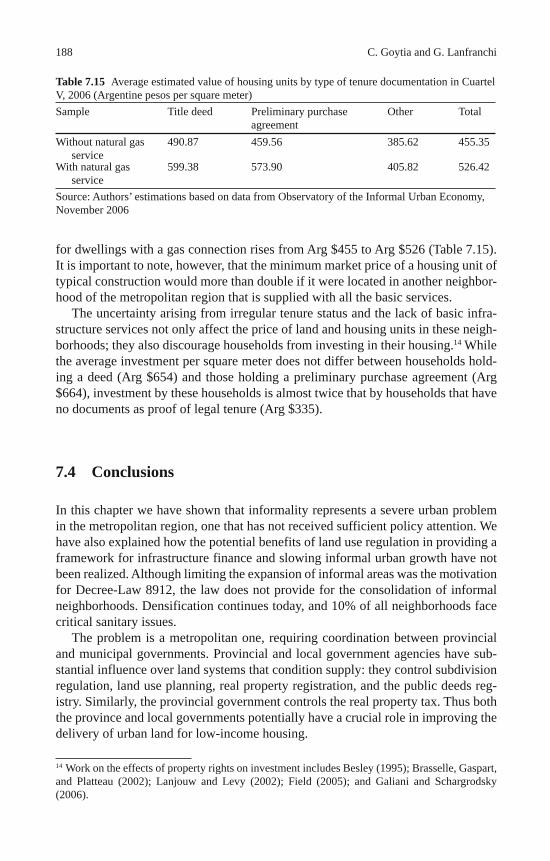
188 C. Goytia and G. Lanfranchi
for dwellings with a gas connection rises from Arg $455 to Arg $526 (Table 7.15). It is important to note, however, that the minimum market price of a housing unit of typical construction would more than double if it were located in another neighbor-hood of the metropolitan region that is supplied with all the basic services.
The uncertainty arising from irregular tenure status and the lack of basic infra-structure services not only affect the price of land and housing units in these neigh-borhoods; they also discourage households from investing in their housing. 14 While the average investment per square meter does not differ between households hold-ing a deed (Arg $654) and those holding a preliminary purchase agreement (Arg $664), investment by these households is almost twice that by households that have no documents as proof of legal tenure (Arg $335).
7.4 Conclusions
In this chapter we have shown that informality represents a severe urban problem in the metropolitan region, one that has not received sufficient policy attention. We have also explained how the potential benefits of land use regulation in providing a framework for infrastructure finance and slowing informal urban growth have not been realized. Although limiting the expansion of informal areas was the motivation for Decree-Law 8912, the law does not provide for the consolidation of informal neighborhoods. Densification continues today, and 10% of all neighborhoods face critical sanitary issues.
The problem is a metropolitan one, requiring coordination between provincial and municipal governments. Provincial and local government agencies have sub-stantial influence over land systems that condition supply: they control subdivision regulation, land use planning, real property registration, and the public deeds reg-istry. Similarly, the provincial government controls the real property tax. Thus both the province and local governments potentially have a crucial role in improving the delivery of urban land for low-income housing.
14 Work on the effects of property rights on investment includes Besley (1995); Brasselle, Gaspart, and Platteau (2002); Lanjouw and Levy (2002); Field (2005); and Galiani and Schargrodsky (2006).
Table 7.15 Average estimated value of housing units by type of tenure documentation in Cuartel V, 2006 (Argentine pesos per square meter)Sample Title deed Preliminary purchase
agreementOther Total
Without natural gas service
490.87 459.56 385.62 455.35
With natural gas service
599.38 573.90 405.82 526.42
Source: Authors’ estimations based on data from Observatory of the Informal Urban Economy, November 2006
1897 Informal Neighborhoods in the Buenos Aires Metropolitan Region
Since the problem of irregular tenure does not stem exclusively from a lack of income, it should be considered from another perspective. The ability to access low-cost land within a financing framework has always been essential for the viability of self-construction, because the land accounts for a significant share of the total cost. Following this reasoning, the focus should be on the lack of a formal land market that would enable low-income households to have access to a serviced plot of land within a financing framework. In the absence of such a market, low-income households have settled in neighborhoods in which they can afford the cost of the land—neighborhoods that have developed on the margins of legality, where they have sought to improve their housing conditions over time.
As we have seen, both the restrictions imposed by land use regulation—those relat-ing to minimum plot size and the provision of infrastructure—and the lack of finance make it impossible for low-income households to gain access to land through the for-mal market. Instead, they rely on the informal market, and the informality perpetu-ates the marginalized condition of their housing and their neighborhoods. Although households invest progressively in building their housing, these investments are not capitalized in housing prices, reducing their incentive for housing investment.
Moreover, the lack of infrastructure services and regular tenure causes a signifi-cant capital loss for the poor by leading to a sharp depreciation of the investment in their dwellings. The provision of infrastructure services to informal neighborhoods not only could increase the value of their homes but also could serve as a mecha-nism for cadastral registration and tenure regularization.
However, extending access to services to poor neighborhoods requires insti-tutional mechanisms different from those used in higher-income neighborhoods. Logistical problems need to be solved, and demand organized, and this may require mechanisms for cooperation between the public and private sectors and civil society.
Despite the complexity of the urban land issue in the metropolitan region, sys-tematic data and analysis focused on topics crucial to land policy are not avail-able. Thus one essential step toward addressing this issue is applied research laying the foundation for intervention. To support this objective, the Observatory of the Informal Urban Economy aims to provide data that can inform urban policies in areas such as Cuartel V. Providing accurate information on legal status could have significant implications for public policy formulation, allowing appropriate legal or cadastre instruments to reach the low-income segment of the land market.
References
Besley, T. (1995). Property rights and investment incentives: Theory and evidence from Ghana. Journal of Political Economy , 103 (5), 903–937.
Brasselle, A.-S., Gaspart, F., & Platteau, J.-P. (2002). Land tenure security and investment incen-tives: Puzzling evidence from Burkina Faso. Journal of Development Economics , 67 (2), 373–418.
de Soto, H. (2000). The mystery of capital: Why capitalism triumphs in the West and fails every-where else . New York: Basic Books.
190 C. Goytia and G. Lanfranchi
Estache, A., Foster, V., & Wodon, Q. (2002). Accounting for poverty in infrastructure reform: Learning from Latin America’s experience . Studies in Development Series. Washington, DC: World Bank Institute.
Fidanza, E. (2005). Diez años de trabajo solidario (1995–2005): Abordajes e investigaciones . Working paper. Fundación Pro Vivienda Social, Buenos Aires.
Field, E. (2005). Property rights and investment in urban slums. Journal of the European Eco-nomic Association , 3 (2–3), 279–290.
Galiani, S., Gertler, P., & Schargrodsky, E. (2005). Water for life: The impact of the privatization of water supply on child mortality. Journal of Political Economy , 113 (1), 83–120.
Galiani, S., González-Rozada, M., & Schargrodsky, E. (2008). Water expansions in shantytowns: Health and savings . Economica . doi: 10.1111/j.1468-0335.2008.00719.x. (Also reprinted in A. Chong (Ed.), Privatization for the public good? The social effects of privatizations in Latin America. Washington, DC: Inter-American Development Bank, forthcoming)
Galiani, S., & Schargrodsky, E. (2006). Property rights for the poor: Effects of land titling . Work-ing paper. Universidad Torcuato Di Tella, Business School, Buenos Aires.
Goytia, C., Pasquini, R., & Sanguinetti, P. (2008, November). Public-private cooperation for the provision of piped gas in poor neighborhoods of Buenos Aires: Institutional framework and impacts. Paper presented at the Latin American and Caribbean Economic Association meeting, Rio de Janeiro.
Goytia, C., & Sanguinetti, P. (2007, April). Desarrollo local en la Región Metropolitana de Buenos Aires: La cooperación publico-privada para la provisión de servicios en barrios informales . Paper presented at the international seminar A reinvenção do futuro das grandes metrópoles e a nova agenda de desenvolvimento econômico e social da América Latina, Rio de Janeiro.
INDEC (National Institute of Statistics and Censuses). (1984). Poverty in Argentina . (INDEC Studies Series, no. 1). Buenos Aires: Author.
Lanjouw, J., & Levy, P. (2002). Untitled: A study of formal and informal property rights in urban Ecuador. Economic Journal , 112 (482), 986–1019.
Turner, J. F. C. (1972). Housing as a verb. In J. F. C. Turner & R. Fichter (Eds.), Freedom to build: Dweller control of the housing process (pp. 148–175). New York: Macmillan.
191
In The Challenge of Slums the United Nations Human Settlements Programme (UN-Habitat, 2003) estimates that 870 million people in developing countries lived in urban slums in 2001. It also estimates that if present trends continue unchecked, the number of slum residents will grow to approximately 1.43 billion by 2020. The influential development targets known as the Millennium Development Goals, agreed to by world leaders at UN-sponsored summits in 2000 and 2002, include a commitment to significantly improve the lives of at least 100 million slum dwellers by 2020 (UN-Habitat, 2003). In Kenya, similar to other developing countries, this commitment now appears in national development plans and is highlighted as a key task in the National Economic Recovery Strategy (Government of Kenya, 2003).
While this commitment to improve the lives of slum dwellers is well intentioned and important, achieving this goal presents significant challenges—especially in Africa, the world’s fastest urbanizing region and its poorest continent. A generation of earlier efforts to upgrade urban slums, starting in the 1970s, has been at best only partially successful. 1 Moreover, until recently most poverty-oriented research has focused on rural areas. Relatively little is known about urban poverty, particularly about slums, because there are few large-scale or representative studies that exam-ine the lives of slum residents, their living conditions, or the nature of the poverty they face. 2 Not surprisingly, in most developing countries there are no reliable esti-mates even of basic indicators—such as the number of people residing in slums and the proportion of them who are poor. The UN-Habitat figures cited above are the
1 See, for example, Gulyani and Bassett (2007) and World Bank (2006). 2 Until recently both poverty-oriented research and poverty-targeted development programs have tended to focus on poor people in rural areas. This is just starting to change with recent studies showing that poverty is not entirely a rural phenomenon, even in a seemingly rural region such as Sub-Saharan Africa.
S.V. Lall et al. (eds.), Urban Land Markets, DOI 10.1007/978-1-4020-8862-9_8 , © World Bank 2009
Chapter 8 Informal Rental Markets: The Low-Quality, High-Price Puzzle in Nairobi’s Slums Sumila Gulyani and Debabrata Talukdar
S. Gulyani ( ) Africa Sustainable Development Department The World Bank Washington DC 20433 , USA e-mail: [email protected]
192 S. Gulyani and D. Talukdar
subject of much contention and debate, and the data problem is particularly acute in Sub-Saharan Africa.
The ambiguity about scale, combined with the lack of knowledge about life inside informal settlements, means that our understanding of the nature of slums and their dynamics is extremely limited. This partial understanding may well have been a key reason for the limited success of previous programs, and it is highly likely to confound the design, implementation, and success of the coming genera-tion of slum improvement efforts as well.
As a step toward addressing this gap in our knowledge base, we conducted a large-scale and representative study of 1,755 households residing in Nairobi’s slums with a focus on understanding who lives there, what they do, and how they live. In this chapter we use these data to examine one aspect of life in the slums—the qual-ity of housing and living conditions and its relationship to the price residents pay for their accommodation. Ours is a population-weighted stratified random sample, and we use the data to analyze the following questions: How inadequately housed and underserved are slum residents in Nairobi? How much do they pay for their hous-ing? And what are the factors correlated with rents in the city’s slums?
The literature on housing in developing countries valorizes slums as an afford-able housing option for the low income. It argues that although slums are subpar from a technocratic planning perspective and unpleasant by middle-class standards, they play a crucial role by proving shelter at low cost to the urban poor. Further, if given even implicit recognition by government—for example, through a mora-torium on evictions and demolitions—these settlements consolidate and housing improves over time.
Nairobi’s slums constitute a serious challenge to conventional wisdom. In Nairobi the slums indeed cater to low-income residents and offer low-quality liv-ing conditions. The surprise is that the residents of slums, most of whom are very poor, are together paying a large sum of money in the form of rents each year—in 2004 they paid an estimated US $31 million, or 2.35 billion Kenya shillings (K Sh). Despite such large payments and a significant history of implicit recognition by government, however, housing in the slums has not improved and consolidated. In other words, Nairobi’s slums offer low-quality but high-cost housing and, even worse, they seem to be stuck in this suboptimal equilibrium.
We take a closer look at the Nairobi puzzle and, in attempting to describe and explain it, contribute to the literature in two ways. First, we make an empirical con-tribution by using the Nairobi case to provide a rare insight into the scale and nature of the informal rental market. We document prevailing rents and analyze their rela-tionship to quality and other factors that tend to drive rents in more formal real estate markets. On the demand side we examine whether these rents are affordable for the residents. On the supply side we contribute to the politically charged local debate on whether rent levels are resulting in extraordinary profits for landlords.
Second, to resolve the challenge that the Nairobi case poses both for the literature and for practice, we develop a new framework for analyzing and improving the qual-ity of living conditions. Specifically, we argue that the quality of living conditions must be understood along four dimensions—tenure, infrastructure, the unit itself,
1938 Informal Rental Markets: The Low-Quality, High-Price Puzzle in Nairobi’s Slums
and the neighborhood—and that these factors interact with one another to determine the outcome. Using this framework—the Living Conditions Diamond—we show that Nairobi’s slums are stuck in a low-quality, high-cost trap and suggest possible ways to intervene to improve the situation. This framework can help us understand, for example, why a slum upgrading program that focuses on improving infrastruc-ture (rather than, say, changing the tenure status) may be the right approach in some contexts but is likely to fail in Nairobi’s slums and other such cases. At a broader level this framework offers one way of improving our understanding of living condi-tions in slums, comparatively analyzing quality in such settlements in different con-texts, distinguishing between “slums of hope” and “slums of despair,” and designing slum improvement strategies that are better tailored to a given context.
8.1 Methodology, the Data, and the Typical Slum Household
This study is based on data gathered in February and March 2004 through an in-depth survey of 1,755 households residing in Nairobi’s slum settlements. A population-weighted stratified random sample of households was created in the following way. For census purposes, Kenya’s Central Bureau of Statistics has divided Nairobi into about 4,700 enumeration areas (EAs). Of these, 1,263 are categorized as “EA5s,” or informal settlements, characterized by poor-quality, substandard housing and poor infrastructure; for our purposes, all 1,263 EA5s are slums. For this study 88 slum enumeration areas were randomly selected from the superset of 1,263. The Central Bureau of Statistics then conducted a complete, field-based relisting of households in each of these 88 enumeration areas to create an updated master list of current residents. About 20 households were selected randomly from the updated resident list for each area, and all households were assigned a weight adjusted to reflect their probability of selection. 3 In the results presented in this chapter all household-level data are weighted but individual-level data are not.
8.1.1 Proportion of Slum Residents: 30% or 55%?
The 1999 national census found that Nairobi’s population was 2.139 million and that slums accounted for 0.64 million people, or about 30% of the city’s population. By contrast, estimates in the grey literature (consulting studies, reports by NGOs and aid agencies, and the like) are significantly higher. For example, a study conducted in 1993 estimates that 55% of Nairobi’s population lives in slums (Matrix Consultants/
3 A similar household survey was conducted in Dakar’s slums to allow a comparative analysis with Nairobi and to establish a base for comparative studies with other cities in the future. The Dakar survey covered 1,960 households selected randomly from a stratified random sample of 168 enumeration areas, from a universe of 2,074 enumeration areas in the city. The results from Dakar are not presented in this chapter.
194 S. Gulyani and D. Talukdar
USAID, as cited in Alder, 1995). There are at least two possible explanations for the divergence in estimates. First, it is highly likely that the Central Bureau of Statistics and the other researchers use different boundaries for Nairobi. Several of the studies prepare estimates for the entire Nairobi metropolitan area and include slum settlements that are on the periphery of the city, outside its administrative boundaries. Estimates using the categorization of the Central Bureau of Statistics, however, exclude people residing in slums outside the city’s administrative boundaries. Second, it is possible that the Central Bureau of Statistics has underestimated the number of slum enumeration areas—that is, it may have miscategorized some of the enumeration areas accidentally or by using a definition that is too narrow (we return to this point in Sect. 8.2).
Clearly, additional research is required to resolve this issue. Meanwhile, and for the purposes of this study, the categorization used by the Central Bureau of Statis-tics offers a more robust starting point than the approaches and estimates used in other studies (though possibly a conservative one). We see this number—0.64 mil-lion slum residents in 1999—as establishing a “floor,” or minimum number of slum residents in the city; it is entirely possible that the actual number is higher. By the time of the survey in 2004 the population of slum residents is likely to have grown. Over the decade 1989–1999 Nairobi’s actual population growth rate was 4.85% a year; if we assume that the population continued to grow at this rate in both the city and the slums between 1999 and 2004, the slum population would have reached 0.81 million by 2004. The sampling and the results of the study therefore generally pertain to the universe of 0.64 million slum residents and, where specifically indi-cated, to the estimated population of 0.81 million.
8.1.2 Disaggregating Poor and Nonpoor Households in Slums
We use a discrete poverty measure—an expenditure-based poverty line — to dis-aggregate the sample into poor and nonpoor households. Here the poverty line is defined as an expenditure of K Sh 3,174 (US $42) per adult equivalent per month, excluding rent (including rent would make some renters seem artificially richer than homeowners). 4 This measure is based on the 1997 urban poverty threshold as defined by the government and adjusted for inflation during 1997–2004. 5 Based on this poverty line, 73% of the slum households are poor and 27% are nonpoor. In other words, as expected, the incidence of poverty in the slums is very high.
4 Adult equivalents are calculated as follows: children ages 0–4 are allocated a weight of 0.24 adult equivalents, children ages 5–14 are 0.65 adult equivalents, and individuals ages 15 above are 1.0 (or “adult”). A household consisting of two adults and a child between the ages of 5 and 14 (2.65 adult equivalents), for example, was asked what its expenditure was in the previous month and whether it was above or below K Sh 8,411 (that is, K Sh 3,174 * 2.65); an expenditure below this household-specific poverty line of K Sh 8,411 would result in this household being categorized as poor. 5 For information on the government’s poverty line, see World Bank (2003). We used the consumer price index to adjust the 1997 poverty line for inflation.
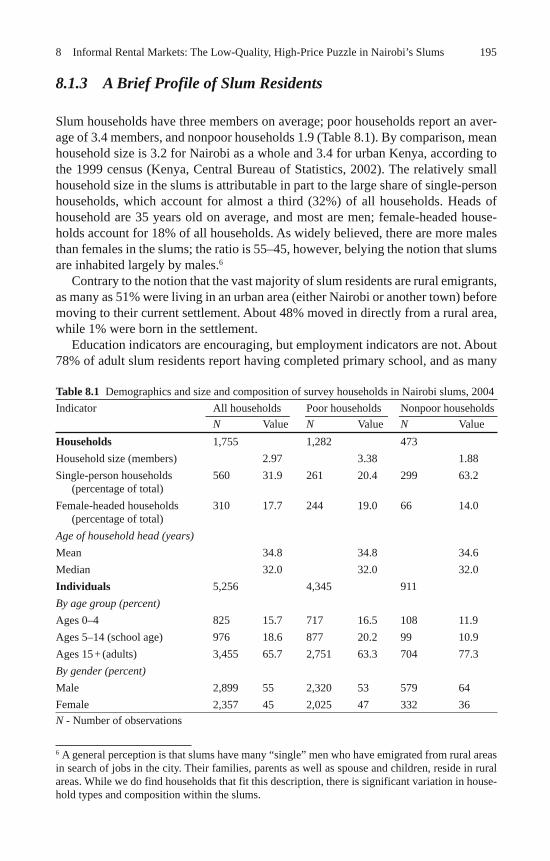
1958 Informal Rental Markets: The Low-Quality, High-Price Puzzle in Nairobi’s Slums
8.1.3 A Brief Profile of Slum Residents
Slum households have three members on average; poor households report an aver-age of 3.4 members, and nonpoor households 1.9 (Table 8.1). By comparison, mean household size is 3.2 for Nairobi as a whole and 3.4 for urban Kenya, according to the 1999 census (Kenya, Central Bureau of Statistics, 2002). The relatively small household size in the slums is attributable in part to the large share of single-person households, which account for almost a third (32%) of all households. Heads of household are 35 years old on average, and most are men; female-headed house-holds account for 18% of all households. As widely believed, there are more males than females in the slums; the ratio is 55–45, however, belying the notion that slums are inhabited largely by males. 6
Contrary to the notion that the vast majority of slum residents are rural emigrants, as many as 51% were living in an urban area (either Nairobi or another town) before moving to their current settlement. About 48% moved in directly from a rural area, while 1% were born in the settlement.
Education indicators are encouraging, but employment indicators are not. About 78% of adult slum residents report having completed primary school, and as many
6 A general perception is that slums have many “single” men who have emigrated from rural areas in search of jobs in the city. Their families, parents as well as spouse and children, reside in rural areas. While we do find households that fit this description, there is significant variation in house-hold types and composition within the slums.
Table 8.1 Demographics and size and composition of survey households in Nairobi slums, 2004 Indicator All households Poor households Nonpoor households
N Value N Value N Value Households 1,755 1,282 473 Household size (members) 2.97 3.38 1.88 Single-person households
(percentage of total) 560 31.9 261 20.4 299 63.2
Female-headed households (percentage of total)
310 17.7 244 19.0 66 14.0
Age of household head (years) Mean 34.8 34.8 34.6 Median 32.0 32.0 32.0 Individuals 5,256 4,345 911 By age group (percent) Ages 0–4 825 15.7 717 16.5 108 11.9 Ages 5–14 (school age) 976 18.6 877 20.2 99 10.9 Ages 15 + (adults) 3,455 65.7 2,751 63.3 704 77.3 By gender (percent) Male 2,899 55 2,320 53 579 64 Female 2,357 45 2,025 47 332 36 N - Number of observations
196 S. Gulyani and D. Talukdar
as 92% of school-age children are enrolled in school. By contrast, the economic base is weak. Although the majority (68%) of adult slum residents are economically active, the unemployment rate is high, at 26%. To cope, 30% of households operate an enterprise, and these appear to help. Most are small businesses that employ an average of 1.6 people and have been in operation for about 4 years; of these, 41% are home based, operated from the home or immediately outside it.
8.2 Assessing Quality: The Living Conditions Diamond as a Framework for Analysis
Although slums universally evoke images of squalor, not all slums are equally bad. They vary—some have better access to water, others offer better-quality housing units, and some are safer. Yet most existing studies of slums tend to rely on a small subset of possible indicators to measure quality—notably, crowding in units, pro-portion with access to water or another basic service, or construction quality of the unit. For this study we developed a framework for assessing and understanding quality in a more comprehensive manner.
Analytically, we propose that slums—and the living conditions in them—must be understood as a combination of four types of factors: tenure, infrastructure, unit quality, and neighborhood conditions. These four factors not only influence one another but also collectively determine the overall quality of living conditions in a settlement. We represent this analytical framework graphically as a diamond with four vertices and call it, for ease of reference, the Living Conditions Diamond (Fig. 8.1).
8.2.1 Defining and Mapping Slums Using the Framework
Slums score poorly on one or more of the four dimensions of the Living Conditions Diamond. In fact, in most parts of the developing world, slums have some combina-tion of the following four characteristics in early stages of their development:
• Informal or illegal land tenure • Housing units built with poor-quality or impermanent construction materials • Settlement layouts and units that fail to meet legally specified space and plan-
ning standards 7 • Physical infrastructure and services—such as water supply, electricity, drainage,
sanitation, and street lighting—that are all highly inadequate
7 Planning “regimes” include, for example, the set of building codes and regulations specifying plot and unit sizes, approvals required to connect to public infrastructure networks, floor area ratios, building setbacks, public open spaces, and space for facilities such as schools and com-munity centers.
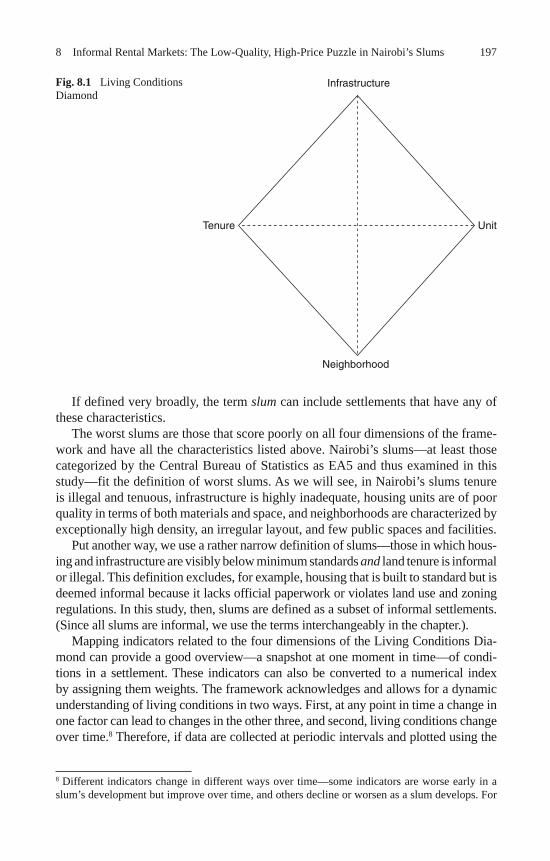
1978 Informal Rental Markets: The Low-Quality, High-Price Puzzle in Nairobi’s Slums
If defined very broadly, the term slum can include settlements that have any of these characteristics.
The worst slums are those that score poorly on all four dimensions of the frame-work and have all the characteristics listed above. Nairobi’s slums—at least those categorized by the Central Bureau of Statistics as EA5 and thus examined in this study—fit the definition of worst slums. As we will see, in Nairobi’s slums tenure is illegal and tenuous, infrastructure is highly inadequate, housing units are of poor quality in terms of both materials and space, and neighborhoods are characterized by exceptionally high density, an irregular layout, and few public spaces and facilities.
Put another way, we use a rather narrow definition of slums—those in which hous-ing and infrastructure are visibly below minimum standards and land tenure is informal or illegal. This definition excludes, for example, housing that is built to standard but is deemed informal because it lacks official paperwork or violates land use and zoning regulations. In this study, then, slums are defined as a subset of informal settlements. (Since all slums are informal, we use the terms interchangeably in the chapter.).
Mapping indicators related to the four dimensions of the Living Conditions Dia-mond can provide a good overview—a snapshot at one moment in time—of condi-tions in a settlement. These indicators can also be converted to a numerical index by assigning them weights. The framework acknowledges and allows for a dynamic understanding of living conditions in two ways. First, at any point in time a change in one factor can lead to changes in the other three, and second, living conditions change over time. 8 Therefore, if data are collected at periodic intervals and plotted using the
8 Different indicators change in different ways over time—some indicators are worse early in a slum’s development but improve over time, and others decline or worsen as a slum develops. For
Fig. 8.1 Living Conditions Diamond
Infrastructure
Neighborhood
Tenure Unit
198 S. Gulyani and D. Talukdar
Living Conditions Diamond or index, the relationship between the different factors can be better understood and changes can be analyzed over time. In the following sec-tions we examine each of the four dimensions of the diamond in turn.
8.2.2 Tenure: Tenuous and Disproportionately Rental
In Nairobi’s slums an extraordinary 92% of the households are rent-paying tenants (rather than home-owning squatters). Of the 8% who are owner occupants, 6% claim that they own both the house and the land, while 2% say that they own the structure but not the land. Within this small group of structure owners (8% of the total), 60% rent out at least one room and are resident landlords. The vast majority of structure owners (95%) are thus absentee landlords. Many local experts emphasize that the technically correct term is structure owner rather than landlord , because almost none of those who own a structure also own the land. Locally, structure owners who rent out their units are often called slumlords . (The terms landlord and structure owner are used interchangeably in this chapter.)
The owner-occupancy rate in the slums is 10 percentage points lower than in the city as a whole and about 63 percentage points lower than the national aver-age. Among Nairobi’s residents, 18% own the unit in which they live and 82% are tenants, according to the 1999 census. At the national level the situation is the reverse—71% own the house in which they reside and only 29% of households are renters. National-level indicators of owner occupancy are driven largely by the high rates of owner occupancy in rural areas; the quality of these structures, however, is poor (Kenya, Central Bureau of Statistics, 2002).
Tenancy contracts in slums are based almost entirely on verbal agreements. Only 3.6% of the renters say that they have a formal written tenancy agreement, while 96% have a verbal agreement with their landlords. About 0.5% claim to have no agreement; it is unclear whether they are squatters. On length of tenure, we find that slum residents have lived in their current home for an average of 5 years and in their current settlement for about 9 years. Yet half the slum households feel that they have secure tenure, and only about 9% report that they have been evicted at least once. This seems to reflect an understanding among slum residents that their tenure or stay or tenancy in a unit is secure as long as they can pay their rent; it probably cannot be construed to mean that their unit or settlement is safe from demolition or eviction by government.
Thus the vast majority of slum residents are tenants, and in legal terms their tenancy is fragile—their rental contracts are based on verbal agreements, and most buildings and plots of land lack formal documents. As a group, slum residents are relatively mobile. Nevertheless, about half the residents feel that they have secure tenure. The relative mobility of tenants and the fact that many perceive their tenure
example, unit quality is often poor at the start and improves with time, while density is often low early in a settlement’s development and worsens over time.
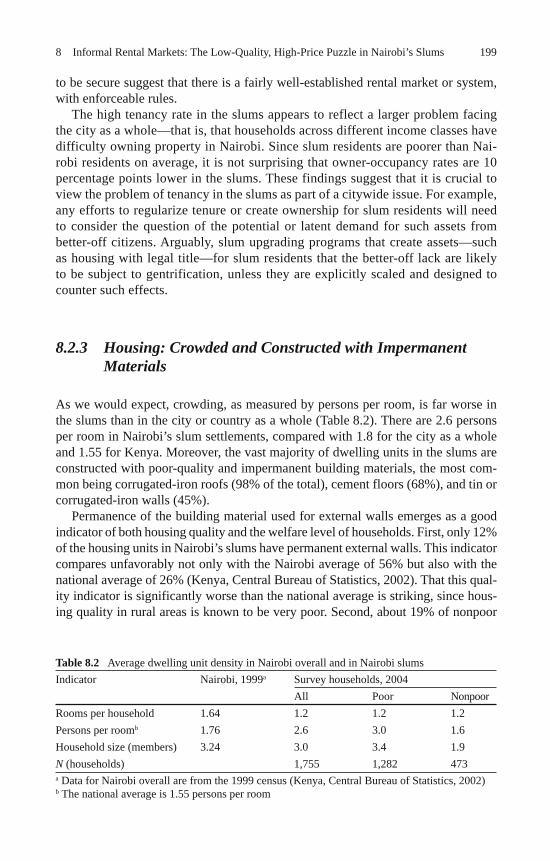
1998 Informal Rental Markets: The Low-Quality, High-Price Puzzle in Nairobi’s Slums
to be secure suggest that there is a fairly well-established rental market or system, with enforceable rules.
The high tenancy rate in the slums appears to reflect a larger problem facing the city as a whole—that is, that households across different income classes have difficulty owning property in Nairobi. Since slum residents are poorer than Nai-robi residents on average, it is not surprising that owner-occupancy rates are 10 percentage points lower in the slums. These findings suggest that it is crucial to view the problem of tenancy in the slums as part of a citywide issue. For example, any efforts to regularize tenure or create ownership for slum residents will need to consider the question of the potential or latent demand for such assets from better-off citizens. Arguably, slum upgrading programs that create assets—such as housing with legal title—for slum residents that the better-off lack are likely to be subject to gentrification, unless they are explicitly scaled and designed to counter such effects.
8.2.3 Housing: Crowded and Constructed with Impermanent Materials
As we would expect, crowding, as measured by persons per room, is far worse in the slums than in the city or country as a whole (Table 8.2). There are 2.6 persons per room in Nairobi’s slum settlements, compared with 1.8 for the city as a whole and 1.55 for Kenya. Moreover, the vast majority of dwelling units in the slums are constructed with poor-quality and impermanent building materials, the most com-mon being corrugated-iron roofs (98% of the total), cement floors (68%), and tin or corrugated-iron walls (45%).
Permanence of the building material used for external walls emerges as a good indicator of both housing quality and the welfare level of households. First, only 12% of the housing units in Nairobi’s slums have permanent external walls. This indicator compares unfavorably not only with the Nairobi average of 56% but also with the national average of 26% (Kenya, Central Bureau of Statistics, 2002). That this qual-ity indicator is significantly worse than the national average is striking, since hous-ing quality in rural areas is known to be very poor. Second, about 19% of nonpoor
Table 8.2 Average dwelling unit density in Nairobi overall and in Nairobi slums Indicator Nairobi, 1999 a Survey households, 2004
All Poor Nonpoor Rooms per household 1.64 1.2 1.2 1.2 Persons per room b 1.76 2.6 3.0 1.6 Household size (members) 3.24 3.0 3.4 1.9 N (households) 1,755 1,282 473 a Data for Nairobi overall are from the 1999 census (Kenya, Central Bureau of Statistics, 2002) b The national average is 1.55 persons per room
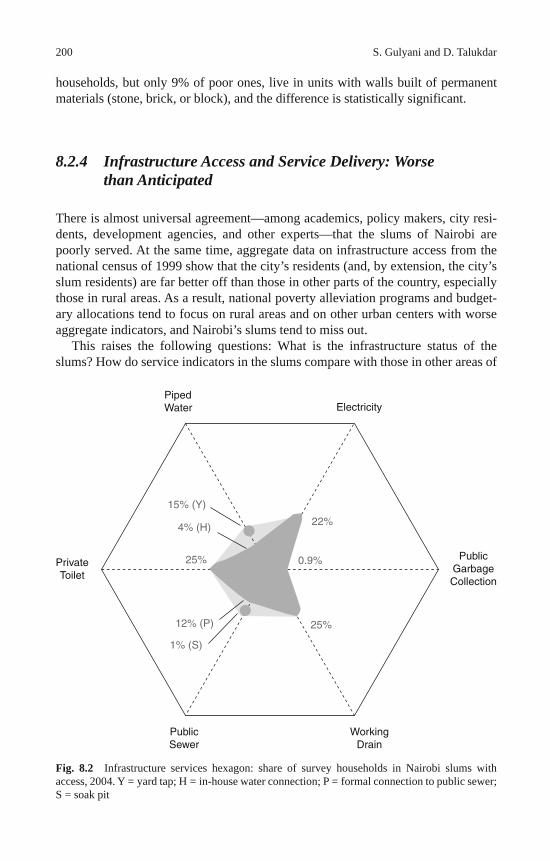
200 S. Gulyani and D. Talukdar
households, but only 9% of poor ones, live in units with walls built of permanent materials (stone, brick, or block), and the difference is statistically significant.
8.2.4 Infrastructure Access and Service Delivery: Worse than Anticipated
There is almost universal agreement—among academics, policy makers, city resi-dents, development agencies, and other experts—that the slums of Nairobi are poorly served. At the same time, aggregate data on infrastructure access from the national census of 1999 show that the city’s residents (and, by extension, the city’s slum residents) are far better off than those in other parts of the country, especially those in rural areas. As a result, national poverty alleviation programs and budget-ary allocations tend to focus on rural areas and on other urban centers with worse aggregate indicators, and Nairobi’s slums tend to miss out.
This raises the following questions: What is the infrastructure status of the slums? How do service indicators in the slums compare with those in other areas of
Fig. 8.2 Infrastructure services hexagon: share of survey households in Nairobi slums with access, 2004. Y = yard tap; H = in-house water connection; P = formal connection to public sewer; S = soak pit
15% (Y)
PipedWater Electricity
PublicGarbageCollection
WorkingDrain
PublicSewer
PrivateToilet
4% (H)
25%
12% (P)
1% (S)
25%
0.9%
22%
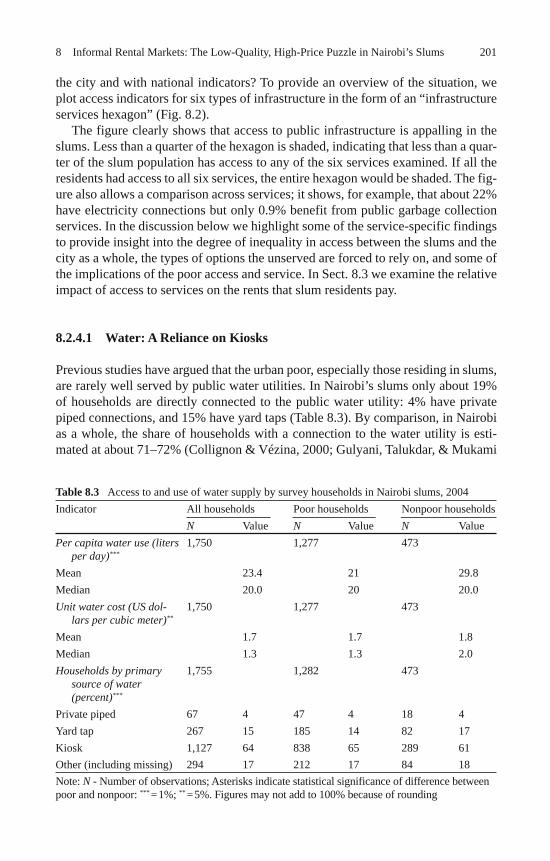
2018 Informal Rental Markets: The Low-Quality, High-Price Puzzle in Nairobi’s Slums
the city and with national indicators? To provide an overview of the situation, we plot access indicators for six types of infrastructure in the form of an “infrastructure services hexagon” (Fig. 8.2).
The figure clearly shows that access to public infrastructure is appalling in the slums. Less than a quarter of the hexagon is shaded, indicating that less than a quar-ter of the slum population has access to any of the six services examined. If all the residents had access to all six services, the entire hexagon would be shaded. The fig-ure also allows a comparison across services; it shows, for example, that about 22% have electricity connections but only 0.9% benefit from public garbage collection services. In the discussion below we highlight some of the service-specific findings to provide insight into the degree of inequality in access between the slums and the city as a whole, the types of options the unserved are forced to rely on, and some of the implications of the poor access and service. In Sect. 8.3 we examine the relative impact of access to services on the rents that slum residents pay.
8.2.4.1 Water: A Reliance on Kiosks
Previous studies have argued that the urban poor, especially those residing in slums, are rarely well served by public water utilities. In Nairobi’s slums only about 19% of households are directly connected to the public water utility: 4% have private piped connections, and 15% have yard taps (Table 8.3). By comparison, in Nairobi as a whole, the share of households with a connection to the water utility is esti-mated at about 71–72% (Collignon & Vézina, 2000; Gulyani, Talukdar, & Mukami
Table 8.3 Access to and use of water supply by survey households in Nairobi slums, 2004 Indicator All households Poor households Nonpoor households
N Value N Value N Value Per capita water use (liters
per day) *** 1,750 1,277 473
Mean 23.4 21 29.8 Median 20.0 20 20.0 Unit water cost (US dol-
lars per cubic meter) ** 1,750 1,277 473
Mean 1.7 1.7 1.8 Median 1.3 1.3 2.0 Households by primary
source of water (percent) ***
1,755 1,282 473
Private piped 67 4 47 4 18 4 Yard tap 267 15 185 14 82 17 Kiosk 1,127 64 838 65 289 61 Other (including missing) 294 17 212 17 84 18 Note: N - Number of observations; Asterisks indicate statistical significance of difference between poor and nonpoor: *** = 1%; ** = 5%. Figures may not add to 100% because of rounding
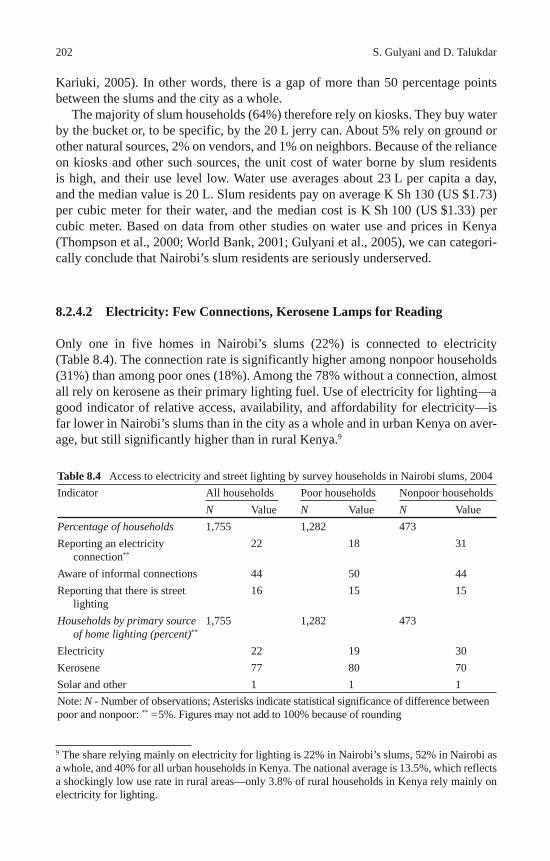
202 S. Gulyani and D. Talukdar
Kariuki, 2005). In other words, there is a gap of more than 50 percentage points between the slums and the city as a whole.
The majority of slum households (64%) therefore rely on kiosks. They buy water by the bucket or, to be specific, by the 20 L jerry can. About 5% rely on ground or other natural sources, 2% on vendors, and 1% on neighbors. Because of the reliance on kiosks and other such sources, the unit cost of water borne by slum residents is high, and their use level low. Water use averages about 23 L per capita a day, and the median value is 20 L. Slum residents pay on average K Sh 130 (US $1.73) per cubic meter for their water, and the median cost is K Sh 100 (US $1.33) per cubic meter. Based on data from other studies on water use and prices in Kenya (Thompson et al., 2000; World Bank, 2001; Gulyani et al., 2005), we can categori-cally conclude that Nairobi’s slum residents are seriously underserved.
8.2.4.2 Electricity: Few Connections, Kerosene Lamps for Reading
Only one in five homes in Nairobi’s slums (22%) is connected to electricity (Table 8.4). The connection rate is significantly higher among nonpoor households (31%) than among poor ones (18%). Among the 78% without a connection, almost all rely on kerosene as their primary lighting fuel. Use of electricity for lighting—a good indicator of relative access, availability, and affordability for electricity—is far lower in Nairobi’s slums than in the city as a whole and in urban Kenya on aver-age, but still significantly higher than in rural Kenya. 9
9 The share relying mainly on electricity for lighting is 22% in Nairobi’s slums, 52% in Nairobi as a whole, and 40% for all urban households in Kenya. The national average is 13.5%, which reflects a shockingly low use rate in rural areas—only 3.8% of rural households in Kenya rely mainly on electricity for lighting.
Table 8.4 Access to electricity and street lighting by survey households in Nairobi slums, 2004 Indicator All households Poor households Nonpoor households
N Value N Value N Value Percentage of households 1,755 1,282 473 Reporting an electricity
connection** 22 18 31
Aware of informal connections 44 50 44 Reporting that there is street
lighting 16 15 15
Households by primary source of home lighting (percent)**
1,755 1,282 473
Electricity 22 19 30 Kerosene 77 80 70 Solar and other 1 1 1 Note: N - Number of observations; Asterisks indicate statistical significance of difference between poor and nonpoor: ** = 5%. Figures may not add to 100% because of rounding
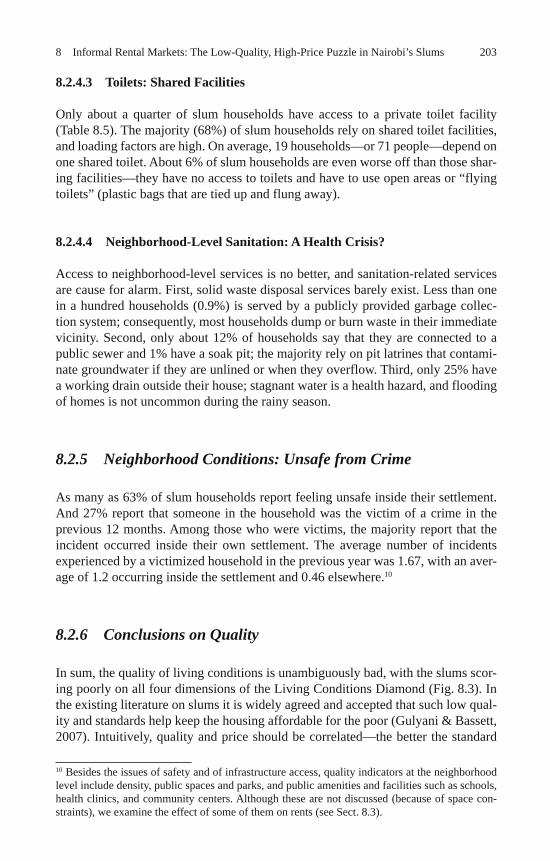
2038 Informal Rental Markets: The Low-Quality, High-Price Puzzle in Nairobi’s Slums
8.2.4.3 Toilets: Shared Facilities
Only about a quarter of slum households have access to a private toilet facility (Table 8.5). The majority (68%) of slum households rely on shared toilet facilities, and loading factors are high. On average, 19 households—or 71 people—depend on one shared toilet. About 6% of slum households are even worse off than those shar-ing facilities—they have no access to toilets and have to use open areas or “flying toilets” (plastic bags that are tied up and flung away).
8.2.4.4 Neighborhood-Level Sanitation: A Health Crisis?
Access to neighborhood-level services is no better, and sanitation-related services are cause for alarm. First, solid waste disposal services barely exist. Less than one in a hundred households (0.9%) is served by a publicly provided garbage collec-tion system; consequently, most households dump or burn waste in their immediate vicinity. Second, only about 12% of households say that they are connected to a public sewer and 1% have a soak pit; the majority rely on pit latrines that contami-nate groundwater if they are unlined or when they overflow. Third, only 25% have a working drain outside their house; stagnant water is a health hazard, and flooding of homes is not uncommon during the rainy season.
8.2.5 Neighborhood Conditions: Unsafe from Crime
As many as 63% of slum households report feeling unsafe inside their settlement. And 27% report that someone in the household was the victim of a crime in the previous 12 months. Among those who were victims, the majority report that the incident occurred inside their own settlement. The average number of incidents experienced by a victimized household in the previous year was 1.67, with an aver-age of 1.2 occurring inside the settlement and 0.46 elsewhere. 10
8.2.6 Conclusions on Quality
In sum, the quality of living conditions is unambiguously bad, with the slums scor-ing poorly on all four dimensions of the Living Conditions Diamond (Fig. 8.3). In the existing literature on slums it is widely agreed and accepted that such low qual-ity and standards help keep the housing affordable for the poor (Gulyani & Bassett, 2007). Intuitively, quality and price should be correlated—the better the standard
10 Besides the issues of safety and of infrastructure access, quality indicators at the neighborhood level include density, public spaces and parks, and public amenities and facilities such as schools, health clinics, and community centers. Although these are not discussed (because of space con-straints), we examine the effect of some of them on rents (see Sect. 8.3).
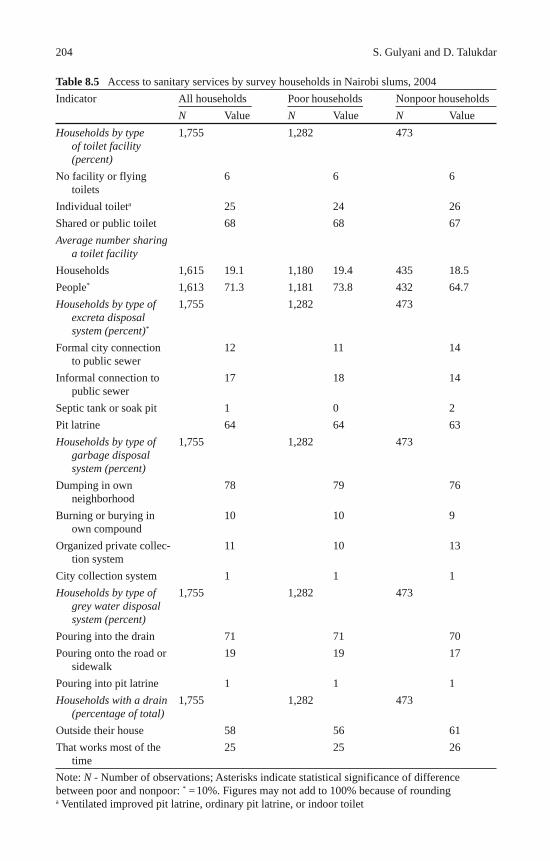
204 S. Gulyani and D. Talukdar
Table 8.5 Access to sanitary services by survey households in Nairobi slums, 2004 Indicator All households Poor households Nonpoor households
N Value N Value N Value Households by type
of toilet facility (percent)
1,755 1,282 473
No facility or flying toilets
6 6 6
Individual toilet a 25 24 26 Shared or public toilet 68 68 67 Average number sharing
a toilet facility
Households 1,615 19.1 1,180 19.4 435 18.5 People* 1,613 71.3 1,181 73.8 432 64.7 Households by type of
excreta disposal system (percent)*
1,755 1,282 473
Formal city connection to public sewer
12 11 14
Informal connection to public sewer
17 18 14
Septic tank or soak pit 1 0 2 Pit latrine 64 64 63 Households by type of
garbage disposal system (percent)
1,755 1,282 473
Dumping in own neighborhood
78 79 76
Burning or burying in own compound
10 10 9
Organized private collec-tion system
11 10 13
City collection system 1 1 1 Households by type of
grey water disposal system (percent)
1,755 1,282 473
Pouring into the drain 71 71 70 Pouring onto the road or
sidewalk 19 19 17
Pouring into pit latrine 1 1 1 Households with a drain
(percentage of total) 1,755 1,282 473
Outside their house 58 56 61 That works most of the
time 25 25 26
Note: N - Number of observations; Asterisks indicate statistical significance of difference between poor and nonpoor: * = 10%. Figures may not add to 100% because of rounding a Ventilated improved pit latrine, ordinary pit latrine, or indoor toilet
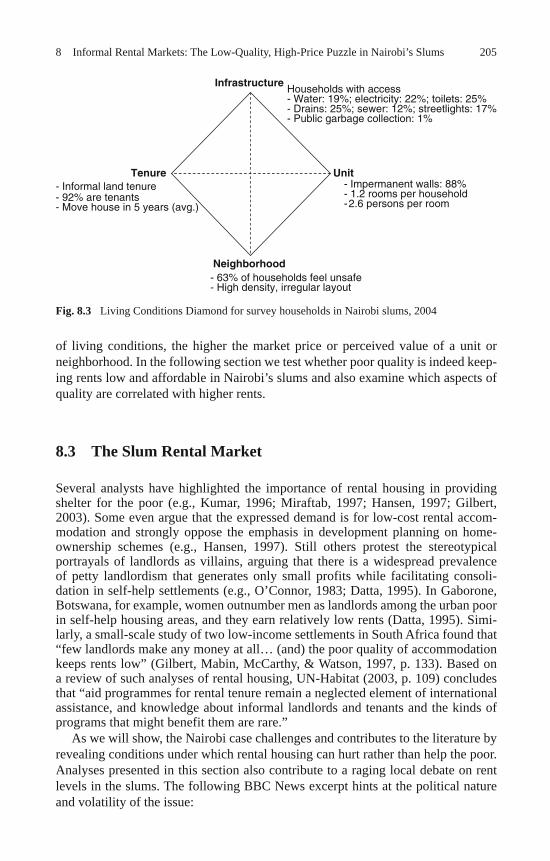
2058 Informal Rental Markets: The Low-Quality, High-Price Puzzle in Nairobi’s Slums
of living conditions, the higher the market price or perceived value of a unit or neighborhood. In the following section we test whether poor quality is indeed keep-ing rents low and affordable in Nairobi’s slums and also examine which aspects of quality are correlated with higher rents.
8.3 The Slum Rental Market
Several analysts have highlighted the importance of rental housing in providing shelter for the poor (e.g., Kumar, 1996; Miraftab, 1997; Hansen, 1997; Gilbert, 2003). Some even argue that the expressed demand is for low-cost rental accom-modation and strongly oppose the emphasis in development planning on home-ownership schemes (e.g., Hansen, 1997). Still others protest the stereotypical portrayals of landlords as villains, arguing that there is a widespread prevalence of petty landlordism that generates only small profits while facilitating consoli-dation in self-help settlements (e.g., O’Connor, 1983; Datta, 1995). In Gaborone, Botswana, for example, women outnumber men as landlords among the urban poor in self-help housing areas, and they earn relatively low rents (Datta, 1995). Simi-larly, a small-scale study of two low-income settlements in South Africa found that “few landlords make any money at all… (and) the poor quality of accommodation keeps rents low” (Gilbert, Mabin, McCarthy, & Watson, 1997, p. 133). Based on a review of such analyses of rental housing, UN-Habitat (2003, p. 109) concludes that “aid programmes for rental tenure remain a neglected element of international assistance, and knowledge about informal landlords and tenants and the kinds of programs that might benefit them are rare.”
As we will show, the Nairobi case challenges and contributes to the literature by revealing conditions under which rental housing can hurt rather than help the poor. Analyses presented in this section also contribute to a raging local debate on rent levels in the slums. The following BBC News excerpt hints at the political nature and volatility of the issue:
Fig. 8.3 Living Conditions Diamond for survey households in Nairobi slums, 2004
- Impermanent walls: 88%- 1.2 rooms per household2.6 persons per room-
InfrastructureHouseholds with access- Water: 19%; electricity: 22%; toilets: 25%- Drains: 25%; sewer: 12%; streetlights: 17%- Public garbage collection: 1%
Unit
Neighborhood
Tenure
- 63% of households feel unsafe- High density, irregular layout
- 92% are tenants- Move house in 5 years (avg.)
- Informal land tenure
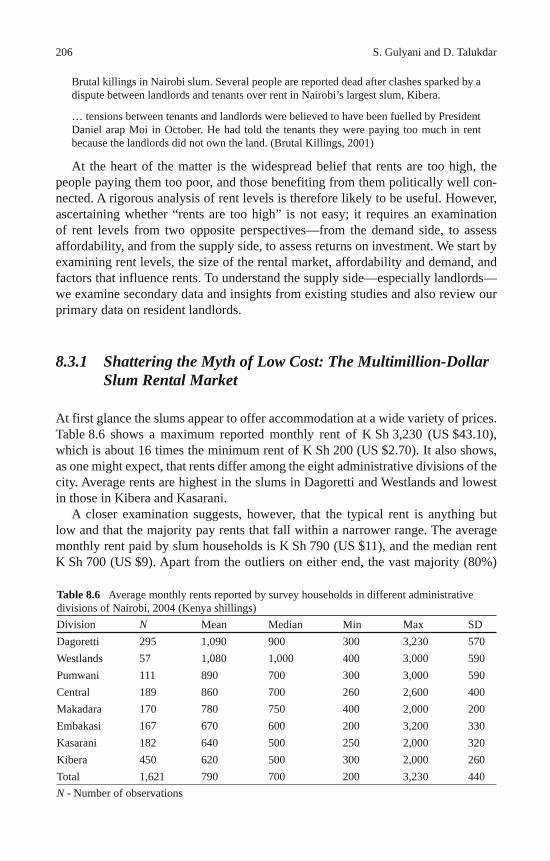
206 S. Gulyani and D. Talukdar
Brutal killings in Nairobi slum. Several people are reported dead after clashes sparked by a dispute between landlords and tenants over rent in Nairobi’s largest slum, Kibera.
… tensions between tenants and landlords were believed to have been fuelled by President Daniel arap Moi in October. He had told the tenants they were paying too much in rent because the landlords did not own the land. (Brutal Killings, 2001)
At the heart of the matter is the widespread belief that rents are too high, the people paying them too poor, and those benefiting from them politically well con-nected. A rigorous analysis of rent levels is therefore likely to be useful. However, ascertaining whether “rents are too high” is not easy; it requires an examination of rent levels from two opposite perspectives—from the demand side, to assess affordability, and from the supply side, to assess returns on investment. We start by examining rent levels, the size of the rental market, affordability and demand, and factors that influence rents. To understand the supply side—especially landlords—we examine secondary data and insights from existing studies and also review our primary data on resident landlords.
8.3.1 Shattering the Myth of Low Cost: The Multimillion-Dollar Slum Rental Market
At first glance the slums appear to offer accommodation at a wide variety of prices. Table 8.6 shows a maximum reported monthly rent of K Sh 3,230 (US $43.10), which is about 16 times the minimum rent of K Sh 200 (US $2.70). It also shows, as one might expect, that rents differ among the eight administrative divisions of the city. Average rents are highest in the slums in Dagoretti and Westlands and lowest in those in Kibera and Kasarani.
A closer examination suggests, however, that the typical rent is anything but low and that the majority pay rents that fall within a narrower range. The average monthly rent paid by slum households is K Sh 790 (US $11), and the median rent K Sh 700 (US $9). Apart from the outliers on either end, the vast majority (80%)
Table 8.6 Average monthly rents reported by survey households in different administrative divisions of Nairobi, 2004 (Kenya shillings) Division N Mean Median Min Max SD Dagoretti 295 1,090 900 300 3,230 570 Westlands 57 1,080 1,000 400 3,000 590 Pumwani 111 890 700 300 3,000 590 Central 189 860 700 260 2,600 400 Makadara 170 780 750 400 2,000 200 Embakasi 167 670 600 200 3,200 330 Kasarani 182 640 500 250 2,000 320 Kibera 450 620 500 300 2,000 260 Total 1,621 790 700 200 3,230 440 N - Number of observations
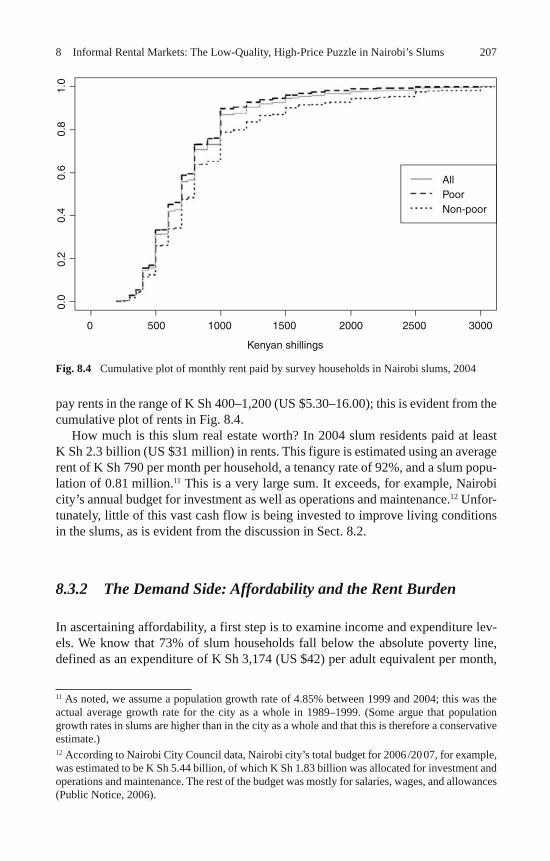
2078 Informal Rental Markets: The Low-Quality, High-Price Puzzle in Nairobi’s Slums
pay rents in the range of K Sh 400–1,200 (US $5.30–16.00); this is evident from the cumulative plot of rents in Fig. 8.4.
How much is this slum real estate worth? In 2004 slum residents paid at least K Sh 2.3 billion (US $31 million) in rents. This figure is estimated using an average rent of K Sh 790 per month per household, a tenancy rate of 92%, and a slum popu-lation of 0.81 million. 11 This is a very large sum. It exceeds, for example, Nairobi city’s annual budget for investment as well as operations and maintenance. 12 Unfor-tunately, little of this vast cash flow is being invested to improve living conditions in the slums, as is evident from the discussion in Sect. 8.2.
8.3.2 The Demand Side: Affordability and the Rent Burden
In ascertaining affordability, a first step is to examine income and expenditure lev-els. We know that 73% of slum households fall below the absolute poverty line, defined as an expenditure of K Sh 3,174 (US $42) per adult equivalent per month,
11 As noted, we assume a population growth rate of 4.85% between 1999 and 2004; this was the actual average growth rate for the city as a whole in 1989–1999. (Some argue that population growth rates in slums are higher than in the city as a whole and that this is therefore a conservative estimate.)12 According to Nairobi City Council data, Nairobi city’s total budget for 2006 /20 07, for example, was estimated to be K Sh 5.44 billion, of which K Sh 1.83 billion was allocated for investment and operations and maintenance. The rest of the budget was mostly for salaries, wages, and allowances (Public Notice, 2006).
Fig. 8.4 Cumulative plot of monthly rent paid by survey households in Nairobi slums, 2004
0
0.0
0.2
0.4
0.6
0.8
1.0
500 1000 1500
Kenyan shillings
AllPoorNon-poor
2000 2500 3000
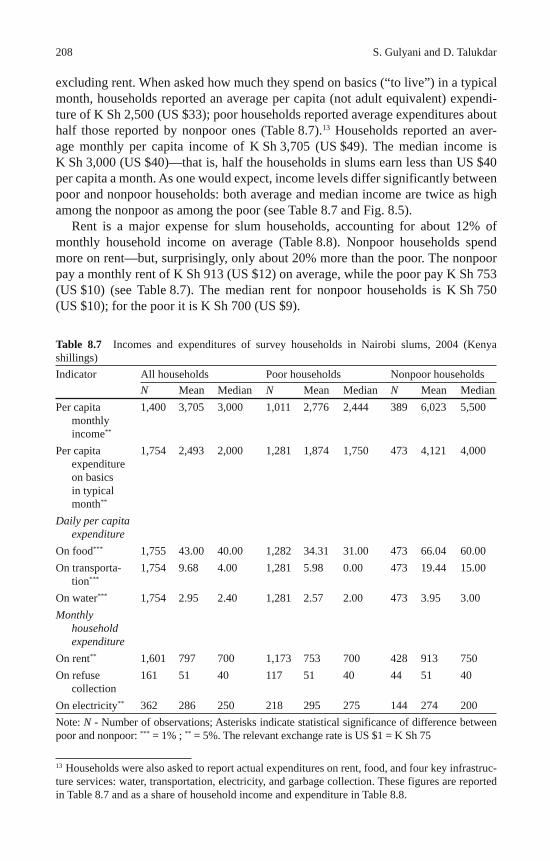
208 S. Gulyani and D. Talukdar
excluding rent. When asked how much they spend on basics (“to live”) in a typical month, households reported an average per capita (not adult equivalent) expendi-ture of K Sh 2,500 (US $33); poor households reported average expenditures about half those reported by nonpoor ones (Table 8.7). 13 Households reported an aver-age monthly per capita income of K Sh 3,705 (US $49). The median income is K Sh 3,000 (US $40)—that is, half the households in slums earn less than US $40 per capita a month. As one would expect, income levels differ significantly between poor and nonpoor households: both average and median income are twice as high among the nonpoor as among the poor (see Table 8.7 and Fig. 8.5).
Rent is a major expense for slum households, accounting for about 12% of monthly household income on average (Table 8.8). Nonpoor households spend more on rent—but, surprisingly, only about 20% more than the poor. The nonpoor pay a monthly rent of K Sh 913 (US $12) on average, while the poor pay K Sh 753 (US $10) (see Table 8.7). The median rent for nonpoor households is K Sh 750 (US $10); for the poor it is K Sh 700 (US $9).
13 Households were also asked to report actual expenditures on rent, food, and four key infrastruc-ture services: water, transportation, electricity, and garbage collection. These figures are reported in Table 8.7 and as a share of household income and expenditure in Table 8.8.
Table 8.7 Incomes and expenditures of survey households in Nairobi slums, 2004 (Kenya shillings) Indicator All households Poor households Nonpoor households
N Mean Median N Mean Median N Mean Median Per capita
monthly income**
1,400 3,705 3,000 1,011 2,776 2,444 389 6,023 5,500
Per capita expenditure on basics in typical month**
1,754 2,493 2,000 1,281 1,874 1,750 473 4,121 4,000
Daily per capita expenditure
On food*** 1,755 43.00 40.00 1,282 34.31 31.00 473 66.04 60.00 On transporta-
tion*** 1,754 9.68 4.00 1,281 5.98 0.00 473 19.44 15.00
On water*** 1,754 2.95 2.40 1,281 2.57 2.00 473 3.95 3.00 Monthly
household expenditure
On rent** 1,601 797 700 1,173 753 700 428 913 750 On refuse
collection 161 51 40 117 51 40 44 51 40
On electricity** 362 286 250 218 295 275 144 274 200 Note: N - Number of observations; Asterisks indicate statistical significance of difference between poor and nonpoor: *** = 1% ; ** = 5%. The relevant exchange rate is US $1 = K Sh 75
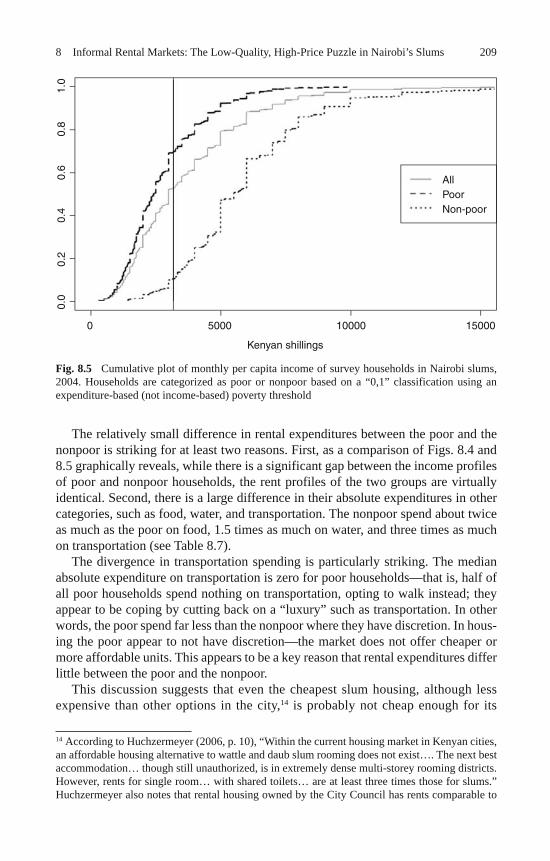
2098 Informal Rental Markets: The Low-Quality, High-Price Puzzle in Nairobi’s Slums
The relatively small difference in rental expenditures between the poor and the nonpoor is striking for at least two reasons. First, as a comparison of Figs. 8.4 and 8.5 graphically reveals, while there is a significant gap between the income profiles of poor and nonpoor households, the rent profiles of the two groups are virtually identical. Second, there is a large difference in their absolute expenditures in other categories, such as food, water, and transportation. The nonpoor spend about twice as much as the poor on food, 1.5 times as much on water, and three times as much on transportation (see Table 8.7).
The divergence in transportation spending is particularly striking. The median absolute expenditure on transportation is zero for poor households—that is, half of all poor households spend nothing on transportation, opting to walk instead; they appear to be coping by cutting back on a “luxury” such as transportation. In other words, the poor spend far less than the nonpoor where they have discretion. In hous-ing the poor appear to not have discretion—the market does not offer cheaper or more affordable units. This appears to be a key reason that rental expenditures differ little between the poor and the nonpoor.
This discussion suggests that even the cheapest slum housing, although less expensive than other options in the city, 14 is probably not cheap enough for its
14 According to Huchzermeyer (2006, p. 10), “Within the current housing market in Kenyan cities, an affordable housing alternative to wattle and daub slum rooming does not exist…. The next best accommodation… though still unauthorized, is in extremely dense multi-storey rooming districts. However, rents for single room… with shared toilets… are at least three times those for slums.” Huchzermeyer also notes that rental housing owned by the City Council has rents comparable to
Fig. 8.5 Cumulative plot of monthly per capita income of survey households in Nairobi slums, 2004. Households are categorized as poor or nonpoor based on a “0,1” classification using an expenditure-based (not income-based) poverty threshold
0
0.0
0.2
0.4
0.6
0.8
1.0
5000
Kenyan shillings
AllPoorNon-poor
10000 15000
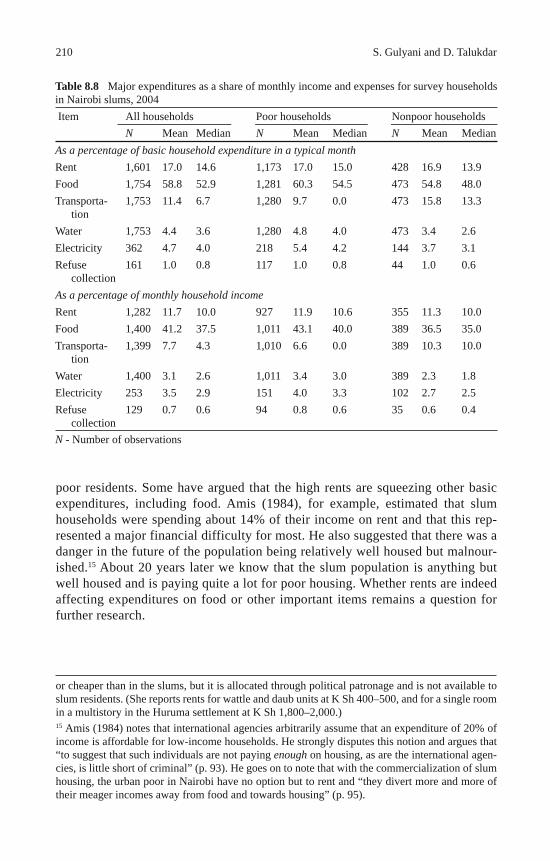
210 S. Gulyani and D. Talukdar
poor residents. Some have argued that the high rents are squeezing other basic expenditures, including food. Amis (1984), for example, estimated that slum households were spending about 14% of their income on rent and that this rep-resented a major financial difficulty for most. He also suggested that there was a danger in the future of the population being relatively well housed but malnour-ished. 15 About 20 years later we know that the slum population is anything but well housed and is paying quite a lot for poor housing. Whether rents are indeed affecting expenditures on food or other important items remains a question for further research.
or cheaper than in the slums, but it is allocated through political patronage and is not available to slum residents. (She reports rents for wattle and daub units at K Sh 400–500, and for a single room in a multistory in the Huruma settlement at K Sh 1,800–2,000.) 15 Amis (1984) notes that international agencies arbitrarily assume that an expenditure of 20% of income is affordable for low-income households. He strongly disputes this notion and argues that “to suggest that such individuals are not paying enough on housing, as are the international agen-cies, is little short of criminal” (p. 93). He goes on to note that with the commercialization of slum housing, the urban poor in Nairobi have no option but to rent and “they divert more and more of their meager incomes away from food and towards housing” (p. 95).
Table 8.8 Major expenditures as a share of monthly income and expenses for survey households in Nairobi slums, 2004 Item All households Poor households Nonpoor households
N Mean Median N Mean Median N Mean Median As a percentage of basic household expenditure in a typical month Rent 1,601 17.0 14.6 1,173 17.0 15.0 428 16.9 13.9 Food 1,754 58.8 52.9 1,281 60.3 54.5 473 54.8 48.0 Transporta-
tion 1,753 11.4 6.7 1,280 9.7 0.0 473 15.8 13.3
Water 1,753 4.4 3.6 1,280 4.8 4.0 473 3.4 2.6 Electricity 362 4.7 4.0 218 5.4 4.2 144 3.7 3.1 Refuse
collection 161 1.0 0.8 117 1.0 0.8 44 1.0 0.6
As a percentage of monthly household income Rent 1,282 11.7 10.0 927 11.9 10.6 355 11.3 10.0 Food 1,400 41.2 37.5 1,011 43.1 40.0 389 36.5 35.0 Transporta-
tion 1,399 7.7 4.3 1,010 6.6 0.0 389 10.3 10.0
Water 1,400 3.1 2.6 1,011 3.4 3.0 389 2.3 1.8 Electricity 253 3.5 2.9 151 4.0 3.3 102 2.7 2.5 Refuse
collection 129 0.7 0.6 94 0.8 0.6 35 0.6 0.4
N - Number of observations
2118 Informal Rental Markets: The Low-Quality, High-Price Puzzle in Nairobi’s Slums
8.3.3 What Drives Rents in Nairobi’s Informal Housing Market?
Rents differ not only between slums in different parts of the city but also within slum settlements. To try to understand the variables that drive rents in slums, we conducted a multivariate regression analysis with monthly rent paid by tenant house-holds as the dependent variable. 16 The independent variables used in this hedonic analysis can be grouped into the following four categories, drawn from the Living Conditions Diamond: rented unit’s size and building quality; infrastructure access at the unit and neighborhood level; other neighborhood characteristics and amenities as well as location; and tenure. Results of the complete regression model are pre-sented in Table 8.9. (For details on the independent variables, see the Appendix.)
The results show that this model—consisting of explanatory variables cor-responding to the four dimensions of the Living Conditions Diamond—explains 50.5% of the observed variation in rents. Because the regression analysis is based entirely on cross-sectional data, the explanatory power of this rent regression model is quite high. By using a stepwise regression approach, we examined the relative explanatory power of the four categories of variables. Variables related to the unit size and quality have the greatest explanatory power; they explain about 32% of the variation in rents. Infrastructure variables explain about 8% of the variation, and neighborhood characteristics, location, and amenities about 10%. Tenure-related variables have the weakest explanatory power; they help explain less than 0.5% of the variation in rents. In the following discussion we take a closer look at the results, using a statistical significance of 10% or less as the threshold value for determining whether or not a variable is correlated with rent.
We find that rent is strongly and positively related to unit size as measured by number of rooms. In addition, as one would expect, rents are directly related to housing quality—they are higher for units assessed to be of higher quality by the enumerator, and they are higher for housing constructed with permanent build-ing materials. Units that have permanent external walls—that is, constructed with stone, brick, or block—have higher rents than units with walls of wood, mud, or tin. Similarly, units with cement or wood floors have higher rents than those with mud floors.
Access to house-specific infrastructure is also correlated with rent. Dwelling units with an electricity connection and those with an in-house or yard connection for water have higher rents than units without these amenities. Similarly, rents are higher for units that provide reasonable access to a toilet facility, defined as those in which the renting household shares a toilet facility with fewer than 10 households (as noted, the average loading is 19 households per facility).
With respect to explicitly controlled neighborhood characteristics, infrastructure, and location, we find that rents are higher in settlements with a public school facility
16 The functional form of the regression model used is linear. It was estimated using the maxi-mum-likelihood estimation method, to allow for the fact that data were collected through stratified random sampling with slum enumeration areas (EA5s) as the primary sampling units and sampling weights assigned to each household based on its inverse probability of selection.
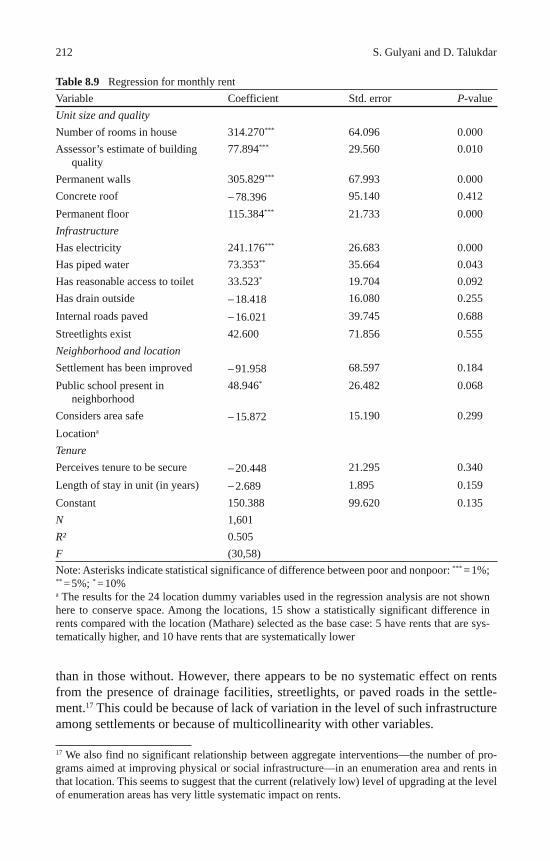
212 S. Gulyani and D. Talukdar
than in those without. However, there appears to be no systematic effect on rents from the presence of drainage facilities, streetlights, or paved roads in the settle-ment. 17 This could be because of lack of variation in the level of such infrastructure among settlements or because of multicollinearity with other variables.
17 We also find no significant relationship between aggregate interventions—the number of pro-grams aimed at improving physical or social infrastructure—in an enumeration area and rents in that location. This seems to suggest that the current (relatively low) level of upgrading at the level of enumeration areas has very little systematic impact on rents.
Table 8.9 Regression for monthly rent Variable Coefficient Std. error P -value Unit size and quality Number of rooms in house 314.270*** 64.096 0.000 Assessor’s estimate of building
quality 77.894*** 29.560 0.010
Permanent walls 305.829*** 67.993 0.000 Concrete roof − 78.396 95.140 0.412 Permanent floor 115.384*** 21.733 0.000 Infrastructure Has electricity 241.176*** 26.683 0.000 Has piped water 73.353** 35.664 0.043 Has reasonable access to toilet 33.523* 19.704 0.092 Has drain outside − 18.418 16.080 0.255 Internal roads paved − 16.021 39.745 0.688 Streetlights exist 42.600 71.856 0.555 Neighborhood and location Settlement has been improved − 91.958 68.597 0.184 Public school present in
neighborhood 48.946* 26.482 0.068
Considers area safe − 15.872 15.190 0.299 Location a Tenure Perceives tenure to be secure − 20.448 21.295 0.340 Length of stay in unit (in years) − 2.689 1.895 0.159 Constant 150.388 99.620 0.135 N 1,601 R² 0.505 F (30,58) Note: Asterisks indicate statistical significance of difference between poor and nonpoor: *** = 1%; ** = 5%; * = 10% a The results for the 24 location dummy variables used in the regression analysis are not shown here to conserve space. Among the locations, 15 show a statistically significant difference in rents compared with the location (Mathare) selected as the base case: 5 have rents that are sys-tematically higher, and 10 have rents that are systematically lower
2138 Informal Rental Markets: The Low-Quality, High-Price Puzzle in Nairobi’s Slums
Residents’ perception of the relative safety of their neighborhood (in terms of crime) is not correlated in any significant way with the rents they pay. This result is somewhat surprising given the widespread perception of crime and insecurity in the slums. Among the possible reasons for this result: Residents’ perception is not a good proxy for measuring the impact of crime. There is little variation in crime levels (or at least in residents’ perception of the incidence of crime) among settlements. There is multicollinearity. Or this variable is not a key driver of rents in Nairobi’s slums.
Location and other “unobserved” neighborhood characteristics of a slum directly influence rent at the unit level. We included about 24 location dummy variables (in census data a location represents a subset of a division and consists of several sub-locations) to capture the effects of location as well as other unobserved differences across neighborhoods on rents, using one location (Mathare) as the “base.” Many of these location dummy variables are significant, indicating that some of the varia-tion in rents can be explained by unobserved differences across neighborhoods (dif-ferences not captured or observed in the other variables included). 18 These results show that even after controlling for key observable characteristics of the house and the neighborhood, location or other unobserved neighborhood-level characteristics impose either a “premium” or a “discount” in the home rental markets across slums in these locations.
Finally, we find no systematic relationship between rent and the renter’s percep-tion of tenure security. Nor do we find a relationship between rent and the length of a household’s stay in a unit. The first finding does not suggest that tenure security has no rental value; instead, it shows that the proxy indicator based on households’ percep-tion of tenure security has little explanatory power with respect to variation in rents.
In sum, we find that rents in Nairobi’s slums depend on a unit’s size, location, construction quality, and access to infrastructure. In other words, the “informality” notwithstanding, rents in Nairobi’s slums appear to behave in many ways as do those in a formal—though distorted—real estate rental market.
8.3.4 Supply-Side Issues: Extraordinary Returns on Investment and Barriers to Entry?
Previous studies suggest that the business of being a slum landlord in Nairobi is highly profitable. Amis (1984), in his detailed study of landlordism in the Nairobi
18 We also ran the analysis using 8 division dummy variables rather than the 24 location dummy variables to account for the unobserved differences across neighborhoods. The substantive results remained the same. However, division dummy variables had 50% less explanatory power than the location dummy variables. This is not surprising, since division dummy variables are more macro (or aggregate) measures of neighborhoods and thus fail to capture the unobserved neighborhood differences as effectively as the more micro location dummy variables. At the division level the results were as follows: Compared with the rents in the Central division (base case), rents are similar in divisions 2, 5, and 6 (Makadara, Pumwani, and Westlands). However, rents are system-atically higher in division 7 (Dagoretti) and systematically lower in divisions 3, 4, and 8 (Kasarani, Embakasi, and Kibera).
214 S. Gulyani and D. Talukdar
slum of Kibera, estimates that for “a 10-room structure, the [undiscounted] annual capital return was 131%. Thus after only 9 months the landlord’s income is pure profit, since the maintenance and running costs are more or less non-existent” (p. 91). Amis also cites a 1973 study by Temple that finds the rate of return on rental housing to be 171%.
UN-Habitat (2002) revisits the issue of returns and profits in A Rapid Economic Appraisal of Rents in Slums and Informal Settlements. This report finds that Kibera, the largest slum in Nairobi, offers the most profitable housing investment in the city. According to the study, the cost of putting up a single room is K Sh 12,686 (US $159; US $169 using our exchange rate), while the average rent per room is K Sh 1,300 (US $16; US $17 using our rate) a month. This means that an inves-tor can recoup the initial investment in 9.75 months. Other informal settlements, although less profitable than Kibera, also offer excellent returns; annual returns range from 60 to 80% and payback periods average 16 months. Viewing these find-ings against the background of the formal property market, the UN-Habitat report observes that unauthorized housing is a lucrative investment in Kenya.
We find that rents are significantly lower than those reported by UN-Habitat. Our data show that monthly rents in Kibera average about K Sh 620 (US $8) and that they are lower than those in the city’s slums as a whole (K Sh 790, or US $11; see Table 8.6). With rents at this level, the payback period for a K Sh 12,686 investment for a single room would be 20.4 months rather than 9.75—still short, but not quite as short as the rapid appraisal suggests. This is not to argue that the UN-Habitat report is wrong but to emphasize that these calculations on payback periods and rates of return are relatively sensitive to assumptions and data on base investment costs, rents, and such factors as the interest rate. It is therefore worth moving beyond rapid appraisals toward more rigorous assessments of the risks as well as the relative costs and benefits of being a slumlord in Nairobi; this is an area for future research.
8.3.4.1 Who Are the Slumlords?
In his study of Kibera’s landlords, Amis (1984) noted that there is an informal system for allocating building rights and that it is an important source of political patronage for politicians and the local administration. He also found that many of the large landlords were from the administration. 19
UN-Habitat (2002) comes to similar conclusions in its more recent study. The report notes that much of the land occupied by squatters in Kibera has been acquired or allocated by politicians and government employees with enough influence to ensure that the squatters are not displaced. 20 In its sample of 120 landlords, 41%
19 In Amis’s (1984) sample of 95 large landlords, 71 (66%) were Kikuyu and 24 (22%) were Nubian. And 10 (35%) of the 29 large landlords who could be identified were from the local administration. 20 Before 1974, Amis (1984) argues, the administration had a laissez-faire attitude toward slums, imposing no effective controls over the construction of units. Around 1974 it took a more active
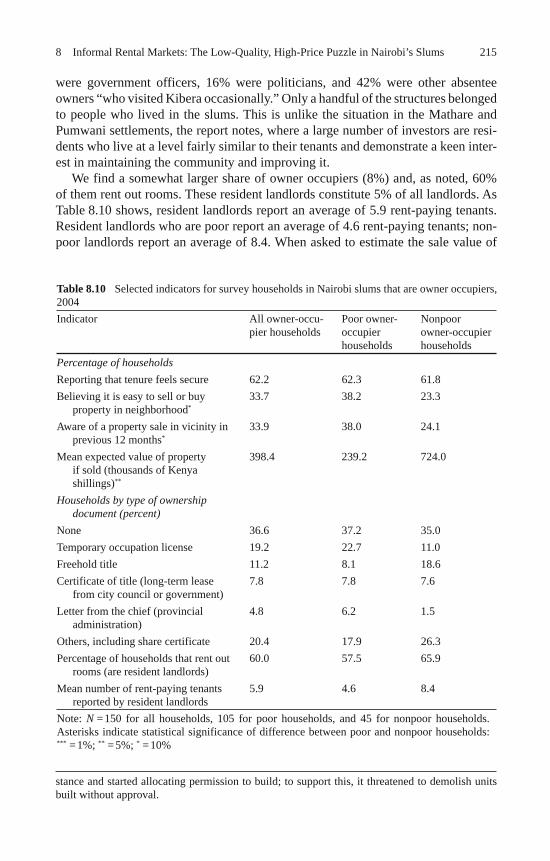
2158 Informal Rental Markets: The Low-Quality, High-Price Puzzle in Nairobi’s Slums
were government officers, 16% were politicians, and 42% were other absentee owners “who visited Kibera occasionally.” Only a handful of the structures belonged to people who lived in the slums. This is unlike the situation in the Mathare and Pumwani settlements, the report notes, where a large number of investors are resi-dents who live at a level fairly similar to their tenants and demonstrate a keen inter-est in maintaining the community and improving it.
We find a somewhat larger share of owner occupiers (8%) and, as noted, 60% of them rent out rooms. These resident landlords constitute 5% of all landlords. As Table 8.10 shows, resident landlords report an average of 5.9 rent-paying tenants. Resident landlords who are poor report an average of 4.6 rent-paying tenants; non-poor landlords report an average of 8.4. When asked to estimate the sale value of
stance and started allocating permission to build; to support this, it threatened to demolish units built without approval.
Table 8.10 Selected indicators for survey households in Nairobi slums that are owner occupiers, 2004 Indicator All owner-occu-
pier households Poor owner-occupier households
Nonpoor owner-occupier households
Percentage of households Reporting that tenure feels secure 62.2 62.3 61.8 Believing it is easy to sell or buy
property in neighborhood* 33.7 38.2 23.3
Aware of a property sale in vicinity in previous 12 months*
33.9 38.0 24.1
Mean expected value of property if sold (thousands of Kenya shillings)**
398.4 239.2 724.0
Households by type of ownership document (percent)
None 36.6 37.2 35.0 Temporary occupation license 19.2 22.7 11.0 Freehold title 11.2 8.1 18.6 Certificate of title (long-term lease
from city council or government) 7.8 7.8 7.6
Letter from the chief (provincial administration)
4.8 6.2 1.5
Others, including share certificate 20.4 17.9 26.3 Percentage of households that rent out
rooms (are resident landlords) 60.0 57.5 65.9
Mean number of rent-paying tenants reported by resident landlords
5.9 4.6 8.4
Note: N = 150 for all households, 105 for poor households, and 45 for nonpoor households. Asterisks indicate statistical significance of difference between poor and nonpoor households: *** = 1%; ** = 5%; * = 10%
216 S. Gulyani and D. Talukdar
their home, owner occupiers who are poor placed the average value at K Sh 239,203 (US $3,189), compared with K Sh 723,977 (US $9,653) for the nonpoor. Their esti-mates can provide an alternative basis for understanding decisions by slum inves-tors on whether to build or not and whether to sell or rent; they can also be used to understand what kind of deal the landlords may or may not be willing to accept if the government were to come in with proposals for slum upgrading.
8.3.4.2 Entry Barriers and Other Disincentives for Investment
Entry into the business of being a slumlord requires at a minimum the construction or purchase of a unit. And this, according to Amis (1984) and UN-Habitat (2002), requires political connections, payment of significant (illegal) fees to get permis-sion to build or improve a unit, 21 and willingness to bear the risk of demolition and loss of capital.
Our data support the view that there are barriers to entry in the housing market in the slums and that landlords face no significant competitive pressure. First, our data show that base rental values are high despite poor quality. Second, although improvements at the unit level do translate into higher rents, landlords are not rein-vesting their profits in upgrading building materials or improving units’ access to such services as water and electricity.
Moreover, because absentee landlords do not live in the unit or the neighbor-hood, they do not suffer from the appalling living conditions. This eliminates yet another incentive for investment or for lobbying government for improvements. This observation is consistent with the UN-Habitat’s (2002) finding that in slums with a larger share of owner occupiers or resident landlords, there is greater interest in improving the community. More research is needed to improve our understand-ing of the landlords, their incentives, and what it would take to have them invest or partner in any government-initiated process for improving services, housing, and overall living conditions in the slums.
8.4 Using the Framework to Understand and Break the Low-Quality, High-Cost Trap
The preceding discussion suggests that Nairobi’s slums are stuck in a low-quality, high-cost trap. The tenants are paying a lot for very poor-quality housing and infra-structure. Moreover, unlike in such cities as Dakar and Rio de Janeiro, in Nairobi housing quality and services in the slums have not improved and consolidated stead-ily over time. While it is easy to vilify the landlords and direct blame toward them,
21 UN-Habitat (2002) notes that investors need to make several kinds of payments, including pay-ments to local administrators, especially the area chief; otherwise the construction or improvement will not be sanctioned. UN-Habitat estimates that in the Kibera, Mukuru, and Korogocho slums these payments amount to K Sh 18,000 (US $225; US $240 using our exchange rate).
2178 Informal Rental Markets: The Low-Quality, High-Price Puzzle in Nairobi’s Slums
we argue that the situation in Nairobi is the result of a combination of factors. In this section we show how the Living Conditions Diamond can be used as a frame-work for understanding the situation and, by extension, deciding how to intervene to improve conditions.
8.4.1 Tenure and Its Effects on Investment by Landlords and Tenants
In Nairobi the tenure mix is highly unusual—there are too many tenants and too few owner occupiers and resident landlords—and the incentives for investing in improvements in the unit (and the neighborhood) are weak. Because the landlords or structure owners do not live there, and because competition is limited, they do not appear to have many incentives to invest in upgrading the units or to press gov-ernment to invest in infrastructure upgrading in the neighborhood as a whole.
We speculate that landlords are likely to be relatively averse to government atten-tion and intervention, because of a fear that the government will assert its rights over the land and, directly or indirectly, cut into their profitable business (for example, by trying to regulate it, tax it, or, worse, declare it illegal and repossess the land). One possible reason that landlords may not want to invest heavily in units is that this would attract undue attention from the authorities; “staying under the radar” appears to be a better strategy for them.
In addition, local experts suggest that absentee landlords own and control not just the housing units but also many of the yard taps, water kiosks, in-house connec-tions for water and electricity, and many of the toilet facilities (including “public” pay-per-use toilets), and all of these are known to be good businesses. If so, land-lords are unlikely to want government to improve services in the slums, because that would directly reduce their infrastructure-related businesses. In other words, landlords are likely to prefer the status quo—and work to maintain it.
The tenants, for their part, are not only poor but also mobile—on average, they have stayed in their current unit for 5 years—and this appears to reduce both their ability and their willingness to invest. But the tenants tend to stay longer in their settlement, about 9 years on average, and they are the ones who suffer most directly from the horrible living conditions. Although their incentives and ability to invest in the units may be weak, they can mobilize to improve their neighborhood—for example, by organizing garbage collection or community policing and by using their voting power to pressure government into improving services. Some slum communities are indeed organizing and mobilizing with assistance from NGOs, but such efforts have yet to be scaled up.
8.4.2 Infrastructure and the Absence of Government Investment
Improvements in infrastructure services, at the level of both the unit and the neigh-borhood, require more than tacit approval by the government. Public utilities and
218 S. Gulyani and D. Talukdar
infrastructure agencies need to have approval to connect slum residents, and they usually also need to have significant budgetary allocations. But for reasons that are not well understood, the government has not invested—there have been no sig-nificant government-supported programs to improve public infrastructure in the slums. 22 The unusual tenure mix, combined with the lack of investment and effort by all three of the main stakeholders—the government, the landlords, and the ten-ants—have together resulted in the appalling conditions in the slums.
8.4.3 Current Approaches to Improving Living Conditions in Slums
Practitioners and academic analysts both tend to identify a key entry point—usu-ally either tenure or infrastructure—and hope that action targeting that factor will trigger broad-based improvements on all fronts. Infrastructure proponents—for example, program managers at the World Bank—have convincingly argued that infrastructure is often the right entry point for governments attempting to improve slums (see, e.g., Gulyani & Bassett, 2007). The argument is that government invest-ment in upgrading infrastructure in slums enhances security of tenure, requires and facilitates improvements in settlement layout, and encourages residents to invest in improvements at the unit level. Moreover, infrastructure rarely improves without government effort because it has public good characteristics and because it entails lumpy investments.
Others see tenure as the right entry point but disagree on the form interventions should take. Analysts such as de Soto (2000) argue that regularizing tenure is the key. If government legalizes tenure in slums, it will unleash “dead capital,” creating assets that slum residents can use as collateral for all sorts of business activities and allowing them to dramatically enhance their own welfare. By contrast, proponents of rental housing, including analysts such as Gilbert (2003), argue that renting is a form of tenure that should be encouraged. Gilbert goes on to note, however, that Nairobi poses a challenge and a dilemma; the following quotation reveals his strug-gle in interpreting the situation and suggesting a solution:
Renting in Nairobi currently represents a worst case scenario, in terms of living condi-tions offered to tenants; it is a classic example of what rental housing should not be like. It should be noted, however, that these rental units provide affordable housing to a consider-able share of the labor force. This situation helps in keeping wages at a low level in many sectors of the economy. The unholy combination of low wages, poverty, unequal access to power, public ownership, absentee landlordism, poor service provision and rapid in-migra-tion have conspired, in Nairobi, to produce some of the world’s worst living conditions. (Gilbert, 2003, p. 239, emphasis added)
22 In the case of water supply the government has supported the expansion of kiosks, but as other studies show, these have had only limited benefits (e.g., Gulyani et al., 2005; World Bank, 2006).
2198 Informal Rental Markets: The Low-Quality, High-Price Puzzle in Nairobi’s Slums
8.4.4 Using the Framework to Analyze the Problem and Propose an Alternative Solution
Our analysis of Nairobi’s slums suggests that the approaches cited above reflect at best a partial understanding of slums and thus offer incomplete solutions—solu-tions that might work in some conditions but will fail in others. Using the Living Conditions Diamond, supplemented by the rent analysis to assess the relative effect of the four factors in that framework, we can categorically conclude that the situa-tion in Nairobi’s slums is not good for the poor and that reaching a better outcome is both highly desirable and possible. We can also see why the situation cannot be attributed simply to bad landlords. Finally, in our view Nairobi is a case in which the solution lies in working simultaneously on two parts of the diamond—tenure and infrastructure.
In Nairobi’s slums neither the standard infrastructure upgrading approach cham-pioned by the World Bank, nor the tenure legalization approach, nor the prescription to support rental housing is likely to work independently. Legalizing tenure in slums, unless explicitly treated as a land reform exercise, is likely to confer benefits on structure owners and not tenants. Supporting structure owners, as providers of rental housing, will not work without altering the structure of the market and some of the other disincentives they face. Investments in infrastructure are likely to translate into higher rents—as is evident from the rent analysis—and thus displace many of the current slum residents, the vast majority of whom fall below the poverty line.
The government’s goal should be to help break the low-quality, high-cost trap in Nairobi’s slums (rather than to aim for piecemeal improvements in selected settle-ments, for example). To do so, the government will need to deal with both tenure and infrastructure issues. The government could, for example, offer a package of infrastructure services combined with greater security of tenure as an incentive—but only to settlements in which tenants and landlords can reach agreement on a formula for sharing both the costs and the benefits of these changes.
One such agreement was brokered by Pamoja Trust, an NGO, in Nairobi’s Huruma settlement. The agreement, between landlords, tenants, and the Nairobi City Council, requires landlords to give up control over some of their units in exchange for a formal title and investment in improving the retained units (Jane Weru, founding director of Pamoja Trust, personal communication, September 20, 2006; also see Baliga, 2005). For example, a landlord with 12 units agreed to retain three and give up the other nine, which were then legally transferred to the tenants. The NGO later assisted with construction of new units or improvement of existing ones for the 70 participating households, using funds from grants and from a sav-ings scheme run by the residents. A key advantage of this solution is that it results in a better mix of owner occupiers, tenants, and landlords on the site; it is a small-scale land reform project.
Other options can be designed, depending on how the government would like to proceed. We now know that the value of maintaining the status quo is a flow of about US $31 million a year to landlords and those they need to unofficially pay—and none of this translates into better living conditions for tenants or official revenues
220 S. Gulyani and D. Talukdar
or taxes for government. As the official landowner, the government can convene a meeting with the other two stakeholders (the structure owners and the tenants) to decide whether and how this pie could be carved up more fairly. Theoretically, if the government were rich and generous, it could also offer to just buy out the landlords with an appropriate compensation package. As yet another alternative, the govern-ment could mandate a solution, but the complex political economy may not allow such an approach. We favor a negotiation between the three stakeholders, with the government using a combination of carrots and sticks to reach a solution.
8.5 Conclusions and Implications for Theory and Practice
In summary, this study finds that the vast majority (92%) of Nairobi’s slum resi-dents do not own their home. They are tenants, and they are crowded—with 2.6 persons per room—in poor-quality housing structures built with impermanent mate-rials. Their access to basic infrastructure is appalling. Only 22% of slum households have an electricity connection, and barely 19% have access to piped water through either an in-house connection or a yard tap.
Despite the informal status of the settlements, the poor quality of housing, and the inadequate infrastructure, rents in the slums are substantial. In 2004 slum house-holds paid structure owners an average rent of about US $11 a month—together paying an extraordinary US $31 million for the year. But this large cash flow does not translate into investments that improve the quality of living conditions for the residents, nor does any fraction of it accrue formally to the official landowner, the government. This informal rental market, though distorted, appears to follow many of the rules that apply in formal markets—rents vary with house size, quality, infra-structure access, and location.
Although earlier studies of Nairobi’s slums have documented some of these features, researchers and practitioners have struggled with their interpretation of the findings. All seem to agree that the situation in Nairobi’s slums is bad, but there are major disagreements, for example, on whether the rents are too high and need to be regulated, whether the landlords are villains or not, and whether this rental market is helping or hurting the poor. Not surprisingly, then, there is no agreement on what to do about the terrible living conditions in these slums. Indeed, many researchers, acknowledging that Nairobi does not fit well with their broader conceptual framework and argument, have left the case hanging as an outlier or unresolved puzzle.
We argue that Nairobi’s slums cannot and should not be dismissed as a unique case or an outlier. First, we speculate that Nairobi is probably not entirely unique. There are possibly many other cities in which substandard slum accommodation comes at a high price (Mumbai may be an example). There are also probably several cities in which renters constitute a significant share of the slum housing market. Identifying and analyzing such cases are important areas for further research.
Second, the Nairobi case and other such outliers should not be dismissed pre-cisely because they call into question the very core of our current understanding of
2218 Informal Rental Markets: The Low-Quality, High-Price Puzzle in Nairobi’s Slums
slum settlements. As difficult cases, they force us to revise or expand the concep-tual frameworks that we use to analyze and understand slums. We offer the Living Conditions Diamond as an analytical framework and a step toward a more complete theory of informal rental markets and slum settlements. This framework allows us to understand, for example, why Nairobi is a difficult but not counterintuitive case and how its “slums of despair” might be converted into “slums of hope.”
What are the implications of this study for improving living conditions in Nairobi’s slums? In Nairobi the standard prescription of in situ upgrading of infra-structure will not work. Efforts to legalize tenure or to support the rental market are likely to benefit the structure owners rather than the tenants. Using the Living Con-ditions Diamond, we argue that rather than choosing either infrastructure or tenure as a single entry point, the government needs to act on both fronts simultaneously. We suggest that the government offer infrastructure services and legitimization of tenure as incentives and use them to explicitly alter the tenure mix in the slums. The government’s goal should be to break the low-quality, high-cost trap in slum hous-ing, and one way to do so is to bring both structure owners and tenants to the table and negotiate a deal.
Acknowledgements The authors are grateful to Natasha Iskander, Ellen Bassett, and Peter Marcuse for offering excellent comments; Jaime Biderman, Geoffrey Bergen, Colin Bruce, Makhtar Diop, and Matthew Glasser for strongly supporting and helping to finance this study; James Mutero for leading the fieldwork in Nairobi; Adam Samuel for editing tips; and Cuz Potter and Alyssa Boyer for providing research assistance. A significantly modified and shortened ver-sion of this chapter is being published in the journal World Development .
Appendix
Rent Regression Model
In the multivariate regression analysis the dependent variable is the monthly rent paid by tenant households. The independent variables used in this hedonic analysis can be grouped into the four categories of the Living Conditions Diamond and are as follows:
1. Rented unit’s size and building quality. The variables included here are number of rooms in the house, house quality as assessed by the enumerator, and three dummy (yes/no) variables reflecting the construction quality of the house: whether the walls are made of permanent materials (stone, brick, block), whether the roof is concrete, and whether the floor is made of permanent materials (tiles, cement, wood).
2. Infrastructure access at the unit and neighborhood level . To investigate the rela-tionship of unit-level infrastructure and rents, the following three dummy vari-ables are included: whether the house has access to electricity, whether it has access to piped water, and whether it has reasonable access to a toilet (with “yes” being defined as having access to a toilet that is shared by fewer than 10 house-
222 S. Gulyani and D. Talukdar
holds). To assess the effect of neighborhood-level infrastructure, the analysis includes three dummy variables: whether the house has a working drain outside, whether there are streetlights, and whether the neighborhood’s internal roads are paved.
3. Other neighborhood characteristics and amenities . Here the variables include whether the slum enumeration area containing the rented home has seen a sig-nificant number of infrastructure or social interventions, whether the area has a public school, and whether the tenant of the rented home perceives the neighbor-hood to be safe. Finally, to control for the crucial “location factor” and any other unobserved or undocumented expected differences across neighborhoods that are likely to influence rental markets, the analysis includes dummy variables for locations (24 location dummy variables and one as the base case) in which the survey households reside.
4. Tenure. Almost all the rental units are located on land that is not formally owned by the structure owner. However, the threat of demolition or eviction is likely to be higher in some settlements than in others; in theory, this should affect the rent. The analysis includes a dummy variable that records whether or not the tenant perceives tenure to be secure. It also includes a variable measuring the duration of the tenant’s stay, specifically, the number of years the tenant had resided in that unit.
References
Alder, G. (1995). Tackling poverty in Nairobi’s informal settlements: Developing an institutional strategy. Environment and Urbanization , 7 (2), 85–107.
Amis, P. (1984). Squatters or tenants: The commercialization of unauthorized housing in Nairobi. World Development , 12 (1), 87–96.
Baliga, N. (2005). Community-based upgrading and tenure regularization: Insights from Nairobi, Kenya . Master’s thesis, Columbia University, New York.
Brutal killings in Nairobi slum. (2001, December 4). BBC News. From http://news.bbc.co.uk/2/hi/africa/1691565.stm.
Collignon, B., & Vézina, M. (2000). Independent water and sanitation providers in African cities: Full report of a ten-country study . Washington, DC: World Bank.
Datta, K. (1995). Strategies for urban survival? Women landlords in Gaborone, Botswana. Habitat International , 19 (1), 1–12.
de Soto, H. (2000). The mystery of capital: Why capitalism triumphs in the West and fails every-where else . New York: Basic Books.
Gilbert, A. (2003). Rental housing: An essential option for the urban poor in developing countries . Nairobi: UN-Habitat.
Gilbert, A., Mabin, A., McCarthy, M., & Watson, V. (1997). Low-income rental housing: Are South African cities different? Environment and Urbanization , 9 (1), 133–148.
Government of Kenya. (2003). Economic recovery strategy . Nairobi: Author. Gulyani, S., & Bassett, E. M. (2007). Retrieving the baby from the bathwater: Slum upgrading in
Sub-Saharan Africa. Environment and Planning C : Government and Policy , 25 (4), 486–515. Gulyani, S., Talukdar, D., & Mukami Kariuki, R. (2005). Universal (non)service? Water markets,
household demand and the poor in urban Kenya. Urban Studies , 42 (8), 1247–1274. Hansen, K. (1997). Keeping house in Lusaka . New York: Columbia University Press.
2238 Informal Rental Markets: The Low-Quality, High-Price Puzzle in Nairobi’s Slums
Huchzermeyer, M. (2006, July). Slum upgrading initiatives in Kenya within the basic services and wider housing market: A housing rights concern . Paper presented at the International Socio-logical Association conference, Durban, South Africa.
Kenya, Central Bureau of Statistics. (2002). The 1999 population and housing census: The popu-lar report. Nairobi: Author.
Kenya, Central Bureau of Statistics. (2003). Geographic dimensions of well-being in Kenya: Vol. 1. Where are the poor? From districts to locations. Ministry of Planning and National Develop-ment. Nairobi: Regal Press Kenya.
Kumar, S. (1996). Landlordism in third world urban low-income settlements: A case for further research. Urban Studies , 33 (4–5), 753–782.
Miraftab, F. (1997). Revisiting informal-sector home ownership: The relevance of household composition for housing options of the poor. International Journal of Urban and Regional Research , 21 (2), 303–322.
O’Connor, A. (1983). The African city . London: Hutchinson. Public notice. Preparation of local authority service delivery plan (LASDAP): Local authority
revenue and resource envelope. (2006, October 25). Daily Nation . Nairobi. Thompson, J., Porras, I. T., Wood, E., Tumwine, J. K., Mujwahuzi, M. R., Katui-Katua, M.,
et al. (2000). Waiting at the tap: Changes in urban water use in East Africa over three decades. Environment and Urbanization , 12 (2), 37–52.
UN-Habitat (United Nations Human Settlements Programme). (2002). A rapid economic appraisal of rents in slums and informal settlements. Prepared by P. Syagga, W. Mitullah & S. Karirah-Gitau as a Nairobi Situational Supplementary Study for the government of Kenya and UN-Habitat Collaborative Nairobi Slum Upgrading Initiative.
UN-Habitat. (2003). The challenge of slums: Global report on human settlements 2003 . London: Earthscan.
World Bank. (2001). Kenya: Review of the water supply and sanitation sector . (Report 22182-KE). Washington, DC: Author.
World Bank. (2003). Kenya: A policy agenda to restore growth . (Report 25840-KE). Africa Coun-try Department 2. Washington, DC: Author.
World Bank. (2006). Kenya: Inside informality—Poverty, jobs, housing and services in Nairobi’s slums . (Report 36347-KE). Africa Region, Water and Urban Unit 1. Washington, DC: Author.

“This page left intentionally blank.”
225
Slum formation is occurring at unprecedented rates. A report by the United Nations Human Settlements Programme (UN-Habitat, 2003) estimated the number of slum dwellers in 2001 at almost 1 billion, about 32% of the global urban population. While the representation of slum dwellers in the urban population varies across regions, there is no doubt that slum formation is a daunting problem. Slum dwellers account for 71.9% of the urban population in Sub-Saharan Africa, 58% in South-central Asia, 36.4% in East Asia, and 32% in Latin America and the Caribbean. UN Secretary General Kofi Annan, in his foreword to the UN-Habitat report, warned that “if no serious action is taken, the number of slum dwellers worldwide is pro-jected to rise over the next 30 years to about 2 billion” (p. v).
To address the growing problem of slum formation, many national and city governments as well as international financial institutions have programs aimed at reducing the rate of future slum formation and improving the lives of existing slum dwellers. The World Bank has disbursed US $14.3 billion in shelter lending over the past 30 years, spread over 278 projects with an average size of almost US $50 million in 2001 dollars (Buckley & Kalarickal, 2006). 1 The UN Millen-nium Development Goals include “Cities without Slums” as Target 11, which specifically calls for significant improvement in the lives of at least 100 million slum dwellers by 2020. While there is an urgent need to scale up interventions that improve the quality of life for slum dwellers, there is little clarity on the types of interventions that are most effective or the relative cost-effectiveness of different strategies.
1 The World Bank’s urban shelter lending portfolio has moved from project-based financing for sites and services and slum upgrading to include broader housing policy and housing finance loans.
S.V. Lall et al. (eds.), Urban Land Markets, DOI 10.1007/978-1-4020-8862-9_9 , © World Bank 2009
Chapter 9 Assessing Benefits of Slum Upgrading Programs in Second-Best Settings Basab Dasgupta and Somik V. Lall
B. Dasgupta ( ) Poverty Reduction and Economic Management Unit The World Bank Washington, DC 20433 , USA e-mail: [email protected]
226 B. Dasgupta and S. V. Lall
Over several decades the strategies of national governments and development agencies to achieve better living conditions for slum dwellers have included sites and services programs, resettlement in new housing developments, and land titling. Initially policies favored sites and services programs, which make it possible to provide infrastructure relatively cheaply on newly developed land. Sites and services programs had limited success, however, and a major reason for that was lack of access to housing finance for construction of the dwelling unit. Slum relocation programs also had limited success, achieving low reten-tion rates. With the persistence of large slum areas, and the realization that many slums could not be simply removed, slum upgrading projects have become more widespread.
Slum upgrading typically involves the provision of a package of basic services, which include clean water supply, sewage disposal, waste collection, housing, access roads, sidewalks, lighting, schools, health posts, and community centers. An important component of these programs is regularizing properties with inse-cure or unclear tenure. The underlying logic behind these interventions is that the poor cannot afford to make shelter improvements on their own because of income and credit constraints. The focus is on explicit interventions rather than on cash transfers because increases in disposable incomes for the poor may not trans-late into access to basic services for them. There can be several reasons for this, including limited empowerment of the poor (as a result, for example, of limited community cohesion and social networking among the poor) and time delays in expanding service coverage (resulting from information and coordination prob-lems, supply constraints in network expansion, and weak incentives for providers to improve performance).
There has been recent interest in evaluating the effectiveness of slum upgrad-ing programs as a way to identify strategies useful for improving the lives of slum dwellers. As part of this the World Bank commissioned a paper to provide guidance on how to estimate the impact of slum upgrading interventions (Field & Kremer, 2005). Related to this effort, several initiatives are collecting baseline data for use in setting up rigorous evaluations of project outcomes. The fly in the ointment is the assumption that interventions happen in first-best settings. Similarly, much of the ex ante cost-benefit estimation of these interventions assumes market clearing. Clearly, this is not the case in most developing countries, where there are preexist-ing distortions in both land markets (excessive zoning, development controls, and the like) and credit markets (higher loan rates). These preexisting distortions not only tend to reduce the cost-effectiveness of interventions but also may change the welfare rank ordering of interventions. Assessing the benefits of interventions with-out accounting for preexisting distortions may thus be misleading. The performance of in situ slum upgrading depends on how severe land and credit market distortions are and how complementary policy initiatives are being implemented to correct for these problems.
In this chapter we develop a dynamic general equilibrium model to compare the effectiveness of alternative instruments for improving the welfare of slum dwell-ers in a second-best setting with distortions in the land and credit markets. With
2279 Assessing Benefits of Slum Upgrading Programs in Second-Best Settings
four decision-making agents in our economy—households, developers, financial institutions, and the government—we analyze how land or credit market distor-tions alter the rankings of different policy instruments. We also test the effects of building caps and infrastructure bottlenecks and get similar results. For the sake of brevity, however, we do not include those findings here. For the analysis we lay out the residential location problem for poor urban households and analyze three types of interventions: improvements in land, in infrastructure, and in building quality. 2
To illustrate the analytical problem, we use examples from three Brazilian cit-ies—Brasília, Curitiba, and Recife—for which data have been collected in recent studies. The analytical strategy is general, however, and can be applied to a wide range of cities. We find that the presence of preexisting land supply and credit mar-ket distortions reduces the benefit-cost ratios across interventions and changes the rank ordering of preferences across types of upgrading packages. In the light of these findings it appears that partial equilibrium analysis used in a typical cost-benefit setup (which does not address preexisting distortions) may be overstating the stream of net benefits from interventions and may in fact propose a mislead-ing sequence of interventions. These findings are consistent with research in envi-ronmental economics (Bovenburg & Goulder, 1996; Parry & Oates, 1998) and public finance (Ballard & Fullerton, 1992; Wildasin, 1984), which suggests that the presence of preexisting distortions changes the welfare impacts of new policy instruments.
The analysis is particularly relevant for Brazil, which has more than 1.3 million substandard housing units, 80% of them in metropolitan areas (World Bank, 2002). In February 2000 the Brazilian government amended the Constitution to recognize housing as a social right (Constitutional Amendment 26). The three-tier government support structure, with the federal government at the helm, made the Ministry of Cities the agency responsible for establishing a national housing policy. The assur-ance of housing rights encompasses access to land tenure, basic public services, and financial services.
9.1 Baseline Model
In this section we develop a general equilibrium model to examine the effectiveness of alternative slum upgrading policy instruments that can be used to improve house-hold welfare. In Sect. 9.2 we first evaluate how these interventions perform in first-best settings and then examine the effects of preexisting institutional and regulatory
2 Bertaud and Brueckner (2005) examine the welfare implications of one particular land market distortion, the floor area ratio, arguing that this regulation encourages sprawl and increases com-muting costs for edge residents.
228 B. Dasgupta and S. V. Lall
constraints on their effectiveness and relative rankings. These constraints include land supply constraints, 3 infrastructure bottlenecks, and credit constraints.
We start with the assumption of a monocentric, closed city with no population growth. The model has four economic agents: households, developers, financial intermediaries, and the city government.
9.1.1 Households
We consider H infinitely lived representative households. Each of them maximizes its lifetime utility by consuming a composite good subject to a budget constraint. In period t each household earns a fixed wage income and distributes it between con-sumption and savings ( S t ) in period t . The composite consumption good in period t consists of nonhousing consumption ( C t ) and housing ( H t , a bundle of housing attributes that include the dwelling unit, infrastructure attributes, and neighbor-hood quality). We assume that each household consumes one unit of housing with specific attributes. These attributes are based on the household’s hedonic prefer-ences for building structure ( B t ) and land area ( L t ) per house, with particular loca-tion attributes such as infrastructure amenities ( A t ) and distance ( D t ) from the city center. 4
We assume that, with a given income ( w t ) and nonhousing consumption ( C t ), each household tries to improve the present quality of housing attributes ( q t ) over the previous period ( q t 1 ).
5 By definition, the quality of housing is determined by the combination of different attributes present in a house. Therefore, other things being equal, each household can improve the quality of housing by improving any of these attributes. This implies that each household, given the budget constraint, can determine its optimal demand for housing on the basis of its preferred combina-tion of these attributes. The government usually steps in to assist when poor house-holds are unable to afford to make improvements. Government programs for slum upgrading aim to improve either housing services or infrastructure to at least main-tain the previous quality level. We assume that the government makes a transfer payment, T t , to these poor households to cover their housing quality improvements.
3 The increase in informal housing units in Brazil between 1991 and 1998, shown in a World Bank report (2002, p. 16) on the basis of National Household Sample Survey (PNAD) data from the Brazilian Institute of Geography and Statistics (IBGE), reflects the extent of the housing deficit in that country. The World Bank report indicates that among ten metropolitan regions, seven are reported to have had an increase of more than 50% in the housing deficit, with Recife experiencing an increase of 52.8% and Curitiba an increase of 143.4%. This stylized fact supports our assump-tion of a supply-side bottleneck in the housing market. 4 For details on hedonic estimation, see Clapham, Englund, Quigley, and Redfearn (2004); Mayo (1986); Mills and Simenauer (1996); Reiff and Barbosa (2005); Wolverton and Senteza (2000). 5 Similar to the hedonic pricing literature (see Clapham et al., 2004 for details), we incorporate the representative or standard dwelling quality ( q t 1 ) for comparison. This standard can be set by households themselves, with no government intervention, or, when necessary, by government as the social planner.
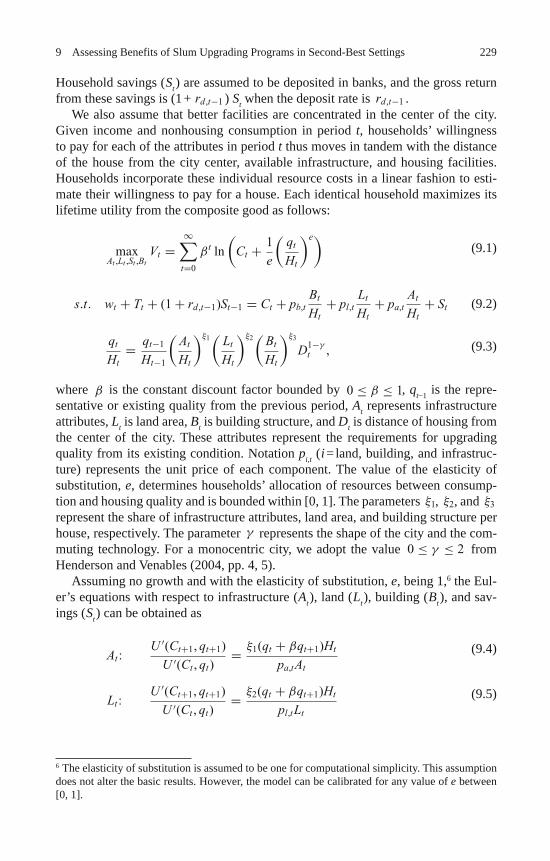
2299 Assessing Benefits of Slum Upgrading Programs in Second-Best Settings
Household savings ( S t ) are assumed to be deposited in banks, and the gross return from these savings is (1 + rd,t−1 ) S t when the deposit rate is rd,t−1 . We also assume that better facilities are concentrated in the center of the city. Given income and nonhousing consumption in period t , households’ willingness to pay for each of the attributes in period t thus moves in tandem with the distance of the house from the city center, available infrastructure, and housing facilities. Households incorporate these individual resource costs in a linear fashion to esti-mate their willingness to pay for a house. Each identical household maximizes its lifetime utility from the composite good as follows:
max
At ,Lt ,St ,BtVt =
∞∑t=0
β t ln
(Ct + 1
e
(qt
Ht
)e) (9.1)
s.t. wt + Tt + (1+ rd,t−1)St−1 = Ct + pb,t
Bt
Ht+ pl,t
Lt
Ht+ pa,t
At
Ht+ St
(9.2)
qt
Ht= qt−1
Ht−1
(At
Ht
)ξ1(
Lt
Ht
)ξ2(
Bt
Ht
)ξ3
D1−γt ,
(9.3)
where β is the constant discount factor bounded by 0 ≤ β ≤ 1 , q t 1 is the repre-sentative or existing quality from the previous period, A t represents infrastructure attributes, L t is land area, B t is building structure, and D t is distance of housing from the center of the city. These attributes represent the requirements for upgrading quality from its existing condition. Notation p i,t ( i = land, building, and infrastruc-ture) represents the unit price of each component. The value of the elasticity of substitution, e , determines households’ allocation of resources between consump-tion and housing quality and is bounded within [0, 1]. The parameters ξ1 , ξ2 , and ξ3 represent the share of infrastructure attributes, land area, and building structure per house, respectively. The parameter γ represents the shape of the city and the com-muting technology. For a monocentric city, we adopt the value 0 ≤ γ ≤ 2 from Henderson and Venables (2004, pp. 4, 5).
Assuming no growth and with the elasticity of substitution, e , being 1, 6 the Eul-er’s equations with respect to infrastructure ( A t ), land ( L t ), building ( B t ), and sav-ings ( S t ) can be obtained as
At :
U ′(Ct+1, qt+1)
U ′(Ct , qt)= ξ1(qt + βqt+1)Ht
pa,tAt
(9.4)
Lt :
U ′(Ct+1, qt+1)
U ′(Ct , qt)= ξ2(qt + βqt+1)Ht
pl,tLt
(9.5)
6 The elasticity of substitution is assumed to be one for computational simplicity. This assumption does not alter the basic results. However, the model can be calibrated for any value of e between [0, 1].
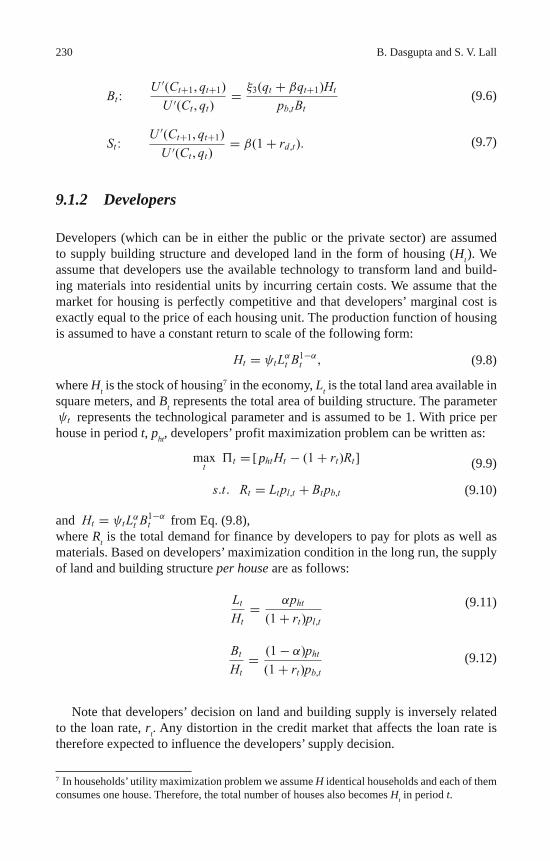
230 B. Dasgupta and S. V. Lall
Bt :U ′(Ct+1, qt+1)
U ′(Ct , qt)= ξ3(qt + βqt+1)Ht
pb,tBt
(9.6)
St :U ′(Ct+1, qt+1)
U ′(Ct , qt)= β(1+ rd,t). (9.7)
9.1.2 Developers
Developers (which can be in either the public or the private sector) are assumed to supply building structure and developed land in the form of housing ( H t ). We assume that developers use the available technology to transform land and build-ing materials into residential units by incurring certain costs. We assume that the market for housing is perfectly competitive and that developers’ marginal cost is exactly equal to the price of each housing unit. The production function of housing is assumed to have a constant return to scale of the following form:
Ht = ψtL
αt B1−α
t , (9.8) where H t is the stock of housing 7 in the economy, L t is the total land area available in square meters, and B t represents the total area of building structure. The parameter ψt represents the technological parameter and is assumed to be 1. With price per house in period t , p ht , developers’ profit maximization problem can be written as:
maxt
t = [ phtHt − (1+ rt)Rt] (9.9)
s.t. Rt = Ltpl,t + Btpb,t (9.10)
and Ht = ψtLαt B1−α
t from Eq. (9.8), where R t is the total demand for finance by developers to pay for plots as well as materials. Based on developers’ maximization condition in the long run, the supply of land and building structure per house are as follows:
Lt
Ht= αpht
(1+ rt)pl,t
(9.11)
Bt
Ht= (1− α)pht
(1+ rt)pb,t
(9.12)
Note that developers’ decision on land and building supply is inversely related
to the loan rate, r t . Any distortion in the credit market that affects the loan rate is therefore expected to influence the developers’ supply decision.
7 In households’ utility maximization problem we assume H identical households and each of them consumes one house. Therefore, the total number of houses also becomes H t in period t .
2319 Assessing Benefits of Slum Upgrading Programs in Second-Best Settings
9.1.3 Financial Intermediaries
We assume banks to be financial intermediaries that maximize profit in a perfectly competitive environment. Banks convert all their deposits from households into loans to developers without any friction. In return they charge a loan rate r t . In the absence of any binding constraint in the first-best situation, banks’ profit maximiza-tion problem can be stated as
maxRt
Bt = rtRt − rd,tSt (9.13)
s.t. Rt = St .
With zero profit condition in the long run, we get
rt = rd,t , (9.14)
where r t is the loan rate, S t is the total savings with banks, and r d,t is the deposit rate.
For our analysis of the first-best setting, we assume that there is no binding constraint in the credit market and that total loans created are equal to total deposits with banks. However, we later calibrate our model by introducing binding con-straints in the credit market to make the model more general and more compatible with our objective. In that situation we assume that as a result of insufficient funds, the supply of loans does not match the total demand for loans. 8
Under constraint optimization in our calibration, we assume that banks’ total supply of loans is a fraction, ω , of the total demand such that St = ωRt with ω
between [0, 1]. Unlike in the unconstrained world or first-best setting (where ω = 1), the loan rate becomes higher under more stringent values of ω < 1.
9.1.4 The Government
The source of revenue for the city government is a three-tier system. 9 The city gov-ernment collects part of its revenue from infrastructure facilities ( A t ) provided to households in the previous period. In addition, at the beginning of each period the city government receives some exogenous funding ( G t ) from the state and central
8 This assumption is relevant for Brazil as well as for most other developing countries. According to a World Bank report (2002), Brazil’s Housing Finance System could meet only 27% of the total demand for loans of US $23.7 million in 1964–1996. This source also reports defaults in 30% of cases during this period. 9 We take this three-tier system to represent the three-tier government support structure in Brazil.
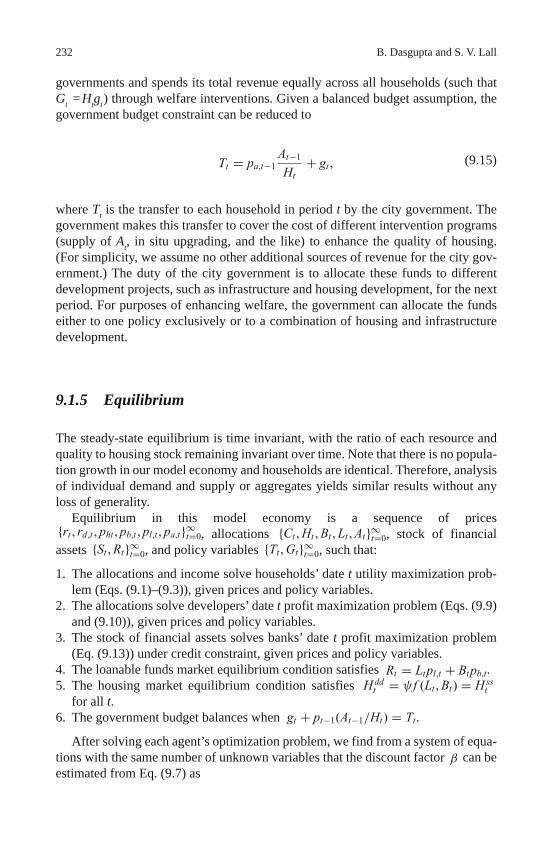
232 B. Dasgupta and S. V. Lall
governments and spends its total revenue equally across all households (such that G t = H t g t ) through welfare interventions. Given a balanced budget assumption, the government budget constraint can be reduced to
Tt = pa,t−1At−1
Ht+ gt ,
(9.15)
where T t is the transfer to each household in period t by the city government. The government makes this transfer to cover the cost of different intervention programs (supply of A t , in situ upgrading, and the like) to enhance the quality of housing. (For simplicity, we assume no other additional sources of revenue for the city gov-ernment.) The duty of the city government is to allocate these funds to different development projects, such as infrastructure and housing development, for the next period. For purposes of enhancing welfare, the government can allocate the funds either to one policy exclusively or to a combination of housing and infrastructure development.
9.1.5 Equilibrium
The steady-state equilibrium is time invariant, with the ratio of each resource and quality to housing stock remaining invariant over time. Note that there is no popula-tion growth in our model economy and households are identical. Therefore, analysis of individual demand and supply or aggregates yields similar results without any loss of generality.
Equilibrium in this model economy is a sequence of prices {rt , rd,t , pht , pb,t , pl,t , pa,t}∞t=0 , allocations {Ct , Ht , Bt , Lt , At}∞t=0 , stock of financial assets {St , Rt}∞t=0 , and policy variables {Tt , Gt}∞t=0 , such that:
1. The allocations and income solve households’ date t utility maximization prob-lem (Eqs. (9.1)–(9.3)), given prices and policy variables.
2. The allocations solve developers’ date t profit maximization problem (Eqs. (9.9) and (9.10)), given prices and policy variables.
3. The stock of financial assets solves banks’ date t profit maximization problem (Eq. (9.13)) under credit constraint, given prices and policy variables.
4. The loanable funds market equilibrium condition satisfies Rt = Ltpl,t + Btpb,t . 5. The housing market equilibrium condition satisfies H ddt = ψ f (Lt , Bt) = H ss
t for all t . 6. The government budget balances when gt + pt−1(At−1/Ht) = Tt .
After solving each agent’s optimization problem, we find from a system of equa-tions with the same number of unknown variables that the discount factor β can be estimated from Eq. (9.7) as
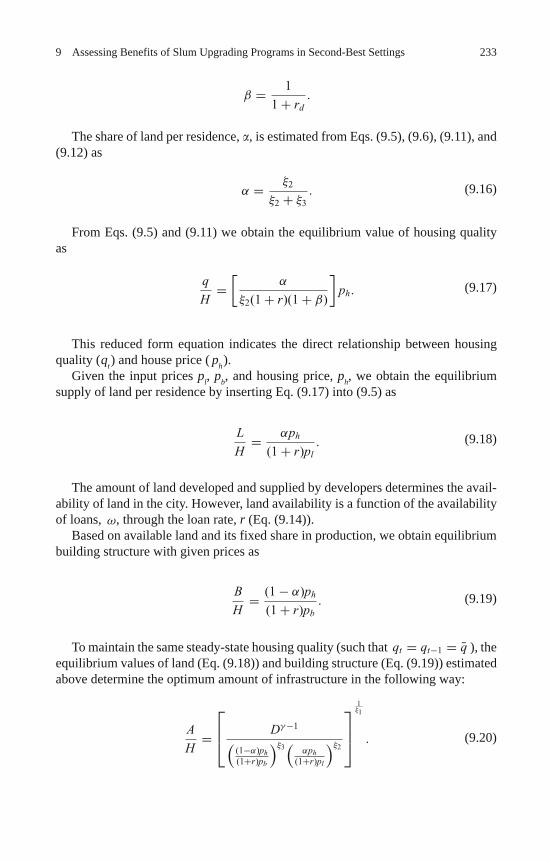
2339 Assessing Benefits of Slum Upgrading Programs in Second-Best Settings
β = 1
1+ rd.
The share of land per residence, � , is estimated from Eqs. (9.5), (9.6), (9.11), and (9.12) as
α = ξ2
ξ2 + ξ3.
(9.16)
From Eqs. (9.5) and (9.11) we obtain the equilibrium value of housing quality as
q
H=[
α
ξ2(1+ r)(1+ β)
]ph.
(9.17)
This reduced form equation indicates the direct relationship between housing quality ( q t ) and house price ( p h ).
Given the input prices p l , p b , and housing price, p h , we obtain the equilibrium supply of land per residence by inserting Eq. (9.17) into (9.5) as
L
H= αph
(1+ r)pl.
(9.18)
The amount of land developed and supplied by developers determines the avail-ability of land in the city. However, land availability is a function of the availability of loans, ω , through the loan rate, r (Eq. (9.14)).
Based on available land and its fixed share in production, we obtain equilibrium building structure with given prices as
B
H= (1− α)ph
(1+ r)pb.
(9.19)
To maintain the same steady-state housing quality (such that qt = qt−1 = q̄ ), the equilibrium values of land (Eq. (9.18)) and building structure (Eq. (9.19)) estimated above determine the optimum amount of infrastructure in the following way:
A
H=⎡⎢⎣ Dγ−1(
(1−α)ph(1+r)pb
)ξ3(
αph(1+r)pl
)ξ2
⎤⎥⎦
1ξ1
.
(9.20)
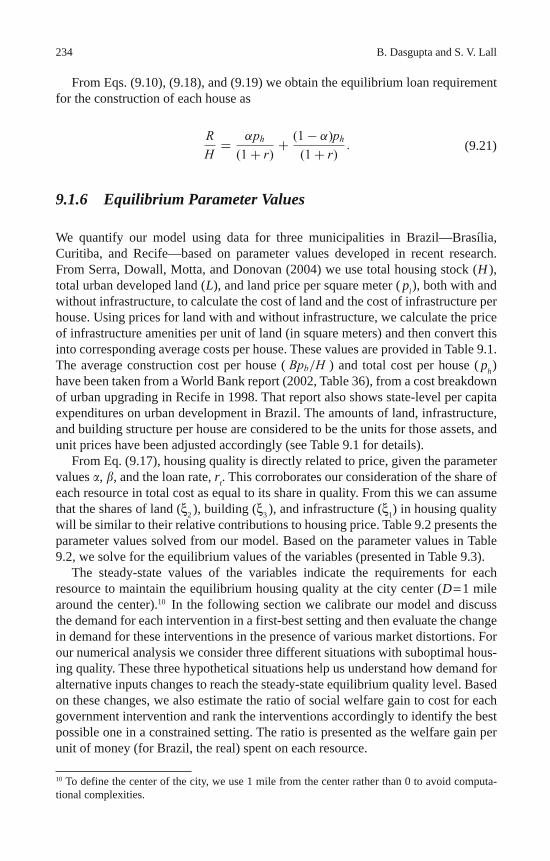
234 B. Dasgupta and S. V. Lall
From Eqs. (9.10), (9.18), and (9.19) we obtain the equilibrium loan requirement for the construction of each house as
R
H= αph
(1+ r)+ (1− α)ph
(1+ r). (9.21)
9.1.6 Equilibrium Parameter Values
We quantify our model using data for three municipalities in Brazil—Brasília, Curitiba, and Recife—based on parameter values developed in recent research. From Serra, Dowall, Motta, and Donovan (2004) we use total housing stock ( H ), total urban developed land ( L ), and land price per square meter ( p l ), both with and without infrastructure, to calculate the cost of land and the cost of infrastructure per house. Using prices for land with and without infrastructure, we calculate the price of infrastructure amenities per unit of land (in square meters) and then convert this into corresponding average costs per house. These values are provided in Table 9.1. The average construction cost per house ( Bpb/H ) and total cost per house ( p h ) have been taken from a World Bank report (2002, Table 36), from a cost breakdown of urban upgrading in Recife in 1998. That report also shows state-level per capita expenditures on urban development in Brazil. The amounts of land, infrastructure, and building structure per house are considered to be the units for those assets, and unit prices have been adjusted accordingly (see Table 9.1 for details).
From Eq. (9.17), housing quality is directly related to price, given the parameter values � , � , and the loan rate, r t . This corroborates our consideration of the share of each resource in total cost as equal to its share in quality. From this we can assume that the shares of land ( ξ 2 ), building ( ξ 3 ), and infrastructure ( ξ 1 ) in housing quality will be similar to their relative contributions to housing price. Table 9.2 presents the parameter values solved from our model. Based on the parameter values in Table 9.2, we solve for the equilibrium values of the variables (presented in Table 9.3).
The steady-state values of the variables indicate the requirements for each resource to maintain the equilibrium housing quality at the city center ( D = 1 mile around the center). 10 In the following section we calibrate our model and discuss the demand for each intervention in a first-best setting and then evaluate the change in demand for these interventions in the presence of various market distortions. For our numerical analysis we consider three different situations with suboptimal hous-ing quality. These three hypothetical situations help us understand how demand for alternative inputs changes to reach the steady-state equilibrium quality level. Based on these changes, we also estimate the ratio of social welfare gain to cost for each government intervention and rank the interventions accordingly to identify the best possible one in a constrained setting. The ratio is presented as the welfare gain per unit of money (for Brazil, the real) spent on each resource.
10 To define the center of the city, we use 1 mile from the center rather than 0 to avoid computa-tional complexities.
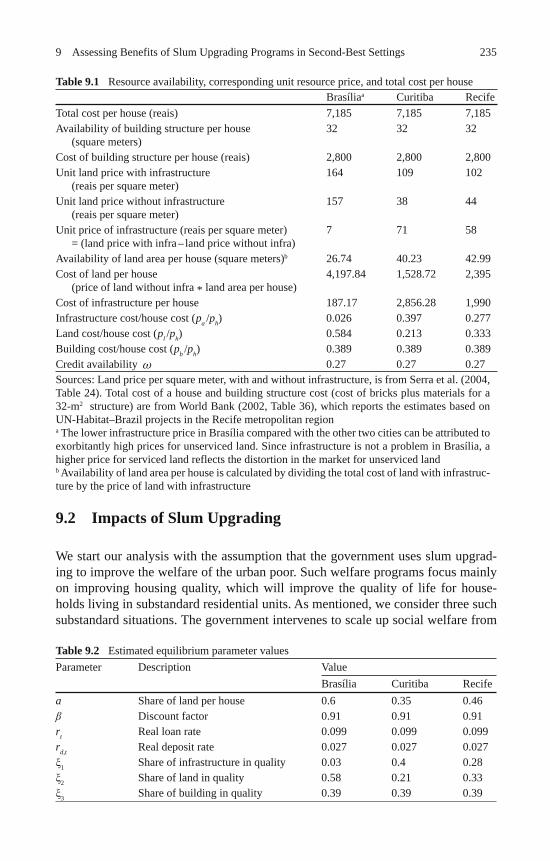
2359 Assessing Benefits of Slum Upgrading Programs in Second-Best Settings
9.2 Impacts of Slum Upgrading
We start our analysis with the assumption that the government uses slum upgrad-ing to improve the welfare of the urban poor. Such welfare programs focus mainly on improving housing quality, which will improve the quality of life for house-holds living in substandard residential units. As mentioned, we consider three such substandard situations. The government intervenes to scale up social welfare from
Table 9.1 Resource availability, corresponding unit resource price, and total cost per house Brasília a Curitiba Recife
Total cost per house (reais) 7,185 7,185 7,185 Availability of building structure per house
(square meters) 32 32 32
Cost of building structure per house (reais) 2,800 2,800 2,800 Unit land price with infrastructure
(reais per square meter) 164 109 102
Unit land price without infrastructure (reais per square meter)
157 38 44
Unit price of infrastructure (reais per square meter) = (land price with infra – land price without infra)
7 71 58
Availability of land area per house (square meters) b 26.74 40.23 42.99 Cost of land per house
(price of land without infra * land area per house) 4,197.84 1,528.72 2,395
Cost of infrastructure per house 187.17 2,856.28 1,990 Infrastructure cost/house cost ( p a / p h ) 0.026 0.397 0.277 Land cost/house cost ( p l / p h ) 0.584 0.213 0.333 Building cost/house cost ( p b / p h ) 0.389 0.389 0.389 Credit availability ω
0.27 0.27 0.27 Sources: Land price per square meter, with and without infrastructure, is from Serra et al. (2004, Table 24). Total cost of a house and building structure cost (cost of bricks plus materials for a 32-m 2 structure) are from World Bank (2002, Table 36), which reports the estimates based on UN-Habitat–Brazil projects in the Recife metropolitan region a The lower infrastructure price in Brasília compared with the other two cities can be attributed to exorbitantly high prices for unserviced land. Since infrastructure is not a problem in Brasília, a higher price for serviced land reflects the distortion in the market for unserviced land b Availability of land area per house is calculated by dividing the total cost of land with infrastruc-ture by the price of land with infrastructure
Table 9.2 Estimated equilibrium parameter values Parameter Description Value
Brasília Curitiba Recife a Share of land per house 0.6 0.35 0.46 Discount factor 0.91 0.91 0.91 r t Real loan rate 0.099 0.099 0.099 r d,t Real deposit rate 0.027 0.027 0.027 1 Share of infrastructure in quality 0.03 0.4 0.28 2 Share of land in quality 0.58 0.21 0.33 3 Share of building in quality 0.39 0.39 0.39
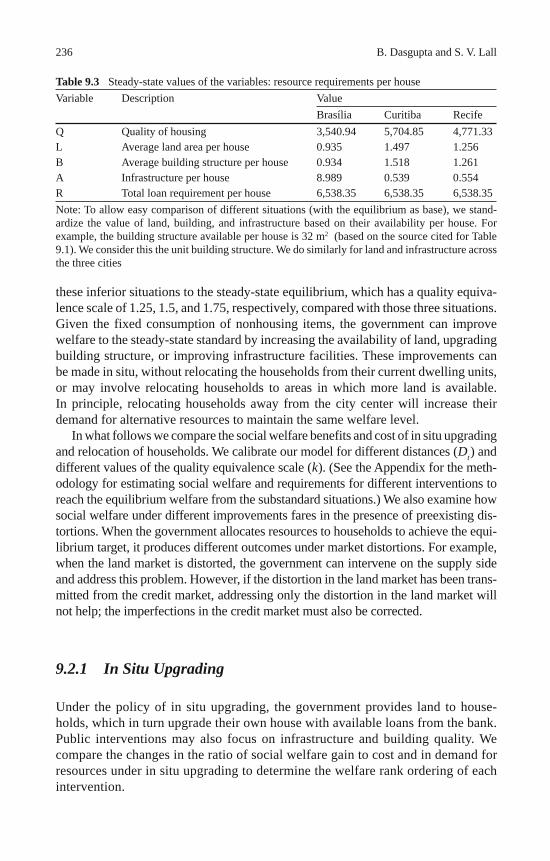
236 B. Dasgupta and S. V. Lall
these inferior situations to the steady-state equilibrium, which has a quality equiva-lence scale of 1.25, 1.5, and 1.75, respectively, compared with those three situations. Given the fixed consumption of nonhousing items, the government can improve welfare to the steady-state standard by increasing the availability of land, upgrading building structure, or improving infrastructure facilities. These improvements can be made in situ, without relocating the households from their current dwelling units, or may involve relocating households to areas in which more land is available. In principle, relocating households away from the city center will increase their demand for alternative resources to maintain the same welfare level.
In what follows we compare the social welfare benefits and cost of in situ upgrading and relocation of households. We calibrate our model for different distances ( D t ) and different values of the quality equivalence scale ( k ). (See the Appendix for the meth-odology for estimating social welfare and requirements for different interventions to reach the equilibrium welfare from the substandard situations.) We also examine how social welfare under different improvements fares in the presence of preexisting dis-tortions. When the government allocates resources to households to achieve the equi-librium target, it produces different outcomes under market distortions. For example, when the land market is distorted, the government can intervene on the supply side and address this problem. However, if the distortion in the land market has been trans-mitted from the credit market, addressing only the distortion in the land market will not help; the imperfections in the credit market must also be corrected.
9.2.1 In Situ Upgrading
Under the policy of in situ upgrading, the government provides land to house-holds, which in turn upgrade their own house with available loans from the bank. Public interventions may also focus on infrastructure and building quality. We compare the changes in the ratio of social welfare gain to cost and in demand for resources under in situ upgrading to determine the welfare rank ordering of each intervention.
Table 9.3 Steady-state values of the variables: resource requirements per house Variable Description Value
Brasília Curitiba Recife Q Quality of housing 3,540.94 5,704.85 4,771.33 L Average land area per house 0.935 1.497 1.256 B Average building structure per house 0.934 1.518 1.261 A Infrastructure per house 8.989 0.539 0.554 R Total loan requirement per house 6,538.35 6,538.35 6,538.35 Note: To allow easy comparison of different situations (with the equilibrium as base), we stand-ardize the value of land, building, and infrastructure based on their availability per house. For example, the building structure available per house is 32 m 2 (based on the source cited for Table 9.1). We consider this the unit building structure. We do similarly for land and infrastructure across the three cities
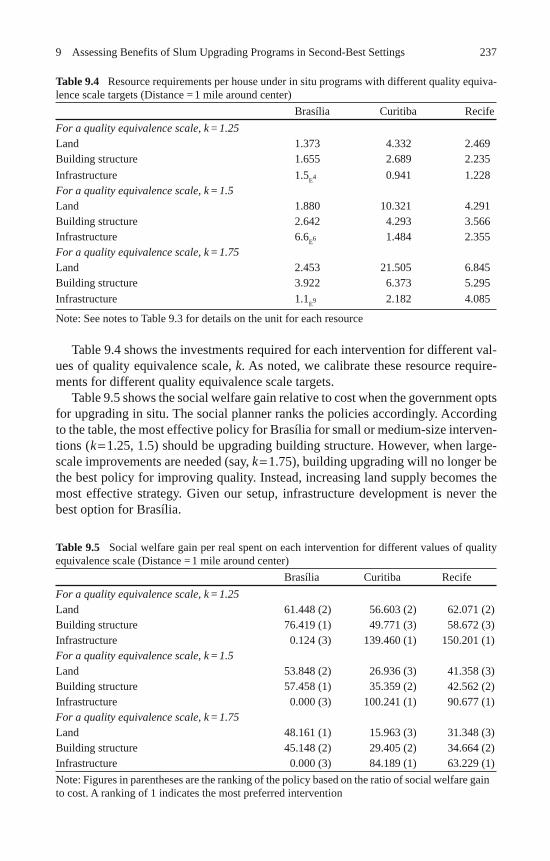
2379 Assessing Benefits of Slum Upgrading Programs in Second-Best Settings
Table 9.4 shows the investments required for each intervention for different val-ues of quality equivalence scale, k . As noted, we calibrate these resource require-ments for different quality equivalence scale targets.
Table 9.5 shows the social welfare gain relative to cost when the government opts for upgrading in situ. The social planner ranks the policies accordingly. According to the table, the most effective policy for Brasília for small or medium-size interven-tions ( k = 1.25, 1.5) should be upgrading building structure. However, when large-scale improvements are needed (say, k = 1.75), building upgrading will no longer be the best policy for improving quality. Instead, increasing land supply becomes the most effective strategy. Given our setup, infrastructure development is never the best option for Brasília.
Table 9.4 Resource requirements per house under in situ programs with different quality equiva-lence scale targets (Distance = 1 mile around center) Brasília Curitiba Recife For a quality equivalence scale, k = 1.25 Land 1.373 4.332 2.469 Building structure 1.655 2.689 2.235 Infrastructure 1.5 E 4 0.941 1.228 For a quality equivalence scale, k = 1.5 Land 1.880 10.321 4.291 Building structure 2.642 4.293 3.566 Infrastructure 6.6 E 6 1.484 2.355 For a quality equivalence scale, k = 1.75 Land 2.453 21.505 6.845 Building structure 3.922 6.373 5.295 Infrastructure 1.1 E 9 2.182 4.085
Note: See notes to Table 9.3 for details on the unit for each resource
Table 9.5 Social welfare gain per real spent on each intervention for different values of quality equivalence scale (Distance = 1 mile around center) Brasília Curitiba Recife For a quality equivalence scale, k = 1.25 Land 61.448 (2) 56.603 (2) 62.071 (2) Building structure 76.419 (1) 49.771 (3) 58.672 (3) Infrastructure 0.124 (3) 139.460 (1) 150.201 (1) For a quality equivalence scale, k = 1.5 Land 53.848 (2) 26.936 (3) 41.358 (3) Building structure 57.458 (1) 35.359 (2) 42.562 (2) Infrastructure 0.000 (3) 100.241 (1) 90.677 (1) For a quality equivalence scale, k = 1.75 Land 48.161 (1) 15.963 (3) 31.348 (3) Building structure 45.148 (2) 29.405 (2) 34.664 (2) Infrastructure 0.000 (3) 84.189 (1) 63.229 (1) Note: Figures in parentheses are the ranking of the policy based on the ratio of social welfare gain to cost. A ranking of 1 indicates the most preferred intervention
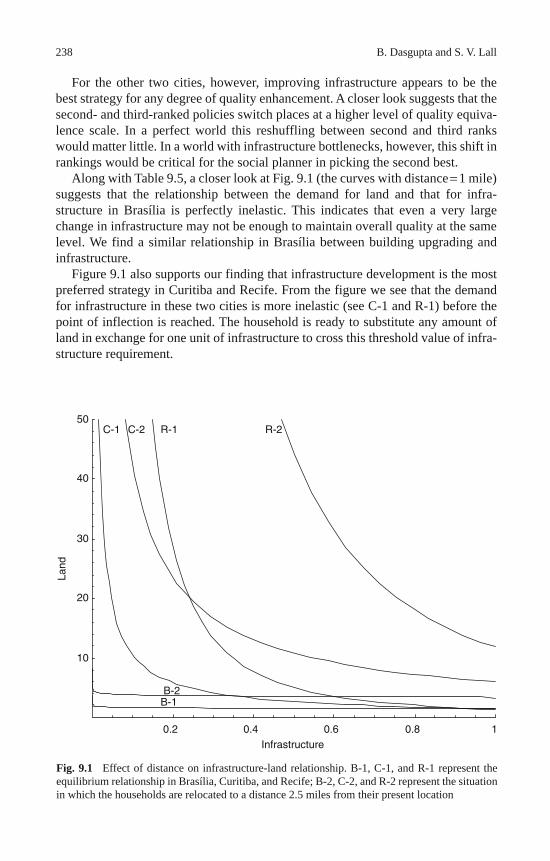
238 B. Dasgupta and S. V. Lall
For the other two cities, however, improving infrastructure appears to be the best strategy for any degree of quality enhancement. A closer look suggests that the second- and third-ranked policies switch places at a higher level of quality equiva-lence scale. In a perfect world this reshuffling between second and third ranks would matter little. In a world with infrastructure bottlenecks, however, this shift in rankings would be critical for the social planner in picking the second best.
Along with Table 9.5, a closer look at Fig. 9.1 (the curves with distance = 1 mile) suggests that the relationship between the demand for land and that for infra-structure in Brasília is perfectly inelastic. This indicates that even a very large change in infrastructure may not be enough to maintain overall quality at the same level. We find a similar relationship in Brasília between building upgrading and infrastructure.
Figure 9.1 also supports our finding that infrastructure development is the most preferred strategy in Curitiba and Recife. From the figure we see that the demand for infrastructure in these two cities is more inelastic (see C-1 and R-1) before the point of inflection is reached. The household is ready to substitute any amount of land in exchange for one unit of infrastructure to cross this threshold value of infra-structure requirement.
Fig. 9.1 Effect of distance on infrastructure-land relationship. B-1, C-1, and R-1 represent the equilibrium relationship in Brasília, Curitiba, and Recife; B-2, C-2, and R-2 represent the situation in which the households are relocated to a distance 2.5 miles from their present location
0.2 0.4 0.6 0.8 1Infrastructure
10
20
30
40
50
Land
B-1B-2
C-2 R-1C-1 R-2
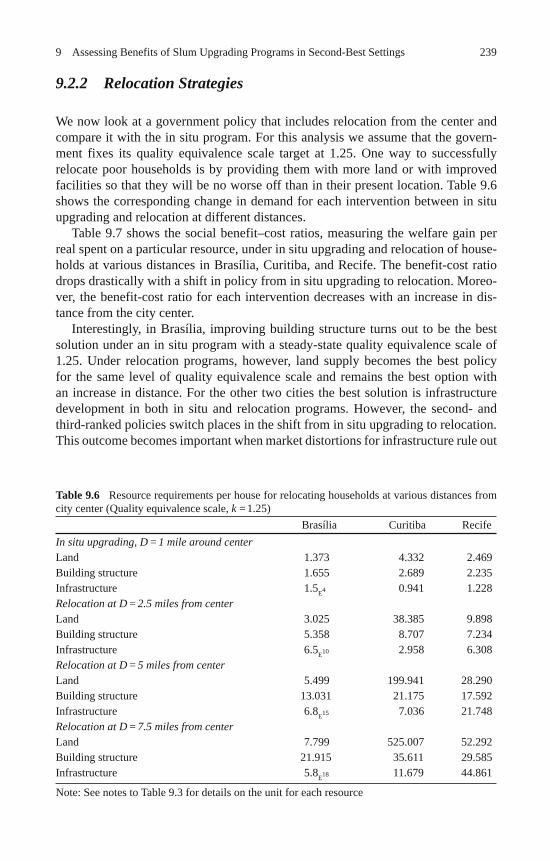
2399 Assessing Benefits of Slum Upgrading Programs in Second-Best Settings
9.2.2 Relocation Strategies
We now look at a government policy that includes relocation from the center and compare it with the in situ program. For this analysis we assume that the govern-ment fixes its quality equivalence scale target at 1.25. One way to successfully relocate poor households is by providing them with more land or with improved facilities so that they will be no worse off than in their present location. Table 9.6 shows the corresponding change in demand for each intervention between in situ upgrading and relocation at different distances.
Table 9.7 shows the social benefit–cost ratios, measuring the welfare gain per real spent on a particular resource, under in situ upgrading and relocation of house-holds at various distances in Brasília, Curitiba, and Recife. The benefit-cost ratio drops drastically with a shift in policy from in situ upgrading to relocation. Moreo-ver, the benefit-cost ratio for each intervention decreases with an increase in dis-tance from the city center.
Interestingly, in Brasília, improving building structure turns out to be the best solution under an in situ program with a steady-state quality equivalence scale of 1.25. Under relocation programs, however, land supply becomes the best policy for the same level of quality equivalence scale and remains the best option with an increase in distance. For the other two cities the best solution is infrastructure development in both in situ and relocation programs. However, the second- and third-ranked policies switch places in the shift from in situ upgrading to relocation. This outcome becomes important when market distortions for infrastructure rule out
Table 9.6 Resource requirements per house for relocating households at various distances from city center (Quality equivalence scale, k = 1.25) Brasília Curitiba Recife In situ upgrading, D = 1 mile around center Land 1.373 4.332 2.469 Building structure 1.655 2.689 2.235 Infrastructure 1.5 E 4 0.941 1.228 Relocation at D = 2.5 miles from center Land 3.025 38.385 9.898 Building structure 5.358 8.707 7.234 Infrastructure 6.5 E 10 2.958 6.308 Relocation at D = 5 miles from center Land 5.499 199.941 28.290 Building structure 13.031 21.175 17.592 Infrastructure 6.8 E 15 7.036 21.748 Relocation at D = 7.5 miles from center Land 7.799 525.007 52.292 Building structure 21.915 35.611 29.585 Infrastructure 5.8 E 18 11.679 44.861
Note: See notes to Table 9.3 for details on the unit for each resource
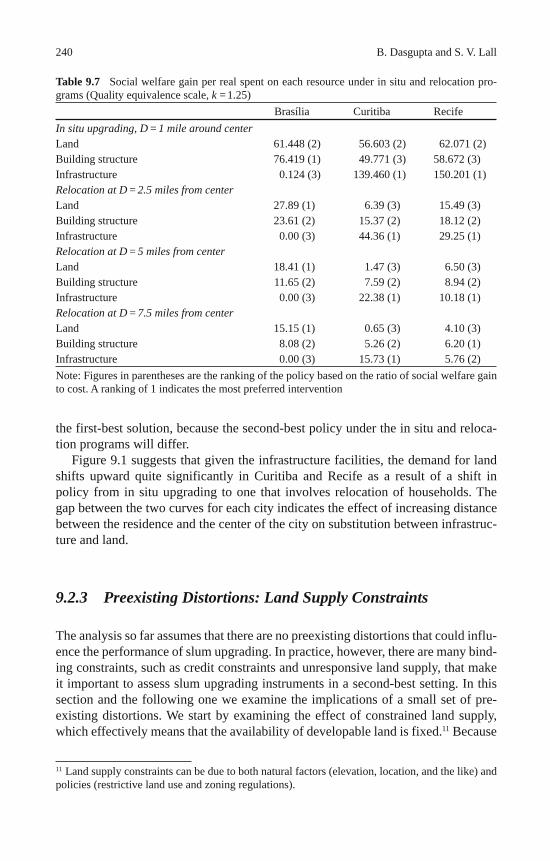
240 B. Dasgupta and S. V. Lall
the first-best solution, because the second-best policy under the in situ and reloca-tion programs will differ.
Figure 9.1 suggests that given the infrastructure facilities, the demand for land shifts upward quite significantly in Curitiba and Recife as a result of a shift in policy from in situ upgrading to one that involves relocation of households. The gap between the two curves for each city indicates the effect of increasing distance between the residence and the center of the city on substitution between infrastruc-ture and land.
9.2.3 Preexisting Distortions: Land Supply Constraints
The analysis so far assumes that there are no preexisting distortions that could influ-ence the performance of slum upgrading. In practice, however, there are many bind-ing constraints, such as credit constraints and unresponsive land supply, that make it important to assess slum upgrading instruments in a second-best setting. In this section and the following one we examine the implications of a small set of pre-existing distortions. We start by examining the effect of constrained land supply, which effectively means that the availability of developable land is fixed. 11 Because
11 Land supply constraints can be due to both natural factors (elevation, location, and the like) and policies (restrictive land use and zoning regulations).
Table 9.7 Social welfare gain per real spent on each resource under in situ and relocation pro-grams (Quality equivalence scale, k = 1.25) Brasília Curitiba Recife In situ upgrading, D = 1 mile around center Land 61.448 (2) 56.603 (2) 62.071 (2) Building structure 76.419 (1) 49.771 (3) 58.672 (3) Infrastructure 0.124 (3) 139.460 (1) 150.201 (1) Relocation at D = 2.5 miles from center Land 27.89 (1) 6.39 (3) 15.49 (3) Building structure 23.61 (2) 15.37 (2) 18.12 (2) Infrastructure 0.00 (3) 44.36 (1) 29.25 (1) Relocation at D = 5 miles from center Land 18.41 (1) 1.47 (3) 6.50 (3) Building structure 11.65 (2) 7.59 (2) 8.94 (2) Infrastructure 0.00 (3) 22.38 (1) 10.18 (1) Relocation at D = 7.5 miles from center Land 15.15 (1) 0.65 (3) 4.10 (3) Building structure 8.08 (2) 5.26 (2) 6.20 (1) Infrastructure 0.00 (3) 15.73 (1) 5.76 (2) Note: Figures in parentheses are the ranking of the policy based on the ratio of social welfare gain to cost. A ranking of 1 indicates the most preferred intervention
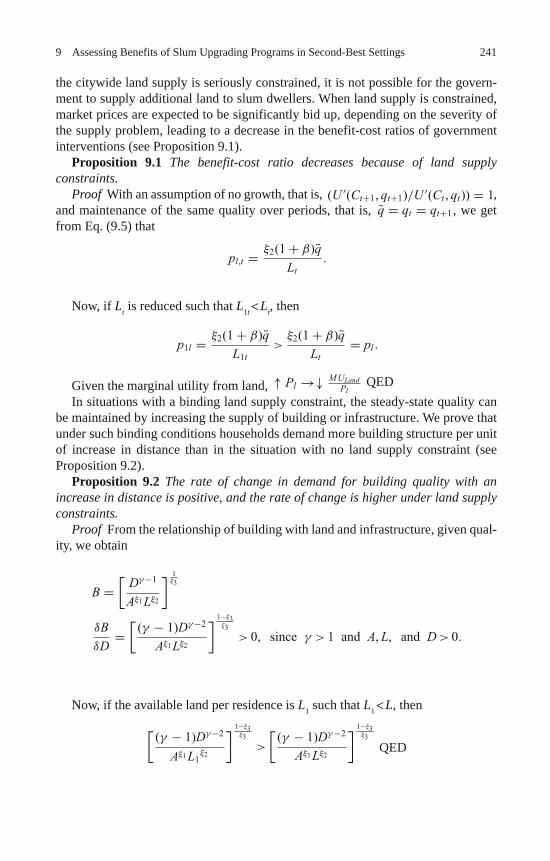
2419 Assessing Benefits of Slum Upgrading Programs in Second-Best Settings
the citywide land supply is seriously constrained, it is not possible for the govern-ment to supply additional land to slum dwellers. When land supply is constrained, market prices are expected to be significantly bid up, depending on the severity of the supply problem, leading to a decrease in the benefit-cost ratios of government interventions (see Proposition 9.1).
Proposition 9.1 The benefit-cost ratio decreases because of land supply constraints.
Proof With an assumption of no growth, that is, (U ′(Ct+1, qt+1)/U ′(Ct , qt)) = 1 , and maintenance of the same quality over periods, that is, q̄ = qt = qt+1 , we get from Eq. (9.5) that
pl,t = ξ2(1+ β)q̄
Lt.
Now, if L t is reduced such that L 1 t < L t , then
p1l = ξ2(1+ β)q̄
L1t>
ξ2(1+ β)q̄
Lt= pl .
Given the marginal utility from land, ↑ Pl →↓ MULandPl
QED In situations with a binding land supply constraint, the steady-state quality can
be maintained by increasing the supply of building or infrastructure. We prove that under such binding conditions households demand more building structure per unit of increase in distance than in the situation with no land supply constraint (see Proposition 9.2).
Proposition 9.2 The rate of change in demand for building quality with an increase in distance is positive, and the rate of change is higher under land supply constraints.
Proof From the relationship of building with land and infrastructure, given qual-ity, we obtain
B =[
Dγ−1
Aξ1 Lξ2
] 1ξ3
δB
δD=[
(γ − 1)Dγ−2
Aξ1 Lξ2
] 1−ξ3ξ3
> 0, since γ > 1 and A, L, and D > 0.
Now, if the available land per residence is L 1 such that L 1 < L , then
[
(γ − 1)Dγ−2
Aξ1 L1ξ2
] 1−ξ3ξ3
>
[(γ − 1)Dγ−2
Aξ1 Lξ2
] 1−ξ3ξ3
QED
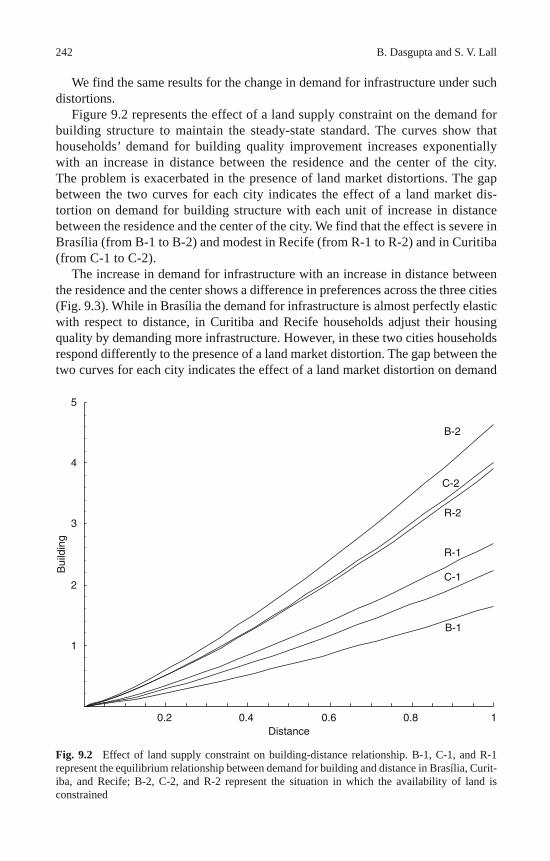
242 B. Dasgupta and S. V. Lall
We find the same results for the change in demand for infrastructure under such distortions.
Figure 9.2 represents the effect of a land supply constraint on the demand for building structure to maintain the steady-state standard. The curves show that households’ demand for building quality improvement increases exponentially with an increase in distance between the residence and the center of the city. The problem is exacerbated in the presence of land market distortions. The gap between the two curves for each city indicates the effect of a land market dis-tortion on demand for building structure with each unit of increase in distance between the residence and the center of the city. We find that the effect is severe in Brasília (from B-1 to B-2) and modest in Recife (from R-1 to R-2) and in Curitiba (from C-1 to C-2).
The increase in demand for infrastructure with an increase in distance between the residence and the center shows a difference in preferences across the three cities (Fig. 9.3). While in Brasília the demand for infrastructure is almost perfectly elastic with respect to distance, in Curitiba and Recife households adjust their housing quality by demanding more infrastructure. However, in these two cities households respond differently to the presence of a land market distortion. The gap between the two curves for each city indicates the effect of a land market distortion on demand
Fig. 9.2 Effect of land supply constraint on building-distance relationship. B-1, C-1, and R-1 represent the equilibrium relationship between demand for building and distance in Brasília, Curit-iba, and Recife; B-2, C-2, and R-2 represent the situation in which the availability of land is constrained
0.2 0.4 0.6 0.8 1Distance
1
2
3
4
5
Bui
ldin
g
B-1
R-2
C-1
C-2
R-1
B-2
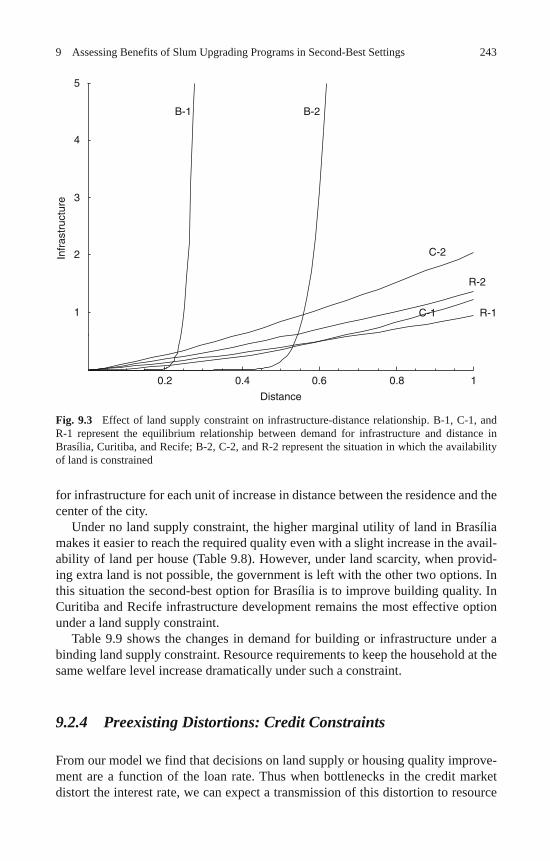
2439 Assessing Benefits of Slum Upgrading Programs in Second-Best Settings
for infrastructure for each unit of increase in distance between the residence and the center of the city.
Under no land supply constraint, the higher marginal utility of land in Brasília makes it easier to reach the required quality even with a slight increase in the avail-ability of land per house (Table 9.8). However, under land scarcity, when provid-ing extra land is not possible, the government is left with the other two options. In this situation the second-best option for Brasília is to improve building quality. In Curitiba and Recife infrastructure development remains the most effective option under a land supply constraint.
Table 9.9 shows the changes in demand for building or infrastructure under a binding land supply constraint. Resource requirements to keep the household at the same welfare level increase dramatically under such a constraint.
9.2.4 Preexisting Distortions: Credit Constraints
From our model we find that decisions on land supply or housing quality improve-ment are a function of the loan rate. Thus when bottlenecks in the credit market distort the interest rate, we can expect a transmission of this distortion to resource
Fig. 9.3 Effect of land supply constraint on infrastructure-distance relationship. B-1, C-1, and R-1 represent the equilibrium relationship between demand for infrastructure and distance in Brasília, Curitiba, and Recife; B-2, C-2, and R-2 represent the situation in which the availability of land is constrained
0.2 0.4 0.6 0.8 1
Distance
1
2
3
4
5
Infr
astr
uctu
re
R-1
R-2
C-1
C-2
B-2B-1
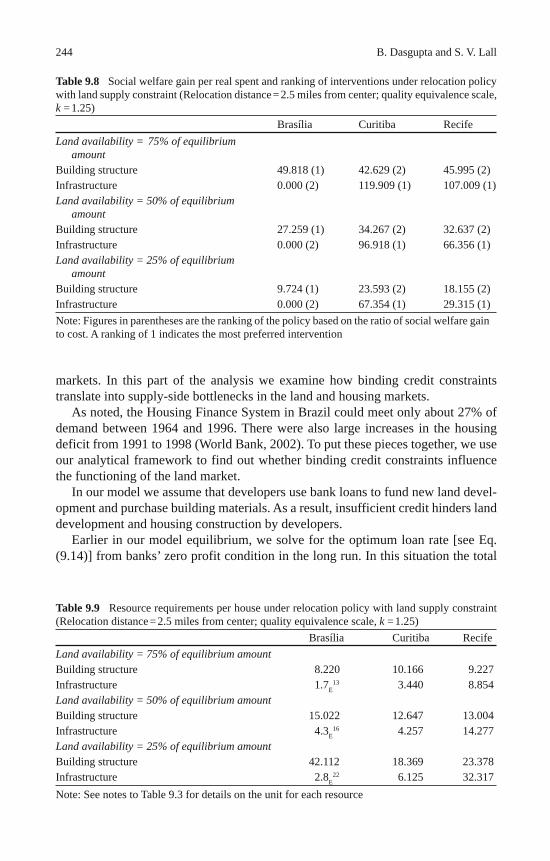
244 B. Dasgupta and S. V. Lall
markets. In this part of the analysis we examine how binding credit constraints translate into supply-side bottlenecks in the land and housing markets.
As noted, the Housing Finance System in Brazil could meet only about 27% of demand between 1964 and 1996. There were also large increases in the housing deficit from 1991 to 1998 (World Bank, 2002). To put these pieces together, we use our analytical framework to find out whether binding credit constraints influence the functioning of the land market.
In our model we assume that developers use bank loans to fund new land devel-opment and purchase building materials. As a result, insufficient credit hinders land development and housing construction by developers.
Earlier in our model equilibrium, we solve for the optimum loan rate [see Eq. (9.14)] from banks’ zero profit condition in the long run. In this situation the total
Table 9.8 Social welfare gain per real spent and ranking of interventions under relocation policy with land supply constraint (Relocation distance = 2.5 miles from center; quality equivalence scale, k = 1.25) Brasília Curitiba Recife Land availability = 75% of equilibrium
amount
Building structure 49.818 (1) 42.629 (2) 45.995 (2) Infrastructure 0.000 (2) 119.909 (1) 107.009 (1) Land availability = 50% of equilibrium
amount
Building structure 27.259 (1) 34.267 (2) 32.637 (2) Infrastructure 0.000 (2) 96.918 (1) 66.356 (1) Land availability = 25% of equilibrium
amount
Building structure 9.724 (1) 23.593 (2) 18.155 (2) Infrastructure 0.000 (2) 67.354 (1) 29.315 (1) Note: Figures in parentheses are the ranking of the policy based on the ratio of social welfare gain to cost. A ranking of 1 indicates the most preferred intervention
Table 9.9 Resource requirements per house under relocation policy with land supply constraint (Relocation distance = 2.5 miles from center; quality equivalence scale, k = 1.25) Brasília Curitiba Recife Land availability = 75% of equilibrium amount Building structure 8.220 10.166 9.227 Infrastructure 1.7 E 13 3.440 8.854 Land availability = 50% of equilibrium amount Building structure 15.022 12.647 13.004 Infrastructure 4.3 E 16 4.257 14.277 Land availability = 25% of equilibrium amount Building structure 42.112 18.369 23.378 Infrastructure 2.8 E 22 6.125 32.317 Note: See notes to Table 9.3 for details on the unit for each resource
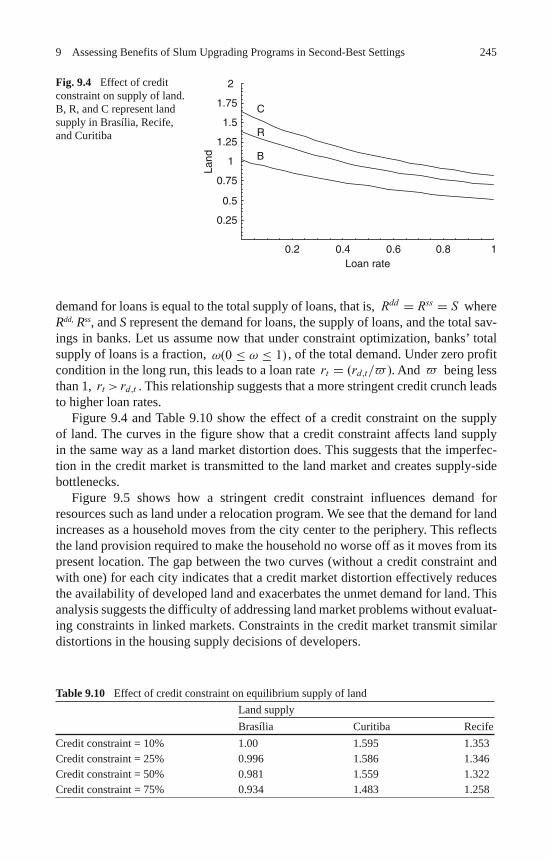
2459 Assessing Benefits of Slum Upgrading Programs in Second-Best Settings
demand for loans is equal to the total supply of loans, that is, Rdd = Rss = S where
R dd , R ss , and S represent the demand for loans, the supply of loans, and the total sav-ings in banks. Let us assume now that under constraint optimization, banks’ total supply of loans is a fraction, ω(0 ≤ ω ≤ 1) , of the total demand. Under zero profit condition in the long run, this leads to a loan rate rt = (rd,t/ ) . And being less than 1, rt > rd,t . This relationship suggests that a more stringent credit crunch leads to higher loan rates.
Figure 9.4 and Table 9.10 show the effect of a credit constraint on the supply of land. The curves in the figure show that a credit constraint affects land supply in the same way as a land market distortion does. This suggests that the imperfec-tion in the credit market is transmitted to the land market and creates supply-side bottlenecks.
Figure 9.5 shows how a stringent credit constraint influences demand for resources such as land under a relocation program. We see that the demand for land increases as a household moves from the city center to the periphery. This reflects the land provision required to make the household no worse off as it moves from its present location. The gap between the two curves (without a credit constraint and with one) for each city indicates that a credit market distortion effectively reduces the availability of developed land and exacerbates the unmet demand for land. This analysis suggests the difficulty of addressing land market problems without evaluat-ing constraints in linked markets. Constraints in the credit market transmit similar distortions in the housing supply decisions of developers.
Fig. 9.4 Effect of credit constraint on supply of land. B, R, and C represent land supply in Brasília, Recife, and Curitiba
0.2 0.4 0.6 0.8 1Loan rate
0.25
0.5
0.75
1
1.25
1.5
1.75
2
Land B
R
C
Table 9.10 Effect of credit constraint on equilibrium supply of land Land supply
Brasília Curitiba Recife Credit constraint = 10% 1.00 1.595 1.353 Credit constraint = 25% 0.996 1.586 1.346 Credit constraint = 50% 0.981 1.559 1.322 Credit constraint = 75% 0.934 1.483 1.258
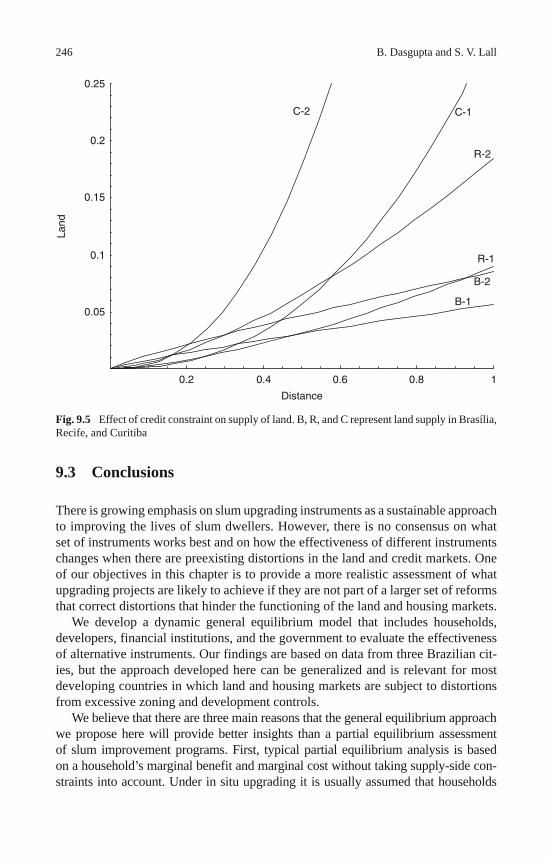
246 B. Dasgupta and S. V. Lall
9.3 Conclusions
There is growing emphasis on slum upgrading instruments as a sustainable approach to improving the lives of slum dwellers. However, there is no consensus on what set of instruments works best and on how the effectiveness of different instruments changes when there are preexisting distortions in the land and credit markets. One of our objectives in this chapter is to provide a more realistic assessment of what upgrading projects are likely to achieve if they are not part of a larger set of reforms that correct distortions that hinder the functioning of the land and housing markets.
We develop a dynamic general equilibrium model that includes households, developers, financial institutions, and the government to evaluate the effectiveness of alternative instruments. Our findings are based on data from three Brazilian cit-ies, but the approach developed here can be generalized and is relevant for most developing countries in which land and housing markets are subject to distortions from excessive zoning and development controls.
We believe that there are three main reasons that the general equilibrium approach we propose here will provide better insights than a partial equilibrium assessment of slum improvement programs. First, typical partial equilibrium analysis is based on a household’s marginal benefit and marginal cost without taking supply-side con-straints into account. Under in situ upgrading it is usually assumed that households
Fig. 9.5 Effect of credit constraint on supply of land. B, R, and C represent land supply in Brasília, Recife, and Curitiba
0.2 0.4 0.6 0.8 1
Distance
0.05
0.1
0.15
0.2
0.25
Land
C-2 C-1
R-2
R-1
B-2
B-1
2479 Assessing Benefits of Slum Upgrading Programs in Second-Best Settings
can continue to increase their consumption of one resource as long as the marginal benefit exceeds the marginal cost (see e.g., Heikkila, 2004, who proposes a conceptual framework for application to Brazilian cities). The argument is difficult to defend if there are supply-side bottlenecks. Second, marginal benefits of program interventions are calculated from a household utility function, while the marginal cost is based on the government’s expenditure/cost function. Meeting the demand of individual house-holds (from their assessment of marginal benefits), based solely on their preferences, may not yield a socially optimal solution. This discrepancy requires that the problem be recast in a social benefit–social cost framework. Third, results from a general equi-librium framework improve on partial estimates because it becomes possible to assess the response of different decision makers—households, the government, and financial intermediaries—to every policy shock. For example, we show how the decisions of developers or households are motivated by a decision made in the banking sector.
Based on our model, a comparison of upgrading in situ and upgrading through a program that involves relocation shows that the social benefit–cost ratios across interventions drop dramatically if households are relocated. The situation is made worse if there are preexisting land market distortions. The welfare analysis pre-sented here suggests that these preexisting distortions not only tend to reduce the cost-effectiveness of individual instruments but also change the welfare rank ordering of interventions. Thus assessing the benefits of interventions without accounting for preexisting distortions is likely to be misleading. Moreover, the choice of preferred instrument (infrastructure, housing quality, land provision) depends on city-specific characteristics and the severity of the underlying supply-side bottlenecks.
We also find that distortions are transmitted across markets; for example, land and building supply decisions of developers are a function of interest rates, and any distortions in the credit market that increase effective interest rates also reduce land and housing supply. Thus distortions in the credit market exacerbate constraints in the land market. In this context the effectiveness of project-level upgrading inter-ventions is likely to be enhanced if these are accompanied by institutional and regu-latory reforms.
Acknowledgments The research reported here was funded by a World Bank Knowledge for Change program grant, “Dynamics of Slum Formation and Strategies to Improve Lives of Slum Dwellers.” The findings are those of the authors alone and should not be attributed to the World Bank, its executive directors, or the countries they represent. The authors thank Paulo Avila, Bob Buckley, Dean Cira, Mila Freire, Sonia Hammam, Hyoung Gun Wang, and Christian Zimmerman for helpful comments.
Appendix
Methodology for Benefit-Cost Analysis With an assumption of no growth, we estimate the ratio of social welfare gain (based on Eq. (9.22)) to the corresponding project implementation cost (Eqs.
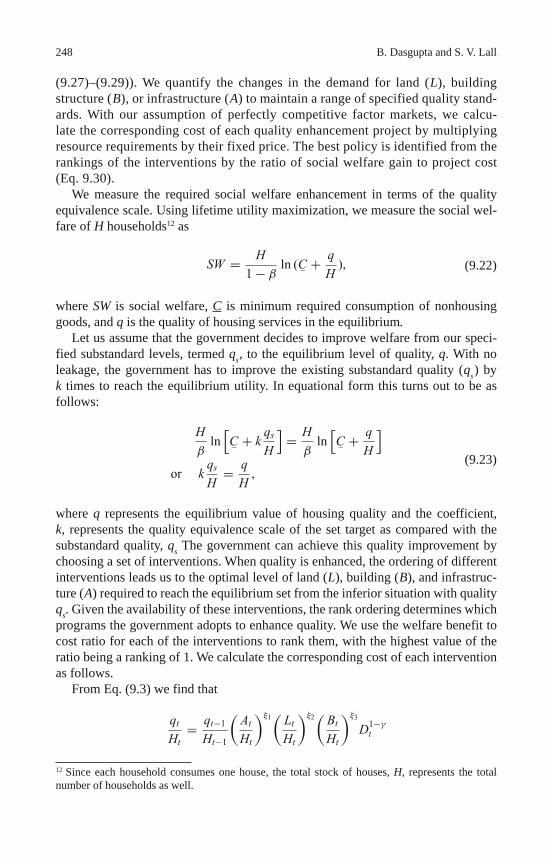
248 B. Dasgupta and S. V. Lall
(9.27)–(9.29)). We quantify the changes in the demand for land ( L ), building structure ( B ), or infrastructure ( A ) to maintain a range of specified quality stand-ards. With our assumption of perfectly competitive factor markets, we calcu-late the corresponding cost of each quality enhancement project by multiplying resource requirements by their fixed price. The best policy is identified from the rankings of the interventions by the ratio of social welfare gain to project cost (Eq. 9.30).
We measure the required social welfare enhancement in terms of the quality equivalence scale. Using lifetime utility maximization, we measure the social wel-fare of H households 12 as
SW = H
1− βln (C− +
q
H),
(9.22)
where SW is social welfare, C is minimum required consumption of nonhousing goods, and q is the quality of housing services in the equilibrium .
Let us assume that the government decides to improve welfare from our speci-fied substandard levels, termed q s , to the equilibrium level of quality, q . With no leakage, the government has to improve the existing substandard quality ( q s ) by k times to reach the equilibrium utility. In equational form this turns out to be as follows:
H
βln[C− + k
qs
H
]= H
βln[C− +
q
H
]or k
qs
H= q
H,
(9.23)
where q represents the equilibrium value of housing quality and the coefficient, k , represents the quality equivalence scale of the set target as compared with the substandard quality, q s The government can achieve this quality improvement by choosing a set of interventions. When quality is enhanced, the ordering of different interventions leads us to the optimal level of land ( L ), building ( B ), and infrastruc-ture ( A ) required to reach the equilibrium set from the inferior situation with quality q s . Given the availability of these interventions, the rank ordering determines which programs the government adopts to enhance quality. We use the welfare benefit to cost ratio for each of the interventions to rank them, with the highest value of the ratio being a ranking of 1. We calculate the corresponding cost of each intervention as follows.
From Eq. (9.3) we find that
qt
Ht= qt−1
Ht−1
(At
Ht
)ξ1(
Lt
Ht
)ξ2(
Bt
Ht
)ξ3
D1−γt
12 Since each household consumes one house, the total stock of houses, H , represents the total number of households as well.
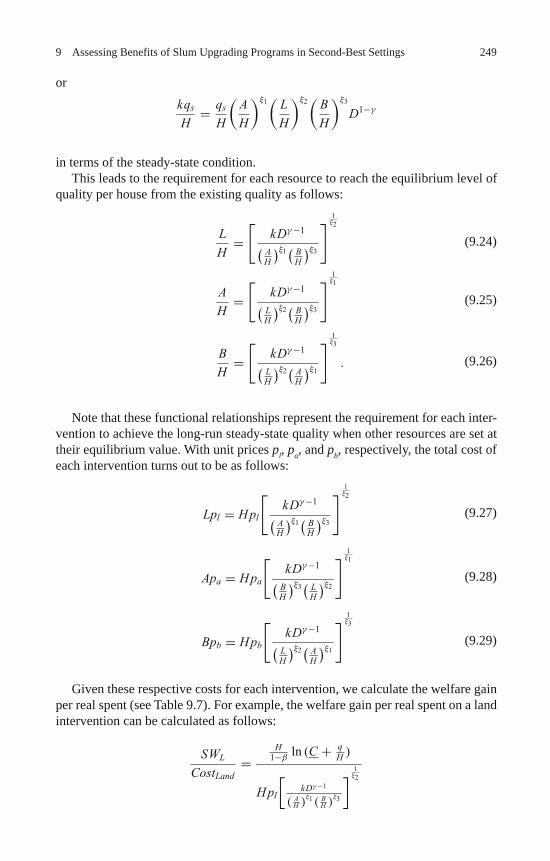
2499 Assessing Benefits of Slum Upgrading Programs in Second-Best Settings
or kqs
H= qs
H
(A
H
)ξ1(
L
H
)ξ2(
B
H
)ξ3
D1−γ
in terms of the steady-state condition. This leads to the requirement for each resource to reach the equilibrium level of
quality per house from the existing quality as follows:
L
H=[
kDγ−1(AH
)ξ1(
BH
)ξ3
] 1ξ2
(9.24)
A
H=[
kDγ−1(LH
)ξ2(
BH
)ξ3
] 1ξ1
(9.25)
B
H=[
kDγ−1(LH
)ξ2(
AH
)ξ1
] 1ξ3
.
(9.26)
Note that these functional relationships represent the requirement for each inter-vention to achieve the long-run steady-state quality when other resources are set at their equilibrium value. With unit prices p l , p a , and p b , respectively, the total cost of each intervention turns out to be as follows:
Lpl = Hpl
[kDγ−1(
AH
)ξ1(
BH
)ξ3
] 1ξ2
(9.27)
Apa = Hpa
[kDγ−1(
BH
)ξ3(
LH
)ξ2
] 1ξ1
(9.28)
Bpb = Hpb
[kDγ−1(
LH
)ξ2(
AH
)ξ1
] 1ξ3
(9.29)
Given these respective costs for each intervention, we calculate the welfare gain per real spent (see Table 9.7). For example, the welfare gain per real spent on a land intervention can be calculated as follows:
SWL
CostLand=
H1−β
ln (C + qH )
Hpl
[kDγ−1
( AH )
ξ1( BH )
ξ3
] 1ξ2
250 B. Dasgupta and S. V. Lall
or, by simplifying, as
SWL
CostLand= 1
(1− β)
ln (C + qH )
pl
[kDγ−1
( AH )
ξ1( BH )
ξ3
] 1ξ2
. (9.30)
The same explanation applies for the other two resources as well.
References
Ballard, C., & Fullerton, D. (1992). Distortionary taxes and the provision of public goods. Journal of Economic Perspectives , 6 (3), 117–131.
Bertaud, A., & Brueckner, J. (2005). Analyzing building-height restrictions: Predicted impacts and welfare costs. Regional Science and Urban Economics , 35 (2), 109–125.
Bovenburg, A. L., & Goulder, L. H. (1996). Optimal environmental taxation in the presence of other taxes: General-equilibrium analyses. American Economic Review , 86 (4), 985–1000.
Buckley, R., & Kalarickal, J. (Eds.). (2006). Thirty years of World Bank shelter lending: What have we learned? Directions in Development – Infrastructure series . Washington, DC: World Bank.
Clapham, E., Englund, P., Quigley, J., & Redfearn, C. L. (2004). Revisiting the past: Revision in repeat sales and hedonic indexes of house prices. Working Paper W04–005. University of California at Berkeley, Fisher Center for Real Estate and Urban Economics.
Field, E., & Kremer, M. (2005). Impact evaluation for slum upgrading interventions . Washington, DC: World Bank.
Heikkila, E. (2004). Conceptual framework: Evaluation of policy alternatives for promoting equi-table access to urban land in Brazil . World Bank, Cities Alliance, and Institute of Applied Eco-nomic Research (IPEA), Enabling Strategy for Moving Urban Upgrading to Scale in Brazil, Washington, DC.
Henderson, J. V., & Venables, A. J. (2004). The dynamics of city formation: Finance and govern-ance . London: Economic and Social Research Council; London School of Economics, Centre for Economic Performance.
Mayo, S. K. (1986). Sources of inefficiency in subsidized housing programs: A comparison of U.S. and German experience. Journal of Urban Economics , 20 (2), 229–249.
Mills, E., & Simenauer, R. (1996). New hedonic estimates of regional constant quality house prices. Journal of Urban Economics , 39 (2), 209–215.
Parry, I. W. H., & Oates, W. (1998). Policy analysis in a second best world. RFF Discussion Paper 98–48. Washington, DC: Resources for the Future.
Reiff, L. O., & Barbosa, A. L. (2005). Housing stock in Brazil: Estimation based on a hedonic price model. In Real estate indicators and financial stability: Proceedings of a joint conference organised by the BIS and the IMF in Washington DC, 27 – 28 October 2003 (pp. 257–270). BIS Papers, no. 21. Washington, DC: Bank for International Settlements.
Serra, M. V., Dowall, D. E., Motta, D., & Donovan, M. (2004). Urban land markets and urban land development: An examination of three Brazilian cities—Brasília, Curitiba and Recife. Work-ing Paper 2004–2003. University of California at Berkeley, Institute of Urban and Regional Development.
UN-Habitat (United Nations Human Settlements Programme). (2003). The challenge of slums: Global report on human settlements 2003 . London: Earthscan.
Wildasin, D. (1984). On public goods provision with distortionary taxation. Economic Inquiry , 22 (2), 227–243.
2519 Assessing Benefits of Slum Upgrading Programs in Second-Best Settings
Wolverton, M. L., & Senteza, J. (2000). Hedonic estimates of regional constant quality house prices. Journal of Real Estate Research , 19 (3), 235–253.
World Bank. (2002). Brazil: Progressive low-income housing—Alternatives for the poor. Report 22032-BR. Latin America and the Caribbean Region, Finance, Private Sector, and Infrastruc-ture. Washington, DC: Author.

“This page left intentionally blank.”
253
In Brazil, as in other Latin American countries, government housing policies have emphasized promoting homeownership in formal housing markets as the best way of satisfying the housing needs of the population, assigning a secondary status to renting.
In developed countries several studies have emphasized the positive effects of homeownership on child development, neighborhood conditions, and civic partici-pation (Green & White, 1997; DiPasquale & Glaeser, 1999; Green, 2001; Haurin, Parcel, & Haurin, 2002, among others). There is also a large body of literature stressing the importance of self-help housing to promote homeownership among the urban poor in Latin American cities, following a tradition launched by John Turner in the 1960s (see Turner, 1968).
Housing is both a consumer and an investment good. Besides serving a basic human need (shelter), housing usually represents the main asset in the portfolios of households around the world. In Brazil housing accounts for 30% of the national stock of physical capital. Housing tenure conditions vary greatly across countries, however, regardless of region, income patterns, and development levels (Fig. 10.1). In Brazil the homeownership rate is 74.4%, very close to the rates in Argentina (74.9%), Mexico (75.3%), and Belgium (74%) and just slightly higher than that in the U.K. (68%). But Brazil’s rate is quite a bit lower than that in Spain, where roughly 83% of households are homeowners. Countries at different stages of eco-nomic development can have quite similar homeownership rates. Both Germany and Jamaica, for example, have rates around 45%, far below the average rates in Latin America.
Despite the efforts of housing ministries, national housing banks, and other finan-cial institutions to promote homeownership in Brazil and many other developing countries, relatively little is known about households’ preferences on tenure choice or about housing demand in these countries.
S.V. Lall et al. (eds.), Urban Land Markets, DOI 10.1007/978-1-4020-8862-9_10 , © World Bank 2009
Chapter 10 Housing Demand, Tenure Choice, and Housing Policy in Brazil Maria da Piedade Morais and Bruno de Oliveira Cruz
M. P. Morais ( ) Institute of Applied Economic Research (IPEA) Brasilia, DF , Brazil e-mail: [email protected]
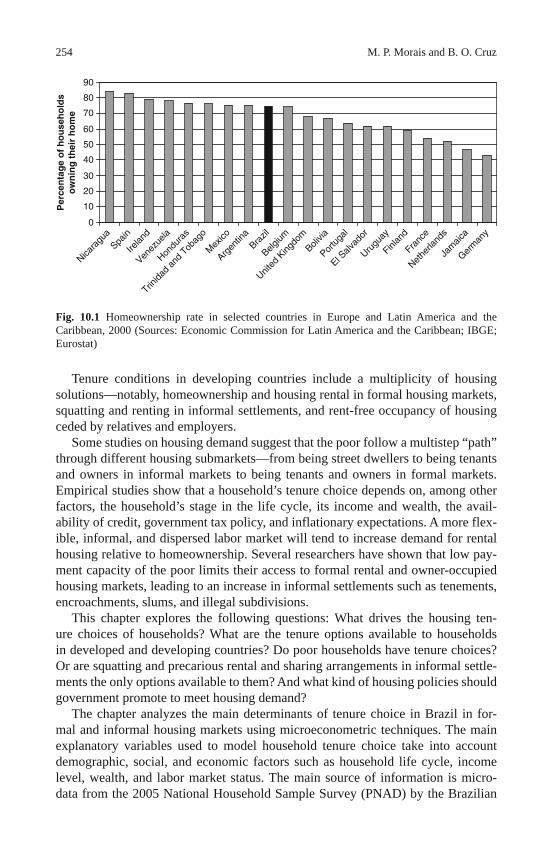
254 M. P. Morais and B. O. Cruz
Tenure conditions in developing countries include a multiplicity of housing solutions—notably, homeownership and housing rental in formal housing markets, squatting and renting in informal settlements, and rent-free occupancy of housing ceded by relatives and employers.
Some studies on housing demand suggest that the poor follow a multistep “path” through different housing submarkets—from being street dwellers to being tenants and owners in informal markets to being tenants and owners in formal markets. Empirical studies show that a household’s tenure choice depends on, among other factors, the household’s stage in the life cycle, its income and wealth, the avail-ability of credit, government tax policy, and inflationary expectations. A more flex-ible, informal, and dispersed labor market will tend to increase demand for rental housing relative to homeownership. Several researchers have shown that low pay-ment capacity of the poor limits their access to formal rental and owner-occupied housing markets, leading to an increase in informal settlements such as tenements, encroachments, slums, and illegal subdivisions.
This chapter explores the following questions: What drives the housing ten-ure choices of households? What are the tenure options available to households in developed and developing countries? Do poor households have tenure choices? Or are squatting and precarious rental and sharing arrangements in informal settle-ments the only options available to them? And what kind of housing policies should government promote to meet housing demand?
The chapter analyzes the main determinants of tenure choice in Brazil in for-mal and informal housing markets using microeconometric techniques. The main explanatory variables used to model household tenure choice take into account demographic, social, and economic factors such as household life cycle, income level, wealth, and labor market status. The main source of information is micro-data from the 2005 National Household Sample Survey (PNAD) by the Brazilian
Fig. 10.1 Homeownership rate in selected countries in Europe and Latin America and the Caribbean, 2000 (Sources: Economic Commission for Latin America and the Caribbean; IBGE; Eurostat)
0
10
20
30
40
50
60
70
80
90
Nicara
gua
Spain
Irelan
d
Venez
uela
Hondu
ras
Trinida
d an
d Tob
ago
Mex
ico
Argen
tina
Brazil
Belgium
United
King
dom
Bolivia
Portu
gal
El Salv
ador
Urugu
ay
Finlan
d
Franc
e
Nethe
rland
s
Jam
aica
Germ
any
Per
cen
tag
e o
f h
ou
seh
old
so
wn
ing
th
eir
ho
me
25510 Housing Demand, Tenure Choice, and Housing Policy in Brazil
Institute of Geography and Statistics (IBGE). The chapter also analyzes the tenure conditions and tenure security of Brazilian households and the extent to which the informality in the housing market is correlated with informality in the labor market, complementing an earlier study by Morais, Cruz, and Oliveira (2003).
By modeling the tenure choice behavior of Brazilian households, the chapter provides several insights into consumer preferences in the housing market. These insights should allow better matching between housing supply and demand, show the obstacles faced by the poor in gaining access to adequate housing, and aid the government in designing housing policies better adapted to household demand and income levels and therefore more effective in meeting the different housing needs of Brazilian households.
10.1 Survey of the Literature on Tenure Choice
There is a vast literature on tenure choice, dealing primarily with the US and other OECD countries. In this section we present a summary of this literature, focusing on the housing tenure choices of vulnerable groups in developing countries. 1
Studies in developed countries usually classify housing tenure as either rent-ing or owning in formal housing markets. Informality is generally neglected. As Malpezzi and Mayo (1987) and Englund, Kim, Malpezzi, and Turner (2005) point out, however, this own-rent dichotomy is just a simplification for analytical pur-poses. Housing tenure can be seen as a continuum of property rights over land and structure, even in developed countries, and actual tenure rights may be influenced by zoning and other urban development regulations, rental agreements, length of stay, or private or customary laws, among others.
One of the earliest works on tenure choice is that by Kain and Quigley (1972). Using a sample of households in St. Louis, Missouri, the authors measure the effects of spatial segregation and racial discrimination on black and white homeowner-ship patterns. Their study shows that blacks pay more than whites for housing of equivalent quality and that blacks, single women, larger families, and female-headed households are less likely to own. Their results are reinforced by McDonald (1974); Roistacher and Goodman (1976), who also find lower rates of homeowner-ship among blacks.
Li (1977), using a logit model to explain tenure choice in Boston and Balti-more, shows that income, family size, and age and race of the household head are the primary determinants of homeownership. Rosen (1979), King (1980), Hend-erson and Ioannides (1983), and Goodman (1988) emphasize the importance of the user cost of owning relative to renting, the tax laws, and portfolio consid-erations of housing as both an investment and a consumption good to explain tenure choice. Blackley and Follain (1983) conclude that the net effect of higher expected inflation is a decrease in the cost of housing, leading to higher own-
1 This section draws on Pianto (2004).
256 M. P. Morais and B. O. Cruz
ership rates and higher investment in housing. Linneman and Wachter (1989) conclude that even in well-developed capital markets the presence of borrowing constraints adversely affects the probability of homeownership. Similarly, Hau-rin, Hendershott, and Wachter (1997) point to the negative effect of borrowing constraints on the homeownership rates of young households. However, Deaton (1992), analyzing household savings in developing countries, and Neri, Carvalho, and Nascimento (2000), studying life cycle and households’ financial motiva-tions in Brazil, argue that individuals with liquidity and borrowing constraints can accumulate housing and real estate assets as a buffer against uncertainty. A similar result had earlier been shown for the US by Birnbaum and Weston (1974), who found that, at the same income and wealth level, blacks invest more in housing than whites because they face a smaller set of investment opportunities as a result of racial discrimination.
Iwarere and Williams (1991), examining data from Washington, D.C., show that permanent income, housing prices, wealth, and demographic variables exert the most dominant forces on housing tenure choice. Many of the relative cost ideas are refuted by Jones (1994), who finds that sociodemographic variables and wealth are extremely important in explaining tenure choice decisions. Ioannides (1987), using data for 1970–1981, concludes that wealth and homeownership are positively cor-related, with wealth resulting in higher mobility for renters and lower mobility for owners. Henley (1998) explores the adverse effects of housing equity on residen-tial mobility and labor market outcomes in the U.K., suggesting that homeowners appear to be rather unresponsive to changes in labor market conditions and that negative equity increases housing-market-related rigidities in the job search proc-ess. The author also states that lack of availability of rental housing and owner occu-pation at early stages of the life cycle lead to suboptimal levels of mobility among certain employees in a changing labor market.
Bourassa (1995) models tenure choice for the metropolitan areas of Sidney and Melbourne in Australia, taking as explanatory variables permanent and transitory income, demographic characteristics, and the cost of renting relative to owning. Di Salvo and Ermisch (1997), using panel data, study the effect of variables such as lifetime earning prospects, family background, a person’s own spells of unemploy-ment, the regional unemployment rate, and regional relative house prices on the timing and pattern of first entry into a major tenure situation (owner-occupied or social housing). They find that being a young parent or the child of parents in social housing increases an individual’s own chances of being in social housing.
Rothenberg, Galster, Butler, and Pitkin (1992), King (1980), and Ermisch, Findlay, and Gibb (1996) suggest that tenure choice and housing demand are simul-taneously determined. Gibb (2000) finds that tenure choice may also be simultane-ously determined by housing location, not just demand, using a nested multinomial logit model in which the choice of renting or owning becomes conditional on other choices, such as location. For some low-income people, however, it is possible that the only choice is renting (or sharing) and that location is therefore limited by tenure, while for high-income people the choice of location may be dominant in limiting tenure choice. Elder and Zumpano (1991) examine location effects on
25710 Housing Demand, Tenure Choice, and Housing Policy in Brazil
tenure choice and housing demand in several US metropolitan areas. They find that for homeowners housing demand and location are jointly determined, while tenure choice is independent of demand and location. This result does not hold for renters, however, again suggesting that they have more limited choices.
Coulson (1999) finds that being an immigrant has a substantial negative effect on homeownership but that this effect dissipates over time. Assessing the determi-nants of housing tenure choice among racial and ethnic groups in the Los Angeles metropolitan area, Painter, Gabriel, and Myers (2001) indicate that endowment dif-ferences in income, education, and immigration status largely explain the home-ownership gap between Latinos and whites.
While in developed economies the tenure options are typically renting and own-ing, in developing countries there is a need for further distinguishing tenure status. In the formal market of developing countries the choice continues to be between owning and renting. However, there are also several types of informal tenure arrangements, including homeownership through squatting or purchasing in illegal subdivisions; renting a bed, a room, a house, or a piece of land; and sharing with relatives (Wadhva, 1988; Gilbert, 1983; Wandeler & Khanaiklang, 1992; Coccato, 1996).
Housing submarkets or tenure options are defined in the literature on the basis of different indicators. Payne (1988) defines informal settlements as “spontane-ous, unplanned or unregulated sub-markets, which commonly attract the general label of self-help housing, slums, or squatters” (p. 1). Lim (1987) uses type of occupancy, legality of land occupancy, and physical characteristics. Struyk, Hoff-man, and Katsura (1990) define housing segments by considering how the hous-ing was produced, what its quality is, whether it is rented or owned, and how secure tenure is.
The literature emphasizes that those with informal tenure are typically the poor and that their tenure choice is often limited to self-help construction, rental in an illegal subdivision, or rent-free or sharing arrangements (Durand-Lasserve, 1986; Gilbert, 1993; Necochea, 1987; Coccato, 1996). Coulomb (1988) wonders whether the poor even have a choice or whether they are forced into rental accommodation because no other alternative is open to them. Edwards (1990) claims that avail-able tenure choice is an increasing function of income and that people with lower incomes have fewer alternatives. In an earlier study, however, Edwards (1982) finds no direct correlation between tenure choice and social class or income group—because households with the same income level choose different forms of tenure, and the converse as well.
Green (1998, p. 251) states that “although choices can only be made within the constraints which determine what is available, where and at what price, even the most disadvantaged section of the population usually has more than one alterna-tive to choose from.” Van Lindert and Westen (1991), analyzing housing strategies in low-income groups in Bamako, Mali, and in La Paz, Bolivia, argue that both the “choice” and the “constraint” argument can apply to different social categories within the same income bracket. In Bamako some households without financial constraints to secure homeownership choose to continue renting. In La Paz many
258 M. P. Morais and B. O. Cruz
inhabitants of conventillos (tenements) prefer to remain in these centrally located rental accommodations rather than become owners on the city periphery.
For Coccato (1996) and Wadhva (1988), location and affordability are the strongest factors in housing preferences. Mehta and Mehta (1989) relate housing preferences to households’ stage in the life cycle. Early on, households base their preferences on their housing background and their housing needs. In the second stage affordability and awareness of housing opportunities play a dominant role. The third and final stage is a process of housing adjustment as households’ goals and needs change. This suggests the use of models in which age is interacted with the main determinants of tenure choice to adjust for the different stages in life cycle.
Daniere (1992) examines the determinants of tenure choice in Cairo and Manila and extends tenure options to include squatting as a third choice, in addition to owning and renting. The author indicates that family size, education, income, and mobility are powerful forces in determining tenure choice. The findings also sug-gest that squatters may have more in common with owners than with renters. Groo-taert and Dubois (1988) use a maximum-likelihood probit model to analyze tenure choice between owning and renting in cities of Côte d’Ivoire. They conclude that life-cycle stage and mobility are the prime determinants of tenure status. Similarly, Arimah (1997), based on a logit model for Ibadan, Nigeria, concludes that income, investment motivation for ownership, number of children, gender of the household head, life-cycle variables, duration of stay in the city, and access to land on the basis of ethnic qualification are the main determinants of housing tenure choice. Huang and Clark (2002), using a multilevel modeling technique, show that tenure choice in China is affected by socioeconomic characteristics, market mechanisms, and insti-tutional factors, with the relationships between the state, work units, and households still playing important roles in tenure decisions.
Jacobs and Savedoff (1999) use data from two cities in Panama to evaluate the determinants of tenure choice in two models. In the first model households choose between owning and renting; in the second model households are classified as buy-ers (finished housing), renters, or builders (progressive housing). Their results show that life-cycle variables influence the choice between owning and renting, while the choice between buying a completed housing unit and progressively building a house depends on income and asset levels.
Koizumi and McCann (2006), also studying housing tenure in Panama, reach similar conclusions. These authors develop a series of log-linear models in which the rent-buy models are extended to include purchasing a plot for future building as a third tenure possibility. They conclude that the extended models perform better in identifying which household characteristics are associated with a particular tenure choice. Their results suggest that the age of the household head and the number of economic dependents are the key factors in the choice between renting and buying a dwelling. Education and income levels explain the household’s choice between purchasing a plot for future building and purchasing a completed dwelling unit.
Most information about informal housing submarkets comes from case studies. Such studies have analyzed major cities, such as Ahmedabad (Mehta & Mehta,
25910 Housing Demand, Tenure Choice, and Housing Policy in Brazil
1989); Bangkok (Yap, 1992); Bogotá (Edwards, 1982); Mexico City (Gilbert, 1993; Ward, 1982); and Nairobi (Amis, 1984). Following the legacy of Turner (1968), the literature agrees on the important role of informal land submarkets in the sup-ply of ownership alternatives for the poor. However, Miraftab (1997), analyzing census data from the metropolitan area of Guadalajara, Mexico, observes that the poor cannot be aggregated into a homogeneous group based only on income and that homeownership in informal settlements will not benefit all. Miraftab argues for broadening housing policies to include renting and sharing as important shelter options for the poor. Coccato (1996), based on research in three informal barrios of Resistencia, Argentina, finds that rentals and sharing increase the choices for those who cannot buy and for those seeking employment. Meanwhile, renting out provides a means of generating income or financing for poor owners. Moreover, for many people homeownership may not be a priority, and it can reduce mobility. Amis (1984) states that the conventional view that squatters build their own home no longer holds in Nairobi, where a private (though illegal) rental sector operating in “squatting” areas supplies low-income shelter.
Gilbert (1993) writes that Latin American governments “encourage owner-occu-pation, sacrificing other forms of housing tenure on the altar of the favored option” (p. 160). This, Gilbert argues, limits the shelter opportunities available, leading to lower standards of living for the poor. The author further argues that to ignore rental housing is simply irresponsible and that renting must be recognized as both a respectable and a necessary housing option. Even so, government policy in most developing countries is still at an early stage when it comes to rental housing (Coc-cato, 1996). The World Bank (1993, p. 15) states that “diversity of the supply is the key for a successful housing sector.” Similarly, Hansen and Justin (1988), Gilbert (1983, 1993), Van Lindert and Westen (1991), and Rakodi (1992) advocate that housing policies must be aimed at all sub-markets and a wide variety of housing options should be available to every family .
Clearly, explaining what determines tenure choice in developing countries is no simple task. While studies on tenure choice in the developed world deal only with formal ownership and renting, in the developing world other options—informal subdivisions, squatting, rental of informal properties—also play a major role in pro-viding housing for the poor. Thus any study of tenure choice in Brazil must include these different categories of tenure, as must any future policies aimed at satisfying the housing needs of the Brazilian population.
10.2 Brief Review of Housing Policy in Brazil
In Brazil until the 1930s low- and middle-income families obtained housing pre-dominantly through the rental markets, while for the upper classes housing was mainly privately supplied, because there was no official housing finance system (Sampaio, 1994; Bonduki, 1998). Silveira and Malpezzi (1991, p. 88) argue that “the private rental sector was crucial in the provision of housing to the fast-grow-
260 M. P. Morais and B. O. Cruz
ing urban populations of Rio de Janeiro and São Paulo (where rental accounted for about 70% of all housing in the 1920s).”
This scenario started to change after the 1940s, when the principle of “self-owned housing” gained momentum with the promulgation of the 1942 Tenants Law and with national housing policies that began to advocate homeownership under President Getulio Vargas’s government (1930–1954). The rent control system established under the 1942 Tenants Law created incentives for the construction of housing to sell for owner occupation, making formal housing less affordable and pushing the poor into informal housing markets. The development of self-owned housing is closely related to the increase in the construction of high-rise buildings in central areas and self-help construction on the periphery. The shift in incentives against private rental housing, together with the massive destruction of low-income rental housing in central areas due to urban renewal projects—all in an environment of rapid industrialization, rural exodus, and explosive rates of urbanization—led to the emergence of slums and peripheral settlements in the country’s main metropoli-tan areas (Ribeiro, 1997; Silva e Silva, 1989).
In the area of housing finance, government intervention in the housing market began with the creation of the Institutes of Pension and Retirement Funds (IAPs), state institutions organized by profession after the 1930 revolution. In 1937–1945 the IAPs supplied 124,000 dwelling units for their members (all with formal employment), reaching only 5% of the total urban population of that period. Later, a large share of IAP funds began to be used to finance public megaprojects such as the construction of the new federal capital in Brasília.
The “Fundação da Casa Popular”(Popular Housing Foundation), created in 1946, was the first government institution to promote social housing. It had a very limited impact in reducing the housing shortage, however, constructing only 19,000 units by 1964.
The official government policy toward informal settlements at that time was complete relocation of slum and tenement residents to structures built or financed by the government, such as the parques proletários (temporary camps) during the 1940s and 1950s and the conjuntos habitacionais (apartment blocks of social hous-ing) from the 1960s on. In 1962–1965 the US Agency for International Develop-ment (USAID), through its Alliance for Progress Program, provided loans for urban development and the relocation of 42,000 people in Rio de Janeiro from 27 central slums to four newly constructed conjuntos habitacionais : Vila Aliança (Bangu), Vila Kennedy (Senador Câmara), Vila Esperança (Vigário Geral), and Cidade de Deus (Jacarepaguá).
In 1964 the federal government, under the military regime, created the Housing Finance System (SFH) and the National Housing Bank (BNH). BNH was the first effective initiative of the government to promote a national housing policy, with well-defined goals and targets, a source of funding, and specific credit mechanisms (Draibe, 1994).
The creation of BNH in 1964 also had the promotion of “self-owned housing” as one of its main policy goals. The SFH-BNH system divided the housing market into three income segments: popular (up to three minimum wages), affordable (three to
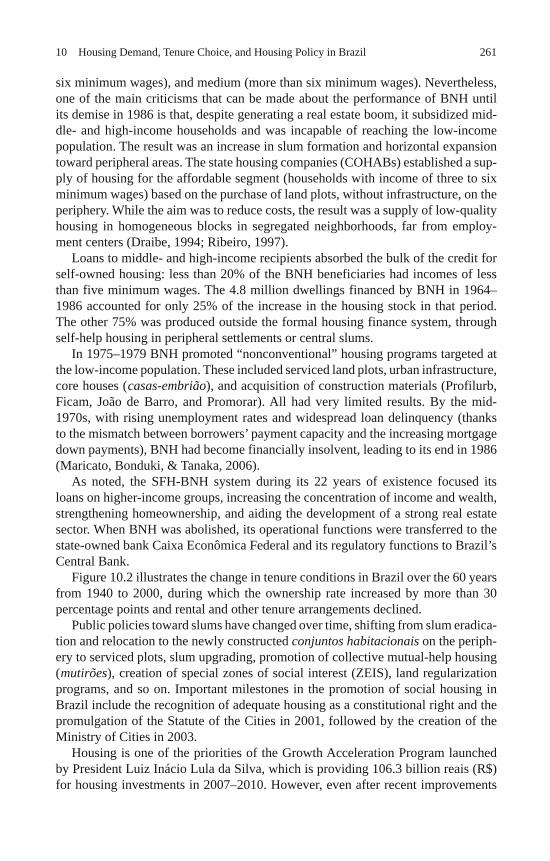
26110 Housing Demand, Tenure Choice, and Housing Policy in Brazil
six minimum wages), and medium (more than six minimum wages). Nevertheless, one of the main criticisms that can be made about the performance of BNH until its demise in 1986 is that, despite generating a real estate boom, it subsidized mid-dle- and high-income households and was incapable of reaching the low-income population. The result was an increase in slum formation and horizontal expansion toward peripheral areas. The state housing companies (COHABs) established a sup-ply of housing for the affordable segment (households with income of three to six minimum wages) based on the purchase of land plots, without infrastructure, on the periphery. While the aim was to reduce costs, the result was a supply of low-quality housing in homogeneous blocks in segregated neighborhoods, far from employ-ment centers (Draibe, 1994; Ribeiro, 1997).
Loans to middle- and high-income recipients absorbed the bulk of the credit for self-owned housing: less than 20% of the BNH beneficiaries had incomes of less than five minimum wages. The 4.8 million dwellings financed by BNH in 1964–1986 accounted for only 25% of the increase in the housing stock in that period. The other 75% was produced outside the formal housing finance system, through self-help housing in peripheral settlements or central slums.
In 1975–1979 BNH promoted “nonconventional” housing programs targeted at the low-income population. These included serviced land plots, urban infrastructure, core houses ( casas-embrião ), and acquisition of construction materials (Profilurb, Ficam, João de Barro, and Promorar). All had very limited results. By the mid-1970s, with rising unemployment rates and widespread loan delinquency (thanks to the mismatch between borrowers’ payment capacity and the increasing mortgage down payments), BNH had become financially insolvent, leading to its end in 1986 (Maricato, Bonduki, & Tanaka, 2006).
As noted, the SFH-BNH system during its 22 years of existence focused its loans on higher-income groups, increasing the concentration of income and wealth, strengthening homeownership, and aiding the development of a strong real estate sector. When BNH was abolished, its operational functions were transferred to the state-owned bank Caixa Econômica Federal and its regulatory functions to Brazil’s Central Bank.
Figure 10.2 illustrates the change in tenure conditions in Brazil over the 60 years from 1940 to 2000, during which the ownership rate increased by more than 30 percentage points and rental and other tenure arrangements declined.
Public policies toward slums have changed over time, shifting from slum eradica-tion and relocation to the newly constructed conjuntos habitacionais on the periph-ery to serviced plots, slum upgrading, promotion of collective mutual-help housing ( mutirões ), creation of special zones of social interest (ZEIS), land regularization programs, and so on. Important milestones in the promotion of social housing in Brazil include the recognition of adequate housing as a constitutional right and the promulgation of the Statute of the Cities in 2001, followed by the creation of the Ministry of Cities in 2003.
Housing is one of the priorities of the Growth Acceleration Program launched by President Luiz Inácio Lula da Silva, which is providing 106.3 billion reais (R$) for housing investments in 2007–2010. However, even after recent improvements
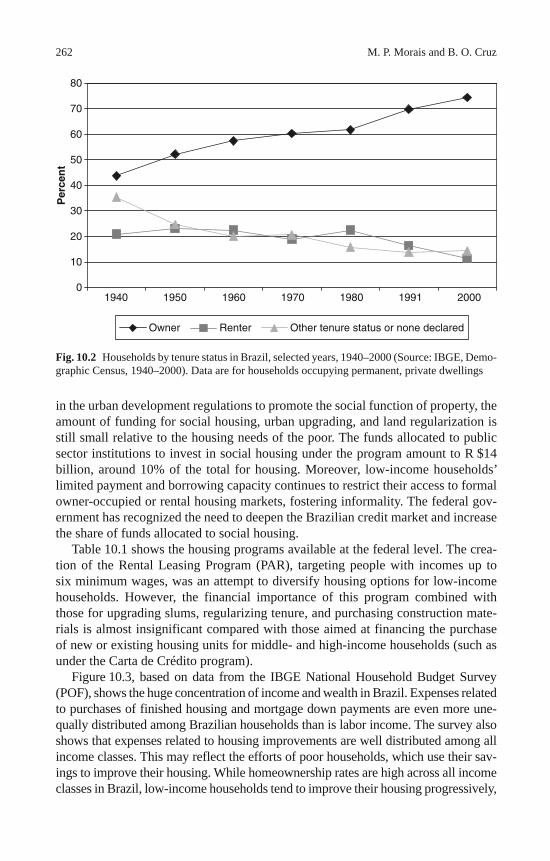
262 M. P. Morais and B. O. Cruz
in the urban development regulations to promote the social function of property, the amount of funding for social housing, urban upgrading, and land regularization is still small relative to the housing needs of the poor. The funds allocated to public sector institutions to invest in social housing under the program amount to R $14 billion, around 10% of the total for housing. Moreover, low-income households’ limited payment and borrowing capacity continues to restrict their access to formal owner-occupied or rental housing markets, fostering informality. The federal gov-ernment has recognized the need to deepen the Brazilian credit market and increase the share of funds allocated to social housing.
Table 10.1 shows the housing programs available at the federal level. The crea-tion of the Rental Leasing Program (PAR), targeting people with incomes up to six minimum wages, was an attempt to diversify housing options for low-income households. However, the financial importance of this program combined with those for upgrading slums, regularizing tenure, and purchasing construction mate-rials is almost insignificant compared with those aimed at financing the purchase of new or existing housing units for middle- and high-income households (such as under the Carta de Crédito program).
Figure 10.3, based on data from the IBGE National Household Budget Survey (POF), shows the huge concentration of income and wealth in Brazil. Expenses related to purchases of finished housing and mortgage down payments are even more une-qually distributed among Brazilian households than is labor income. The survey also shows that expenses related to housing improvements are well distributed among all income classes. This may reflect the efforts of poor households, which use their sav-ings to improve their housing. While homeownership rates are high across all income classes in Brazil, low-income households tend to improve their housing progressively,
Fig. 10.2 Households by tenure status in Brazil, selected years, 1940–2000 (Source: IBGE, Demo-graphic Census, 1940–2000). Data are for households occupying permanent, private dwellings
0
10
20
30
40
50
60
70
80
1940
Per
cen
t
Owner Renter Other tenure status or none declared
1950 1960 1970 1980 1991 2000
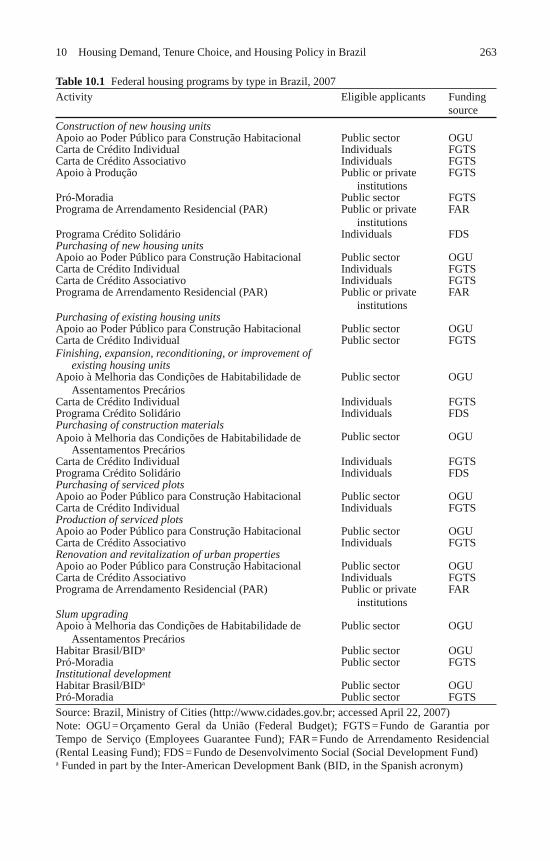
26310 Housing Demand, Tenure Choice, and Housing Policy in Brazil
Table 10.1 Federal housing programs by type in Brazil, 2007 Activity Eligible applicants Funding
source Construction of new housing units Apoio ao Poder Público para Construção Habitacional Public sector OGU Carta de Crédito Individual Individuals FGTS Carta de Crédito Associativo Individuals FGTS Apoio à Produção Public or private
institutions FGTS
Pró-Moradia Public sector FGTS Programa de Arrendamento Residencial (PAR) Public or private
institutions FAR
Programa Crédito Solidário Individuals FDS Purchasing of new housing units Apoio ao Poder Público para Construção Habitacional Public sector OGU Carta de Crédito Individual Individuals FGTS Carta de Crédito Associativo Individuals FGTS Programa de Arrendamento Residencial (PAR) Public or private
institutions FAR
Purchasing of existing housing units Apoio ao Poder Público para Construção Habitacional Public sector OGU Carta de Crédito Individual Public sector FGTS Finishing, expansion, reconditioning, or improvement of
existing housing units
Apoio à Melhoria das Condições de Habitabilidade de Assentamentos Precários
Public sector OGU
Carta de Crédito Individual Individuals FGTS Programa Crédito Solidário Individuals FDS Purchasing of construction materials Apoio à Melhoria das Condições de Habitabilidade de
Assentamentos Precários Public sector OGU
Carta de Crédito Individual Individuals FGTS Programa Crédito Solidário Individuals FDS Purchasing of serviced plots Apoio ao Poder Público para Construção Habitacional Public sector OGU Carta de Crédito Individual Individuals FGTS Production of serviced plots Apoio ao Poder Público para Construção Habitacional Public sector OGU Carta de Crédito Associativo Individuals FGTS Renovation and revitalization of urban properties Apoio ao Poder Público para Construção Habitacional Public sector OGU Carta de Crédito Associativo Individuals FGTS Programa de Arrendamento Residencial (PAR) Public or private
institutions FAR
Slum upgrading Apoio à Melhoria das Condições de Habitabilidade de
Assentamentos Precários Public sector OGU
Habitar Brasil/BID a Public sector OGU Pró-Moradia Public sector FGTS Institutional development Habitar Brasil/BID a Public sector OGU Pró-Moradia Public sector FGTS Source: Brazil, Ministry of Cities (http://www.cidades.gov.br; accessed April 22, 2007) Note: OGU = Orçamento Geral da União (Federal Budget); FGTS = Fundo de Garantia por Tempo de Serviço (Employees Guarantee Fund); FAR = Fundo de Arrendamento Residencial (Rental Leasing Fund); FDS = Fundo de Desenvolvimento Social (Social Development Fund) a Funded in part by the Inter-American Development Bank (BID, in the Spanish acronym)
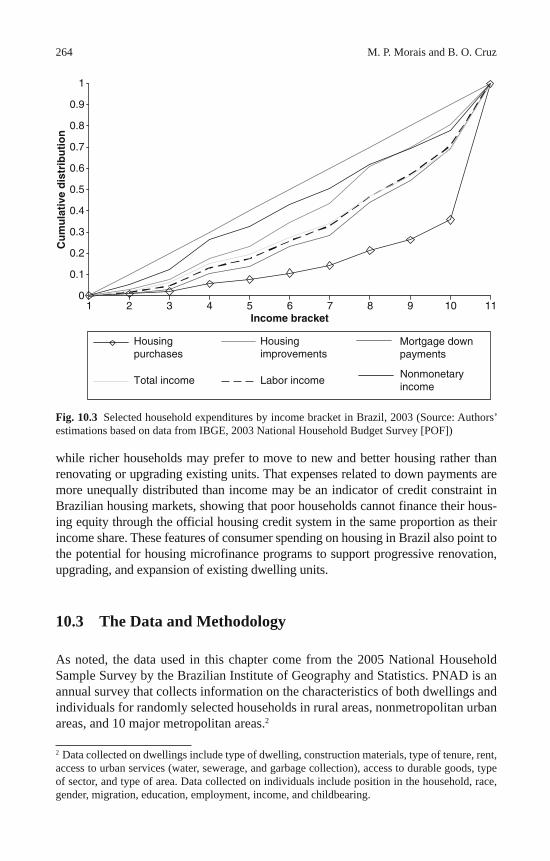
264 M. P. Morais and B. O. Cruz
while richer households may prefer to move to new and better housing rather than renovating or upgrading existing units. That expenses related to down payments are more unequally distributed than income may be an indicator of credit constraint in Brazilian housing markets, showing that poor households cannot finance their hous-ing equity through the official housing credit system in the same proportion as their income share. These features of consumer spending on housing in Brazil also point to the potential for housing microfinance programs to support progressive renovation, upgrading, and expansion of existing dwelling units.
10.3 The Data and Methodology
As noted, the data used in this chapter come from the 2005 National Household Sample Survey by the Brazilian Institute of Geography and Statistics. PNAD is an annual survey that collects information on the characteristics of both dwellings and individuals for randomly selected households in rural areas, nonmetropolitan urban areas, and 10 major metropolitan areas. 2
2 Data collected on dwellings include type of dwelling, construction materials, type of tenure, rent, access to urban services (water, sewerage, and garbage collection), access to durable goods, type of sector, and type of area. Data collected on individuals include position in the household, race, gender, migration, education, employment, income, and childbearing.
Fig. 10.3 Selected household expenditures by income bracket in Brazil, 2003 (Source: Authors’ estimations based on data from IBGE, 2003 National Household Budget Survey [POF])
0
0.1
0.2
0.3
0.4
0.5
0.6
0.7
0.8
0.9
1
1Income bracket
Cu
mu
lati
ve d
istr
ibu
tio
n
Nonmonetary income
2 3 4 5 6 7 8 9 10 11
Housing purchases
Housingimprovements
Mortgage down payments
Total income Labor income
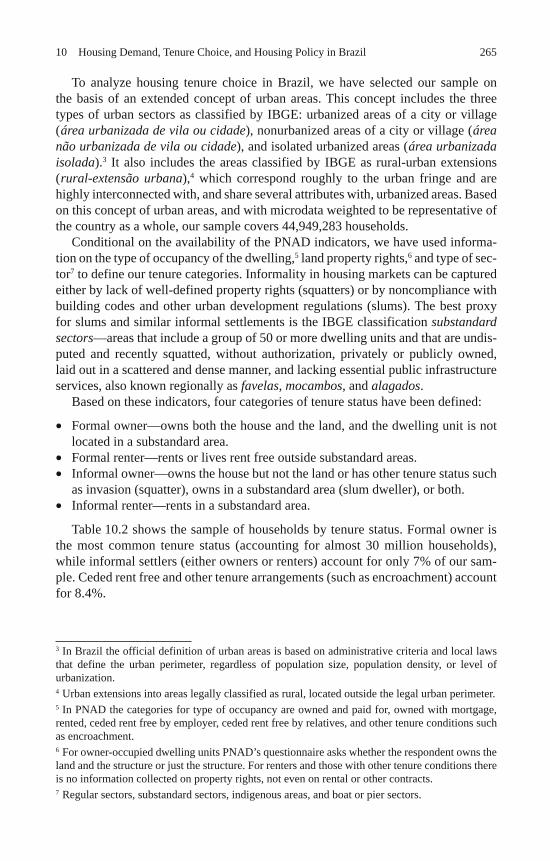
26510 Housing Demand, Tenure Choice, and Housing Policy in Brazil
To analyze housing tenure choice in Brazil, we have selected our sample on the basis of an extended concept of urban areas. This concept includes the three types of urban sectors as classified by IBGE: urbanized areas of a city or village ( área urbanizada de vila ou cidade ), nonurbanized areas of a city or village ( área não urbanizada de vila ou cidade ), and isolated urbanized areas ( área urbanizada isolada ). 3 It also includes the areas classified by IBGE as rural-urban extensions ( rural-extensão urbana ), 4 which correspond roughly to the urban fringe and are highly interconnected with, and share several attributes with, urbanized areas. Based on this concept of urban areas, and with microdata weighted to be representative of the country as a whole, our sample covers 44,949,283 households.
Conditional on the availability of the PNAD indicators, we have used informa-tion on the type of occupancy of the dwelling, 5 land property rights, 6 and type of sec-tor 7 to define our tenure categories. Informality in housing markets can be captured either by lack of well-defined property rights (squatters) or by noncompliance with building codes and other urban development regulations (slums). The best proxy for slums and similar informal settlements is the IBGE classification substandard sectors —areas that include a group of 50 or more dwelling units and that are undis-puted and recently squatted, without authorization, privately or publicly owned, laid out in a scattered and dense manner, and lacking essential public infrastructure services, also known regionally as favelas , mocambos , and alagados .
Based on these indicators, four categories of tenure status have been defined:
• Formal owner—owns both the house and the land, and the dwelling unit is not located in a substandard area.
• Formal renter—rents or lives rent free outside substandard areas. • Informal owner—owns the house but not the land or has other tenure status such
as invasion (squatter), owns in a substandard area (slum dweller), or both. • Informal renter—rents in a substandard area.
Table 10.2 shows the sample of households by tenure status. Formal owner is the most common tenure status (accounting for almost 30 million households), while informal settlers (either owners or renters) account for only 7% of our sam-ple. Ceded rent free and other tenure arrangements (such as encroachment) account for 8.4%.
3 In Brazil the official definition of urban areas is based on administrative criteria and local laws that define the urban perimeter, regardless of population size, population density, or level of urbanization. 4 Urban extensions into areas legally classified as rural, located outside the legal urban perimeter. 5 In PNAD the categories for type of occupancy are owned and paid for, owned with mortgage, rented, ceded rent free by employer, ceded rent free by relatives, and other tenure conditions such as encroachment. 6 For owner-occupied dwelling units PNAD’s questionnaire asks whether the respondent owns the land and the structure or just the structure. For renters and those with other tenure conditions there is no information collected on property rights, not even on rental or other contracts. 7 Regular sectors, substandard sectors, indigenous areas, and boat or pier sectors.
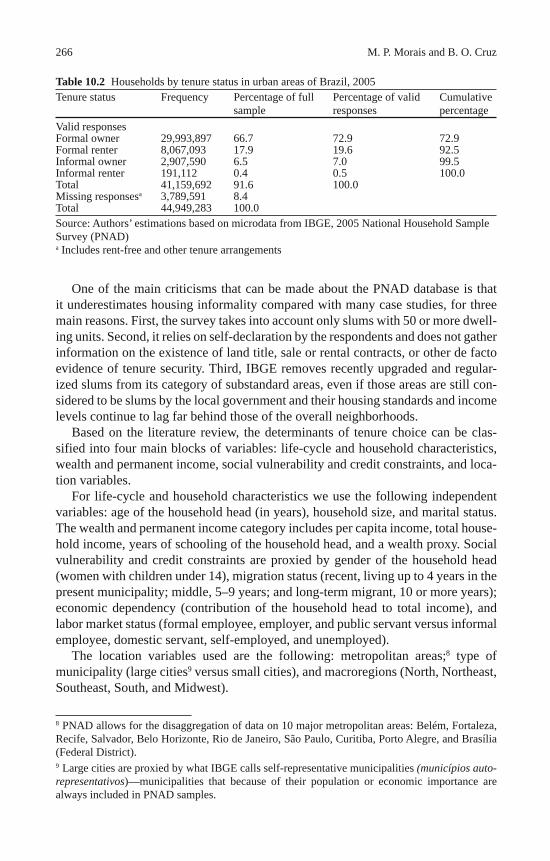
266 M. P. Morais and B. O. Cruz
One of the main criticisms that can be made about the PNAD database is that it underestimates housing informality compared with many case studies, for three main reasons. First, the survey takes into account only slums with 50 or more dwell-ing units. Second, it relies on self-declaration by the respondents and does not gather information on the existence of land title, sale or rental contracts, or other de facto evidence of tenure security. Third, IBGE removes recently upgraded and regular-ized slums from its category of substandard areas, even if those areas are still con-sidered to be slums by the local government and their housing standards and income levels continue to lag far behind those of the overall neighborhoods.
Based on the literature review, the determinants of tenure choice can be clas-sified into four main blocks of variables: life-cycle and household characteristics, wealth and permanent income, social vulnerability and credit constraints, and loca-tion variables.
For life-cycle and household characteristics we use the following independent variables: age of the household head (in years), household size, and marital status. The wealth and permanent income category includes per capita income, total house-hold income, years of schooling of the household head, and a wealth proxy. Social vulnerability and credit constraints are proxied by gender of the household head (women with children under 14), migration status (recent, living up to 4 years in the present municipality; middle, 5–9 years; and long-term migrant, 10 or more years); economic dependency (contribution of the household head to total income), and labor market status (formal employee, employer, and public servant versus informal employee, domestic servant, self-employed, and unemployed).
The location variables used are the following: metropolitan areas; 8 type of municipality (large cities 9 versus small cities), and macroregions (North, Northeast, Southeast, South, and Midwest).
8 PNAD allows for the disaggregation of data on 10 major metropolitan areas: Belém, Fortaleza, Recife, Salvador, Belo Horizonte, Rio de Janeiro, São Paulo, Curitiba, Porto Alegre, and Brasília (Federal District). 9 Large cities are proxied by what IBGE calls self-representative municipalities (municípios auto-representativos )—municipalities that because of their population or economic importance are always included in PNAD samples.
Table 10.2 Households by tenure status in urban areas of Brazil, 2005 Tenure status Frequency Percentage of full
sample Percentage of valid responses
Cumulative percentage
Valid responses Formal owner 29,993,897 66.7 72.9 72.9 Formal renter 8,067,093 17.9 19.6 92.5 Informal owner 2,907,590 6.5 7.0 99.5 Informal renter 191,112 0.4 0.5 100.0 Total 41,159,692 91.6 100.0 Missing responses a 3,789,591 8.4 Total 44,949,283 100.0 Source: Authors’ estimations based on microdata from IBGE, 2005 National Household Sample Survey (PNAD) a Includes rent-free and other tenure arrangements
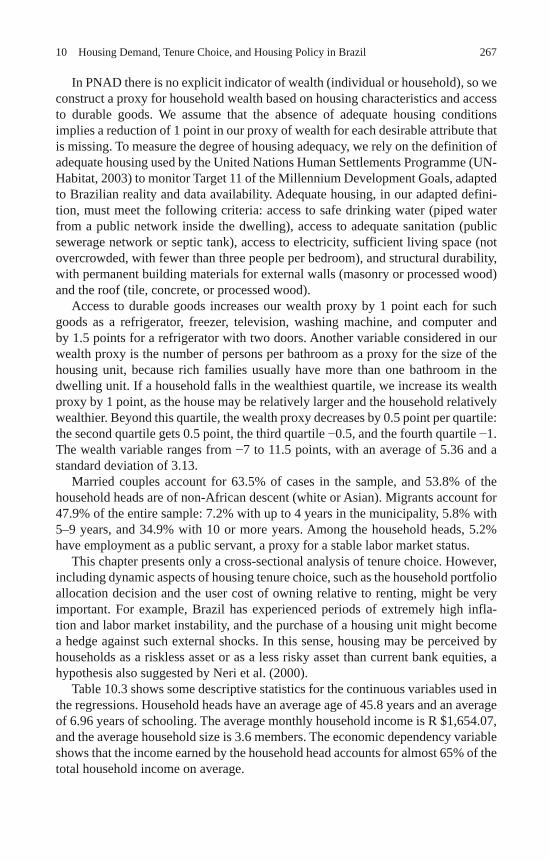
26710 Housing Demand, Tenure Choice, and Housing Policy in Brazil
In PNAD there is no explicit indicator of wealth (individual or household), so we construct a proxy for household wealth based on housing characteristics and access to durable goods. We assume that the absence of adequate housing conditions implies a reduction of 1 point in our proxy of wealth for each desirable attribute that is missing. To measure the degree of housing adequacy, we rely on the definition of adequate housing used by the United Nations Human Settlements Programme (UN-Habitat, 2003) to monitor Target 11 of the Millennium Development Goals, adapted to Brazilian reality and data availability. Adequate housing, in our adapted defini-tion, must meet the following criteria: access to safe drinking water (piped water from a public network inside the dwelling), access to adequate sanitation (public sewerage network or septic tank), access to electricity, sufficient living space (not overcrowded, with fewer than three people per bedroom), and structural durability, with permanent building materials for external walls (masonry or processed wood) and the roof (tile, concrete, or processed wood).
Access to durable goods increases our wealth proxy by 1 point each for such goods as a refrigerator, freezer, television, washing machine, and computer and by 1.5 points for a refrigerator with two doors. Another variable considered in our wealth proxy is the number of persons per bathroom as a proxy for the size of the housing unit, because rich families usually have more than one bathroom in the dwelling unit. If a household falls in the wealthiest quartile, we increase its wealth proxy by 1 point, as the house may be relatively larger and the household relatively wealthier. Beyond this quartile, the wealth proxy decreases by 0.5 point per quartile: the second quartile gets 0.5 point, the third quartile 0.5, and the fourth quartile 1. The wealth variable ranges from 7 to 11.5 points, with an average of 5.36 and a standard deviation of 3.13.
Married couples account for 63.5% of cases in the sample, and 53.8% of the household heads are of non-African descent (white or Asian). Migrants account for 47.9% of the entire sample: 7.2% with up to 4 years in the municipality, 5.8% with 5–9 years, and 34.9% with 10 or more years. Among the household heads, 5.2% have employment as a public servant, a proxy for a stable labor market status.
This chapter presents only a cross-sectional analysis of tenure choice. However, including dynamic aspects of housing tenure choice, such as the household portfolio allocation decision and the user cost of owning relative to renting, might be very important. For example, Brazil has experienced periods of extremely high infla-tion and labor market instability, and the purchase of a housing unit might become a hedge against such external shocks. In this sense, housing may be perceived by households as a riskless asset or as a less risky asset than current bank equities, a hypothesis also suggested by Neri et al. (2000).
Table 10.3 shows some descriptive statistics for the continuous variables used in the regressions. Household heads have an average age of 45.8 years and an average of 6.96 years of schooling. The average monthly household income is R $1,654.07, and the average household size is 3.6 members. The economic dependency variable shows that the income earned by the household head accounts for almost 65% of the total household income on average.
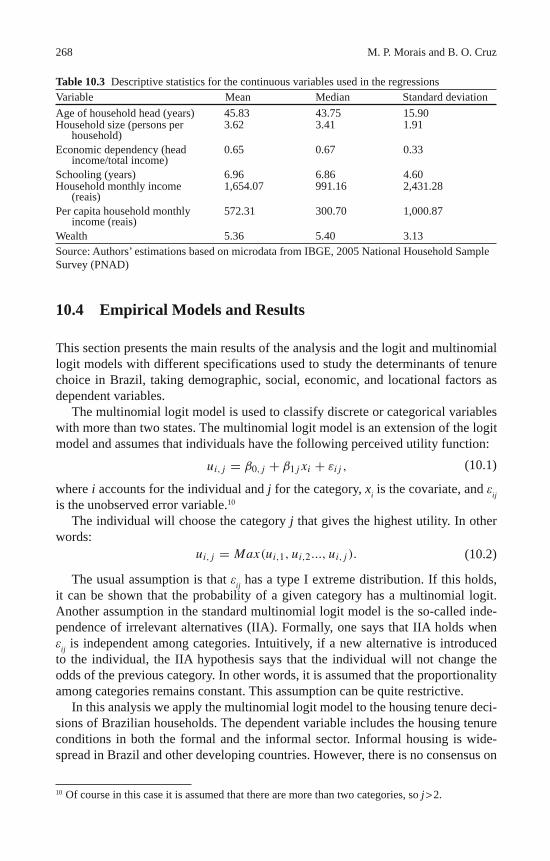
268 M. P. Morais and B. O. Cruz
10.4 Empirical Models and Results
This section presents the main results of the analysis and the logit and multinomial logit models with different specifications used to study the determinants of tenure choice in Brazil, taking demographic, social, economic, and locational factors as dependent variables.
The multinomial logit model is used to classify discrete or categorical variables with more than two states. The multinomial logit model is an extension of the logit model and assumes that individuals have the following perceived utility function:
ui,j = β0,j + β1j xi + εij , (10.1) where i accounts for the individual and j for the category, x i is the covariate, and i j is the unobserved error variable. 10
The individual will choose the category j that gives the highest utility. In other words:
ui,j = Max(ui,1, ui,2..., ui,j ). (10.2)
The usual assumption is that i j has a type I extreme distribution. If this holds, it can be shown that the probability of a given category has a multinomial logit. Another assumption in the standard multinomial logit model is the so-called inde-pendence of irrelevant alternatives (IIA). Formally, one says that IIA holds when i j is independent among categories. Intuitively, if a new alternative is introduced to the individual, the IIA hypothesis says that the individual will not change the odds of the previous category. In other words, it is assumed that the proportionality among categories remains constant. This assumption can be quite restrictive.
In this analysis we apply the multinomial logit model to the housing tenure deci-sions of Brazilian households. The dependent variable includes the housing tenure conditions in both the formal and the informal sector. Informal housing is wide-spread in Brazil and other developing countries. However, there is no consensus on
10 Of course in this case it is assumed that there are more than two categories, so j > 2.
Table 10.3 Descriptive statistics for the continuous variables used in the regressions Variable Mean Median Standard deviation Age of household head (years) 45.83 43.75 15.90 Household size (persons per
household) 3.62 3.41 1.91
Economic dependency (head income/total income)
0.65 0.67 0.33
Schooling (years) 6.96 6.86 4.60 Household monthly income
(reais) 1,654.07 991.16 2,431.28
Per capita household monthly income (reais)
572.31 300.70 1,000.87
Wealth 5.36 5.40 3.13 Source: Authors’ estimations based on microdata from IBGE, 2005 National Household Sample Survey (PNAD)
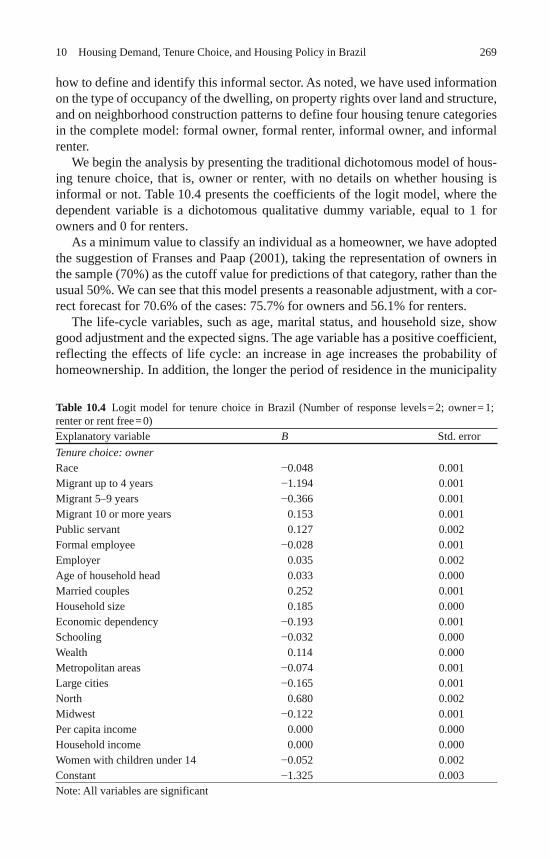
26910 Housing Demand, Tenure Choice, and Housing Policy in Brazil
how to define and identify this informal sector. As noted, we have used information on the type of occupancy of the dwelling, on property rights over land and structure, and on neighborhood construction patterns to define four housing tenure categories in the complete model: formal owner, formal renter, informal owner, and informal renter.
We begin the analysis by presenting the traditional dichotomous model of hous-ing tenure choice, that is, owner or renter, with no details on whether housing is informal or not. Table 10.4 presents the coefficients of the logit model, where the dependent variable is a dichotomous qualitative dummy variable, equal to 1 for owners and 0 for renters.
As a minimum value to classify an individual as a homeowner, we have adopted the suggestion of Franses and Paap (2001), taking the representation of owners in the sample (70%) as the cutoff value for predictions of that category, rather than the usual 50%. We can see that this model presents a reasonable adjustment, with a cor-rect forecast for 70.6% of the cases: 75.7% for owners and 56.1% for renters.
The life-cycle variables, such as age, marital status, and household size, show good adjustment and the expected signs. The age variable has a positive coefficient, reflecting the effects of life cycle: an increase in age increases the probability of homeownership. In addition, the longer the period of residence in the municipality
Table 10.4 Logit model for tenure choice in Brazil (Number of response levels = 2; owner = 1; renter or rent free = 0) Explanatory variable B Std. error Tenure choice: owner Race 0.048 0.001 Migrant up to 4 years 1.194 0.001 Migrant 5–9 years 0.366 0.001 Migrant 10 or more years 0.153 0.001 Public servant 0.127 0.002 Formal employee 0.028 0.001 Employer 0.035 0.002 Age of household head 0.033 0.000 Married couples 0.252 0.001 Household size 0.185 0.000 Economic dependency 0.193 0.001 Schooling 0.032 0.000 Wealth 0.114 0.000 Metropolitan areas 0.074 0.001 Large cities 0.165 0.001 North 0.680 0.002 Midwest 0.122 0.001 Per capita income 0.000 0.000 Household income 0.000 0.000 Women with children under 14 0.052 0.002 Constant 1.325 0.003 Note: All variables are significant
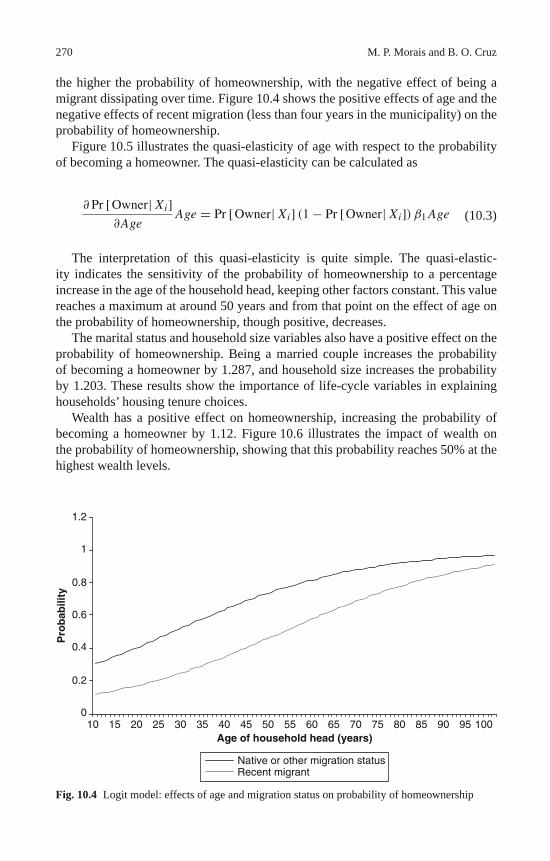
270 M. P. Morais and B. O. Cruz
the higher the probability of homeownership, with the negative effect of being a migrant dissipating over time. Figure 10.4 shows the positive effects of age and the negative effects of recent migration (less than four years in the municipality) on the probability of homeownership.
Figure 10.5 illustrates the quasi-elasticity of age with respect to the probability of becoming a homeowner. The quasi-elasticity can be calculated as
∂ Pr [Owner|Xi]
∂AgeAge = Pr [Owner|Xi] (1− Pr [Owner|Xi]) β1Age
(10.3)
The interpretation of this quasi-elasticity is quite simple. The quasi-elastic-ity indicates the sensitivity of the probability of homeownership to a percentage increase in the age of the household head, keeping other factors constant. This value reaches a maximum at around 50 years and from that point on the effect of age on the probability of homeownership, though positive, decreases.
The marital status and household size variables also have a positive effect on the probability of homeownership. Being a married couple increases the probability of becoming a homeowner by 1.287, and household size increases the probability by 1.203. These results show the importance of life-cycle variables in explaining households’ housing tenure choices.
Wealth has a positive effect on homeownership, increasing the probability of becoming a homeowner by 1.12. Figure 10.6 illustrates the impact of wealth on the probability of homeownership, showing that this probability reaches 50% at the highest wealth levels.
Fig. 10.4 Logit model: effects of age and migration status on probability of homeownership
0
0.2
0.4
0.6
0.8
1
1.2
10 15 20 25 30 35 40 45 50 55 60 65 70 75 80 85 90 95 100Age of household head (years)
Pro
bab
ility
Native or other migration statusRecent migrant
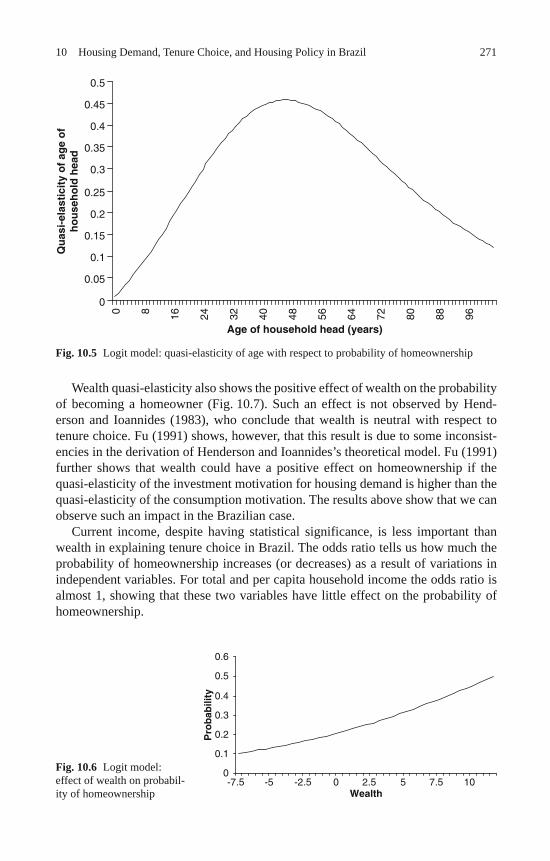
27110 Housing Demand, Tenure Choice, and Housing Policy in Brazil
Wealth quasi-elasticity also shows the positive effect of wealth on the probability of becoming a homeowner (Fig. 10.7). Such an effect is not observed by Hend-erson and Ioannides (1983), who conclude that wealth is neutral with respect to tenure choice. Fu (1991) shows, however, that this result is due to some inconsist-encies in the derivation of Henderson and Ioannides’s theoretical model. Fu (1991) further shows that wealth could have a positive effect on homeownership if the quasi-elasticity of the investment motivation for housing demand is higher than the quasi-elasticity of the consumption motivation. The results above show that we can observe such an impact in the Brazilian case.
Current income, despite having statistical significance, is less important than wealth in explaining tenure choice in Brazil. The odds ratio tells us how much the probability of homeownership increases (or decreases) as a result of variations in independent variables. For total and per capita household income the odds ratio is almost 1, showing that these two variables have little effect on the probability of homeownership.
Fig. 10.5 Logit model: quasi-elasticity of age with respect to probability of homeownership
0
0.05
0.1
0.15
0.2
0.25
0.3
0.35
0.4
0.45
0.5
0 8 16 24 32 40 48 56 64 72 80 88 96
Age of household head (years)
Qu
asi-
elas
tici
ty o
f ag
e o
fh
ou
seh
old
hea
d
Fig. 10.6 Logit model: effect of wealth on probabil-ity of homeownership
0
0.1
0.2
0.3
0.4
0.5
0.6
-7.5 -5 -2.5 0 2.5 5 7.5 10Wealth
Pro
bab
ility
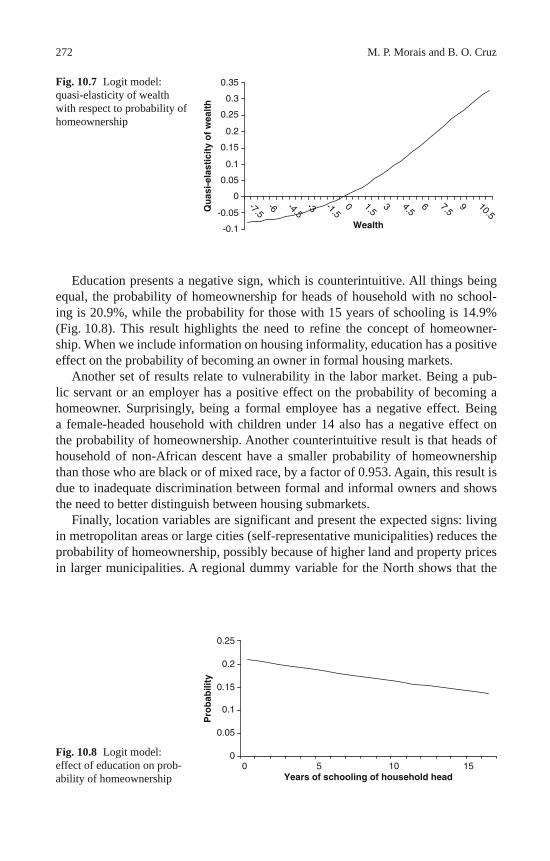
272 M. P. Morais and B. O. Cruz
Education presents a negative sign, which is counterintuitive. All things being equal, the probability of homeownership for heads of household with no school-ing is 20.9%, while the probability for those with 15 years of schooling is 14.9% (Fig. 10.8). This result highlights the need to refine the concept of homeowner-ship. When we include information on housing informality, education has a positive effect on the probability of becoming an owner in formal housing markets.
Another set of results relate to vulnerability in the labor market. Being a pub-lic servant or an employer has a positive effect on the probability of becoming a homeowner. Surprisingly, being a formal employee has a negative effect. Being a female-headed household with children under 14 also has a negative effect on the probability of homeownership. Another counterintuitive result is that heads of household of non-African descent have a smaller probability of homeownership than those who are black or of mixed race, by a factor of 0.953. Again, this result is due to inadequate discrimination between formal and informal owners and shows the need to better distinguish between housing submarkets.
Finally, location variables are significant and present the expected signs: living in metropolitan areas or large cities (self-representative municipalities) reduces the probability of homeownership, possibly because of higher land and property prices in larger municipalities. A regional dummy variable for the North shows that the
Fig. 10.7 Logit model: quasi-elasticity of wealth with respect to probability of homeownership
-0.1
-0.05
0
0.05
0.1
0.15
0.2
0.25
0.3
0.35
-7.5-6 -4.5
-3 -1.50 1.5
3 4.56 7.5
9 10.5Wealth
Qu
asi-
elas
tici
ty o
f w
ealt
h
Fig. 10.8 Logit model: effect of education on prob-ability of homeownership
0
0.05
0.1
0.15
0.2
0.25
0 5 10 15Years of schooling of household head
Pro
bab
ility
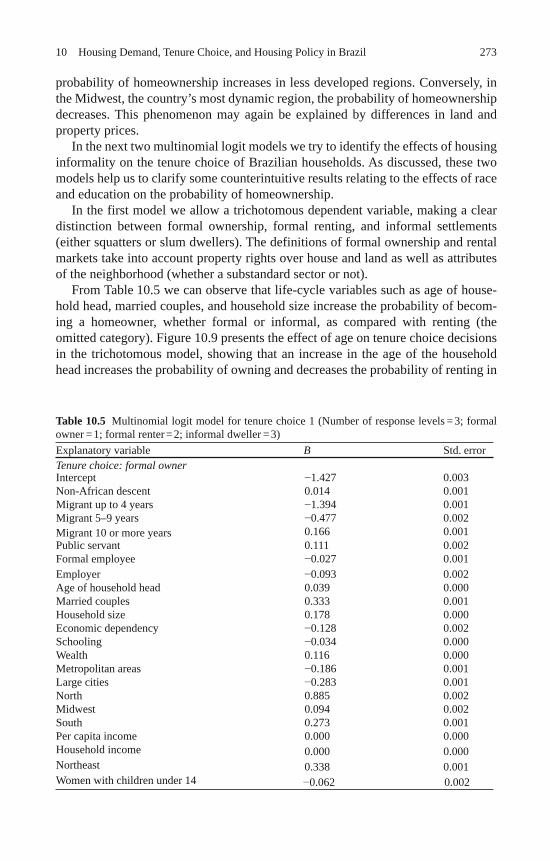
27310 Housing Demand, Tenure Choice, and Housing Policy in Brazil
probability of homeownership increases in less developed regions. Conversely, in the Midwest, the country’s most dynamic region, the probability of homeownership decreases. This phenomenon may again be explained by differences in land and property prices.
In the next two multinomial logit models we try to identify the effects of housing informality on the tenure choice of Brazilian households. As discussed, these two models help us to clarify some counterintuitive results relating to the effects of race and education on the probability of homeownership.
In the first model we allow a trichotomous dependent variable, making a clear distinction between formal ownership, formal renting, and informal settlements (either squatters or slum dwellers). The definitions of formal ownership and rental markets take into account property rights over house and land as well as attributes of the neighborhood (whether a substandard sector or not).
From Table 10.5 we can observe that life-cycle variables such as age of house-hold head, married couples, and household size increase the probability of becom-ing a homeowner, whether formal or informal, as compared with renting (the omitted category). Figure 10.9 presents the effect of age on tenure choice decisions in the trichotomous model, showing that an increase in the age of the household head increases the probability of owning and decreases the probability of renting in
Explanatory variable B Std. error Tenure choice: formal owner Intercept 1.427 0.003 Non-African descent 0.014 0.001 Migrant up to 4 years 1.394 0.001 Migrant 5–9 years 0.477 0.002 Migrant 10 or more years 0.166 0.001 Public servant 0.111 0.002 Formal employee 0.027 0.001 Employer 0.093 0.002 Age of household head 0.039 0.000 Married couples 0.333 0.001 Household size 0.178 0.000 Economic dependency 0.128 0.002 Schooling 0.034 0.000 Wealth 0.116 0.000 Metropolitan areas 0.186 0.001 Large cities 0.283 0.001 North 0.885 0.002 Midwest 0.094 0.002 South 0.273 0.001 Per capita income 0.000 0.000 Household income 0.000 0.000 Northeast 0.338 0.001 Women with children under 14 0.062 0.002
Table 10.5 Multinomial logit model for tenure choice 1 (Number of response levels = 3; formal owner = 1; formal renter = 2; informal dweller = 3)
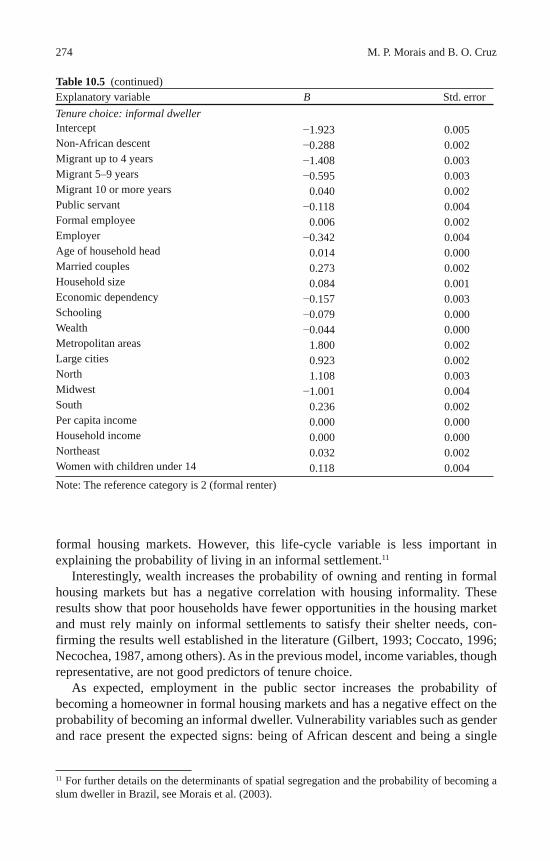
274 M. P. Morais and B. O. Cruz
formal housing markets. However, this life-cycle variable is less important in explaining the probability of living in an informal settlement. 11
Interestingly, wealth increases the probability of owning and renting in formal housing markets but has a negative correlation with housing informality. These results show that poor households have fewer opportunities in the housing market and must rely mainly on informal settlements to satisfy their shelter needs, con-firming the results well established in the literature (Gilbert, 1993; Coccato, 1996; Necochea, 1987, among others). As in the previous model, income variables, though representative, are not good predictors of tenure choice.
As expected, employment in the public sector increases the probability of becoming a homeowner in formal housing markets and has a negative effect on the probability of becoming an informal dweller. Vulnerability variables such as gender and race present the expected signs: being of African descent and being a single
11 For further details on the determinants of spatial segregation and the probability of becoming a slum dweller in Brazil, see Morais et al. (2003).
Explanatory variable B Std. error Tenure choice: informal dweller Intercept 1.923 0.005 Non-African descent 0.288 0.002 Migrant up to 4 years 1.408 0.003 Migrant 5–9 years 0.595 0.003 Migrant 10 or more years 0.040 0.002 Public servant 0.118 0.004 Formal employee 0.006 0.002 Employer 0.342 0.004 Age of household head 0.014 0.000 Married couples 0.273 0.002 Household size 0.084 0.001 Economic dependency 0.157 0.003 Schooling 0.079 0.000 Wealth 0.044 0.000 Metropolitan areas 1.800 0.002 Large cities 0.923 0.002 North 1.108 0.003 Midwest 1.001 0.004 South 0.236 0.002 Per capita income 0.000 0.000 Household income 0.000 0.000 Northeast 0.032 0.002 Women with children under 14 0.118 0.004 Note: The reference category is 2 (formal renter)
Table 10.5 (continued)
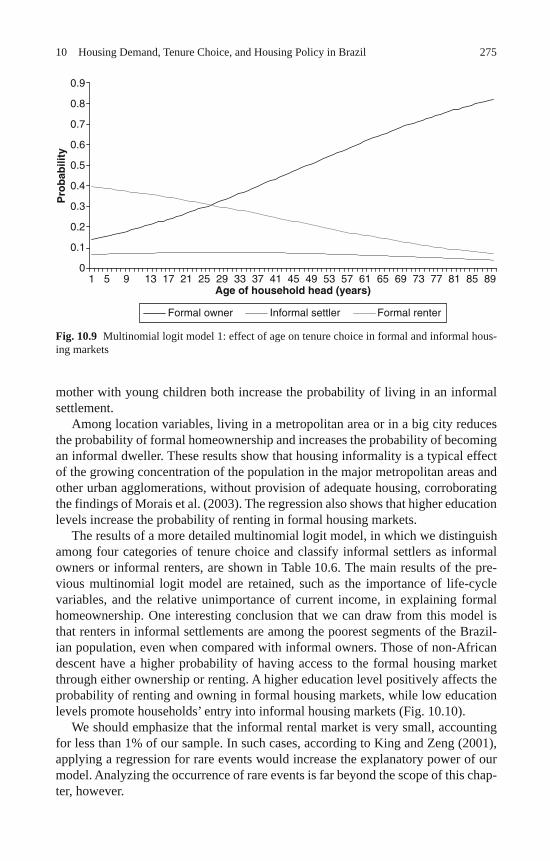
27510 Housing Demand, Tenure Choice, and Housing Policy in Brazil
mother with young children both increase the probability of living in an informal settlement.
Among location variables, living in a metropolitan area or in a big city reduces the probability of formal homeownership and increases the probability of becoming an informal dweller. These results show that housing informality is a typical effect of the growing concentration of the population in the major metropolitan areas and other urban agglomerations, without provision of adequate housing, corroborating the findings of Morais et al. (2003). The regression also shows that higher education levels increase the probability of renting in formal housing markets.
The results of a more detailed multinomial logit model, in which we distinguish among four categories of tenure choice and classify informal settlers as informal owners or informal renters, are shown in Table 10.6. The main results of the pre-vious multinomial logit model are retained, such as the importance of life-cycle variables, and the relative unimportance of current income, in explaining formal homeownership. One interesting conclusion that we can draw from this model is that renters in informal settlements are among the poorest segments of the Brazil-ian population, even when compared with informal owners. Those of non-African descent have a higher probability of having access to the formal housing market through either ownership or renting. A higher education level positively affects the probability of renting and owning in formal housing markets, while low education levels promote households’ entry into informal housing markets (Fig. 10.10).
We should emphasize that the informal rental market is very small, accounting for less than 1% of our sample. In such cases, according to King and Zeng (2001), applying a regression for rare events would increase the explanatory power of our model. Analyzing the occurrence of rare events is far beyond the scope of this chap-ter, however.
Fig. 10.9 Multinomial logit model 1: effect of age on tenure choice in formal and informal hous-ing markets
0
0.1
0.2
0.3
0.4
0.5
0.6
0.7
0.8
0.9
1Age of household head (years)
Pro
bab
ility
Formal owner Informal settler Formal renter
5 9 13 17 21 25 29 33 37 41 45 49 53 57 61 65 69 73 77 81 85 89
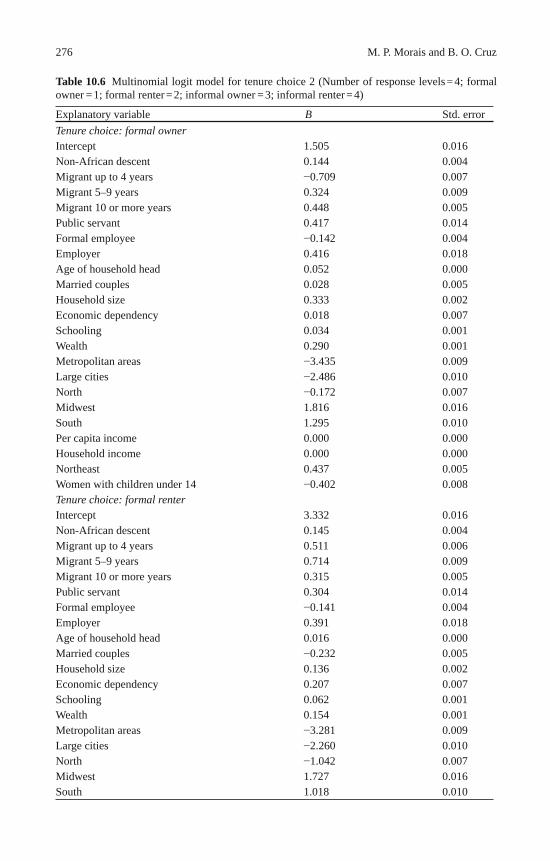
276 M. P. Morais and B. O. Cruz
Explanatory variable B Std. error Tenure choice: formal owner Intercept 1.505 0.016 Non-African descent 0.144 0.004 Migrant up to 4 years 0.709 0.007 Migrant 5–9 years 0.324 0.009 Migrant 10 or more years 0.448 0.005 Public servant 0.417 0.014 Formal employee 0.142 0.004 Employer 0.416 0.018 Age of household head 0.052 0.000 Married couples 0.028 0.005 Household size 0.333 0.002 Economic dependency 0.018 0.007 Schooling 0.034 0.001 Wealth 0.290 0.001 Metropolitan areas 3.435 0.009 Large cities 2.486 0.010 North 0.172 0.007 Midwest 1.816 0.016 South 1.295 0.010 Per capita income 0.000 0.000 Household income 0.000 0.000 Northeast 0.437 0.005 Women with children under 14 0.402 0.008 Tenure choice: formal renter Intercept 3.332 0.016 Non-African descent 0.145 0.004 Migrant up to 4 years 0.511 0.006 Migrant 5–9 years 0.714 0.009 Migrant 10 or more years 0.315 0.005 Public servant 0.304 0.014 Formal employee 0.141 0.004 Employer 0.391 0.018 Age of household head 0.016 0.000 Married couples 0.232 0.005 Household size 0.136 0.002 Economic dependency 0.207 0.007 Schooling 0.062 0.001 Wealth 0.154 0.001 Metropolitan areas 3.281 0.009 Large cities 2.260 0.010 North 1.042 0.007 Midwest 1.727 0.016 South 1.018 0.010
Table 10.6 Multinomial logit model for tenure choice 2 (Number of response levels = 4; formal owner = 1; formal renter = 2; informal owner = 3; informal renter = 4)
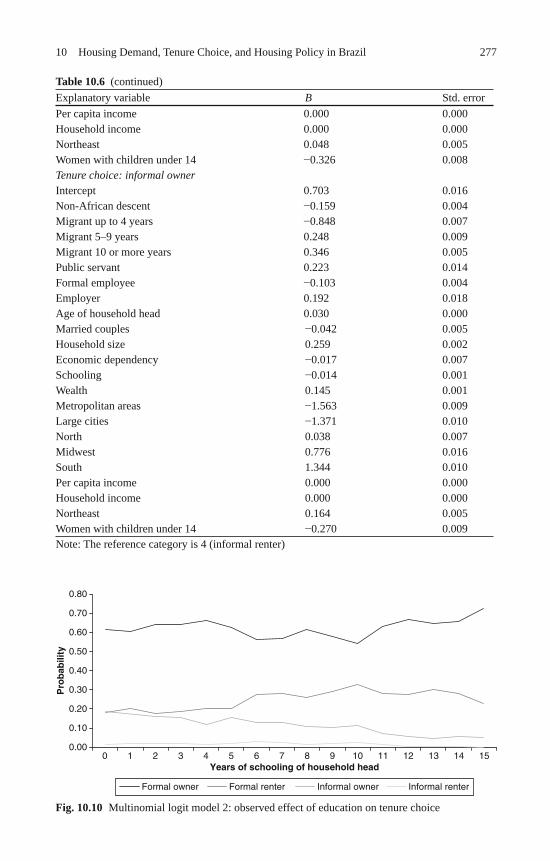
27710 Housing Demand, Tenure Choice, and Housing Policy in Brazil
Explanatory variable B Std. error Per capita income 0.000 0.000 Household income 0.000 0.000 Northeast 0.048 0.005 Women with children under 14 0.326 0.008 Tenure choice: informal owner Intercept 0.703 0.016 Non-African descent 0.159 0.004 Migrant up to 4 years 0.848 0.007 Migrant 5–9 years 0.248 0.009 Migrant 10 or more years 0.346 0.005 Public servant 0.223 0.014 Formal employee 0.103 0.004 Employer 0.192 0.018 Age of household head 0.030 0.000 Married couples 0.042 0.005 Household size 0.259 0.002 Economic dependency 0.017 0.007 Schooling 0.014 0.001 Wealth 0.145 0.001 Metropolitan areas 1.563 0.009 Large cities 1.371 0.010 North 0.038 0.007 Midwest 0.776 0.016 South 1.344 0.010 Per capita income 0.000 0.000 Household income 0.000 0.000 Northeast 0.164 0.005 Women with children under 14 0.270 0.009 Note: The reference category is 4 (informal renter)
Table 10.6 (continued)
Fig. 10.10 Multinomial logit model 2: observed effect of education on tenure choice
0.10
0.20
0.30
0.40
0.50
0.60
0.70
Years of schooling of household head
Pro
bab
ility
0.00
0.80
Formal owner Formal renter Informal owner Informal renter
1 2 3 4 5 6 7 8 9 10 11 12 13 140 15
278 M. P. Morais and B. O. Cruz
10.5 Conclusions and Policy Implications
The objective of this chapter is to analyze the tenure choice behavior of Brazilian households, based on 2005 household survey (PNAD) data, so as to derive some policy conclusions. The main results show that wealth is a good predictor of formal homeownership while current income has a very small (though statistically sig-nificant) effect on tenure choice decisions. Life-cycle variables such as age of the household head, marital status, and household size increase the probability of for-mal homeownership. These results suggest that policy makers in Brazil, who have always designed housing policy on the basis of current income levels, might want to consider creating housing programs or incentives that explicitly take into account households’ stage in the life cycle, such as incentives for first-time home buyers or subsidies for rental housing for the young or the elderly.
More vulnerable households, such as the poor, those of African descent, and single women with children under age 14, have a higher probability of living in informal settlements, showing that they have limited tenure choice. Including infor-mation on housing informality in the models improves the quality of the forecasts and changes the sign of the effect of being of African descent on homeownership.
Education has a significant effect on tenure choice, but the sign of the effect on homeownership depends on the specification of the dependent variable. Education enhances the probability of being in the formal housing sector, as either a renter or an owner. Recent migration (being in the municipality for less than four years) has a negative effect on homeownership, but the effect of migration dissipates over time.
The extended multinomial logit models, which include informal tenure arrange-ments in the dependent variable, generally perform better than the simple, dichoto-mous “owner versus renter” logit model in explaining tenure choice in Brazil. Even if the models perform well in explaining tenure choice behavior in the formal sector, however, predictions in the informal sector are quite poor. One possible explana-tion for this may be the existence of local characteristics that affect tenure choice in specific places and that our dummy variables for fixed effects are unable to account for. In general, if we restrict our sample to metropolitan areas, the predictive power of the models for the informal sector increases. Some corrections for the rare event bias might also be performed (see e.g., King & Zeng, 2001).
One possible extension of this study would be to try to estimate a separate model for each metropolitan area or even to estimate tenure choice at the intracity level, taking into account households’ locational decision as well as their tenure choice, based on methodologies developed by Gibb (2000) or Elder and Zumpano (1991). The assumption of independence of irrelevant alternatives might be quite restrictive in some cases; to avoid this hypothesis, perhaps a formal test could be performed or the nested logit model used (see e.g., Franses & Paap, 2001).
Vulnerability and credit constraint variables need to be more detailed and fur-ther refined because they show different effects being measured by the same set of variables. An unexpected result is that being a formal employee has a negative effect on the probability of becoming a homeowner. More information on informal property rights and tenure security is needed to improve the quality of our forecasts,
27910 Housing Demand, Tenure Choice, and Housing Policy in Brazil
because informality is not well captured in PNAD. Including questions in PNAD about perceived and de facto tenure security, such as the existence of legal title or formal purchase and rental contracts, would be useful. One of the key variables for explaining tenure choice and housing prices in the informal sector is the probability of losing the housing equity, and this variable is not explicitly accounted for in the cross-sectional empirical models.
Another interesting study that could be developed is the dynamic analysis of ten-ure choice based on pseudo panels constructed from the 1992–2005 PNAD series, so that the analysis could take into account the effect of inflation on tenure choice and on the user cost of owning relative to renting. The effects of tenure insecurity on tenure decisions could also be better captured in a dynamic framework, because perceived tenure security increases over time if land remains unclaimed for a long period. The effects of precarious insertion in the labor market on cohabitation and length of stay in the parental home and the economic obstacles to the formation of new households would also be interesting subjects for future research.
To conclude, one general recommendation of this chapter is that policy mak-ers should not focus exclusively on owner-occupied housing as the best housing solution. A wider range of housing options—with different tenure arrangements, prices, qualities, and locations—should be available to Brazilian households, allow-ing them to choose the solution that best fits their housing needs. Rental hous-ing can offer good housing solutions for young people seeking employment and for newly arrived migrants, with rental markets serving a particularly important function in alleviating housing shortages in urban agglomerations and fast-growing urban areas.
In addition, if policy makers want to promote economic efficiency and social inclusion in housing markets, they should give more attention to household com-position, life cycle, and wealth and income distribution when designing housing policies and programs.
Acknowledgements The authors have benefited from discussions with and support from Carlos Wagner de Albuquerque Oliveira, George Alex da Guia, Emmanuel Cavalcante Porto, James Rich-ard Santos, Lucas Veras Salgado, Juliana Wenceslau, Flavio Vidal, Donald Mathew Pianto, and Leonardo Klüppel. The authors take responsibility for all errors and omissions, however, and the conclusions they draw do not necessarily reflect the institutional view of the Institute of Applied Economic Research (IPEA).
References
Amis, P. (1984). Squatters or tenants: The commercialization of unauthorized housing in Nairobi. World Development , 12 (1), 87–96.
Arimah, B. (1997). The determinants of housing tenure choice in Ibadan, Nigeria. Urban Studies , 34 (1), 105–124.
Birnbaum, H., & Weston, R. (1974). Homeownership and the wealth position of black and white Americans. Review of Income and Wealth , 20 (1), 103–114.
Blackley, D., & Follain, J. R. (1983). Inflation, tax advantages to homeownership and the loca-tional choices of households. Regional Science and Urban Economics , 13 (4), 505–516.
280 M. P. Morais and B. O. Cruz
Bonduki, N. (1998). Origens da habitação social no Brasil. Arquitetura moderna, lei do inquili-nato e difusão da casa própria . São Paulo: Estação Liberdade, FAPESP.
Bourassa, S. C. (1995). A model of housing tenure choice in Australia. Journal of Urban Econom-ics , 37 (2), 161–175.
Coccato, M. (1996). Alternatives to home ownership: Rental and shared sub-markets in informal settlements . Master’s thesis, McGill University, Montreal.
Coulomb, R. (1988). Rental housing and the dynamics of urban growth in Mexico City. In A. Gilbert (Ed.), Housing and land in urban Mexico (pp. 39–50). San Diego: Center for U.S.-Mexican Studies.
Coulson, N. (1999). Why are Hispanic and Asian-American homeownership rates so low? Immi-gration and other factors. Journal of Urban Economics , 45 (2), 209–227.
Daniere, A. (1992). Determinants of tenure choice in the third world: An empirical study of Cairo and Manila. Journal of Housing Economics , 2 (2), 159–184.
Deaton, A. (1992). Understanding consumption . Oxford: Oxford University Press. DiPasquale, D., & Glaeser, E. L. (1999). Incentives and social capital: Are homeowners better
citizens? Journal of Urban Economics , 45 . doi: 10.1006/juec.1998.2098. Di Salvo, P, & Ermisch, J. (1997). Analysis of the dynamics of housing tenure choice in Britain.
Journal of Urban Economics , 42 (1), 1–17. Draibe, S. M. (1994). As políticas sociais do regime militar. In: Soares, G. & D´Araujo, M. C.
(orgs.). 25 Anos de Regime Militar. Rio de Janeiro: FGV. Durand-Lasserve, A. (1986). L’exclusion des pauvres dans les villes du Tiers-Mondes. Paris:
L’Harmattan. Edwards, M. (1982). Cities of tenants: Renting among the urban poor in Latin America. In
A. Gilbert, J. Hardoy, & R. Ramirez (Eds.), Urbanization in contemporary Latin America (pp. 128–158). Chichester, England: Wiley.
Edwards, M. (1990). Rental housing and the urban poor: Africa and Latin America compared. In P. Amis & P. Lloyd (Eds.), Housing Africa’s urban poor (pp. 253–272). Manchester, England: Manchester University Press.
Elder, H. W., & Zumpano, L. V. (1991). Tenure choice, housing demand, and residential location. Journal of Real Estate Research , 6 (3), 341–356.
Englund, P., Kim, K., Malpezzi, S., & Turner, B. (2005, August). Housing tenure across countries: The effects of regulations and institutions . Paper presented at the American Real Estate and Urban Economics Association conference, Los Cabanas, Mexico.
Ermisch, J. F., Findlay, J., & Gibb, K. (1996). The price elasticity of housing demand in Britain: Issues of sample selection. Journal of Housing Economics , 5 (1), 64–86.
Franses, P., & Paap, R. (2001). Qualitative models in marketing research . Cambridge: Cambridge University Press.
Fu, Y. (1991). A model of housing tenure choice: Comment. American Economic Review , 81 (1), 381–383.
Gibb, K. (2000). Modeling housing choice and demand in a social housing system: The case of Glasgow . Working Paper 1027. University of California at Berkeley, Institute of Business and Economic Research, Berkeley Program on Housing and Urban Policy.
Gilbert, A. (1983). The tenants of self-help housing: Choice and constraint in the housing markets of less developed countries. Development and Change , 14 (3), 449–477.
Gilbert, A. (1993). In search of a home: Rental housing in Latin America . London: UCL Press. Goodman, A. C. (1988). An econometric model of housing price, permanent income, tenure choice
and housing demand. Journal of Urban Economics , 23 (1), 327–353. Green, R. K. (1998). Finding a home in a frontier city: The dynamics of housing tenure in Santa
Cruz, Bolivia. PhD dissertation, University College London. Green, R. K. (2001). Home owning, social outcomes, tenure choice, and U.S. housing policy.
Cityscape , 5 (2), 21–29. Green, R., & White, M. (1997). Measuring the benefits of homeowning: Effects on children. Jour-
nal of Urban Economics , 41 (3), 441–461.
28110 Housing Demand, Tenure Choice, and Housing Policy in Brazil
Grootaert, C., & Dubois, J. (1988). Tenancy choice and the demand for rental housing in the cities of the Ivory Coast. Journal of Urban Economics , 24 (1), 44–63.
Hansen, E., & Justin, W. (1988). Economic issues and the progressive housing development model. In C. Patton (Ed.), Spontaneous shelter: International perspectives and prospects (pp. 303–325). Philadelphia: Temple University Press.
Haurin, D., Parcel, T., & Haurin, R. (2002). Does homeownership affect child outcomes? Real Estate Economics , 30 (4), 635–666.
Haurin, R. D., Hendershott, P. H., & Wachter, S. (1997). Borrowing constraints and the tenure choice of young households. Journal of Housing Research , 8 (2), 137–154.
Henderson, J. V., & Ioannides, Y. M. (1983). A model of housing tenure choice. American Eco-nomic Review , 73 (1), 98–113.
Henley, A. (1998). Residential mobility, housing equity and the labor market. Economic Journal , 108 (447), 414–427.
Huang, Y., & Clark, W. (2002). Housing tenure choice in transitional urban China: A multilevel analysis. Urban Studies , 39 (1), 7–32.
Ioannides, Y. M. (1987). Residential mobility and housing tenure choice. Regional Science and Urban Economics , 17 (2), 265–287.
Iwarere, L. J., & Williams, J. E. (1991). A micro-market analysis of tenure choice using the logit model. Journal of Real Estate Research , 6 (3), 327–339.
Jacobs, M., & Savedoff, W. D. (1999). There’s more than one way to get a house: Housing strate-gies in Panama . Washington, DC: Inter-American Development Bank.
Jones, L. D. (1994). Testing the central prediction of housing tenure transition models. Journal of Urban Economics , 38 (1), 50–73.
Kain, J., & Quigley, J. (1972). Housing market discrimination, home-ownership and savings behavior. American Economic Review , 62 (3), 263–277.
King, G., & Zeng, L. (2001). Logistic regression in rare events data. Political Analysis , 9 (2), 137–163.
King, M. A. (1980). An econometric model of tenure choice and demand for housing as a joint decision. Journal of Public Economics , 14 (2), 137–159.
Koizumi, N., & McCann, P. (2006). Living on a plot of land as a tenure choice: The case of Panama. Journal of Housing Economics , 15 (4), 349–371.
Li, M. M. (1977). A logit model of homeownership. Econometrica , 45 (5), 1081–1097. Lim, G. C. (1987). Housing policies for the urban poor in developing countries. Journal of the
American Planning Association , 53 (2), 176–185. Linneman, P., & Wachter, S. (1989). The impacts of borrowing constraints on homeownership.
Journal of the American Real Estate & Urban Economics Association , 17 (14), 389–402. Malpezzi, S., & Mayo, S. K. (1987). User cost and housing tenure in developing countries. Journal
of Development Economics , 25 (1), 197–220. Maricato, E., Bonduki, N., & Tanaka, G. (2006). Quantificação, custo e regionalização do défi-
cit habitacional brasileiro . Unpublished manuscript, University of São Paulo, School of Architecture.
McDonald, J. F. (1974). Housing market discrimination, homeownership, and savings behavior: Comment. American Economic Review , 64 (1), 225–229.
Mehta, M., & Mehta, D. (1989). Metropolitan housing market: A study of Ahmedabad . New Delhi: Sage.
Miraftab, F. (1997). Revisiting informal sector homeownership: The relevance of household composition for housing options of the poor. International Journal of Urban and Regional Research , 21 (2), 303–322.
Morais, M. P., Cruz, B. O., & Oliveira, C. W. (2003). Residential segregation and social exclu-sion in Brazilian housing markets . Texto para Discussão 951. Brasília: Institute of Applied Economic Research (IPEA).
Necochea, A. (1987). Los allegados: Una estrategia de supervivencia solidaria en vivienda. Medio Ambiente y Urbanización, Mercados de Tierra Urbana , 21 , 70–79.
282 M. P. Morais and B. O. Cruz
Neri, M., Carvalho, A., & Nascimento, M. (2000). Ciclo de vida e motivações financeiras . Ensaios Econômicos da EPGE 393. Rio de Janeiro: Getulio Vargas Foundation, Graduate School of Economics.
Painter, G., Gabriel, S., & Myers, D. (2001). Race, immigrant status, and housing tenure choice. Journal of Urban Economics , 49 (1), 150–167.
Payne, G. (1988). Informal housing and land subdivisions in third world cities: A review of the literature . Oxford: Centre for Development and Environmental Planning.
Pianto, D. M. (2004). A literature review of tenure choice . Unpublished manuscript, Institute of Applied Economic Research (IPEA), Brasília.
Rakodi, C. (1992). Housing markets in third world cities: Research and policy into the 1990s. World Development , 20 (1), 39–52.
Ribeiro, L. C. Q. (1997). Dos cortiços aos condomínios fechados: As formas de produção da moradia na Cidade do Rio de Janeiro . Rio de Janeiro: Civilização Brasileira, IPPUR/UFRJ, FASE.
Roistacher, E. A., & Goodman, J. L. (1976). Race and homeownership: Is discrimination disap-pearing? Economic Inquiry , 14 (1), 59–70.
Rosen, H. (1979). Housing decisions and the U.S. income tax: An econometric analysis. Journal of Public Economics , 11 (1), 1–23.
Rothenberg, J., Galster, G., Butler, R., & Pitkin, J. (1992). The maze of urban housing markets: Theory, evidence , and policy . Chicago: University of Chicago Press.
Sampaio, M. R. (1994). O papel da iniciativa privada na formação da periferia paulistana. Espaço e Debates , 37 (14), 19–33.
Silva e Silva, M. O. (1989). Política habitacional: Verso e reverso . São Paulo: Cortez. Silveira, R., & Malpezzi, S. (1991). Costs and benefits of rent control in Rio de Janeiro . Infra-
structure and Urban Development Department Discussion Paper 83. Washington, DC: World Bank.
Struyk, R., Hoffman, M., & Katsura, H. (Eds.). (1990). The market for shelter in Indonesian cities . Washington, DC: Urban Institute Press.
Turner, J. (1968). Housing priorities, settlement patterns and urban development in modernizing countries. Journal of the American Institute of Planners , 34 (6), 354–363.
UN-Habitat (United Nations Human Settlements Programme). (2003). Improving the lives of 100 million slum dwellers: Guide to monitoring Target 11 . Nairobi: Author.
Van Lindert, P., & Westen, A. (1991). Household shelter strategies in comparative perspec-tive: Evidence from low-income groups in Bamako and La Paz. World Development , 19 (8), 1007–1028.
Wadhva, K. (1988, August 20). Housing programs for the urban poor: Shifting priorities. Eco-nomic and Political Weekly , pp. 1762–1765.
Wandeler, K., & Khanaiklang, A. (1992). Low-income rental and rent-free housing. In K. S. Yap (Ed.), Low-income housing in Bangkok: A review of some housing sub-markets (pp. 115–136). Bangkok: Asian Institute of Technology.
Ward, P. (1982). Self help housing: A critique . London: Mansell. World Bank. (1993). Housing: Enabling markets to work . World Bank Policy Paper. Washington,
DC: Author. Yap, K. S. (Ed.). (1992). Low-income housing in Bangkok: A review of some housing sub-markets .
Bangkok: Asian Institute of Technology.
283
Housing has been a major problem in the large cities of developing countries, with a distinctive feature being a growing informal sector. Indeed, much of the literature on housing in such cities has focused on the informal sector, revealing the limits of the formal market.
In this chapter we seek another perspective, focusing mainly on the “other side of the coin”: the formal market and its capabilities and limitations in providing housing. Formal housing markets have been somewhat neglected in the recent housing litera-ture, a reflection of the declining importance given to the concept of empowerment that pervaded the literature at the beginning of the 1990s (World Bank, 1993).
Essential to the preparation of this chapter has been our operational knowledge of a database on new housing produced for the market in the city of São Paulo, Brazil. With data collected and organized by Empresa Brasileira de Estudos do Patrimônio (EMBRAESP), a local private real estate consultancy, this database has documented housing starts in São Paulo for almost 30 years. 1 The database makes it possible to identify the least expensive units offered by the market—as well as their character-istics and location—and to trace the market’s evolution over the past two decades against income-related indicators. The database also allows verification of the effect of income distribution on the limits of the formal market, as is done in this chapter.
Systematic information on housing starts and their main characteristics is rare in developing country cities, and to the best of our knowledge such information has
1 A comment must be made about the use of housing starts , a term referring to the number of privately owned new housing units on which construction has been started in a given period. The EMBRAESP database actually provides information on new housing units that have started to be marketed (“launched”) in a given period, which is a good proxy for estimating housing starts. We use the term housing starts in this chapter because it is widely used in the economics literature. Here housing starts are used only as a descriptive tool, however, and not for the purpose of statisti-cal tests.
S.V. Lall et al. (eds.), Urban Land Markets, DOI 10.1007/978-1-4020-8862-9_11, © World Bank 2009
Chapter 11Housing Conditions and Income Distribution: Evidence from São PauloEmilio Haddad and João Fernando Pires Meyer
E. Haddad ( )School of Architecture and Planning University of São Paulo 05508-900 São Paulo, Brazile-mail: [email protected]
284 E. Haddad and J. F. P. Meyer
not previously been used in housing market research. Thus introducing and explor-ing this database has been one objective of this study. The chapter reports major findings of the research; others are still to come as the analysis progresses.
Because the study uses existing data, its methodology is not the more traditional scientific approach in which a research question is posed and data are then collected to test a hypothesis. Instead, the study is part of the expanding body of research resulting from the mushrooming of digital databases. Indeed, one of the growing fields in statistics is data mining, a set of concepts and techniques for finding knowl-edge from existing raw data.
A descriptive data analysis was undertaken, relating to four major aspects of the market:
Volume of production Sales price Affordability Developers in the market and their perspective
One intention is to show an interesting and, to the best of our knowledge, innova-tive illustration of affordability by plotting the estimated demand for housing units in the city of São Paulo by income bracket against housing starts at the price afford-able to each of those brackets. Another is to identify some basic characteristics of housing developers in São Paulo, facilitating comparison with those in other cities of the world. We show how their behavior has evolved in recent years and interpret that behavior. In societies around the world, policy makers responsible for housing need to understand the decision-making process of developers, as central players in housing, and to devise incentives for them to better respond to social and environ-mental needs.
In sum, using the case of the city of São Paulo, we explore the potential and limitations of the private sector, as one of the major actors in housing development, in the provision of housing for low-income families. For this analysis a view of the “market as a whole” is informative.
11.1 Background on Housing Conditions and Financing
We begin by providing some background on housing conditions in São Paulo and on developments in housing finance in Brazil. For the purposes of this discussion as well as the study, the market is segmented on the basis of minimum wages: families with a monthly income of 5 or fewer minimum wages are considered low income , and those with an income of 5–30 minimum wages middle income . Families at the lower end of this range, those with an income of 5–10 minimum wages, are consid-ered lower middle income . Those with an income of more than 30 minimum wages are considered high income. 2
2 In Brazil the value of the minimum wage is officially defined by the central government and has been adjusted annually. Because the minimum wage indexes some economic indicators, its adjust-ment follows rules that have a policy content.
••••
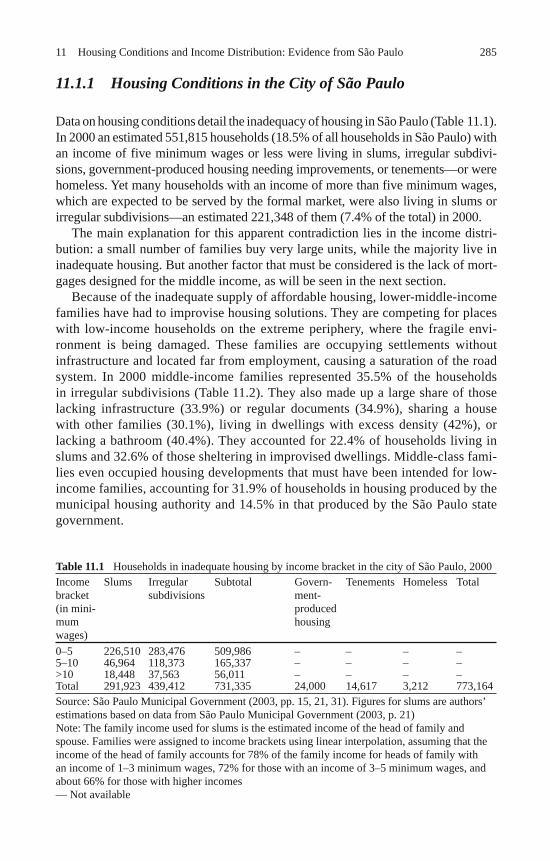
28511 Housing Conditions and Income Distribution: Evidence from São Paulo
11.1.1 Housing Conditions in the City of São Paulo
Data on housing conditions detail the inadequacy of housing in São Paulo (Table 11.1). In 2000 an estimated 551,815 households (18.5% of all households in São Paulo) with an income of five minimum wages or less were living in slums, irregular subdivi-sions, government-produced housing needing improvements, or tenements—or were homeless. Yet many households with an income of more than five minimum wages, which are expected to be served by the formal market, were also living in slums or irregular subdivisions—an estimated 221,348 of them (7.4% of the total) in 2000.
The main explanation for this apparent contradiction lies in the income distri-bution: a small number of families buy very large units, while the majority live in inadequate housing. But another factor that must be considered is the lack of mort-gages designed for the middle income, as will be seen in the next section.
Because of the inadequate supply of affordable housing, lower-middle-income families have had to improvise housing solutions. They are competing for places with low-income households on the extreme periphery, where the fragile envi-ronment is being damaged. These families are occupying settlements without infrastructure and located far from employment, causing a saturation of the road system. In 2000 middle-income families represented 35.5% of the households in irregular subdivisions (Table 11.2). They also made up a large share of those lacking infrastructure (33.9%) or regular documents (34.9%), sharing a house with other families (30.1%), living in dwellings with excess density (42%), or lacking a bathroom (40.4%). They accounted for 22.4% of households living in slums and 32.6% of those sheltering in improvised dwellings. Middle-class fami-lies even occupied housing developments that must have been intended for low-income families, accounting for 31.9% of households in housing produced by the municipal housing authority and 14.5% in that produced by the São Paulo state government.
Table 11.1 Households in inadequate housing by income bracket in the city of São Paulo, 2000Income bracket (in mini-mum wages)
Slums Irregular subdivisions
Subtotal Govern-ment-produced housing
Tenements Homeless Total
0–5 226,510 283,476 509,986 – – – –5–10 46,964 118,373 165,337 – – – –>10 18,448 37,563 56,011 – – – –Total 291,923 439,412 731,335 24,000 14,617 3,212 773,164Source: São Paulo Municipal Government (2003, pp. 15, 21, 31). Figures for slums are authors’estimations based on data from São Paulo Municipal Government (2003, p. 21)Note: The family income used for slums is the estimated income of the head of family and spouse. Families were assigned to income brackets using linear interpolation, assuming that the income of the head of family accounts for 78% of the family income for heads of family with an income of 1–3 minimum wages, 72% for those with an income of 3–5 minimum wages, and about 66% for those with higher incomes— Not available
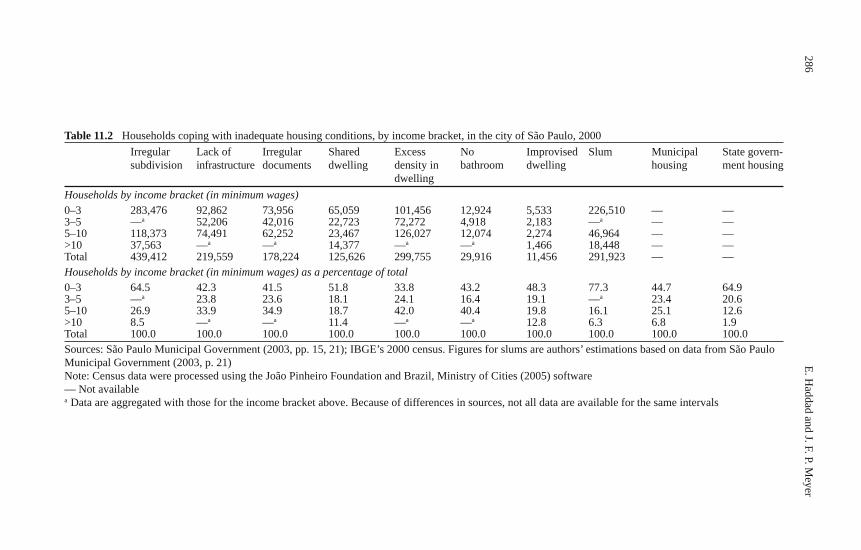
286E. H
addad and J. F. P. Meyer
Table 11.2 Households coping with inadequate housing conditions, by income bracket, in the city of São Paulo, 2000 Irregular
subdivision Lack of infrastructure
Irregular documents
Shared dwelling
Excess density in dwelling
No bathroom
Improvised dwelling
Slum Municipal housing
State govern-ment housing
Households by income bracket (in minimum wages)0–3 283,476 92,862 73,956 65,059 101,456 12,924 5,533 226,510 — —3–5 —a 52,206 42,016 22,723 72,272 4,918 2,183 —a — —5–10 118,373 74,491 62,252 23,467 126,027 12,074 2,274 46,964 — —>10 37,563 —a —a 14,377 —a —a 1,466 18,448 — —Total 439,412 219,559 178,224 125,626 299,755 29,916 11,456 291,923 — —Households by income bracket (in minimum wages) as a percentage of total0–3 64.5 42.3 41.5 51.8 33.8 43.2 48.3 77.3 44.7 64.93–5 —a 23.8 23.6 18.1 24.1 16.4 19.1 —a 23.4 20.65–10 26.9 33.9 34.9 18.7 42.0 40.4 19.8 16.1 25.1 12.6>10 8.5 —a —a 11.4 —a —a 12.8 6.3 6.8 1.9Total 100.0 100.0 100.0 100.0 100.0 100.0 100.0 100.0 100.0 100.0Sources: São Paulo Municipal Government (2003, pp. 15, 21); IBGE’s 2000 census. Figures for slums are authors’ estimations based on data from São Paulo Municipal Government (2003, p. 21)Note: Census data were processed using the João Pinheiro Foundation and Brazil, Ministry of Cities (2005) software— Not availablea Data are aggregated with those for the income bracket above. Because of differences in sources, not all data are available for the same intervals
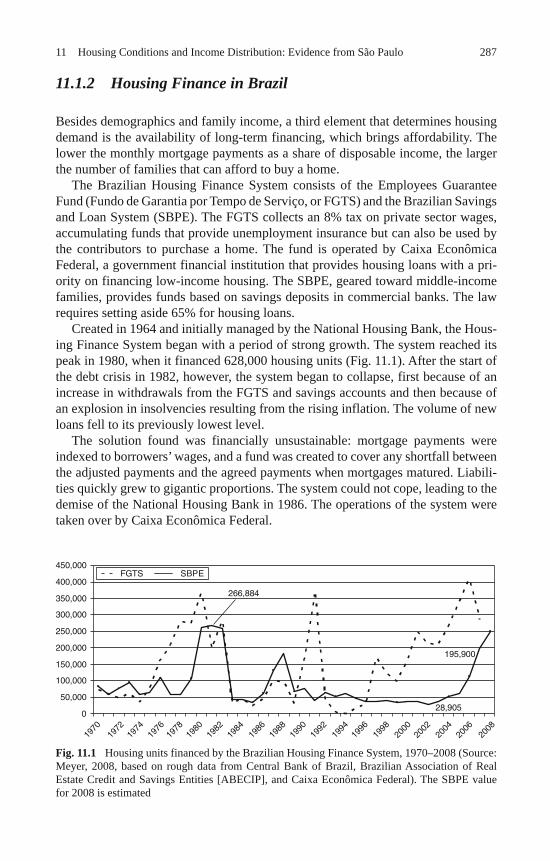
28711 Housing Conditions and Income Distribution: Evidence from São Paulo
11.1.2 Housing Finance in Brazil
Besides demographics and family income, a third element that determines housing demand is the availability of long-term financing, which brings affordability. The lower the monthly mortgage payments as a share of disposable income, the larger the number of families that can afford to buy a home.
The Brazilian Housing Finance System consists of the Employees Guarantee Fund (Fundo de Garantia por Tempo de Serviço, or FGTS) and the Brazilian Savings and Loan System (SBPE). The FGTS collects an 8% tax on private sector wages, accumulating funds that provide unemployment insurance but can also be used by the contributors to purchase a home. The fund is operated by Caixa Econômica Federal, a government financial institution that provides housing loans with a pri-ority on financing low-income housing. The SBPE, geared toward middle-income families, provides funds based on savings deposits in commercial banks. The law requires setting aside 65% for housing loans.
Created in 1964 and initially managed by the National Housing Bank, the Hous-ing Finance System began with a period of strong growth. The system reached its peak in 1980, when it financed 628,000 housing units (Fig. 11.1). After the start of the debt crisis in 1982, however, the system began to collapse, first because of an increase in withdrawals from the FGTS and savings accounts and then because of an explosion in insolvencies resulting from the rising inflation. The volume of new loans fell to its previously lowest level.
The solution found was financially unsustainable: mortgage payments were indexed to borrowers’ wages, and a fund was created to cover any shortfall between the adjusted payments and the agreed payments when mortgages matured. Liabili-ties quickly grew to gigantic proportions. The system could not cope, leading to the demise of the National Housing Bank in 1986. The operations of the system were taken over by Caixa Econômica Federal.
Fig. 11.1 Housing units financed by the Brazilian Housing Finance System, 1970–2008 (Source: Meyer, 2008, based on rough data from Central Bank of Brazil, Brazilian Association of Real Estate Credit and Savings Entities [ABECIP], and Caixa Econômica Federal). The SBPE value for 2008 is estimated
195,900
28,905
266,884
0
50,000
1970
1972
1974
1976
1978
1980
1982
1984
1986
1988
1990
1992
1994
1996
1998
2000
2002
2004
2006
2008
100,000
150,000
200,000
250,000
300,000
350,000
400,000
450,000FGTS SBPE
288 E. Haddad and J. F. P. Meyer
For more than two decades the provision of loans for the formal production of housing was minimal, contributing to the housing conditions shown in Table 11.2. New loans during this period came mainly from the resources of the FGTS. The SBPE remained practically paralyzed. Between 1983 and 2005 the SBPE financed an average of only 56,949 units a year in the entire country. In the city of São Paulo alone the projected housing demand for 2005–2010 is about 64,000 units a year.
Only in 2002 did resources for financing real estate gradually begin to return. Starting in 2006 growth in credit began to stimulate real estate development. As credit continued to grow, competition among banks led to longer terms for financ-ing and lower interest rates, especially in 2007, producing a housing boom. Real estate financing from the SBPE grew rapidly, increasing from 28,900 units in 2002 to 196,000 in 2007. By 2009 the financing might reach the peak attained in 1981, the year before the crisis began, when 267,000 units were financed.
The creation of a new real estate finance system (Sistema Financeiro Imobiliário, or SFI) at the beginning of this decade has allowed the development of real estate investment trusts as well as securitization of receivables, as happened in the United States, in the 1990s (Miles, Behrens, & Weiss, 2000), and in other countries. 3 The financial resources generated have been geared mostly toward commercial invest-ment. There is virtually no investment in rental housing in Brazil, where residential rent control policies have limited the returns.
The sources of real estate funding have become more diversified. The com-mercial sector has tentatively started to securitize mortgage loans. In addition, between the second half of 2005 and the end of 2007 many real estate companies went public. By December 2007, 29 were listed on the stock exchange. Initial public offerings of real estate development companies injected more than 12 bil-lion reais (R$) into the sector. These companies are diversifying their activities, moving into new regions and new markets and moving down the income ladder to reach new families.
As will be shown, these recent developments in housing finance have been accompanied by a shift in the market toward middle-class housing, which had been a major focus when the Housing Finance System began. This shift has come about as a result of the synergistic effects of a reduction in interest rates due to greater price stability and greater availability of housing finance.
11.2 Sources of Information
Our study uses data on two main areas: housing supply in São Paulo and income and its distribution.
3 The example of Mexico (see Duhau & Uribe, 2007) has drawn the attention of Brazilian housing authorities and academics.
28911 Housing Conditions and Income Distribution: Evidence from São Paulo
11.2.1 Housing Supply
The basic data on housing supply used in the study come from the monthly survey by EMBRAESP. 4 The information compiled by EMBRAESP in its database has in recent years become a major reference for studies of the São Paulo housing market.
A real estate development project is added to the database when sales are launched, which might occur before, during, or after the start of construction. Analysis based on a large data series suggests that, for the purposes of our study, this “launch” of sales can serve as a good proxy for what in the literature has been considered to be housing starts.
The EMBRAESP survey collects rigorous data on all housing starts. The data collected on each project include:
Name of the project Location (address) Homogeneous market zone Number of units Number of floors (for an apartment building) Number of elevators Area of land developed Date for completion of construction
For each residential unit, the survey collects the following information:
Private area and total area Number of bedrooms Number of bathrooms Price (in both reais and the US dollar equivalent) Form of payment Price per square meter
The survey also obtains the name and address of the developer, the building contractor, the real estate broker, and (if there is mortgage finance involved) the financial institution, as well as other information available.
The price of land, if not stated, can be indirectly estimated. In these cases the price refers to the land component after development, not the purchase price of raw land.
11.2.2 Income
The quality of the housing stock is probably the most conspicuous evidence of the distribution of income in a society. Brazil has been known as a most unequal soci-ety. São Paulo, a “small sample” of the country, shows a similar pattern.
4 For more on EMBRAESP, see its Web site at http://www.embraesp.com.br .
••••••••
••••••
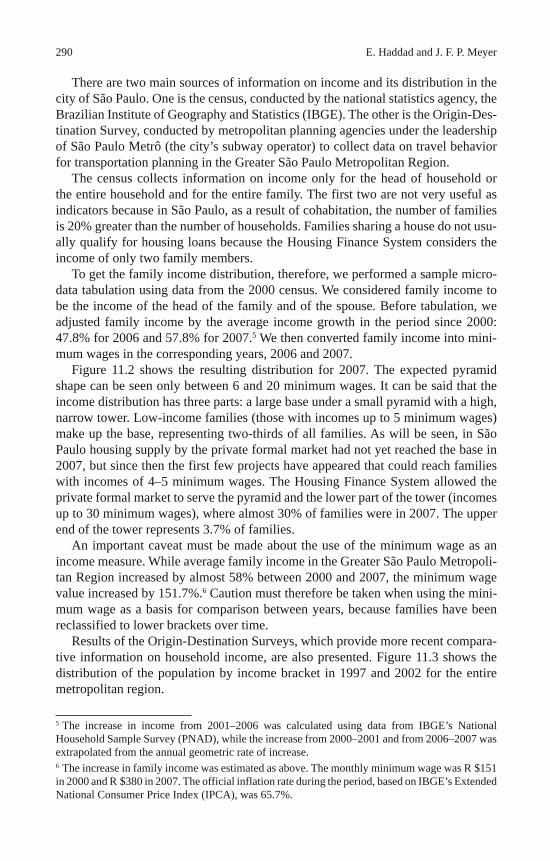
290 E. Haddad and J. F. P. Meyer
There are two main sources of information on income and its distribution in the city of São Paulo. One is the census, conducted by the national statistics agency, the Brazilian Institute of Geography and Statistics (IBGE). The other is the Origin-Des-tination Survey, conducted by metropolitan planning agencies under the leadership of São Paulo Metrô (the city’s subway operator) to collect data on travel behavior for transportation planning in the Greater São Paulo Metropolitan Region.
The census collects information on income only for the head of household or the entire household and for the entire family. The first two are not very useful as indicators because in São Paulo, as a result of cohabitation, the number of families is 20% greater than the number of households. Families sharing a house do not usu-ally qualify for housing loans because the Housing Finance System considers the income of only two family members.
To get the family income distribution, therefore, we performed a sample micro-data tabulation using data from the 2000 census. We considered family income to be the income of the head of the family and of the spouse. Before tabulation, we adjusted family income by the average income growth in the period since 2000: 47.8% for 2006 and 57.8% for 2007. 5 We then converted family income into mini-mum wages in the corresponding years, 2006 and 2007.
Figure 11.2 shows the resulting distribution for 2007. The expected pyramid shape can be seen only between 6 and 20 minimum wages. It can be said that the income distribution has three parts: a large base under a small pyramid with a high, narrow tower. Low-income families (those with incomes up to 5 minimum wages) make up the base, representing two-thirds of all families. As will be seen, in São Paulo housing supply by the private formal market had not yet reached the base in 2007, but since then the first few projects have appeared that could reach families with incomes of 4–5 minimum wages. The Housing Finance System allowed the private formal market to serve the pyramid and the lower part of the tower (incomes up to 30 minimum wages), where almost 30% of families were in 2007. The upper end of the tower represents 3.7% of families.
An important caveat must be made about the use of the minimum wage as an income measure. While average family income in the Greater São Paulo Metropoli-tan Region increased by almost 58% between 2000 and 2007, the minimum wage value increased by 151.7%. 6 Caution must therefore be taken when using the mini-mum wage as a basis for comparison between years, because families have been reclassified to lower brackets over time.
Results of the Origin-Destination Surveys, which provide more recent compara-tive information on household income, are also presented. Figure 11.3 shows the distribution of the population by income bracket in 1997 and 2002 for the entire metropolitan region.
5 The increase in income from 2001–2006 was calculated using data from IBGE’s National Household Sample Survey (PNAD), while the increase from 2000–2001 and from 2006–2007 was extrapolated from the annual geometric rate of increase. 6 The increase in family income was estimated as above. The monthly minimum wage was R $151 in 2000 and R $380 in 2007. The official inflation rate during the period, based on IBGE’s Extended National Consumer Price Index (IPCA), was 65.7%.
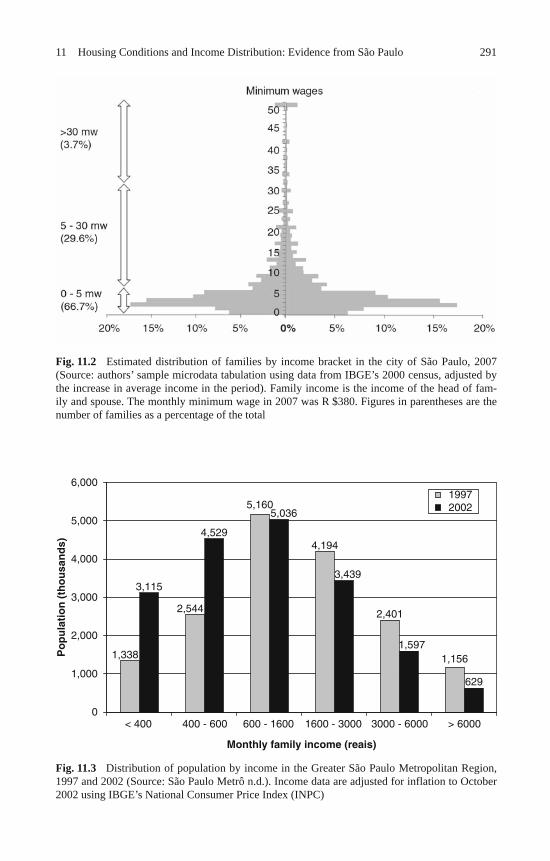
29111 Housing Conditions and Income Distribution: Evidence from São Paulo
Fig. 11.2 Estimated distribution of families by income bracket in the city of São Paulo, 2007 (Source: authors’ sample microdata tabulation using data from IBGE’s 2000 census, adjusted by the increase in average income in the period). Family income is the income of the head of fam-ily and spouse. The monthly minimum wage in 2007 was R $380. Figures in parentheses are the number of families as a percentage of the total
Fig. 11.3 Distribution of population by income in the Greater São Paulo Metropolitan Region, 1997 and 2002 (Source: São Paulo Metrô n.d.). Income data are adjusted for inflation to October 2002 using IBGE’s National Consumer Price Index (INPC)
1,338
2,544
4,194
2,401
1,156
3,115
4,529
629
5,160
1,597
3,439
5,036
0< 400 400 - 600 600 - 1600 1600 - 3000 3000 - 6000 > 6000
1,000
2,000
3,000
4,000
5,000
6,000
Monthly family income (reais)
Po
pu
lati
on
(th
ou
san
ds)
19972002
292 E. Haddad and J. F. P. Meyer
The figure shows that between 1997 and 2002 income distribution in São Paulo became more unequal. Davis (2006) documents similar developments in different countries around the world, all of them countries that are being affected by globali-zation. Davis also describes the consequences for housing, which he portrays as generating “a planet of slums.”
In São Paulo, after a long decline, average family income has recently shown a recovery. Between 2004 and 2006 it rose by 24.6%, as compared with an infla-tion rate of 10.8% (based on IBGE’s Extended National Consumer Price Index, IPCA). 7
11.3 Empirical Results
This section presents and briefly discusses some results of data analysis. Five aspects are considered: volume of production, housing prices, affordability, the perspective of developers, and locational aspects.
11.3.1 Volume of Production
To better place in context the participation of the formal market in providing housing, some background data on São Paulo are needed. According to the official census, the city of São Paulo, the core of the Greater São Paulo Metropolitan Region, had a population of 9,527,426 in 1991 and 10,434,252 in 2000. This population made up 2,539,953 households in 1991 and 2,985,977 in 2000. In 1977–2007 formal housing production in the city of São Paulo averaged 22,257 units a year (Table 11.3).
A first comparison can now be made between formal housing production and total housing production. According to the census, between 1991 and 2000 the total number of housing units grew by 446,024. During that same period formal housing starts totaled 231,639, or 51.9% of the increment in housing. The difference was due to non-market-oriented production, such as self-construction in regular or irregular settlements.
Figure 11.4 illustrates the cyclical nature of housing starts, which can be explained by macroeconomic trends and changes in the supply of credit. Indeed, changes in housing starts have been used as a first indicator of whether an economy is heading toward a period of recession or expansion.
Several trends and events can be associated with the behavior of housing starts. For example, the surge in production in 1986 came as a result of the successful implementation of the stabilization policy Plano Cruzado, which had positive effects on income distribution. The more stable rhythm of housing starts since 2000 largely reflects the overall economic stability during the period. And the boom in
7 The growth in average family income was calculated using data from IBGE’s National House-hold Sample Survey (PNAD).
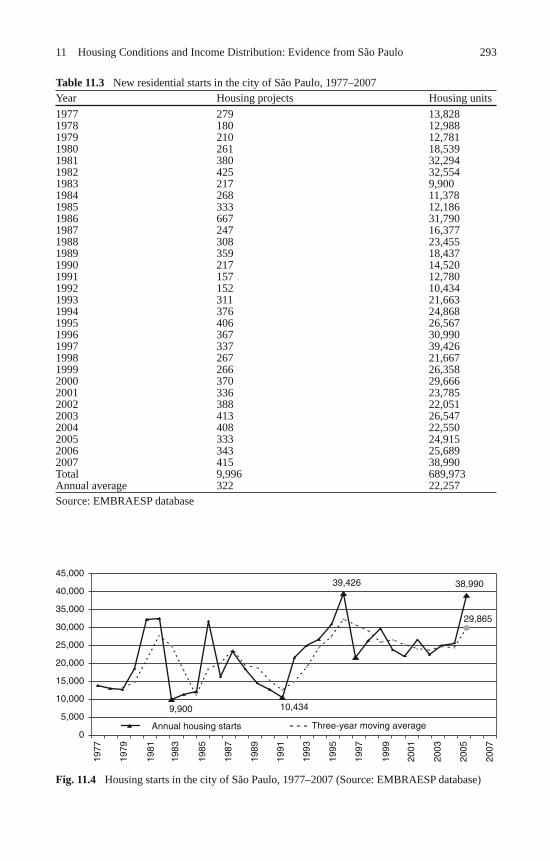
29311 Housing Conditions and Income Distribution: Evidence from São Paulo
Table 11.3 New residential starts in the city of São Paulo, 1977–2007Year Housing projects Housing units1977 279 13,8281978 180 12,9881979 210 12,7811980 261 18,5391981 380 32,2941982 425 32,5541983 217 9,9001984 268 11,3781985 333 12,1861986 667 31,7901987 247 16,3771988 308 23,4551989 359 18,4371990 217 14,5201991 157 12,7801992 152 10,4341993 311 21,6631994 376 24,8681995 406 26,5671996 367 30,9901997 337 39,4261998 267 21,6671999 266 26,3582000 370 29,6662001 336 23,7852002 388 22,0512003 413 26,5472004 408 22,5502005 333 24,9152006 343 25,6892007 415 38,990Total 9,996 689,973Annual average 322 22,257Source: EMBRAESP database
Fig. 11.4 Housing starts in the city of São Paulo, 1977–2007 (Source: EMBRAESP database)
9,900 10,434
39,426 38,990
29,865
0
1977
1979
1981
1983
1985
1987
1989
1991
1993
1995
1997
1999
2001
2003
2005
2007
5,000
10,000
15,000
20,000
25,000
30,000
35,000
40,000
45,000
Three-year moving averageAnnual housing starts
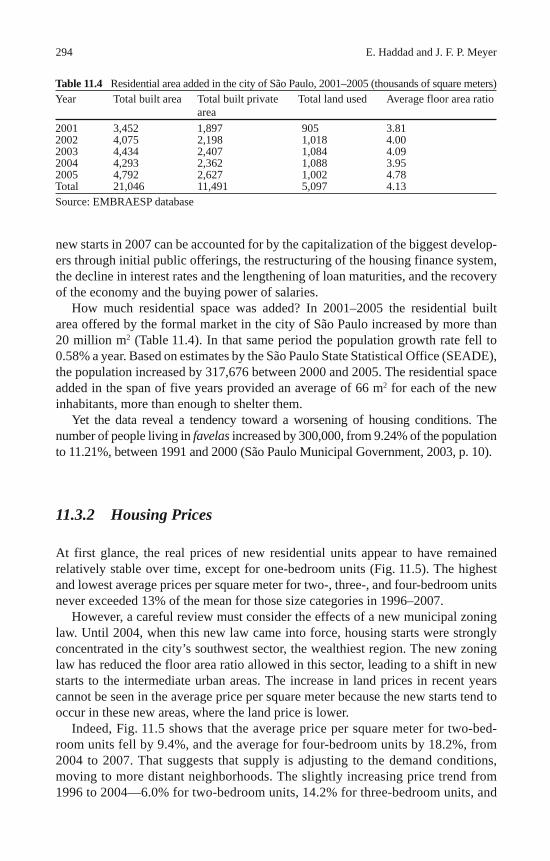
294 E. Haddad and J. F. P. Meyer
new starts in 2007 can be accounted for by the capitalization of the biggest develop-ers through initial public offerings, the restructuring of the housing finance system, the decline in interest rates and the lengthening of loan maturities, and the recovery of the economy and the buying power of salaries.
How much residential space was added? In 2001–2005 the residential built area offered by the formal market in the city of São Paulo increased by more than 20 million m 2 (Table 11.4). In that same period the population growth rate fell to 0.58% a year. Based on estimates by the São Paulo State Statistical Office (SEADE), the population increased by 317,676 between 2000 and 2005. The residential space added in the span of five years provided an average of 66 m 2 for each of the new inhabitants, more than enough to shelter them.
Yet the data reveal a tendency toward a worsening of housing conditions. The number of people living in favelas increased by 300,000, from 9.24% of the population to 11.21%, between 1991 and 2000 (São Paulo Municipal Government, 2003, p. 10).
11.3.2 Housing Prices
At first glance, the real prices of new residential units appear to have remained relatively stable over time, except for one-bedroom units (Fig. 11.5). The highest and lowest average prices per square meter for two-, three-, and four-bedroom units never exceeded 13% of the mean for those size categories in 1996–2007.
However, a careful review must consider the effects of a new municipal zoning law. Until 2004, when this new law came into force, housing starts were strongly concentrated in the city’s southwest sector, the wealthiest region. The new zoning law has reduced the floor area ratio allowed in this sector, leading to a shift in new starts to the intermediate urban areas. The increase in land prices in recent years cannot be seen in the average price per square meter because the new starts tend to occur in these new areas, where the land price is lower.
Indeed, Fig. 11.5 shows that the average price per square meter for two-bed-room units fell by 9.4%, and the average for four-bedroom units by 18.2%, from 2004 to 2007. That suggests that supply is adjusting to the demand conditions, moving to more distant neighborhoods. The slightly increasing price trend from 1996 to 2004—6.0% for two-bedroom units, 14.2% for three-bedroom units, and
Table 11.4 Residential area added in the city of São Paulo, 2001–2005 (thousands of square meters)Year Total built area Total built private
areaTotal land used Average floor area ratio
2001 3,452 1,897 905 3.812002 4,075 2,198 1,018 4.002003 4,434 2,407 1,084 4.092004 4,293 2,362 1,088 3.952005 4,792 2,627 1,002 4.78Total 21,046 11,491 5,097 4.13Source: EMBRAESP database
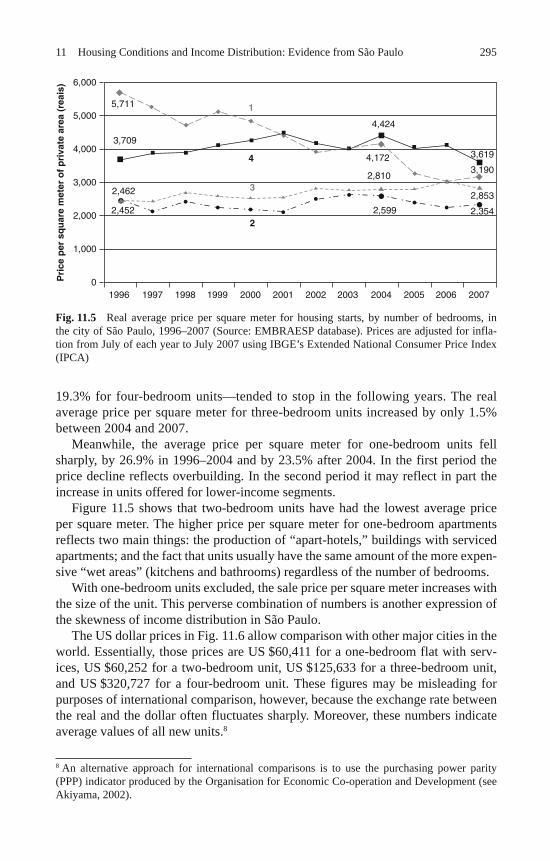
29511 Housing Conditions and Income Distribution: Evidence from São Paulo
19.3% for four-bedroom units—tended to stop in the following years. The real average price per square meter for three-bedroom units increased by only 1.5% between 2004 and 2007.
Meanwhile, the average price per square meter for one-bedroom units fell sharply, by 26.9% in 1996–2004 and by 23.5% after 2004. In the first period the price decline reflects overbuilding. In the second period it may reflect in part the increase in units offered for lower-income segments.
Figure 11.5 shows that two-bedroom units have had the lowest average price per square meter. The higher price per square meter for one-bedroom apartments reflects two main things: the production of “apart-hotels,” buildings with serviced apartments; and the fact that units usually have the same amount of the more expen-sive “wet areas” (kitchens and bathrooms) regardless of the number of bedrooms.
With one-bedroom units excluded, the sale price per square meter increases with the size of the unit. This perverse combination of numbers is another expression of the skewness of income distribution in São Paulo.
The US dollar prices in Fig. 11.6 allow comparison with other major cities in the world. Essentially, those prices are US $60,411 for a one-bedroom flat with serv-ices, US $60,252 for a two-bedroom unit, US $125,633 for a three-bedroom unit, and US $320,727 for a four-bedroom unit. These figures may be misleading for purposes of international comparison, however, because the exchange rate between the real and the dollar often fluctuates sharply. Moreover, these numbers indicate average values of all new units. 8
8 An alternative approach for international comparisons is to use the purchasing power parity (PPP) indicator produced by the Organisation for Economic Co-operation and Development (see Akiyama, 2002).
Fig. 11.5 Real average price per square meter for housing starts, by number of bedrooms, in the city of São Paulo, 1996–2007 (Source: EMBRAESP database). Prices are adjusted for infla-tion from July of each year to July 2007 using IBGE’s Extended National Consumer Price Index (IPCA)
6,000
5,711 1
4
3
2
4,424
3,619
2,853
3,190
2,354
4,172
2,810
2,599
3,709
2,462
2,452
5,000
4,000
3,000
2,000
1,000
1996 1997 1998 20001999 2001 2002 2003 2004 2005 2006 20070P
rice
per
sq
uar
e m
eter
of
pri
vate
are
a (r
eais
)
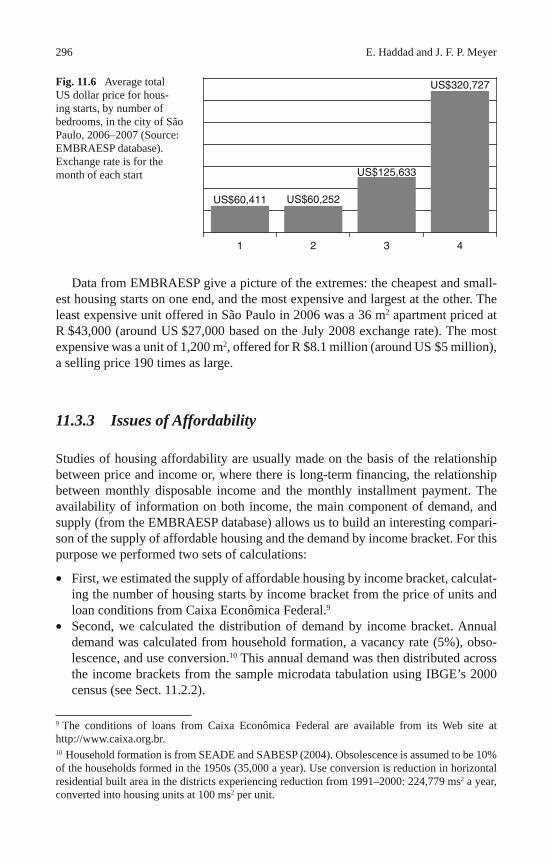
296 E. Haddad and J. F. P. Meyer
Data from EMBRAESP give a picture of the extremes: the cheapest and small-est housing starts on one end, and the most expensive and largest at the other. The least expensive unit offered in São Paulo in 2006 was a 36 m 2 apartment priced at R $43,000 (around US $27,000 based on the July 2008 exchange rate). The most expensive was a unit of 1,200 m 2 , offered for R $8.1 million (around US $5 million), a selling price 190 times as large.
11.3.3 Issues of Affordability
Studies of housing affordability are usually made on the basis of the relationship between price and income or, where there is long-term financing, the relationship between monthly disposable income and the monthly installment payment. The availability of information on both income, the main component of demand, and supply (from the EMBRAESP database) allows us to build an interesting compari-son of the supply of affordable housing and the demand by income bracket. For this purpose we performed two sets of calculations:
First, we estimated the supply of affordable housing by income bracket, calculat-ing the number of housing starts by income bracket from the price of units and loan conditions from Caixa Econômica Federal. 9 Second, we calculated the distribution of demand by income bracket. Annual demand was calculated from household formation, a vacancy rate (5%), obso-lescence, and use conversion. 10 This annual demand was then distributed across the income brackets from the sample microdata tabulation using IBGE’s 2000 census (see Sect. 11.2.2).
9 The conditions of loans from Caixa Econômica Federal are available from its Web site at http://www.caixa.org.br . 10 Household formation is from SEADE and SABESP (2004). Obsolescence is assumed to be 10% of the households formed in the 1950s (35,000 a year). Use conversion is reduction in horizontal residential built area in the districts experiencing reduction from 1991–2000: 224,779 ms 2 a year, converted into housing units at 100 ms 2 per unit.
•
•
Fig. 11.6 Average total US dollar price for hous-ing starts, by number of bedrooms, in the city of São Paulo, 2006–2007 (Source: EMBRAESP database). Exchange rate is for the month of each start
US$60,411
1 2 3 4
US$125,633
US$60,252
US$320,727
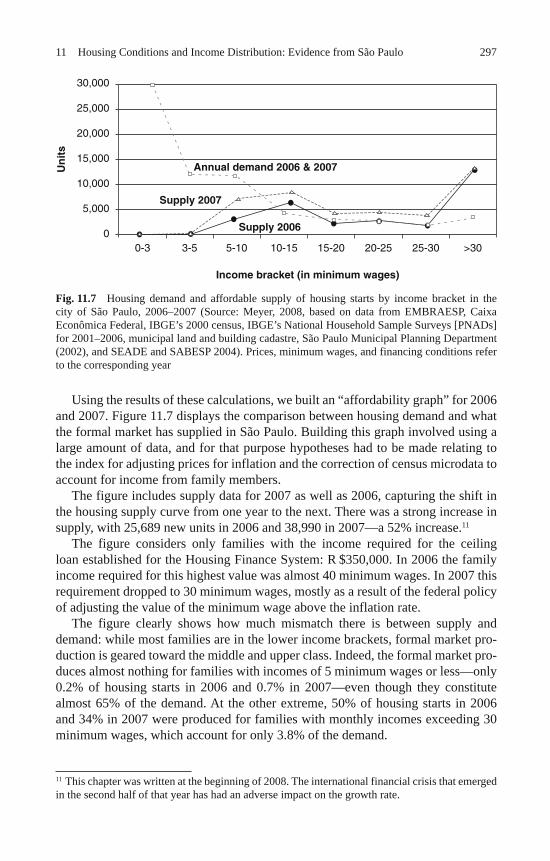
29711 Housing Conditions and Income Distribution: Evidence from São Paulo
Using the results of these calculations, we built an “affordability graph” for 2006 and 2007. Figure 11.7 displays the comparison between housing demand and what the formal market has supplied in São Paulo. Building this graph involved using a large amount of data, and for that purpose hypotheses had to be made relating to the index for adjusting prices for inflation and the correction of census microdata to account for income from family members.
The figure includes supply data for 2007 as well as 2006, capturing the shift in the housing supply curve from one year to the next. There was a strong increase in supply, with 25,689 new units in 2006 and 38,990 in 2007—a 52% increase. 11
The figure considers only families with the income required for the ceiling loan established for the Housing Finance System: R $350,000. In 2006 the family income required for this highest value was almost 40 minimum wages. In 2007 this requirement dropped to 30 minimum wages, mostly as a result of the federal policy of adjusting the value of the minimum wage above the inflation rate.
The figure clearly shows how much mismatch there is between supply and demand: while most families are in the lower income brackets, formal market pro-duction is geared toward the middle and upper class. Indeed, the formal market pro-duces almost nothing for families with incomes of 5 minimum wages or less—only 0.2% of housing starts in 2006 and 0.7% in 2007—even though they constitute almost 65% of the demand. At the other extreme, 50% of housing starts in 2006 and 34% in 2007 were produced for families with monthly incomes exceeding 30 minimum wages, which account for only 3.8% of the demand.
11 This chapter was written at the beginning of 2008. The international financial crisis that emerged in the second half of that year has had an adverse impact on the growth rate.
Fig. 11.7 Housing demand and affordable supply of housing starts by income bracket in the city of São Paulo, 2006–2007 (Source: Meyer, 2008, based on data from EMBRAESP, Caixa Econômica Federal, IBGE’s 2000 census, IBGE’s National Household Sample Surveys [PNADs] for 2001–2006, municipal land and building cadastre, São Paulo Municipal Planning Department (2002), and SEADE and SABESP 2004). Prices, minimum wages, and financing conditions refer to the corresponding year
00-3 3-5 5-10
Annual demand 2006 & 2007
Supply 2007
Supply 2006
10-15 15-20 20-25 25-30 >30
5,000
10,000
15,000
20,000
25,000
30,000
Un
its
Income bracket (in minimum wages)
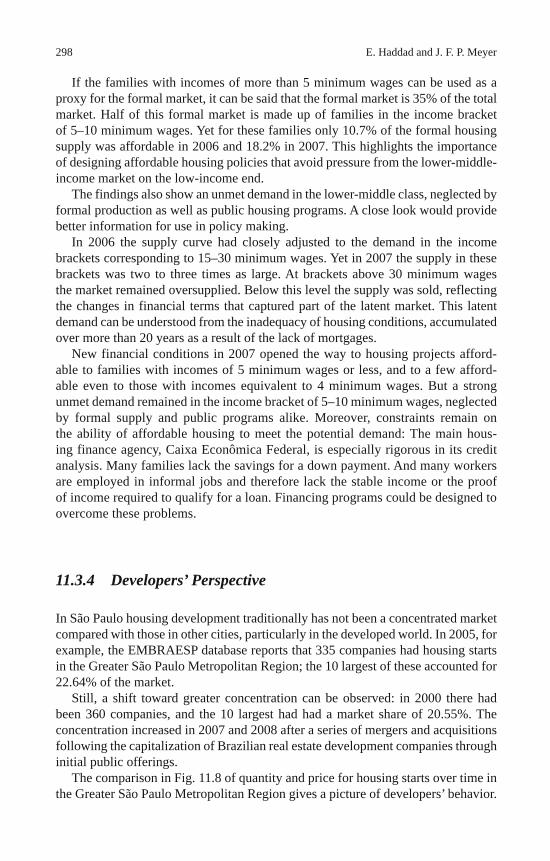
298 E. Haddad and J. F. P. Meyer
If the families with incomes of more than 5 minimum wages can be used as a proxy for the formal market, it can be said that the formal market is 35% of the total market. Half of this formal market is made up of families in the income bracket of 5–10 minimum wages. Yet for these families only 10.7% of the formal housing supply was affordable in 2006 and 18.2% in 2007. This highlights the importance of designing affordable housing policies that avoid pressure from the lower-middle-income market on the low-income end.
The findings also show an unmet demand in the lower-middle class, neglected by formal production as well as public housing programs. A close look would provide better information for use in policy making.
In 2006 the supply curve had closely adjusted to the demand in the income brackets corresponding to 15–30 minimum wages. Yet in 2007 the supply in these brackets was two to three times as large. At brackets above 30 minimum wages the market remained oversupplied. Below this level the supply was sold, reflecting the changes in financial terms that captured part of the latent market. This latent demand can be understood from the inadequacy of housing conditions, accumulated over more than 20 years as a result of the lack of mortgages.
New financial conditions in 2007 opened the way to housing projects afford-able to families with incomes of 5 minimum wages or less, and to a few afford-able even to those with incomes equivalent to 4 minimum wages. But a strong unmet demand remained in the income bracket of 5–10 minimum wages, neglected by formal supply and public programs alike. Moreover, constraints remain on the ability of affordable housing to meet the potential demand: The main hous-ing finance agency, Caixa Econômica Federal, is especially rigorous in its credit analysis. Many families lack the savings for a down payment. And many workers are employed in informal jobs and therefore lack the stable income or the proof of income required to qualify for a loan. Financing programs could be designed to overcome these problems.
11.3.4 Developers’ Perspective
In São Paulo housing development traditionally has not been a concentrated market compared with those in other cities, particularly in the developed world. In 2005, for example, the EMBRAESP database reports that 335 companies had housing starts in the Greater São Paulo Metropolitan Region; the 10 largest of these accounted for 22.64% of the market.
Still, a shift toward greater concentration can be observed: in 2000 there had been 360 companies, and the 10 largest had had a market share of 20.55%. The concentration increased in 2007 and 2008 after a series of mergers and acquisitions following the capitalization of Brazilian real estate development companies through initial public offerings.
The comparison in Fig. 11.8 of quantity and price for housing starts over time in the Greater São Paulo Metropolitan Region gives a picture of developers’ behavior.
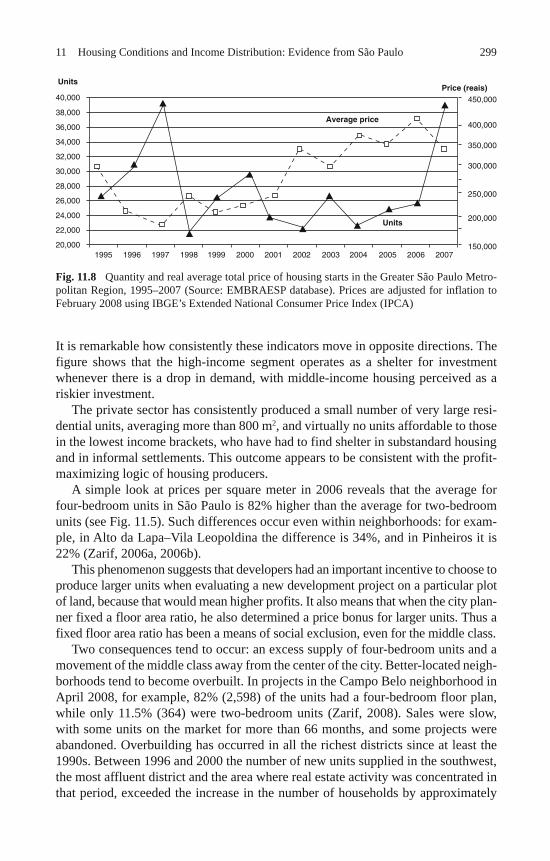
29911 Housing Conditions and Income Distribution: Evidence from São Paulo
It is remarkable how consistently these indicators move in opposite directions. The figure shows that the high-income segment operates as a shelter for investment whenever there is a drop in demand, with middle-income housing perceived as a riskier investment.
The private sector has consistently produced a small number of very large resi-dential units, averaging more than 800 m 2 , and virtually no units affordable to those in the lowest income brackets, who have had to find shelter in substandard housing and in informal settlements. This outcome appears to be consistent with the profit-maximizing logic of housing producers.
A simple look at prices per square meter in 2006 reveals that the average for four-bedroom units in São Paulo is 82% higher than the average for two-bedroom units (see Fig. 11.5). Such differences occur even within neighborhoods: for exam-ple, in Alto da Lapa–Vila Leopoldina the difference is 34%, and in Pinheiros it is 22% (Zarif, 2006a, 2006b).
This phenomenon suggests that developers had an important incentive to choose to produce larger units when evaluating a new development project on a particular plot of land, because that would mean higher profits. It also means that when the city plan-ner fixed a floor area ratio, he also determined a price bonus for larger units. Thus a fixed floor area ratio has been a means of social exclusion, even for the middle class.
Two consequences tend to occur: an excess supply of four-bedroom units and a movement of the middle class away from the center of the city. Better-located neigh-borhoods tend to become overbuilt. In projects in the Campo Belo neighborhood in April 2008, for example, 82% (2,598) of the units had a four-bedroom floor plan, while only 11.5% (364) were two-bedroom units (Zarif, 2008). Sales were slow, with some units on the market for more than 66 months, and some projects were abandoned. Overbuilding has occurred in all the richest districts since at least the 1990s. Between 1996 and 2000 the number of new units supplied in the southwest, the most affluent district and the area where real estate activity was concentrated in that period, exceeded the increase in the number of households by approximately
Fig. 11.8 Quantity and real average total price of housing starts in the Greater São Paulo Metro-politan Region, 1995–2007 (Source: EMBRAESP database). Prices are adjusted for inflation to February 2008 using IBGE’s Extended National Consumer Price Index (IPCA)
20,0001995 1996 1997 1998 1999 2000 2001 2002 2003 2004 2005 2006 2007
22,000
24,000
26,000
28,000
30,000
32,000
34,000
36,000
38,000
40,000
150,000
200,000
250,000
300,000
350,000
400,000
450,000
Units
Average price
Units
Price (reais)
300 E. Haddad and J. F. P. Meyer
half (Barbon, 2003, p. 36). In the 12 districts where housing starts were concen-trated, there was a 15% vacancy rate in 2000. 12
The tendency to supply more expensive units raises the average price in the neighborhood, and many households, mainly the youngest ones, cannot afford them. The developers perceive an opportunity to design projects to this demand in the next neighborhood, where the land prices are lower. Again they try to get the highest price per square meter, now at a new level, and again the average price rises, starting the process all over again. Thus successive groups of the middle class are dislocated to the next ring of territory, taking the place of others who then move further toward the periphery. Many units have remained vacant, purchased by investors trying to capture the increase in value generated by the process.
A new challenge for city planners is to rethink the urban development and hous-ing loan policies so as to retain the middle class in the central areas, reducing the pressure on the low-income settlements, the environmentally sensitive areas, and the road infrastructure.
11.3.5 Locational Aspects of Housing
Over the years the housing market in São Paulo has been associated with important transformations in the occupation of the city space. Indeed, housing analysis is an essential part of city planning.
Because the EMBRAESP database includes the address of housing starts, it allows the use of the spatial analysis capabilities of geographic information sys-tem software, especially the possibility of integrating different spatial databases. Haddad (2005) has studied the extent to which real estate investment decisions anticipate neighborhood changes in São Paulo.
11.4 Conclusions and Notes for Future Research
One objective of this chapter has been to provide a case study of using data on hous-ing starts in market studies. For São Paulo, the availability of such data has made it possible to estimate the quantity and prices of housing starts and relate them to family income. The chapter has provided details showing how the formal hous-ing market serves only middle- and high-income families. It also has shown some characteristics of the housing industry, shedding light on aspects of the market that appear to have been relatively neglected and pointing the way to further empirical and comparative studies.
12 Data are from IBGE’s 2000 census ( http://www.sidra.ibge.gov.br/bda/tabela/listabl.asp?z=t& c=131016% , accessed November 17, 2005).
30111 Housing Conditions and Income Distribution: Evidence from São Paulo
The chapter, the result of a first descriptive analysis using information from a database on housing starts in São Paulo along with data from official sources, pro-vides some interesting empirical results:
Over a 20 years period (1986–2005) urban development policies and lack of mortgages for lower-middle-income families made obtaining housing difficult for the lower end of the market, leading to an accumulation of pent-up demand. New financial conditions in 2007 permitted the production of affordable hous-ing for households with incomes of 5–30 minimum wages. But demand in the income bracket of 5–10 minimum wages was virtually neglected by both formal supply and public programs. The formal market produces almost nothing for families with incomes of 5 mini-mum wages or less, which represent almost 65% of the demand. At the other extreme, 50% of units started in 2006 and 34% in 2007 were produced for fami-lies with monthly incomes above 30 minimum wages, which correspond to only 3.8% of the demand. For families in the income bracket of 5–10 minimum wages only 10.7% of the formal housing supply was affordable in 2006 and 18.2% in 2007. Yet this income bracket represents 50% percent of the formal housing market. A new challenge for city planners is to rethink the urban development and hous-ing loan policies so as to retain middle-class families in the central areas, easing the pressure on low-income settlements.
Further analyses are to follow, and a few suggestions have already been made for future research:
To focus on the projects affordable to low-income families To include a feasibility analysis of housing investment decisions To deepen the study of the price bonus resulting from the limits on floor area ratio and its effects, including the middle-class shift toward the periphery and the consequences for low-income families
Acknowledgements The authors would like to thank Luis Paulo Pompeia, executive director of Empresa Brasileira de Estudos do Patrimônio (EMBRAESP), for his comments and permission to use information from the EMBRAESP database.
References
Akiyama, Y. (2002). The World Land Survey: An introduction of a methodology for comparing real estate values . Accessed April 7, 2007, from http://www.lares.org.br/SL2_akiyama.pdf
Barbon, Â. L. (2003). Mobilidade residencial intra-urbana em grandes centros: Região Metro-politana de São Paulo . Master’s thesis, Pontifícia Universidade Católica de Campinas, State of São Paulo.
Davis, M. (2006). Planet of slums . London: Verso. Duhau, E., & Uribe, G. (2007, October). Los nuevos productores del espacio habitable: Breve
historia de una mercancía possible . Paper presented at the 30th meeting of Red Nacional de Investigación Urbana, Toluca, Mexico.
•
•
•
•
•
•••
302 E. Haddad and J. F. P. Meyer
Haddad, E. (2005, September). O Mercado imobiliário antecipa as alterações da estrutura dos bairros? Evidências no caso de São Paulo . Paper presented at the fifth annual meeting of the Latin American Real Estate Society, São Paulo. Accessed May 4, 2007, from http://www.lares.org.br/haddad.pdf
João Pinheiro Foundation & Brazil, Ministry of Cities. (2005). Déficit habitacional do Brasil (Housing deficit in Brazil) [CD-ROM].
Meyer, J. F. P. (2008). Demanda residencial: Adequação da análise de mercado imobiliário—o caso de São Paulo . PhD dissertation, University of São Paulo, School of Architecture and Urbanism.
Miles, M., Behrens, G., & Weiss, M. (2000). Real estate development: Principles and process (3rd ed.). Washington, DC: Urban Land Institute.
São Paulo Metrô. (n.d.). Aferição da Pesquisa Origem e Destino na Região Metopolitana. Accessed May 4, 2007, from http://www.metro.sp.gov.br/empresa/pesquisas/afericao_da_ pesquisa/afericao_da_ pesquisa.shtml
São Paulo Municipal Government. (2003). Plano Municipal de Habitação . Versão para debate. São Paulo: Author.
São Paulo Municipal Planning Department . (2002). População , renda e categorias selecionadas de uso do solo em São Paulo: 1991–2000 . Accessed August 31, 2006, from http://www.sempla.prefeitura.sp.gov.br/
SEADE (São Paulo State Statistical Office) and SABESP (São Paulo State Water Resources Man-agement Agency). (2004). Projeções para o Estado de São Paulo: População e domicílios até 2025 [CD-ROM]. São Paulo: Authors.
World Bank. (1993). Housing: Enabling markets to work . World Bank Policy Paper. Washington, DC: Author.
Zarif, R. (2006a). São Paulo: Alto da Lapa and Vila Leopoldina . Real estate market research report, March.
Zarif, R. (2006b). São Paulo: Pinheiros . Real estate market research report, September. Zarif, R. (2008). São Paulo: Campo Belo . Real estate market research report, April.

Part IIIPublic Land Management

“This page left intentionally blank.”
305
Many developing country cities, it is often asserted, have substantial public land assets that appear to be suboptimally managed. Garba and Al-Mubaiyedh (1999), for example, contend that public ownership and management of land may result in land market failure, using Kano, Nigeria, as an example. Deininger (2003) argues that to the extent that publicly owned land is suboptimally used, the transfer of ownership or use rights to the private sector could improve land use, increase government rev-enue, and minimize a potential source of corruption. Buckley and Kalarickal (2006) report that land markets in Mumbai, India, and Dhaka, Bangladesh, are unrespon-sive to demand because a significant amount of land is publicly held.
The net effect of public ownership and management of land is purported to be an artificial shortage of land supply on the market, giving rise to prices that are gener-ally out of reach for most. Thus deficiencies in public land management are often blamed in part for the prevalent informality, particularly in shelter solutions and small-scale commercial undertakings. However, no literature has empirically exam-ined cross-country relationships between public land ownership and management and land market outcomes, including land prices, in the developing world. Angel (2000) comes closest and encouragingly finds that an “enabling index” is a statis-tically significant contributor to different land market outcome indicators (house price to income ratio, rent to income ratio, and down-market penetration). Although his enabling index does not explicitly include public land management, it does encompass the public housing stock and land registration.
The irony is that many state interventions in land markets are motivated by a desire to alleviate the plight of the poor by compensating for market deficiencies. Quite apart from the range of peculiarities resulting from the heterogeneous nature of land and housing commodities, many researchers recognize the existence of imperfections in land and housing markets. On the demand side these include infor-mation asymmetries, tenant immobility, and large transaction costs. On the supply
S.V. Lall et al. (eds.), Urban Land Markets, DOI 10.1007/978-1-4020-8862-9_12 , © World Bank 2009
Chapter 12 Does Public Ownership and Management of Land Matter for Land Market Outcomes? Robin Rajack
R. Rajack ( ) Urban Development The World Bank Washington, DC 20433 , USA e-mail: [email protected]
306 R. Rajack
side spatial fixity and market indivisibilities of the housing good, together with neighborhood externalities, are seen as relevant (Robinson, 1979).
Whitehead (1983) identifies other important problems with urban land markets, including the need to provide certain land with goods that are at least in part public goods (such as primary and secondary infrastructure), which cannot be effectively produced through the private market; unequal division of market power among economic agents, particularly in the case of monopolistic supply; and differences in how individuals and the community value future and current benefits. Mindful of the massive income disparities in most developing countries, she discusses the temptation to intervene to achieve redistribution in kind—and the relative feasibil-ity of doing so—given that extra cash may inflate prices.
The net result of these market imperfections is often a failure of land markets to produce formal land and shelter solutions for the urban masses at a price they can afford. In this scenario a well-intentioned state often intervenes and is tempted to use publicly owned land to foster land market outcomes that can improve welfare. Rothenberg (1967), in a cost-benefit analysis of urban renewal in the United States, contends that while high land assembly costs are a significant deterrent to large-scale residential redevelopment by private enterprise, the right of eminent domain significantly reduces these costs when government undertakes the process. The same argument can be made when land assembly is not even necessary because of preexisting large-scale ownership of land by the state in some cities. Similarly, where private enterprise is constrained either because capital markets are incipient or because severe credit rationing occurs, large-scale land development by the state is often a feature of public policy. But as Stafford (1978) argues, even if an external-ity exists, there is no a priori case for government ownership and intervention. Dahl-man (1979) takes the argument a step further by asserting that state intervention can be justified only if it can be shown that governments can do better at internalizing externalities than private market forces can.
Of course, states intervene in the operation of land markets in a great variety of ways, including taxation, regulation, and direct participation. This chapter focuses on the last of these and even so does not cover the less controversial roles of the state in providing primary and secondary infrastructure and in land acquisition in these contexts. Instead, the focus is more narrowly on the way public land is managed, with the emphasis on urban and periurban contexts. This management includes the institutional arrangements that govern the alienation and development of public land, the protection of such land from encroachment, and the regulariza-tion of established informal settlements on public land.
In looking at public land management, the chapter addresses two primary research questions: What are the appropriate institutional structures for managing public land? And is land supply more constrained in cities with large public land assets than in those with predominantly private landownership? These two ques-tions may be summed up in a single question: Does public ownership and manage-ment of land matter for land market outcomes?
For the purpose of this chapter, public land includes all land under majority own-ership or control by central government, municipalities, and parastatal bodies such
30712 Does Public Ownership and Management of Land Matter for Land Market Outcomes?
as state enterprises and statutory bodies. Spatially, however, the chapter focuses on urban areas and on the rural–urban periphery. The term institutional arrangements is used to mean organizational arrangements and associated human resource capac-ity and incentive issues; information and records management; and land manage-ment practices.
The chapter begins by outlining a framework relating public land institutional arrangements with land market outcomes, highlighting some of the literature on country-specific features of public land management. It then discusses ways in which the effectiveness of public land management has been evaluated in the lit-erature, using country cases to illustrate each category of evaluation. The chapter next describes its original empirical contribution. It first presents some cross-country profiling of institutional arrangements for public land management and then explores whether there is evidence of empirical relationships between these arrangements as well as the extent of public landownership and specific land mar-ket outcomes.
12.1 Conceptual Framework: Public Land and Land Market Outcomes
This section explores conceptually ways in which public ownership and manage-ment of land can unintentionally have adverse impacts on land market outcomes. Four main contributors to inefficiency are discussed: withholding of land from the market, high transaction costs, limited functional decentralization, and unfair com-petition with private sector developers.
12.1.1 Withholding of Land from the Market
One of the most common criticisms of public land management is that the state often fails to strategically interject parcels of land into the market in a way that could bolster land supply when demand is high. This does not necessarily require the state to function as a developer. It can be accomplished through alienation of the land by lease or other tenure instrument or through outright privatization such as by auction.
Supplying the appropriate amount of public goods is a very difficult task in itself and one that the private sector would not necessarily do better. Much of the with-holding of public land from the market is the product of the policy ambivalence governing such land. Policy makers face competing demands for maximizing eco-nomic returns and redressing social inequities that are difficult to resolve politically. In a similar way, the communal land tenure that dominates in Sub-Saharan Africa, while posing challenges for private investment, serves as a social safety net for the poor, allowing them affordable access to land that is particularly crucial in times
308 R. Rajack
of economic shock. 1 At the heart of public land management is an ongoing public policy debate on the role and obligations of large landowners and the public and private good aspects of their real estate assets. Judicial back and forth—including the drafting of regulation, its passage into law, and the contestation over its mean-ing—are often the visual handles on this policy debate.
The implication is that even if the state were equipped with perfect information about the location, extent, and value of its estate as well as the institutional arrange-ments and capacity to efficiently allocate land, it would still act less expediently and responsively than a private actor because of the inherent difficulties of reconciling the various interests and objectives with which it is charged. The result is again a less than efficient short-run solution in which land that is needed for settlement or other development today may not be allocated to that need today.
Yet the withholding of land has more consequences than the creation of artifi-cial scarcity. It also imposes efficiency costs on cities by increasing commuting distances and costs and by hindering agglomeration economies for commerce and industry. Liu (2005) estimates that the social costs of what he terms “interrupted development” are at least twice the private cost of land. He contends that this is a major source of market failure, since private decisions relating to interrupted devel-opment are based on returns that are less than half the social returns and therefore give rise to a city form that has too much interrupted development.
Although Liu’s analysis focuses largely on private actions, the argument is valid for interrupted development caused by the withholding of public land from develop-ment purposes due to managerial inefficiency or other causes giving rise to spatially discontinuous development. Here land prices or rents (private value to the state) are often not even used in making land use decisions and so the ratio of social costs to return on existing use is likely to be even greater. His argument is particularly rel-evant in contexts in which lax management approaches for public land derive few if any compensatory social benefits from the existing use of that land. The net effect of underestimating the social costs of land use decisions manifested as interrupted development is the underallocation of land for housing and other productive uses, with adverse effects on affordability. Interrupted development would also likely affect the pattern and shape of urban expansion, particularly through less contiguity of the built area.
This pattern of noncontiguous, interrupted development may be exacerbated if an inefficient public land developer also actively acquires land for future devel-opment through land banking. The artificial scarcity of developable land so cre-ated, as well as the speculation that the practice can fuel, may further push land prices upward. Such a trend was noted in France, the Netherlands, and Sweden (Van Meurs, 1986). In considering the potential impact of land banking in developing countries, Farvacque and McAuslan (1992) expressed this caution:
Where other land use instruments are very weak... land banking is likely to achieve neither efficiency nor equity in the supply of land for urban development, since its operation will be
1 A related argument is made by Posner (1980) in relation to property rights in preliterate societies.
30912 Does Public Ownership and Management of Land Matter for Land Market Outcomes?
likely to be skewed by the same defects that affect other instruments—weak implementa-tion, overbureaucratisation, abuse of power. (p. 74)
By contrast, public authorities are often advised to expand leasing and privatiza-tion of surplus public land, with auctions often the preferred route for privatization. As Strong (2003) notes with respect to Ukraine, among the rationales advanced for competitive land auctions was the opportunity they provide to remove the shroud of mystery from land allocation decisions, reducing the scope for improper considera-tions. Such improper considerations can of course affect the supply—and thus the prices—of land for a given purpose. Hong and Bourassa (2003) contend that land leasing is sometimes a more flexible instrument for allocating public land, although this is debatable if adequate administrative capacity to administer such leases is lacking. In the absence of such capacity, increased transaction costs and rent seek-ing are not uncommon (Kaganova & McKellar, 2006). 2
12.1.2 High Transaction Costs of Public Land Management
The next source of impact considered is the relative inefficiency of the state as a supplier of land. Institutional arrangements for public land management are fre-quently criticized as being complex and convoluted. These institutions directly affect the transaction costs involved in public land management. The contention is that if institutional arrangements for public land management were less tedious, the elasticity of supply of land would be greater.
12.1.2.1 Convoluted Procedures
The more complicated and time consuming are the process and rules for acquiring access to a plot of public land, the more costly is that access. Faced with these costs, both firms and individuals make determinations on whether to pursue that access through formal or informal means. de Soto (1990) documented this choice through the example of Peru. His regulatory audit was mainstreamed worldwide in the World Bank Group’s Doing Business Survey, which is applied periodically. Sprawling slums in many developing country cities with large tracts of public land suggest that, for many, the transaction costs of public land management are too high to make formal occupation of such land a viable option. The high transaction costs of effectively patrolling a large and dispersed public land estate are also seen as contributing to the ease with which encroachment occurs and the scale that it often reaches.
2 This debate about the relative merits of auctions and leasing of public land was the subject of an open letter in 1990 to Mikhail Gorbachev, then president of the Soviet Union, in which 30 Ameri-can economists strongly advised him not to auction vast tracts of public land. They urged him instead to lease the land, to allow a continuous stream of revenue and the public capture of most of the land rent not directly attributable to private effort (see http://www.cooperativeindividualism.org/tideman-nicolaus_open-letter-to-gorbachev.html).
310 R. Rajack
12.1.2.2 Interagency Coordination
Some transaction costs are determined by interagency relationships, because of requirements for information, approvals, and participation from different state agen-cies for the development and allocation of land and regularization of encroachment. These agencies often do not share one another’s priorities and sometimes have con-flicting interests in the proposed development site. Coordination among these agen-cies is often weak, and unlike private land development firms, they often lack an overall management or budget structure that reconciles their differences in priorities and interests. Confusion over responsibilities and duplication of work in instituting and enforcing land reforms and procedures lead to inaction and create tensions at all levels of government (Lincoln Institute of Land Policy, 2002; UNCHS, 1983). The net result is a slowing of the land development and allocation process.
As tools for land management, Archer (1989, 1992) recommends the establish-ment of a central government body or public agency to oversee law and regulations related to land schemes and help develop procedures, and the formation of an inter-departmental steering committee to guide development of the system and promote interdepartmental cooperation in its operation.
12.1.2.3 Statutory Provisions Governing Public Expenditure
Other transaction costs arise from statutory provisions governing public expenditure. Procurement of contractors for land development on behalf of the state is often a pro-tracted process that involves centralized arrangements for advertisement, review of tenders, and selection of successful bidders. Contractors usually factor these delays into their bid prices, contributing to a less competitive product. Even though the state’s final product may eventually be offered at a competitive price—often thanks to subsidies on the cost of raw land and, in many cases, infrastructure—the greater time and cost involved in public development of land contribute to the image of the state as a model of inefficiency in land development.
Reforms allowing direct control over land development processes and procure-ment can reduce these costs. Similarly, having control over key human resource decisions can translate into speedier recruitment, greater functional continuity, and staffing responsiveness to fluctuations in workload—and thus also lead to lower transaction costs.
12.1.2.4 Incentive Frameworks of Public Land Officials
The incentive frameworks of public land officials also affect the transaction costs and efficiency of public land management. One of these incentive frameworks relates to employee motivation in public institutions. Certain institutional charac-teristics in human resource management, such as lack of a competitive compen-sation plan and opportunities for internal promotion, may lead to organizational
31112 Does Public Ownership and Management of Land Matter for Land Market Outcomes?
failure, with employees not striving together to meet organizational goals. At the same time, lack of employee motivation in organizations leaves them with unskilled and ill-trained staff, considered a major constraint in the public management proc-ess (Cheema, 2005).
Public officials charged with management of state land often hold relatively low office, are poorly paid, and lack a career path with realistic opportunities for pro-motion. These factors are thought to lower their productivity and therefore the effi-ciency of the public land management process. This in turn affects land supply, with adverse consequences for affordability.
In addition, in this environment of low motivation the temptation to abuse office for financial gain is strong, especially since the valuable asset of public land is usually allocated administratively and not competitively. Moreover, land allocation decisions based on rent seeking by public officials are unlikely to assign public land either to its most efficient use or to a use that has strategic welfare objectives for the poor. If rent seeking behavior is widespread, it should be manifest as distortions in overall land prices.
Reforms that seek to change the balance between labor division and functional mobility, and to enhance employee compensation, voice, and opportunities for internal promotion, all target employee motivation. Reforms that increase compen-sation and the scope for internal promotion encourage the retention of staff, allow-ing greater functional continuity. Higher compensation also makes it possible to attract competent staff in the first place.
12.1.2.5 Public Land Management Capacity
In many cities it is claimed that large parcels of strategically located land lie vacant or in a use that is in no way consistent with their value. This situation is often linked to lack of land management capacity among public officials and widespread deficiencies in data management. It is not uncommon for public officials to be una-ble to reliably estimate the extent or value of public lands because of incomplete and dysfunctional information systems. Consequently, land often is not managed efficiently. Nor is land strategically interjected into the market with a welfare objec-tive. The purported consequence of this withholding of land is an artificial scarcity of supply leading to price inflation.
Lack of managerial and administrative capacity in the government can be a severe obstacle to implementing land policy instruments and managing urban land. Innovative land policy instruments require skilled negotiations before an agree-ment acceptable to all stakeholders can be reached (Amborski, 1999). In Nepal one constraint faced by land pooling schemes was the lack of a system to document and monitor the progress of projects. Karki (2004) notes that staff were trained to deliver only physical reports, not analytical ones, and that they lacked an adequate system to access information, coordinate projects, and share knowledge. Managers could not devote adequate attention to projects because they also served as the town controllers. In addition, they were regularly transferred because of frequent changes
312 R. Rajack
in government setup. In Kenya several initiatives in land readjustment had little impact mainly because of administrative and political problems that discouraged planners and administrators and affected their work (UNCHS, 1983).
Dillinger (1992) notes that hiring local professionals and staff along with expe-rienced on-site project managers can contribute to the success of a program. This is particularly critical in partnerships with informal developers where a local under-standing is important. A partnership with private developers requires a pragmatic planning strategy, effective monitoring, and high-level management effort by the city authorities as well as appropriate guidance and assistance (Misra & Rarain, 1989).
12.1.2.6 Summary
Table 12.1 depicts a schematic of institutional reforms in public land management. Most are aimed at directly reducing transaction costs. Some are indirectly targeted reforms, focused on improving employee motivation and thus service delivery.
12.1.3 Public Land Management Insufficiently Decentralized
Public land management is often faulted as being too far removed from practical reality. Decentralization of public land management should be understood in the broader context of decentralized forms of government. Elcock and Minogue (2001) contend that decentralization brings two changes in a society. One is the strength-ening of participatory mechanisms through local power structures. Compared with the central government, local governments are closer to the public they serve and in a position to be more attentive to the real needs of the society. The other is the delegation of different functions within organizations. In contrast with the central-ized control model, decentralization of institutions sometimes enables local subbod-ies to make decisions on local policies and distribution of resources.
Decentralization has similar implications for public land management. Land is a resource that has different potentials for its future use, and better knowledge or information on local perspectives can be used to serve the needs and desires of the local population. Central government ministries and agencies usually are not well placed to capture information on the needs and desires of local population groups and subgroups. By comparison, a decentralized land management approach can make it possible to hold public hearings, consider petitions, and communicate directly with people in the field, better positioning the state to identify priorities for public land use (Kaganova, Tian, & Undeland, 2001). Decentralization places deci-sion makers in closer proximity to the communities they are meant to serve. One outcome of this is a potential for greater voice for the poor and enhanced account-ability. Moreover, public land can be better protected from encroachment by a land management agency with local patrolling capacity, which is usually feasible only in a decentralized structure.
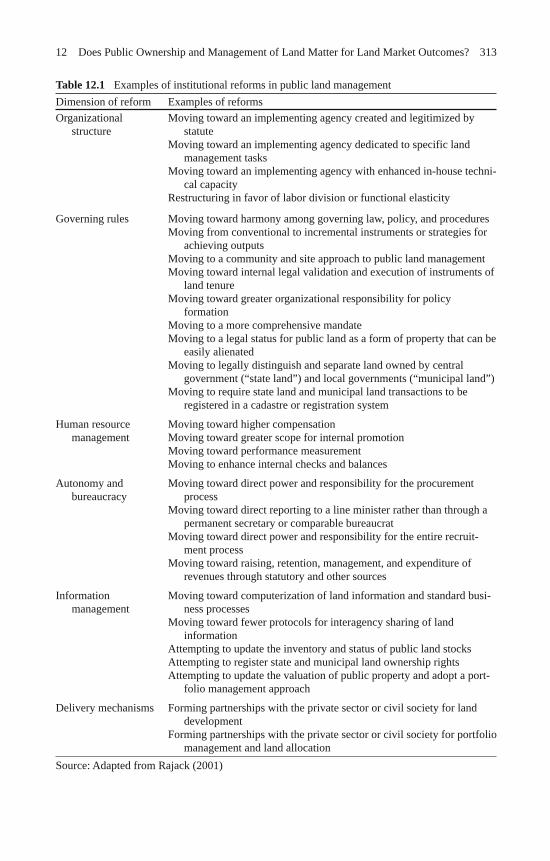
31312 Does Public Ownership and Management of Land Matter for Land Market Outcomes?
Table 12.1 Examples of institutional reforms in public land management Dimension of reform Examples of reforms Organizational
structure Moving toward an implementing agency created and legitimized by
statute Moving toward an implementing agency dedicated to specific land
management tasks Moving toward an implementing agency with enhanced in-house techni-
cal capacity Restructuring in favor of labor division or functional elasticity
Governing rules Moving toward harmony among governing law, policy, and procedures Moving from conventional to incremental instruments or strategies for
achieving outputs Moving to a community and site approach to public land management Moving toward internal legal validation and execution of instruments of
land tenure Moving toward greater organizational responsibility for policy
formation Moving to a more comprehensive mandate Moving to a legal status for public land as a form of property that can be
easily alienated Moving to legally distinguish and separate land owned by central
government (“state land”) and local governments (“municipal land”) Moving to require state land and municipal land transactions to be
registered in a cadastre or registration system
Human resource management
Moving toward higher compensation Moving toward greater scope for internal promotion Moving toward performance measurement Moving to enhance internal checks and balances
Autonomy and bureaucracy
Moving toward direct power and responsibility for the procurement process
Moving toward direct reporting to a line minister rather than through a permanent secretary or comparable bureaucrat
Moving toward direct power and responsibility for the entire recruit-ment process
Moving toward raising, retention, management, and expenditure of revenues through statutory and other sources
Information management
Moving toward computerization of land information and standard busi-ness processes
Moving toward fewer protocols for interagency sharing of land information
Attempting to update the inventory and status of public land stocks Attempting to register state and municipal land ownership rights Attempting to update the valuation of public property and adopt a port-
folio management approach
Delivery mechanisms Forming partnerships with the private sector or civil society for land development
Forming partnerships with the private sector or civil society for portfolio management and land allocation
Source: Adapted from Rajack (2001)
314 R. Rajack
Identifying local needs and perspectives will be of little value, however, if the mechanism for translating that knowledge into action is weak or absent. Thus it is argued that effective decentralization requires delegating authority for land manage-ment functions to local authorities. Once the subbodies have the power to set their own policies on public land in their jurisdiction, and the capacity to implement and execute those policies, management of public land and buildings can be effective in providing local solutions to local problems (Mutale, 2004). Even when decentralization exists in one measure or another, however, higher tiers of government all too commonly seek to influence decisions by lower tiers, often through the guise of policy, plan approval, legislation, or allocation of funding (Farvacque & McAuslan, 1992).
These arguments suggest that where public land management is a centralized state function or where de facto functional and financial decentralization is weak, the responsiveness of land supply is likely to be adversely affected by communi-cation gaps, competing and unconnected priorities, and limited opportunities for feedback from key stakeholders including the poor. If public landownership is sub-stantial in these circumstances, the net effect could be a land market out of sync with local reality. This is likely to be manifest most as sluggishness in the elasticity of supply of land in relation to effective demand, thereby leading to price increases. Experience with decentralized public land management has been mixed, as the fol-lowing examples illustrate.
12.1.3.1 Land Boards in Botswana: Accountable to Whom?
Botswana presents an interesting case in decentralized public land management. Urban informal settlement is proportionately much less significant in Botswana today than in many other rapidly urbanizing African countries. As early as 1970 the Tribal Lands Act created decentralized land boards based on a culturally familiar concept associated with the role of tribal chiefs. Among other functions, these boards were intended to help ensure that Botswana’s land management system adequately catered to emerging economic opportunities. There are 12 main and 38 subordinate land boards that allocate land for a wide range of uses, including residential, commercial, and industrial, and allocate rights under both customary and common law (Mathuba, 2003). The boards are also involved in the demolition of some unauthorized develop-ment. A recent review of land policy in Botswana (Natural Resource Services, 2002) emphasized the need to specify whether land boards should have a clear line of report-ing to the Ministry of Land and Environment or be completely decentralized and accountable to the citizens—especially important in the light of the recent separation of the Ministry of Land and Housing from the Ministry of Local Government.
12.1.3.2 Functional Duplication in Indonesia
Indonesia represents a major attempt at decentralization on many fronts, including public land management. Today there is no central authority over state land. The
31512 Does Public Ownership and Management of Land Matter for Land Market Outcomes?
National Land Agency (BPN) registers state land but does not have the power to alienate it. The Ministry of Forestry is responsible for managing nonurban lands, which form the majority of state land. As in many other countries, state land in urban areas is occupied and used by several ministries, including Defense, Health, and Education. Since 1998 the government has enacted several laws and regulations to improve transparency in the use and alienation of public land. Significantly, local authorities now have the authority to identify land for distribution for settlement and investment, with final approval given by BPN. Delegated functions include spatial planning and zoning regulations, land acquisition and compensation (except for national-level projects), settling land disputes, issuing location permits, produc-ing recommendations for disposal and reallocation of state land, reclaiming idle land, and designating adat (social function) land.
In reflecting on the decentralization in Indonesia, Thorburn (2004) noted that in an effort to boost local revenues, many districts interpreted the Decentralization Law to mean that they were entrusted with all functions of the BPN. That led many of them to establish their own agencies ( dinas ), sometimes as parallel structures to the BPN, which maintained a local presence after decentralization. This situation has reportedly contributed to greater confusion in land certification and transactions.
12.1.3.3 Decentralization Affected by Lack of Capacity and Central Guidance
Several other developing countries have decentralized their public land manage-ment functions. For example, Mongolia has delegated to municipalities the author-ity to allocate land use rights (McEwen, 2004). In Malaysia two states, Sabah and Sarawak, have their own land policies and planning instruments independent of national ones (Singh, 1994). In many countries in Central and Eastern Europe a separate category of “municipal property” has been created as an independent type of property, similar in its rights to private and state property. A part of this process is practical and legal delineation of state and municipal land. While this process has progressed well in some countries in Eastern Europe, it lags in the Russian Federa-tion and many other former Soviet countries, in part because legal delineation of municipal land has not always been followed by implementation of regulations to transfer such land. In some cases this delay is attributable in part to the separate legal treatment of land and improvements as well as to limited meaningful parcella-tion of nationalized land (Kaganova, 2006).
In many former Soviet countries decentralized land management has sought to facilitate the privatization of land. However, there is much divergence among coun-tries in the form this decentralization has taken. As Kaganova et al. (2001) observe,
Until now, the legal framework for local government management remains ambiguous and unclear, and a decision-making ability of city governments varies substantially from city to city depending on politics and power structure within a region of the country. (p. 335)
Limited financial and human resource capacity often constrains decentral-ized public land management. Many local institutions lack staff proficient in
316 R. Rajack
the field. Professionals with land management expertise are almost nonexistent at the local level. Among the many reasons for this phenomenon is inadequate human resource management compared with that at the central level, reflected in uncompetitive salaries or lack of opportunities for promotion. Financial and human resource capacities are of course related: local bodies usually lack suf-ficient financial resources for the investments that can enhance public land man-agement. These investments may include hiring skilled professionals, setting up information systems, and covering other operating costs that may occur during the decentralization effort.
12.1.4 Unfair Competition Between Public and Private Developers
The state not only is regarded as an inefficient land developer; it is often accused of suppressing private sector participation in the land market through unfair competi-tion. Agencies of the state are viewed by private sector competitors as having an unfair advantage, particularly when they enjoy both regulatory and development powers. With these powers, the state can both approve its own project and reject or delay proposals from competitors. Moreover, the state often uses its ownership of public land to subsidize its land development and housing production by charging only nominally (if at all) for the cost of raw land. This failure to incorporate the real price of land distorts product prices and hinders accurate estimation of the opportu-nity cost of specific policy choices. In these ways private sector participation can be hamstrung, exacerbating the shortage of supply of developed land.
The urban development authorities of South Asia are trademark examples of the state taking on the role of land developer. In India and Pakistan these development authorities also assume the role of regulator. In the Indian state of Karnataka the Bangalore Development Authority (BDA), constituted in 1976, has development functions that include implementing residential, commercial, and civic schemes; developing infrastructure; and constructing housing. Yet as a designated planning authority it also carries out regulatory functions, including preparing development plans for the city, approving development plans for group housing and layouts, and approving building plans. Organizationally, the authority has capacity in land acqui-sition, town planning, engineering, finance, law, and allotment and administration. According to the Bangalore Metropolitan Region Development Authority Act, no other authority or person may undertake development within the Bangalore Metro-politan Region without permission of the BDA. This puts the authority as a devel-oper in a very favorable position relative to its competitors, both public and private.
If experience in India is illustrative, there is little reason to believe that a public development authority is better equipped to provide land at the expense of large-scale private land development. In 1976 the government of India attempted to simulta-neously increase the stock of publicly owned land and curb the influence of large landowners through the Urban Land (Ceiling and Regulation) Act. Seventeen states
31712 Does Public Ownership and Management of Land Matter for Land Market Outcomes?
and three union territories passed legislation to this effect, amounting to perhaps the largest ever attempt at land banking. Over the decades of its application the act has been severely criticized for being highly expropriatory and for vesting in the states and union territories too much discretionary power in granting exemptions. It has also been criticized for its failure to specify a mechanism for ensuring the entry of “excess,” vacant land onto the market and for creating many land market distortions.
A recent review (National Institute of Urban Affairs, 2002) estimated that in the states of Karnataka, Punjab, Madhya Pradesh, Uttar Pradesh, and Gujarat combined, around 22,000 ha were declared to be excess land under the act. Of this amount, about 16,000 ha were vested with the state and only about 1,000 ha were used for a development purpose, including low-income settlement. Thirty years after the intro-duction of the Urban Land (Ceiling and Regulation) Act, the central government is now so convinced of the ineffectiveness of this attempt at redistribution that favored public over private land development that it includes outright repeal of this legisla-tion by state legislatures as one of the reforms for which it financially rewards states under the Jawaharlal Nehru National Urban Renewal Mission and its predecessor program, the Urban Reform Incentive Fund.
12.2 Existing Reviews of the Effectiveness of Public Land Management
While there have been many attempts to document public land management arrange-ments in specific countries, these are by and large descriptive and usually highly idi-osyncratic. Consequently, documented reviews of the effectiveness of management of urban public land are sparse. Generally, however, three evaluation approaches are discernible:
Reviews from an asset management perspective. Reviews from a production function perspective. Reviews of comparative transaction costs and development outputs.
This section briefly describes each of these approaches with illustration from country cases. By no means does it represent a comprehensive review of all such evaluations.
12.2.1 Reviews from an Asset Management Perspective
Reviews of public land management from an asset management perspective are premised on the view that public landholdings are potentially valuable and particu-larly so for otherwise resource-poor central or local government bodies. They argue that efficient public land management should take into account the opportunity cost of land use and land alienation decisions to maximize the financial return from holding the assets.
•••
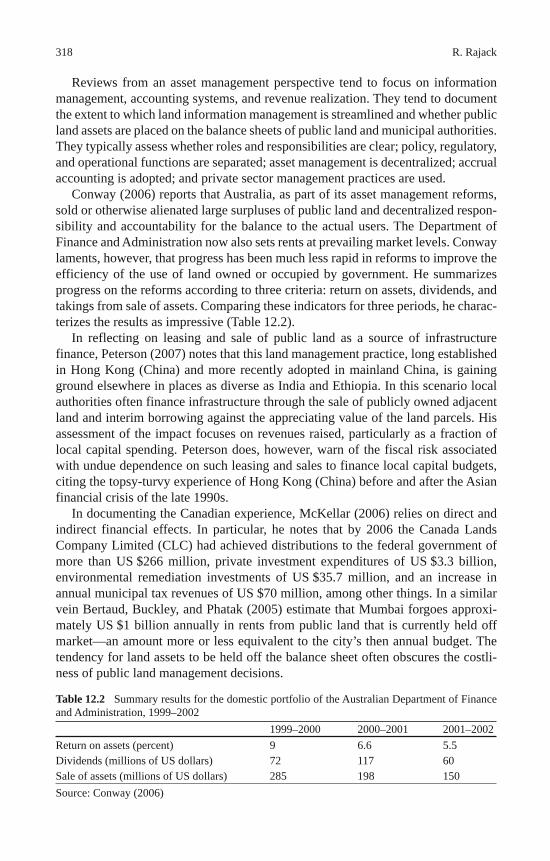
318 R. Rajack
Reviews from an asset management perspective tend to focus on information management, accounting systems, and revenue realization. They tend to document the extent to which land information management is streamlined and whether public land assets are placed on the balance sheets of public land and municipal authorities. They typically assess whether roles and responsibilities are clear; policy, regulatory, and operational functions are separated; asset management is decentralized; accrual accounting is adopted; and private sector management practices are used.
Conway (2006) reports that Australia, as part of its asset management reforms, sold or otherwise alienated large surpluses of public land and decentralized respon-sibility and accountability for the balance to the actual users. The Department of Finance and Administration now also sets rents at prevailing market levels. Conway laments, however, that progress has been much less rapid in reforms to improve the efficiency of the use of land owned or occupied by government. He summarizes progress on the reforms according to three criteria: return on assets, dividends, and takings from sale of assets. Comparing these indicators for three periods, he charac-terizes the results as impressive (Table 12.2).
In reflecting on leasing and sale of public land as a source of infrastructure finance, Peterson (2007) notes that this land management practice, long established in Hong Kong (China) and more recently adopted in mainland China, is gaining ground elsewhere in places as diverse as India and Ethiopia. In this scenario local authorities often finance infrastructure through the sale of publicly owned adjacent land and interim borrowing against the appreciating value of the land parcels. His assessment of the impact focuses on revenues raised, particularly as a fraction of local capital spending. Peterson does, however, warn of the fiscal risk associated with undue dependence on such leasing and sales to finance local capital budgets, citing the topsy-turvy experience of Hong Kong (China) before and after the Asian financial crisis of the late 1990s.
In documenting the Canadian experience, McKellar (2006) relies on direct and indirect financial effects. In particular, he notes that by 2006 the Canada Lands Company Limited (CLC) had achieved distributions to the federal government of more than US $266 million, private investment expenditures of US $3.3 billion, environmental remediation investments of US $35.7 million, and an increase in annual municipal tax revenues of US $70 million, among other things. In a similar vein Bertaud, Buckley, and Phatak (2005) estimate that Mumbai forgoes approxi-mately US $1 billion annually in rents from public land that is currently held off market—an amount more or less equivalent to the city’s then annual budget. The tendency for land assets to be held off the balance sheet often obscures the costli-ness of public land management decisions.
Table 12.2 Summary results for the domestic portfolio of the Australian Department of Finance and Administration, 1999–2002 1999–2000 2000–2001 2001–2002 Return on assets (percent) 9 6.6 5.5 Dividends (millions of US dollars) 72 117 60 Sale of assets (millions of US dollars) 285 198 150 Source: Conway (2006)
31912 Does Public Ownership and Management of Land Matter for Land Market Outcomes?
12.2.2 Reviews from a Production Function Perspective
A related approach to evaluating the effectiveness of public land management, as out-lined by Van Meurs (1986), focuses on the production function aspect of public land development agencies. This data-intensive model appraises inventory control, pro-duction, sales, management systems, and operational areas such as land acquisition.
The model emphasizes that inventory policy should account for the agency’s cost of capital relative to the rate of appreciation of the land stock in inventory. On a point particularly relevant to the line of inquiry pursued in this chapter, it contends that inventory policy should consider the impact on land prices of removing land from the market and thereby potentially creating artificial scarcity.
The model uses conventional risk analysis in analyzing production with par-ticular attention to two risks: first, the risk of capital being frozen as large outlays for land acquired for immediate production are immobilized by regulatory or other delays; and second, project-related risks, particularly the double-edged sword of project delays that increase cost while also decreasing output. The model also con-siders the extent to which market demand is effectively assessed to allow accurate projections of timely receipt of sales revenue.
Finally, the model looks at management systems. It assesses the extent to which administrative costs are minimized by maintaining a lean, decentralized project management workforce. In assessing financial management it focuses on an agen-cy’s sources of working capital, giving these sources heightened attention when they are internal. It also examines the extent to which a public land development agency minimizes its land development costs through effective land acquisition.
In applying the model to Agence Foncière d’Habitation (AFH) in Tunisia and the Korea Land Development Corporation (KLDC) in the Republic of Korea, Van Meurs (1986) found that at the time of evaluation neither agency had explicitly addressed inventory policy. The inventory of KLDC was found to be twice what was needed to maintain the agency’s production level. The ratio of the cost of capital to the rate of appreciation in land stock in KLDC was satisfactory, although an unlikely bench-mark to miss given the general inflation in Korean land prices at the time.
The Korean approach to capital exposure risk was to program acquisition and development volumes according to a formula such that 80% of new project land was acquired during the first year and the rest the following year. The new project volume for the current year would be equal to 20% of the development volume for the cur-rent year, 50% of the development volume for the next year, and 30% of the develop-ment volume in the year after. No such systematic approach was observed in AFH.
While KLDC was streamlining and standardizing construction management rou-tines at the time, AFH’s approach was much more ad hoc. AFH was also found to have considerable project risk exposure because of its dependence on public utili-ties. The ability of both agencies to assess market demand was found to be weak, as reflected by mismatches between the type and volume of products and unmet demands for other products. Both KLDC and AFH substantially expanded staffing during the late 1970s and early 1980s. This adversely affected performance ratios, particularly when sales plummeted later on.
320 R. Rajack
12.2.3 Reviews of Comparative Transaction Costs and Development Outputs
Another approach to evaluating the effectiveness of public land management compares transaction costs or development outputs either before and after reforms or across different institutional arrangements. This approach is widely used in evaluating the progress of land registration projects involving business process reengineering and computerization of land records. It is also mainstreamed in the World Bank Group’s Doing Business and Investment Climate Surveys, which periodically rank countries on a wide variety of indicators, a few of which relate to land access. The notion underlying such evaluations is that a reduction in trans-action costs for key procedures (such as the number of procedures to register a property or the time to complete allocation of a parcel of public land) and an increase in development outputs are evidence of success. A few examples are highlighted in the following.
12.2.3.1 Reforms at the Bangalore Development Authority in India
Paul (1998), in a World Bank Policy Research Working Paper reporting on the use of citizen scorecards in India, noted that of all public agencies surveyed, the BDA had by far the lowest scores on general household satisfaction. Only 1% of BDA custom-ers were satisfied with their experience with the agency, and some 65% were explic-itly dissatisfied. A mere 11% were satisfied with staff behavior, 2% with quality of service, and 4% with information provided. Moreover, the BDA had the highest share of customers (33%) paying “speed money” in the hope of expediting service.
To the BDA’s credit, it was the first public agency in India to respond to the scorecard in a systematic way. The BDA undertook significant changes in customer orientation and operational management. The average annual volume of residential plots developed and allotted increased substantially. During the restructuring the BDA adopted more rigorous accounting of its assets, selling some and leveraging others. While the BDA’s improved performance in recent years has been a source of pride, there is no documented estimation of how the land market might have operated if the BDA were not such a dominant player. Whether the private sector, operating on a level playing field, would have matched or exceeded the BDA’s performance is not known.
12.2.3.2 Institutional Reforms and Development Outputs in Trinidad
Rajack’s (2001) review of state land management in Trinidad documented institu-tional reforms and reductions in transaction costs under three institutional regimes. Procurement and recruitment were found to be significantly faster in the newest institutional framework. The study also attempted to compare development outputs
32112 Does Public Ownership and Management of Land Matter for Land Market Outcomes?
before and after reform. These outputs included the number of households directly benefiting from infrastructure upgrading, tenure regularization, and new serviced plots. The review noted that the latest institutional framework, in which the Land Set-tlement Agency was the operational arm, was associated with enhanced coverage and faster delivery of development outputs. The review contended that these outcomes were likely due to several changes in the “rules of the game” (institutional changes), including the increasing acceptance and use of incremental development standards and incremental tenure upgrading; the increasing implementation of infrastructure works through a self-help method; and the faster procurement, decision making, and implementation in the Land Settlement Agency (Rajack & Barhate, 2004).
12.2.3.3 Land Privatization in the Russian Federation
Kisunko and Coolidge (2007) provide a rare example of applying econometric anal-ysis to evaluate urban public land management reforms, using data for the Russian Federation. They use ordinary least squares (OLS) regression analysis on a number of transaction cost and development output variables. They find some statistically reli-able correlations between time to complete certain procedures and aspects of public land management such as number of stages by law and number of stages with unof-ficial payments. They also find that the duration of certain procedures reliably con-tributes to determining what share of land transactions will be lease transactions.
12.2.3.4 Better Implementation of Land Pooling at the Local Level in Nepal
In Nepal, where the urban development process is highly structured, land pooling projects are implemented and monitored mainly by the Kathmandu Valley Town Development Committee, made up of three town development committees. Only 2 of 11 projects initiated under the 1988 land pooling scheme were implemented and man-aged by municipalities (although following central government procedures). These two projects were implemented faster than those implemented by the central office, and one of them yielded the highest financial internal rate of return (Karki, 2004).
12.3 Public Land Management and Land Market Outcomes: Global Empirical Insights
While each of the above approaches to assessing the effectiveness of public land management offers useful insights, they all stop short of assessing whether the man-agement structures, production models, or reforms are associated with broader land market impacts that might reasonably be linked with public ownership and manage-ment of land. Econometric methods are seldom used to estimate whether changes in development outputs, let alone impacts, are reliably associated with the structures
322 R. Rajack
and reforms or may be explained by other intervening variables. This is understand-able given the somewhat tenuous theoretical links and the grave deficiencies in land market data for developing country cities. Moreover, cross-country analysis has been hindered by the absence of standard profiling of public land management features across cities.
This section begins to address this knowledge gap. First, data of admittedly varia-ble quality are used to profile public land management across cities in the developing world. The key features highlighted are land information management, organizational arrangements and human resource capacity, and land management practices. Then the section explores whether there is evidence of empirical relationships between each of these features as well as the extent of public landownership and a number of land market outcome indicators. These indicators include tentative estimates of house price to income ratios and shelter price inflation over the period 2000–2005, a more rigorous measure of the contiguity of recent spatial expansion, an estimate of the extent to which encroachment affects public rather than private land, and the percentage of firms citing access to land as a major constraint to their business.
12.3.1 Data Sources
The main data sources are the World Bank–led Urban Growth Management Initia-tive, original data collection, the World Bank Group’s Investment Climate Assess-ment data, and a database of decentralization indexes.
The Urban Growth Management Initiative , from its first round, provides a series of indicators, based on pairs of satellite images taken 10–12 years apart, that meas-ure the level and pattern of urban expansion in 120 representative cities around the world. A particular focus here is the contiguity index, which measures the mono-centricity of urban structure based on the area of the main built-up cluster of the city as a share of its total built-up area (Angel, Sheppard, & Civco, 2005). The sample of cities is a random sample stratified to be reflective of world regions, population size, and GDP variations.
The second round of the Urban Growth Management Initiative provides esti-mates of different land market outcomes for 60 of the 120 cities in the study. These 60 cities are mostly those with deficiencies in affordable and adequate housing, often manifest in the incidence of informal settlement. The estimates were gener-ated by field-based consultants applying a standard instrument called the Survey of Secure Tenure in Cities with Irregular Settlements. The survey consisted of a series of field visits. On the first visit the consultants collected general housing market information from often incomplete statistical sources and from local officials. Three indicators are used here:
• Estimated inflation in housing prices over the period 2000–2005. • Estimated ratio of median dwelling unit price to median annual income in
2005. • Estimated proportion of invaded land that is public land.
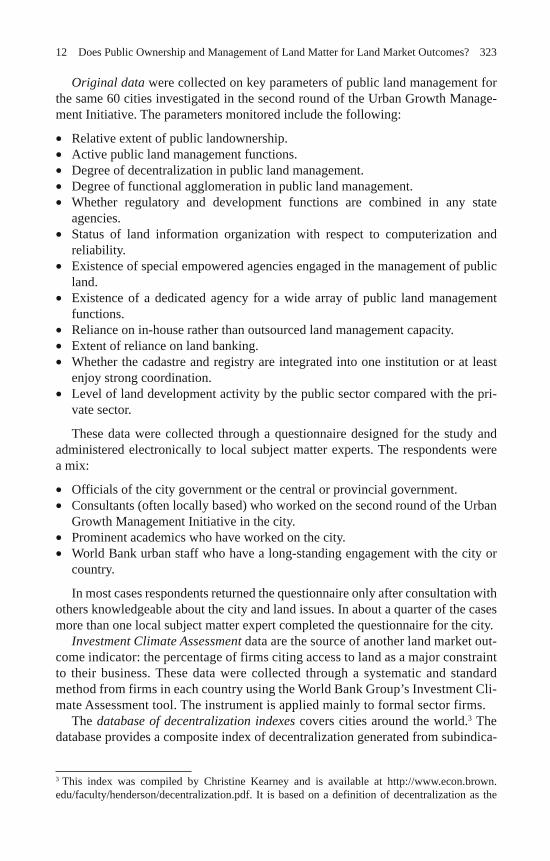
32312 Does Public Ownership and Management of Land Matter for Land Market Outcomes?
Original data were collected on key parameters of public land management for the same 60 cities investigated in the second round of the Urban Growth Manage-ment Initiative. The parameters monitored include the following:
• Relative extent of public landownership. • Active public land management functions. • Degree of decentralization in public land management. • Degree of functional agglomeration in public land management. • Whether regulatory and development functions are combined in any state
agencies. • Status of land information organization with respect to computerization and
reliability. • Existence of special empowered agencies engaged in the management of public
land. • Existence of a dedicated agency for a wide array of public land management
functions. • Reliance on in-house rather than outsourced land management capacity. • Extent of reliance on land banking. • Whether the cadastre and registry are integrated into one institution or at least
enjoy strong coordination. • Level of land development activity by the public sector compared with the pri-
vate sector.
These data were collected through a questionnaire designed for the study and administered electronically to local subject matter experts. The respondents were a mix:
• Officials of the city government or the central or provincial government. • Consultants (often locally based) who worked on the second round of the Urban
Growth Management Initiative in the city. • Prominent academics who have worked on the city. • World Bank urban staff who have a long-standing engagement with the city or
country.
In most cases respondents returned the questionnaire only after consultation with others knowledgeable about the city and land issues. In about a quarter of the cases more than one local subject matter expert completed the questionnaire for the city.
Investment Climate Assessment data are the source of another land market out-come indicator: the percentage of firms citing access to land as a major constraint to their business. These data were collected through a systematic and standard method from firms in each country using the World Bank Group’s Investment Cli-mate Assessment tool. The instrument is applied mainly to formal sector firms.
The database of decentralization indexes covers cities around the world. 3 The database provides a composite index of decentralization generated from subindica-
3 This index was compiled by Christine Kearney and is available at http://www.econ.brown.edu/faculty/henderson/decentralization.pdf. It is based on a definition of decentralization as the
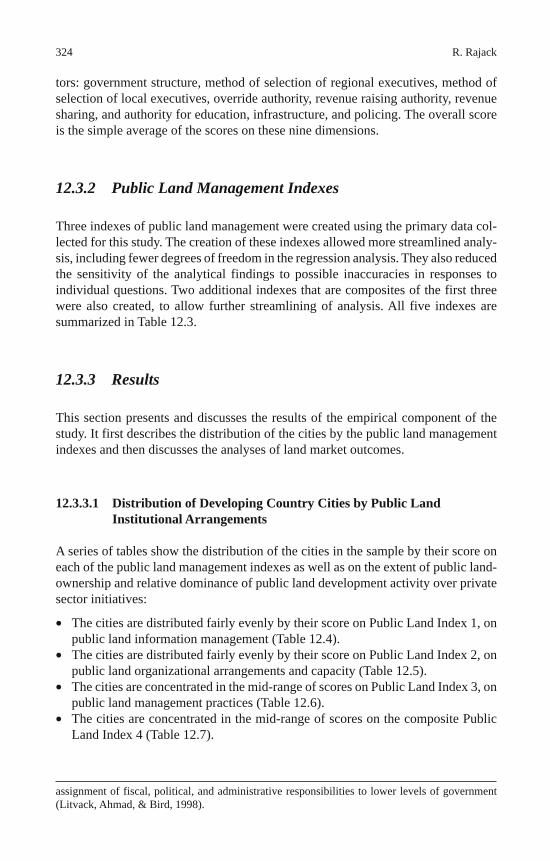
324 R. Rajack
tors: government structure, method of selection of regional executives, method of selection of local executives, override authority, revenue raising authority, revenue sharing, and authority for education, infrastructure, and policing. The overall score is the simple average of the scores on these nine dimensions.
12.3.2 Public Land Management Indexes
Three indexes of public land management were created using the primary data col-lected for this study. The creation of these indexes allowed more streamlined analy-sis, including fewer degrees of freedom in the regression analysis. They also reduced the sensitivity of the analytical findings to possible inaccuracies in responses to individual questions. Two additional indexes that are composites of the first three were also created, to allow further streamlining of analysis. All five indexes are summarized in Table 12.3.
12.3.3 Results
This section presents and discusses the results of the empirical component of the study. It first describes the distribution of the cities by the public land management indexes and then discusses the analyses of land market outcomes.
12.3.3.1 Distribution of Developing Country Cities by Public Land Institutional Arrangements
A series of tables show the distribution of the cities in the sample by their score on each of the public land management indexes as well as on the extent of public land-ownership and relative dominance of public land development activity over private sector initiatives:
The cities are distributed fairly evenly by their score on Public Land Index 1, on public land information management (Table 12.4). The cities are distributed fairly evenly by their score on Public Land Index 2, on public land organizational arrangements and capacity (Table 12.5). The cities are concentrated in the mid-range of scores on Public Land Index 3, on public land management practices (Table 12.6). The cities are concentrated in the mid-range of scores on the composite Public Land Index 4 (Table 12.7).
assignment of fiscal, political, and administrative responsibilities to lower levels of government (Litvack, Ahmad, & Bird, 1998).
•
•
•
•
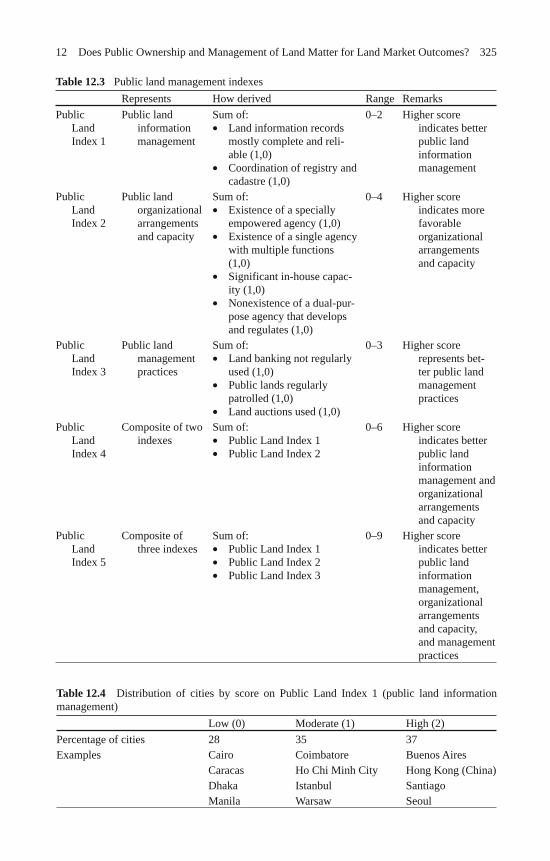
32512 Does Public Ownership and Management of Land Matter for Land Market Outcomes?
Table 12.3 Public land management indexes Represents How derived Range Remarks Public
Land Index 1
Public land information management
Sum of: • Land information records
mostly complete and reli-able (1,0)
• Coordination of registry and cadastre (1,0)
0–2 Higher score indicates better public land information management
Public Land Index 2
Public land organizational arrangements and capacity
Sum of: • Existence of a specially
empowered agency (1,0) • Existence of a single agency
with multiple functions (1,0)
• Significant in-house capac-ity (1,0)
• Nonexistence of a dual-pur-pose agency that develops and regulates (1,0)
0–4 Higher score indicates more favorable organizational arrangements and capacity
Public Land Index 3
Public land management practices
Sum of: • Land banking not regularly
used (1,0) • Public lands regularly
patrolled (1,0) • Land auctions used (1,0)
0–3 Higher score represents bet-ter public land management practices
Public
Land Index 4
Composite of two indexes
Sum of: • Public Land Index 1 • Public Land Index 2
0–6 Higher score indicates better public land information management and organizational arrangements and capacity
Public Land Index 5
Composite of three indexes
Sum of: • Public Land Index 1 • Public Land Index 2 • Public Land Index 3
0–9 Higher score indicates better public land information management, organizational arrangements and capacity, and management practices
Table 12.4 Distribution of cities by score on Public Land Index 1 (public land information management) Low (0) Moderate (1) High (2) Percentage of cities 28 35 37 Examples Cairo Coimbatore Buenos Aires
Caracas Ho Chi Minh City Hong Kong (China) Dhaka Istanbul Santiago Manila Warsaw Seoul
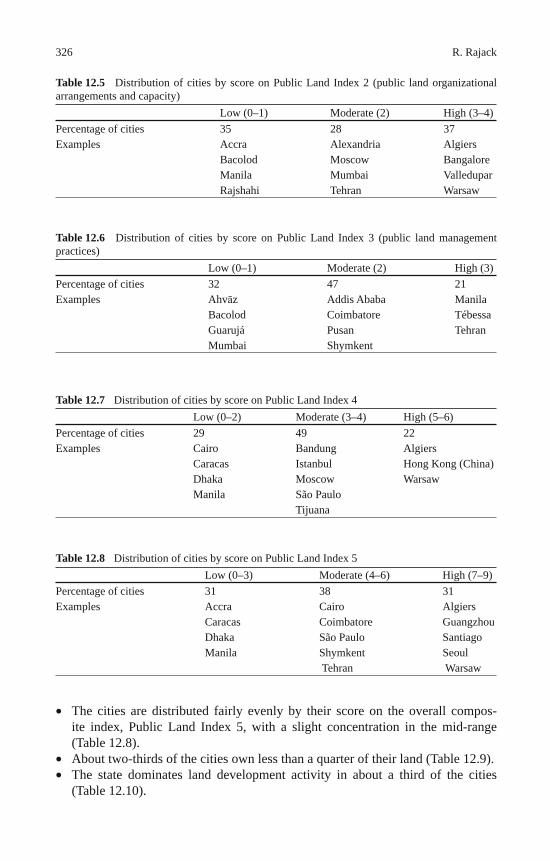
326 R. Rajack
The cities are distributed fairly evenly by their score on the overall compos-ite index, Public Land Index 5, with a slight concentration in the mid-range (Table 12.8). About two-thirds of the cities own less than a quarter of their land (Table 12.9). The state dominates land development activity in about a third of the cities (Table 12.10).
•
••
Table 12.5 Distribution of cities by score on Public Land Index 2 (public land organizational arrangements and capacity) Low (0–1) Moderate (2) High (3–4) Percentage of cities 35 28 37 Examples Accra Alexandria Algiers
Bacolod Moscow Bangalore Manila Mumbai Valledupar Rajshahi Tehran Warsaw
Table 12.6 Distribution of cities by score on Public Land Index 3 (public land management practices) Low (0–1) Moderate (2) High (3) Percentage of cities 32 47 21 Examples Ahv z Addis Ababa Manila Bacolod Coimbatore Tébessa
Guarujá Pusan Tehran Mumbai Shymkent
Table 12.7 Distribution of cities by score on Public Land Index 4 Low (0–2) Moderate (3–4) High (5–6) Percentage of cities 29 49 22 Examples Cairo Bandung Algiers
Caracas Istanbul Hong Kong (China) Dhaka Moscow Warsaw Manila São Paulo Tijuana
Table 12.8 Distribution of cities by score on Public Land Index 5 Low (0–3) Moderate (4–6) High (7–9) Percentage of cities 31 38 31 Examples Accra Cairo Algiers
Caracas Coimbatore Guangzhou Dhaka São Paulo Santiago Manila Shymkent Seoul
Tehran Warsaw
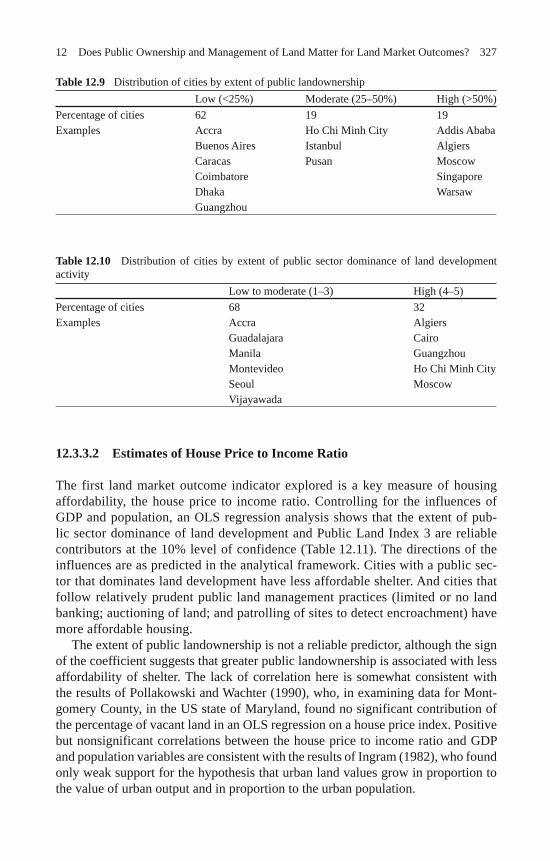
32712 Does Public Ownership and Management of Land Matter for Land Market Outcomes?
12.3.3.2 Estimates of House Price to Income Ratio
The first land market outcome indicator explored is a key measure of housing affordability, the house price to income ratio. Controlling for the influences of GDP and population, an OLS regression analysis shows that the extent of pub-lic sector dominance of land development and Public Land Index 3 are reliable contributors at the 10% level of confidence (Table 12.11). The directions of the influences are as predicted in the analytical framework. Cities with a public sec-tor that dominates land development have less affordable shelter. And cities that follow relatively prudent public land management practices (limited or no land banking; auctioning of land; and patrolling of sites to detect encroachment) have more affordable housing.
The extent of public landownership is not a reliable predictor, although the sign of the coefficient suggests that greater public landownership is associated with less affordability of shelter. The lack of correlation here is somewhat consistent with the results of Pollakowski and Wachter (1990), who, in examining data for Mont-gomery County, in the US state of Maryland, found no significant contribution of the percentage of vacant land in an OLS regression on a house price index. Positive but nonsignificant correlations between the house price to income ratio and GDP and population variables are consistent with the results of Ingram (1982), who found only weak support for the hypothesis that urban land values grow in proportion to the value of urban output and in proportion to the urban population.
Table 12.9 Distribution of cities by extent of public landownership Low (<25%) Moderate (25–50%) High (>50%) Percentage of cities 62 19 19 Examples Accra Ho Chi Minh City Addis Ababa
Buenos Aires Istanbul Algiers Caracas Pusan Moscow Coimbatore Singapore Dhaka Warsaw Guangzhou
Table 12.10 Distribution of cities by extent of public sector dominance of land development activity Low to moderate (1–3) High (4–5) Percentage of cities 68 32 Examples Accra Algiers
Guadalajara Cairo Manila Guangzhou Montevideo Ho Chi Minh City Seoul Moscow Vijayawada
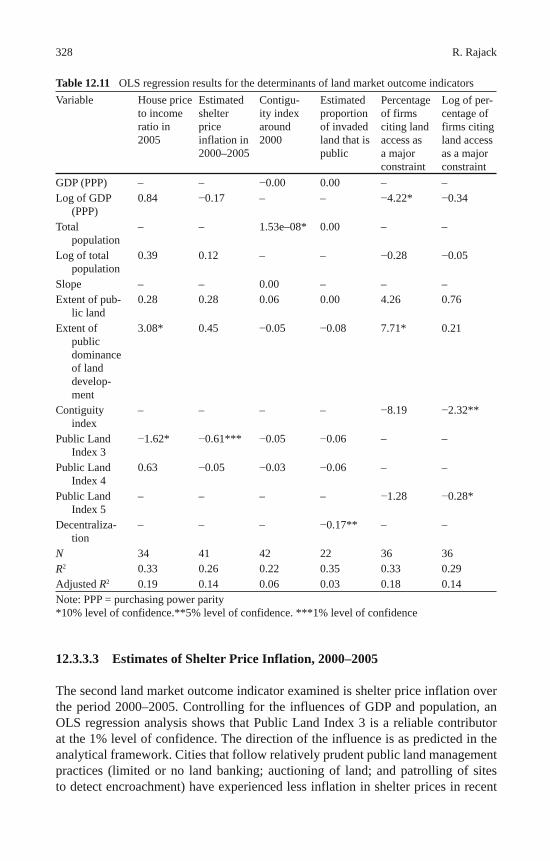
328 R. Rajack
12.3.3.3 Estimates of Shelter Price Inflation, 2000–2005
The second land market outcome indicator examined is shelter price inflation over the period 2000–2005. Controlling for the influences of GDP and population, an OLS regression analysis shows that Public Land Index 3 is a reliable contributor at the 1% level of confidence. The direction of the influence is as predicted in the analytical framework. Cities that follow relatively prudent public land management practices (limited or no land banking; auctioning of land; and patrolling of sites to detect encroachment) have experienced less inflation in shelter prices in recent
Table 12.11 OLS regression results for the determinants of land market outcome indicators Variable House price
to income ratio in 2005
Estimated shelter price inflation in 2000–2005
Contigu-ity index around 2000
Estimated proportion of invaded land that is public
Percentage of firms citing land access as a major constraint
Log of per-centage of firms citing land access as a major constraint
GDP (PPP) – – 0.00 0.00 – – Log of GDP
(PPP) 0.84 0.17 – – 4.22* 0.34
Total population
– – 1.53e–08* 0.00 – –
Log of total population
0.39 0.12 – – 0.28 0.05
Slope – – 0.00 – – – Extent of pub-
lic land 0.28 0.28 0.06 0.00 4.26 0.76
Extent of public dominance of land develop-ment
3.08* 0.45 0.05 0.08 7.71* 0.21
Contiguity index
– – – – 8.19 2.32**
Public Land Index 3
1.62* 0.61*** 0.05 0.06 – –
Public Land Index 4
0.63 0.05 0.03 0.06 – –
Public Land Index 5
– – – – 1.28 0.28*
Decentraliza-tion
– – – 0.17** – –
N 34 41 42 22 36 36 R 2 0.33 0.26 0.22 0.35 0.33 0.29 Adjusted R 2 0.19 0.14 0.06 0.03 0.18 0.14 Note: PPP = purchasing power parity *10% level of confidence.**5% level of confidence. ***1% level of confidence
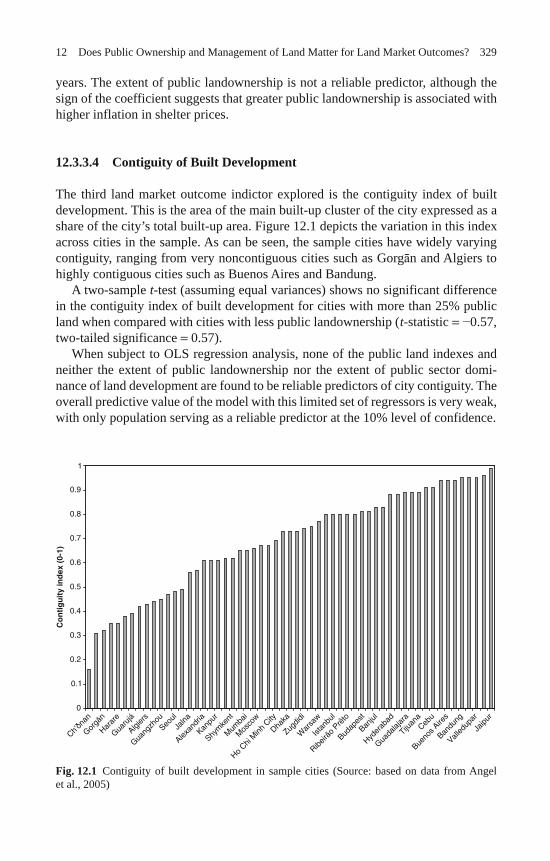
32912 Does Public Ownership and Management of Land Matter for Land Market Outcomes?
years. The extent of public landownership is not a reliable predictor, although the sign of the coefficient suggests that greater public landownership is associated with higher inflation in shelter prices.
12.3.3.4 Contiguity of Built Development
The third land market outcome indictor explored is the contiguity index of built development. This is the area of the main built-up cluster of the city expressed as a share of the city’s total built-up area. Figure 12.1 depicts the variation in this index across cities in the sample. As can be seen, the sample cities have widely varying contiguity, ranging from very noncontiguous cities such as Gorg n and Algiers to highly contiguous cities such as Buenos Aires and Bandung.
A two-sample t -test (assuming equal variances) shows no significant difference in the contiguity index of built development for cities with more than 25% public land when compared with cities with less public landownership ( t -statistic = 0.57, two-tailed significance = 0.57).
When subject to OLS regression analysis, none of the public land indexes and neither the extent of public landownership nor the extent of public sector domi-nance of land development are found to be reliable predictors of city contiguity. The overall predictive value of the model with this limited set of regressors is very weak, with only population serving as a reliable predictor at the 10% level of confidence.
Fig. 12.1 Contiguity of built development in sample cities (Source: based on data from Angel et al., 2005)
0
0.1
0.2
0.3
0.4
0.5
0.6
0.7
0.8
0.9
1
Harar
e
Ch’ona
n
Gorgä
n
Guaru
já
Algier
s
Guang
zhou
Seoul
Jalna
Alexan
dria
Kanpu
r
Shym
kent
Mum
bai
Mos
cow
Ho Chi
Minh
City
Dhaka
Zugdid
i
War
saw
Istan
bul
Ribeirã
o Prê
to
Budap
est
Banjul
Hyder
abad
Guada
lajar
a
Tijuan
aCeb
u
Bueno
s Aire
s
Bandu
ng
Valled
upar
Jaipu
r
Co
nti
gu
ity
ind
ex (
0-1)
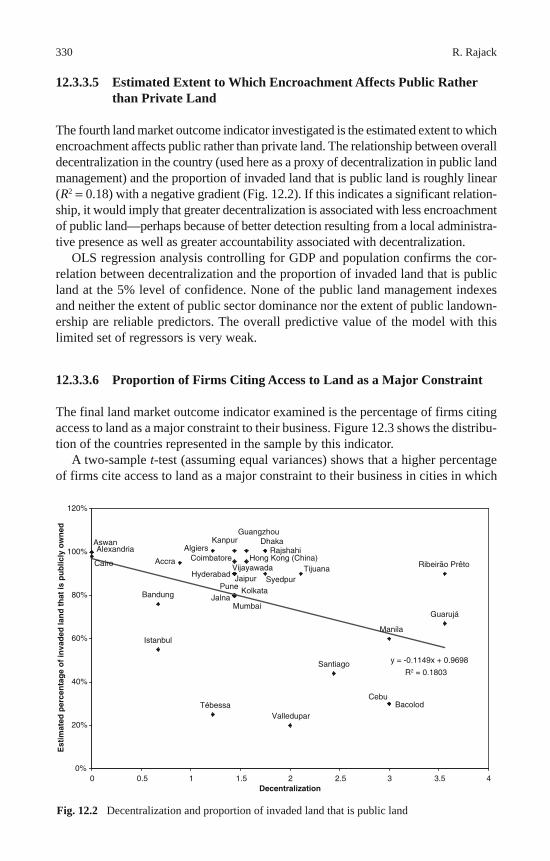
330 R. Rajack
12.3.3.5 Estimated Extent to Which Encroachment Affects Public Rather than Private Land
The fourth land market outcome indicator investigated is the estimated extent to which encroachment affects public rather than private land. The relationship between overall decentralization in the country (used here as a proxy of decentralization in public land management) and the proportion of invaded land that is public land is roughly linear ( R 2 = 0.18) with a negative gradient (Fig. 12.2). If this indicates a significant relation-ship, it would imply that greater decentralization is associated with less encroachment of public land—perhaps because of better detection resulting from a local administra-tive presence as well as greater accountability associated with decentralization.
OLS regression analysis controlling for GDP and population confirms the cor-relation between decentralization and the proportion of invaded land that is public land at the 5% level of confidence. None of the public land management indexes and neither the extent of public sector dominance nor the extent of public landown-ership are reliable predictors. The overall predictive value of the model with this limited set of regressors is very weak.
12.3.3.6 Proportion of Firms Citing Access to Land as a Major Constraint
The final land market outcome indicator examined is the percentage of firms citing access to land as a major constraint to their business. Figure 12.3 shows the distribu-tion of the countries represented in the sample by this indicator.
A two-sample t -test (assuming equal variances) shows that a higher percentage of firms cite access to land as a major constraint to their business in cities in which
Fig. 12.2 Decentralization and proportion of invaded land that is public land
Vijayawada
Valledupar
Tijuana
Tébessa
Santiago
Syedpur
Ribeirão Prêto
Rajshahi
Pune
Mumbai
Manila
Kolkata
Kanpur
Jalna
Jaipur
Istanbul
Hyderabad
Hong Kong (China)
Guarujá
GuangzhouDhaka
Coimbatore
Cebu
Cairo
Bandung
Bacolod
AswanAlgiersAlexandria
Accra
y = -0.1149x + 0.9698
R2 = 0.1803
0%
20%
40%
60%
80%
100%
120%
0 0.5 1.5 2.5 3.5Decentralization
Est
imat
ed p
erce
nta
ge
of
inva
ded
lan
d t
hat
is p
ub
licly
ow
ned
41 2 3
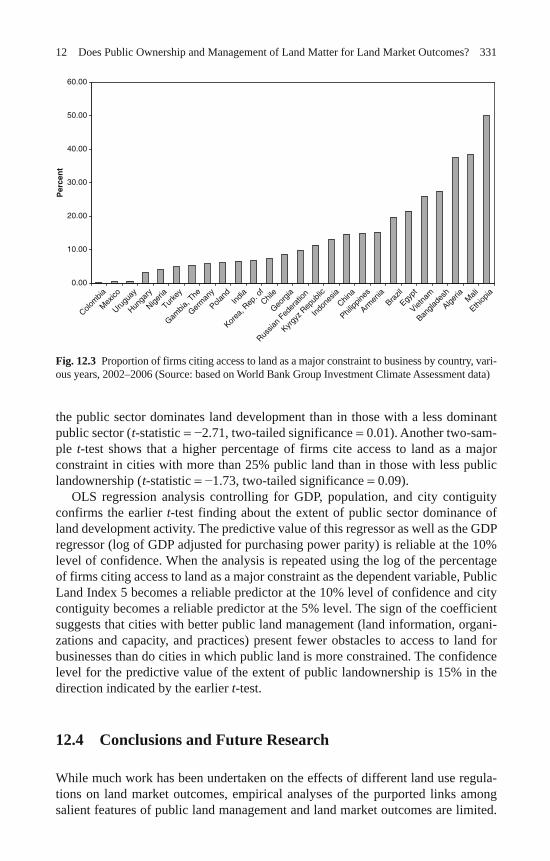
33112 Does Public Ownership and Management of Land Matter for Land Market Outcomes?
the public sector dominates land development than in those with a less dominant public sector ( t -statistic = 2.71, two-tailed significance = 0.01). Another two-sam-ple t -test shows that a higher percentage of firms cite access to land as a major constraint in cities with more than 25% public land than in those with less public landownership ( t -statistic = 1.73, two-tailed significance = 0.09).
OLS regression analysis controlling for GDP, population, and city contiguity confirms the earlier t -test finding about the extent of public sector dominance of land development activity. The predictive value of this regressor as well as the GDP regressor (log of GDP adjusted for purchasing power parity) is reliable at the 10% level of confidence. When the analysis is repeated using the log of the percentage of firms citing access to land as a major constraint as the dependent variable, Public Land Index 5 becomes a reliable predictor at the 10% level of confidence and city contiguity becomes a reliable predictor at the 5% level. The sign of the coefficient suggests that cities with better public land management (land information, organi-zations and capacity, and practices) present fewer obstacles to access to land for businesses than do cities in which public land is more constrained. The confidence level for the predictive value of the extent of public landownership is 15% in the direction indicated by the earlier t -test.
12.4 Conclusions and Future Research
While much work has been undertaken on the effects of different land use regula-tions on land market outcomes, empirical analyses of the purported links among salient features of public land management and land market outcomes are limited.
Fig. 12.3 Proportion of firms citing access to land as a major constraint to business by country, vari-ous years, 2002–2006 (Source: based on World Bank Group Investment Climate Assessment data )
Per
cen
t
0.00
10.00
20.00
30.00
40.00
50.00
60.00
Colom
bia
Mex
ico
Urugu
ay
Hunga
ry
Nigeria
Turke
y
Gambia
, The
Germ
any
Poland
India
Korea
, Rep
. of
Chile
Georg
ia
Russia
n Fed
erat
ion
Kyrgy
z Rep
ublic
Indo
nesia
China
Philipp
ines
Armen
iaBra
zil
Egypt
Vietna
m
Bangla
desh
Algeria M
ali
Ethiop
ia
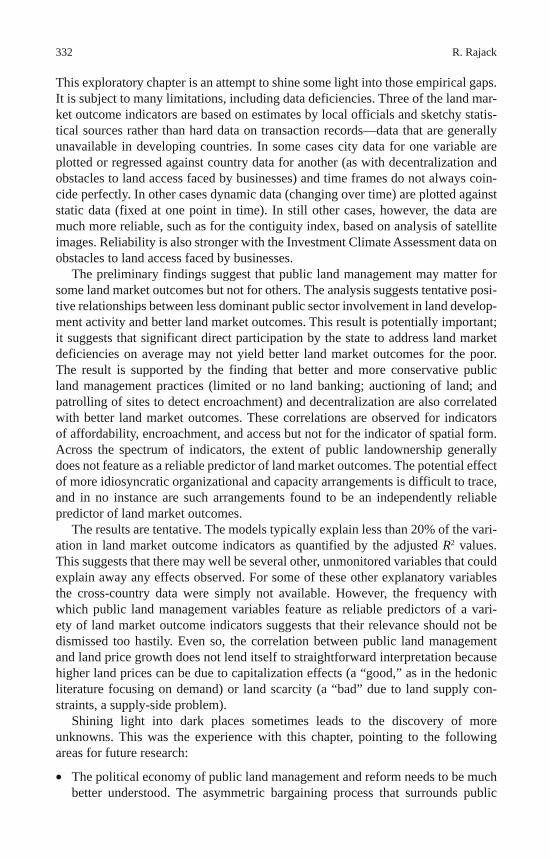
332 R. Rajack
This exploratory chapter is an attempt to shine some light into those empirical gaps. It is subject to many limitations, including data deficiencies. Three of the land mar-ket outcome indicators are based on estimates by local officials and sketchy statis-tical sources rather than hard data on transaction records—data that are generally unavailable in developing countries. In some cases city data for one variable are plotted or regressed against country data for another (as with decentralization and obstacles to land access faced by businesses) and time frames do not always coin-cide perfectly. In other cases dynamic data (changing over time) are plotted against static data (fixed at one point in time). In still other cases, however, the data are much more reliable, such as for the contiguity index, based on analysis of satellite images. Reliability is also stronger with the Investment Climate Assessment data on obstacles to land access faced by businesses.
The preliminary findings suggest that public land management may matter for some land market outcomes but not for others. The analysis suggests tentative posi-tive relationships between less dominant public sector involvement in land develop-ment activity and better land market outcomes. This result is potentially important; it suggests that significant direct participation by the state to address land market deficiencies on average may not yield better land market outcomes for the poor. The result is supported by the finding that better and more conservative public land management practices (limited or no land banking; auctioning of land; and patrolling of sites to detect encroachment) and decentralization are also correlated with better land market outcomes. These correlations are observed for indicators of affordability, encroachment, and access but not for the indicator of spatial form. Across the spectrum of indicators, the extent of public landownership generally does not feature as a reliable predictor of land market outcomes. The potential effect of more idiosyncratic organizational and capacity arrangements is difficult to trace, and in no instance are such arrangements found to be an independently reliable predictor of land market outcomes.
The results are tentative. The models typically explain less than 20% of the vari-ation in land market outcome indicators as quantified by the adjusted R 2 values. This suggests that there may well be several other, unmonitored variables that could explain away any effects observed. For some of these other explanatory variables the cross-country data were simply not available. However, the frequency with which public land management variables feature as reliable predictors of a vari-ety of land market outcome indicators suggests that their relevance should not be dismissed too hastily. Even so, the correlation between public land management and land price growth does not lend itself to straightforward interpretation because higher land prices can be due to capitalization effects (a “good,” as in the hedonic literature focusing on demand) or land scarcity (a “bad” due to land supply con-straints, a supply-side problem).
Shining light into dark places sometimes leads to the discovery of more unknowns. This was the experience with this chapter, pointing to the following areas for future research:
The political economy of public land management and reform needs to be much better understood. The asymmetric bargaining process that surrounds public
•
33312 Does Public Ownership and Management of Land Matter for Land Market Outcomes?
land decisions as well as claims of entitlement and historical deprivation are key aspects of public land management that affect the choices the state makes with respect to an asset usually defined as “held in trust for the people.” Such analy-ses would be particularly relevant in countries in which public landownership is substantial. Rent seeking, corruption, and budgeting strategies that increase the transparency of land-related transactions are an important aspect of this line of research, but the breadth of analysis needed is greater than these issues normally suggest. The social and environmental benefits that may be derived from vacant public land are generally not factored into analyses favoring intensive, revenue-maxi-mizing uses of urban public land. Research that strikes a balance in the way these decisions are evaluated would be welcome. Such research would need to be linked to a long-run analysis of various land uses that, given the typical durability of property rights, may sometimes justify holding prime land off the market in the short to medium term. Associated with this type of research would be an assessment of whether decisions by private actors that are typically profit maximizing would be more or less conducive to the types of long-term land market objectives the society may wish to achieve. Another useful line of research would be to assess whether particular institu-tional configurations of public land management are better suited than others to specific instruments of public land intervention. This is a more sophisticated analysis that could not feasibly be undertaken at this stage because of the general absence of more basic empirical work in the field. An understanding of the scope for pursuing specific land management practices and other institutional arrangements under widely varying land tenure systems would be useful for building operationally on research of the type undertaken in this chapter. Detailed country-specific studies using econometric tools to study comparative development outputs and impacts under evolving institutional structures would allow much greater depth of diagnosis and prescription. Wherever feasible, the type of analysis undertaken in this chapter should be repeated using data on actual land market transactions rather than expert opin-ions. Such analysis would be bolstered by simultaneous consideration of data on other likely influences on land market outcomes. The type of research reported in this chapter should also be repeated using addi-tional land market outcome indicators. Such indicators could include the share of the land price in the total price of homes and ratios of rent to income.
Acknowledgements This chapter benefited from research assistance by Hyoung Gun Wang, an extended-term consultant; Ye-rin Um, a summer 2006 intern; and Susana Williams, a short-term consultant, all at the World Bank. Berenice Sanchez assisted with data entry and graphics. The author wishes to thank Somik Lall, Richard Green, Robert Buckley, and Olga Kaganova for com-ments on an earlier draft as well as all the participants in the December 2006 World Bank–spon-sored Urban Research Symposium Workshop, where an earlier draft was presented. The views expressed are those of the author and not necessarily the World Bank.
•
•
•
•
•
•
334 R. Rajack
References
Amborski, D. (1999, April). The use of regulatory tools to encourage and facilitate the develop-ment of vacant land . Paper presented at the International Seminar on Vacant Land: New Chal-lenges and Opportunities, Rio de Janeiro.
Angel, S. (2000). Housing policy matters: A global analysis. New York: Oxford University Press. Angel, S., Sheppard, S. C., & Civco, D. L. (2005). The dynamics of global urban expansion. Wash-
ington, DC: World Bank, Transport and Urban Development Department. Archer, R. W. (1989). Transferring the urban land pooling/readjustment technique to the develop-
ing countries of Asia. Third World Planning Review , 11 (3), 307–331. Archer, R. W. (1992). Introducing the urban land pooling/readjustment technique into Thailand
to improve urban development and land supply. Public Administration and Development , 12 , 155–174.
Bertaud, A., Buckley, R., & Phatak, V. K. (2005). Reforming Mumbai’s real estate raj: A prelude to a business plan. Unpublished report, World Bank, South Asia Region, Sustainable Develop-ment, Urban, Water & Sanitation, and Hazard Risk Management (SASDU), Washington, DC.
Buckley, R. M., & Kalarickal, J. (Eds.). (2006). Thirty years of World Bank shelter lending: What have we learned? Directions in Development–Infrastructure series . Washington, DC: World Bank.
Cheema, G. S. (2005). Building democratic institutions . Bloomfield, CT: Kumarian. Conway, F. (2006). Federal asset management in Australia. In O. Kaganova & J. McKellar (Eds.),
Managing government property assets (pp. 25–48). Washington, DC: Urban Institute Press. Dahlman, C. (1979). The problem of externality. Journal of Law and Economics , 22 (1), 141–162. de Soto, H. (1990). The other path. New York: Harper & Row. Deininger, K. (2003). Land policies for growth and poverty reduction . World Bank Policy Research
Report. Washington, DC: World Bank. Dillinger, W. (1992). Urban property tax reform guidelines and recommendations: Urban manage-
ment and municipal finance. Washington, DC: World Bank, Urban Management Program. Elcock, H., & Minogue, M. (2001). Local government: Management or politics? In W. McCourt
& M. Minogue (Eds.), The internalization of public management: Reinventing the third world state (pp. 90–106). Cheltenham, England: Edward Elgar.
Farvacque, C., & McAuslan, P. (1992). Reforming urban land policies and institutions in develop-ing countries. Washington, DC: World Bank.
Garba, S. B., & Al-Mubaiyedh, S. (1999). An assessment framework for public urban land man-agement intervention. Land Use Policy , 16 (4), 269–279.
Hong, Y., & Bourassa, S. (2003). Rethinking the future roles of public leasehold. In S. Bourassa & Y. Hong (Eds.), Leasing public land: Policy debates and international experiences (pp. 283–303). Cambridge, MA: Lincoln Institute of Land Policy.
Ingram, G. (1982). Land in perspective: Its role in the structure of cities. In M. Cullen & S. Wool-ery (Eds.), World congress on land policy, 1980 (pp. 103–118). Lexington, MA: D. C. Heath and Company.
Kaganova, O. (2006). A need for guidance in countries with emerging markets. In O. Kaganova & J. McKellar (Eds.), Managing government property assets (pp. 255–295). Washington, DC: Urban Institute Press.
Kaganova, O., & McKellar, J. (2006). Conclusions: Sharing experiences—What we do and do not know. In O. Kaganova & J. McKellar (Eds.), Managing government property assets (pp. 403–421). Washington, DC: Urban Institute Press.
Kaganova, O., Tian, V., & Undeland, C. (2001). Learning how to be efficient property owners and accountable governments: The case of Kyrgyzstan’s cities. Public Administration and Devel-opment , 21 (4), 333–341.
Karki, T. K. (2004). Implementation experiences of land pooling projects in Kathmandu Valley. Habitat International , 28 (1), 67–88.
33512 Does Public Ownership and Management of Land Matter for Land Market Outcomes?
Kisunko, G., & Coolidge, J. (2007). Survey of land and real estate transactions in the Russian Federation. Policy Research Working Paper 4115. Washington, DC: World Bank.
Lincoln Institute of Land Policy. (2002). Access to Land by the Urban Poor: 2002 Annual Round-table . S. Angel, J. Baldó, P. Connolly, M. Cuellar, P. McAuslan, B. Sanyal, & M. Serra (Con-tributors), Cambridge, MA: Author.
Litvack, J., Ahmad, J., & Bird, R. (1998). Rethinking decentralization in developing countries (Sector Studies Series 21491). Washington, DC: World Bank.
Liu, F. (2005, March). “Interrupted development”: Failure in urban land and housing markets. Paper presented to the Federal Reserve Board–George Washington University Seminar on Real Estate and Urban Economics, Washington, DC.
Mathuba, B. M. (2003, May). Botswana land policy. Paper presented at the International Work-shop on Land Policies in Southern Africa, Berlin, Germany.
McEwen, A. (2004). Land reform in developing countries: Legal and institutional aspects. In M. Deakin, R. Dixon-Gough, & R. Mansberger (Eds.), Methodologies, models and instruments for rural and urban land management (pp. 16–23). Aldershot, England: Ashgate.
McKellar, J. (2006). The management framework for real property: Government of Canada. In O. Kaganova & J. McKellar (Eds.), Managing government property assets (pp. 49–75). Washing-ton, DC: Urban Institute Press.
Misra, G. K., & Rarain, M. K. (1989). Development programmes for urban poor. New Delhi: Indian Institute of Public Administration.
Mutale, E. (2004). The management of urban development in Zambia . Hants, England: Ashgate. National Institute of Urban Affairs. (2002). Assessment of the impact of the repeal of the Urban
Land (Ceiling & Regulation) Act, 1976. New Delhi: Author. Natural Resource Services. (2002). Botswana national land policy: Issues report. Unpublished
manuscript. Paul, S. (1998). Making voice work: The report card on Bangalore’s public service. Policy Research
Working Paper 1921. Washington, DC: World Bank. Peterson, G. (2007). Land leasing and land sale as an infrastructure financing option. In G. Peter-
son & P. Clarkedr Annez (Eds.), Financing cities: Fiscal responsibility and infrastructure in Brazil, China, India, Poland and South Africa (pp. 284–306). Washington, DC: World Bank.
Pollakowski, H., & Wachter, S. (1990). The effects of land-use constraints on housing prices. Land Economics , 66 (3), 315–324.
Posner, R. (1980). A theory of primitive society with special reference to law. Journal of Law and Economics , 23 (1), 1–53.
Rajack, R. (2001). Institutional reform in facilitating shelter for the landless: The ongoing experi-ence of Trinidad. Robert S. McNamara Fellowship Report. Unpublished manuscript, World Bank, Washington, DC.
Rajack, R., & Barhate, S. (2004). Urban poverty and habitat precariousness in the Caribbean . Santiago, Chile: United Nations.
Robinson, R. (1979). Housing economics and public policy . London: Macmillan. Rothenberg, J. (1967). Economic evaluation of urban renewal . Washington, DC: Brookings
Institution. Singh, G. (1994). Land laws, land policies and planning in Malaysia. Retrieved July 2, 2006, from
http://www.serd.ait.ac.th/ump/op8.pdf Stafford, D. (1978). The economics of housing policy . London: Croom Helm. Strong, A. (2003). Tenure choices for urban land privatization in Ukraine: The role of leasehold. In
S. Bourassa & Y. Hong (Eds.), Leasing public land: Policy debates and international experi-ences (pp. 179–204). Cambridge, MA: Lincoln Institute of Land Policy.
Thorburn, C. (2004, August). A long row to hoe: Decentralization, reformasi , and land manage-ment policy in Indonesia . Paper presented at the Tenth Conference of the International Associa-tion for the Study of Common Property, Oaxaca, Mexico.
UNCHS (United Nations Centre for Human Settlements). (1983). Land for housing the poor. Stockholm: Swedish Council for Building Research.
336 R. Rajack
Van Meurs, A. (1986). Public land development agencies in developing countries: Elements of financial and managerial appraisal. Water Supply and Urban Development Department Dis-cussion Paper UDD-93. Washington, DC: World Bank.
Whitehead, C. M. E. (1983). The rationale for government intervention. In H. B. Dunkerley & C. M. E. Whitehead (Eds.), Urban land policy: Issues and opportunities (pp. 108–131). New York: Oxford University Press.
337
Compulsory purchase, expropriation, eminent domain, and simply “taking” are different names for the same legal institution: that which allows states to acquire property against the will of its owner to fulfill some purpose of general interest. Traditionally, expropriation has been considered one of the main instruments of land policy. Today, however, it is subject to many criticisms and mounting social resistance. Campaigns for housing rights, movements for the defense of property rights, legislative and judiciary activism, and land tenure reforms, among other fac-tors, are changing the conditions under which governments exercise their power of eminent domain.
In some cases this is good news. The rise of democratic regimes in many coun-tries has reduced the arbitrary taking of land, and new forms of legal protection are helping homeowners and peasants adversely affected by infrastructure projects. At the same time, satisfying diverse public needs has become highly complex, pre-cisely because the power of eminent domain has been weakened.
As part of the institution of property, eminent domain attracts an ideological debate in which many observers will be for or against it as a matter of principle. But it is difficult to deny that there is a justification for this power when a public need is considered more important than the interests of those who own the land. This chapter is the result of a first exploration of recent worldwide trends in the law and policy of the compulsory acquisition of land for urban and infrastructure develop-ment projects. This task faces two main obstacles. First, governments do not pro-duce systematic information about the use of their power of eminent domain, even when they recognize it as an instrument of their land policies. Second, academic research on the subject has focused on legal issues, leaving aside other dimensions of this government practice. The accumulated knowledge on the subject therefore has a strong disciplinary bias.
S.V. Lall et al. (eds.), Urban Land Markets, DOI 10.1007/978-1-4020-8862-9_13 , © World Bank 2009
Chapter 13 Taking Land Around the World: International Trends in Expropriation for Urban and Infrastructure Projects Antonio Azuela and Carlos Herrera-Martín
A. Azuela ( ) Social Research Institute of the National Autonomous University of Mexico Mexico e-mail: [email protected]
338 A. Azuela and C. Herrera-Martín
Given the diversity of situations that arise in different countries, it is necessary to define some general questions to guide our research. For that purpose we follow three main avenues. First, we place the discussion of expropriation within the wider theme of the institution of property. Second, we take up the question that several authors have posed on whether there is a global convergence in property regimes around the world (Jacobs, 2006; Woodman, Wanitzek, & Sippel, 2004). Third, to allow an orderly and fruitful comparative analysis of trends in eminent domain, we look at the different contexts in which this issue is being discussed around the world. Our main conclusion is that while there may be many signs that expropria-tion has fallen into deep disregard in many countries, there are not enough to pro-claim its demise as an instrument of land policy.
The main policy recommendation that emerges from this first exploration is that while expropriation must be reconsidered as an instrument of land policy, reconsid-ering should not mean dispensing with . Instead, governments need to find a new place and function for the power of eminent domain as a policy instrument.
13.1 Major Trends in Policy and Law
In this section we describe the dominant trends in the use of the power of eminent domain by governments as well as the way legal systems deal with it. The point of departure for our analysis is the fact that there is widespread discontent with expro-priations in many countries.
13.1.1 The Discontent with Expropriation
Only in the past two decades has dissatisfaction with the use of eminent domain become generalized. Three decades ago the dominant approaches in urban law and planning saw the expropriation of land as a crucial component of any development strategy. It was part of an equation in which private interests were on one side while the public interest, on the other, was a coherent combination of infrastructure works and land use regulation. Expropriation was the ultimate tool for advancing public over private interests, and planning was the art of getting the right balance. For one author, there could be no urban policies “worth the name” if public authorities did not have the power to acquire and control land (Fromont, 1978, p. 7; see also Graëffly, 2006).
The first signs that expropriation was imposing high social costs (and not just the sacrifice of selfish individual interests) became evident with dams in devel-oping economies. Their construction meant the displacement of large numbers of people. 1 According to Michael Cernea (2000), in the last decade of the 20th century
1 According to Cernea (1997a), 505,000 people have been displaced just for dam projects in Africa.
33913 Taking Land Around the World
the number of people displaced by infrastructure projects reached 90–100 million. In some cases projects displaced almost 1% of the population of an entire country (Cernea, 1997a, p. 7).
People in Africa have been particularly affected by the construction of dams. There was an important surge in dam projects in the 1970s, largely because of the decolonization processes throughout the continent. Colonial powers had deployed their own territorial policies, displacing people for a number of reasons (access to natural resources, creation of urban centers in strategic locations). But develop-ment projects became a new and more pervasive cause of displacement in post-colonial times. 2 And their social impact became even more acute as land became scarce. 3
Even when infrastructure projects tried to reduce the social impact of population displacement, as in the case of dams funded by the World Bank or the US Agency for International Development (USAID) in the 1980s, that goal was far from being achieved.
The construction of dams became emblematic of “displacement by develop-ment.” But other forms of land dispossession also affected millions in postcolonial societies. “Villagization” in Tanzania (Benjaminsen & Lund, 2003, p. 61) and land grabbing in Zimbabwe (Maposa, 1995) are only two examples of politically induced (and sometimes violent) changes in the relationship between people and land that have had enormous consequences for societies. Regardless of the intentions or the political context explaining such processes, there is no doubt that they constitute extreme forms of uncompensated taking of land from a great number of people who depended on it for their subsistence.
Expropriations related to infrastructure that imply the relocation of people have an impact that goes beyond an economic loss. 4 Legal systems usually do not recog-nize the difference between taking land from people who live on (and from) it and expropriating land from individuals or organizations for which it is only an “asset.” Obviously, expropriation should not be confused with resettlement. Resettlement can take place without expropriation, and the converse is true as well. But it is important to have these two situations in mind so as to recognize two different extremes in social costs. There is a high social cost where land is expropriated with little or no compensation and people are forced to leave the place they inhabit. At the other extreme, high costs to society as a whole may result when governments are forced by judicial decisions to pay exorbitant sums to landowners, as has happened recently in Brazil and Mexico.
2 Mortimore (1997, p. 26) explains that independent governments in Africa played a more impor-tant part in land acquisition than their colonial predecessors. 3 The implications of land scarcity have also been important in defining new political processes (Lentz, 2006, p. 2). 4 According to the risk model proposed by Cernea (2000, p. 22), there are eight risks associated with forceful displacement: landlessness, joblessness, homelessness, marginalization, food inse-curity, increased morbidity and mortality, loss of access to common property and services, and social disarticulation.
340 A. Azuela and C. Herrera-Martín
Expropriation of land as part of infrastructure projects has not been limited to development policies in postcolonial settings. The emerging economies—particu-larly those with high and sustained growth rates, such as China—have resorted to huge projects to meet their transport and energy needs. The Three Gorges Dam is certainly the most well-known initiative of this kind, and it is not difficult to see why it dominates the list of projects with dubious social and environmental records (Padovani, 2003).
In many of these cases the issue becomes exacerbated by two elements: the lack or insufficient recognition of land rights for the dispossessed population and the weakness of the rule of law. Clearly, being deprived of land rights or lacking access to a legal remedy to defend them is the ultimate state of vulnerability in ten-ure. However, these elements should not be seen as external to (or separate from) expropriation as a legal institution. The single action by which a government takes someone’s property is only a moment in the history of a property right. It is after an expropriation has had its full effects that we can establish the content and the extension of a property right. This is important if we are to understand the relation-ship between expropriation and a wider issue: land tenure. If in many countries the removal of people from their land takes place without compensation, that is precisely a sign of the weakness of their property rights.
This is far from being a mere legal technicality; it is crucial in understanding the impact of taking land for public uses. In countries that have undertaken major land tenure reforms in which some groups have been awarded titles while other users of the land (such as herders) have been left without rights, the potential inequality in the new tenure arrangement will materialize as soon as land is taken for an urban or infrastructure project (e.g., see Ho, 2005, p. 106). That inequality is the result not of the expropriation itself but of an ill-conceived tenure system. Thus both tenure systems and the operation of the legal system must be taken seriously if we are to understand the meaning and impact of expropriations in different contexts. For the moment it suffices to say that the literature on this subject shows that in recent dec-ades part of the vulnerability of people affected by expropriations is closely related to those two crucial elements.
Thus far we have referred mainly to institutional questions. But there are also demographic and cultural aspects. In recent decades conflicts over the expropria-tion of rural land have appeared to be less frequent than conflicts in the context of urbanization. 5
Cultural changes have played a part, especially for big infrastructure projects. Dams, ports, and highways have lost the appeal they once had as symbols of progress. As environmental and broader social arguments gain importance in public opinion, opposition to expropriations comes not only from owners but also from
5 In Africa in 1985 the main cause of displacement was the construction of dams, which accounted for 67% of the World Bank–financed projects in Africa that involved forced dis-placement; urban development projects accounted for 33%. In 1995 the numbers had changed dramatically. Dams accounted for only 27% of the projects, and urban development projects for 57%. In China urban resettlement now accounts for the majority of forced displacements (Meikle & Youxuan, 2000, p. 129).
34113 Taking Land Around the World
wider segments of society. Among the many examples is the ill-fated project to construct a new airport for Mexico City. After intense opposition from one of the villages whose land was being expropriated and the mobilization of dozens of social organizations from many parts of the country, the federal government decided to abandon the project in 2002. This was seen by some commentators as the first great failure of Vicente Fox’s administration, which had begun as the main outcome of Mexico’s transition to democracy. 6 But the truth is that wide sectors of public opin-ion expressed their sympathy for “peasants against airplanes.”
Thus in recent times the use of the power of eminent domain in developing countries has been associated with the displacement of millions of people from the lands considered to be “theirs,” with a lack of recognition of property rights, limited access to judicial remedies, and a growing opposition to the infrastructure and urban projects for which that power is wielded.
Dissatisfaction with expropriation has not been exclusive to the developing world, however. In the United States there have been serious attempts through both political and judiciary activism to impose limits on powers of eminent domain. The property rights movement enjoys growing support in several states and has launched initiatives in that direction. In addition, the Supreme Court has resusci-tated two issues that had long been dormant in takings jurisprudence: the question of “regulatory takings,” which involves the need to compensate owners for certain land use restrictions (as in Lucas v. South Carolina Coastal Council , decided in 1992, commonly known as the Lucas case), and, more recently, the question of whether it is permissible to take land from one person to give it to another, even if the second person would promote development projects from which the commu-nity would benefit (as in Kelo v. City of New London , decided in 2005, commonly known as the Kelo case).
At the same time European countries such as France and Italy, where land use policies and urban law had never been seen as being in conflict with the rule of law, have had to adapt their legislation to restrict the discretionary power exerted in expropriations as a result of rulings by the European Court of Human Rights (Coban, 2004). In the following section we review some of those legal develop-ments. Here it suffices to say that they also reflect a growing discontent with expro-priation practices.
Such discontent is also apparent in academic research. Three decades ago it would have been improbable to see sociologists taking seriously the impact of expropria-tions on the lives of property owners, but the works of Imrie and Thomas (1997) and Cavaillé (1999) witness a change in this. Cavaillé shows what people have to go through when their land is expropriated for a highway. Her work is part of a new way of looking at the institution of property in which the possession of land and houses is “for the individual the confirmation that he is part of a community” (p. 203). It is probably an exaggeration to say that all this means a “crisis” for expro-
6 At an October 2006 conference at the National Autonomous University of Mexico (organized by the Philosophical Research Institute), the leader of a social organization from the southern state of Oaxaca, Carlos Manzo, declared that one of the great successes in his political career was having played a part in halting that project.
342 A. Azuela and C. Herrera-Martín
priation as an institution. But there are plenty of signs, in many different contexts, that it is being seriously reconsidered. In any case it is important to clarify what is actually happening. To explore this question in different parts of the world, we now look at changes in policy and law as well as the driving forces behind them.
13.1.2 Policy Changes: Obscure Facts, Clear Directions?
Policy analysis requires quantitative information about the way a government task is carried out. To the extent that expropriation is considered as an instrument of land policy, its use cannot be evaluated without quantitative data. We need to know how extensively it is used, for what purposes, and how all this changes over time. Also important to know is how much compensation is paid to owners, whether payment takes place before or after the occupation of land, and so on.
Our first finding is the lack of official information. This situation can be over-come in many ways, but for the moment it makes the task of identifying clear trends in expropriation as a government practice very difficult. Indeed, we found no country that reports the use of expropriation in a systematic way. The main source is the judiciary. While information from the judiciary has a high qualitative value, because it helps us understand how legal cases relating to expropriations are dealt with, it says nothing about the number of conflicts that do not become legal cases. Even when there are professional groups interested in the subject, aggregate information is not available. 7 On the executive branch side information about procurement practices may be abundant, but it is generally poor when it comes to crucial policy issues. 8 Moreover, powers of eminent domain for urban purposes are often exerted by local governments, which makes it improbable that national statistics include this kind of information, even in highly centralized countries such as France. 9
Researchers who have tried to find general trends have had to build their own data from ad hoc sources. In a predecessor to this chapter, a project sponsored by the Lincoln Institute of Land Policy to explore the use of expropriation for urban devel-opment in Mexico (Herrera-Martín, 2006; Saavedra, 2006), it took several months to build a database with all the expropriation decrees issued by the federal govern-ment between 1968 and 2004. Moreover, the database does not include information on the amount of compensation paid. Figures 13.1 and 13.2 show the evolution of the use of expropriation in that context.
7 See, for example, the Web site of the Expropriation Law Centre, where information about Cana-dian expropriation law, practice, and professionals is available ( http://www.expropriationlaw.ca ). 8 A recent survey found that information on procurement in Mexico is so poor that it is impossible to build indicators on good procurement practices (Azuela, 2006a). 9 When our research assistant approached the French Ministére de l’Equippement, she was told that information on expropriations was not available to the public. Conseil d’État (1991) reported that after decentralization it was difficult to track judicial decisions on the subject, let alone main-tain a systematic registry of expropriations.
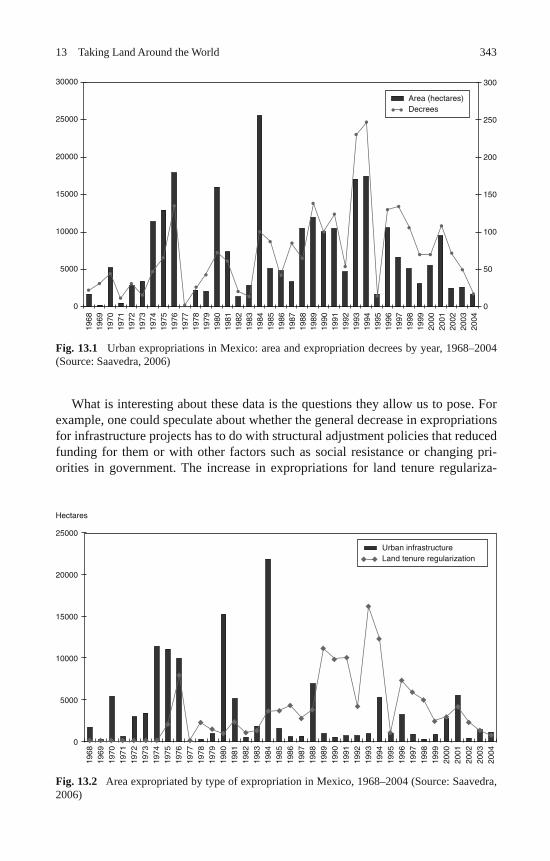
34313 Taking Land Around the World
What is interesting about these data is the questions they allow us to pose. For example, one could speculate about whether the general decrease in expropriations for infrastructure projects has to do with structural adjustment policies that reduced funding for them or with other factors such as social resistance or changing pri-orities in government. The increase in expropriations for land tenure regulariza-
Fig. 13.1 Urban expropriations in Mexico: area and expropriation decrees by year, 1968–2004 (Source: Saavedra, 2006)
1968
1969
1970
1971
1972
1973
1974
1975
1976
1977
1978
1979
1980
1981
1982
1983
1984
1985
1987
30000
25000
20000
15000
10000
5000
0
300
250
200
150
100
50
0
1986
1988
1989
1990
1991
1992
1993
1994
1995
1996
1997
1998
1999
2000
2001
2002
2003
2004
Area (hectares)Decrees
Fig. 13.2 Area expropriated by type of expropriation in Mexico, 1968–2004 (Source: Saavedra, 2006)
Hectares
1968
1969
1970
1971
1972
1973
1974
1975
1976
1977
1978
1979
1980
1981
1982
1983
1984
1985
1987
1986
1988
1989
1990
1991
1992
1993
1994
1995
1996
1997
1998
1999
2000
2001
2002
2003
2004
25000
20000
15000
10000
5000
0
Urban infrastructureLand tenure regularization
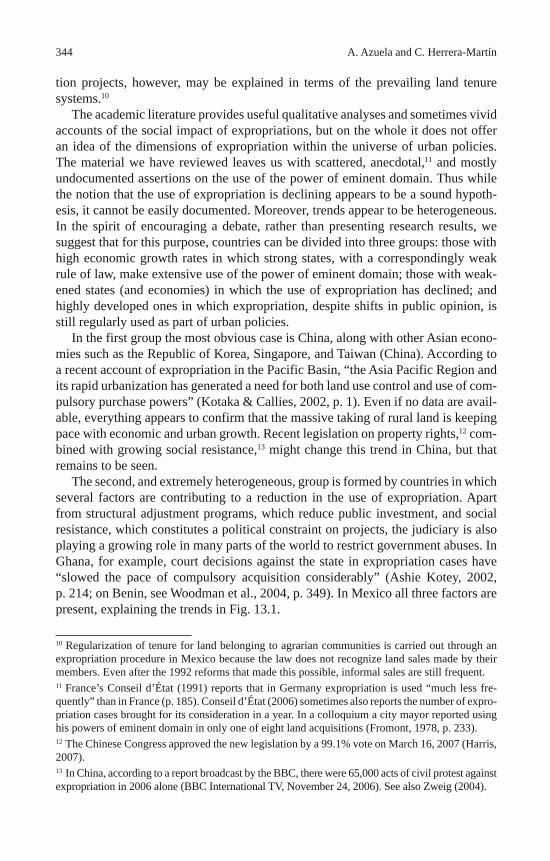
344 A. Azuela and C. Herrera-Martín
tion projects, however, may be explained in terms of the prevailing land tenure systems. 10
The academic literature provides useful qualitative analyses and sometimes vivid accounts of the social impact of expropriations, but on the whole it does not offer an idea of the dimensions of expropriation within the universe of urban policies. The material we have reviewed leaves us with scattered, anecdotal, 11 and mostly undocumented assertions on the use of the power of eminent domain. Thus while the notion that the use of expropriation is declining appears to be a sound hypoth-esis, it cannot be easily documented. Moreover, trends appear to be heterogeneous. In the spirit of encouraging a debate, rather than presenting research results, we suggest that for this purpose, countries can be divided into three groups: those with high economic growth rates in which strong states, with a correspondingly weak rule of law, make extensive use of the power of eminent domain; those with weak-ened states (and economies) in which the use of expropriation has declined; and highly developed ones in which expropriation, despite shifts in public opinion, is still regularly used as part of urban policies.
In the first group the most obvious case is China, along with other Asian econo-mies such as the Republic of Korea, Singapore, and Taiwan (China). According to a recent account of expropriation in the Pacific Basin, “the Asia Pacific Region and its rapid urbanization has generated a need for both land use control and use of com-pulsory purchase powers” (Kotaka & Callies, 2002, p. 1). Even if no data are avail-able, everything appears to confirm that the massive taking of rural land is keeping pace with economic and urban growth. Recent legislation on property rights, 12 com-bined with growing social resistance, 13 might change this trend in China, but that remains to be seen.
The second, and extremely heterogeneous, group is formed by countries in which several factors are contributing to a reduction in the use of expropriation. Apart from structural adjustment programs, which reduce public investment, and social resistance, which constitutes a political constraint on projects, the judiciary is also playing a growing role in many parts of the world to restrict government abuses. In Ghana, for example, court decisions against the state in expropriation cases have “slowed the pace of compulsory acquisition considerably” (Ashie Kotey, 2002, p. 214; on Benin, see Woodman et al., 2004, p. 349). In Mexico all three factors are present, explaining the trends in Fig. 13.1.
10 Regularization of tenure for land belonging to agrarian communities is carried out through an expropriation procedure in Mexico because the law does not recognize land sales made by their members. Even after the 1992 reforms that made this possible, informal sales are still frequent. 11 France’s Conseil d’État (1991) reports that in Germany expropriation is used “much less fre-quently” than in France (p. 185). Conseil d’État (2006) sometimes also reports the number of expro-priation cases brought for its consideration in a year. In a colloquium a city mayor reported using his powers of eminent domain in only one of eight land acquisitions (Fromont, 1978, p. 233). 12 The Chinese Congress approved the new legislation by a 99.1% vote on March 16, 2007 (Harris, 2007). 13 In China, according to a report broadcast by the BBC, there were 65,000 acts of civil protest against expropriation in 2006 alone (BBC International TV, November 24, 2006). See also Zweig (2004).
34513 Taking Land Around the World
Brazil may not be part of this group, because its economy is not exactly declin-ing, but it deserves special mention here. Many expropriations for urban develop-ment projects in Brazil have been successfully challenged in court, and judges have awarded huge compensation payments with high interest rates. As a result, local governments have accumulated judicial debts ( precatórios ) that are push-ing them into a critical situation. As a recent survey shows, “non-compliance with official demands can result in the sequestration of federal, state or municipal assets as well as intervention in the respective management regimes” (Maricato, 2000, p. 7). From the financial point of view, “an explosive combination of interest-on-interest, monetary correction and legal fees effectively makes the debts virtually unredeemable” (p. 8). The problem is enormous: in the state of São Paulo alone, “104 intervention orders have been issued against 60 municipalities”; in a single expropriation the precatório “is equal to 5 years or more of the entire municipal budget” (pp. 6–7).
The third group includes highly developed countries in which there are intense debates around eminent domain in the realms of law and politics, but debates that do not necessarily lead to radical changes in the way this instrument is used. In the United States the Lucas case, in 1992, reopened the issue of regulatory takings and led to a fear that the planning system could be seriously weakened. More recently, the Kelo decision prompted initiatives to restrict the use of eminent domain for projects that would involve the transfer of land to private developers.
As already stated, there is no doubt that the property rights movement has been a growing force in the past two decades, and it seems highly probable that the law of eminent domain will change. Seen from the perspective of policy analysis, how-ever, the picture is somewhat different. Cypher and Forgey (2003), in a survey cov-ering the 239 largest cities in the United States, find that expropriation appears to be alive and well, because it passed the tests of equity, effectiveness, and efficiency. A notable finding, relating to one of the main issues raised by the property rights movement, is that “in 49% of the cases, the property was conveyed to real estate developers” (p. 261). The level of success in the use of eminent domain can be seen in the fact that “only in 3% of the cases did litigation create an extensive delay in the development of various projects” (p. 264).
By pointing to these research findings we are not trying to deny the impact that legal changes may have on the practice of expropriation or to suggest that changes in public opinion are irrelevant. Our intention is to illustrate the importance of pol-icy research if we want to see what happens in practice. Here it prevents a premature conclusion about the “demise” of expropriation as an instrument of land policy. The survey by Cypher and Forgey proves that debates in the realms of law and public opinion cannot give us a comprehensive image of what happens in practice.
In sum, there are sufficient indications that there is no universal, let alone uni-form, decline in the use of expropriation. And even if there is a general trend in that direction, exploring the varying conditions under which it takes place is relevant for future research.
Much like the actual use of expropriation, the tendencies in policy orientation also appear to be a grey area. As stated, even though eminent domain is recognized
346 A. Azuela and C. Herrera-Martín
as a policy instrument, governments do not set explicit goals for its use nor evaluate that use. 14 Even if one can find a rationale behind decisions on the use of the power of eminent domain or other instruments to acquire or develop land, those deci-sions appear to be more a pragmatic response by governments to specific conditions than a conscious or explicit effort in that direction. Obviously, changes in eminent domain law can be said to express the adoption of land policies. However, those changes are more significant as limits to the use of the power of eminent domain than as clear indications of the place that its use will have in the context of land policy as a whole.
In contrast with governments, multilateral organizations have been adopting clearer positions on expropriation. The World Bank and USAID in particular have contributed to the diagnosis of the social impact that expropriations have had on populations displaced by infrastructure and urban development projects, especially for projects they have financed. After recognizing such social costs, some multilat-eral organizations have adopted clear and assertive policy orientations on expropria-tion (Huggins & Clover, 2005; Deininger, 2003). 15 Indeed, there have been attempts to reduce the social impacts of development projects, although there are no signs of significant improvement (for a recent analysis, see Cernea & McDowell, 2000).
An interesting aspect of policies adopted at the international level is the dif-ference in the discourses that prevail in different settings. In the United Nations system and NGOs the concept of housing rights organizes the discourse around evictions associated with expropriations. In contrast, economic development agen-cies use the language of property rights to pose the problem in terms of public policy. This difference is more than lexicological. It reflects different ways of defin-ing the underlying issues: the concept of property rights (especially as used in the context of the World Bank) is part of an economic theory of development, 16 while the concept of housing rights refers to a moral imperative associated with doctrines of social, economic, and cultural rights. 17 Although security of tenure is seen as a common goal of all land policies, there are different philosophical foundations for the institutions that are to be created to attain that goal. 18 We will return to the fact that different institutional settings privilege different sets of issues in the debate on expropriations.
14 Pierre Moor (1978) made the same point about information 30 years ago, when he tried to evalu-ate the use of expropriation in a number of countries. 15 The World Bank has issued policy statements on “involuntary resettlement” (whether involving expropriation or not) since 1980, issuing the most recent one in 2001. 16 Institutional economics and evolutionism are the leading theories in this respect, with North (1990); Boserup (1965) being the most influential authors. 17 In what is considered to be the policy paper of the World Bank on land issues (Deininger, 2003), as well as in the Bank-backed analysis of the social consequences of relocation (Cernea, 2000), it is difficult to find the phrase human rights , but it is impossible to find a mention of housing rights or economic, social, and cultural rights. 18 The discourse in the UN system has also emphasized communal systems of tenure (Platteau, 1992, p. 3). Recently the World Bank has been more ready to accept that such systems can play a positive role (Trubek & Santos, 2006).
34713 Taking Land Around the World
13.1.3 Legal Changes: One Direction, Many Contexts
In Sect. 13.2 we deal with the way different legal systems cope with the more salient issues in the field of eminent domain. Here we only point to the general direction in which legal systems are moving with respect to expropriation. While tendencies in the way powers of eminent domain are being used in practice may not be clear, looking at legal developments provides a much more precise picture of general trends—although this again does not mean that judges around the world are going to follow the same pattern when adjudicating concrete cases.
Almost without exception, legislative changes in the past two decades have tended to reduce the government’s power of eminent domain. In particular, criteria for compensation have tended to stabilize at market values (see Kotaka & Callies, 2002; Kushner, 2003), and authorities are being subjected to more stringent proce-dures. Interestingly, this trend does not include the definition of public use or public purpose . As we will see, debates in the United States over this issue appear to be exceptional.
The general trend toward a reduction in the power of eminent domain is so wide-spread that it is worth mentioning the only example we have found in which legal developments seem to take a different path: the South African Constitution of 1996. According to Southwood (2000), the Constitution recognizes a wide concept of “public interest,” gives considerable discretionary power to the government to pay “just and equitable compensation” (with market value being just one of the ele-ments to be taken into account), and shifts from a previous regime of immediate payment of compensation to a system in which “the Court is given a discretion to decide on the timing and manner of the payment” (p. 4). Despite the legal battles that, not surprisingly, are taking place around the interpretation of the constitutional text, it is an interesting case for its rarity. The explanation probably lies in the fact that South Africa is only beginning a cycle that other countries completed years ago: the redistribution of land as part of an agrarian reform. 19
Eminent domain law is changing in two ways: directly , through legislation, judi-cial rulings, or international treaties, and indirectly , through the wider path of land tenure reform. Direct changes are responses to the way in which governments are using their power of eminent domain. Through legislative or judicial actions rules are being enacted to redefine that power. Sometimes courts simply follow changes in the law, but in some cases courts have made decisions that run counter to leg-islative or administrative rules, for example, when they consider those rules to be unconstitutional.
Another route for direct change in the rules on expropriation is through inter-national law. Free trade agreements usually imply a commitment by the signatory countries to respect property rights of investors from each of the others. Guarantees against unfair expropriation are an essential element here. The first conflict under
19 In countries such as Mexico that cycle is in a more critical phase; the question now is how to justify the expropriation of lands for public purposes to peasant communities that decades ago were the beneficiaries of expropriations that were the core of agrarian reform.
348 A. Azuela and C. Herrera-Martín
the North American Free Trade Agreement was between a US corporation (Metal-clad) and Mexico, an environmental conflict that turned into an international legal case on eminent domain. 20 The main problem with such guarantees is that while for-eign investors have the same substantive protection of property rights as nationals, they are given additional procedures to defend those rights. As the Metalclad case has made clear, arbitration panels available only to foreign investors tend to show a bias toward economic interests, a bias that national courts would not necessarily share when considering conflicts over government expropriations at the expense of nationals. This difference becomes even greater under conditions of unequal access to justice. So, in countries with free trade agreements foreign corporations can end up with greater protection against expropriation than nationals (especially the poor) of those countries.
Other changes in eminent domain law come from human rights law. Several European countries have been forced to change expropriation procedures as a result of resolutions of the European Court of Human Rights (for the case of France, see Hostiou, 2002, 2005; Shwing, 2004; Conseil d’État, 2006; for Italy, see Ramacci, 2001). Such restrictions are far from being a “refoundation” of expropriation as a legal institution. Instead, they reflect the existence of a supranational power that is able to reduce the abuse in the use of the power of eminent domain.
An indirect way of transforming the legal status of eminent domain is tenure reform, a process taking place in many parts of the world (see Kuba & Lentz, 2006; Deininger, 2003; Benjaminsen & Lund, 2003; Durand-Lasserve & Royston, 2002; Toulmin, Lavigne-Delville, & Traoré, 2002; Mortimore, 1997; Maposa, 1995; Platteau, 1992). To the extent that it creates new property rights over land, tenure reform redefines the conditions in which state authorities may take that land. This increases people’s security and at the same time means higher costs for govern-ment projects. While under weak land rights the relocation of people for urban or infrastructure projects may be seen as a violation of (frequently ill-defined) human rights, the same relocation, after tenure reform, has to contend with much more clearly defined property rights. This is not meant to suggest that any land reform will produce equal benefits for all parties. 21 The point is only that tenure reforms are an indirect way in which the legal status of expropriation is transformed.
Such reforms are taking place in a wide range of contexts, and establishing a clear classification is not easy. Formerly communist countries have “refounded” the institution of property. Many developing countries not only are changing eco-nomic regimes where state landownership used to prevail but also are dealing with land questions closely related to cultural identities. Developed countries (Aus-tralia, Canada, New Zealand, and the United States) are confronting the issue of aboriginal rights.
20 Mexico ended up paying compensation of almost US $17 million. See Azuela (2006b). 21 Traditional systems of land use often entail different sets of rights for different people over the same land. When property rights are given to only one group (leaving herders out, for example), tenure reform may imply new forms of social exclusion. See Mortimore (1997, p. 3) and Lund (2000, p. 17).
34913 Taking Land Around the World
Land tenure reform is more than just a technical process; it has a foundational character. 22 This is particularly relevant where land tenure reform is associated with the recognition of aboriginal rights. In many countries this is a relatively recent process, and expropriation therefore rarely emerges as an issue. That is, debates are so focused on how to “give” rights to certain groups that few people think about how to “take” those rights away from them if and when that becomes necessary.
13.1.4 Forces Behind Major Trends
Changes in policies and legal rules on eminent domain for urban and infrastructure projects respond to five driving forces: mounting social resistance, changing land tenure patterns, growing independence of judiciaries, changes in public opinion, and changes in the international context. Those forces may operate independently or in combination—and the combination varies across countries.
13.1.4.1 Social Resistance
Social discontent with the use of the power of eminent domain is probably the main driving force behind the trends we have discussed. Its impact obviously will depend on the level of mobilization and on political conditions, the analysis of which is beyond the scope of this chapter. Even though the issue that prompts social mobi-lization is always the same—the “taking” of someone’s property by a government agency—motivations may vary. In the developing world people displaced by gov-ernment projects may mobilize for better compensation, but sometimes they resist for cultural reasons. No compensation will be enough when it comes to places con-sidered irreplaceable; burial sites are the most obvious example.
Similarly, in developed countries people may oppose the compensation offered, but they may also contest the purpose for which property is being taken—as in the famous Kelo case. The ideological foundations of the property rights movement in the United States are very different from those of the international campaign against forced evictions and for housing rights, even if they may converge on the same point (see Jacobs, 2006; Centre on Housing Rights and Evictions, 2006; Azuela, Duahu, & Ortiz, 1998).
Another element adds strength to social resistance against expropriations, even though it has nothing to do with the interests of property owners. Many people mobilize against a project not because of the expropriation but because of the project itself. It is no news that there is a growing dissatisfaction with the very idea of “development” represented by such structures as dams, highways, airports,
22 A growing body of historical research explores the importance of changes in land relations in the formation of states (see, e.g., Joseph & Nujent, 1994; Scott, 1998; and Mallon, 1995).
350 A. Azuela and C. Herrera-Martín
and shopping malls. Even when development initiatives meet strict environmental requirements, the cultural connotations of some projects will prompt social protest, adding to the complexities of the use of eminent domain power.
13.1.4.2 Changing Patterns of Landholding
Property rights are important not only as cultural representations. Their relevance depends on more basic (that is, structural) facts, such as land scarcity. This may sound strange for societies in which the land question has been settled for centuries, as in Western Europe, but it is important in societies in which social practices like pastoralism are still part of the agenda. In some African countries land became a more pressing issue only in postcolonial times, as a result of wider demographic changes and new land use patterns (Lentz, 2006; Platteau, 1992). We do not intend to examine this question in any depth; this is only to point out that studying the social impact of expropriations requires considering a wider view of the relationship between society and territory. It should be no surprise that government interventions in landownership face more serious resistance in a context of growing land scarcity.
Interestingly, some researchers on land law issues are beginning to be attracted by more complex accounts of the society-territory relationship, through the study of time-space compression as a central feature of contemporary societies (Woodman et al., 2004). But we can put it in simple terms: patterns of landholding should be recognized as a driving force (or at least as a backdrop) behind all developments in the realm of land policies and laws—eminent domain included.
13.1.4.3 Independent Judiciaries
Legislation protecting property holders from arbitrary expropriation is useless with-out an independent judiciary that acts as a check on government actions. In the past two decades many countries have undergone political and institutional changes that include a growing autonomy of the judiciary. Although this increasing judiciary autonomy can be overrated by discourses on “transition to democracy” that tend to depict all previous regimes as outright authoritarian, 23 there is no doubt that judici-ary activism is a growing phenomenon, opening new spaces for the defense of those affected by expropriation. This development often means a long learning curve for civil servants who had grown accustomed to arbitrary practices. 24
23 Mexico is a case in point. While most participants in the public debate tend to believe that the Supreme Court is only now beginning to show autonomy from the executive, specialized research has long demonstrated that things are not so simple. See the classic study of González Casanova (1964). 24 In Mexico expropriations took place, and had full legal effect, without due process. It was only in 2006, after the Supreme Court ruled that authorities must respect the right of due process in expropriations, that this has started to change.
35113 Taking Land Around the World
A strong judiciary does not necessarily mean greater restrictions on the power of eminent domain, as the Kelo case in the United States clearly illustrates. In that case the Supreme Court deferred to the legislative branch by ruling that expropria-tions of land that is then transferred to private persons for development purposes are not unconstitutional as long as they are permitted by state law. The property rights movement has been fighting the doctrine in Kelo precisely because it allows restric-tions on property rights rather than on the government’s power of eminent domain.
13.1.4.4 Greater Role of Public Opinion
The role of public opinion has not been explicitly recognized in the literature on eminent domain. In at least Mexico and the United States, however, it is obvious that trends in the use of eminent domain are heavily influenced by public opinion. From a technocratic point of view long public debates obviously imply unnecessary delays and the risk of distorting the “real” meaning of projects. And it is true that in many cases these debates can involve the same manipulation and oversimplifica-tion as political campaigns do. They may even take place at the same time and with the same rules: during the November 2006 midterm elections in the United States, citizens of 11 states voted on “anti-Kelo property-rights initiatives” (National Con-ference of State Legislatures, 2006).
Far from attempting a normative evaluation of this subject here, we merely want to point out that the strengthening of public opinion in many countries has been an additional force behind the decrease in the use of eminent domain powers in those countries. At any event it is a force that follows its own logic. The public sphere can surely be seen as the space of enlightened communication, although a more skeptical view will see in it social and political actors fighting from different posi-tions over eminent domain and using prevailing cultural codes to advance their own views and interests. In particular, different opinions on the idea of economic devel-opment as embodied in urban and infrastructure projects will converge in the public space. Because there is no prescribed recipe for the outcome of these processes, this issue should be part of the research agenda if one is to understand the entire spec-trum of social conditions that shape expropriation practices.
13.1.4.5 Changing International Context
The international context plays a major part in the adaptation of policies and laws on expropriation. Free trade agreements create special rules for investors, interna-tional campaigns may force governments to adopt certain policies, and of course the Internet increases the diffusion of legal and political ideas about eminent domain. Now does this mean that all countries are heading in the same direction, as the “convergence hypothesis” claims (Jacobs, 2006; Woodman et al., 2004)? We think that globalization is not a homogeneous set of forces that imposes itself on all coun-tries in the same way. Instead, nation-states are subject to different international
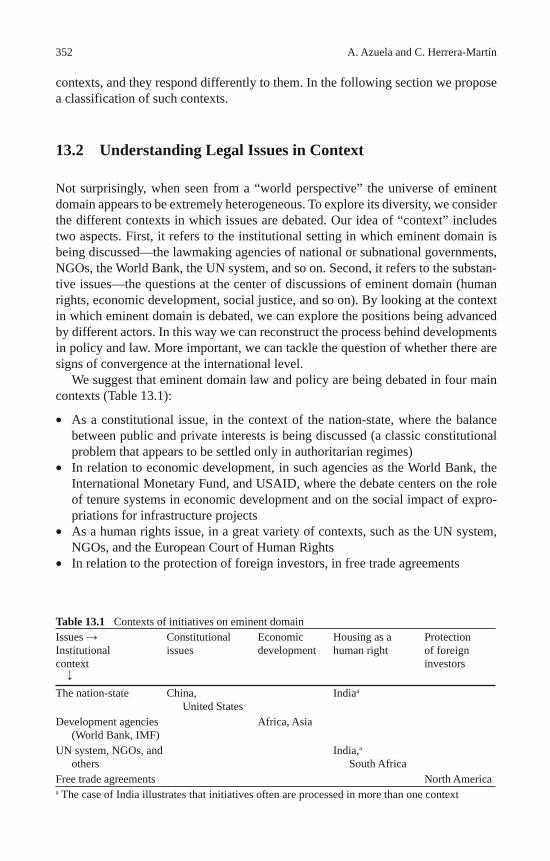
352 A. Azuela and C. Herrera-Martín
contexts, and they respond differently to them. In the following section we propose a classification of such contexts.
13.2 Understanding Legal Issues in Context
Not surprisingly, when seen from a “world perspective” the universe of eminent domain appears to be extremely heterogeneous. To explore its diversity, we consider the different contexts in which issues are debated. Our idea of “context” includes two aspects. First, it refers to the institutional setting in which eminent domain is being discussed—the lawmaking agencies of national or subnational governments, NGOs, the World Bank, the UN system, and so on. Second, it refers to the substan-tive issues—the questions at the center of discussions of eminent domain (human rights, economic development, social justice, and so on). By looking at the context in which eminent domain is debated, we can explore the positions being advanced by different actors. In this way we can reconstruct the process behind developments in policy and law. More important, we can tackle the question of whether there are signs of convergence at the international level.
We suggest that eminent domain law and policy are being debated in four main contexts (Table 13.1):
• As a constitutional issue, in the context of the nation-state, where the balance between public and private interests is being discussed (a classic constitutional problem that appears to be settled only in authoritarian regimes)
• In relation to economic development, in such agencies as the World Bank, the International Monetary Fund, and USAID, where the debate centers on the role of tenure systems in economic development and on the social impact of expro-priations for infrastructure projects
• As a human rights issue, in a great variety of contexts, such as the UN system, NGOs, and the European Court of Human Rights
• In relation to the protection of foreign investors, in free trade agreements
Table 13.1 Contexts of initiatives on eminent domain Issues Institutional context
Constitutional issues
Economic development
Housing as a human right
Protection of foreign investors
The nation-state China, United States
India a
Development agencies (World Bank, IMF)
Africa, Asia
UN system, NGOs, and others
India, a South Africa
Free trade agreements North America a The case of India illustrates that initiatives often are processed in more than one context
35313 Taking Land Around the World
These are no more than ideal types. All changes in eminent domain law are proc-essed through national or subnational (legislative, administrative, or judicial) mech-anisms. At the same time many of them are part of an international debate (perhaps in more than one institutional context). There are only a small handful of countries in which there is little or no influence from an international context (such as Brazil, China, and the United States). For most of the rest, the international contexts in which they are inserted are strong and, at the same time, extremely varied. The intention of our typology is to capture that diversity.
Pointing to these contexts is not intended to affirm a causal nexus. Changes in policy, like most social phenomena, are multicausal. 25 Instead, the typology is only a road map for exploring the way ideas and initiatives are processed in different contexts and, in particular, whether there is convergence or not at the global level. In what follows we examine the main issues that constitute the law of eminent domain.
13.2.1 The Concept of Public Interest
One of the key issues in discussing expropriation is its justification. The most pervasive idea is that the individual interest of property owners must give way to the more general interests of society. Virtually every constitution that recognizes private property at the same time determines that the state can take property from individuals, under two conditions: that just compensation is paid and that the pur-pose is to satisfy some general interest. To avoid bias toward a particular legal tradition, we use the phrase public interest to refer to this kind of justification. In all regimes the public interest clause is an important limit on the exercise of the power of eminent domain.
Today most countries acknowledge that the legislative and executive branches have broad discretionary power to decide when there is a public interest that justi-fies an expropriation. It is hard to find an example of the judiciary declaring a law unconstitutional because it does not respect the public interest clause (Allen, 2000, p. 211). The same can be said of judicial decisions about the way the executive branch exercises its power of eminent domain. There is a strong presumption, espe-cially in democratic countries, that the executive branch will act reasonably when deciding what constitutes the public interest.
In the United States, in an exception to this general trend, an intense debate about what the Constitution means by public use emerged after the Supreme Court decided the now famous Kelo case in May 2005. The case centered on an expro-priation by the city of New London, Connecticut, as part of an ambitious economic revitalization project that included the participation of private investors. The ques-tion was whether it was legitimate to take land from private individuals in order to
25 The analysis of these issues can benefit from the vast literature on “diffusion” that has been produced in the context of political science.
354 A. Azuela and C. Herrera-Martín
transfer it to private entities—assuming that new investments would bring an eco-nomic revival of the area. Relying on long-standing precedents, the Supreme Court upheld the decision by the city on the basis of the principle of legislative deference. It was not the first time that the court had decided that economic development was a valid use of the power of eminent domain.
In the rest of the world the concept of public interest can be defined in a number of ways. For example, most constitutions in the Commonwealth tradition require that property subject to compulsory purchase go to “a public purpose or a public use” (Allen, 2000, p. 201). Some constitutions establish an elaborate catalogue of provisions for what constitutes a public interest. Others leave this task to the legisla-tive branch.
In contrast, in Japan there is very limited scope for what constitutes a public interest. The Law of Expropriation contains a precise list of the kinds of projects that justify the use of expropriation. The interpretation of this statute is limitative, although this does not seem to be a problem for the academic literature (Kotaka & Callies, 2002, p. 147). Malaysia is one of the few countries in which the literature documents a strong debate and even social unrest because of an extremely wide definition of public interest. The cause of this dissatisfaction apparently is the abuse of discretionary power. In New Zealand the judiciary has undertaken a complete review of the need to acquire the property subject to expropriation (Godlovitch, 2002). In Africa we have found no discussions around this issue. As in many coun-tries, who receives compensation for expropriation is a much greater source of concern.
The purpose of a definition of public interest is to reduce the margin for arbitrary use of expropriation, but most jurists around the world do not see the variations in this definition as a fundamental problem. What the literature seems to suggest is that the substantive justification of expropriation, through the concept of public use, public purpose, or an equivalent, is not an issue that may be driving eminent domain to a crisis (the United States, with its anti-Kelo movement, being an exception). The context in which this issue is being discussed, according to our hypothesis, is the institutions of nation-states, with very little external influence. If there is any “con-vergence” in the definition of public interest, it has nothing to do with developments in specific international contexts.
13.2.2 Compensation
The second key issue in expropriation law relates to the compensation to be awarded to the affected owners. This issue, which can be considered the most press-ing one in takings law around the world, involves two fundamental questions: how to determine the amount of compensation to be paid and who is entitled to receive compensation.
The problem of determining the compensation can be analyzed at two levels. At one level is the debate about the general criteria for fixing it—commercial value, fair price value, fiscal value, and so on. At the second level is a more technical dis-
35513 Taking Land Around the World
cussion on methods of valuation. While valuation has no effect on the principles of eminent domain, the lack of technical competence of civil servants in charge should not be underestimated, as it may exacerbate conflicts around expropriations. 26
In the debate on the general criteria for fixing compensation, there is a clear convergence in most economies toward market value. 27 While this approach does not pose a major problem where property rights are clear, it presents enormous challenges where it is unclear who owns what or when the social cost of relocation outweighs the market value of the land. Most studies on population resettlement do not recognize the relevance of this issue (see Cernea, 1993, 1997a, 1997b, 2000, 2003). There are even suggestions that the concept of compensation is not useful for solving the problems that huge projects generate. 28
The social cost of the displacement of people due to the use of eminent domain has no doubt been enormous in many countries, but part of the problem is that compensation has been too low. This is not to deny other (more qualitative 29 or pro-cedural) questions, such as the need to establish mechanisms of social consultation and to respect rules of due process. But there are projects that will have to go on, even without the consent of those who own the land. And to offset the burden that expropriation imposes on them, it is difficult to think of a different solution than economic compensation—even if it is accompanied by the most “inclusive” social policies.
A second issue that affects compensation is the recognition of tenure rights for groups that had not previously been considered to be property holders. Herders, ten-ants, agricultural laborers, and other social groups become (rightly, we must insist) entitled to compensation for the loss of their possessions.
For these two reasons compensation tends to be (or will have to be) much higher than in the past. When this makes projects financially unviable, that in itself is a good reason to abandon them. But apart from financial considerations, there are also legal limits to increasing compensation. Procurement laws usually forbid the acquisition of assets by government agencies at prices above market value. Clearly there is a public interest in keeping such acquisitions at reasonable levels. This does not mean that it is impossible to reach a fair intermediate solution, but it does mean that there is a limit beyond which the use of expropriation becomes questionable.
26 In Mexico some of the most serious political conflicts in recent years originated in incred-ibly inappropriate assessments of compensation in difficult expropriation cases (Herrera-Martín, 2006). 27 Economies lagging behind in this regard include Singapore, Taiwan (China), and Thailand (Kotaka & Callies, 2002). As Allen writes (2000, p. 230), “most of the older statutory schemes required subjective valuation of loss, but modern statutes generally require only objective valua-tion. In general, constitutional cases do not distinguish between methods of valuation, although it appears that most courts regard objective valuation, based on market values, as the constitutional minimum.” 28 Nayak (2000, p. 103) argues that “the displaced surely deserve more than just compensation, as it is a concept and a procedure that is inflexible, imprecise and unjust.” 29 In Japan the loss of cultural values as a result of expropriation has led to legal debates. See Kotaka and Callies (2002, pp. 156–157).
356 A. Azuela and C. Herrera-Martín
Not surprisingly, compensation issues are treated differently in different international contexts. Through free trade agreements, states guarantee fair compensation to foreign investors, although valuation methods are seldom agreed on. At the other extreme, international campaigns for housing rights tend to ignore the issue of compensation. Beyond the impact that such international developments may have on the practice of expropriation, there are many cases in which the national dynamic is much more important than any international context. Exorbitant compensation payments awarded by judges in Brazil and Mexico can hardly be related to international processes, as they result from specific political and legal developments at national and sometimes local levels. It is here that the convergence hypothesis seems less plausible.
13.2.3 Housing Rights and Population Resettlement
The idea of housing rights has the potential to fundamentally change legal doctrines on expropriation because it introduces a distinction between two types of expro-priations: those that affect people in their ability to meet a basic need (housing) and those that affect individuals or legal entities for which property is only an asset. Despite that potential, the idea of housing rights has not yet had an impact on the law of expropriation.
With a few exceptions (India and South Africa being the most relevant ones), the idea of housing rights has had greater influence through international cam-paigns in cases of egregious evictions. One aspect of the dominant discourse in this international context—a space created by UN organizations and NGOs—and the discourse prevailing in economic development agencies is worth highlighting. As noted, while housing as a human right is the dominant idea in the first context, a utilitarian theory of economic development based on property rights dominates in the second. While both discourses have huge potential consequences for a redefini-tion of the law of eminent domain, they have so far avoided an explicit recognition of such consequences.
On the one hand, the housing rights discourse entails a systematic condemnation of evictions, but it rarely recognizes situations in which evictions have some form of legal validity. This is a serious limitation on housing rights as a doctrine, because those rights will be hard to accommodate within the set of values that a legal system is meant to protect—including other human rights (such as environmental rights) that may conflict with housing rights in certain situations. On the other hand, while discourses on resettlement risk have been extremely useful in documenting the social costs of urban and infrastructure projects, they have not recognized the con-sequences of that critique for eminent domain law and property law in general—as seen in the discussion of compensation.
These two discourses correspond to two different and in many ways opposed legal cultures—perhaps two different worldviews. By ignoring each other, these two approaches, rather than moving toward convergence, represent the most notori-ous divergence in the field of eminent domain today.
35713 Taking Land Around the World
13.2.4 Expropriation of Different Components of the Bundle of Rights
Here we try to point to a potential convergence between two apparently unrelated issues: first, regulatory takings, and second, the relevance of the doctrine of a bun-dle of rights to the recognition of compensation rights for groups of land users who have not been defined as property owners, such as herders and agricultural laborers.
The issue of regulatory takings is probably the most popular topic in discussions around the law of eminent domain. In almost every developed country there is an ongoing discussion about land use regulations that impose restrictions so severe that they should be considered expropriation and therefore require compensation. Given the notion that property is a bundle of rights, the question is how many (or which) of the sticks in that bundle the state can take in the name of a public interest without generating a right to compensation for the loss.
Importantly, nobody talks about “regulatory givings,” the increase in property values generated by generous land regulations—a point that should not be discarded as eccentric. 30 In some European legal systems, most notably the Spanish system, the dominant legal doctrine holds that the extent of property rights is defined by urban plans. In particular, development rights are not inherent to the ownership of land; they are the result of a public decision expressed in a development plan. 31
In the United States the problem of regulatory takings has been discussed since the 1887 case Mugler v. Kansas (Hylton, 2000). After all these years we still cannot find a generally accepted theory, in the United States or elsewhere, on what con -stitutes a regulatory taking. And if we analyze the decisions of the US Supreme Court, we will find enormous variations over time.
In Europe variations are also great. Even in legal systems that recognize the doctrine that social obligations are inherent to private property, such as those of Germany and Switzerland, legislation recognizes the idea of regulatory takings through the concept of “material expropriation” (Kushner, 2003). Thus some plan-ning restrictions create an obligation for the government to compensate for loss. At the other extreme, French jurisprudence has for many decades admitted that land use restrictions create no right to compensation. Remarkably, this issue has not ended up on the agenda of the European Court of Human Rights, which has been the main source of restrictions on powers of eminent domain in Europe.
There is an obvious contrast between Europe and the United States with respect to regulatory takings: in Europe legal changes are strongly restricted by supranational developments; in the United States the future of regulatory takings will depend on subnational developments, because legal change takes place in state legislatures. But on neither side of the Atlantic has the planning system been paralyzed by those restrictions, as many authors had feared would happen.
30 We owe this point to Greg Ingram. 31 For an in-depth analysis of the concept of land property in the Spanish legal system, see García de Enterría and Parejo-Alfonso (1994).
358 A. Azuela and C. Herrera-Martín
In some parts of the developing world an interesting link can be established between the doctrine behind regulatory takings and expropriations. In many Afri-can countries, for example, the use of the power of eminent domain is depriving people not recognized as owners of the land of their means of subsistence. Tenants, herders, and agricultural laborers are among those paying the highest social cost of expropriation because they are not recognized as holding any property rights. An extension of the doctrine of the bundle of rights might open the way to recognition of a variety of interests in the same piece of land, just as in most developed countries tenants are entitled to compensation in case of an expropriation. This is a potential convergence of legal ideas toward the same goal: to give protection to those most vulnerable to the use of the power of eminent domain.
13.3 Policy Implications
There are clear indications of growing difficulties in using the power of eminent domain as it has traditionally been used. Legal restrictions, social resistance, and rising costs are the main obstacles. The most important policy implication of this trend is the need to reconsider the use of eminent domain as an instrument of land policy. However, reconsidering expropriation does not mean discarding it alto-gether . Instead, governments need to redefine the conditions under which they can expect expropriations to be successful—that is, efficient, equitable, and socially accepted. In many cases expropriations will be more expensive, they will require longer consultation processes, and their success will depend on issues that have nothing to do with property rights—such as environmental concerns raised by cer-tain projects. There may be fewer expropriations as a result, but it is difficult to imagine governments being completely deprived of the power of eminent domain, particularly as urban and infrastructure needs become more acute.
We have shown a wide variety of issues that should be taken into account as emi-nent domain laws and policies are reconsidered. Beyond these issues, it is important to bear in mind the two extremes in the kinds of social costs that expropriations can produce: the high costs for those affected by expropriations that involve the reset-tlement of a population and the high costs for society as a whole when distortions in the operation of judicial institutions (whether due to corruption, incompetence, or an ill-conceived legal framework) impose prohibitive costs on the use of eminent domain powers and thus on the satisfaction of public needs.
Debates on eminent domain have thus far taken place in contexts that do not recognize the entire array of issues at stake: housing rights campaigns, with all their moral force, have failed to acknowledge the economic implications of policy options; development theories that inspire land tenure reforms in many countries ignore the human rights dimension; free trade agreements focus on the interests of investors. If land policies are to be based on solid foundations, all these dimensions must be considered. Expropriations not only should be seen as opportunistic actions to which governments can resort; they also must be part and parcel of both property
35913 Taking Land Around the World
regimes and land policies. This is particularly important in countries undergoing a transition from state ownership of land to private property. As Vincent Renard wrote almost 15 years ago for an Eastern European audience:
It may seem a paradox, for countries where state landownership is generalized, to mention the power of eminent domain. However, the lack of legislation in this respect can create great difficulties as privatization becomes generalized. It will not take long before new property owners … see the benefits of holding land, while the community does not have the right to promote the necessary changes for its proper use. (Renard, 1993, p. 19)
While there is a need to reconstruct expropriation as a policy instrument and as a legal institution on the basis of profound analysis, work on a simpler aspect is urgent: developing information systems that make it possible to observe how pow-ers of eminent domain are actually being used and what social impact they produce. As has happened in other areas of public policy, access to public information in general has improved in many countries. But transparency is useless if there is no information to look at. As we have seen, information on the use of expropriation is extremely poor.
13.4 Proposals for Future Research
We propose three avenues for future research on land expropriation for urban and infrastructure projects. First, there is a great need for more empirical analysis, as the field is dominated by legal studies. This is not to underestimate the importance of the law. But if we are to understand what the law means for society in this realm, it is important to develop more studies about the way in which eminent domain is used by governments, about the way it is combined with other instruments, and, above all, about its social consequences. This work must include a wide array of research methods, from database construction to case studies and ethnography.
Second, expropriation should be studied as an aspect of the institution of prop-erty. Otherwise its moral, economic, and philosophical implications cannot be dis-cussed. As Michael Mortimore (1997) has written, changes in property regimes around the world during the past decades have been so profound that we can take this time as a “breathing space” to reflect on their many implications (p. 261).
Third, there are many specific questions that one could envision about the expropriation of land for urban and infrastructure projects. But their relevance will always depend on local or national priorities. If there is one common question for all research in this field, it is the question of convergence. We suggest that convergence cannot be studied as some sort of “global” (homogeneous) phenomenon. Policies and laws are processed in different contexts, and issues are discussed in different institutional settings. Following developments in all these contexts is important if we are to understand where our laws and policies come from. This is not a purely academic question. The use of eminent domain may decline when more efficient mechanisms for satisfying public needs are put into practice or when vulnerable groups enjoy broader legal protection. But the same trend surely has a different
360 A. Azuela and C. Herrera-Martín
meaning when it is the result of an expansion of the power of private owners who are able to impose their interests on society as a whole—particularly when judges and other public officials are unable to explain what is happening.
Acknowledgments The authors wish to express their thanks to Greg Ingram, Martim Smolka, Alain Durand-Lasserve, and Mila Freire for their comments on a first draft of this chapter. Thanks are also due to Céline Jacquin (Université Marne–La Vallée), who provided research assistance in assembling materials from documentation centers and official sources in France, as well as to Alison Strong for making the text much more readable. The usual disclaimers apply.
References
Allen, T. (2000). The right to property in Commonwealth constitutions . Cambridge: Cambridge University Press.
Ashie Kotey, N. (2002). Compulsory acquisition of land in Ghana: Does the 1992 Constitution open new vistas? In C. Toulmin, P. Lavigne-Delville, & S. Traoré (Eds.), The dynamics of resource tenure in West Africa (pp. 203–215). London: GRET; International Institute for Envi-ronment and Development.
Azuela, A. (2006a). Las compras del gobierno: Datos blandos, percepciones duras . Mexico City: National Autonomous University of Mexico, Social Research Institute.
Azuela, A. (2006b). Visionarios y pragmáticos: Una aproximación sociológica al derecho ambi-ental . Mexico City: Ediciones Fontamara; National Autonomous University of Mexico, Social Research Institute.
Azuela, A., Duahu, E., & Ortiz, E. (Eds.). (1998). Evictions and the right to housing: Experience from Canada, Chile, the Dominican Republic, South Africa and South Korea . Ottawa: Interna-tional Development Research Centre.
Benjaminsen, T. A., & Lund, C. (Eds.). (2003). Securing land rights in Africa . London; Portland, OR: Frank Cass.
Boserup, E. (1965). The conditions of agricultural growth: The economics of agrarian change under population pressure . London: G. Allen and Unwin.
Cavaillé, F. (1999). L’expérience de l’expropriation: Appropriation et expropriation de l’espace . Paris: L’Association des Etudes Foncières (ADEF).
Centre on Housing Rights and Evictions. (2006). Forced evictions: Violations of human rights 2003–2006 . Global Survey 10. Accessed December 14, 2008 from http://www.cohre.org/store/attachments/Global_Survey_10.pdf .
Cernea, M. (1993). The urban environment and population relocation . World Bank Discussion Paper 152. Washington, DC: World Bank.
Cernea, M. (1997a). African involuntary population resettlement in global context . Environment Department Papers, Social Assessment Series 045. Washington, DC: World Bank.
Cernea, M. (1997b). The risks and reconstruction model for resettling displaced populations. World Development , 25 (10), 1569–1587.
Cernea, M. (2000). Risks, safeguards, and reconstruction: A model for population displacement and resettlement. In M. Cernea & C. McDowell (Eds.), Risks and reconstruction: Experiences of resettlers and refugees (pp. 11–55). Washington, DC: World Bank.
Cernea, M. (2003). For a new economics of resettlement: A sociological critique of the compensa-tion principle. International Social Science Journal , 55 (175), 37–45.
A longer bibliography is included in a version of this chapter available on the Web site of the Lincoln Institute of Land Policy at http://www.lincolninst.edu/pubs/dl/1266_Azuela%20Final.pdf
36113 Taking Land Around the World
Cernea, M., & McDowell, C. (Eds.). (2000). Risks and reconstruction: Experiences of resettlers and refugees . Washington, DC: World Bank.
Coban, A. R. (2004). Protection of property rights within the European Convention of Human Rights . Burlington, VT: Ashgate.
Conseil d’État. (1991). L’urbanisme, pour un droit plus efficace . Paris: La Documentation Francaise.
Conseil d’État. (2006). Rapport public du Conseil d’État, 2006 . Paris: La Documentation Francaise.
Cypher, M. L., & Forgey, F. A. (2003). Eminent domain: An evaluation based on criteria relating to equity, effectiveness, and efficiency. Urban Affairs Review , 39 (2), 254–268.
Deininger, K. (2003). Land policies for growth and poverty reduction . World Bank Policy Research Report. Washington, DC: World Bank.
Durand-Lasserve, A., & Royston, L. (Eds.). (2002). Holding their ground: Secure land tenure for the urban poor in developing countries . London: Earthscan.
Fromont, M. (Ed.). (1978). Les instruments juridiques de la politique foncière des villes: Etudes comparatives portant sur quatorze pays occidentaux . Brussels: Etabilissements Emile Bruylant.
García de Enterría, E., & Parejo-Alfonso, L. (1994). La ordenación urbanística y el derecho de propiedad. Revista Alegatos , 28 , 451–490.
Godlovitch, G. (2002). Compulsory land acquisition and compensation in New Zealand. In T. Kotaka & D. Callies (Eds.), Taking land: Compulsory purchase and regulation in Asian-Pacific countries (pp. 227–262). Honolulu: University of Hawaii Press.
González Casanova, P. (1964). La democracia en México . Mexico City: Era. Graëffly, R. (2006). Le droit de l’expropriation dans l’Union Européene: Panorama d’une préroga-
tive foncière locale. Études Fonciéres , 121 , 24–29. Harris, D. (2007). China’s new property law, part I: Introduction. China law blog . Accessed December
14, 2008, from http://www.chinalawblog.com/2007/05/chinas_new_property_law_part_i.html Herrera-Martín, C. (2006). La jurisprudencia mexicana y la expropiación . Working paper. Mexico
City: Lincoln Institute of Land Policy. Ho, P. (2005). Institutions in transition: Land ownership, property rights, and social conflict in
China . Oxford: Oxford University Press. Hostiou, R. (2002). L’expropriation, un droit en crise. Etudes Foncières , 100 , 40–42. Hostiou, R. (2005). L’expropriation aux normes européennes. Etudes Foncières , 115 , 7–12. Huggins, C., & Clover, J. (Eds.). (2005). From the ground up: Land rights, conflict and peace in
Sub-Saharan Africa . Pretoria: Institute for Security Studies. Hylton, J. G. (2000). Prelude to Euclid: The United States Supreme Court and the constitutionality
of land use regulation. Washington University Journal of Law and Policy , 3 (1), 1–37. Imrie, R., & Thomas, H. (1997). Law, legal struggles and urban regeneration: Rethinking the rela-
tionships. Urban Studies , 34 (9), 1401–1418. Jacobs, H. (2006). The “taking” of Europe: Globalizing the American ideal of private property?
Working paper. Cambridge, MA: Lincoln Institute of Land Policy. Joseph, G., & Nujent, D. (1994). Everyday forms of state formation . Durham, NC; London: Dur-
ham University Press. Kotaka, T., & Callies, D. (Eds.). (2002). Taking land: Compulsory purchase and regulation in
Asian-Pacific countries . Honolulu: University of Hawaii Press. Kuba, R., & Lentz, C. (Eds.). (2006). Land and the politics of belonging in West Africa . Leiden;
Boston: Brill. Kushner, J. A. (2003). Comparative urban planning law: An introduction to urban law in the
United States through the lens of comparing the experience of other nations . Durham, NC: Carolina Academic Press.
Lund, C. (2000). African land tenure: Questioning basic assumptions . Drylands Issue Paper 100. London: International Institute for Environment and Development.
Mallon, F. (1995). Peasant and nation: The making of postcolonial Mexico and Peru . Berkeley: University of California Press.
362 A. Azuela and C. Herrera-Martín
Maposa, I. (1995). Land reform in Zimbabwe: An inquiry into the Land Acquisition Act (1992) combined with a case study analysis of the resettlement programme . Harare: Catholic Commis-sion for Justice and Peace in Zimbabwe.
Maricato, E. (Coordinator). (2000). Urban land and social policies: Acquisition and expropria-tion . Working paper. São Paulo: Lincoln Institute of Land Policy.
Meikle, S., & Youxuan, Z. (2000). Employment for displacees in the socialist market economy of China. In M. Cernea & C. McDowell (Eds.), Risks and reconstruction: Experiences of reset-tlers and refugees (pp. 127–143). Washington, DC: World Bank.
Moor, P. (1978). L’expropriation: Conditions d’utilisation et procedure. In M. Fromont (Ed.), Les instruments juridiques de la politique foncière des villes: Etudes comparatives portant sur quatorze pays occidentaux (pp. 50–63). Brussels: Etabilissements Emile Bruylant.
Mortimore, M. (1997). History and evolution of land tenure and administration in West Africa . Drylands Issue Paper 71. London: International Institute for Environment and Development.
National Conference of State Legislatures. (2006, November 12). Property rights issues on the 2006 ballot. Accessed December 14, 2008 from http://www.ncsl.org/statevote/prop_rights_06.htm
Nayak, R. (2000). Risks associated with landlessness: An exploration toward socially friendly displacement and resettlement. In M. Cernea & C. McDowell (Eds.), Risks and reconstruction: Experiences of resettlers and refugees (pp. 79–107). Washington, DC: World Bank.
North, D. C. (1990). Institutions, institutional change, and economic performance . Cambridge: Cambridge University Press.
Padovani, F. (2003). Involuntary resettlement in the Three Gorges Dam area in the perspective of forced migration due to hydraulic planning in China. In F. Crépeau, D. Nakache, M. Collyer, N. Goetz, A. Hansen, & R. Modi, et al. (Eds.), Forced migrations and global processes: A view from forced migration studies (pp. 91–124). Oxford: Lexington Books.
Platteau, J.-P. (1992). Land reform and structural adjustment in Sub-Saharan Africa: Controver-sies and guidelines . FAO Economic and Social Development Paper 107. Rome: Food and Agriculture Organization.
Ramacci, F. (2001). La nueva espropriazione per pubblica utilità . Naples: Sistemi Editoriali. Renard, V. (1993). Statut des sols et montage d’opérations. Élements d’une sinthèse. In V. Renard
& R. Acosta (Eds.), Land tenure and property development in Eastern Europe . Paris: PIR-VILLE-CNRS; L’Association des Etudes Foncières (ADEF).
Saavedra, C. (2006). Las expropriaciones federales de suelo urbano en México: 1968–2004 . Working paper. Mexico City: Lincoln Institute of Land Policy.
Scott, J. (1998). Seeing like a state: How certain schemes to improve the human condition have failed . New Haven, CT: Yale University Press.
Shwing, C. (2004). Le juge, le maire et la Convention européenne: L’article L.480.5 du CU. Etudes Foncières , 108 , 31–35.
Southwood, M. D. (2000). The compulsory acquisition of rights by expropriation, way of necessity, prescription, labour tenancy and restitution . Durban: Juta.
Toulmin, C., Lavigne-Delville, P., & Traoré, S. (Eds.). (2002). The dynamics of resource tenure in West Africa . London: GRET; International Institute for Environment and Development.
Trubek, D., & Santos, A. (2006). The new law and economic development: A critical appraisal . Cambridge; New York: Cambridge University Press.
Woodman, G. R., Wanitzek, U., & Sippel, H. (Eds.). (2004). Local land law and globalization: A comparative study of peri-urban areas in Benin, Ghana and Tanzania . Münster, Germany: Lit Verlag.
Zweig, D. (2004). To the courts or to the barricades: Can new political institutions manage rural conflict? In E. J. Perry & M. Selden (Eds.), Chinese society: Change, conflict and resistance (2nd ed., pp. 113–135). London: RoutledgeCurzon.
363
Singapore has often been described as a highly planned city-state. It is a city in which land development is planned and strictly controlled. With few exceptions, all development involving construction or change of use requires permission. Despite criticisms of its centralized planning and tabula rasa development outcomes (Kool-haas & Mau, 1995), Singapore presents a prototype of urban governance in which land use planning is taken seriously and plans are implemented with relatively high compliance with development control and planning regulations. In recent years Sin-gapore has gained increasing international recognition as a model of good practice for public land management (Yeung, 1987; Wakeley & You, 2001).
Singapore, with a land area of 690 km 2 , is located just 1° north of the equator in the subregion of Southeast Asia. It has a present population of 5 million and a pro-jected population under its long-term development plan of 6.5 million. Singapore is at the same time both a city and a country, with the city center occupying an area of about 110 km 2 in the southern part of the main island. Urbanization of the city-state has progressed to such an extent, however, that the entire island is classified as urban (Motha & Yuen, 1999). The planning system must take these factors into account, because within the limited land area it must address the needs of the grow-ing population, the city, and the nation.
While Singapore can trace its origins to earlier centuries, the form of its modern development and planning stems largely from its founding in 1819 as a trading post of the British East India Company. 1 Comprehensive planning and development control in Singapore started under the British colonial administration in 1959 with the enactment of the Planning Ordinance, which introduced the British notions of
1 Singapore was granted self-rule status by Britain in 1959. It then joined the Federation of Malay-sia in 1963 and became independent in 1965.
S.V. Lall et al. (eds.), Urban Land Markets, DOI 10.1007/978-1-4020-8862-9_14 , © World Bank 2009
Chapter 14 Guiding Spatial Changes: Singapore Urban Planning Belinda Yuen
B. Yuen ( ) School of Design & Environment National University of Singapore Singapore 117566 , Singapore e-mail: [email protected]
364 B. Yuen
development plan and development control. Control over land allocation and build-ing was considered important for three main reasons. The first relates to matters of law and order, given the multiple ethnicities, languages, and religions of Singa-pore’s immigrant population. Separate housing areas were identified for the differ-ent ethnic communities of settlers: the Europeans, Bugis, Arabs, Chinese, Indians, and Malays. In allocating land, first preference would be given to merchants, sec-ond to artisans, and third to farmers. The second reason relates to the island’s geo-graphic constraints; the limited land area led to a need for the government to control the use of the space and to arbitrate between competing uses. The third reason was the rising value of land and the desire of its new owners to do with it as they liked. This situation led to competing interests between property owners and businesses and a resulting need to protect the collective community interest. It is precisely because of such interests that modern town planning has evolved as a particular set of administrative arrangements and procedures for the control of land development and use (Ashworth, 1954).
Nowhere is this perhaps more evident than in the British planning system with its key elements of development plan and development control. The Town and Country Planning Act 1947, which introduced these aspects, established for the first time in the United Kingdom a comprehensive and compulsory planning sys-tem that covered the entire country. 2 The act sought to relate land use and develop-ment matters to national and regional policy and to define a major role in urban development for the public sector, with regulatory powers and control over land use. Many of those planning ideas were transported to British colonies, where they continue in urban planning practice, making the British planning system a common tool for managing the urban environment in many postcolonial cities. As Healey (1988, p. 397) states, “The British planning system was once considered the most advanced in the world, in terms of both its legislation and its practice.” Increasingly too, however, different studies within Britain have generated debates about the effectiveness of the planning system, particularly of development con-trol, for contemporary challenges (McLoughlin, 1973; Healey, Doak, McNamara, & Elson, 1985; Booth, 2002).
In postindependence Singapore the pace and priority of development have changed dramatically. Under a program of deliberate intervention by the state, or what McGee (1976) calls “deliberate urbanization,” an entire new townscape of high-rise, high-density buildings has all but replaced the low-rise, predominantly shophouse colonial city of British rule. The new government (which has been in place since independence) has chosen an overtly interventionist approach toward urban development, adopting a strategy of integrating social, economic, political, and spatial visions through the overarching process of planning, and legitimizing its control through performance in the provision of public goods. A good example is housing. Some 84% of Singapore residents live in public housing, with many continually registering satisfaction with residential conditions (Wong & Yeh, 1985;
2 The Town and Country Planning Act 1947 came into effect on July 1, 1948, and along with the Town and Country Planning (Scotland) Act 1947 was the foundation of modern town and country planning in the United Kingdom .
36514 Guiding Spatial Changes: Singapore Urban Planning
Yuen, 2005). The intervention is justified both ideologically and pragmatically by a central concern over the survival of an independent island nation. Chan (1971) has argued that survival has been the structuring and rationalizing force for policies governing Singapore since self-government began in 1959.
At the time of independence Singapore had to respond to a severe socioeconomic crisis stemming from high unemployment (over 13%), high population growth (about 4% a year), housing shortages and overcrowding (about 250,000 people were living in slums and another 300,000 in squatter areas), labor strikes (the unions had strong communist influence), and civil riots (among different ethnic groups). Such instances appear to substantiate Castells’s (1981) argument that planning is a process of political intervention in the economic sphere so as to help preserve social stability. The overriding goal is domestic and political stability, which is seen as the foundation for strong economic growth and the institution of highly central-ized planning machinery. Admittedly, Singapore’s small size and the presence of a strong government have facilitated centralized planning without it being hampered by provincial authorities or sectoral interests.
The highest level of central decision making in Singapore is the Cabinet, devel-oped from the British parliamentary model (Lim, 2000). Planning and development control is administered through a central planning agency, the Urban Redevelop-ment Authority (URA), 3 a statutory board in the portfolio of the minister for national development. 4 The minister, who is in charge of physical planning in Singapore, is the final authority in planning and development control matters. The day-to-day administration of physical planning and improvement of Singapore rests with the Urban Redevelopment Authority. The authority’s planning functions, as shown in Fig. 14.1, include:
Preparing and revising development plans. Controlling land use and development. Providing good urban form. Implementing conservation. Coordinating public and private sector development proposals.
Driven by a common vision of Singapore’s continued development, coordination among public development agencies is facilitated by different standing and work-ing committees, which meet continually to coordinate the formulation and imple-mentation of their development policies. Interagency committees are formed and
3 This arrangement has existed since 1989. Before 1989 development control and planning were the functions of different government departments. For a more detailed discussion, see Motha and Yuen (1999). 4 The statutory boards under the Ministry of National Development include the Building and Con-struction Authority (building control), Housing and Development Board (public housing), National Parks Board (public parks), and the Urban Redevelopment Authority. Since independence, gov-ernment activities, including local government activities, have been carried out by government departments organized under ministries or by statutory boards characterized by their functions, each with its own terms of reference. Each statutory board is empowered by enabling legislation to implement its programs. The statutory boards are not a part of the civil service, though each is responsible to an appropriate minister, who in turn answers to the Cabinet. See Lim (2000).
•••••
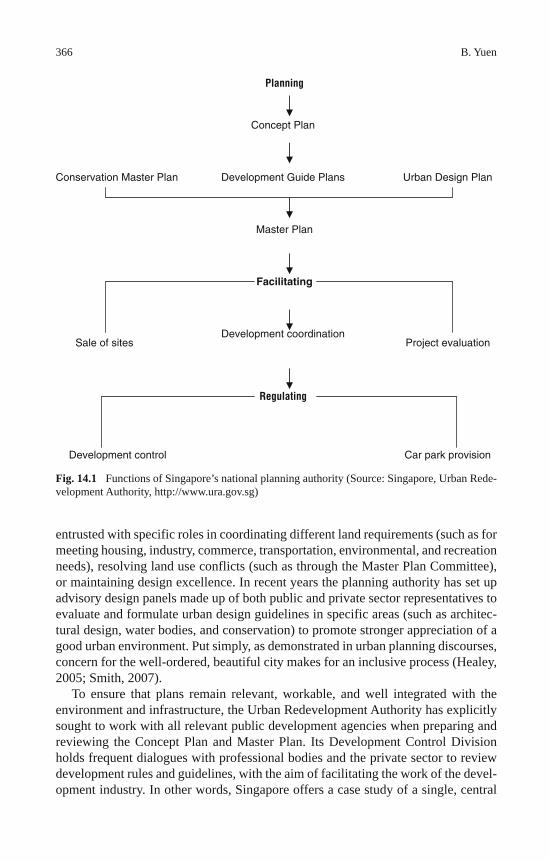
366 B. Yuen
entrusted with specific roles in coordinating different land requirements (such as for meeting housing, industry, commerce, transportation, environmental, and recreation needs), resolving land use conflicts (such as through the Master Plan Committee), or maintaining design excellence. In recent years the planning authority has set up advisory design panels made up of both public and private sector representatives to evaluate and formulate urban design guidelines in specific areas (such as architec-tural design, water bodies, and conservation) to promote stronger appreciation of a good urban environment. Put simply, as demonstrated in urban planning discourses, concern for the well-ordered, beautiful city makes for an inclusive process (Healey, 2005; Smith, 2007).
To ensure that plans remain relevant, workable, and well integrated with the environment and infrastructure, the Urban Redevelopment Authority has explicitly sought to work with all relevant public development agencies when preparing and reviewing the Concept Plan and Master Plan. Its Development Control Division holds frequent dialogues with professional bodies and the private sector to review development rules and guidelines, with the aim of facilitating the work of the devel-opment industry. In other words, Singapore offers a case study of a single, central
Fig. 14.1 Functions of Singapore’s national planning authority (Source: Singapore, Urban Rede-velopment Authority, http://www.ura.gov.sg)
Planning
Concept Plan
Conservation Master Plan Development Guide Plans Urban Design Plan
Master Plan
Facilitating
Sale of sites Development coordination
Project evaluation
Regulating
Development control Car park provision
36714 Guiding Spatial Changes: Singapore Urban Planning
land use planning authority that handles every aspect of planning, from strategic long-term planning to day-to-day development control.
14.1 Legislative and Policy Framework
Following the Town and Country Planning Act 1947 in Britain, the idea of a com-prehensive system of planning and control was introduced in the colony of Sin-gapore. In 1959 town planning was legislated in Singapore with the passage of the Planning Ordinance, leading to the establishment of a central planning body to oversee physical planning in Singapore, the preparation of a long-term development plan (the Master Plan), and the implementation of development control. The signifi-cance of the ordinance lies in the operation of the planning control system, since it is from this written law that planning derives its legitimacy.
For the first time in the colony’s history developers and landowners were required to obtain permission from the planning authority before they could develop any land. Before 1959 there had been practically no legal control over development of land in Singapore. Only bylaw planning and some ad hoc planning controls had existed, and these related largely to construction control and public health. 5 With the preparation and subsequent approval of the first Master Plan by the colonial government, the traditional British planning concept of “survey-analysis-plan” was also under way in Singapore. Thus as with the British system, the Singapore plan-ning system, strengthened by the country’s centralist notion of administration, was to have two separate yet related aspects of planning practice: development plan and development control.
14.1.1 Development Control
Development of land in Singapore is subject to statutory control. The statutory basis of this control, first set out in the 1959 Planning Ordinance, is now contained in the Planning Act Cap 232 (1998 rev. ed.). Despite several amendments to and revi-sions of the Planning Act over the past decades, the basis of development control has remained the same: no person shall without planning permission carry out any development of any land. This requirement has become a public institution of land use control in Singapore: “Development control is … an essential part of build-ing and programming for development” (Singapore, Ministry of National Develop-ment, 1980, p. 40).
Much of Singapore’s present built environment has been constructed under the aegis of the system of development control started in 1959. The key to this control lies primarily in the definition of development that requires planning permission.
5 See Motha and Yuen (1999, Chap. 6) for an account of the system before 1959.
368 B. Yuen
The present legislation repeats the original 1959 definition, which is in pari materia with that contained in the 1947 British act. Section 3(1) of the Planning Act Cap 232 defines development as
… the carrying out of any building, engineering, mining, earthworks [a word not in the 1959 definition] or other operations in, on, over or under land, or to the making of any material change in the use of any building or land
In other words, the notion of development is confined to the use and develop-ment of land; it is a process of change from one state of the built environment or the use of land to another state. Planning permission does not, however, confer building approval. Building approval has to be obtained separately, from the Building and Construction Authority.
As with the British planning system, however, there is one problem with the above definition of development control. It is, as is frequently acknowledged in British planning law literature, very wide and all-embracing, bringing under control potentially all aspects of the use and development of land and buildings, including a very small extension to a building or an insignificant change in use (Telling, 1986; Denyer-Green, 1987). This would give rise to a lot of work for the planners. More important, it might not be workable in practice. Thus the strategy has been to follow the British practice of providing for a number of exemptions from the definition: a category of development for which planning permission is “deemed” to be granted by procedures other than those for development control and a category of “permit-ted” development that, while legally constituting development, does not require planning permission. 6
Several of these exemptions are set out in subsidiary legislation, for example, the Planning (Use Classes) Rules, first introduced in 1960, and the Planning (Develop-ment of Land Authorization) Notification, passed in 1963. These rules are statutory instruments that are provided for in the Planning Act and can be amended rela-tively easily by the minister for national development. Over the years the system of control has become increasingly sophisticated. In 1964, for example, development charges and a time limit on the granting of planning permission were introduced. In 1989 a special type of control focused on conservation (conservation permis-sion) was introduced, and provisional permission was introduced to facilitate the development process (Khublall & Yuen, 1991; Motha & Yuen, 1999). Despite the changes, the system has not been fundamentally altered. Like the British system, it operates primarily by:
Creating a wide definition in principle. Extending or limiting that definition in specific cases. Varying the circumstances in which planning permission may be required.
By requiring planning permission for all development, the 1959 legislation, like the 1947 British planning act, effectively nationalized individuals’ property development rights in Singapore. It was to be the state that would decide when
6 For details on these categories, see Planning Act Cap 232, Part III; and Khublall and Yuen (1991).
•••
36914 Guiding Spatial Changes: Singapore Urban Planning
and where development and land use change would take place on the island by either allowing or withholding individual permissions, a power tempered only by the extent to which private developers were willing (or not) to invest in particular locations.
14.1.2 Development Plan
In exercising development control, the planning authority is required to give due regard to the contents of the development plan. Similarly, development agencies, private and public, must take into account the development plan in their preparation of planning applications. The role of the development plan deserves closer exami-nation, since the development plan and development control are interrelated. While the development plan allocates land among different uses, development control is the executive arm of the planning process that gives effect to the planning objec-tives of the development plan. Those objectives were first set out in the Master Plan approved by the colonial government in 1958. The Master Plan was the first com-prehensive development plan for the entire island of Singapore. It was a statutory plan that governed the use of land for a period of 20 years with provision for 5-year reviews, which had to be approved by the minister for national development after an opportunity for objections from anyone affected.
Closely following the British development plans of 1947, the 1958 Master Plan was detailed and precise. It included a compendium of survey data on population, land use, traffic, employment, and possible industrial development; maps showing the land use zones; and a written statement that defined land uses and gave guidance on how they were controlled by the zoning categories and intensities of develop-ment. Its objectives were to promote the orderly physical development of Singapore, provide a general framework of proposed land uses to guide future development, and ensure the optimal use of land. The Master Plan introduced two new concepts in the control of land use:
The regulation of land use through zoning and the control of intensity of devel-opment through density (for residential use) and plot ratio (for nonresidential use). The British planning ideas of new town and urban containment.
The core policy of development set out in the 1958 Master Plan was essentially one of decentralization, with a proposed greenbelt to arrest continued expansion of the city area and the accommodation of further growth in three new towns outside the existing city.
Even though changes in the plan could be made through a legal process of public advertisement and inquiry, the 1958 Master Plan, with its detailed and rigid land use zoning proposals, proved incapable of dealing with the rapid postin-dependence urban development during the 1960s. The new state government’s many large-scale development programs (such as housing and industrial develop-ment) required departures from the density and locational standards stipulated in
•
•
370 B. Yuen
the Master Plan. This led to the lifting of Master Plan controls on public sector development and a search for a more responsive instrument to facilitate long-term planning.
14.1.2.1 Concept Plan
This process culminated in a change in planning approach and strategies, moving from a conceptualization born of the 1947 British style of development planning to the new action planning of the Singapore Concept Plan. Public sector develop-ment was from that point coordinated through the standing Master Plan Committee, chaired by the chief planner and including representatives from all relevant govern-ment agencies. The objective in having representation from all relevant agencies is to ensure that land claims can be resolved without much delay and development projects expedited. The committee is tasked with considering and coordinating the proposals of public departments and resolving conflicts in land use among the public agencies. The general aim is to ensure that the use of state land is optimal and is compatible with the Concept Plan. A land use recommendation of the Master Plan Committee, once approved by the minister, is safeguarded for a development period of 2 years. 7
The Concept Plan, first adopted by the Singapore government in 1971, is a nonstat-utory plan that shows in structural terms the distribution of and relationship between major land uses and transportation. A multinuclei spatial pattern of major develop-ment corridors supported by extensive road and rail networks is envisaged. The plan reinforces the comprehensive integrated planning approach. Unlike the Master Plan, where the concern is the production of the plan, the Concept Plan focuses on the process of meeting its objective functions of being flexible and responsive to the needs of all sectors. It overcomes the restrictions of the 1958 Master Plan by remaining an expression of principles and policies, not detailed proposals and land use maps. It is an evolving document to allow the strategic shifts necessary to meet growing needs, changing circumstances, and new opportunities as they arise.
The Concept Plan is on a 10-year planning cycle. The latest release, the 2001 Concept Plan, has built on the earlier plans to unfold a vision of Singapore as a “dynamic, distinctive and delightful city” in an increasingly globalizing world. The plan emphasizes not just ensuring the optimal use of land but also planning for dynamic growth, taking a broader view of what society needs through planning, and delivering sustained development and a high quality of life for all. Once the basic needs are satisfied, strategies are laid on to enhance quality and distinction. The key strategies of the 2001 Concept Plan include the following: 8
7 Once approval is granted, the next step is for the relevant development agency to implement its proposed development as approved by the minister. This usually involves the acquisition of the land by the government if the land is in private ownership or, for state land, steps to vest the land in the relevant development agency. For discussion of Singapore’s land acquisition act, see Khublall and Yuen (1991) and Motha and Yuen (1999). 8 For more details on the proposals in the 2001 Concept Plan, see Singapore, Urban Redevelop-ment Authority (2001).
37114 Guiding Spatial Changes: Singapore Urban Planning
Creating a more livable city—providing a wider choice of housing types and locations and raising the quality of the living environment. Creating a fun and exciting city—providing a wider choice of facilities, places, and greenery for all to enjoy. Creating an economically vibrant city—providing greater flexibility for busi-nesses and further improving transportation and connectivity. Creating a distinctive city—focusing on identity, to retain and enhance a sense of place identity.
In response to the widening frame of globalization and the criticisms of tabula rasa development, the Concept Plan gives additional attention to greenery, place identity, and heritage conservation:
Buildings and places are part of Singapore’s built heritage. They are an important element in identity. To date, more than 5,600 buildings have been conserved. In future, more build-ings will be conserved to preserve the character and collective memory of places. (Singa-pore, Urban Redevelopment Authority, 2001, p. 42)
To adequately understand and uncover places that are valued and have identity, planners have turned to the community, giving renewed impetus to the plan-making process. The logic is simple. As the minister for national development states,
All of us who have a stake here ought to have a say in how we want this place to develop. The more we are involved in the planning, then the more aware we are of the constraints we face and the trade-offs we need to make this little red dot [Singapore] liveable and comfort-able. ( The Straits Times , July 21, 2001)
Besides inputs from different government agencies, extensive public consulta-tion has been initiated through multiple channels (forums, exhibitions, competi-tions, the media, public dialogues, focus group discussions) to engage all sectors of the community (Singapore, Urban Redevelopment Authority, 2001; Yuen, 2006). The planning outcome is summarized by a focus group member:
The process of public participation is unparalleled. The URA has taken a back seat to let the public discuss. It did not impose or insist on things, but listened and made all the logis-tics possible for us to interview and discuss with various authorities, so this Concept Plan comes with a very good cross-sectional view. ( Sunday Times [Singapore], April 29, 2001)
14.1.2.2 Revision of the Master Plan
In parallel with the work on the Concept Plan, the Master Plan is being revised to implement place-based planning. The community is again invited to work with the planners in the plan-making process to define place identity and conservation areas at a more local level. A key element is consensus building to create and foster a greater sense of community. As the minister of state for national development stated, in a July 23, 2002, speech at the opening of the exhibition of the parks and water bodies plan and identity plan,
As conservation has gained recognition and success over the years, it is now timely for the planners to work with the public to further develop these efforts towards a Singapore where
•
•
•
•
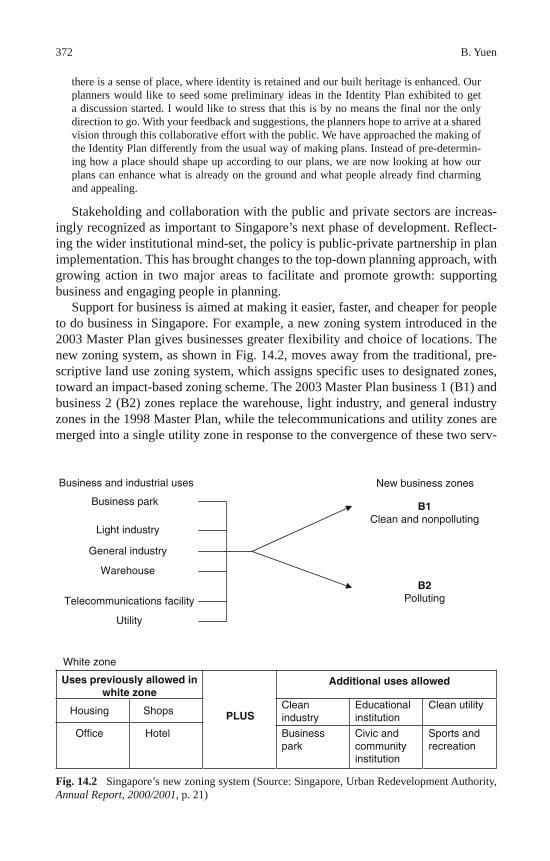
372 B. Yuen
there is a sense of place, where identity is retained and our built heritage is enhanced. Our planners would like to seed some preliminary ideas in the Identity Plan exhibited to get a discussion started. I would like to stress that this is by no means the final nor the only direction to go. With your feedback and suggestions, the planners hope to arrive at a shared vision through this collaborative effort with the public. We have approached the making of the Identity Plan differently from the usual way of making plans. Instead of pre-determin-ing how a place should shape up according to our plans, we are now looking at how our plans can enhance what is already on the ground and what people already find charming and appealing.
Stakeholding and collaboration with the public and private sectors are increas-ingly recognized as important to Singapore’s next phase of development. Reflect-ing the wider institutional mind-set, the policy is public-private partnership in plan implementation. This has brought changes to the top-down planning approach, with growing action in two major areas to facilitate and promote growth: supporting business and engaging people in planning.
Support for business is aimed at making it easier, faster, and cheaper for people to do business in Singapore. For example, a new zoning system introduced in the 2003 Master Plan gives businesses greater flexibility and choice of locations. The new zoning system, as shown in Fig. 14.2, moves away from the traditional, pre-scriptive land use zoning system, which assigns specific uses to designated zones, toward an impact-based zoning scheme. The 2003 Master Plan business 1 (B1) and business 2 (B2) zones replace the warehouse, light industry, and general industry zones in the 1998 Master Plan, while the telecommunications and utility zones are merged into a single utility zone in response to the convergence of these two serv-
Fig. 14.2 Singapore’s new zoning system (Source: Singapore, Urban Redevelopment Authority, Annual Report, 2000/2001 , p. 21)
Business and industrial uses
Business park
Light industry
General industry
B1Clean and nonpolluting
Warehouse
Telecommunications facility
Utility
B2Polluting
White zone
Uses previously allowed inwhite zone
Additional uses allowed
Housing Shops Cleanindustry
Educationalinstitution
Clean utility
Office Hotel
PLUS
Businesspark
Civic andcommunityinstitution
Sports andrecreation
New business zones
37314 Guiding Spatial Changes: Singapore Urban Planning
ices made possible by advances in technology. Similarly, a wider range of uses will be permitted in the new white zone for businesses, a concept introduced in 1995 to give developers the flexibility to propose a mix of uses. 9
Under this revised zoning system, businesses will have the flexibility to mix a wider range of uses—creating working, living, playing, and learning environments within the same site to suit their needs and market demand. As the minister of state for national development announced during the launch of the exhibition of the draft 2003 Master Plan (West Region),
If business needs change, industrialists can adapt their uses without the need to seek rezon-ing for the site. In the current prescriptive land use zoning system, this is not possible. (Singapore government press release, February 28, 2003)
Engaging people in planning is another key thrust. A new set of local plans, the Development Guide Plans, have been introduced since the 1990s to replace the 1958 Master Plan. These involve public consultation, as required in the Planning Act. In addition, several of these plans were farmed out to private sector profes-sionals and developers to prepare as part of the move toward encouraging greater participation by the private sector and the general public in creating a signature city-scape for Singapore. Going further, the Urban Redevelopment Authority in 2003 launched an e-consultation portal to engage the population in discussions of draft guidelines and policies before they are finalized. In proclaiming that the develop-ment plans are “your plans,” the planners have moved to more actively engage the community in the plan-making process. As “heartware” issues of quality of life and place identity are being considered, the general tenor is toward a more collaborative approach in planning.
Taking off from the broad strategies of the Concept Plan, the Development Guide Plans gazetted as the Master Plan in 1998 contain more detailed policies and control guidelines on land use zoning, building height, development intensity, 10 urban design, conservation and monuments, parks and water bodies, and land use arrangements. The Development Guide Plans draw together all the land use, spe-cial, and detailed controls in one plan to provide a transparent basis for development control. 11
There are 55 Development Guide Plans for the whole of Singapore. The prepa-ration of each of these plans applies the principles of the Concept Plan within the
9 The concept of the white zone was introduced in the Urban Redevelopment Authority’s land sale program to provide greater flexibility in zoning. Under this program land is sold to the pri-vate sector for development, generally through public tender. Some small residential parcels and conservation shophouses are sold by public auction. The government land sale program has been used to promote the redevelopment of the city center, the development of hotels, and conservation and other projects. 10 Since 1989 density control in residential areas has been replaced by plot ratio, resulting in a single intensity control for all developments. See Motha and Yuen (1999, Chap. 6). 11 Before the Development Guide Plans were introduced, several of these controls existed in writ-ten instructions or as separate plans outside the Master Plan documentation. The consolidation of all controls in the Master Plan clarifies the planning parameters governing land in Singapore and is part of the ongoing effort to improve the planning system.
374 B. Yuen
more local context of a specific planning area. With the development potential of a particular site set out in the Development Guide Plans, public and private sector developers can obtain a clear idea of what they can or cannot build on their land parcels. This helps to provide not only certainty but also transparency in the plan-ning system. The Development Guide Plans are an important element in ensuring that development control is not arbitrary, unpredictable, and unaccountable.
14.1.2.3 Coordination of Sectoral Planning
More than four decades since being introduced in 1959, comprehensive planning through the development plan and development control remains the cornerstone of Singapore’s planning system. Although the system of development plans in Singa-pore had its origins in British practice, over the years it has sought to include a balance between flexibility and certainty in its development of a framework that facilitates the growth of Singapore as an international airport and seaport, a manufacturing and industrial base, and a regional and international center of trade, commerce, and finance. The central area has been largely cleared of squatters and redeveloped with new infrastructure. Over the rest of the island the development of public housing, industrial estates, transportation, parks, and other public infrastructure has proceeded in an orderly pattern guided by the proposals of the Concept Plan (Motha & Yuen, 1999; Yuen, 1998, 2004). In many of these developments the government has taken a proactive approach to realize the vision set out in the Concept Plan by investing in key infrastructure. Government commitment has remained a strong factor in Singa-pore’s plan implementation and a key driver of interagency collaboration.
Even though there are no rights to future development in the absence of valid planning permission, the Concept Plan serves as a common reference point on appropriate development for the different agencies in their management of land. Because public investments have a long-term impact, these agencies are required to take a broad view and respect the provisions of the Concept Plan when preparing their development proposals. In the area of public housing, for example, the govern-ment, through the Housing and Development Board, has built more than 900,000 dwelling units, mainly in high-rise, high-density public housing estates and new towns with a large volume of related facilities (such as shops, parks, schools, mar-kets, and parking lots). Guided by the 1971 Concept Plan, many of the public new towns are located in high-density urban corridors adjacent to high-capacity public transportation. This plan has facilitated the systematic and comprehensive planning of public housing estates and new towns to meet housing demands. Critical to the implementation of the plan are the following:
The early designation of land in relevant locations for high-density public hous-ing developments. Better coordination between public housing developments and the provision of utilities. The early planning of uses complementary to housing estates, such as land for parks, education facilities, and industrial uses.
•
•
•
37514 Guiding Spatial Changes: Singapore Urban Planning
Before the Concept Plan was formulated, public housing estates and new towns were developed largely on a piecemeal basis, with little reference to the overall physical development strategy. With the Concept Plan setting out the likely direc-tions for the future development of land, the public development agencies could bet-ter coordinate their sectoral planning. The impact of this can be seen in the planning and programming of large-scale public investment in infrastructure. The islandwide mass rapid transit and expressway networks, for example, could be planned on a comprehensive scale and in advance of implementation. Because plan implementa-tion takes place through the process of development control, the following section examines that process of control more closely.
14.2 The Process of Control
The procedures for control (determination, approval, refusal, appeal) are set out in the Planning Act. Three main aspects are covered:
The procedures to follow in applying for planning permission and in considering what decision to make on applications The limits within which planning controls operate so as to provide a mechanism protecting against arbitrary decisions and abuse of power The machinery through which an aggrieved person can mount a legal challenge against the system
The powers of the minister for national development to decide on planning appli-cations and appeals and to institute new rules are set out in the Planning Act. The minister may appoint a person (or persons) to act as competent authority for admin-istration of the Planning Act. Today that competent authority is the chief planner of the Urban Redevelopment Authority. All development applications must be made on prescribed forms and submitted to the competent authority. A processing fee is charged for each application. The amount payable is set out in the subsidiary leg-islation (The Fee Schedule 2000) and is generally structured to correspond to the type, size, and complexity of the application.
Given the pro-business environment, the planners have produced development control handbooks and submission checklists to guide applicants. Application forms for planning approval are available from the Urban Redevelopment Author-ity, at its customer service counter and on its Web site. The planners have continu-ally reexamined the procedures and sought to reduce the red tape and processing time.
The competent authority has 3 months to decide on an application, although under unavoidable circumstances the decision may be deferred as long as the competent authority deems appropriate. Decisions are made on most development applications in less than 3 months; in 2000/2001, for example, 95% of the 8,800 applications received were reportedly cleared within 8 weeks (Singapore, Urban Redevelopment Authority, Annual Report, 2000/2001 ).
•
•
•
376 B. Yuen
Over the years the planning authority has simplified procedures to speed the process of obtaining planning permission. The Simplified Planning Approval Sys-tem introduced since April 1987 is one such effort. 12 Before this system was imple-mented, the planning authority had to consult all relevant technical departments and obtain their clearances before planning permission could be issued. This tended to lengthen the processing time for even the most straightforward development appli-cations. The simplified system aims to separate development and building control procedures by calling for developers to consult with the technical departments on their requirements before submitting development plans.
In processing development applications, therefore, planners will not insist on clearances being obtained from the technical departments. They will evaluate a development application primarily on planning grounds, relegating compliance with technical requirements to the building control stage. At that stage compliance with the technical requirements will be required before the building plan approval is issued. This arrangement helps to minimize duplication in technical consultations and requirements between the development control and building control stages. It also gives flexibility to the professionals (architects, engineers, and the like) whose responsibility it is to decide what consultations are needed for the development application and when they are needed.
The intention is for the construction industry to self-regulate. As an incentive, under the Simplified Planning Approval System the submission requirements have been simplified: application forms focus on the essential planning issues, and fewer plans are required. To further speed processing, the system allows simple, straight-forward development applications—combining submissions for planning and building approval—in certain cases, such as for areas where planning parameters are clearly defined. Whether to opt for this type of submission is entirely up to the applicant, who is also responsible for ensuring that the proposed project can comply with all aspects of the planning parameters.
For larger, more complex, or controversial projects that do not conform with the intended land use set out in the Master Plan, developers may initially submit an outline application. This process is aimed at giving developers a quick indica-tion as to whether their proposal would be favorably considered without a need to prepare detailed plans. Put simply, an outline application is a broad proposal to test the requirements for land use, plot ratio, building height, and form on a develop-ment site and determine the planners’ intentions for the site, including whether the site is affected by public schemes and what its urban design or planning parameters are. Outline permission may be issued within 3–4 weeks of an application. Such permission does not authorize the developer to carry out the proposed or any other development or works.
Outline permission is generally valid for 6 months, while planning permission is valid for 2 years (an extension of planning permission may be applied for 2 months before the expiration date). The 2-year time span was introduced in 1964 by an amendment to the 1959 Planning Ordinance to curb speculation and reduce the
12 For details on this system, see Motha and Yuen (1999).
37714 Guiding Spatial Changes: Singapore Urban Planning
number of unused planning permissions. Since 2003, under the multiple develop-ment options scheme, an applicant has also been allowed to test up to three different development schemes in a single planning application. This process not only helps to reduce costs (the combined application fee is less than that for separate applica-tions); it also shortens the processing time.
In response to the growing use of the Internet, the Urban Redevelopment Author-ity in 1997 introduced a computerized planning application form for the construction of new buildings and for amendments to approved plans. Since 1999 it has promoted electronic submission using the Internet under the Electronic Development Applica-tion (EDA) system. With the EDA system, applicants can submit text files and CAD (computer-aided design) drawings and obtain online approval. Capitalizing on the Singapore ONE broadband network, the EDA system is part of the larger effort to reengineer the business process in the construction industry. It is the first step to the one-stop submission system developed under CORENET, the network that allows the construction and real estate industry to communicate and exchange information seamlessly. All types of development applications can be submitted using the EDA system, and its use has grown rapidly. While 9% of all planning applications were made through the system in 2000, the share rose to 99% in 2004 (Singapore, Urban Redevelopment Authority, Annual Report, 2000/2001, Annual Report 2003/2004 ). Some 95% of e-applicants receive a decision within 4 weeks.
E-application offers several attractions. It improves timeliness in obtaining planning decisions and saves applicants time, labor, and costs. Online processes speed consultation responses and the delivery of decisions from the planner. Appli-cants can check the status of their submissions online. In contrast with traditional paper submissions, there is no need to provide multiple color copies of plans. The e-submission system supports a fast, hassle-free form-filling process that includes automatic computation of the plot ratio, site coverage, communal open space, and processing fees. E-submissions can be made at any time, including after office hours, and from any place with an Internet connection. There are, however, some minimum hardware and software requirements, such as a personal computer with a Pentium 166-Mhz processor, 32 MB of random access memory (RAM), a modem that transfers data at a minimum speed of 56.6 Kbps, and a Netrust smartcard reader and Netrust smartcard certificate 13 —as well as a need for computing literacy.
Instant approval is available through an alternative process of plan lodgment that has been in place since 1995. Once receipt of the lodgment is acknowledged, the applicant can proceed to apply for building control approval if required. Plan lodgment allows a development application for proposed additions and alterations, new construction, or material change of use to be lodged by a qualified person (QP)—a registered architect or engineer—as long as the application complies with the planning and lodgment requirements. This process, based on self-declaration of compliance, is part of the effort to promote self-regulation: plans are approved immediately on the strength of the qualified person’s certification that they have
13 Netrust is a certification authority that provides online identification and security infrastructure to enable secure electronic transactions through the Internet and other wireless media.
378 B. Yuen
been checked for compliance with all relevant guidelines and regulations. By deem-ing the work to be authorized and thus not requiring planning approval, plan lodg-ment further reduces the time and cost for businesses. It also promotes a larger role for qualified persons in development control. To allow businesses to respond quickly to market changes, more building and use categories have been added over the years. In 2003 an estimated 40% of proposals for change of use (about 60 cases a month) qualified for lodgment.
In today’s climate of public participation, partnership with the community has also entered development control, though at the policy level. The Urban Redevel-opment Authority has actively engaged businesses and the community in review-ing and reducing rules and simplifying development controls. Through the Public Officers Working to Eliminate Red Tape (POWER) scheme initiated in 2002, the authority holds regular dialogues with industry players with a view to identifying business-responsive changes in its development control guidelines. Following one such session, in January 2002, the Urban Redevelopment Authority revised more than 12 industrial building guidelines ( The Straits Times , April 9, 2002). Extending what was originally a Ministry of Finance practice to cut red tape through inter-nal review of rules by government departments and statutory boards, the Urban Redevelopment Authority has used this tool to engage businesses, professionals, residents, and other users to “dissect, question and redefine our development con-trol guidelines and give their honest assessment and recommendations” ( Skyline , November–December 2000, p. 3).
Unlike in the British system, the public is not consulted on planning applications. However, in recent years the public has been invited to comment on several major development projects such as the integrated resorts (a mixed-use development with a casino). In the present era, with the focus on developing a global city, Singapore authorities have sought to make the practice of development control more respon-sive to the market. The thrust of reforms has been largely toward streamlining the process through greater speed, flexibility, and self-regulation.
14.3 The Assessment System
Under the Planning Act the competent authority may decide on an application for planning permission in one of three ways:
Grant planning permission unconditionally. Grant permission subject to certain conditions. Refuse planning permission.
Decisions must be given to applicants in writing. On the basis of this notice, applicants can lodge an appeal if they feel aggrieved.
Since 1989 the competent authority has had the power to grant provisional per-mission before granting planning permission. Provisional permission is generally valid for 6 months unless a longer period is specified (as with planning permission,
•••
37914 Guiding Spatial Changes: Singapore Urban Planning
an extension may be applied for 2 months before the expiration). When the com-petent authority is satisfied that the developer has complied with all the conditions in a provisional permission during the period in which it was valid, the competent authority may grant planning permission subject to any further conditions deemed appropriate. To avoid delaying development, the competent authority may authorize specified preliminary works following the grant of provisional permission.
The crucial point about the decision on a planning application is the criterion for its determination, which is set out in the Planning Act: the competent authority “shall act in conformity with the provisions of the Master Plan and any Certified Interpretation Plan in so far as they may be relevant.” 14 This has had the effect of making the development plan—specifically, the Master Plan—a strategic document in the development control process. One apparent purpose of this is the traditional role of development control: to ensure that development control is accepted as the means of implementing the land use plan. A second purpose is to ensure that the plan gives applicants some degree of certainty, the certainty of knowing in advance what is acceptable.
Although largely plan led, under the Planning Act the competent authority may make a determination, with the approval of the minister for national development, in the following circumstances:
Where the land to which the application relates (the relevant land) is or will be required for any public purpose or for the provision of any utility services or infrastructural, social, or transportation facility. Where the relevant land or its locality is the subject of a planning, transportation, conservation, or preservation study being carried out by the competent authority or any other public authority. Where the provisions of the Master Plan in so far as it relates to the relevant land or its locality is being reviewed by the competent authority. Where a proposal to amend the provisions of the Master Plan in so far as it relates to the relevant land or its locality has been submitted to the minister for approval. Where the competent authority is of the view that the development proposed in the application is incongruent with the developments on land adjoining the relevant land or other land in the locality.
These circumstances offer the possibility of introducing some discretion, or what Jowell (1973, p. 178) terms “room for decisional manoeuvre,” into the system of control to accommodate the dynamic nature of development in Singapore. The built-up area of Singapore has doubled in 30 years, increasing from 26% of the total area in 1967 to 51% in 1997. In the next 40–50 years the built-up area is expected to expand to 70%, to accommodate the projected increase in the population to 6.5 million.
Prompted by the desire for flexibility in strategic controls, the planning authority has from time to time articulated planning policies and guidelines through circulars
14 Certified interpretation plans are prepared to provide more detailed interpretation of the Master Plan and are usually on a scale larger than the maps in the Master Plan.
•
•
•
•
•
380 B. Yuen
to professional bodies. In practice, these circulars often become policy directives, providing guidelines to developers as well as evaluation criteria for development control decisions. As the minister for national development explains, the purpose of these guidelines is “to formulate flexible standards, encourage greater creativity and ensure that land is put to optimum use” ( The Straits Times , April 19, 1990). Together, the policies and guidelines offer a way to balance the element of certainty with flexibility and creativity in planning control. As the chief executive officer of the Urban Redevelopment Authority states,
Part of the URA’s job is to facilitate orderly development … . But we must not over-control. The best way to do this is to listen to our customers, to trust them more and share responsi-bilities with them. ( The Straits Times , April 9, 2002)
Discretion is not without limits. The Planning Act, in providing for discretion, is also very clear on the limits of that discretion: the competent authority is to act under the watchful eye of the minister for national development. The minister in turn is answerable to parliament for the activities of the ministry. In other words, the discretion is neither absolute nor a matter of personal whim that can lead to injus-tice—but instead operates within limits. There is strong disincentive for corruption under the country’s strict anticorruption policy. Under Singapore law, both the giver and the receiver of a bribe are guilty of corruption. If convicted, they are subject to the same court punishment of a fine (up to 100,000 Singapore dollars [S$]) or imprisonment (up to 7 years), or both, and the penalties are more severe for public servants and members of parliament.
What is more, the validity of a planning permission is not affected by errors or omissions. In the event of an error in or omission of any particulars in the description of any land or boundary, the competent authority may by gazette notification amend the error or omission and amend or add to the planning permission accordingly.
Another way of ensuring accountability in the system is enshrined in the right of appeal, as in the British system. An applicant aggrieved by a decision may appeal the decision to the minister within 60 days of being notified of the decision. The decision of the minister is final; it cannot be challenged in any court.
The minister may direct the competent authority to refer any or all applications to him for determination. The minister’s decision on these applications is also final. In addition, the minister may make rules relating to the operational aspects of develop-ment control (such as the form and manner in which applications may be made for planning permission to develop land, the manner in which the competent authority will deal with applications for planning permission, the fees or charges to be paid, and the manner in which appeals may be made and determined under the Planning Act).
14.4 Enforcement of Planning Control
To be effective, any system of control must have some ultimate sanction to deal with contravention. Enforcement of planning control is thus an important element in the planning system. In Singapore development control is enforced through criminal
38114 Guiding Spatial Changes: Singapore Urban Planning
prosecution. Any person who develops land without planning permission commits an offense and, if convicted, is liable for a fine or a prison term. An enforcement notice may be served on any person who owns or occupies the land, has any other interest in it, or is using the land for any purpose. The enforcement notice must be in writing, stating the breach of planning control and the measures and time to be taken to remedy the breach.
The penalties for noncompliance with an enforcement notice are severe. If con-victed, an offender is liable for a fine of up to S $200,000 or a prison term of up to 12 months, or both. A continuing offense means an additional fine of up to S $10,000 for every day that the offense continues after conviction. Over the years, with rising salaries and inflation, the amount of the fine has been progressively increased. Not-withstanding the provisions of the Criminal Procedure Code, the Magistrate’s Court or a district court can also impose the maximum penalties provided for an offense under the Planning Act. In addition, where a person fails to comply with a planning permission or its conditions, the competent authority may cancel the permission. As with planning permission, an aggrieved person may appeal an enforcement notice to the minister.
The 1998 Planning Act also provides for issuing an information notice. This notice may be served on any person who owns or occupies the land, has any other interest in it, or is using the land in any way that appears to the competent authority to be a breach of planning control. The notice may ask for information on the use of and activities on the land. Failure to comply is an offense, and conviction leads to a fine of up to S $5,000 or a prison term of up to 6 months, or both.
The Singapore procedures for development control are in many ways influenced by the thinking behind the 1947 British act. The concept of application, determina-tion, and appeal exemplifies that influence, as does the use of subsidiary legislation and the introduction of Use Classes Rules in 1960. The influence is also evident in the fundamental aim of development control, which is still the implementation of the development plans with respect to land use and physical development. The simple premise is that development control in Singapore is the means by which land use policies are implemented: through the granting (or withholding) of planning permission for government or private sector applications to develop or change the use of land.
14.5 Conclusions
Much of what we see in Singapore today has been constructed under the framework of the planning and development control system begun in 1959. The system has raised some contradictions and challenges. On the one hand, growth in population and traffic notwithstanding, the urban environment and quality of life have visibly improved. Singapore has become a modern, efficient city. Physical development appears to have taken place in an orderly, coordinated manner. On the other hand, as is perhaps typical of centralized planning, many of the developments, such as public housing, are criticized for their cookie-cutter monotony.
382 B. Yuen
Solutions are possible. In recent years effort has been increasingly directed toward greater diversity and creativity in the city’s skyline and design. Many of the older public housing estates and towns are being renewed, with a focus on place identity. Whatever the criticisms, the outcome appears to indicate that the city has held steadfast to its development plans, instituting an enabling legal, policy, and administrative framework to achieve their implementation. As Wehrfritz and Koles-nikov-Jessop (2007) state,
The unabashedly paternalistic model once earned Singapore the reputation as a “nanny state” in a region known for its all-night neon. Yet with many Asian cities now gridlocked and mired in pollution, the costs of laissez-faire development are more and more appar-ent—making Singapore’s centralized approach increasingly appealing.
The transformation of Singapore over the past 40 years demonstrates the strength and legitimacy of planning in guiding spatial changes. Plans are prepared, and importantly, they are implemented with relatively high compliance with develop-ment control and planning regulations.
Central to plan implementation is development control. Under present law and practice no person in Singapore may develop any land without planning permis-sion from the competent authority. In its essentials the Singapore system is firmly rooted in the ideology of British planning, which brought under control all devel-opment activities and all material changes in the use of any land or buildings and severely limited what could be undertaken without planning permission. The term develop is all-encompassing, even though the Planning Act makes clear that some works and land uses are not to constitute development. The procedures to be followed in applying for planning permission, the limits within which planning controls operate, and the machinery for mounting legal challenges against the system are all clearly set out in legislation. As Smith (2007) argues in discussing British planning,
We need to recognise however that effective planning cannot always be achieved through consensus. Where hard choices are required, clear and equitable decision-making frame-works are essential. (p. 4)
The objective of planning and development control in Singapore, as in many other countries, is primarily to achieve orderly development in the interest of the community as a whole. The system has embodied processes enabling the imple-mentation of planning policy objectives and plans in a changing environment. As argued, planning and development control in Singapore is not static. It is by no means a mechanical, preordained process. Dissatisfied with the rigidity of tradi-tional master planning and development control measures and spurred by global trends, Singapore authorities have made a general move over the years to review the measures, reduce processing time, engage the stakeholders, and increasingly shift the focus of control toward facilitating development.
As part of these efforts, new and more flexible business zones and white zones have been introduced to facilitate business development as Singapore increasingly integrates with the global economy. Greater attention is being focused on greenery, heritage conservation, and place identity. Alternatives are being pursued to make
38314 Guiding Spatial Changes: Singapore Urban Planning
the city more livable and attractive. Much more is being done to work in partner-ship with the community to create the distinctive, vibrant, and sustainable city as envisioned in the 2001 Concept Plan. This in turn has brought changes to the top-down planning approach. By acknowledging the need to work more closely with the public and private sectors in plan implementation, the planners are changing the power relations and the way development plans are being made. The global mantra “think global and act local,” while presenting challenges, has opened opportunities to reinvent public participation in planning.
The desire to be pro-business is reopening the debate on the balance between the need for certainty and the scope for flexibility. Where does this balance lie, especially in the light of the long-standing debate about certainty and flexibility in development control systems around the world? It is still too early to know the full impact of the new zones and other pro-business development initiatives. While the planning authority’s facilitation service scores a high 90% on customer satisfac-tion, preliminary indications of the industry response to the government’s plans to allow developers freer rein on white sites appears to be largely lukewarm ( The Straits Times , March 1, 2003; Singapore, Urban Redevelopment Authority, Annual Report 2003/2004 ). As Booth (2002) reminds us from British experience, actors in land management favor flexibility in development control for different reasons. The emphasis on faster and easier development applications, including instant approv-als, must not come at the cost of the basic aims of development control. Too much flexibility can be a problem too.
There is another challenge to consider. Given the widening appeal of the Inter-net, electronic submission and plan lodgment appear likely to feature strongly. That suggests that the private sector will play an increasingly large role in the self-regula-tion process. This development is not without problems. Key impediments include not just system constraints but also liability problems highlighted by Low (2000) in a review of the lodgment scheme. Plan lodgment as now practiced offers free-dom from the normal process of development control by allowing instant approv-als of development as long as it complies with all the rules set out in the lodgment scheme. But there is a question whether qualified persons will be willing to shoul-der the entire responsibility for ensuring compliance in the face of what Low (2000, p. 61) describes as “a punitive environment that leaves no room for mistakes to be made.” Related to this is a psychological barrier for qualified persons, the concern that existing regulations may not be sufficiently flexible for some projects. That concern has led some to opt to continue with the normal process of development control rather than risk the liability. Unless these issues are resolved, streamlining the development control system could result in limited gains.
References
Ashworth, W. (1954). The genesis of modern town planning . London: Routledge and Kegan Paul. Booth, P. (2002). A desperately slow system? The origins and nature of the current discourse on
development control. Planning Perspectives , 17 (4), 309–323.
384 B. Yuen
Castells, M. (1981). Towards a sociological theory of urban planning. In C. C. Lemert (Ed.), French sociology: Rupture and renewal since 1968 (pp. 374–395). New York: Columbia Uni-versity Press.
Chan, H. C. (1971). The politics of survival . Kuala Lumpur: Oxford University Press. Denyer-Green, B. (1987). Development and planning law . London: Estates Gazette. Healey, P. (1988). The British planning system and managing the urban environment. Town Plan-
ning Review , 59 (4), 397–417. Healey, P. (2005). Collaborative planning: Shaping places in fragmented societies . New York:
Palgrave Macmillan. Healey, P., Doak, A., McNamara, P., & Elson, M. (1985). The implementation of planning prac-
tice and the role of development plans . Oxford: Oxford Polytechnic, Department of Town Planning.
Jowell, J. (1973). The legal control of administrative discretion. Public Law , autumn, 178–219. Khublall, N., & Yuen, B. (1991). Development control and planning law in Singapore . Singapore:
Longman Singapore. Koolhaas, R., & Mau, B. (1995). SMLXL . Rotterdam: 010 Publishers. Lim, S. P. (2000, May). Towards good governance: Promoting operational efficiency and account-
ability . Paper presented at the World Bank Institute course East Asia: Urban and City Manage-ment, Singapore.
Low, C. H. E. (2000). The impact of self-regulation on the process of development control . Unpub-lished master’s thesis, National University of Singapore, Singapore.
McGee, T. G. (1976). Beach-heads and enclaves: The urban debate and the urbanisation process in South-east Asia. In Y. M. Yeung & P. Lo (Eds.), Changing South-East Asian cities: Readings on urbanization (pp. 60–75). Singapore: Oxford University Press.
McLoughlin, J. B. (1973). Control and urban planning . London: Faber. Motha, P., & Yuen, B. (1999). Singapore real property guide . Singapore: Singapore University
Press. Singapore, Ministry of National Development. (1980). Revised Master Plan, report of survey .
Singapore: Author. Singapore, Urban Redevelopment Authority. (2001). Concept Plan 2001 . Singapore: Author. Singapore, Urban Redevelopment Authority. (various years). Annual report . Singapore: Author. Smith, R. (2007). The vision: Inclusive planning . London: Royal Town Planning Institute. Telling, A. E. (1986). Planning law and procedure . London: Butterworths. Wakeley, P., & You, N. (2001). Implementing the Habitat Agenda: In search of urban sustainabil-
ity . London: University College London. Wehrfritz, G., & Kolesnikov-Jessop, S. (2007). Singapore leads way in green architec-
ture. Newsweek International . Accessed March 12, 2007 from http://www.msnbc.msn.com/id/10756823/site/newsweek/.
Wong, A., & Yeh, S. H. K. (Eds.). (1985). Housing a nation . Singapore: Maruzen Asia. Yeung, Y. M. (1987). Cities that work: Hong Kong and Singapore. In R. J. Fuchs, G. W. Jones, &
E. M. Pernia (Eds.), Urbanization and urban policies in Pacific Asia (pp. 257–274). London: Westview.
Yuen, B. (Ed.). (1998). Planning Singapore: From plan to implementation . Singapore: Singapore Institute of Planners.
Yuen, B. (2004). Planning Singapore growth for better living. In M. Freire & B. Yuen (Eds.), Enhancing urban management in East Asia (pp. 55–70). Aldershot, England: Ashgate.
Yuen, B. (2005, April). Squatters no more: Singapore social housing . Paper presented at the Third World Bank Urban Research Symposium, Brasília.
Yuen, B. (2006). Reclaiming cultural heritage in Singapore. Urban Affairs Review , 41 (6), 830–854.
385
International aid to cities over the past 40 years has been based largely on a simple, demographically driven model of demand for and supply of housing and urban infrastructure services. The demographic projections have been generated by the United Nations Population Division, country demographic and statistical offices, housing and public works ministries, and, more recently, analyses by major research institutions such as the US National Academy of Sciences (2003). Governments and aid agencies have noted the projections of continued rapid urban population growth in developing countries, especially the conclusion that there will be an addi-tional 2 billion urban residents in these countries by 2025. These projections have been taken as the starting point in assessing the demand for investment in housing and urban infrastructure such as water supply, sanitation, electricity, and solid waste management.
Recent examples of this work include the Global Report on Human Settlements of the United Nations Human Settlements Programme (see e.g., UN-Habitat, 2003), the work done on the Millennium Development Goals in A Home in the City (UN Millennium Project, 2005), slum improvement strategies of the Cities Alliance, and analyses of the growth of the urban population, such as Davis’s Planet of Slums (2006). As a result of perceived and real demographic pressure, entire policy areas have developed, such as remedies for the threat to the urban poor of forced evictions or for provision of water supply and sanitation to millions of new urban residents.
Conclusions about the demand for housing and infrastructure services have focused on two points: the need to find affordable solutions for growing numbers of urban poor and the weak supply response of both the public and the private sector to growing demand. Both points have reflected the assessment that governments did not have the financial resources to provide subsidized shelter and services to grow-ing numbers of urban residents and that most countries did not have the policies in place to provide incentives for the private sector to respond to this demand. This has
S.V. Lall et al. (eds.), Urban Land Markets, DOI 10.1007/978-1-4020-8862-9_15 , © World Bank 2009
Chapter 15 Aid, Density, and Urban Form: Anticipating Dakar Michael Cohen
M. Cohen ( ) International Affairs New School New York , NY 10011 , USA e-mail: [email protected]
386 M. Cohen
led to the widely perceived need to provide low-cost, affordable solutions on a large scale and to look for opportunities for what has been described as “scaling up.”
The meanings of low cost and affordable are critical in this argument. Low cost in fact meant, after 1970 and the entry of the World Bank into the field of urban aid, that much lower standards and unit costs for housing and infrastructure services were proposed than had previously been supported by the major international and bilateral providers of aid: the United Nations Centre for Housing, Building, and Planning and the French and U.K. bilateral housing and urban planning programs. Rather than pursuing models such as the single-family homes supported by the US Agency for International Development (USAID) in Latin America, which were responsive to prospective middle-class homeowners but were prohibitively expen-sive to the urban poor, the Bank began to ask much more basic questions about how to reach the poor. This led to low-cost solutions such as providing one water faucet for a hundred families in some aid projects.
Affordable in this context gradually became understood as about 15–20% of dis-posable household income that could be used to pay for housing and urban infra-structure costs. This 15–20% became a rule of thumb that was used in hundreds of projects in developing countries, even though socioeconomic surveys in these coun-tries demonstrate great variation across cities and income groups in what house-holds actually spend for these basic services.
The critical design variable in these project discussions, however, was residen-tial density . Assuming a given number of households per hectare was necessary to apportion the costs of infrastructure networks such as water supply, sewerage, roads, and drainage as well as public spaces and public facilities such as schools, clinics, markets, and community centers. As cost estimates were aggregated at the hectare level, the key parameter in deciding whether the desired population could afford the proposed solution was how many households would live in these areas. This number was arrived at through a series of calculations that first specified the area needed for roads, public facilities, and public spaces, with residential area being the residual. The sequence in this calculation reflected the requirements of land use and zoning codes that govern most cities.
Importantly, despite projects being located in cities with large numbers of high-density squatter settlements, most project design processes failed to include two important tasks: First, they did not explicitly examine the projected level of density of the project from a medium- or long-term perspective. And second, they did not consider the planned settlement in terms of the wider patterns of land use in the city at the time. Instead, decisions on density were project specific —disconnected, along with many other decisions, from the urban context as a whole. Just as deci-sions about density were not “contextualized,” the issue of site location was not considered in relation to urban form.
The consequences of this approach for density and urban form are the subject of this chapter, which uses the case of Dakar, the capital of Senegal, as an example. The chapter explores the implications of changes in the density of a project area over a period of 35 years in the context of the growth and development of Dakar. It offers conclusions about how project design incorporates density in projects for
38715 Aid, Density, and Urban Form: Anticipating Dakar
low-income populations and how density itself changes over time as a result of project design.
The stakes in this discussion are substantial. Residential density not only is a critical variable for the design of individual projects and their eventual benefits; it also has significant consequences for the wider issues of urban form and land use, urban transportation, and ultimately the productivity of a city. Considering that more than 11,000 cities and towns in the developing world received different forms of urban aid from the international community between 1970 and 2000, it is star-tling that these wider implications have not been the focus of more attention from policy makers and researchers.
One reason that these issues have been relatively neglected is that most urban aid has focused heavily on strengthening urban institutions in municipal and national governments. The physical and spatial dimensions of aid have received little atten-tion, also in part because the physical and spatial impacts of specific housing and infrastructure investment projects have become apparent only with the passage of time. The writing of this chapter therefore benefits from a long-term perspective—35 years from the beginning of project implementation. No other examples of such long-term evaluation could be found in international assistance and cooperation, including the United Nations Development Programme, the World Bank, and bilat-eral assistance programs. Consequently, this study is unfortunately unique in having the benefit of taking the long view.
15.1 The Senegal Sites and Services Project
The first World Bank loan for an urban development project was approved in June 1972 by the Bank’s Board of Executive Directors. Requested by the government of Senegal, this 50-year, interest-free loan of US $8 million was to finance the con-struction of a sites and services, or parcelles assainies , project in Dakar, a city of 500,000 people. The project was to provide 14,000 plots of land (150 m 2 each) with minimal infrastructure services (water supply, sanitation, unpaved dirt roads, and social services such as schools, clinics, and markets). Intended for low-income households, the project was to be implemented by the government’s Office des Habitations à Loyer Modéré (OHLM) on 400 ha in a vacant site in the Camberene area of Pikine, on the northern periphery of Dakar.
Urban growth in Senegal had averaged about 3.5% a year since independence in 1960, amounting to annual increases of more than 100,000 people, most of whom moved to the Cap Vert region, around Dakar. Dakar was growing at 6% a year, and by 1971 more than 60% of its population of 500,000 lived in squatter neighbor-hoods (World Bank, 1983, p. 3). As far back as 1952 the colonial government had created Pikine for population expelled from the slums of central Dakar. By 1969 Pikine was already home to 100,000 people (World Bank, 2002, p. 8).
This project was the first of the hundreds of urban projects financed by the World Bank since 1972, and Dakar was the first of the thousands of cities and towns that
388 M. Cohen
have received urban aid from the World Bank (Cohen, 2001). International aid agencies had financed urban projects in developing countries before 1972. How-ever, the Dakar project signaled the World Bank’s entry into this complex and rela-tively unknown sector and the introduction of a new approach to the provision of shelter and infrastructure services for the poor. The president of the World Bank at the time, Robert McNamara, had given speeches in 1970, including to the United Nations Economic and Social Council in New York, in which he acknowledged the ignorance of the Bank about urban issues while asserting the growing importance of cities in the economic and social development of developing countries.
During the board discussion of the Senegal sites and services project the Bank’s president and staff readily admitted that the Bank’s first effort in this sector was experimental and was in fact “learning by doing.” The project was small in finan-cial terms, yet quite ambitious and indeed very large relative to the experience of the Senegalese government in undertaking such programs. Within the Bank it was understood that the intellectual and policy stakes of this project were high. The biggest question posed in 1972 was whether low-income households, when guaranteed land tenure, would actually invest in and build their own homes while paying modest amounts over 15 years at 7% interest for the land and infrastructure services.
The basic hypothesis of project design was that poor people would invest in their housing if they had secure land tenure. This hypothesis was based on studies and experience in cities around the developing world. This work was best typified at the time by the field experiences of British architect-planner John F. C. Turner, whose influential work in Peru and in other countries in the 1960s had established the empirical basis for the sites and services policy and project approach (see Turner & Fichter, 1972).
The challenge for project design was to reduce the costs of the project and thereby increase its affordability for low-income households. As noted, density was the decision variable that could make that possible. Reducing costs meant reducing the size of plots and, in doing so, increasing the number of households per hectare and thus the density. Residential densities were to be increased rather than creating either public space or additional space for social facilities.
A few years after the project was launched, the major drama in Washington and Dakar, however, was the slow pace of implementation. The original implementation schedule had assumed that 14,000 plots could be constructed and services provided in 6 years, with households beginning to build their self-help housing as soon as they received ownership of their plot. While the Bank staff had badly underestimated the time needed for policy and institutional changes to occur, delays in implementation also reflected more profound second thoughts by the Senegalese government.
By the late 1960s government housing programs were largely subsidizing civil servants in the metropolitan area while at the same time systematically bulldozing the homes of residents of squatter settlements known as bidonvilles . The policy of forced evictions, or deguerpissement , was a response to increased squatting and ille-gal occupancy of urban land (Verniere, 1977, p. 7). High-quality real estate invest-ment and housing construction were considered key parts of a strategy to project the
38915 Aid, Density, and Urban Form: Anticipating Dakar
image of a modern Dakar as the national capital. This included building a wall along the highway to the airport to hide squatter settlements from visitors.
Public agencies followed a two-pronged strategy of bulldozing slums while at the same time providing areas for resettlement with minimal infrastructure. The proposed sites and services project further legitimated access to land and urban infrastructure for poor households. It thus represented an evolving response by the government to a large and growing problem. The provision of secure tenure and ownership to the poor, however, was a significant departure from existing govern-ment urban policy. Within the government, however, clarification of policies toward the poor occurred in December 1974, when President Léopold Senghor visited the site and declared that all households in the project should have private water taps and toilets, both of which were clearly unaffordable for most of the intended low-income population. This signaled government interest in settling a wealthier popu-lation on the site (Cohen, 1980).
Despite mixed messages and contradictory policies, the government was legally bound by agreements it had signed with the World Bank; implementation of the project continued, and the government temporarily stopped its policy of deguerp-issement . By 1976 the first tranche of 3,500 households had been allocated plots, or parcelles , and the roads, water supply, and sewerage system were slowly being built. The divergence in perspectives on the pace of implementation between the Bank staff and the Senegalese reality were reflected in a conversation I had with an elderly Senegalese mason sitting on the ground working on the project in 1977: when I commented to him that the project was behind schedule, he looked up at me with curiosity and asked, “According to whom?” Nevertheless, there was growing concern in Washington that the project would never be completed and that the “first urban project” would thus be an embarrassing failure.
In 1982 the Bank and the Senegalese government agreed that the project had been “completed,” as the momentum of occupancy and construction had increased considerably. Each wrote a report on the experience, with Bank staff noting that despite the delays, the concept of the project had been validated by the fact that for every US $1 of public funds, some US $8.20 of private funds had been invested in housing in the neighborhood (Tager, 1982). By 1978 three of the four tranches of parcelles , 10,500 plots for an estimated population of about 105,000 people, had been allocated and most of the project’s infrastructure had been built. Delays, inflation, and physical contingencies had absorbed the remaining funds, resulting in an earlier decision in 1976 to drop the fourth tranche. The recalculated economic rate of return for the project was put at 19% by Bank staff, easily falling within an acceptable range for projects in Senegal and in Africa more generally. Bank staff commented that one of the most important contributions of the project had been the training of more than 100 professional staff at OHLM in the provision of low-cost urban infrastructure and housing, a capacity badly needed in a country experiencing rapid growth.
While the time for the project had been seriously underestimated, the most sig-nificant impact of the project in Washington was its bad reputation for delays, disa-greement, and the stigma of failure. These perceptions were neither accurate nor
390 M. Cohen
sensitive to the contextual factors that had affected implementation in the field. Writing nearly three decades ago, I observed that the Bank had tried “to make the context conform to the project rather than the project conform to the context” (Cohen, 1980, p. 35), with resulting delays from mediating differences between the Bank and the government.
One conclusion of many of the Bank’s urban staff who had visited Dakar in 1972–1982 or, worse still, had been influenced by hearsay in Washington was that the Dakar project had been too big. This was not an unreasonable insight at the time: with 10,500 plots and 10 people per plot, what had come to be known as Par-celles Assainies was the second largest city in Senegal, and expecting such a project to be built in 6 years had been unrealistic. The experience with the project also led to a perception that sites and services projects were too complicated to imple-ment efficiently, particularly given the difficulty of achieving cost recovery (Cohen, 1983). The experience with one project appeared to have a worldwide impact. Inter-estingly, the issue of density had been forgotten in the intensified efforts to settle households on the site.
15.2 Looking Back and Going Back: 35 Years Later
When one looks back at this experience 35 years later, and visits the neighborhood, there are several sets of information needed to arrive at a fuller understanding of what happened. These include a demographic profile of current inhabitants; surveys of housing, infrastructure and environmental services, social services, and com-munity institutions and organization; and the relationship of Parcelles Assainies to metropolitan Dakar.
15.2.1 An Evolving Demographic Profile
By 2006 the Parcelles Assainies neighborhood was home to somewhere between 350,000 and 500,000 people, three to five times the originally projected population and density per hectare. These estimates were provided by the municipal office for the arrondissement of Parcelles Assainies, which is part of the commune Gue-diawaye, one of the four communes on the periphery of central Dakar. Despite its painfully slow start, the neighborhood has been steadily built since the mid-1980s, with most plots holding two- or three-story brick and concrete buildings. These buildings house extended, polygamous households of 20–30 people. More than half the population is under 25-years-old.
This situation is in contrast with a projected density, included in the project appraisal report, of 35 plots per hectare, 10 people per plot, and 350 people per hectare. Today there are between 1,000 and 1,700 people per hectare on 300 ha, depending on the population figure one accepts as reasonable.
39115 Aid, Density, and Urban Form: Anticipating Dakar
While precise data are not available, women appear to be predominant in the area’s population. This is in contrast with earlier periods of African urban history, when sex ratios in cities sharply favored males, reflecting earlier patterns of rural to urban migration. Parcelles Assainies is a neighborhood of many female-headed households. With limited opportunities for employment in the largely stagnant Dakar economy, many male Senegalese have left their country and their family to find work in other African countries, in Europe or North America, or in other, even more distant locations. Many stay overseas for many years, regularly sending remittances to their family in Parcelles Assainies. Remittances appear to cover both daily consumption expenses and further investment in housing. Devaluation of the CFA franc in 1994 has meant that foreign currency earned by overseas Senegalese workers is worth several times as much as it had been earlier.
In addition to this shifting demographic profile, the neighborhood experienced an even more important change starting in the mid-1980s, when low-income households began to sell their land and houses to middle- and upper-income individuals and families. This possibility had been raised in the 1970s as the drought affecting Senegal and its Sahelian neighbors had generated great pressure on urban households in Dakar to send remittances to their relatives in drought-stricken rural areas. The absence of opportunities for investment in housing or even for speculation in the 1980s led to rapidly rising prices for plots in Parcelles Assainies. The possibility of earning windfall gains by selling plots to richer peo-ple proved to be too lucrative to forgo. In the 1970s I had discussed this issue with women property owners, who told me that they would sell their plots if they needed funds for the education of their children or for family health emergencies. By the mid-1980s this process had begun. By the 1990s there were very few of the original households from the project’s “target population” (an unfortunate term used by the Bank).
This process, however, had its roots in the original design of the project. By pro-viding land, secure tenure, and infrastructure, project designers believed that they were putting into place the necessary conditions to lead to investment in housing. In fact, these features of the project were necessary but not sufficient. The absence of loans for construction meant that poor households were unable to start, much less sustain, the construction process. The costs implied in moving to a vacant site, with new construction and transportation needs as well as the likelihood that food and other essentials would be more expensive, meant that poor households simply could not afford to move to the site. Even when a loan program was finally estab-lished, the terms for loans were not sufficiently favorable to the poor while being more accessible for civil servants. Delays in the completion of infrastructure further increased the carrying costs for poor households.
The irony of this outcome is that the intention to increase affordability for the poor by reducing costs and increasing density not only generated political problems but also created delays in project implementation. Legal changes in density could be effected only by changing zoning regulations and building codes, which in turn required first bureaucratic approvals and then legal certification. Delays reflected the inertia against policy change.
392 M. Cohen
The issue of construction loans also proved to be central in implementation. The lesson that construction loans were essential components of sites and services projects aimed at providing viable housing solutions for the poor was not lost on the Bank or on other governments. Loans in different forms were included in many subsequent projects, facilitating the construction of millions of low-cost homes in cities across the developing world.
Nonetheless, the result in Parcelles Assainies cannot be described simply as gentrification. A visitor to the neighborhood in 2006 would have been hard pressed to describe it as rich, with some exceptions of relatively luxurious houses near the beach or in two or three of the unités , or units. Its sandy streets, lack of shade, and unfinished buildings hardly suggest a privileged environment, even for Dakar. Many Senegalese named other areas of the city as the quartiers of the rich; Parcelles Assainies was in a good location and a good place to live, but hardly rich. But the often half-finished appearance of buildings masks the sharp contrasts in the lives of the people inhabiting them. In some respects these households are house-poor, with homes that fail to provide an accurate picture of their socioeco-nomic status. Some individuals and families may be richer than the appearance of their unfinished home would suggest; others are poor and rent rooms in these buildings.
One three-story, unpainted cinder-block home, for example, consisted of an open courtyard on the ground floor, surrounded by individual rooms, where three women were washing clothes. On the second floor six baby goats occupied a half-finished room with straw on the floor. Yet across the hall was the room of a young man who had a computer, a printer, a compact disc player, and modern furniture. He worked for the municipality and had participated in the Social Forum in Pôrto Alegre, Bra-zil, in 2004. In this building that was home to illiterate mothers and their six chil-dren, with husbands working overseas, this young man suggested possibilities for upward mobility (a feeling well captured by Simone, 2004). Household members were quite articulate in asserting that Parcelles Assainies was much more desirable than many other neighborhoods of metropolitan Dakar.
15.2.2 Housing Investment
Regardless of the change in the demographic profile and income level of the popu-lation, the project proved the desirability of opportunities for housing investment. Indeed, despite the often dire economic straits of Senegal since 1972, households have continued to invest—although slowly, room by room, floor by floor—and have created a medium-size city of about 500,000 people. Some of this growth has been by necessity; families have grown, and people are too poor to move out. If the eco-nomic rate of return of the project was 19% in 1982, it was certainly much greater in 2006. Indeed, in an economy with so little investment capital, so little employment, and a great premium placed on location near downtown Dakar, it is surprising that more housing has not been built closer to the center of the city.
39315 Aid, Density, and Urban Form: Anticipating Dakar
15.2.3 Infrastructure and Environmental Services
Any visitor to Parcelles Assainies immediately sees the traffic-filled dirt streets con-necting and dividing the 26 unités . The streets are filled with mixed traffic: people, animals, cars, and cars rapides , or minibuses. A central market and peripheral mar-kets complement the many smaller grocery stores, and a wide range of goods and services, particularly construction materials, are available in the neighborhood. The high density of residential buildings has left little room for production of anything except clothing, furniture, and construction materials.
If the density of economic activity is a healthy indicator of neighborhood life, the quality of infrastructure is less so. The originally designed water supply system had provided for one water faucet for a hundred families—to keep costs affordable for eligible low-income households. However, the amount of service and the lack of individual household connections were problematic for the households living in the neighborhood. By the mid-1980s they began to lobby the public water company, and starting in the late 1980s private water connections were extended house by house throughout the neighborhood. This process was facilitated by the inflow of middle- and upper-income households into the area.
The quality of sewerage was and continues to be problematic, because the net-work built in the area had been designed with the assumption that it would serve a population of about 140,000. As noted, however, the density on the 300 built-up hectares is three to five times as great as had been anticipated. As a result, the capac-ity of the system is badly strained. Not surprisingly, there have been frequent leaks of untreated sewage. This problem has been particularly acute along the beach at Camberene, where the outfall of sewage into the Atlantic Ocean creates pollution and health problems.
While these problems are serious, they are less visible than the unpaved streets in most of Parcelles Assainies. Despite the high level of investment in individual housing units, the neighborhood looks poor because of the sandy streets. House-holds “make do” even as they seek ways to generate income and send their children to school.
15.2.4 Social Services
One of the most immediate negative consequences of the unplanned higher den-sity of the area is the lack of sufficient social services, specifically schools and clinics. There are only 22 public elementary schools for an elementary-school-age population of close to 87,000, with class sizes of around 80 students per class-room (Conteh, 2006, p. 6). Another glaring deficiency is that the area has only one public secondary school, with about 3,000 students and class sizes of around 70 students per classroom (Kone, 2005, p. 9). Any student wishing to continue at the secondary level must go to this public school or a large, nearby, expensive private school or travel to other parts of the city. Because of the crowded condition of pri-
394 M. Cohen
mary schools, 59 Islamic schools have also been established for the almost entirely Islamic population (p. 12).
Parcelles Assainies also lacks sufficient clinics. There are only nine small clinics and one hospital. This is very problematic for a population of between 350,000 and 500,000.
Both these shortfalls in services are reflected in the 1982 tables showing project expenditures. The data show that as delays and inflation consumed the public finan-cial resources available for the project, the components that were not fully funded were schools and clinics. Expenditures for schools amounted to only 131 million CFA francs (CFAF), although CFAF 508.3 million had been allocated at appraisal. Results for clinics were similar: only CFAF 19.1 million was spent, while CFAF 93.3 million had been allocated at appraisal (Tager, 1982, p. 20). These shortfalls are particularly noteworthy because the funds originally allocated to these facilities in the project design documents were already limited and probably insufficient.
15.2.5 Community Institutions and Organization
One of the most positive aspects of the consolidation of the neighborhood has been the proliferation of religious and community organizations. The project’s original intention was to promote self-help associations, through the Section d’Assistance aux Communautés (SAC) of OHLM, the executing agency. The SAC had helped in allocating plots and in resolving some settlement issues. Since the mid-1980s, however, there has been a growth of organizations within the unités of the project area.
One observer has noted that while public space was limited and many social services relatively neglected in project design, at least one mosque has been built in each of the 26 unités ; indeed, the neighborhood has 58 mosques altogether (Marusek, 2006). In contrast, there is one church. The vitality and importance of Islam in this neighborhood reflect its central social and economic roles in Senega-lese society. Administrative and real estate pressures had resulted in a reduction of the public space in Parcelles Assainies and the creation of more residential plots for sale. But religious and social pressures had nevertheless carved out spaces—often large spaces—for these important religious facilities.
Another notable feature has been the establishment of tontines , traditional wom-en’s savings cooperatives. Participating women contribute each week to a fund, and one of the women receives all the money to use for her own needs. Saving pays off over time for each member as her turn comes around and she receives the funds. Tontines have existed for many years in Senegalese communities. They immediately became important in Parcelles Assainies, helping to root the women and their households in the area. In addition to women’s savings cooperatives there are youth clubs, some supported by the communes, as well as other organizations. Indeed, Parcelles Assainies is known for its high level of organization, which gives the neighborhood a sense of stability and coherence.
39515 Aid, Density, and Urban Form: Anticipating Dakar
15.3 Conclusions: Density and Urban Form in Dakar
A look back at the parcelles assainies project points to several key conclusions:
• The sites and services project responded to a large unsatisfied demand for housing.
• Despite the difficulties in implementation and the consequent delays, the project has provided one of the largest—if not the largest—public sector housing solu-tion in Dakar.
• The sale of plots by the originally targeted low-income population to middle- and upper-income households reflected both the need for income by the poor and the lack of well-located housing market alternatives for wealthier Dakar house-holds. While a wider range of market alternatives were developed in the 1990s, the context of the project at its inception in 1972 was characterized largely by a few public housing projects and squatter settlements.
• The three- to fivefold increase in density, from an originally projected 350 peo-ple per hectare to between 1,000 and 1,700 per hectare, also reflects the lack of alternative housing solutions and serviced sites in metropolitan Dakar. Increased density was also found in a nearby area, Medina Gounass, one of the five dis-tricts of the commune Guediawaye, which had 1,045 people per hectare (World Bank, 2004, p. 16).
• The popularity of the Parcelles Assainies neighborhood also resulted from its location and relatively easier access to employment in central Dakar, in contrast to many bidonvilles farther from downtown.
• Increased density of the area also signals a shift from owner-occupied housing toward a growing market for rental housing.
• Increased density could thus be seen as an indicator of project success. The neigh-borhood, with traditional Senegalese large extended households, has accounted for about 15% of the Dakar population, assuming a metropolitan population approaching 3 million.
These observations about Parcelles Assainies only hint at the larger conceptual and policy problems of contextualizing the project within metropolitan Dakar. As the following points show, many other issues can be raised that have far greater significance for the urban economy and the Dakar metropolitan area.
Both the World Bank and the government explained the slow pace of implemen-tation by the project’s complexity and its scale. Both institutions concluded that the project was too big and too ambitious. Yet the increased density of Parcelles Assainies over time suggests that the project in fact was probably too small, given the context of growing effective demand. It further suggests that planners of urban housing and infrastructure projects in Senegal and other countries should consider a much longer time frame when anticipating future demand.
Delay and controversy frightened off both the Bank and the government from sites and services projects, eliminating from policy consideration what was prob-ably the only successful large-scale housing solution in Dakar over the past 35 years. Smaller projects with serviced sites have been carried out in the metropolitan
396 M. Cohen
area, but these have not made a large dent in the effective demand for shelter. The Bank’s urban program shifted largely toward supporting the government’s agenda of municipal decentralization, in Cap Vert and in the country as a whole, rather than explicitly focusing on housing, infrastructure, or land development. 1 This shift distanced the Bank from the policy debates about land use and the issue of urban form. The shift was justified by the Bank as a way to strengthen the institutional framework for urban management, an emphasis that the Bank and the government appear to regard as largely successful. As discussed below, however, this shift has resulted in tremendous economic and financial costs for families, for metropolitan Dakar, and for Senegal as a whole.
In place of sites and services, the government reverted to its old policy of subsi-dized apartments for the middle and upper classes, to the extent that public finance was available to cover the costs of subsidy. This policy was complemented by sup-port for scattered private investment projects that attracted remittances from abroad. The policy of forced eviction ( deguerpissement ), bulldozing of slums, and reloca-tion was continued until 1985, when large public demonstrations against it forced the government to stop (World Bank, 2002, p. 6).
This combination of policies led to continued rapid and extensive growth of squatter areas, or bidonvilles, lacking infrastructure services. By 2006 more than 60% of the metropolitan population lived in bidonvilles (World Bank, 2004). A 2004 study of 10 squatter settlements in Dakar showed that 82% of their population lived below the poverty line. Within these areas, the study showed, 65% of adults had not completed primary school or had no education, and primary school attend-ance was 67% (World Bank, 2004, p. 3).
This relatively uncontrolled urban sprawl has resulted in a costly urban form for Dakar, with low densities, long distances for the transport of people and goods, high energy and infrastructure costs, and a low level of productivity overall for the met-ropolitan economy. Dakar has experienced a form of sprawl with few advantages. Indeed, its location on a peninsula has meant that transport routes flow into a highly congested bottleneck, leading to losses in travel time and growing urban air pollu-tion. If the Bank and the government had understood the parcelles assainies project as successful, they might have continued a dialogue about the value of sites and services projects and more actively engaged with the issue of urban form, which has been relatively neglected.
The inefficiencies and externalities resulting from the inefficient urban form con-tribute to the negligible growth in urban employment in Dakar (Anas, Lee, & Oh, 1996). Low productivity in Dakar, which accounts for a large percentage of the GDP of Senegal, is not only an urban problem. The consequences of its urban form contrib-ute to macroeconomic problems (see e.g., Prud’homme, Huntzinger, & Kopp, 2004).
Moreover, urban form contributes to the growing inequalities in metropolitan Dakar and in Senegal as a whole. As noted in the World Bank’s (2003) Country Assistance Strategy Paper for Senegal:
1 One exception to this focus was a small sites and services component in a 1988 World Bank loan to Senegal.
39715 Aid, Density, and Urban Form: Anticipating Dakar
Senegal is two nations. One is approaching middle-income levels. It has access to middle class levels of education, public services, health care, housing, financial services, social protection, and urban amenities. The other—larger—nation exists near or below the pov-erty line. It is rural or lives in urban slums and is ill fed, ill clothed, ill housed, insecure, and uneducated. (p. 1)
This poverty and inequality are therefore very much conditioned by the low productivity of the urban share of the national economy. While macroeconomic performance is conditioned by many factors, including the global economy, the demand for groundnuts, and drought in rural areas, it is also highly dependent on urban demand and urban investment, both of which are related to the physical and spatial form of metropolitan Dakar.
To conclude, this analysis began with some questions about the significance of density in determining project outcomes and the “place” of the project in an urban area. Place does not refer simply to geographic location but also to the opportunities the project presents to a population with few alternatives in meeting basic needs for shelter and infrastructure. The Dakar case also suggests that density is not an abso-lute value but is highly relational, within urban space and within urban markets. How these densities affect and are affected by these wider contextual factors and processes deserves further attention not only in the design of international assist-ance to specific cities but also in future research.
Acknowledgments This chapter builds on the author’s experience working for the World Bank on the implementation but not the design of the Senegal sites and services—or parcelles assain-ies —project in the 1970s. The author visited Dakar for a week in June 2006. The chapter also ben-efits from the work of eight women graduate students from the Graduate Program in International Affairs of the New School University in New York, who initiated a study in January 2006 on the long-term impact of the project. The multinational team was led by Sarah Cooper and included Kathryn Aspaas, Amina Conteh, Makousse Kone, Sarah Marusek, Natalie Rodic, Sara Rowbot-tom, and Bonnie Vosu. Team members had access to dozens of World Bank and research docu-ments about the design, implementation, and evaluation of the project. They also visited the World Bank in April 2006 and met with staff working on Bank-assisted urban projects in Senegal. They worked in Dakar in June–July 2006 studying the project area, now the built-up neighborhood of Parcelles Assainies. A shorter version of this chapter was published in 2007 in Built Environment (33(2), 145–156).
References
Anas, A., Lee, K. S., & Oh, G.-T. (1996). Costs of infrastructure deficiencies in manufacturing in Indonesia, Nigeria, and Thailand. Policy Research Working Paper 1604. Washington, DC: World Bank.
Cohen, M. (1980). The Senegal sites and services project: A case study of project experience. Case study for the Economic Development Institute and UN-Habitat course Amélioration de l’habitat urbain: Conception et exécution des projets, Washington, DC.
Cohen, M. (1983). Learning by doing: World Bank lending for urban development, 1972–1982. Washington, DC: World Bank.
Cohen, M. (2001). Urban assistance and the material world: Learning by doing in the World Bank. Environment and Urbanization , 13 (1), 37–60.
398 M. Cohen
Conteh, A. (2006). Looking back: Parcelles Assainies, lessons in urban development. New York: New School University.
Davis, M. (2006). Planet of slums. London: Verso. Kone, M. (2005). Parcelles assainies: Education. New York: New School University. Marusek, S. (2006). Focus on Islam. Global Urban Studio West Africa Field Report. New York:
New School University, Graduate Program in International Affairs. Prud’homme, R., Huntzinger, H., & Kopp, P. (2004). Stronger municipalities for stronger cities in
Argentina. Report to the Inter-American Development Bank, Washington, DC. Simone, A. M. (2004). For the city yet to come: Changing African life in four cities. Durham, NC:
Duke University Press. Tager, C. (1982). Senegal sites and services project: Project Completion Report. Washington, DC:
World Bank. Turner, J. F. C., & Fichter, R. (Eds.). (1972). Freedom to build: Dweller control of the housing
process. New York: Macmillan. UN-Habitat (United Nations Human Settlements Programme). (2003). The challenge of slums:
Global report on human settlements 2003. London: Earthscan. UN Millennium Project. (2005). A home in the city. Task force on improving the lives of slum
dwellers. London: Earthscan. U.S. National Academy of Sciences. (2003). Cities transformed: Demographic change and its
implications in the developing world. Washington, DC: Author. Verniere, M. (1977). Dakar et son double Dagoudane Pikine. Volontarisme d’état et spontanéisme
populaire dans l’urbanisation du tiers-monde. Formation et évolution des banlieues dakar-oises. Le cas de Dagoudane Pikine. Paris: Bibliothèque Nationale.
World Bank. (1983). Senegal sites and services project: Project Completion Report. (Rep. No. 4768). Washington, DC: Author.
World Bank. (2002). Upgrading of low-income urban settlements: Country Assessment Report—Senegal. Washington, DC: Author.
World Bank. (2003). Senegal: Country Assistance Strategy Paper. (Rep. No. 25498-SE). Washington, DC: Author.
World Bank. (2004). Upgrading of low-income settlements in Sub-Saharan Africa: Assessing the impacts of formal and informal interventions. (Draft TF-024943). Washington, DC: Author.
399
Index
AAgence Foncière d’Habitation (AFH), 319Anti-Kelo property-rights initiatives, 351Apartheid effect, 5Asymmetric bargaining process, xxxi
BBangalore Development Authority (BDA)
development functions, 316reforms, 320
Bangalore Metropolitan Region DevelopmentAuthority Act, 316
Bank’s implicit model, 53Baseline model
developers, 230equilibrium parameter values, 234
housing quality, 233, 234resource availability, 235social welfare gain, 234steady-state values, 234, 236unit resource price, 234, 235
financial intermediary, 231government, 231households
Euler’s equations, 229housing quality, 228lifetime utility, 229
steady-state equilibriumdiscount factor, 232land per residence, 233loan requirement, 234model economy, 232–243optimum infrastructure, 233
Benefit-cost analysiscost ratio, 247, 248equilibrium level of quality, 248equilibrium utility, 248household social welfare, 248
total cost, 249welfare gain, 249
BNH. See National Housing BankBrazilian Institute of Geography and Statistics
(IBGE), 290Brazilian Savings and Loan System
(SBPE), 287, 288
CCanada Lands Company Limited (CLC), 318Capitalization, land regulation
land use restriction, xxivraised standards, xxv, xxviurban development limitations, xxv
CFA francs (CFAF), 394China, land use regulation
land allocation, 65land productivity, 63planning process, 63, 64transition economy, 64
CORENET, 377Cost-increasing intervention, 9, 10Credit access
impact evaluation, formalizationprograms, 119
potential effects, real propertyrights, 109, 110
DDakar
community institutions and organization,394, 395
demographic profilelow-income households, 391, 392population and density per
hectare, 390, 391sex ratio, 391socioeconomic status, 392
400 Index
density and urban formparcelles assainies project, 394, 395poverty and inequality, 396
housing investment, 392, 393infrastructure and environmental
services, 393residential density, 386, 387Senegal sites and services projectimplementation and reputation,
389, 390international aid agencies, 387, 388project design, 388two-pronged strategy, 389urban development project, 387slum improvement strategies, 385social services, 393, 394urban aid, 387
Data quality, developing countries, xxxiiDe jure tenure formalization, xxiDemocratic system, 76, 77Density regulation, 4, 5
EEconomic analysis, land use interventions
apartheid, 12, 13cost-increasing regulations, 10, 11diagrammatic approach, 5floor area ratio (FAR) restriction, 8, 9housing floor space, 7minimum floor area ratio, 11, 12population density, 13–15rural, urban migrants, 14urban growth boundary, 7
Economic developmentagglomeration benefits, 57elasticity of supply, 55inelastic market supply, 56, 57well-organized planning, 58
Economic impacts, land titlingaccess costs, 143, 144costs, 148, 149credit access
formal credit, 145institutional credit, 147solicited loans, 145, 146
employment, 147, 148household incomes, 147, 148housing and property investment, 141, 142labor mobility, 147, 148property values, 143, 144tax revenues, 150
Electronic Development Application (EDA)system, 377
Empresa Brasileira de Estudos do Patrimônio(EMBRAESP), 283
European Court of Human Rights, 341, 348,352, 357
Expropriationdiscontent
cultural aspects, 340impact, 341, 342infrastructure projects, 337, 338jurisprudence, 341legal technicality, 340, 341resettlement, 339, 340
driving forcesindependent judiciary, 350, 351international context, 351, 352landholding patterns, 350public opinion, 351social resistance, 349, 350
eminent domain power, 337, 338empirical analysis, 359institution of property, 359legal changes
international law, 347issues, 347land tenure reforms, 348, 349
legal issuesbundle of rights, 357, 358compensation, 354, 355concept, public interest, 353, 354contexts, eminent domain, 352, 353housing rights, 356population resettlement, 356
obstacles, land acquisition, 337policy changes
Asian economy, 344highly developed country, 345multilateral organizations, 346qualitative analysis, 344quantitative information,
government, 342reduced expropriation, 343, 344tendencies, policy orientation, 345urban development, Mexico, 342, 343
policy implications, 358, 359
FFinancial system, 126, 127Floor area ratios (FARs), xxvii, xxviii
economic analysis, 9, 10motivations, 19, 20quantitative evidence, 15, 16typology, 3, 4
Formal housing markets. See Housing conditi-ons and income distribution, São Paulo
Fundo de Garantia por Tempo de Serviço(FGTS), 288
401Index
GGovernment land use interventions
business productivity, 21economic analysis
apartheid, 12, 13cost-increasing regulations, 9, 10diagrammatic approach, 5floor area ratio (FAR) restriction, 8, 9housing floor space, 7minimum floor area ratio, 11, 12population density, 13, 14rural, urban migrants, 14, 15urban growth boundary, 7, 8
motivationsfloor area ratio limits, 19, 20policies, 20urban growth boundaries, 18, 19
quantitative evidenceand floor area ratio restrictions, 15, 16land use regulation, 16, 17regulatory indexes, 17urban growth boundaries, 15, 16
typologyapartheid effect, 5, 6bureaucratic control, developmentdecisions, 5cost-increasing regulations, 5floor area ratio restrictions, 4, 5residential location control, 6urban growth boundaries (UGB), 4
HHabitat Agenda, 101Homeownership probability
age and migration status, 270education, 272wealth, 270, 271
Housing conditions and incomedistribution, São Pauloaffordability
housing demand vs. supply, 296monthly income, loans, 297, 298
Brazilian housing finance system,287, 288
characteristics, housing industry, 300, 301data analysis, 283, 284developer behavior
profits, larger units, 299quantity vs. price, 298, 299urban development and loan
policy, 300inadequate housing, 285, 287information sources
family income, 289, 290
household income, 290, 291housing supply, 289
locational aspects, 300production volume
formal housing production, 292macroeconomic trends, 292, 293residential built area, 294
real estate finance system, 288sales price
average price per square meter,294–296
US dollar price, 295systematic information, 283
Housing Finance System (SFH), 260, 261Housing investments, 108Housing policy and tenure choice, Brazil
apartment blocks, social housing, 260data and methodology
adequate housing, 267categories, tenure status, 265descriptive statistics, 267, 268households, tenure status, 265, 266migrants account, 267urban sector types, 265variables, 266wealth proxy, 267
empirical models and resultsage and migration status, 270education, 272, 275, 278employment, 274formal and informal housing
markets, 273, 275housing tenure categories, 269IIA hypothesis, 268life-cycle variables, 273, 274location variables, 272, 273logit model, 269marital status, 270odds ratio, 271quasi-elasticity of age, 270, 271utility function, 268wealth quasi-elasticity, 271, 272
federal housing programs, 262, 263Growth Acceleration Program, 261household expenditures, 262, 264housing loans, 261income patterns, and development
levels, 253, 254income segments, 260, 261literature survey
housing demand, 256, 257housing strategies, 257informal housing submarkets, 258, 259informal settlement, 257location and affordability, 258
402 Index
log-linear and rent-buy models, 258maximum-likelihood probit model,
258rental housing, 259spatial segregation and racialdiscrimination, 255wealth and homeownership, 256
SFH-BNH system, 260, 261temporary camps, 260tenants law and rent control system, 260
Housing pricefloor area ratio restriction, 8, 9
UGB, 7, 8Human Sciences Research Council
(HSRC), 80
IIn situ tenure formalization, 124Informal neighborhoods
Buenos Aires Metropolitan Regionhousing conditions, 165–167infrastructure services, 172–176policy implications, 178–182welfare condition, households,
176–178Cuartel V, Municipality of Moreno
infrastructure services, 182low-income housing, 182socioeconomic characteristics,
184, 185tenure status, 185, 186tenure, market value, and investment,
186–188wealth deficit indicators, 184, 185
Informal rental markets, Nairobi’s slumsaffordability and rent burden
income and expenditure levels, 207–210
monthly per capita income, 208, 210monthly rent, 208transportation, 208, 209
factors, 196, 197housing, 199, 201informal housing market
building materials, 211crime and insecurity perception, 212electricity connection, 211, 212location dummy variables, 212multivariate regression analysis,
211, 212tenure security, 212, 213toilet and drainage facility, 212
infrastructure access and service deliverybudget-aggregate indicator, 208
electricity connection, 202infrastructure services hexagon,
200, 201national poverty alleviation
program, 200neighborhood-level sanitation,
203toilet facility, 203water supply, 201, 202
low-quality, high-cost trapgovernment investment, 217, 218Huruma settlement, 219infrastructure, 217, 218living condition improvement,
218tenure, 217
methodology, data, and householdenumeration areas (EAs), 193household disaggregation, 194slum residents profile, 195, 196slum residents proportion, 194
Millennium Development Goals, 191myth of low cost
cumulative plot of rent, 207, 208monthly rents, 205, 206
National Economic RecoveryStrategy, 191
neighborhood condition, 203rent regression model, 221, 222slum definition and mapping, 196–198suboptimal equilibrium, 192supply-side issues
entry barriers and disincentives,216
slumlords, 213, 214UN-Habitat report, 214
tenure, 198, 199Informal sector
demand shocks, population growth, 46democracy, 43free market, 40housing and public service profiles, 44–46land development fees payment, 42local public services, 38, 39migrants share, MCA, 47, 48rural, urban migrants, 36service provision, 46, 47squatter settlements, 36superstar municipios, 43, 44utility function, 39, 40vs. formal sector, 38wage function, 37zoning restrictions, 40
Informal settlements, households, 107, 108
403Index
Infrastructure servicesBuenos Aires Metropolitan Region
consolidation deficit indicator,174, 177
deficiency effects, 168, 169determinants, 167, 168expansion constraints, 167georeferenced information, 173natural gas network, 175paved streets, 176population and area, 174sewerage network, 175urban consolidation, 173water supply network, 175
Cuartel V, Municipality of Moreno, 182Institutes of pension and retirement (IAP)
funds, 260Investment Climate Assessment tool, 323
KKelo doctrine, 351Korea Land Development Corporation
(KLDC), 332Korean greenbelts, 4
LLabor market outcomes, 119, 120Land allocation policy, 126Land market effects, 109, 119Land ownership and management
asymmetric bargaining process, xxxipotential merits and risks, xxix, xxxRajack’s findings, xxxi, xxxiiresearch property, xxxiii
Land regulation effects, informalneighborhoodsCuartel V, Municipality of Moreno
low-income housing, 182socioeconomic characteristics,
184, 185tenure status, 185, 186tenure, market value, and investment,
186–188wealth deficit indicators, 183demographic dynamism, 165–170dwelling construction, 163, 164formal submarket, 163housing conditions, 165infrastructure services, 183
consolidation deficit indicator,173, 177
deficiency effects, 168, 169determinants, 167, 168expansion constraints, 167
georeferenced information, 173natural gas network, 176paved streets, 176population and area, 174sewerage network, 175urban consolidation, 173water supply network, 175
land tenurecensus methodology, 168households, 170, 171irregular tenure, 170occupancy, 169progressive housing improvements, 170
policy implicationsconsolidation and wealth deficits,
178, 180critical and intervention areas,
181, 182high-density neighborhoods, 181local community participation, 182metropolitan vision, 181, 182socioeconomic characteristics, 181
urbanization parameters, 164welfare condition, households
correlation, 178, 179indicator, 177, 178population and area, 178, 179
Land rights allocationeconomic implications, xxiformalization, xxihigher property values and transactions,
xxii, xxiiiinformal and insecure tenure, xxi, xxiipreexisting distortions, xxii
Land tenure rights continuum, 102, 103Land titling programs
administrative impacts, 151–153building and environmental impacts,
150, 151Commission on Legal Empowerment of
the Poor (CLEP), 134contextual factors, 137economic impacts
costs, 148, 149credit access, 144, 147household incomes, employment, andlabor mobility, 147, 148housing and property investment,
141–143property values and costs of access,
143, 144tax revenues, 150
efficiency and equity objectives, 121focus and scope, 136
404 Index
impact on demand, 155, 156institutional impacts, 154land management systems, 156landownership pattern, 123legal impacts, 154, 155merits and limitations, 135, 136methodological issues, 137neocustomary tenure, 123, 124political impacts, 155pragmatic and incremental approach, 157property rights approach, 123social and economic development, 157social impacts
gender, 139gentrification, 140, 141health, education, and fertility,
139, 140residential mobility, 140, 141social status, integration, andinclusiveness, 139spatial integration, 140, 141tenure security, 138, 139
sources used, 137, 138tenure regularization, 122World Bank policy, 134
Land use planning system, 58, 59Land use regulation
Bank’s implicit model, 53beneficial regulation, 54capitalization
land use restriction, xxivraised standards, xxv, xxviurban development limitations, xxv
Chinaland allocation, 65land productivity, 63planning process, 63, 64transition economy, 65
developed economiesagglomeration benefits, 57elasticity of supply, 55inelastic market supply, 56, 57well-organized planning, 58
implications, 66, 67market deregulation politics, xxvii, xxviiimarket failures and interventions, 52measurement challenges and policy
priorities, xxvipostsocialist cities
broad planning framework, 61economic and social transformation,
60land management systems, 62service development, 62, 63
regulatory and allocation systems, 52taxation, 55United Kingdom
affordable housing, 59land use planning, 58, 59legislation, 60market supply elasticity, 58
MMarket distortions, South Africa
definition, 71housing allocation
informal settlement, 77, 78mixed-income developments, 78state housing program, 78, 79
naïve assumption, 72private sector activity, 71, 72
Master development plan, Singaporebusiness zoning system, 372, 373development guide plans, 373, 374place-based planning, 371, 372public, private partnership, 372
NNational Housing Bank, 287National Housing Bank (BNH), 260, 261National Land Agency (BPN), 314Neocustomary tenure, 123, 124North American Free Trade Agreement,
348
OOffice des Habitations à Loyer Modéré
(OHLM), 387Origin-Destination Survey, 290
PParcelles assainies project. See DakarPlanning Act Cap 236, 368, 387Postsocialist cities, land use regulation
broad planning framework, 61economic and social transformation, 60land management systems, 62service development, 62, 63
Poverty alleviation argumentcomplex commodity, 86, 87economic growth, 86filtering phenomenon, residential, 85, 86flashier strategy, 85land redistribution, 86land restitution process, 85tenure regularisation programme, 86
Preexisting distortions, slum upgrading
405Index
programscredit constraints
effect, 245, 246supply-side bottlenecks, 244
land supply constraintbenefit-cost ratio, 241binding constraints, 240building quality, 241, 242building-distance relationship, 242infrastructure-distance relationship,
243social welfare gain, 243, 244
Property Rates Act, 83Public land management, xxix
decentralizationcentral guidance, 315, 316centralized function, 312, 314functional duplication, Indonesia, 315human and financial resourcecapacity, 315, 316land boards, Botswana, 314, 315
effectsasset management perspective,
317, 318production function perspective,
318, 319transaction costs vs. developmentoutputs, 319–321
land market imperfections, 304land market outcomes, global empirical
insightscontiguity index, built development,
329, 330data sources, 322, 323distribution of cities, 324, 325econometric methods, 321encroachment effects, 330house price to income ratio,
328, 329indexes, 323, 324land access constraint, 330–332shelter price inflation, 328
land withholdingconsequences, 307, 308land banking, 308
public ownership effect, 305, 306public vs. private developer competition,
316, 317salient features, 331, 332state intervention, 306, 307transaction costs
capacity, 311, 312convoluted procedures, 309
incentive frameworks, public land
officials, 310institutional reforms, 312, 313interagency coordination, 310statutory provisions, public
expenditure, 310, 311Public Officers Working to Eliminate Red
Tape (POWER) scheme, 378Public transportation, 47
QQuality assessment
factors, 196, 197housing, 199, 200infrastructure accessbudget-aggregate indicator, 200electricity connection, 201, 202infrastructure services hexagon,
200, 201national poverty alleviation
program, 200neighborhood-level sanitation,
203, 204toilet facility, 203water supply, 201, 202Living conditions diamond, 196neighborhood condition, 203service delivery, see infrastructure accessslum definition and mapping, 196, 197tenure, 198, 199
RRajack’s findings, xxxi, xxxiiRental Leasing Program (PAR), 262Research priorities
data quality, developing countries, xxxiiland management, xxxiiiland-based revenues, xxxiv, xxxvregulation costs, fragmented markets,
xxxii, xxxiiiResidential filtering phenomenon, 86, 87Residential land market regulations
building height restriction, 27direct calculations, price, 31, 32exclusionary zoning, 28, 29health and environmental standards, 27housing prices, 29, 30informal sector
demand shocks, population growth, 46democracy, 43free market, 40housing and public service profiles,
45, 46land development fees payment, 42local public services, 38, 39
406 Index
migrants share, MCA, 47, 48rural, urban migrants, 37service provision, 47, 48squatter settlements, 37superstar municipios, 43, 44utility function, 40–42vs. formal sector, 39wage function, 38zoning restrictions, 40
land use planning, 33prices and supply elasticities
demand shocks response, 35, 36effects modeling, 33, 34housing demand, 32housing supply, 32, 33regulation index, 34short- and long-run effects, 35spillover effects, 35
superstar cities, 30, 31Tiebout model, 28
Rural, urban migrants, 36
SSample microdata tabulation, 290São Paulo State Statistical Office
(SEADE), 294Section d’Assistance aux Communautés
(SAC), 394Security premium approach, 118, 119Singapore urban planning
assessment systemappeal rights, 380minister approval, 379, 380planning application, 378, 379
British planning system, 364challenges, 382, 383contradictions, 381, 382country profile, 363deliberate urbanization, 364, 365development control
definition, 367, 368development applications, 375, 376Electronic Development Application
(EDA) system, 377guidelines, 378instant planning approval, 377, 378outline application and permission,
376, 377planning rules, 368, 369simplified planning approval system,
376development plan
concept plan, 370, 371land use control, 369, 370master plan, 371, 372
role, 369sectoral planning coordination,
370, 371enforcement notice, 380land allocation control, 364self-regulation, 378, 379socioeconomic crisis, 365survey-analysis-plan, 367Urban Redevelopment Authority (URA)
functions, 365, 366plans, 366, 367
Sistema Financeiro Imobiliário (SFI), 288Slum rental market
affordability and rent burdenincome and expenditure levels, 207,
209–211monthly per capita income, 208, 210monthly rent, 208transportation, 208, 209
informal housing marketbuilding materials, 211crime and insecurity perception, 212electricity connection, 211, 212location dummy variables, 212multivariate regression analysis,
211, 212tenure security, 213, 214toilet and drainage facility, 211
myth of low costcumulative plot of rent, 206, 207monthly rents, 205, 206
supply-side issuesentry barriers and disincentives,
216slumlords, 216UN-Habitat report, 214
Slum upgrading programsbaseline model
developers, 230, 231equilibrium parameter values, 234–236financial intermediary, 231government, 231households, 228–230steady-state equilibrium, 232–234
benefit-cost analysiscost ratio, 248, 249
equilibrium level of quality, 249equilibrium utility, 248household social welfare, 248total cost, 249welfare gain, 249
credit constraintseffect, 245, 246supply-side bottlenecks, 244
decision-making agents, 227
407Index
ex ante cost-benefit estimation, 226in situ upgrading
infrastructure-land relationship,238, 239
public intervention, 236quality equivalence scale, 237social welfare gain, 237, 238
land supply constraintbenefit-cost ratio, 241binding constraints, 240building quality, 241, 242building-distance relationship, 242infrastructure-distance relationship,
244social welfare gain, 240
national housing policy, 227relocation strategy
infrastructure facilities, 239, 240resource requirements, 239, 240social benefit-cost ratios, 239, 240
slum formation, 225substandard residential units, 236
Social impacts, land titlinggender, 139gentrification, 140, 141health, education, and fertility, 140residential mobility, 140, 141social status, integration, andinclusiveness, 139spatial integration, 140, 141tenure security, 138
Social justice argument, 84, 85Socio-economic transformation, 81South African land markets
agenda for change, 90, 91democracy, 76, 77economy
government housing, 80modern economy, 80socio-economic transformation, 81
historyformal regulation, 75homeland areas, 74ownership, 75, 76
market failureslack of information, 82, 83Property Rates Act, 83regulatory systems, 82value capture process, 83, 84
naïve assumption, 72peripheral settlements, 90, 91poverty alleviation argument
complex commodity, 87economic growth, 87flashier strategy, 85
land redistribution, 86land restitution process, 85residential filtering phenomenon,
85, 86tenure regularisation programme, 87
property sector transformation charter, 92recent market distortions, housing
allocationinformal settlement, 76, 77mixed-income developments, 78state housing program, 78, 79
social justice argument, 84, 85state and market allocation, 89, 90urban efficiency argument, 87, 88
Squatter settlements, 104, 105
TTax price, 38Tenure formalization, developing countries
access to credit, 119community ownership and group titling,
125definitions
administrative recognition, occupancyrights, 106bundle of rights, 102–104informality, 102–105land titling, 108security and status, 105
effectsbuilt environment, 120health, education, and fertility, 120infrastructure, 120service provision, 120
financial system, 126, 127formalization programs review, 127Habitat Agenda, 102incremental process, 124land decentralization, 125land market efficiency, 127land titling
efficiency and equity objectives, 122landownership pattern, 123neocustomary tenure, 127property rights approach, 122tenure regularization, 122
legal and regulatory frameworks, 123methodological issues
controlled experiments, 116differences technique, 117natural experiments, 116, 117nonrandomized evaluations, 118security measurement, 118selection bias, 115, 116
policies, justifications, 111
408 Index
potential effectsde facto recognition, 106, 107eviction probability, 109housing investments, 109labor market outcomes, 108real property rights, 109, 110
security premium approach, 118, 119tools development, operation, 128types
diversity, programs, 112–114funding agencies, 111tenure regularization, 112
Tenure regularisation programme, 87Tiebout model, 28Titling, xxiiiTontines, 394Town and Country Planning Act 1947,
364–367Transaction costs
convoluted procedures, 309development outputs
Bangalore Development Authority(BDA), 320
land pooling projects, Nepal, 321land privatization, Russian Federation,
320, 321Trinidad documented institutional
reforms, 320incentive frameworks, public land
officials, 311institutional reforms, 312, 313interagency coordination, 310public land management capacity,
311, 312statutory provisions, public expenditure,
310Tribal Lands Act, 314
UUS Agency for International Development
(USAID), 339United Kingdom, land use regulation
affordable housing, 59land use planning, 58, 59legislation, 60market supply elasticity, 58
Urban efficiency argument, 87, 88Urban growth boundaries (UGB)
economic analysis, 7–9motivations, 19, 20quantitative evidence, 16, 17typology, 4
Urban Growth Management Initiative,323
Urban Land (Ceiling and Regulation) Act,317
Urban Redevelopment Authority (URA)functions, 365, 366plans, 369, 370
V Villagization, 339
W Welfare impacts, xxiiWorld Development Report 2009, xx
ZZoning regulations, 5


