Embed Size (px)
Citation preview

Philip M. Sargent'
Use of the Indentation Size Effect on Microhardness for Materials Characterization
REFERENCE, Sargent. P. M., "Use of the Indentation Size Effect on Microhardness for Materials Characterization," Microindentation Techniques in Materials Science and En-gineering. ASTM STP 889, P. J. Blau and B. R. Lawn, Eds., American Society for Test-ing and Materials, Philadelphia, 1985. pp. 43030-000- 22.5--24,
ABSTRACT: This paper describes several different physicochemical mechanisms that produce an indentation size effect on microhardness. The mechanisms are illustrated with reference to published data. A simple quantitative model for surface layer effects is pre-sented, and its relevance to chemomechanical effects on ceramics is discussed.
A well-behaved empirical function describing some indentation size effects is intro-duced, and its advantages are discussed. It is used in a new method of graphically present-ing microhardness data which is presented here for the first time. This "error-ellipsoid" diagram not only is visually compact and statistically rigorous but is based on a new physi-cally meaningful parameter, the "10-pm hardness."
KEY WORDS, hardness, indentation, microhardness, microindentation, surface layers, surface plasticity, chemomechanical effects, indentation size effect (ISE), Meyer index, microindentation hardness testing
A great many interrelationships between cooperative and competing pro-cesses occur in a solid when it is indented. Figure 1 attempts to show all the causal relationships between these effects. This paper is concerned with only the subset of these processes that control the variations in measured micro-hardness values which occur when indentations are made using different loads. All of these processes are shown in the relevant part of Fig. 1 and will be discussed separately, and their independent existence will be demon-strated using examples from the published literature. The principal mecha-nisms causing these variations are those of microstructure size and the thick-ness of environmentally affected layers or superficial films. Since these have
' Research assistant. Department of Engineering. University of Cambridge, Cambridge CB2 IFYL, England.

SARGENT ON INDENTATION SIZE EFFECT ON MICROHARDNESS 161

162 MICROINDENTATION TECHNIQUES IN MATERIALS SCIENCE
characteristic dimensiOns, the hardness variations are best termed indenta-tion size effects (ISE) and not load effects.
Indentation Size Effects
For conical and pyramidal indenters, indentations of different sizes are, to a first approximation, geometrically similar, and so hardness should be inde-pendent of indentation size. This is generally true for large indentations but not for indentations less than about 10 pm deep. A number of mechanisms contribute to the variation of microhardness with indentation size, and since there is no good physical model for any of them on which a quantitative de-scription of ISE can be based, this paper uses an empirical ISE index defined only in terms of the directly measured quantities of force on the indenter (the load) and the diameter of the indentation produced
a F/F n —
where n is the ISE index and is a dimensionless, normalized parameter de-scribing the shape of the curve of one experimental parameter plotted against the other. This index has been measured to vary between 1.5 for copper with a work-hardened surface layer [1] and 4.0 for lead telluride (PbTe) [2]. A value of 2.0 means that there is no size effect and that hardness is independent of indentation size, for microindentations, this is the exception rather than the rule. This ISE index describes the change in equilibrium stress around inden-tations of the same shape but of different sizes. It should be distinguished from the Meyer index, which is derived only for the case in which a ball in-denter is used and the indentations are different in both size and shape.
Small indentations can most obviously measure different hardnesses from large indentations if there is a superficial layer of another substance, for ex-ample, oxide film in air, contaminant carbon film in oil-pumped vacuum sys-tems, or preferential surface segregation of one component in an alloy. A sim-ilar effect occurs if the surface of the solid has a different mechanical behavior from that of the bulk, even when it has the same composition. This is espe-cially important in insulators and semiconductors, in which the effects of sur-face electronic states and space charge penetrate much more deeply than they do in electronic conductors 13-51. Dislocations in nonconducting materials commonly carry charged jogs, and so the density of chargeearriers and the band bending near the surface affect the plasticity. This is the major cause of chemomechanical and optomechanical effects.
The second class of phenomena which can cause indentation size effects are those connected with the finite size of the "deformation carriers" (usually dis-locations in crystalline materials, but also shear bands in some glasses) and of the microstructure and the indentations themselves. Mott [6] hypothesized
a d/d (1)

SARGENT ON INDENTATION SIZE EFFECT ON MICROHARDNESS 163
that smaller indentations would require dislocation slip bands to be more closely spaced than would large indentations, and thus the flow stress for these finer bands would be higher. This is in accordance with most experi-mental observations that smaller indentations measure a higher hardness (which means that ISE indices are less than 2.0).
Figure 2 (top) illustrates how surface layers and microstructural features interact with an indentation. In the layer case, very small indentations mea-sure only the hardness of the surface, and very large indentations are domi-nated by bulk interactions and measure only the hardness of the underlying material. For intermediate-sized indentations, the measured hardness de-pends on the size of the indentation in a smooth, monotonic manner (Fig. 2 bottom! right).
The lower part of the top of Fig. 2 shows diagrammatically how microstruc-tural features influence mechanical behavior within a particular radius (shown as circles on the figure). Large indentations interact with a large num-ber of features (whether they be grain boundaries, dislocation loops, precipi-tates, or regions of slightly different amorphous structure in a metallic glass). The statistical nature of the expected interaction is shown in Fig. 2 (bottom,
LAyER EFFECTS
MICROSTRUCTURE EFFECTS
H H
SOFT d 4 HARD
SOFT d 4 HARD m4TRIX COMPOSITE
LAYER SUBSTRATE
- • - FIG. 2—The expected effects of surface layers and microstructure on the relationship between
indentation size and measured hardness: (lop) Vickers indentations showing the sampling effect of layers and discrete microstructural elements: (bottom) what this implies for the measured hardneis and the experimental scatter of individual measurements (the shaded areas).

164 MICROINDENTATION TECHNIQUES IN MATERIALS SCIENCE
left), which shows a great deal of scatter (in the shaded area) in the transition between small indentations which measure the hardness of a pure matrix ma-terial and large indentations which "see" a harder composite material.
Layer effects need not be due to different superficially applied materials; different dominant plasticity mechanisms near the surfaces will also have such an effect. For example, the operation of image forces on dislocations, charge double layers in semiconductors and insulators, optomechanical ef-fects, and dislocation etch-pit dragging in solvents will all affect behavior in the top micrometre or so of a material.
A Simple Single-Layer Model
A very simplified model of layer behavior has been devised and its proper-ties investigated quantitatively, the results being expressed in terms of n, the ISE index [I]. The model bulk material has a hardness, H2, and is covered with a layer of thickness, L, and hardness, HI . This single-layer situation is a major simplification; no gradual change in hardness between the layers is as-sumed, nor are any criteria of strain compatibility across the interface taken into consideration.
A Vickers indentation is assumed (in this model) to measure only the hard-ness of a hemispherical volume centered at the original surface (before inden-tation), with a diameter equal to the diagonal length of the indentation. Within this hemisphere is the pyramidal space, in which the indenter pene-trates, and two volumes: VI of bulk material and V2 of surface material (the effects of elastic compression and surface pileup are ignored, and the layer is assumed to be the same thickness everywhere). The measured hardness is cal-culated by a simple law of mixtures
H — HI V, ± H 2 V2
+ V2 (2)
These simplifications have been made in order to reduce the number of pa-rameters in the model; the form of the load/indentation size relationship and the quality of the data available are such that almost any function with more than two parameters can be made to fit. This model has only two parameters, H, and H2. The ratio, lid, of layer thickness to indentation diagonal varies over a range such that at one extreme the hemisphere is entirely contained within the layer and at the other the effect of the layer is negligible.
The model allows an estimate to be made of the variation of hardness with indentation size using the ISE index equation and the formula for calculating the hardness pressure, H, from Vickers indentations. All the hardnesses pre-sented in this paper are calculated from the load divided by the projected area of the indentation and expressed in gigapascals. This is different by a geometric factor of 1.0785, and by a unit conversion factor of 1.0194 X 10 '4,
SARGENT ON INDENTATION SIZE EFFECT ON MICROHARDNESS 165
from Vickers pyramid numbers (VPN), which are calculated from the surface area and expressed in kilograms force per square millimetre (1000 kgf • mm -2 is 9.81 GPa). The projected area method is used so that compari-son can be made with Knoop and ball hardness measurements.
1854.4 • load VPN —
diagonal2 kgf • mm –2 (3)
where the load is in kilograms force and the diagonal is in micrometres. A
2000.0 • load H —
GPa (4) diagonal2
where the load is in Newtons and the diagonal in micrometres (the factor 2.0 arises because the indentation area is half the square of the diagonal length).
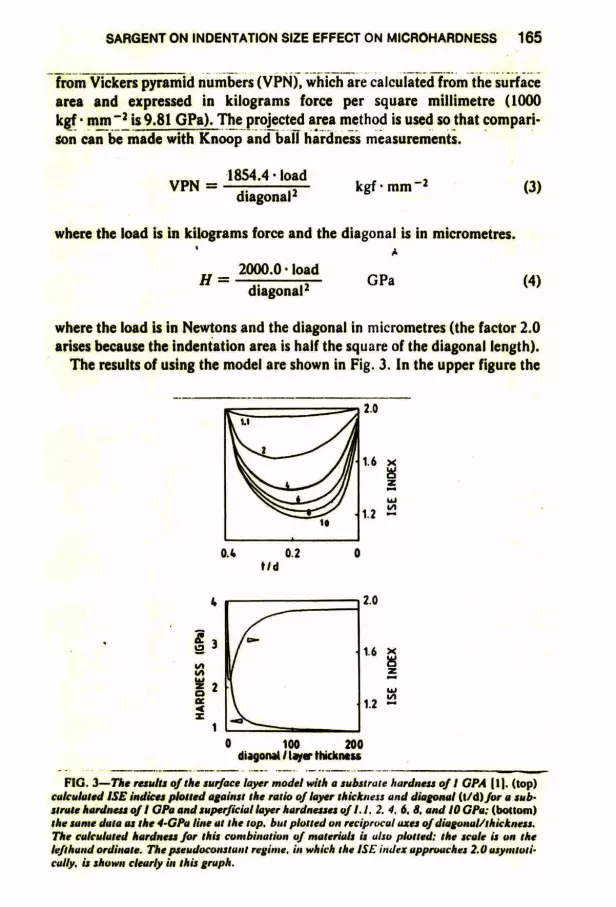
The results of using the model are shown in Fig. 3. In the upper figure the
2.0
0.4 0.2
0 1/d
1.6 x z z
2.0
1.2 •-•
0 100 200 diagonal /layer thickness
-- -- FIG. 3—The results of the surface layer model with a substrate hardness of I GPA I II. (top)
calculated ISE indices plotted against the ratio of layer thickness and diagonal (t/d)for a sub-strate hardness of I GPa and superficial layer hardnesses of 1.1. 2. 4. 6. 8. and 10 GPa: (bottom) the same data as the 4-GPa line at the top. but plotted on reciprocal axes of diagonal/thickness. The calculated hardness for this combination of materials is also plotted: the scale is un the left hand ordinate. The pseudoconstant regime, in which the ISE index approaches 2.0 asynototi-cally. is shown clearly in this graph.

166 MICROINDENTATION TECHNIQUES IN MATERIALS SCIENCE
bulk hardness was set to 1 GPa, and the layer hardness was set to the value marked on each of the curves. The lower figure plots both the prediction of the ISE index, n, and the hardness prediction for the case in which the bulk is 1 GPa and the surface 4 GPa, but with the abscissa the reciprocal of the upper figure.
If experimental data for magnesium oxide (MgO) single crystals are com-pared with the predictions of the model, a rough fit may be obtained if a layer 0.05 to 1.2 Am thick, with a hardness of 14 GPa, is assumed to exist [/1. With such a crude model, the values cannot be more than an estimate, but space charge effects are thought to influence the top 1 Am [2].
The model shows that the ISE is more severe (that is, further from a value of 2.0) when the hardness of the layer and the bulk diverge and that, as the indentation.size becomes markedly different from the layer thickness, the ISE index does approach 2.0 as expected. It is interesting that the lower figure shows that only a very thin layer has a strong effect on hardness and the ISE index and that as the indentations become very much larger than the thick-ness of the layer, there is still an effect on hardness, and n approaches 2.0 only asymtotically. The fact that is is roughly constant (about 1.96 for this model) over a wide range of indentation sizes in this region means that the ISE index equation fits well here. The value of the index is roughly similar to that found by Burnand for a very large number of inorganic single crystals. Burnand made an extensive review of published ISE indicies and found that they clus-tered about 1.8 to 1.9; he interpreted this as a fundamental property of the microhardness test [7]. On the basis of the model, it is proposed that this effect is due to measurements being made in the asymtotic regime for crystals whose surfaces are harder than the bulk because of surface-specific effects on plasticity. However, this can be only one influence; Fig. 1 shows that many other effects may be responsible.
Burnett and Page have since extended this model to describe the case of a soft amorphous layer on a hard crystalline substrate which has its own intrin-sic indentation size effect from other causes 18,91. Such a model describes relationships in which a peak occurs in the measured hardness at some parti-cular indentation size, but it is not the only applicable model for this relatively common experimental result [10]. Figure 4 shows diagrammatically how a combination of size effects from grain size and from some other mechanism (for example, surface layers or work hardening) can lead to a hardness peak. The transition from single-crystal to polycrystal behavior occurs when inden-tations and grains are about the same size, so that for specimens with differ-ent grain size the peak will probably be displaced, and for ductile metals the hardness would tend to be higher for the finer-grained material because of the effect of grain size on yield stress and work hardening.
Figure 5 shows the experimental data from Raghuram et al [Ln for single-crystal niobium in which the presence of a peak indicates the presence of two size effect mechanisms. However, for a single crystal no grain size effect ex-

GRAIN SIZES: 3, )3,)3.
POLYCRYSTALS
-------------- SINGLE CRYSTAL
Ha
r dn
ess
(CIP
a)
SARGENT ON INDENTATION SIZE EFFECT ON MICROHARDNESS 167
H
S 9. 9)
FIG. 4—The expected effects of indentation sizes. similar to a material's grain size. in which the material is also subject to indentation size effects from other causes.
10
20
30
DIagon•l (microns)
FIG. 5—Data from Ref II replotted to show similarity with part of Fig. 4.
ists, no chemomechanical effects or layers are expected, and surface or "Mott-model" work hardening would lead to a hardening and not a soften-ing. In this case, the geometry of dislocation rosettes around indentations may have led to some dislocation-loop size effect with interactions with the production of crystallographically orientated pileups.
Examples of Indentation Size Effects
Figure 6 shows the more usual results from single crystals with an ISE in-dex between 1.8 and 2.0 [12], for materials of the same isomechanical class [131. Although these are very similar solids, they have been indented under


