Embed Size (px)
Citation preview
Available online at www.sciencedirect.com
Technologies 9 (2008) 385–395www.elsevier.com/locate/ifset
Innovative Food Science and Emerging
Use of Time Temperature Integrators for determining process uniformityin agitated vessels
K. Mehauden, S. Bakalis, P.W. Cox, P.J. Fryer ⁎, M.J.H. Simmons
Centre for Formulation Engineering, Department of Chemical Engineering, University of Birmingham, Birmingham, B15 2TT, United Kingdom
Received 13 July 2007; accepted 25 October 2007
Abstract
Time Temperature Integrators (TTIs) were used to investigate the process uniformity of an industrial scale 250 l agitated vessel. Factors such asfluid viscosity, fill level and direct and indirect heating have been examined. Different numbers of TTIs were added throughout each experiment andtemperature was recorded using 2 thermocouples: one fixed in the centre and one on the wall of the vessel. TTIs were added at the start of theexperiment and also at the end of the heat up time. Novel designs of TTI fitted inside either porous plastic balls or a series of plastic tie clips to preventover-processing due to contact with the hot vessel wall were also used. P values recorded by the TTIs illustrated significant heterogeneity of heatingfor viscous fluids which could be partly overcome by steam injection. Overfilling also affected the heating efficiency, possibly due to changes in theflow field. The use of the novel TTIs enabledmore accurate determination of the thermal processing of the fluid away from the vessel wall. This paperdemonstrates that TTIs can be used for thermal monitoring and validation of processes in the food industry (centre and wall) which is morerepresentative.© 2007 Elsevier Ltd. All rights reserved.
Keywords: Time Temperature Integrators; Large agitated vessel; Thermal processing; Thermocouple
Industrial relevance: Time Temperature Integrators (TTIs) are potentially very valuable tools for the measurement and validation of thermalprocesses. This paper gives an example application of such a safety/quality tool which could be used to improve design by demonstrating processuniformity under real conditions.
1. Introduction
In the food industry, heating and mixing of food is oftenperformed simultaneously. Ostensibly, these processes seemvery easy to evaluate, however, fluids commonly encounteredin food processing routinely possess complex rheology, withvery high apparent viscosity and often contain a high volumefraction of particulates. In this case, it is very difficult toevaluate the efficiency of the process, since it is essential thateach phase receives the minimum heat treatment to ensuresafety. Large numbers of food factories are concerned with thisproblem and utilise the expertise of equipment manufacturers toensure proven heat treatment and safe products which do not
⁎ Corresponding author.E-mail address: [email protected] (P.J. Fryer).
1466-8564/$ - see front matter © 2007 Elsevier Ltd. All rights reserved.doi:10.1016/j.ifset.2007.10.006
harm the consumer. Safety concerns often lead to food productsbeing over-processed, with consequent loss of product quality.
Heat treatment efficiency can be evaluated from the de-struction of the micro-organisms initially present before heattreatment. At constant temperature T, the death of micro-organisms can be described using (Ball & Olson, 1957)
Nfinal
Ninitial¼ 10�t=DT ; ð1Þ
where Ninitial and Nfinal are the initial and final number of micro-organisms present, t is the duration of the heat treatment and DT
is the Decimal reduction time necessary to reduce the number ofmicro-organisms by 90% at a given temperature, T. The valueof DT depends on the type of micro-organism and physical–chemical properties of its environment (pH, ionic strength.)(Valentas, Rotstein, & Singh, 1997).
386 K. Mehauden et al. / Innovative Food Science and Emerging Technologies 9 (2008) 385–395
Any thermal process considers quality and safety of theproduct. Excessive heat treatment, while ensuring safety, reducesproduct quality attributes such as flavour and texture (Lewis &Heppell, 2000). Eq. (2) below can compare different thermalprocesses
F orPð Þ ¼ DT refð Þd logNinitial
Nfinal
� �; ð2Þ
where F and P are the process values (F for sterilisation and P forpasteurisation). To calculate the process value, the organismshould follow the thermal death time model (Bigelow, 1921;Guiavarc'h, Zuber, Van Loey, & Hendrickx, 2005). P and F canalso be calculated from the time temperature history of the product(Ball & Olson, 1957; Hendrickx et al., 1995)
P orF ¼Z t
010
T tð Þ�Trefz d dt; ð3Þ
where T(t) is the product temperature (°C), Tref is the referencetemperature for the DT value (°C), t is the process time (min) andthe z is the change in temperature in degrees Celsius needed tobring about a ten-fold change in DT. The z value represents thetemperature sensitivity of destruction rate of the micro-organism(Hendrickx et al., 1995; Richardson, 2001).
The time temperature history can be obtained from thermo-couples or any type of sensor which records temperature as afunction of time. This history can then be translated into anequivalent time at a reference temperature using the P or F value(Eq. (3)). Thismeasurement technique is very easy to apply and thedata analysis is relatively fast and easy. However, thermocouplesare not convenient for every type of thermal process. In some cases,they can interfere with the movement of the food fluid and lead toan incorrect time temperature history being recorded. Moreover,their large size is an issue, and they can be placed in locationswhichare not representative of the vessel conditions, such as local ‘cold’or ‘hot spots’(Hendrickx et al., 1995; Marra & Romano, 2003).
The Time Temperature Integrators (TTIs) can be used as analternative to conventional temperature probes (Van Loey,Hendrickx, De Cordt, Haentjens, & Tobback, 1996a). TTIs areparticles that contain thermally labile species which undergoirreversible changes during passage through a thermal process(Guiavarc'h et al., 2005; Hendrickx, Weng, Maesmans, &Tobback, 1992; Hendrickx et al., 1995; Taoukis & Labuza, 1989;Tucker &Holdsworth, 1991; Van Loey et al., 1996a). Compared tothermocouples, TTIs are small, can be made neutrally buoyant andcan be manufactured from materials with the same thermalconductivity as food particles (Van Loey, Hendrickx, Smout,Haentjens, &Tobback, 1996b). The time temperature history of theproduct is not needed to determine the impact of thermal treatmentswhen detailed kinetic information is available (Guiavarc'h et al.,2005; Hendrickx et al., 1995; Van Loey et al., 1996a).
Different substances can be encapsulated inside TTIs.Microbiological TTIs are based on the quantification of thedestruction of a target micro-organism. However, this techniqueis time consuming and requires trained personnel to carry outthe analysis. Chemical and physical TTIs are based on the
detection of a change in a physical or chemical property.Enzymatic TTIs, the focus of this study, are based on the quan-tification of enzyme activity after thermal treatment. The impactof the treatment is revealed by the amount of remaining activity.Enzymes possess a relatively high thermostability allowingthem to be used at a wide range of temperatures (Guiavarc'h,Deli, Van Loey, & Hendrickx, 2002a; Guiavarc'h, Van Loey,Zuber, & Hendrickx, 2004b; Guiavarc'h, Van Loey, Zuber, &Hendrickx, 2004a; Maesmans et al., 1994; Tucker, 1999; VanLoey, Arthawn, Hendrickx, Haentjens, & Tobback, 1997).Analysis is relatively straightforward and does not requirespecialist analytical skills or equipment which makes it suitablefor regular application in industry. Compared to microbiologi-cal, chemical or physical TTIs, the enzymatic TTI is mostsuitable for further development (Van Loey et al., 1996a). Foran enzyme to be suitable for use in a TTI, its denaturation byheating must follow known kinetics (Tucker, Lambourne,Adams, & Lach, 2002).
Tomato and cucumber Pectinmethylesterase (PME) have beenstudied as potential TTIs byGuiavarc'h, Sila, Duvetter, Van Loey,and Hendrickx (2003), who showed that the purified tomato PMEcould follow a first order kinetics and was a potential TTI. DTref
and z could be changed by modifying stabiliser agent (buffer pH,presence of glycerol). However, the cucumber PME exhibits abiphasic inactivation curve which made it not useable as a TTI.Peroxidase enzyme has been used to determine the efficiency ofpasteurisation and gave excellent correlation with the measuredtime temperature values (Hendrickx et al., 1992). However, moststudies have focused on use of α-amylase from Bacillus spp,which possesses good thermal resistance, has a z value more orless equal to that of the targeted micro-organism (Clostridiumbotulinum) and its denaturation follows first order kinetics(Tucker et al., 2002). At pasteurisation temperatures, severalenzymes are suitable, obtaining an enzymewith adequate thermalstability for sterilisation temperatures (around 121 °C), such asPyrococcus furiosus, is much more difficult (Tucker et al., 2007).New types of TTIs are still being developed. One example is anamperiometric glucose oxidase biosensor which showed potentialfor fast assessment of pasteurisation processes where E. coli andListeria monocytogenes are the targetedmicro-organisms (Reyes-De-Corcuera et al., 2005).
Validation of TTIs has been performed mostly on a lab-scale,although some industrially relevant studies are emerging. Lab-scale studies include the work of Taoukis and Labuza (1989),who showed a direct correlation between TTI response and thequality of food subjected to various time temperature profiles.Guiavarc'h et al. (2002b) used TTIs to monitor thermal impactinside a solid/liquid model food and showed that incorrectconclusions could be drawn using F values for solid piecesobtained just by using temperatures recorded at the centre of thesolid at the tip of a thermocouple. Mehauden et al. (2007) used aPeltier stage to reproduce various industrially relevant timetemperature profiles and showed good correlation between Pvalues from the integrated time temperature history ofthermocouples and those obtained from TTIs at 85 °C.
An industrial study on the continuous rotary processing ofcanned ravioli was undertaken by Guiavarc'h et al. (2005).
387K. Mehauden et al. / Innovative Food Science and Emerging Technologies 9 (2008) 385–395
Other work has studied the pasteurisation of fruits used foryoghurt (Tucker et al., 2002) showing that a P value can beobtained with the TTIs where the use of thermocouples isimpossible. Nonetheless, the published literature on the use ofTTIs in industry is limited. There is a lack of knowledge on theperformance of TTIs as a safety tool to determine the heattreatment efficiency in real applications. Their use could lead tooptimised thermal processing of food and hence improved foodquality and nutritional value.
Here, an industrial scale study on the use of TTIs inside aspecialist mixing vessel for food processing has been carriedout. TTIs are used in parallel with thermocouples within thevessel to validate them as a thermal process monitoringtechnique. Fluids with representative rheologies of food fluidswere used and other parameters varied in the experiments werethe vessel fill level and heating and cooling methods. The aim ofthis work is to enable the use of TTIs to improve the knowledgeof thermal processing inside mixing vessels with consequentinfluences upon future vessel design.
2. Materials and methods
2.1. TTI preparation
The enzyme used in the TTI preparation was α-amylase (EC3.2.1.1. Type II-A, Sigma, UK) isolated from Bacilluslicheniformis. The enzyme will be denoted as BLA hereafter.This enzyme has a pH activity which ranges from 5.5 to 6.5 withan optimum at 5.9 and its optimum rate of activity is at 65 °C.The BLA solution was prepared by dissolving 200 mg of BLApowder into 20 ml of 0.05 M tris buffer pH 8 (prepared fromTrizma base C4H11NO3) giving a final enzyme concentration of10 mg/ml. The Decimal reduction time, DT, of BLA at 85 °C is29.15±4.7 min and its z value is 10 °C±0.8 °C. The DT and thez value were determined for isothermal conditions operated witha waterbath. The z value used for the calculation of the P valuesobtained from the thermocouples and data loggers was the sameas the TTIs (10 °C). This solution was stored in a freezer at−18 °C and exhibited excellent storage stability over severalmonths (Lloyds, Lloyds, Cronje, & Tucker, 2003).
The BLA solution (20 µl) was encapsulated into Altesil(Altec, Cornwall, UK) high strength silicone tubing with a2 mm internal bore and 0.5 mm wall thickness cut into lengthsof 15 mm. The extremities of the tubes were closed by siliconeelastomer (Sylgard 170, Dow Corning, USA) and they werestored in a freezer at −18 °C.
2.2. Measurement of TTI activity
The Randox amylase test method (Randox, 2006) was usedto measure the remaining activity of BLA. This method usesethylidene-blocked p-nitrophenyl-maltoheptaoside as substrate,which is cleaved by BLA into various fragments. These arefurther hydrolysed in a second step by α-glucosidase producingglucose and p-nitrophenol. The presence of the p-nitrophenolcan be detected by absorbance using a spectrophotometer due toits yellow colour.
The BLA was removed from the TTIs using a syringe anddiluted with the tris buffer to a concentration of 10 μl of enzymesolution per 300 μl of buffer. 1 ml of the enzyme essay reagentfrom Randox (Crumlin, UK) was added to the diluted enzyme,put into the measurement cell of a spectrophotometer (CECIL,Cambridge, UK) and the absorbance at a wavelength of 405 nmwas recorded at 30 °C for 200 s online.
From this data, the rate of the reaction can be determined(Cornish-Bowden &Wharton, 1988). The initial rate of reactionis linear with respect to the concentration of BLA, i.e.
rA ¼ kCBLA; ð4Þwhere rA is the reaction rate, k is the first order rate constant andCBLA is the concentration of BLA (Cornish-Bowden &Wharton, 1988). The rate of reaction can be found from theslope of the absorbance, versus time data obtained from thespectrophotometer. This rate can be compared with that, rA0from a sample at a known initial concentration, CBLA0.
Hence the ratio of initial to the final activity of the enzymecan be calculated as
Ainitial
Afinal¼ CBLA0
CBLA¼ rA0
rA: ð5Þ
2.3. Determination of the pasteurisation value
When the inactivation is a first order reaction, the P valuemeasured by the TTIs can be calculated using
P ¼ DT d logAinitial
Afinal
� �; ð6Þ
where Ainitial/Afinal is the ratio of the enzyme activities beforeand after heat treatment as measured by the Randox test. Com-bining Eqs. (3) and (6) gives:
P ¼Z t
010
T tð Þ�Trefz d dt ¼ DT d log
Ainitial
Afinal
� �: ð7Þ
In this case, Tref is equal to 85 °C. Integration of measuredtime temperature profiles was done in Microsoft excel.
2.4. Use of TTIs in an industrial scale agitated vessel
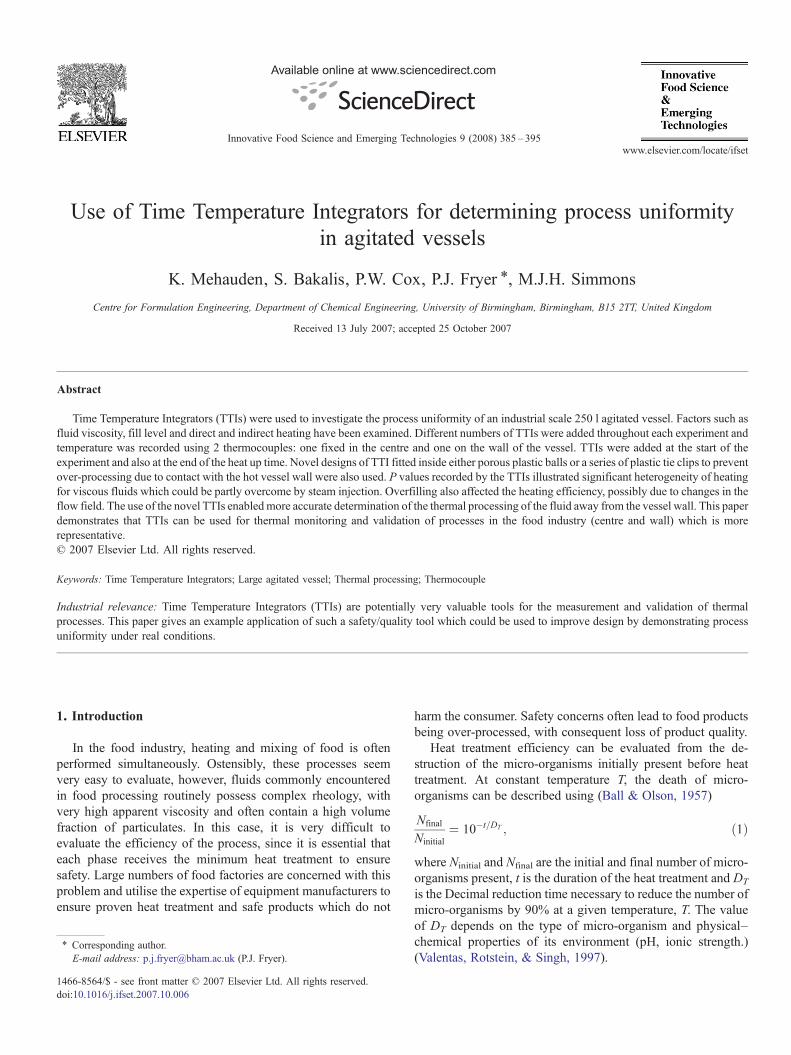
Experiments were performed on a vertical jacketed mixingvessel manufactured by Giusti Ltd. (Burton on Trent, UK) asshown in Fig. 1 (a). The maximum capacity of this vessel is250 l. It is equipped with a horizontal rotating agitator withpolytetrafluoroethylene (PTFE) scrapers attached to the steelblades which make contact with the vessel wall, designed toperform an efficient and gentle mix for highly shear-sensitiveproducts. Agitation speeds used range from 3 to 15 rpm.
Various heating and cooling options were used, with thevessel contents vented to atmosphere. Indirect heating andcooling was produced by the introduction of either steam at3 bar gauge or cooling water respectively into the vessel jacket.Direct heating was provided by steam injection into the vessel
Fig. 1. Details of vessel and TTIs used: (a) vessel schematic, showing the top and side views, (b) and (c) show the two system which ensured that the TTIs could not getinto close thermal contact with the wall. TTIs are shown.
388 K. Mehauden et al. / Innovative Food Science and Emerging Technologies 9 (2008) 385–395
and evaporative cooling by pressure reduction of the vesselcontents to below atmospheric. Additional heating or coolingwas also provided by use of the jacket.
When steam was flowing in the vessel jacket for heating, thewall temperature was not less than 130 °C. The saturationtemperature of steam at the working pressure, 3 bar gauge, is143.6 °C. Steam was introduced into the jacket until the vesselcontents were heated to the set temperature, based on a mea-surement from a calibrated PT 100 thermocouple with anaccuracy of ±0.15% at 100 °C, situated in a housing at thebottom of the vessel, used as the wall thermocouple during thisstudy. When vessel contents were heated directly, steam wasinjected through a wall aperture directed towards the centre ofthe vessel. In both cases, the steam flow rate was controlledautomatically using a Proportional Integral (PI) controller withthe wall thermocouple providing the temperature input.
During the experiments, a calibrated wireless thermocouple(Tracksense pro, Ellab UK Ltd., King's Lynn, Norfolk UK)with a 50 cm long probe was fixed securely onto the middle ofthe agitator shaft. This thermocouple tolerates temperaturesfrom −50 °C to +150 °C at pressures up to 10 bar, with anaccuracy of ±0.05 °C. The P value at 85 °C was obtainedfrom the time temperature history recorded by both the walland the wireless thermocouple using Eq. (7) with Tref=85 °C
and z=10 °C and was used for comparison with the P valuesgiven by the TTIs. The agreement between TTI and integratedP value has been shown to be good by Mehauden et al.(2007).
The fluids used for the experiments were water, aqueoussolutions of starch at different concentrations (Colflo 67,National Starch & Chemicals, Manchester UK) and Heinzcream of tomato soup (Heinz, Wigan UK). Colflo 67 is a modi-fied food starch derived from waxy maize, used as a thickeningand stabilising agent for water based food systems and sodirectly applicable to this study. Colflo 67 starts to gelatinise atapproximately 69 °C and its maximum viscosity is reached at80–85 °C. Concentrations of 4% and 5% by mass were used.The soup used was condensed and was mixed with an equalamount of water before it was used in the vessel.
Eleven experiments were performed as shown in Table 2.Parameters varied were the fluid used, the set temperature, thefilling level of the vessel and the heating options. Heating andcooling rates observed were dependent upon the heating optionsand the fluid used. Controllable parameters were the holdingtime and the set temperature. The holding time chosen was15 min (14 min+1 min used to evacuate condensate from thejacket of the vessel) at the set temperature. Cooling wasperformed by using both the jacket and the vacuum cooling.
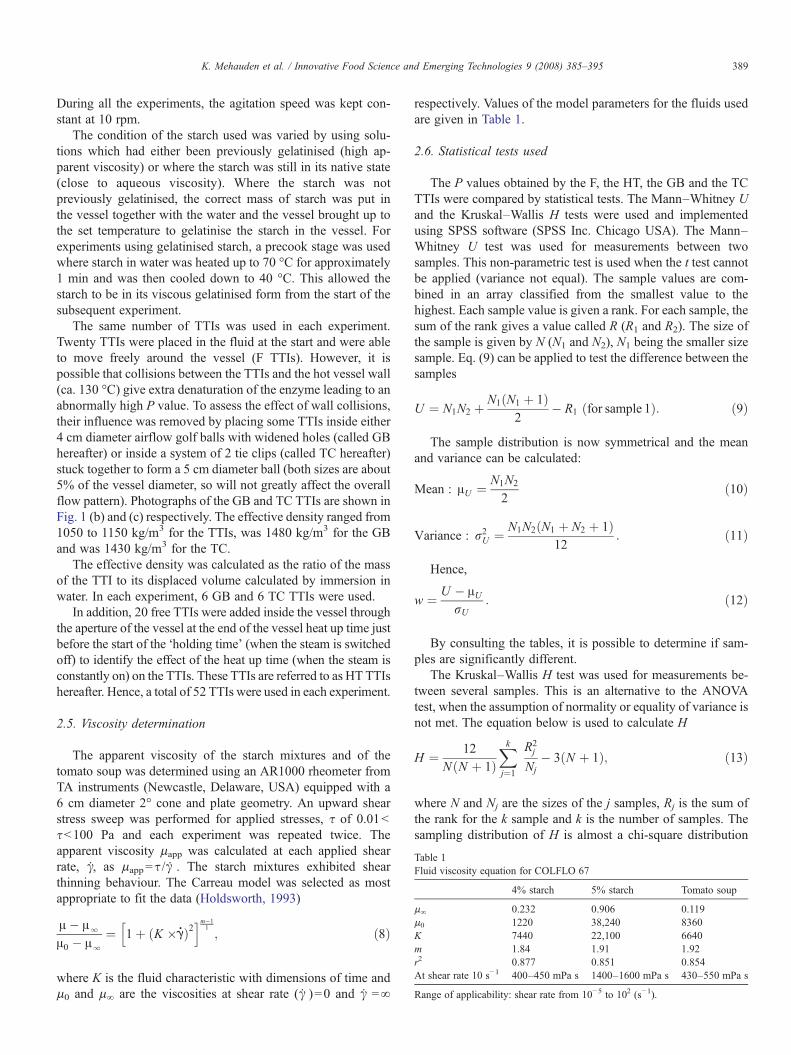
Table 1Fluid viscosity equation for COLFLO 67
4% starch 5% starch Tomato soup
μ∞ 0.232 0.906 0.119μ0 1220 38,240 8360K 7440 22,100 6640m 1.84 1.91 1.92r2 0.877 0.851 0.854At shear rate 10 s−1 400–450 mPa s 1400–1600 mPa s 430–550 mPa s
Range of applicability: shear rate from 10−5 to 102 (s−1).
389K. Mehauden et al. / Innovative Food Science and Emerging Technologies 9 (2008) 385–395
During all the experiments, the agitation speed was kept con-stant at 10 rpm.
The condition of the starch used was varied by using solu-tions which had either been previously gelatinised (high ap-parent viscosity) or where the starch was still in its native state(close to aqueous viscosity). Where the starch was notpreviously gelatinised, the correct mass of starch was put inthe vessel together with the water and the vessel brought up tothe set temperature to gelatinise the starch in the vessel. Forexperiments using gelatinised starch, a precook stage was usedwhere starch in water was heated up to 70 °C for approximately1 min and was then cooled down to 40 °C. This allowed thestarch to be in its viscous gelatinised form from the start of thesubsequent experiment.
The same number of TTIs was used in each experiment.Twenty TTIs were placed in the fluid at the start and were ableto move freely around the vessel (F TTIs). However, it ispossible that collisions between the TTIs and the hot vessel wall(ca. 130 °C) give extra denaturation of the enzyme leading to anabnormally high P value. To assess the effect of wall collisions,their influence was removed by placing some TTIs inside either4 cm diameter airflow golf balls with widened holes (called GBhereafter) or inside a system of 2 tie clips (called TC hereafter)stuck together to form a 5 cm diameter ball (both sizes are about5% of the vessel diameter, so will not greatly affect the overallflow pattern). Photographs of the GB and TC TTIs are shown inFig. 1 (b) and (c) respectively. The effective density ranged from1050 to 1150 kg/m3 for the TTIs, was 1480 kg/m3 for the GBand was 1430 kg/m3 for the TC.
The effective density was calculated as the ratio of the massof the TTI to its displaced volume calculated by immersion inwater. In each experiment, 6 GB and 6 TC TTIs were used.
In addition, 20 free TTIs were added inside the vessel throughthe aperture of the vessel at the end of the vessel heat up time justbefore the start of the ‘holding time’ (when the steam is switchedoff) to identify the effect of the heat up time (when the steam isconstantly on) on the TTIs. These TTIs are referred to as HT TTIshereafter. Hence, a total of 52 TTIs were used in each experiment.
2.5. Viscosity determination
The apparent viscosity of the starch mixtures and of thetomato soup was determined using an AR1000 rheometer fromTA instruments (Newcastle, Delaware, USA) equipped with a6 cm diameter 2° cone and plate geometry. An upward shearstress sweep was performed for applied stresses, τ of 0.01bτb100 Pa and each experiment was repeated twice. Theapparent viscosity μapp was calculated at each applied shearrate, γ,̇ as μapp=τ /γ ˙ . The starch mixtures exhibited shearthinning behaviour. The Carreau model was selected as mostappropriate to fit the data (Holdsworth, 1993)
A� AlA0 � Al
¼ 1þ K ��gð Þ2h im�1
1; ð8Þ
where K is the fluid characteristic with dimensions of time andμ0 and μ∞ are the viscosities at shear rate (γ˙ )=0 and γ˙ =∞
respectively. Values of the model parameters for the fluids usedare given in Table 1.
2.6. Statistical tests used
The P values obtained by the F, the HT, the GB and the TCTTIs were compared by statistical tests. The Mann–Whitney Uand the Kruskal–Wallis H tests were used and implementedusing SPSS software (SPSS Inc. Chicago USA). The Mann–Whitney U test was used for measurements between twosamples. This non-parametric test is used when the t test cannotbe applied (variance not equal). The sample values are com-bined in an array classified from the smallest value to thehighest. Each sample value is given a rank. For each sample, thesum of the rank gives a value called R (R1 and R2). The size ofthe sample is given by N (N1 and N2), N1 being the smaller sizesample. Eq. (9) can be applied to test the difference between thesamples
U ¼ N1N2 þ N1 N1 þ 1ð Þ2
� R1 for sample 1ð Þ: ð9Þ
The sample distribution is now symmetrical and the meanand variance can be calculated:
Mean : AU ¼ N1N2
2ð10Þ
Variance : r2U ¼ N1N2 N1 þ N2 þ 1ð Þ12
: ð11Þ
Hence,
w ¼ U � AUrU
: ð12Þ
By consulting the tables, it is possible to determine if sam-ples are significantly different.
The Kruskal–Wallis H test was used for measurements be-tween several samples. This is an alternative to the ANOVAtest, when the assumption of normality or equality of variance isnot met. The equation below is used to calculate H
H ¼ 12N N þ 1ð Þ
Xkj¼1
R2j
Nj� 3 N þ 1ð Þ; ð13Þ
where N and Nj are the sizes of the j samples, Rj is the sum ofthe rank for the k sample and k is the number of samples. Thesampling distribution of H is almost a chi-square distribution
390 K. Mehauden et al. / Innovative Food Science and Emerging Technologies 9 (2008) 385–395
with a k−1 degrees of freedom (N needs to be higher than 5). IfH exceeds the critical value at some significance level (usually0.05) it means that there is evidence to reject the null hypothesisin favour of the alternative hypothesis (Spielger, 1988).
Samples may be considered as significantly different if theresults from both tests are lower than 0.05.
3. Results and discussion
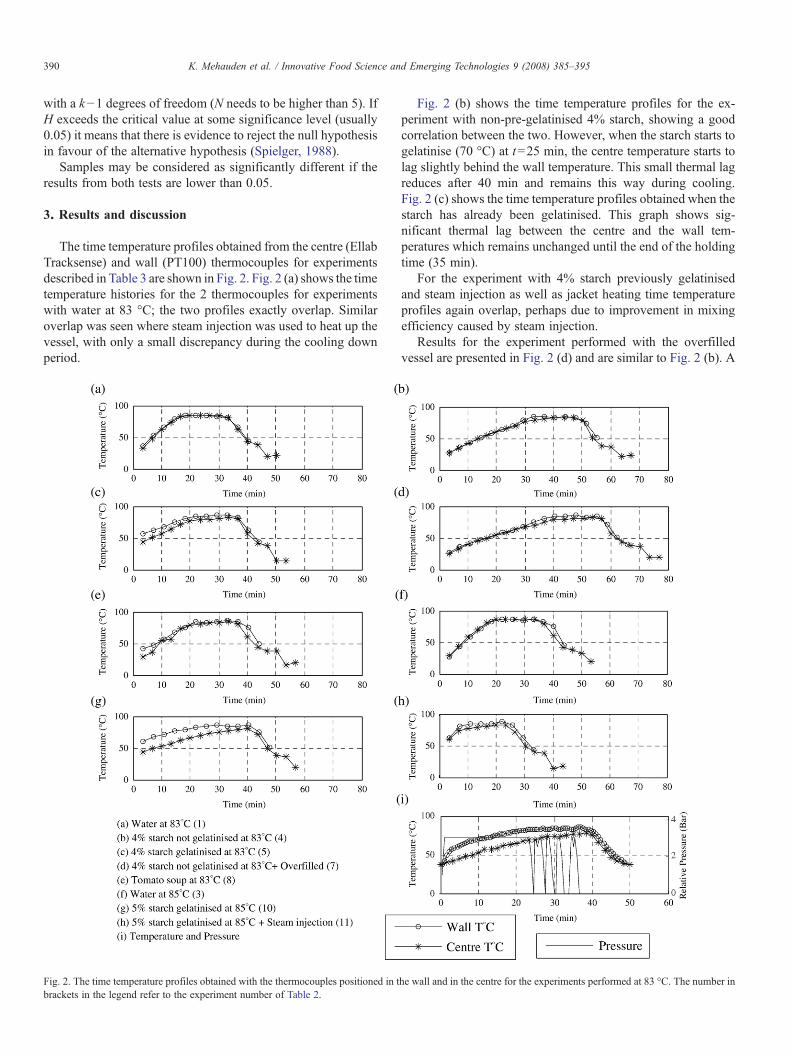
The time temperature profiles obtained from the centre (EllabTracksense) and wall (PT100) thermocouples for experimentsdescribed in Table 3 are shown in Fig. 2. Fig. 2 (a) shows the timetemperature histories for the 2 thermocouples for experimentswith water at 83 °C; the two profiles exactly overlap. Similaroverlap was seen where steam injection was used to heat up thevessel, with only a small discrepancy during the cooling downperiod.
Fig. 2. The time temperature profiles obtained with the thermocouples positioned in tbrackets in the legend refer to the experiment number of Table 2.
Fig. 2 (b) shows the time temperature profiles for the ex-periment with non-pre-gelatinised 4% starch, showing a goodcorrelation between the two. However, when the starch starts togelatinise (70 °C) at t=25 min, the centre temperature starts tolag slightly behind the wall temperature. This small thermal lagreduces after 40 min and remains this way during cooling.Fig. 2 (c) shows the time temperature profiles obtained when thestarch has already been gelatinised. This graph shows sig-nificant thermal lag between the centre and the wall tem-peratures which remains unchanged until the end of the holdingtime (35 min).
For the experiment with 4% starch previously gelatinisedand steam injection as well as jacket heating time temperatureprofiles again overlap, perhaps due to improvement in mixingefficiency caused by steam injection.
Results for the experiment performed with the overfilledvessel are presented in Fig. 2 (d) and are similar to Fig. 2 (b). A
he wall and in the centre for the experiments performed at 83 °C. The number in
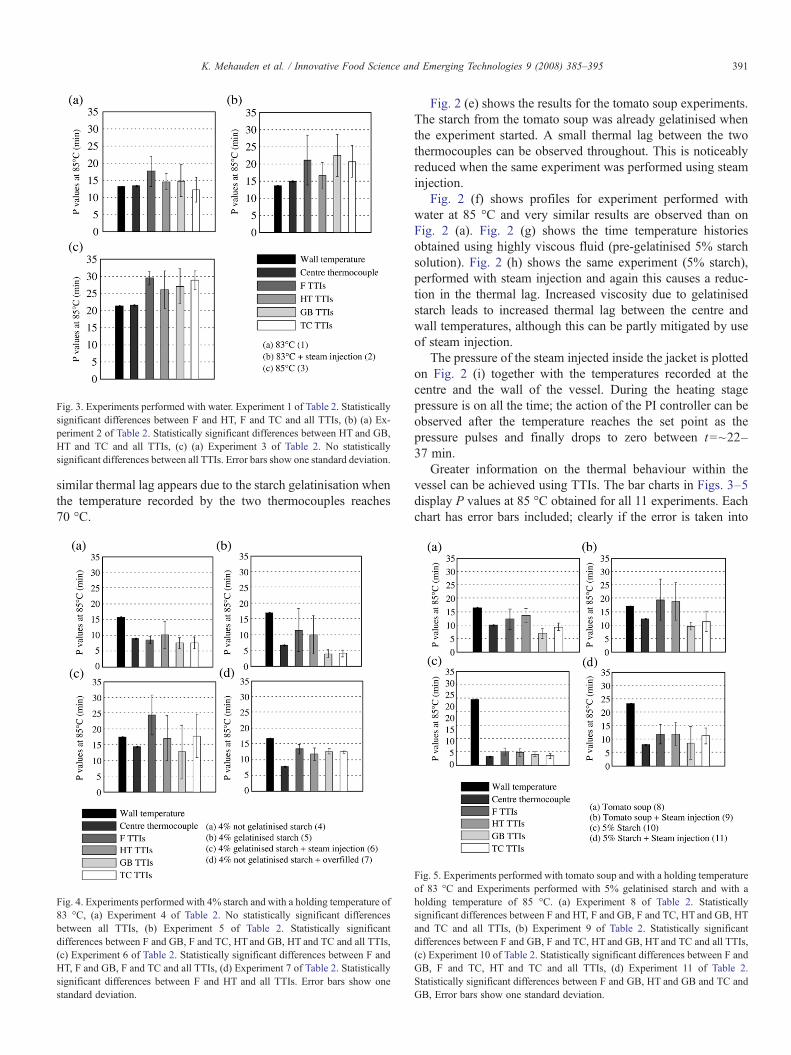
Fig. 3. Experiments performed with water. Experiment 1 of Table 2. Statisticallysignificant differences between F and HT, F and TC and all TTIs, (b) (a) Ex-periment 2 of Table 2. Statistically significant differences between HT and GB,HT and TC and all TTIs, (c) (a) Experiment 3 of Table 2. No statisticallysignificant differences between all TTIs. Error bars show one standard deviation.
391K. Mehauden et al. / Innovative Food Science and Emerging Technologies 9 (2008) 385–395
similar thermal lag appears due to the starch gelatinisation whenthe temperature recorded by the two thermocouples reaches70 °C.
Fig. 4. Experiments performed with 4% starch and with a holding temperature of83 °C, (a) Experiment 4 of Table 2. No statistically significant differencesbetween all TTIs, (b) Experiment 5 of Table 2. Statistically significantdifferences between F and GB, F and TC, HT and GB, HT and TC and all TTIs,(c) Experiment 6 of Table 2. Statistically significant differences between F andHT, F and GB, F and TC and all TTIs, (d) Experiment 7 of Table 2. Statisticallysignificant differences between F and HT and all TTIs. Error bars show onestandard deviation.
Fig. 2 (e) shows the results for the tomato soup experiments.The starch from the tomato soup was already gelatinised whenthe experiment started. A small thermal lag between the twothermocouples can be observed throughout. This is noticeablyreduced when the same experiment was performed using steaminjection.
Fig. 2 (f) shows profiles for experiment performed withwater at 85 °C and very similar results are observed than onFig. 2 (a). Fig. 2 (g) shows the time temperature historiesobtained using highly viscous fluid (pre-gelatinised 5% starchsolution). Fig. 2 (h) shows the same experiment (5% starch),performed with steam injection and again this causes a reduc-tion in the thermal lag. Increased viscosity due to gelatinisedstarch leads to increased thermal lag between the centre andwall temperatures, although this can be partly mitigated by useof steam injection.
The pressure of the steam injected inside the jacket is plottedon Fig. 2 (i) together with the temperatures recorded at thecentre and the wall of the vessel. During the heating stagepressure is on all the time; the action of the PI controller can beobserved after the temperature reaches the set point as thepressure pulses and finally drops to zero between t=~22–37 min.
Greater information on the thermal behaviour within thevessel can be achieved using TTIs. The bar charts in Figs. 3–5display P values at 85 °C obtained for all 11 experiments. Eachchart has error bars included; clearly if the error is taken into
Fig. 5. Experiments performed with tomato soup and with a holding temperatureof 83 °C and Experiments performed with 5% gelatinised starch and with aholding temperature of 85 °C. (a) Experiment 8 of Table 2. Statisticallysignificant differences between F and HT, F and GB, F and TC, HT and GB, HTand TC and all TTIs, (b) Experiment 9 of Table 2. Statistically significantdifferences between F and GB, F and TC, HT and GB, HT and TC and all TTIs,(c) Experiment 10 of Table 2. Statistically significant differences between F andGB, F and TC, HT and TC and all TTIs, (d) Experiment 11 of Table 2.Statistically significant differences between F and GB, HT and GB and TC andGB, Error bars show one standard deviation.
392 K. Mehauden et al. / Innovative Food Science and Emerging Technologies 9 (2008) 385–395
consideration some of the results overlap. For this reason,statistical tests were used to verify if the differences between theresults from each type of TTI within each experiment weresignificant. The results of the statistical tests are tabulated on thelegend of each graph in Figs. 3–5 and differences are con-sidered significant only for values below 0.05.
Fig. 3 presents experiments performed with water (Experi-ments 1, 2 and 3 of Table 2). Fig. 3 (a) shows P values obtainedby the thermocouples and TTIs for the experiment performed ata holding temperature of 83 °C. There is reasonable agreementbetween the P values obtained by both thermocouples(P=13 min at 85 °C), and the HT and GB TTIs. The F TTIsadded at the start of the experiment, gave higher P values thanthe thermocouples (P=17 min); this is due to contact with thehot steam jacket. Since the GB and TC TTIs are protected fromwall contact, and the HT TTIs are added later, these do notcontact the jacket and the P values obtained are lower thanthose of the F thermocouples. However, in this experiment thescatter in the GB TTIs meant that results were not significantlydifferent from the F TTIs.
Fig. 3 (b) shows results from the experiment performed withwater at 83 °C using steam injection. Notably, the P values of allTTIs are higher than those obtained with the two thermo-couples. The P values from the thermocouples are similar tothose measured without steam injection, (although the centrevalue is slightly higher, P=15 min at 85 °C). As steam isinjected in the centre of the vessel, any TTIs passing through thesteam jet will receive localised heating and thus higher Pvalues. It is notable that the error bars are much larger than forFig. 3 (a) suggesting that some TTIs have passed through thesteam jet whilst others have not. Only the results for the HTTTIs compared with the GB and TC TTIs are significantlydifferent, with the values for the HT TTIs being lower. Since theHT TTIs were added at the end of the heat up time, they werenot exposed to continuous steam injection, with the steam only
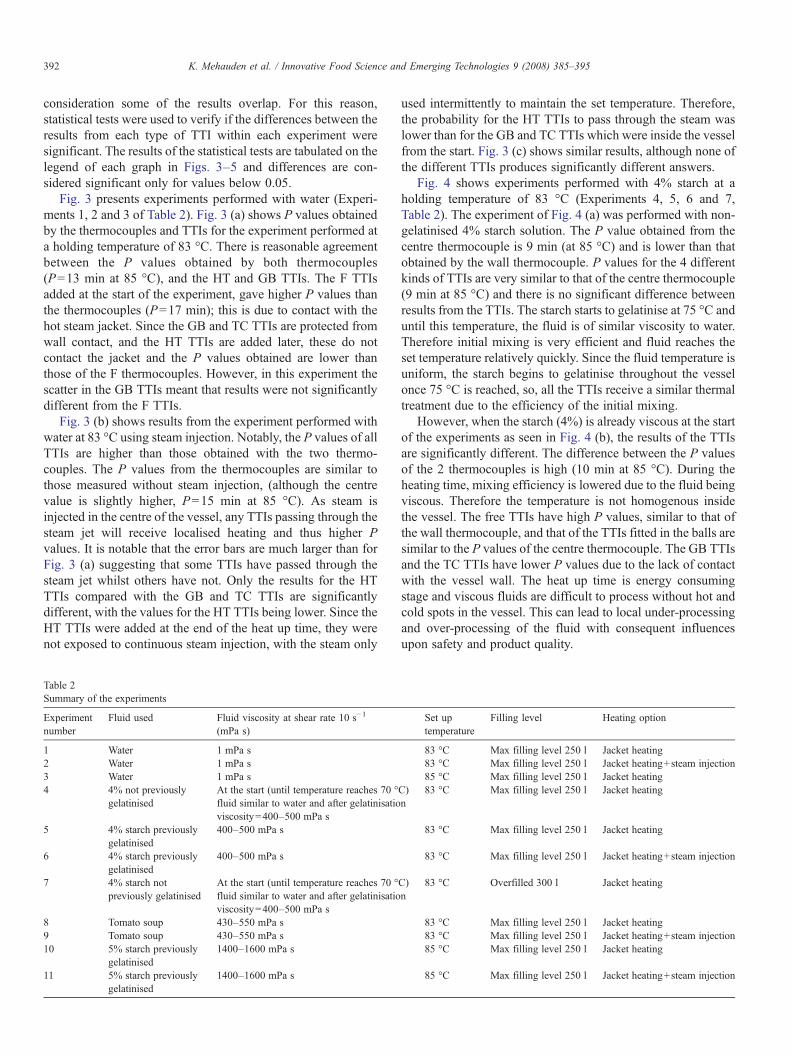
Table 2Summary of the experiments
Experimentnumber
Fluid used Fluid viscosity at shear rate 10 s−1
(mPa s)
1 Water 1 mPa s2 Water 1 mPa s3 Water 1 mPa s4 4% not previously
gelatinisedAt the start (until temperature reaches 70 °fluid similar to water and after gelatinisatioviscosity=400–500 mPa s
5 4% starch previouslygelatinised
400–500 mPa s
6 4% starch previouslygelatinised
400–500 mPa s
7 4% starch notpreviously gelatinised
At the start (until temperature reaches 70 °fluid similar to water and after gelatinisatioviscosity=400–500 mPa s
8 Tomato soup 430–550 mPa s9 Tomato soup 430–550 mPa s10 5% starch previously
gelatinised1400–1600 mPa s
11 5% starch previouslygelatinised
1400–1600 mPa s
used intermittently to maintain the set temperature. Therefore,the probability for the HT TTIs to pass through the steam waslower than for the GB and TC TTIs which were inside the vesselfrom the start. Fig. 3 (c) shows similar results, although none ofthe different TTIs produces significantly different answers.
Fig. 4 shows experiments performed with 4% starch at aholding temperature of 83 °C (Experiments 4, 5, 6 and 7,Table 2). The experiment of Fig. 4 (a) was performed with non-gelatinised 4% starch solution. The P value obtained from thecentre thermocouple is 9 min (at 85 °C) and is lower than thatobtained by the wall thermocouple. P values for the 4 differentkinds of TTIs are very similar to that of the centre thermocouple(9 min at 85 °C) and there is no significant difference betweenresults from the TTIs. The starch starts to gelatinise at 75 °C anduntil this temperature, the fluid is of similar viscosity to water.Therefore initial mixing is very efficient and fluid reaches theset temperature relatively quickly. Since the fluid temperature isuniform, the starch begins to gelatinise throughout the vesselonce 75 °C is reached, so, all the TTIs receive a similar thermaltreatment due to the efficiency of the initial mixing.
However, when the starch (4%) is already viscous at the startof the experiments as seen in Fig. 4 (b), the results of the TTIsare significantly different. The difference between the P valuesof the 2 thermocouples is high (10 min at 85 °C). During theheating time, mixing efficiency is lowered due to the fluid beingviscous. Therefore the temperature is not homogenous insidethe vessel. The free TTIs have high P values, similar to that ofthe wall thermocouple, and that of the TTIs fitted in the balls aresimilar to the P values of the centre thermocouple. The GB TTIsand the TC TTIs have lower P values due to the lack of contactwith the vessel wall. The heat up time is energy consumingstage and viscous fluids are difficult to process without hot andcold spots in the vessel. This can lead to local under-processingand over-processing of the fluid with consequent influencesupon safety and product quality.
Set uptemperature
Filling level Heating option
83 °C Max filling level 250 l Jacket heating83 °C Max filling level 250 l Jacket heating+steam injection85 °C Max filling level 250 l Jacket heating
C)n
83 °C Max filling level 250 l Jacket heating
83 °C Max filling level 250 l Jacket heating
83 °C Max filling level 250 l Jacket heating+steam injection
C)n
83 °C Overfilled 300 l Jacket heating
83 °C Max filling level 250 l Jacket heating83 °C Max filling level 250 l Jacket heating+steam injection85 °C Max filling level 250 l Jacket heating
85 °C Max filling level 250 l Jacket heating+steam injection
393K. Mehauden et al. / Innovative Food Science and Emerging Technologies 9 (2008) 385–395
Fig. 4 (c) displays P values for the TTIs and thermocouplesfor experiments performed with 4% pre-gelatinised starch andwith steam injection. Steam injection seems to improve heatingefficiency since the difference between the P value of the centreand the wall thermocouples is lower compared with Fig. 4 (b).The P values of the F TTIs are higher than the P value of thewall thermocouple. During the heat up time F TTIs could easilyhave passed close to the steam injection nozzle and thereforereceived further localised heating. After the heating time thesteam injection was not in operation most of the time and hencethe HT TTIs have lower P values. Values for the GB and TCTTIs are also significantly lower than those of the F TTIs andthey appear less affected by steam injection.
Fig. 4 (d) shows results from experiments performed with4% starch and overfilled vessel. The P values from the TTIs areall similar and on average equal to 14 min at 85 °C. They aresurprisingly closer to the P values of the wall thermocouple(16 min at 85 °C) than to those of the centre thermocouple(8 min at 85 °C). In this experiment, the fluid path is differentwhich may change the thermal treatment the TTIs havereceived. When this experiment is compared to one performedwith a normal filled vessel (Fig. 4 (a)), it can be seen that all theTTIs have higher P values suggesting that fluid mixing in theoverfilled case is different.
Fig. 5 (a) and (b) shows experiments performed with tomatosoup (Experiments 8 and 9). These experiments are essential forthe characterisation of the heating efficiency of the vessel sinceit uses a real food product. The experiment performed withtomato soup using only the jacket heating is shown in Fig. 5 (a).Results are similar to that obtained with 4% gelatinised starch.The TTIs fitted inside ‘golf ball’ and ‘tie clip ball’ havesignificantly lower P values than those that are freely moving.The P value obtained by the wall thermocouple is similar to theP values of the F and HT TTIs. A similar observation can bemade between the P value of the centre thermocouple and thoseof the TTIs fitted inside the balls. This experiment shows that
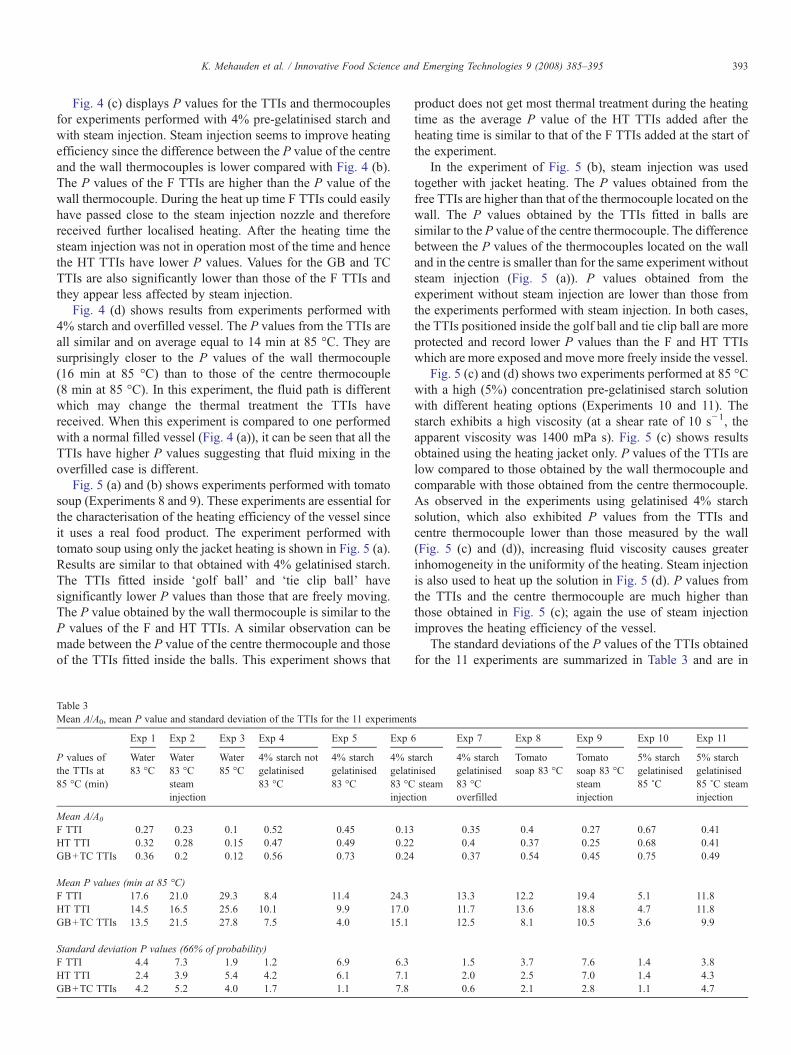
Table 3Mean A/A0, mean P value and standard deviation of the TTIs for the 11 experiment
Exp 1 Exp 2 Exp 3 Exp 4 Exp 5 Exp 6
P values ofthe TTIs at85 °C (min)
Water83 °C
Water83 °Csteaminjection
Water85 °C
4% starch notgelatinised83 °C
4% starchgelatinised83 °C
4% sgelati83 °Cinject
Mean A/A0
F TTI 0.27 0.23 0.1 0.52 0.45 0.13HT TTI 0.32 0.28 0.15 0.47 0.49 0.22GB+TC TTIs 0.36 0.2 0.12 0.56 0.73 0.24
Mean P values (min at 85 °C)F TTI 17.6 21.0 29.3 8.4 11.4 24.3HT TTI 14.5 16.5 25.6 10.1 9.9 17.0GB+TC TTIs 13.5 21.5 27.8 7.5 4.0 15.1
Standard deviation P values (66% of probability)F TTI 4.4 7.3 1.9 1.2 6.9 6.3HT TTI 2.4 3.9 5.4 4.2 6.1 7.1GB+TC TTIs 4.2 5.2 4.0 1.7 1.1 7.8
product does not get most thermal treatment during the heatingtime as the average P value of the HT TTIs added after theheating time is similar to that of the F TTIs added at the start ofthe experiment.
In the experiment of Fig. 5 (b), steam injection was usedtogether with jacket heating. The P values obtained from thefree TTIs are higher than that of the thermocouple located on thewall. The P values obtained by the TTIs fitted in balls aresimilar to the P value of the centre thermocouple. The differencebetween the P values of the thermocouples located on the walland in the centre is smaller than for the same experiment withoutsteam injection (Fig. 5 (a)). P values obtained from theexperiment without steam injection are lower than those fromthe experiments performed with steam injection. In both cases,the TTIs positioned inside the golf ball and tie clip ball are moreprotected and record lower P values than the F and HT TTIswhich are more exposed and move more freely inside the vessel.
Fig. 5 (c) and (d) shows two experiments performed at 85 °Cwith a high (5%) concentration pre-gelatinised starch solutionwith different heating options (Experiments 10 and 11). Thestarch exhibits a high viscosity (at a shear rate of 10 s−1, theapparent viscosity was 1400 mPa s). Fig. 5 (c) shows resultsobtained using the heating jacket only. P values of the TTIs arelow compared to those obtained by the wall thermocouple andcomparable with those obtained from the centre thermocouple.As observed in the experiments using gelatinised 4% starchsolution, which also exhibited P values from the TTIs andcentre thermocouple lower than those measured by the wall(Fig. 5 (c) and (d)), increasing fluid viscosity causes greaterinhomogeneity in the uniformity of the heating. Steam injectionis also used to heat up the solution in Fig. 5 (d). P values fromthe TTIs and the centre thermocouple are much higher thanthose obtained in Fig. 5 (c); again the use of steam injectionimproves the heating efficiency of the vessel.
The standard deviations of the P values of the TTIs obtainedfor the 11 experiments are summarized in Table 3 and are in
s
Exp 7 Exp 8 Exp 9 Exp 10 Exp 11
tarchnisedsteamion
4% starchgelatinised83 °Coverfilled
Tomatosoap 83 °C
Tomatosoap 83 °Csteaminjection
5% starchgelatinised85 ˚C
5% starchgelatinised85 ˚C steaminjection
0.35 0.4 0.27 0.67 0.410.4 0.37 0.25 0.68 0.410.37 0.54 0.45 0.75 0.49
13.3 12.2 19.4 5.1 11.811.7 13.6 18.8 4.7 11.812.5 8.1 10.5 3.6 9.9
1.5 3.7 7.6 1.4 3.82.0 2.5 7.0 1.4 4.30.6 2.1 2.8 1.1 4.7
394 K. Mehauden et al. / Innovative Food Science and Emerging Technologies 9 (2008) 385–395
general relatively high. In around 40% of cases the standarddeviation of the P values obtained by the GB TTIs is lower thanthe error from the two types of free F and HT TTIs. The tableshows that the standard deviation increases when the steaminjection is used, possibly due to localised heating imparted bydirect contact with the jet of steam. High standard deviation isalso observed for the experiments performed with low viscosityfluids where the mixing efficiency is expected to be high, how-ever this may be due to the TTIs passing close to the vessel wall.
3.1. Potential of TTIs for process analysis
The above experiments demonstrate how different types ofTTI can be used to study the effects of a process. We have notattempted here to propose a protocol for formal validation of aprocess; more work is needed before this can be done. However,the results suggest that:
(i) TTI particles that are free to be close to the steam-heatedwall show the highest P value; these are likely to berepresentative of the processing the fluid has received.
(ii) TTI particles that have constrained to be away from thewall show lower values, indicating the processing re-ceived by fluid that is not heated by the wall.
The process should be designed so that the two sets of resultsgive P values that are as close as possible. The influence ofoverfilling shows that mixing profiles changes and that greatervariation is seen; it is probable that the TTI results seen here showthe over-processed fraction only, and that under-processing alsoresults.
4. Conclusion
TTIs were used together with thermocouples to investigatethe thermal efficiency of a industry scale 250 l agitated vesselused for the thermal processing of viscous food fluids. Theparameters varied were the fluid apparent viscosity, direct andindirect heating options and filling level. The study showed thatthe thermal process efficiency is lowered when the fluidviscosity increases; however this is overcome by using steaminjection. Overfilling the vessel modifies the heating efficiencyof the vessel. This is probably due to the different path taken bythe fluid during the mixing.
The effect of the heating time on the product was studied byadding some TTIs (HT) once the vessel had reached the set uptemperature. During the heating time, steam was constantlyinjected inside the jacket and therefore the wall temperature washigh. By adding other free TTIs at the end of the heating time, itwas possible to investigate if the product was getting most of itscooking during the heating time. However, comparison of the Pvalues obtained from the F and the HT TTIs showed that for70% of the cases the product did not get most of its cookingduring the heating time.
Novel designs of TTI (GB and TC) were successfully used tomonitor the thermal treatment received by the fluid in the centralarea of the vessel. Close approach to the hot wall was prevented
by putting the TTIs inside plastic balls. The free-flowing TTIsshowed the effect of the whole process, including the time spentclose to the hot wall, whilst those in the balls reported P valuescloser to that calculated from bulk temperatures. The bulkvalues reported by GB+TC TTIs thus underestimate theprocessing the fluid has received. For all the experiments, nosignificant difference between the GB or TC designs was ob-served; therefore either GB or TC could be used to monitor thethermal treatment. For 70% of the experiments, the average Pvalues obtained by the TTIs from the GB and TC were close orsimilar to the P value of the thermocouple located in the centreof the vessel. This observation showed that the use of GB or TCTTIs could help to investigate the thermal treatment efficiencyin the centre of the vessel. The results show how TTIs might beapplied to determine the process safety (i.e. the minimum valueidentified) the degree of overcooking due to the wall (i.e. thedifferences between the different types of TTIs) and thevariability or uncertainty induced by the process.
Acknowledgments
KM wishes to acknowledge financial support from anEPSRC Industrial CASE Award with Giusti Ltd. through theFood Processing Faraday. We are grateful for the detailed com-ments of the referees.
References
Ball, C., & Olson, F. (1957). Sterilization in food technology. New York:Mc Graw Hill.
Bigelow, W. D. (1921). The logarithmic nature of thermal death time curves.Journal of Infectious Diseases, 29, 528−536.
Cornish-Bowden, A., & Wharton, C. W. (1988). Simple enzyme kinetics.Enzyme Kinetics (pp. 73). Oxford: IRL Press Ltd.
Guiavarc'h, Y. P., Deli, V., Van Loey, A. M., & Hendrickx, M. E. (2002a).Development of an enzyme Time Temperature Integrator for sterilizationprocesses based on Bacillus licheniformis α-amylase at reduced watercontent. Journal of Food Science, 67, 285−291.
Guiavarc'h, Y. P., Dintwa, E., Van Loey, A. M., Zuber, F. T., & Hendrickx, M. E.(2002b). Validation and use of an enzymatic Time Temperature Integrator tomonitor thermal impacts inside a solid/liquid model food. Biotechnology, 18,1087−1094.
Guiavarc'h, Y. P., Van Loey, A. M., Zuber, F. T., & Hendrickx, M. E. (2004a).Bacillus licheniformis α-amylase immobilized on glass beads andequilibrated at low moisture content: potentials as a Time TemperatureIntegrators for sterilisation processes. Innovative Food Science & EmergingTechnologies, 5, 317−325.
Guiavarc'h, Y. P., Van Loey, A. M., Zuber, F. T., & Hendrickx, M. E. (2004b).Development characterization and use of a high-performance enzymaticTime Temperature Integrator for control of sterilization process impacts.Biotechnology and Bioengineering, 88, 15−25.
Guiavarc'h, Y. P., Zuber, F. T., Van Loey, A. M., & Hendrickx, M. E. (2005).Combined use of two single-component enzymatic Time TemperatureIntegrators: Application to industrial continuous rotary processing of cannedravioli. Journal of Food Protection, 68, 375−383.
Guiavarc'h, Y., Sila, D., Duvetter, T., Van Loey, A., & Hendrickx, M. (2003).Influence of sugars and polyols on the thermal stability of purified tomatoand cucumber pectinmethylesterases: A basis for TTI development. Enzymeand Microbial Technology, 33, 544−555.
Hendrickx, M. E., Maesmans, G., De Cordt, S., Noronha, J., Van Loey, A. M., &Tobback, P. (1995). Evaluation of the integrated time temperature effect inthermal processing of foods.Critical reviews in Food Science and Nutrition, 35,231−262.
395K. Mehauden et al. / Innovative Food Science and Emerging Technologies 9 (2008) 385–395
Hendrickx, M. E., Weng, Z., Maesmans, G., & Tobback, P. (1992). Validation ofTime Temperature Integrator for thermal processing of food under pasteurisa-tion conditions. International of Food Science and Technology, 27, 21−31.
Holdsworth, S. D. (1993). Rheological models used for the prediction of theflow properties of food products. Trans. I ChemE, 71, 139−179.
Lewis, M., & Heppell, N. (2000). Kinetics for microorganism death andchanges in biochemical components. Continuous thermal processing offoods (pp. 1−465). New York: Aspen publication.
Lloyds, E., Cronje, M., & Tucker, G. (2003) Time–Temperature Integrators:Guidelines on their preparation, processing and analysis Campden &Chorleywood Food Research Association Group. R & D report.
Maesmans, G., Hendrickx, M. E., De Cordt, S., Van Loey, A. M., Noronha, J., &Tobback, P. (1994). Evaluation of process value distribution with TimeTemperature Integrators. Food Research International, 27, 413−423.
Marra, F., & Romano, V. (2003). A mathematical model to study the influence ofwireless temperature sensor during assessment of canned food sterilization.Journal of Food Engineering, 59, 245−252.
Mehauden, K., Cox, P. W., Bakalis, S., Simmons, M. J. H., Tucker, G. S., &Fryer, P. J. (2007). A novel method to evaluate the applicability of TimeTemperature Integrators to different temperature profiles. Innovative FoodScience & Emerging Technologies, 8, 507−514.
Randox. Amylase Ethylidene Blocked-p-NPG7 Manual. [AY1582]. 2006.Reyes-De-Corcuera, J. I., Cavalieri, R. P., Powers, J. R., Tang, J., & Kang, D. H.
(2005). Enzyme-electropolymer-based amperometric biosensors: An inno-vative platform for Time–Temperature Integrators. Journal of Agricricul-tural and Food Chemistry, 53, 8866−8873.
Richardson, P. (2001). Thermal technologies in food processing. Cambridge:Woodhead publishing limited.
Spielger, M. R. (1988). Schaum's outline series theory and problems ofstatistics. New York: McGraw-Hill.
Taoukis, P. S., & Labuza, T. P. (1989). Reliability of Time TemperatureIndicators as food quality monitors under nonisothermal conditions. Journalof Food Science, 54, 789−792.
Tucker, G. (1999). Application of Time Temperature Integrators for validation ofpasteurisation processes.Campden & Chorleywood Food Research Associa-tion Group, 77 R & D report.
Tucker, G., & Holdsworth, S. D. (1991). Mathematical modelling of sterilisationand cooking processes for heat preserved foods, applications of a new heattransfer model. Trans I ChemE, 69, 5−12.
Tucker, G., Lambourne, T., Adams, J. B., & Lach, A. (2002). Application of abiochemical Time Temperature Integrator to estimate pasteurisation valuesin continuous food processes. Innovative Food Science & EmergingTechnologies, 3, 165−174.
Tucker, G. S., Brown, H. M., Fryer, P. J., Cox, P. W., Poole, F. L., II, Lee, H. S.,et al. (2007). A sterilisation Time–Temperature Integrator based on amylasefrom the hyperthermophilic organism Pyrococcus furiosus. Innovative FoodScience & Emerging Technologies, 8, 63−72.
Valentas, K. J., Rotstein, E., & Singh, R. P. (1997). Handbook of foodengineering practice. Boca Raton: CRC Press LLC.
Van Loey, A. M., Arthawn, A., Hendrickx, M. E., Haentjens, T., & Tobback, P.(1997). The development and use of an α-amylase based Time TemperatureIntegrators to evaluate in-pack pasteurization processes. lebensm-Wiss u-Techno, 30, 94−100.
Van Loey, A. M., Hendrickx, M. E., De Cordt, S., Haentjens, T., & Tobback, P.(1996a). Quantitative evaluation of thermal processes using TimeTemperature Integrators. Trends in Food Science & Technology, 7, 16−26.
Van Loey, A. M., Hendrickx, M. E., Smout, C., Haentjens, T., & Tobback, P.(1996b). Recent advances in process assessment and optimisation. MeatScience, 43, 81−98.


