Embed Size (px)
Citation preview

©OUBS, 2000
Utilising internal and external resources forinnovation: employment practices and inter-firm
collaboration
Working Paper Number 00/1
ESRC Innovation Programme Project L125251051
Management of Intellectual Capital for Innovation: Individuals and Organizations
Philip Taylor, Paul Quintas John Storey and Wendy Fowle
Management of Knowledge and Innovation Research Unit,
The Open University Business School
January 2000
Acknowledgement
The authors gratefully acknowledge the support of the
ESRC Innovation Programme in funding this research.

2
ABSTRACT
Recent years have seen a loosening of the ties between organisations and the key
resources that provide the main inputs to innovation. Processes of downsizing,
flexible employment practices, vertical disintegration, outsourcing, and an increasing
dependence on external complementary assets, all reduce the direct control and
ownership which organisations have over these resources. The key question is
whether this reduces the capability to innovate. This paper reports findings from a
large-scale survey which provides a unique dataset drawn randomly from all sectors
of the private economy, including many that are often neglected in innovation studies.
A complex range of associations are revealed, most notably that the significance of
inter-firm networking for innovation differs markedly between industry sectors. In
the area of employment flexibility, there are indications that high innovating
organisations seek long-term secure relations with employees. The data also shows
that organisations have distinctly different strategies towards staff directly involved in
innovation related activities, compared with staff in general.

3
INTRODUCTION
Recent years have seen a loosening of the ties between organisations and the key
resources that provide the main inputs to innovation. Processes of downsizing,
flexible employment practices, vertical disintegration, outsourcing, and an increasing
dependence on external complementary assets, all reduce the direct control and
ownership which organisations have over these resources. The key question is
whether this reduces the capability to innovate.
This paper examines the prevalence of such arrangements and the extent to which
they are associated with the innovative performance of firms. The paper is based on
findings from a large-scale survey of UK firms.
NETWORKING, FLEXIBILITY AND INNOVATION
Recent business and economic theory would suggest a number of reasons to expect
some form of association between the variables of innovation, employment policies
and inter-firm networking. For example, the resource-based model of the firm (e.g.
Grant 1995) propounds the view that organisations must build and maintain the
resources and capabilities to compete. Innovative products and processes are the
‘outgrowths’ of underlying capabilities and resources (Prahalad and Hamel 1990). This
position is consistent also with the view that the capability to innovate is acquired
cumulatively and is path-dependent (Pavitt 1991). It would seem to follow therefore
that firms will find it difficult to innovate in arenas where they have not grown the
capability to do so. From this kind of theoretical stance it might be expected that
‘looser’ employment contracts such as short-term contracting and outsourcing would

4
be damaging to innovative performance when compared to situations where secure,
long-term and high-commitment based employment policies are pursued.
The industrial economics theory associated with the resource model of the firm does
not however suggest that all the resources required for innovation have to be owned
by, or must be internal to, the organisation. While the capability to orchestrate
resources in the innovation process may be internal to the organisation, the resources
to be mobilised may be external (Teece 1988).
However, there is another strand of literature which places rather more emphasis on
the criticality of high-commitment management for a business strategy which aspires
towards innovation (for example, Schuler and Jackson, 1987). This approach
suggests that an organisation’s capacity to innovate depends to a very considerable
extent upon the knowledge and expertise possessed by its staff - assets which ‘can
vanish overnight’ (Stewart 1994). The importance of these ‘human resources’ has
been widely canvassed - for example, Beer, Lawrence, Mills and Walton (1985);
Kochan and Osterman, (1995). The human resource management model designed to
‘win commitment’ is premised upon the understanding that employees have a long-
term stake in an organisation and that, as a consequence, they will identify with it
(Storey 1992).
Paradoxically, the period when such a case has enjoyed so much intellectual assent has
coincided with a time when many organisations have reduced staff numbers, have
adopted looser rather than tighter contractual arrangements for their employees and
have outsourced or hived off various elements of their organisational functions. There

5
are complications because of the myriad forms which ‘flexible working’ can take,
nonetheless, there is in general terms, some extensive evidence that flexible
employment practices have increased throughout Europe including the UK (Brewster
and Hegewisch 1994; Casey, Metcalf and Millward 1997; Dex and McCulloch 1997;
Hunter, McGregor, MacInnes and Sproul 1993). Although the incidence of the varied
forms of flexible working have been tracked and recorded, the implications which they
carry for the innovative performance of firms has been neglected.
At a theoretical level, there has been disagreement about the direction of association
between employment relationships and innovative capability. As we have noted, there
are models of firm strategy which emphasise the need to build and sustain committed
and capable human resources. But, on the other hand, some have argued that looser
employment relationships could, in fact be beneficial for innovation. This latter
hypothesis stems from two rather different logics. One is that diverse contracting
practices enable and allow constantly renewing inflows of fresh ideas. The other is that
flexible employment policies exert a discipline upon labour which counteracts
complacency and rigidity. Both logics tend to celebrate the benefits of exposure to
free markets and they implicitly if not indeed explicitly offer a critique of internal
labour market arrangements (Adams and Brock 1986).
Current literature and contemporary conventional wisdom on innovation has also
focused on another theme - namely, that innovation under modern conditions is
dependent upon inter-firm networking and cross-boundary networks. It has been
contended that innovation generally occurs within networks of interacting and
collaborating organisations (Tzokas and Saren 1997). Customer-supplier links are the

6
most common type of inter-firm innovation linkage. These often take the form of the
supply of specialised components or services to the primary contractor. In addition,
the role of customers as crucial sources of knowledge and expertise within the
innovation process has been emphasised (notably, von Hippel 1976, 1988; and
Lundvall 1988).
Crucially, the trends towards vertical disintegration and outsourcing, whereby business
functional areas are hived-off, creates new cross-boundary transactions as firms have
to buy-in services and technology from newly externalised sources (Williamson 1975,
1983). To what extent outsourcing creates cross-boundary transactions with regard to
the resources required for innovation is open to investigation.
Beyond the customer–supplier relationship, networking between organisations
mutually developing new technologies, systems, services and products is also driven,
amongst other things, by the need to pool and share scarce knowledge resources. New
products, services, processes and systems it is argued, increasingly require the
integration of disparate technologies and expertise from hitherto separated disciplines
and communities of practitioners. For example, Kodama (1995) suggests that
innovation is now dependent on the strategic integration of technologies, requiring
organisations to rapidly acquire new capabilities or to ensure the presence of
knowledge and technological resources that may be beyond existing internal
capabilities.
The argument is that few, if any, organisations have the capability anymore to cover
the waterfront of technologies or possess the correct mix of knowledge resources and

7
assets to enable them to innovate and compete effectively in today’s rapidly changing
markets. As technologies become more integrative, relying on a widening range of
skills and areas of expertise, even the largest corporations need to acquire at least some
of the knowledge and technology necessary to innovate from external sources (Quintas
and Guy 1995). In total therefore, the literature seems to suggest that innovation
requires managerial skills that can span organisational boundaries, facilitate
communication between different specialists, and ensure that the organization builds
the capacity to absorb knowledge from external sources (Cohen and Levinthal 1990).
RESEARCH AGENDA
To date, the literature on organisational networks has largely remained separate from
the ‘flexibility’ literature concerning new employment contracts. In this paper we are
seeking to bring them into closer alignment, within the context of the innovation
process. There is currently greater scope for so doing because the unfolding of events
in relation to ‘outsourcing’ suggests that the distinction between individual firms and
collectives may be now much reduced. In addition, as some organisations seek to
derive some of the resources (including human resources) which are necessary to
innovate from beyond the core workforce there may be a corresponding loosening of
contractual ties. In both domains there appears to be a reduced reliance on the
internal labour market model.
In order to investigate these issues empirically we draw on a large postal survey of UK
organizations. This provides a considerable amount of data on networking activities
related to innovation and recent trends in employment strategies, targeting workers

8
identified as being directly involved in innovation-related activities as well as staff in
general. A key question which we sought to address was the extent to which it would
be possible to demonstrate an empirical linkage between the innovative performance
of businesses and different types of employment strategies and collaborative
relationships with other organisations.
We then faced a range of methodological issues not least of which was the kind of
measures of inputs and outputs which could be adopted. The indicators we used are
summarised in Figure 1. These measurable inputs and outputs accord with
conventional approaches, and treat the innovation process itself as a ‘black box’. This
study sought to quantify as many of these inputs and outputs as possible, starting with
human and financial resource inputs to innovation.
Figure 1
resources
,
The innovation process
Human Financial
investment
Financial benefits
New or
improved
products and
services
Awards, patents
copyrights,
licensing
agreements
New or
improved
processes

9
RESEARCH METHODS
We conducted a postal questionnaire survey of 2,700 private sector organisations.
This was designed in order to provide comprehensive cross-sectoral data, to achieve a
large enough dataset to allow meaningful analysis, and in order to enable the
subsequent structured identification of companies for further in-depth qualitative
study. Three pilot surveys were conducted prior to the main random survey. The
questions contained in the final questionnaire are presented in Annex 1. The
questionnaire was addressed to the chief executive of each company.
In order to maximise the chances of detecting statistically significant relationships and
to maximise the value of conducting a postal survey, we chose to sample a large
group of companies in order to obtain returned questionnaires from at least 500. Prior
research, the pilots, and the literature suggested that a total response rate of 20 per
cent would be possible from an unsolicited survey with two reminder follow-up
mailings. The chosen sample size of 2,700 (3,000 addresses purchased less 300 used
in the pilot) provided a small margin over the required 2,500.
Details of the statistical techniques used to order and analyse the data can be found in
Annex 2.
RESULTS
In all, 864 organisations responded to the survey - a 32 per cent response rate. Of
these, 667 (25 per cent of the total sample) returned usable questionnaires. In the
following sub-section we first identify the characteristics of our dataset in terms of

10
sector, turnover and ownership. This profile is then compared with the national
profile (in terms of sectoral composition) in order to gain some measure of the
representativeness of the responding companies. Following this we present the
characteristics of the respondents with regard to innovation practice and performance.
The findings are then presented, first regarding the relationship between networking
and innovation, and next the relationship between flexible employment practices and
innovation.
Profile and Representativeness of Respondents
The sectoral profile of respondents is shown in Table 1 The largest sectoral grouping
is distribution, hotels and restaurants followed by banking, finance and insurance and
then manufacturing followed by other services.

11
Table 1 Comparisons of Annual Employment Survey and innovation survey by number of employees
Percentage of total across all size bands (Annual Employment Survey figures are in italics)
100-199 200-499 500 or more Total Total
Agriculture, forestry and fishing 0.58 4.05 0.40 3.12 0.68 2.02 1.66 9.19
Manufacturing industries 18.07 4.52 10.94 3.43 3.78 5.45 32.79 13.40
Energy and water 1.01 2.49 0.82 2.02 0.33 6.39 2.16 10.90
Construction 2.84 3.58 1.26 4.52 0.28 4.21 4.38 12.31
Distribution, hotels and
restaurants 14.01 5.61 7.41 5.92 1.24 5.76 22.66 17.29
Transport and communications 5.53 2.96 3.00 2.80 1.25 3.12 9.78 8.88
Banking, finance and insurance 13.02 2.18 7.22 3.43 2.32 10.44 22.56 16.05
Other services* 2.83 4.83 0.88 4.36 0.31 3.12 4.02 12.31
Source of national figures: Annual Employment Survey Sep-95
Note Annual Employment Survey figures exclude Agriculture and Horticulture
* when questionnaires were returned two respondents indicated that their organisation was in the public administration, education and health sector. These respondents areexcluded.

12
In terms of firm size by revenue, almost 40 per cent of respondents report an annual
turnover of under £20 million (38.6 per cent), with only 6.7 per cent reporting a
turnover of £100 million or over. Between these extremes, nearly one quarter had an
annual turnover of between £20-49 million (23.7 per cent) and just under one third
had an annual turnover of between £50-90 million (31.0 per cent).
As shown in Table 2, just over two-fifths of respondents classified their organisations
as independent , while just under one third classified their organisation as a company
within a group. The smallest representation was that of business units within a larger
organisation with only 4.9 per cent of respondents classifying their organisation in
this way.
Table 2 Ownership structure of responding organisations
per cent
Independent 41.8
Company in a group 32.7
PLC 18.0
Multinational 15.1
Division of a larger
organisation
11.4
Business unit in a
larger organisation
4.9
Note: percentages sum to more than 100 because some respondents gave more than one category

13
In order to analyse the representativeness of the responding companies in terms of
sectoral representation we compared our data with statistics taken from the Annual
Employment Survey (1995). Table 1 shows this data. Comparing the two columns
headed ‘total’ suggests that, among our respondents (shown in italics), there was an
over-representation of organisations in the agriculture, energy and water, construction,
and ‘other services’ sectors, and an under-representation among manufacturing
companies and distribution, hotels and restaurants.
Table 1 shows that the sample over-represents the largest employment category (over
500 employees) in all sectors. However, the overall under-representation of our total
survey respondents in the manufacturing sector is seen to be concentrated in firms up
to 499 employees – above 500 employees our data is marginally over-representative
of manufacturing.
Innovation Practice and Performance
The survey provided a number of indicators concerning the strategic importance of
innovation in the firms, the resources devoted to it, and the achievements and outputs
from innovative activities. Innovation is clearly regarded as being of considerable
importance to these firms. When asked to say to what extent innovation is a critical
factor in meeting their organisation’s business objectives, over one third (38.6 per
cent) responded considerable, just over one third (33.7 per cent) responded quite a lot
and just under one quarter (23.7 per cent) responded to some extent. In considering
the overall innovative performance of their organisation in comparison to other

14
organisations operating in the same sector the vast majority of respondents rated
themselves average or above (40.0 per cent and 51.9 per cent respectively).
We also asked respondents to categorise their innovation strategy according to
whether they intended to be leaders, follower-differentiators, externally-sourced
improvers, customer dependent, or non-innovators (these are summaries – see Annex
for full statements). It was clear that the majority (56 per cent) aim to be innovative
leaders. Looking outside for technical advances and focusing on internal
improvement was mentioned by over half the respondents (50.7 per cent), and being
follower-differentiators is a strategy adopted by two fifths (40.6 per cent). On the
other hand, just over a fifth (22.2 per cent) relied heavily on customer inputs for new
specifications, know-how or technology. However, these categories are not perceived
to be mutually exclusive by our respondents. This might, for example, reflect
different strategies for different products or processes, or differences over time,
according to product lifecycles.
The overall picture that emerges is that innovation plays a significant role in firm
strategy, and firms have high expectations of their innovative performance. How is
this reflected in commitment and resource inputs to innovation? Asked to identify the
approximate percentage of staff involved in innovation related activities, three
quarters (74 per cent) of respondents stated that this group represented 10 per cent or
less of the workforce, less than a tenth (7.2 per cent) responded that this group
represented between 11 per cent and 20 per cent while only 4.7 per cent answered that
this group represented over 30 per cent of the workforce. Similarly with financial
commitment to innovation, over four fifths (84.2 per cent) of respondents stated that

15
they committed 10 per cent or less of their organisation’s annual turnover to activities
related to innovation. Clearly, for most firms, the strategic importance of innovation
is not reflected in a high percentage of resources being devoted to it. The idea that
innovation is a systemic, organization-wide activity, involving all functional areas
rather than just the R&D department (Imai et al 1985) does not appear to be prevalent
in the UK.
The survey also provided some indication of the innovative performance of the
respondent firms. Most respondents considered the innovations in their organisation
over the previous two years to have been fairly or very technically successful (66.5
per cent and 20.1 per cent respectively). Financial success of innovations was rated as
‘fairly successful’ by the majority (57.9 per cent) of respondents with just over one
fifth (20.9 per cent) of respondents stating the innovations in their organisation had
been ‘very successful’ in financial terms.
More detailed questioning revealed the extent to which innovative activities had
resulted in new or improved products and processes during the last five years. The
underlying assumption is that there is a spectrum of innovation from marginal
improvement to products in existing markets at one extreme, through to wholly new
products in new markets at the other extreme.
Improved products are most likely to be targeted on existing markets. Over half (54.7
per cent) of respondents had introduced significantly improved, and around a third
(31.3 per cent) had launched marginally improved, products or services. Almost a
third (32.5 per cent) had introduced wholly new products or services into existing

16
markets. As for entry into new markets almost a third (31.0 per cent) of respondents
had launched ‘significantly improved’ products or services, and a similar proportion
(31.3 per cent) ‘wholly new’ products or services, into new markets.
Just over a third (35.5 per cent) of respondents had introduced marginally improved
processes, nearly two thirds (63.7 per cent) significantly improved processes and just
over one third (35.2 per cent) wholly new processes in the last five years.
Objective evidence of innovative outputs is provided by external recognition of
various types. Almost one third of respondents had received or been nominated for an
external award related to innovation - a high percentage given the random nature of
our sample. Just under a quarter of respondents had applied for patents, and just
under one fifth had been granted patents on their technology. Again this is a high
percentage given the random sample, and given that only 45 per cent of respondents
are within sectors where patenting might be expected - manufacturing, construction,
energy, transport and communications.
Inter-Firm Networking, Employment Flexibility And Innovation
For the majority of our respondents, the primary relationships relevant to innovation
were those formed with their suppliers - 15.8 per cent reported that they collaborated
with suppliers ‘to a large extent’ on innovation related activities. The next most
important were collaborative relationships with customer organisations. Some 12.8
per cent relied on customer inputs for new specifications, know-how or technology ‘to
a large extent’. Responding organisations seldom collaborated with their competitors
in order to innovate.

17
Regarding employment flexibility, the majority of staff in the sample firms were
directly employed full-time, but significant numbers of contract staff were also
reported. Three quarters of respondents gave a maximum importance rating to
demonstrating a long-term commitment to employees, and over half the respondents
rated the importance of minimising job insecurity similarly highly.
These responses form the backdrop to the detailed information on employment
strategies and practices presented in Table 3. In the case of staff in general (not in
italics) between a third and a half of respondents have made more use of flexible
hours contracts, part-time employment contracts and, particularly, short-term or
temporary employment contracts over the last five years. Around a third of
respondents see these measures as being central to their overall employment strategy

18
Table 3 Employment strategies used in the last five years
More
per cent
Same
per cent
Less
per cent
CENTRAL
to overall
strategy
per cent
MARGINAL
employment
per cent
flexible hours contracts 33.3 16.5 54.6 58.3 5.5 5.6 33.0 25.7 67.0 74.3
short-term/temporary
employment contracts
49.6 26.3 39.3 49.0 7.8 7.6 36.1 27.4 63.9 72.6
part-time workers 36.3 15.7 51.3 57.3 8.6 8.6 29.3 16.7 70.7 83.3
outsourcing of R&D or
product/service development
- 32.9 - 36.7 - 9.5 - 37.1 - 62.9
redundancies 27.1 10.2 37.8 44.7 34.4 24.4 33.6 18.1 66.4 81.9
secondments from/to other
organisations
18.9 15.3 46.8 48.7 14.2 10.9 12.5 13.4 87.5 86.6
bringing back former
employees on flexible
contracts
14.2 7.7 44.1 49.6 20.0 14.7 9.7 7.5 90.392.5
Notes: * Non-italicised data relates to overall employment strategy; data for staff directly involved ininnovation related activities are in italic** This table excludes respondents reporting that they did not know or could not say and so cell entriesdo not sum to 100 per cent.
Table 3 also shows (in italics) the responses to similar questions as in the previous
discussion, but targeted on those employees directly involved in activities related to
innovation. This shows that trends towards greater use of flexible employment
practices are less a feature among this group than among staff in general. In
particular, redundancies have increased significantly less amongst staff involved in
innovation.

19
The final two columns in Table 3 show that the majority of respondents, thinking
about the staff involved in innovation, overwhelmingly see all of these strategies, with
one notable exception, as being marginal to their overall employment strategies and
practices. The exception to this concerns R&D outsourcing. The most striking
finding from Table 3 is that there has been a marked trend towards the outsourcing of
R&D functions. Almost one third of the organisations surveyed have increased R&D
outsourcing in the last five years. The right-hand two columns of Table 3 suggest that
this is a relatively important part of overall employment strategy.
Our primary research question concerns whether measures such as flexible
employment strategies and outsourcing R&D has an impact on innovative capability.
However, when organizations adopting these measures were asked if they had taken
into account the possible impact on innovative performance of moves in this
direction, less than a fifth (15.6 per cent) responded a lot and just over two fifths
(44.1 per cent) answered to some extent.
Relationship Between Networking, Flexibility And Innovation
Table 4 presents Pearson correlations between the variables. As can be seen in this
table, there are small but significant associations between the networking variable and
the measures of trends in employment flexibility. Thus greater use of more flexible
employment contracts in the last five years is associated with more inter-firm
networking.

20
Table 4 Pearson correllation coefficients between survey variables
1 2 3 4 5 6 7 8 9 10 11 12 13 14 15 16 17 18 19 20 21 22
1. Ratings of innovativeness
2. Extent of product & process innovation -0.24e
3. External recognition for innovation 0.05ns -0.28e
4. Percentage of staff involved ininnovation
-0.19e 0.24e -0.17d
5. Annual turnover 0.02ns 0.26e -0.26e 0.21e
6. Percentage of turnover spent oninnovation
-0.27e 0.23e -0.13b 0.48e -0.07ns
7. Total number of employees -0.02ns 0.21e -0.20e 0.07ns 0.70e -0.01ns
8. Percentage of temporary employees 0.00ns -0.04ns 0.02ns 0.06ns -0.01ns 0.04ns 0.02ns
9. Networking 0.16e -0.23e 0.17e -0.24e -0.17e -0.33e -0.18e -0.02ns
10. Staff relations 0.22e -0.02ns -0.06ns 0.01ns 0.07ns -0.04ns 0.04ns 0.04ns 0.08b
11. Relationships with suppliers 0.17e -0.15e 0.13d -0.04ns -0.07ns -0.06ns -0.05ns -0.01ns 0.22e 0.00ns
All staff
12. Flexible contracts 0.04ns -0.16e 0.08b -0.17d -0.18e -0.05ns -0.22e -0.16e 0.09c 0.01ns -0.02ns
13. Retention policies -0.04ns -0.03ns 0.09c -0.06ns -0.17e -0.15c -0.14e -0.07a 0.01ns -0.09b -0.12d 0.00ns
Staff directly involved in innovation
14. Flexible contracts -0.05ns -0.09ns -0.02ns -0.22e -0.11c -0.19e -0.11d -0.07a 0.08b -0.03ns 0.00ns 0.41e 0.10c
15. Retention policies -0.11c 0.04ns 0.08b 0.02ns -0.09b -0.03ns -0.08b -0.02ns -0.03ns -0.17e -0.08b 0.08b 0.50e 0.00ns
16. Outsourding R & D -0.05ns -0.09a 0.04ns -0.10a -0.14c 0.00ns -0.12c -0.05ns 0.07ns -0.10b -0.01ns 0.25e 0.17e 0.24e 0.27e
17. Agriculture etc 0.00ns -0.01ns -0.01ns -0.04ns -0.06ns 0.00ns -0.06ns 0.11d 0.01ns -0.03ns 0.04ns -0.02ns -0.03ns 0.03ns -0.05ns 0.01ns
18. Manufacturing 0.04ns 0.09c -0.17e 0.05ns 0.08a 0.06ns 0.03ns 0.00ns 0.01ns 0.12d 0.03ns 0.00ns -0.13d 0.02ns -0.10c -0.06ns 0.61e
19. Energy/Water -0.03ns 0.01ns -0.05ns 0.03ns 0.13d 0.13b 0.08a 0.06ns -0.07ns 0.02ns 0.05ns -0.02ns -0.18e 0.02ns -0.09c -0.02ns 0.63e 0.58e
20. Construction 0.04ns -0.05ns 0.06ns -0.06ns 0.02ns 0.01ns 0.00ns 0.08b 0.10c -0.02ns 0.09c 0.12d -0.09c 0.10c 0.00ns 0.06ns 0.62e 0.58e 0.60e
21. Transport -0.01ns 0.05ns 0.06ns -0.01ns 0.00ns 0.02ns 0.01ns 0.02ns 0.01ns 0.00ns 0.11d 0.00ns -0.09c 0.00ns -0.02ns 0.03ns 0.65e 0.61e 0.63e 0.62e
22. Banking, finance, etc 0.04ns 0.10c 0.02ns 0.03ns 0.20e 0.02ns 0.19e 0.02ns 0.00ns 0.00ns 0.08b -0.10c -0.13d -0.02ns -0.07a 0.01ns 0.59e 0.54e 0.56e 0.56e 0.59e
23. Other services 0.02ns 0.00ns 0.06ns 0.05ns -0.06ns 0.09ns -0.06ns 0.05ns -0.04ns 0.03ns 0.10c -0.05ns -0.06ns -0.02ns -0.06a -0.02ns 0.62e 0.57e 0.59e 0.59e 0.62e 0.55e
Statistical significance a=0.10 b=0.05 c=0.01 d=0.001 e=0.0001

21
Ordinary least squares regression analysis was employed in order to examine the
relationship between the measures of innovation and networking and flexibility, while
controlling for other variables. Analysis was carried out on the whole sample (Table
5) and selected sectors (Tables 6 to 9).
Table 5 Prediction of innovation variables
Predictors Innovation Variables
Ratings ofinnovativeness
Extent of product andprocess innovation
External recognitionfor innovation
Percentage of staff involved ininnovation
-0.09b 0.08b -0.10c
Annual turnover 0.20e -0.15d
Percentage of turnover spent oninnovation
-0.13d 0.10c
Total number employees -0.10b
Percentage of temporary employeesNetworking 0.07a -0.14e 0.09b
Staff relations 0.20eRelationships with suppliers 0.14e -0.10c 0.07a
All staffFlexible contracts -0.11dRetention policies
InnovatorsFlexible contracts -0.07b
Retention policies -0.06aOutsourcing R&D
Sector
Agriculture etcManufacturing 0.10b -0.36e
Energy/Water -0.16dConstruction 0.11b
Transport 0.09a 0.13c
Banking, finance, etc 0.13c
Other servicesF=15.69e F=13.46e F=14.02e
AdR2=0.12 AdR2=0.14 AdR2=0.16
Significance a 0.10 b 0.05 c 0.01 d 0.001 e 0.0001
22
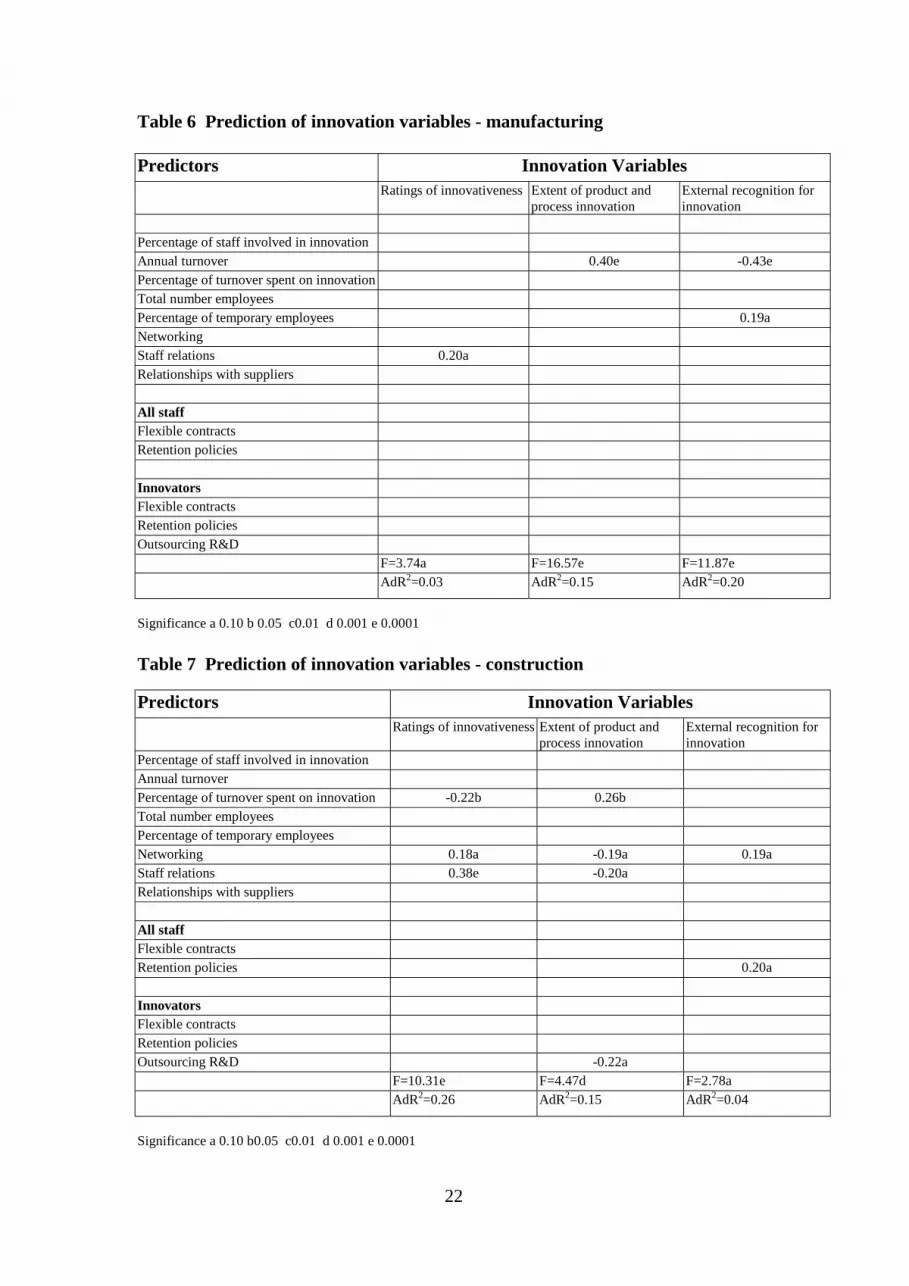
Table 6 Prediction of innovation variables - manufacturing
Predictors Innovation VariablesRatings of innovativeness Extent of product and
process innovationExternal recognition forinnovation
Percentage of staff involved in innovation
Annual turnover 0.40e -0.43e
Percentage of turnover spent on innovation
Total number employees
Percentage of temporary employees 0.19a
Networking
Staff relations 0.20a
Relationships with suppliers
All staffFlexible contracts
Retention policies
InnovatorsFlexible contracts
Retention policies
Outsourcing R&D
F=3.74a F=16.57e F=11.87e
AdR2=0.03 AdR2=0.15 AdR2=0.20
Significance a 0.10 b 0.05 c0.01 d 0.001 e 0.0001
Table 7 Prediction of innovation variables - construction
Predictors Innovation VariablesRatings of innovativeness Extent of product and
process innovationExternal recognition forinnovation
Percentage of staff involved in innovation
Annual turnover
Percentage of turnover spent on innovation -0.22b 0.26b
Total number employees
Percentage of temporary employees
Networking 0.18a -0.19a 0.19a
Staff relations 0.38e -0.20a
Relationships with suppliers
All staffFlexible contracts
Retention policies 0.20a
InnovatorsFlexible contracts
Retention policies
Outsourcing R&D -0.22a
F=10.31e F=4.47d F=2.78a
AdR2=0.26 AdR2=0.15 AdR2=0.04
Significance a 0.10 b0.05 c0.01 d 0.001 e 0.0001

23
Table 8 Prediction of innovation variables - finance, insurance and businessservicesPredictors Innovation Variables
Ratings of innovativeness Extent of product andprocess innovation
External recognition forinnovation
Percentage of staff involved in innovation
Annual turnover
Percentage of turnover spent on innovation -0.17a
Total number employees 0.29c
Percentage of temporary employees
Networking 0.32e -0.18a
Staff relations 0.31d
Relationships with suppliers
All staffFlexible contracts
Retention policies
InnovatorsFlexible contracts
Retention policies -0.24c 0.21b
Outsourcing R&D
F=13.60e F=6.76e F=3.04a
AdR2=0.26 AdR2=0.14 AdR2=0.02
Significance a 0.10 b 0.05 c 0.01 d 0.001 e 0.0001
Table 9 Prediction of innovation variables -other services Predictors Innovation Variables
Ratings ofinnovativeness
Extent of product andprocess innovation
External recognitionfor innovation
Percentage of staff involved in innovation
Annual turnover 0.29c
Percentage of turnover spent on innovation -0.31d 0.24b -0.27c
Total number employees
Percentage of temporary employees -0.19a
Networking -0.20a
Staff relations 0.18a
Relationships with suppliers
All staffFlexible contracts 0.24b
Retention policies 0.26c
InnovatorsFlexible contracts
Retention policies
Outsourcing R&D -0.22b
F=5.61c F=5.62d F=4.95d
AdR2=0.10 AdR2=0.19 AdR2=0.16
Significance a 0.10 b 0.05 c 0.01 d 0.001 e 0.0001

24
As can be seen in Table 5, when all respondents are considered together, both the
extent of networking and the importance of supplier relationships are positively
associated with each measure of innovative performance, after taking into account
factors such as sector and percentage of turnover spent on innovative activities.
Notably, a high commitment (low flexibility) employment strategy is associated with
ratings of firms’ innovativeness. In contrast, more product and process innovations is
associated with greater use of flexible employment practices among staff in general.
External recognition for innovation is associated with less use of flexible contracts
among staff directly involved in innovation related activities.
It is noticeable that a high commitment employment strategy is associated with higher
ratings of firms’ innovativeness across all sectors whereas the indicators of
networking and supplier relationships do not show a consistent pattern with the
different measures of innovation. There are also other interesting differences between
sectors. For example, in the case of manufacturing, employing a greater proportion of
temporary employees is associated negatively with innovation - there is a lower
likelihood of external recognition for innovation. Similarly, in the case of ‘other
services’ a higher proportion of temporary employees is associated with fewer process
and product innovations. This flexibility variable however showed no association
with any measure of innovation in the other sectors. Also, in the case of construction,
greater outsourcing of R&D capability is associated with a greater number of product
and process innovations. This variable showed no association with any variable in the
other sectors apart from other services where, as might be expected, greater
outsourcing of R&D capability is associated with a lower likelihood of having
received external recognition for innovation.

25
Discussion and conclusions
In this paper we have focused on two phenomena – employment flexibility and
networking - and the ways in which they relate to the innovative behaviour of
organisations. The organizations concerned were not selected to be high innovators,
indeed the survey provides insights into a reasonably representative cross-section of
the UK private sector, including sectors such as hotels and catering that may not
always be considered innovative.
We have reported findings which show that, amongst the collaborative relationships
we examined, collaboration with suppliers appear to be most strongly associated with
innovation related activities. Our findings also indicate that flexible employment
practices are less a feature among staff directly involved in innovation related
activities than among staff in general. This is an important finding and it appears to
align with the finding that organisations see innovation as involving a small subset of
employees (i.e. it is not systemic), and they have different strategies towards staff
involved in innovation compared with staff in general.
Our analysis also indicates that greater involvement in networking activities related to
innovation is associated, albeit weakly, with a tendency towards the greater use of
flexible employment practices. While our cross-sectional data set does not allow us
to draw firm conclusions about the nature of this relationship these findings suggest
that there may be a trend towards the direct replacement of in-house capability to

26
innovate with the sourcing of this capability from elsewhere. On the other hand the
size of this association indicates that this does not seem to be a major reason for the
apparent growth in more flexible employment relationships.
The findings point to the critical importance of networking for the innovative
performance of organisations overall. However, such relationships were not
consistent across all sectors and were not observed at all for manufacturing
companies. Probing this finding in relation to manufacturing, there was some
indication that supplier relationships are linked to innovative performance, but
networking more widely is not. This does not of course mean that our sample of
manufacturing companies do not network; rather, it means that the propensity to
network is not statistically linked with innovative performance.
One of the most striking findings from the survey is that there has been a marked
trend towards the outsourcing of R&D functions. Almost one third of the
organisations surveyed have increased R&D outsourcing in the last five years, and the
survey suggests that this is seen as a relatively important component of firms’
innovation strategies.
We can also draw some tentative conclusions on the phenomenon of employment
flexibility. First, our finding that high innovators aim for long-term secure
relationships with employees supports the view that innovation is the result of long-
term commitment to building resources and capabilities. However, these measures
showed no statistically significant associations with the objective measures of
innovative performance for the sample overall.

27
Our findings suggest that there is not a clear-cut relationship between employment
flexibility and innovative performance. First, we find that espousing greater
importance to long-term secure employment relationships is associated with higher
ratings of innovative performance. Second, looking at actual employment practice,
we find the introduction of more flexible employment policies among staff in general
does appear however to be associated with higher innovative performance. One
possible explanation for this apparently contradictory finding is that positive attitudes
towards commitment to staff may not always be reflected in the reality of employment
practices. An alternative explanation is that greater use of flexible employment and
retention policies is not necessarily seen by employers as being opposed to an
intention to demonstrate a long-term commitment to employees. For example, there
may be increased demand for greater flexibility among workers, for which employers
are attempting to cater.
We have also found evidence that differential treatment of staff in general compared
with those directly involved in innovation related activities may be associated with the
innovative performance of organisations. Most firms perceive innovation to be the
responsibility of a select few employees – it is not regarded as being systemic.
However, our findings also indicate that the role of flexible employment and retention
policies for staff in general and those directly involved in innovation depends on the
sector which is being considered. Similarly, whether or not an organisation’s
proportion of temporary, contract or freelance workers is associated with measures of
innovation depends upon the sector being considered. These findings suggest that
making universal statements about the relationship between employment practices

28
and innovative performance may not be helpful. We would suggest that future studies
look at individual sectors in detail and compare small groups of sectors, as well as
differentiating between staff in general and those identified as being involved in
innovation related activities.
For organisations, these findings indicate that the development and effective
management of external alliances and human resources may be important if they are
to maximise their innovative performance. Outsourcing key functions such as R&D
presents challenges to organizations in managing the cross-boundary interfaces, and
requires firms to develop ‘absorptive capacity’ if they are to be able to internalise and
assimilate external knowledge (Cohen and Levinthal 1990). For employees, these
findings indicate that, as organisations strive to compete in the introduction of new
products and services, moves towards greater employment flexibility may mean
greater job insecurity for some. The orientations and expectations of those employees
on looser contracts require some considerable investigation. The single organisation -
that is, ‘the company’, is itself, ultimately, an alliance of investors. But it has evolved
as a social entity that has been able often to attract loyalty, commitment and
expectations which well exceed the limits of the legal contract. How far these aspects
can survive the redrawing of contracts in a new ‘post-organisational’ age is very much
open to question - and investigation.
ACKNOWLEDGEMENTS
The authors acknowledge the support of the Economic and Social Research Council
Innovation Programme in funding this research

29
References
Adams W. and Brock J. (1986) The bigness complex: industry, labour andgovernment in the American economy, Pantheon, New York.
Beer, M., Spector, B., Lawrence, P., Mills, D., and Walton, R. (1985) HumanResources Management: A General Managers Perspective, New York, Free Press
Brewster, C. and Hegewisch, A. (1994) Policy and Practice in European HumanResource Management, London, Routledge
Casey, B., Metcalf, H. and Millward, N. (1997) Employers’ use of flexible labour,Policy Studies Institute, London.
Cohen, W.M. amd Levinthal, D.A. (1990) ‘Absorptive capacity: a new perspective onlearning and innovation’, Administrative Science Quarterly, 35, 128-152.
Davidow, W. H. and Malone, M S (1992) The virtual corporation: structuring andrevitalizing the corporation for the 21st century, Harper Business, New York.
Dex, S. and McCulloch, A. (1997) Flexible Employment, London: Macmillan PressLtd.
Freeman, C. (1992) The economics of hope, Pinter Publishers, London.
Grant, R. M. (1995) Contemporary Strategy Analysis, Blackwell Publishers,Cambridge, Mass.
Grant, R. M. (1996) ‘Toward a Knowledge-Based Theory of the Firm’, StrategicManagement Journal, vol. 17 (Winter Special Issue), pp. 109-122.
Gulati, R. (1998) ‘Alliances and Networks’ Strategic Management Journal, vol. 19,pp. 293-317.
von Hippel, E. (1976) ‘The dominant role of users in the scientific instrumentinnovation process’, Research Policy, vol. 5, no. 3, pp. 212-239.
von Hippel, E. (1988) The sources of innovation , Oxford University Press, NewYork.
Hunter, L. McGregor, A. MacInnes, J. and Sproull, A. (1993) ‘The “flexible firm”:strategy and segmentation’, British Journal of Industrial Relations, 31 (3), pp. 383-407.
Imai, K., Nonaka, I. and Takeuchi, H. (1985) ‘Managing the new productdevelopment game’ in Clark, K. and Hayes, R. (eds.) The Uneasy Alliance, HarvardBusiness School Press, Cambridge, Mass.
Kochan, T. and Osterman, P. (1994) The Mutual Gains Enterprise, Boston, HarvardBusiness School Press
Kodama, F. (1995) Emerging patterns of innovation: sources of Japan's technologicaledge, Harvard Business School Press, Boston, Mass.
Lundvall, B-A. (1988) ‘Innovation as an interactive process: from user-producerinteraction to the national system of innovation’, pp. 349-369 in Technical changeand economic theory, edited by G. Dosi, C. Freeman, R. Nelson, G. Silverberg, and L.Soete. London: Pinter Publishers.

30
Pavitt, K. (1991) ‘Key characteristics of the large innovating firm’, British Journal ofManagement, vol. 2 issue no.1, pp. 41-50.
Pollert, A., Ed (1991) Farewell to Flexibility, Oxford, Blackwell.
Prahalad, C.K. and Hamel, G. (1990) ‘The core competence of the corporation’,Harvard Business Review (May-June)
Quintas, P. and Guy, K. (1995) 'Collaborative, Pre-competitive R&D and the Firm'Research Policy, Vol. 24, No. 3, 325-348.
Schuler, R. and Jackson, S (1987) ‘Linking competitive strategies with humanresource management practices’, Academy of Management Executive 1 (3): 207-219
Stewart, T. A. (1994) ‘Your company’s most valuable asset: intellectual capital’,Fortune, 3 October, pp. 38-33.
Storey, J. (1992) Developments in the Management of Human Resources, Oxford:Blackwell.
Teece, D. J. (1988) Profiting from technological innovation: implications forintegration, collaboration, licensing and public policy, Research Policy, 15, 285-305.
Tzokas, N. and Saren, M. (1997) ‘On strategy, typologies and the adoption oftechnological innovations in industrial markets’, British Journal of Management, vol.8, special issue, S91-S105.
Williamson, O. E. (1975) Markets and Hierarchies: Analysis and AntitrustImplications, The Free Press, London.
Williamson, O.E.(1983) ‘Organizational Innovation: The Transaction-CostApproach’, in J. Ronen (ed.), Entrepreneurship , Heath Lexington, Lexington, Mass.,pp. 101-134.

31
Annex 1
The questionnaire items are listed below (response scales are included in brackets).
Attitudes towards innovation, measures of innovative activities.
Question: To what extent is innovation a critical factor in meeting your organisation’s
business objectives? (considerable, quite a lot, to some extent, hardly at all, don’t
know, not applicable)
Question: How would you rate the overall innovative performance of your
organisation compared to other organisations operating in your sector? (above
average, average, below average, don’t know, not applicable)
Question: Overall how would you rate the technical and financial success of
innovations in your organisation over the last two years? (very successful, fairly
successful, not very successful, very unsuccessful, don’t know, not applicable)
Question: This organisation
• aims to be a leader in terms of the introduction of innovations
• seeks to differentiate and improve on others’ innovations rather than be first into a
field
• tends to look outside for technical advances but tries to improve the ways it does
things
Respondents were asked to tick all those that applied.
Question: In the last five years have you launched products or services in existing or
new markets (marginally improved, significantly improved, wholly new)

32
Question: In the last five years have you introduced processes that are (marginally
improved, significantly improved, wholly new)
Question: Which of the following, if any, have applied to your organisation in the last
five years?
• Received or nominated for an external award related to innovation
• Applied for patents
• Patents granted
• Technology or copyright licenses granted by your organisation to others
(yes, no, don’t know, not applicable)
Networking
Question: In order to innovate to what extent does your organisation collaborate with
the following
• your suppliers
• competitors
• other organisations in a network
• customer organisations.
(to a large extent, quite a lot, not very much, not at all, don’t know, not applicable)
Supplier relationships
Question: What importance does your organisation attach to the following:
• long-term relationships with suppliers
• maximising flexibility in relationships with suppliers
(a lot, some, a little, none, don’t know/can’t say, not applicable)

33
Flexible employment practices
Question: What importance does your organisation attach to the following:
• demonstrating a long-term commitment to employees
• minimising feelings of job insecurity
(a lot, some, a little, none, don’t know/can’t say, not applicable)
The following question was asked as two separate questions referring to staff in
general and staff directly involved in innovation related activities.
Question: (Thinking only about employees directly involved in activities related to
innovation) In the last five years has your organisation made more, the same or less
use of any of the following policies or practices?
• flexible hours contracts (e.g. annualised hours)
• short-term/temporary employment contracts
• part-time workers
• outsourcing of R&D or product service development [only asked for workers
directly involved in innovation related activities].
• redundancies
• secondments from/to other organisations
• bringing back former employees on flexible contracts
(more, same, less, don’t know)

34
Details of the responding organisation
Respondents were also asked:
• to indicate the numbers of full-time, part-time and unspecified time directly
employed and temporary, contract, or freelance workers working for their
organisation;
• the approximate percentage of staff employed in innovation related activities,
• financial turnover
• percentage of turnover spent on innovation related activities
• what the organisation does or makes.

35
Annex 2
The research was focused on three main variables - innovation, networking and
employment flexibility, for each of which a range of indicators were used. In order to
reduce the number of variables included in the detailed statistical analysis, principal
components analysis was carried out on each. Analysis of the four questions
concerned with the extent of collaborative relationships with suppliers, competitors,
other organisations in a network and customers (see Annex 1) produced a single
factor solution. Thus for the purposes of multivariate analysis, factor scores were
produced giving an overall indication of the extent of networking by responding
organisations. The variable with the highest loading on the factor concerned the
extent to which the organisation collaborated with other organisations in a network.
In the case of the employment flexibility variables, two components each were
identified for the sets of questions concerning changes in employment practices
among staff in general and those directly involved in innovation related activities.
Thus, for the purposes of multivariate analysis, factor scores for each of the four
factors were used instead of the individual variables. The factors were labelled
‘flexible employment contracts’ and ‘retention policies’. In the case of staff in
general the former contained the following variables in order of the variable with the
higher loading on the factor: ‘part-time workers’, ‘short-term/temporary employment
contracts’ and ‘flexible hours contracts’. In the case of staff directly involved in
innovation-related activities, the order of the loadings was reversed. In the case of
staff in general the ‘retention policies’ factor contained the following variables in
order of the size of their loading on the factor: ‘bringing back former employees on

36
flexible contracts’; ‘redundancies’; and ‘secondments from/to other organisations’. In
the case of staff directly involved in innovation-related activities the variable order
was reversed.
In order to facilitate comparisons between staff in general and staff directly involved
in the innovation process a question concerning outsourcing R&D activities, which
was only included in the set of questions concerning those individuals who were
directly involved in innovation related activities, was entered separately in each
analysis.
Principal components analysis was also carried out on four variables concerned with
ratings of the importance of relationships with staff and supplier relationships. All
four variables were entered in the analysis together and a two factor solution was
obtained. The two questions concerned with staff relationships loaded on the first
factor and the two questions concerned with supplier relationships loaded highly on
the second. We therefore decided to treat both factors as new composite variables.
Factor scores for each new variable were used in subsequent analyses. These factors
were labelled: ‘staff relations’ and ‘supplier relations’. For each factor the two
variables had a similar sized loading on the factor.
Additionally, we also carried out principal components analysis on the various
measures of innovation. Analysis of three variables concerned with respondents’
assessment of the innovative performance of their organisation: rating of overall
innovative performance; and technical and financial success of recent innovations
revealed a single factor solution. Therefore, in multivariate analysis, a single factor
37
score labelled ‘ratings of innovativeness’ was used. Analysis of three items
concerned with whether organisations had introduced new or improved products or
processes also revealed a single factor solution. Thus a factor score labelled ‘extent
of product and process innovation’ was entered for multivariate analysis. Finally,
analysis of four items concerned with external recognition for innovation-related
activities (e.g. won and award or had a patent granted) also revealed a single factor
solution which was treated as a single variable. This was labelled ‘external
recognition for innovation’.
In addition, transformations were carried out on some variables in order to reduce
skewness.