Embed Size (px)
Citation preview
Page 1/18
Insights into Bioindicator Redundancy for MonitoringWater Quality based on Functional Units of PeriphyticProtozoan Communities in Marine EcosystemsSyed Shabi Ul Hassan Kazmi
Ocean University of ChinaUroosa Uroosa
Ocean University of ChinaAlan Warren
Natural History MuseumGuangjian Xu
Qingdao University of Science and TechnologyHenglong Xu ( [email protected] )
Ocean University of China https://orcid.org/0000-0003-1954-6647
Research Article
Keywords: Marine environment, periphytic protozoa, response units, redundancy level, water quality
Posted Date: June 1st, 2021
DOI: https://doi.org/10.21203/rs.3.rs-481939/v1
License: This work is licensed under a Creative Commons Attribution 4.0 International License. Read FullLicense
Page 2/18
AbstractAlthough periphytic protozoan communities have long been used for the bioassessment of water quality, their utilityis hampered by functional redundancy leading to high “signal to noise” ratios. In this study, a 1-year baseline surveyof periphytic protozoan communities was carried out in coastal waters of Yellow sea, northern China, in order todetermine redundancy levels in conditions of differing water quality. Samples were collected at four sampling sitesalong a pollution gradient. Environmental variables such as salinity, chemical oxygen demand (COD), andconcentrations of dissolved oxygen (DO), soluble reactive phosphates (SRP), ammonium nitrogen (NH4-N) and nitratenitrogen (NO3-N) were measured to compare with biotic factors. A total of 53 functional units (FUs) were identi�edfrom 144 observed protozoan species based on four biological traits, i.e., feeding type, body size, movement type andsource of food supply. For reducing the “signal to noise” ratios of species-abundance/biomass data, the peelingprocedure was used to identify the bioindicator redundancy levels based on these FUs. Three consecutive subsets ofresponse units (RU1–RU3) with correlation coe�cients >0.75 of the full FU dataset were identi�ed, comprising 12, 21and 9 FUs, respectively. Algivores and bacterivores were dominant in RU1 and RU2 among the polluted sites, whereasraptors were dominant in RU3 at the unpolluted site. In terms of relative abundance, RU1 was the primary contributorto the protozoan communities during the 1-year cycle and its relative abundance increased with increasing pollution,whereas RU2 and RU3, with complementary temporal distributions, generally decreased with increasing pollution.Ordinations based on boot-strapped average analyses revealed a signi�cant variation in functional pattern of all threeRUs among the four sampling sites. Biological-environmental match analysis demonstrated that the variability wasdriven by the increasing concentrations of nutrients (e.g., NH4-N, NO3-N and PO4-P) and decreasing concentrations ofDO (P<0.05). Based on these �ndings, it is suggested that there were high levels of functional redundancy amongperiphytic protozoan communities used as bioindicators of marine water quality.
IntroductionTraditionally, community responses to environmental change are investigated using full species datasets (Jiang etal., 2007, 2014; Xu et al., 2014a, b; Xu et al., 2017). When using such datasets, however, the community-basedbioassessment is generally subject to a high “signal to noise” ratio (Clarke, 1993; Clarke and Warwick, 1998; Xu et al.,2014a, b, 2015a, b). A number of studies have demonstrated the interchangeability of species that serve equivalentfunctions within an ecosystem (Gray et al., 1998; Zhong et al., 2014; Zhang and Xu, 2015). This indicates that there issubstantial structural and functional redundancy within communities (Menge et al., 1994; Chapin et al., 1995; Frost etal., 1995). Therefore, when using community-based bioassessments, the identi�cation of functional redundancy isconsidered an important operative tool for reducing the “signal to noise” ratios (Clarke, 1993; Clarke and Warwick,1998; Gray et al., 1998; Zhong et al., 2014). In full species datasets this can be achieved through multivariate analysisby identifying the response units (RUs), i.e., subsets of species with interchangeable functional roles.
Most periphytic protozoa are primary grazers that play a pivotal role in microbial food webs by controlling the �ux ofmatter and energy from lower to higher trophic levels (Azovsky, 1988; Crawford et al., 1997; Finlay and Esteban, 1998;Kchaou et al., 2009; Fischer et al., 2002; Weitere et al., 2003; Zhong et al., 2017; Kazmi et al., 2020b). Furthermore,they typically have relatively short life cycles and high sensitivity to environmental change (Jiang et al., 2011; Xu etal., 2014a; Kazmi et al., 2021). Consequently, periphytic protozoa have been widely used as bioindicators of waterquality in many types of aquatic habitat worldwide (Sime-Ngando et al., 1995; Coppellotti and Matarazzo, 2000; Norfet al., 2009; Kathol et al., 2011; Jiang et al., 2011; Zhang et al., 2012; Payne, 2013; Jiang et al., 2014; Zhong et al.,2014; Xu et al., 2014a; Feng et al., 2015; Xu et al., 2017; Kazmi et al., 2021). Nevertheless, their utility is often limitedby high “signal to noise” ratios due to the high functional redundancy in such communities (Menge et al., 1994;
Page 3/18
Chapin et al., 1995; Frost et al., 1995; Clarke and Warwick, 1998; Coppellotti and Matarazzo, 2000; Xu et al., 2014b)and, hitherto, few studies have addressed this problem (Gray et al., 1998; Xu et al., 2017).
In the present study, the peeling procedure was used to identify the response units (RUs) from a functional-unitdataset of periphytic protozoan communities in coastal waters of the Yellow sea, northern China, during a 1-yearcycle. The main aims of the study were: (1) to identify the redundancy levels of response units in the periphyticprotozoan communities; (2) to explore spatio-temporal �uctuations in functional patterns of response units in thesecommunities, and; (3) to reveal the spatio-temporal variations in different functional redundancy levels in response tocertain environmental parameters.
Materials And MethodsStudy area and dataset collection
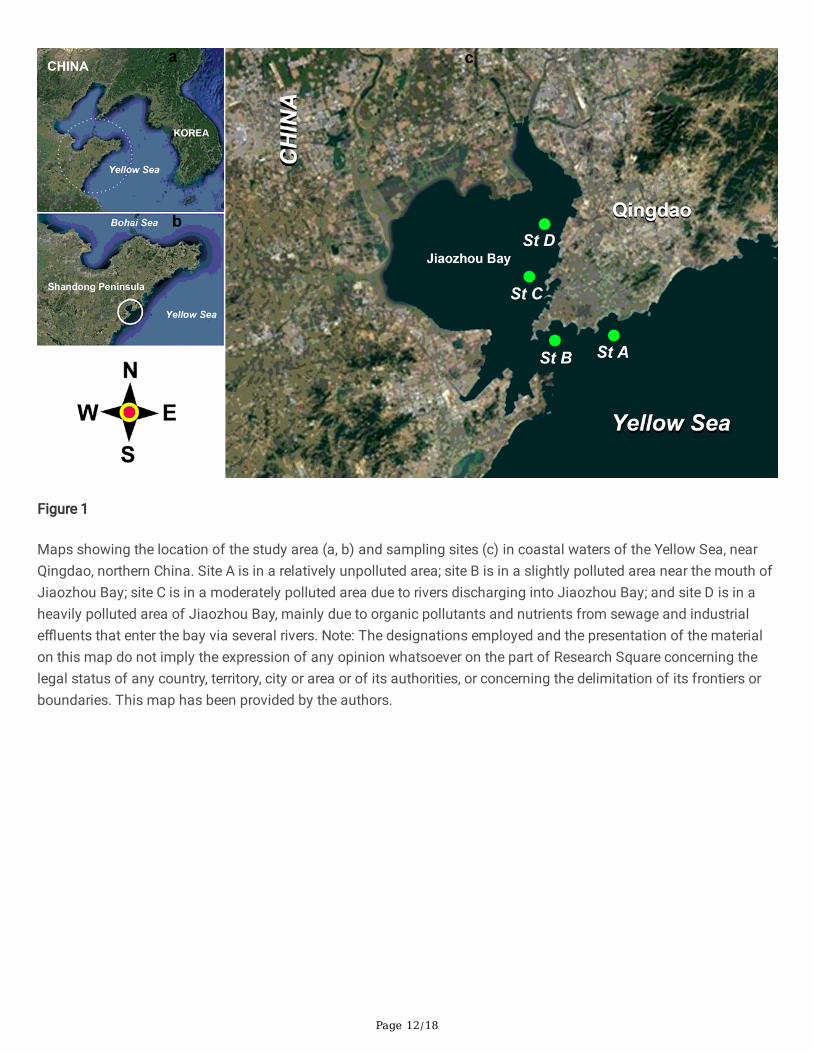
The study area was located in coastal waters of the Yellow Sea, northern China (Fig. 1a, b). Four study sites wereselected based on a pollution gradient (Fig. 1c): site A, located in a relatively unpolluted area at the Olympic SailingCenter; site B, located in a slightly polluted area near the mouth of Jiaozhou Bay; site C, located in a moderatelypolluted area due to rivers discharging into Jiaozhou Bay; and site D, located in a heavily polluted area of JiaozhouBay mainly due to organic pollutants and nutrients from domestic sewage and industrial e�uents entering the bayvia several rivers (Fig. 1c).
Periphytic protozoan communities were sampled every month over a 1-year cycle from August 2011 to July 2012,using glass microscope slides (2.5×7.5cm) as arti�cial substrates. The slides were immersed 1 m below the watersurface and left for 14 days to allow colonization by periphytic protozoa. On each sampling occasion two PVCframes, each having 10 slides giving a total of 20 slides for each site, were collected. In total, 960 slides wereexamined during the course of the study. Upon retrieval, the slides were transferred into Petri dishes containing in situwater and were processed within 2 h according to the methods described by Xu et al. (2014a, b).
Identi�cation and Enumeration
Identi�cation and enumeration of periphytic protozoa were performed under an inverted microscope atmagni�cations of 10–400X. Published guides such as Song et al. (2009) were used for species identi�cation. Theenumeration strategy was according to Xu et al. (2014b).
A WTW Multi 3500i sensor was used to measure the water temperature (T), pH, salinity (Sal) 3 and dissolved oxygenconcentration (DO) at each sampling site. Concentrations of ammonium nitrogen (NH4-N), nitrate nitrogen (NO3-N),nitrite nitrogen (NO2-N), and soluble reactive phosphate (SRP) were measured according to the “Standard Protocolsfor the Examination of Water and Wastewater” (APHA, 1992).
Formulation of response units (RUs)
Functional units of periphytic protozoa were determined based on four biological traits, i.e., feeding type(bacterivores, algivores, non-selectives and predators/raptors), body size (small, medium and large), movement type(vagile, sessile and planktonic), and source of food supply (plankton and periphyton).
Using a peeling procedure based on the routine BVSTEP in the PRIMER v7.1.17 package, the best matching subsetsfrom the matrix of functional-unit abundance data were determined by peeling the former selections (Clarke andGorley, 2015; Xu et al., 2017). Among these selections, the �rst subsets with correlation coe�cients more than 0.75 to
Page 4/18
the Functional Unit (FU) of the full-species dataset were identi�ed as response units (RUs) of the periphytic protozoancommunities (Zhong et al., 2014; Clarke and Gorley, 2015; Xu et al., 2017).
Data analysisAll multivariate analyses were performed using the PRIMER v7.1.17 (Clarke and Gorley, 2006) and the PERMANOVA + v1.0.7 for PRIMER packages (Anderson et al., 2008). Shade plotting with cluster analysis was used to summarize theco-occurrence and distribution of RUs of the periphytic protozoan communities at each sampling site (Anderson et al.,2008). Bootstrapped average analysis with metric multidimensional scaling (mMDS) ordinations were computed toshow the relationships between environmental variables and variations in RUs (Clarke and Gorley, 2015). Thesubmodule BIOENV (biota-environment correlation analysis) was used to explore the potential environmental driversfor variations of the RUs along the pollution gradient, and the signi�cance level of biota-environment correlations wastested using the routine RELATE (Clarke and Gorley, 2006; Xu et al., 2008; Jiang et al., 2011, 2013b; Xu et al., 2014a).
Correlation analyses were performed using statistical program SPSS v16.0 to observe the Pearson relationshipsbetween RUs and environmental variables. Data were log-transformed before analyses (Xu et al., 2008; Xu et al.,2014a).
ResultsPhysico-chemical/environmental variables
The mean values of physico-chemical factors at the four sampling sites are shown in Table S1. Clear variations wereobserved in abiotic factors along the pollution gradient from site A to site D. It is noteworthy that site D (in the mostheavily polluted area) had the lowest salinity and pH values whereas DO and transparency gradually decreased fromsite A to site D. In contrast, concentrations of NH4-N, SRP and NO3-N increased from site A to site D (Table S1).
Functional redundancy levels and response units
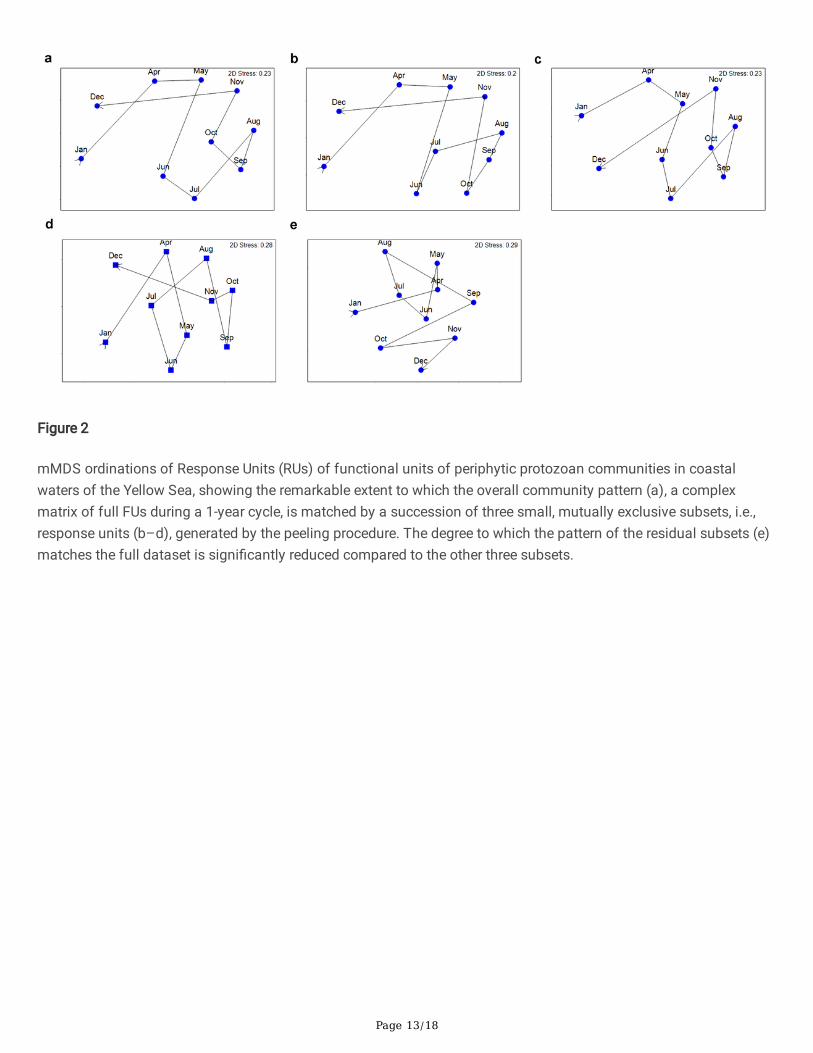
A total of 144 protozoan species were observed, which were assigned to 53 FUs (Table S2). Of these, three sequentialsubsets of RUs were identi�ed. The �rst subset comprised 12 FUs and its mMDS ordinations closely matched thepatterns of the full FUs (Fig. 2a, b). The second subset with 21 FUs and third subset with nine FUs representedcontinuous peeling (Fig. 2c and d). The degree to which the patterns of mMDS ordinations of the residual subsets(Fig. 2e) matched that of the full FUs (Fig. 2a) was signi�cantly reduced compared to the other three subsets.
Spatial distribution of response units
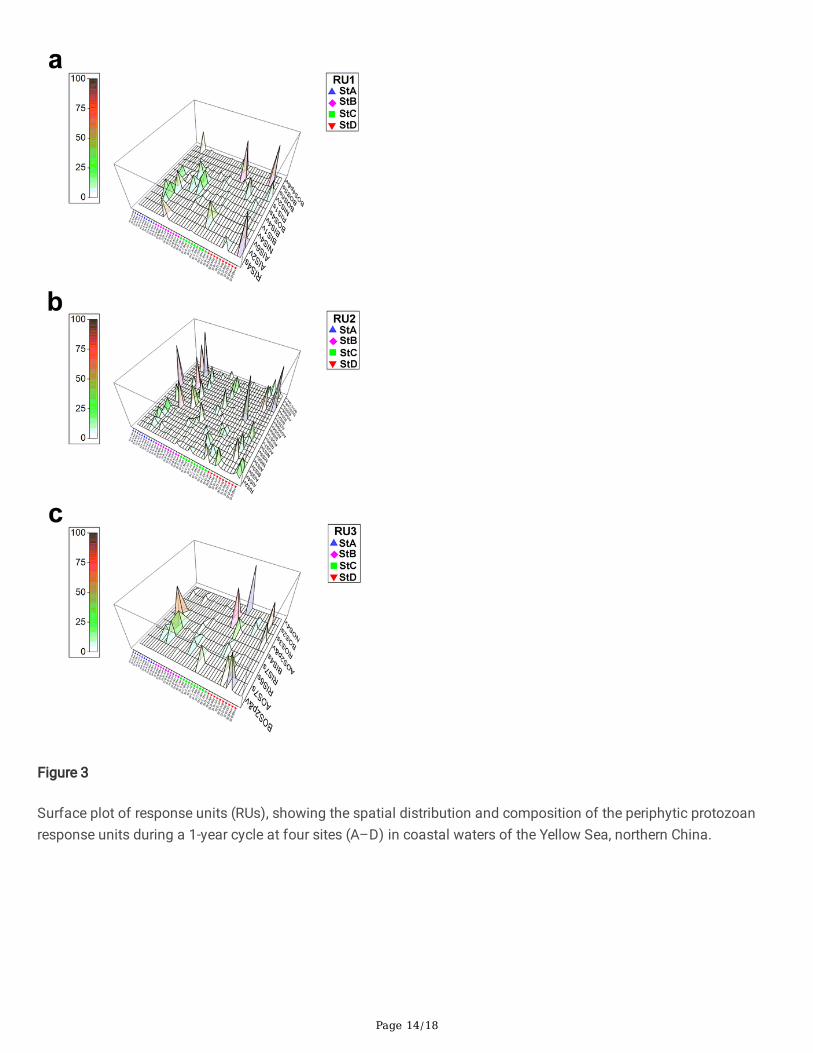
The distribution of response units RU1, RU2 and RU3 among the four study sites are summarized in (Fig. 3).Stochastic patterns of distribution are shown by these RUs along the pollution gradient from site A to site D. In RU1,raptors with inside food supply (RIS4s) and bacterivores with outside food supply (BOS5s) dominated at site A(Fig. 3a). In RU2, by contrast, algivores with inside food supply (AIS4p&v) and bacterivores with outside food supply(BOS5s) were primary contributors at sites B and C (Fig. 3b). It is noteworthy, however, that in RU3 an interchangeablepatterns were shown by protozoan communities, with the most heavily polluted site (site D) mostly dominated bybacterivores with outside food supply (BOS2s) and non-selective with outside food supply (NOS4v), respectively(Fig. 3c).
Page 5/18
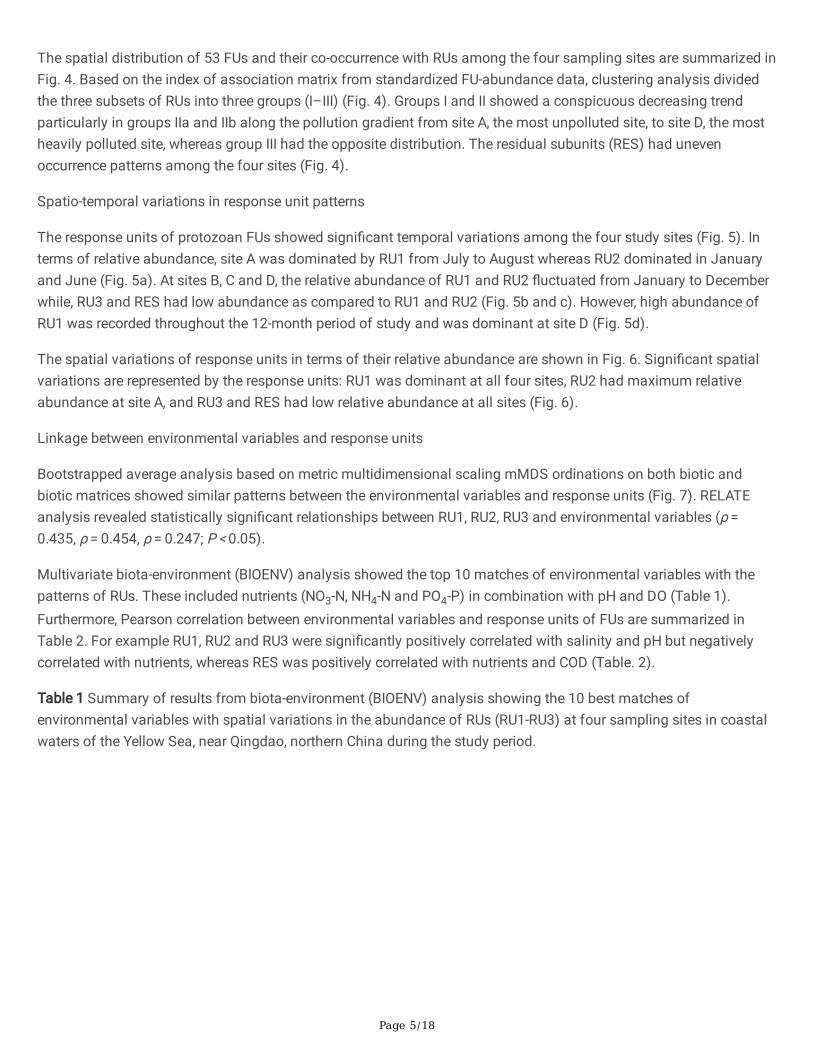
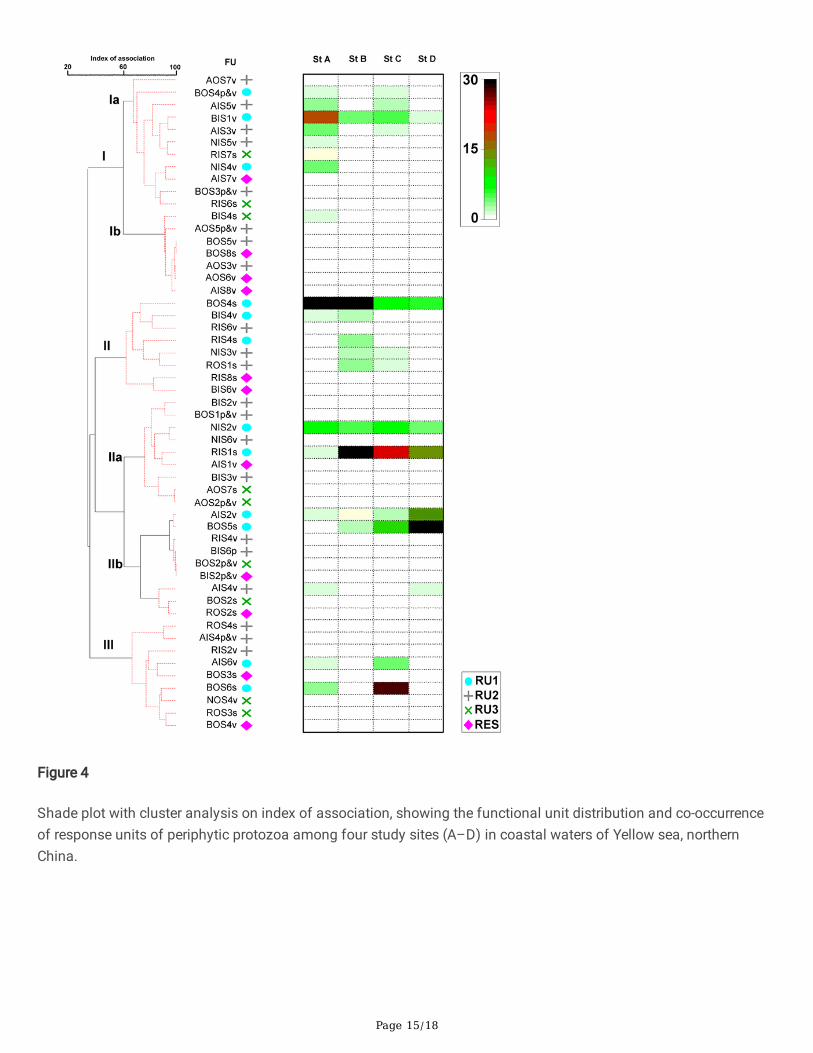
The spatial distribution of 53 FUs and their co-occurrence with RUs among the four sampling sites are summarized inFig. 4. Based on the index of association matrix from standardized FU-abundance data, clustering analysis dividedthe three subsets of RUs into three groups (I–III) (Fig. 4). Groups I and II showed a conspicuous decreasing trendparticularly in groups IIa and IIb along the pollution gradient from site A, the most unpolluted site, to site D, the mostheavily polluted site, whereas group III had the opposite distribution. The residual subunits (RES) had unevenoccurrence patterns among the four sites (Fig. 4).
Spatio-temporal variations in response unit patterns
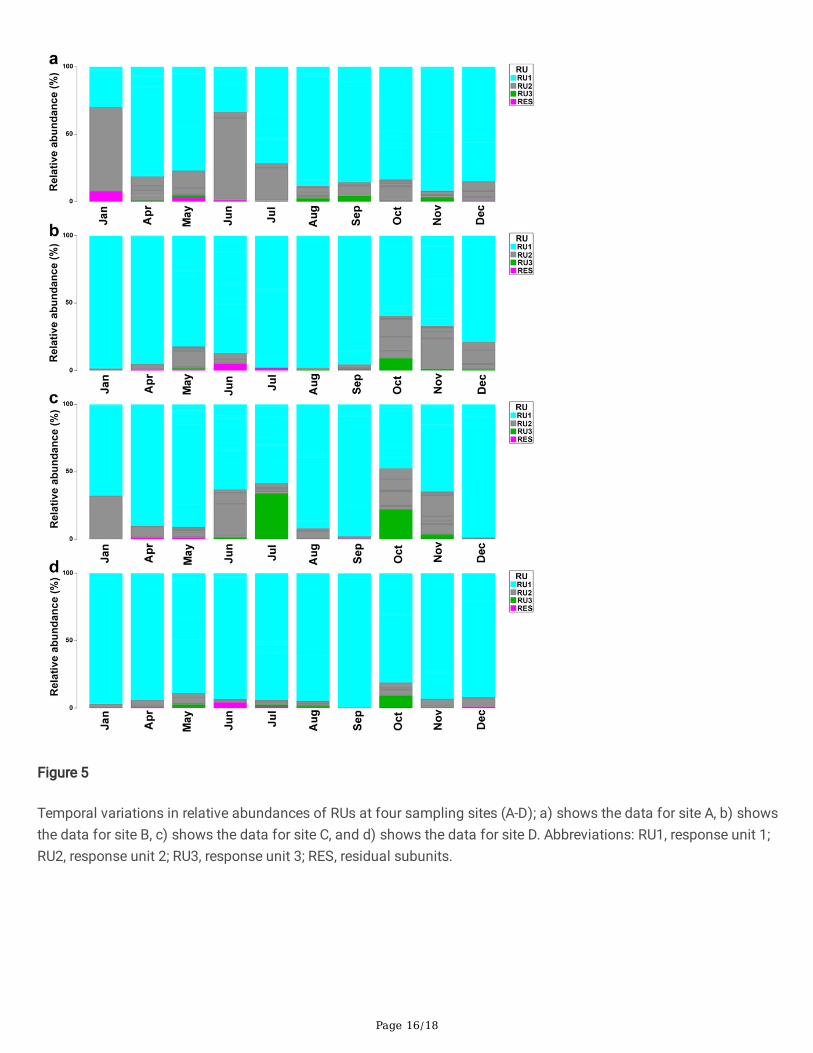
The response units of protozoan FUs showed signi�cant temporal variations among the four study sites (Fig. 5). Interms of relative abundance, site A was dominated by RU1 from July to August whereas RU2 dominated in Januaryand June (Fig. 5a). At sites B, C and D, the relative abundance of RU1 and RU2 �uctuated from January to Decemberwhile, RU3 and RES had low abundance as compared to RU1 and RU2 (Fig. 5b and c). However, high abundance ofRU1 was recorded throughout the 12-month period of study and was dominant at site D (Fig. 5d).
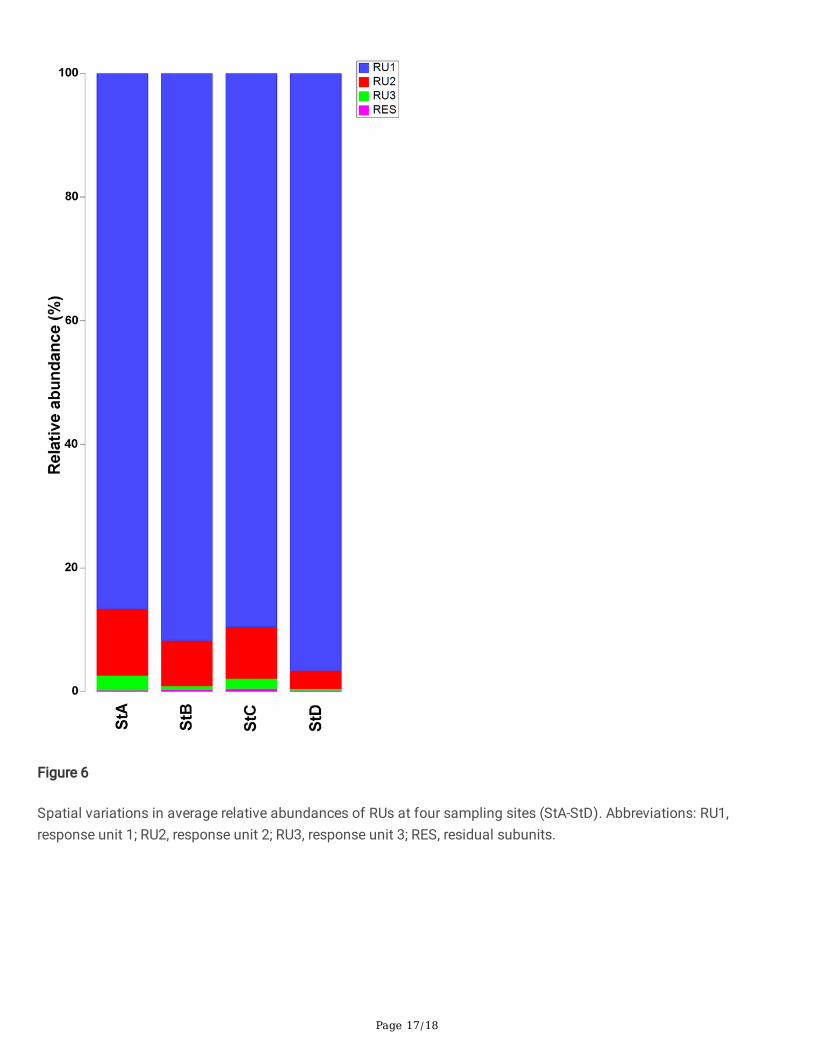
The spatial variations of response units in terms of their relative abundance are shown in Fig. 6. Signi�cant spatialvariations are represented by the response units: RU1 was dominant at all four sites, RU2 had maximum relativeabundance at site A, and RU3 and RES had low relative abundance at all sites (Fig. 6).
Linkage between environmental variables and response units
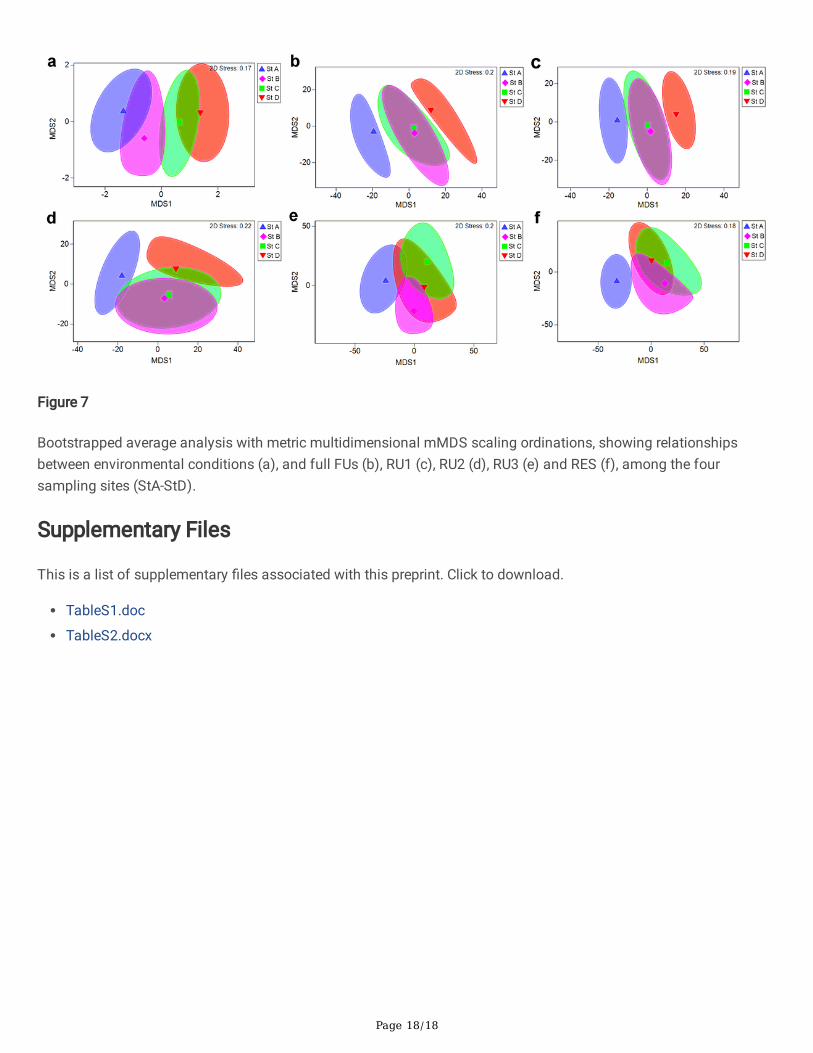
Bootstrapped average analysis based on metric multidimensional scaling mMDS ordinations on both biotic andbiotic matrices showed similar patterns between the environmental variables and response units (Fig. 7). RELATEanalysis revealed statistically signi�cant relationships between RU1, RU2, RU3 and environmental variables (ρ = 0.435, ρ = 0.454, ρ = 0.247; P < 0.05).
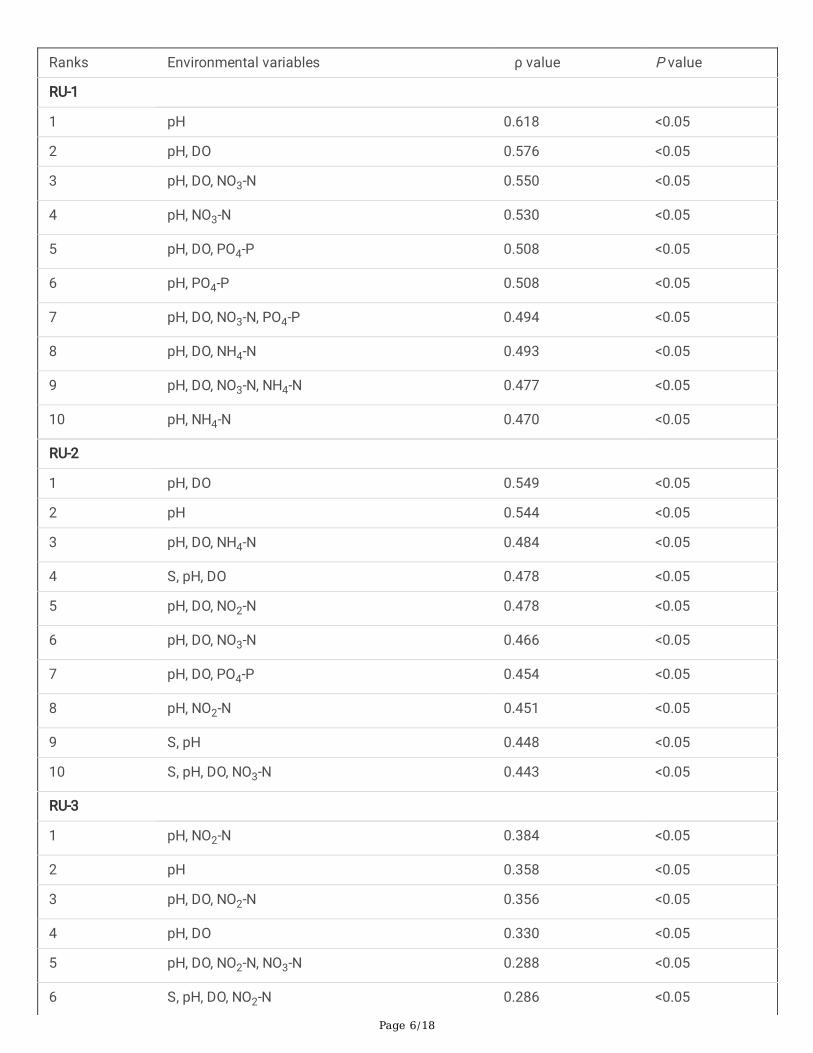
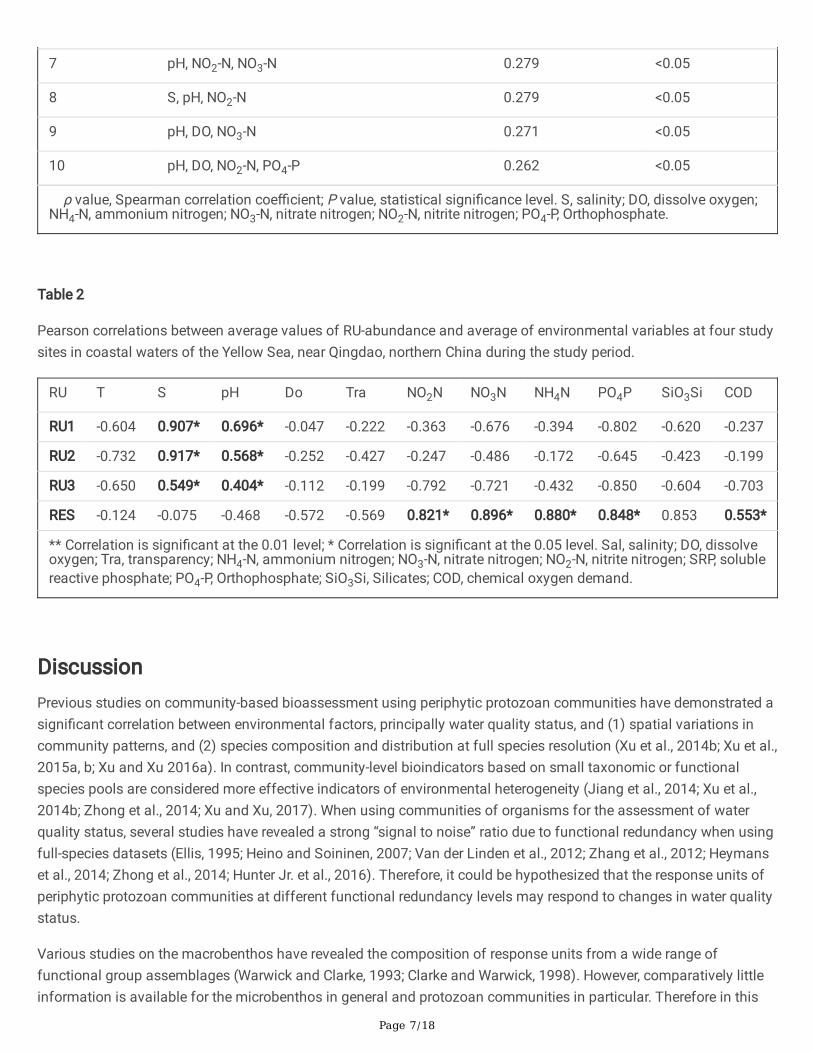
Multivariate biota-environment (BIOENV) analysis showed the top 10 matches of environmental variables with thepatterns of RUs. These included nutrients (NO3-N, NH4-N and PO4-P) in combination with pH and DO (Table 1).Furthermore, Pearson correlation between environmental variables and response units of FUs are summarized inTable 2. For example RU1, RU2 and RU3 were signi�cantly positively correlated with salinity and pH but negativelycorrelated with nutrients, whereas RES was positively correlated with nutrients and COD (Table. 2).
Table 1 Summary of results from biota-environment (BIOENV) analysis showing the 10 best matches ofenvironmental variables with spatial variations in the abundance of RUs (RU1-RU3) at four sampling sites in coastalwaters of the Yellow Sea, near Qingdao, northern China during the study period.
Page 6/18
Ranks Environmental variables ρ value P value
RU-1
1 pH 0.618 <0.05
2 pH, DO 0.576 <0.05
3 pH, DO, NO3-N 0.550 <0.05
4 pH, NO3-N 0.530 <0.05
5 pH, DO, PO4-P 0.508 <0.05
6 pH, PO4-P 0.508 <0.05
7 pH, DO, NO3-N, PO4-P 0.494 <0.05
8 pH, DO, NH4-N 0.493 <0.05
9 pH, DO, NO3-N, NH4-N 0.477 <0.05
10 pH, NH4-N 0.470 <0.05
RU-2
1 pH, DO 0.549 <0.05
2 pH 0.544 <0.05
3 pH, DO, NH4-N 0.484 <0.05
4 S, pH, DO 0.478 <0.05
5 pH, DO, NO2-N 0.478 <0.05
6 pH, DO, NO3-N 0.466 <0.05
7 pH, DO, PO4-P 0.454 <0.05
8 pH, NO2-N 0.451 <0.05
9 S, pH 0.448 <0.05
10 S, pH, DO, NO3-N 0.443 <0.05
RU-3
1 pH, NO2-N 0.384 <0.05
2 pH 0.358 <0.05
3 pH, DO, NO2-N 0.356 <0.05
4 pH, DO 0.330 <0.05
5 pH, DO, NO2-N, NO3-N 0.288 <0.05
6 S, pH, DO, NO2-N 0.286 <0.05
Page 7/18
7 pH, NO2-N, NO3-N 0.279 <0.05
8 S, pH, NO2-N 0.279 <0.05
9 pH, DO, NO3-N 0.271 <0.05
10 pH, DO, NO2-N, PO4-P 0.262 <0.05
ρ value, Spearman correlation coe�cient; P value, statistical signi�cance level. S, salinity; DO, dissolve oxygen;NH4-N, ammonium nitrogen; NO3-N, nitrate nitrogen; NO2-N, nitrite nitrogen; PO4-P, Orthophosphate.
Table 2
Pearson correlations between average values of RU-abundance and average of environmental variables at four studysites in coastal waters of the Yellow Sea, near Qingdao, northern China during the study period.
RU T S pH Do Tra NO2N NO3N NH4N PO4P SiO3Si COD
RU1 -0.604 0.907* 0.696* -0.047 -0.222 -0.363 -0.676 -0.394 -0.802 -0.620 -0.237
RU2 -0.732 0.917* 0.568* -0.252 -0.427 -0.247 -0.486 -0.172 -0.645 -0.423 -0.199
RU3 -0.650 0.549* 0.404* -0.112 -0.199 -0.792 -0.721 -0.432 -0.850 -0.604 -0.703
RES -0.124 -0.075 -0.468 -0.572 -0.569 0.821* 0.896* 0.880* 0.848* 0.853 0.553*
** Correlation is signi�cant at the 0.01 level; * Correlation is signi�cant at the 0.05 level. Sal, salinity; DO, dissolveoxygen; Tra, transparency; NH4-N, ammonium nitrogen; NO3-N, nitrate nitrogen; NO2-N, nitrite nitrogen; SRP, solublereactive phosphate; PO4-P, Orthophosphate; SiO3Si, Silicates; COD, chemical oxygen demand.
DiscussionPrevious studies on community-based bioassessment using periphytic protozoan communities have demonstrated asigni�cant correlation between environmental factors, principally water quality status, and (1) spatial variations incommunity patterns, and (2) species composition and distribution at full species resolution (Xu et al., 2014b; Xu et al.,2015a, b; Xu and Xu 2016a). In contrast, community-level bioindicators based on small taxonomic or functionalspecies pools are considered more effective indicators of environmental heterogeneity (Jiang et al., 2014; Xu et al.,2014b; Zhong et al., 2014; Xu and Xu, 2017). When using communities of organisms for the assessment of waterquality status, several studies have revealed a strong “signal to noise” ratio due to functional redundancy when usingfull-species datasets (Ellis, 1995; Heino and Soininen, 2007; Van der Linden et al., 2012; Zhang et al., 2012; Heymanset al., 2014; Zhong et al., 2014; Hunter Jr. et al., 2016). Therefore, it could be hypothesized that the response units ofperiphytic protozoan communities at different functional redundancy levels may respond to changes in water qualitystatus.
Various studies on the macrobenthos have revealed the composition of response units from a wide range offunctional group assemblages (Warwick and Clarke, 1993; Clarke and Warwick, 1998). However, comparatively littleinformation is available for the microbenthos in general and protozoan communities in particular. Therefore in this
Page 8/18
study, we have used the matrix of FUs of periphytic protozoan communities, i.e., feeding type, source of food supply,body size and mode of locomotion, and identi�ed the three consecutive subsets of response units (RU1, RU2 andRU3) to demonstrate the levels of functional redundancy present. These three subsets were distributed unevenlyamong four sampling sites (A–D) along a pollution gradient. In particular within RU1, raptors with inside food supply(RIS4s) and bacterivores (BOS5s) with outside food supply were dominant at site A, which was in the mostunpolluted area, whereas within RU2 algivores with inside food supply (AIS4p&v) and bacterivores (BOS5s) withoutside food supply were dominant at sites B and C which were moderately polluted areas. Within RU3, bacterivoreswith outside food supply (BOS5s) accompanied by non-selectives with outside food source (NOS4v) were dominantat site D, which was in the most heavily polluted area, and could be the most redundant bioindicators of water qualitystatus. On a temporal scale, the relative abundances of RU1 and RU2 were high throughout the 12-month period ofstudy as compared to RU3. Similarly, on a spatial scale, RU1 and RU2 had high relative abundancies at all foursampling sites compared to RU3. These �ndings are consistent with previous studies which reported that the totalcommunity pattern is sensitive to environmental change, and this pattern does not simply result from trends in onefunctional group (Clarke and Warwick, 1998). Furthermore, multivariate analysis demonstrated signi�cantrelationships between the RUs and environmental variables, particularly the best-matching of the nutrients NO3-N,NH4-N and PO4-P in combination with pH and DO. Moreover, Pearson correlation analysis revealed signi�cantlypositive correlations (P < 0.05) between RUs and both water salinity and pH, but negative correlations with nutrients.
Multivariate analysis is considered a more effective tool than univariate analysis for detecting variations incommunity structure (Clarke and Ainsworth, 1993), whereas both approaches are pivotal for the analysis ofcommunity patterns along pollution gradients in aquatic environments (Jiang et al., 2007; Xu et al., 2011). In addition,the peeling procedure (BVSTEP) and multivariate analysis metric multidimensional scaling (mMDS), are alsopowerful approaches for revealing mechanisms of community ecology. Thus, extended and rigorous studies withsubstantial datasets are required to fully exploit the predictive capacity of periphytic protozoan communities formonitoring water quality.
ConclusionIn conclusion, we recovered three successive subsets of response units from the matrix of FUs that seem to performinterchangeable roles on spatio-temporal scales. The relative abundance of the �rst two subsets (RU1 and RU2)increased along the pollution gradient whereas the relative abundance of the third subset (RU3) generally decreasedwith increasing pollution levels. Furthermore, algivores and bacterivores were dominant in RU1and RU2 at pollutedsites whereas raptors were dominant in RU3 at the unpolluted site. Environmental variations showed signi�cantrelationship with the patterns of RUs, in particular with COD and nutrients such as NO3-N, NH4-N and PO4-P. These�ndings suggest that RUs of periphytic protozoan communities may be used as a useful bioindicators of marinewater quality.
DeclarationsFunding
This study was supported by “The Natural Science Foundation” of China (project number 31672308) and Excellentdoctoral award from “Chinese Scholarship Council” (CSC) (Award no.: 2018SOA023059) under the Ministry ofEducation of China.
Declaration of Interest
Page 9/18
The authors declare that they have no known competing �nancial interests or personal relationships that could haveappeared to in�uence the work reported in this paper.
Credit authorship contribution statement
Syed Shabi Ul Hassan Kazmi: Writing Original Draft, Study Designing, Revision Editing; Uroosa: Proof reading; AlanWarren: Revision; Guangjian Xu: Proof reading; Henglong Xu: Supervision, Conceptualization, and Revision.
Publication/Participation consent
All authors have participated and approved the �nal version of manuscript.
Data availability Statement
Beside the supplementary material, the data will be available on request.
Ethical Approval
Not Applicable
References1. Anderson MJ, Gorley RN, Clarke KR (2008) PERMANOVA+ for PRIMER Guide to software and Statistical Methods.
Plymouth: PRIMER-E Ltd.
2. APHA (1992) Standard Methods for Examination of Water and Waste Water, 18th ed. American Public HealthAssociation, Washington, DC.
3. Azovsky AI (1988) Colonization of sand ‘islands’ by psammophilous ciliates: the effect of microhabitat size andstage of succession. Oikos 51, 48–56.
4. Chapin FS, Lubchenco J, Reynolds HL (1995) Biodiversity effects on patterns and processes of communities andecosystems. Cambridge University Press, Cambridge
5. Clarke KR (1993) Non-parametric multivariate analyses of changes in community structure. Aust. J. Ecol. 18,117–143.
�. Clarke KR, Gorley RN (2006) User manual/tutorial. Plymouth: PRIMER-E Ltd.
7. Clarke KR, Gorley RN (2015) PRIMER v7: User Manual/Tutorial. PRIMER-E Ltd, Plymouth, UK.
�. Clarke KR, Warwick RM (1998) Quantifying structural redundancy in ecological communities. Oecologia 113,278–289.
9. Coppellotti O, Matarazzo P (2000) Ciliate colonization of arti�cial substrates in the Lagoon of Venice. J. Mar.Biol. Assoc. UK. 80, 419–427.
10. Crawford DW, Purdie DA, Lockwood APM, Weissman P (1997) Recurrent red-tides in the Southampton waterestuary caused by the phototrophic ciliate Mesodinium rubrum. Estuar. Coast. Shelf Sci. 45, 799–812.
11. Ellis D (1995) Taxonomic su�ciency in pollution assessment. Mar. Pollut. Bull. 16, 459.
12. Feng M, Zhang W, Wang W, Zhang G, Xiao T, Xu H (2015) Can tintinnids be used for discriminating water qualitystatus in marine ecosystems? Mar. Pollut. Bull. 101, 549-555.
13. Finlay BJ, Esteban GF (1998) Freshwater protozoa: biodiversity and ecological function. Biol. Conserv. 7, 1163-1186.
Page 10/18
14. Frost TM, Carpenter SR, Ives AR, Kratz TK (1995) Species compensation and complementary in ecosystemfunction. In: Jones, C.G., Lawton, J.H. (Eds.), Linking Species and Ecosystems. Chapman & Hall, New York, pp.224–239.
15. Gray JS, Aschan M, Carr MR, Clarke KR, Green RH, Pearson TH, Rosengerg R, Warwick RM (1998) Analysis ofcommunity attributes of the benthic macrofauna of Frierfjord/Langesundfjoird and in a mesocosm experiment.Mar. Ecol. Prog. Ser. 66, 285–299.
1�. Heino J, Soininen J (2007) Are higher taxa adequate surrogates for species-level assemblage patterns andspecies richness in stream organisms? Biol. Conserv. 137 (1): 78–89.
17. Heymans JJ, Coll M, Libralato S, et al (2014) Global Patterns in Ecological Indicators of Marine Food Webs: AModelling Approach. PLoS ONE 9 (4): e95845.
1�. Hunter Jr M, Westgate M, Barton P, et al (2016) Two roles for ecological surrogacy: Indicator surrogates andmanagement surrogates. Ecol. Indic. 63, 121–125.
19. Jiang J, Wu S, Shen Y (2007) Effects of seasonal succession and water pollution on the protozoan communitystructure in an eutrophic lake. Chemosphere 66, 523–532.
20. Jiang Y, Xu H, Hu X, Zhu M, Al-Rasheid KAS, Warren A (2011) An approach to analyzing spatial patterns ofplanktonic ciliate communities for monitoring water quality in Jiaozhou Bay, northern China. Mar. Pollut. Bull. 62,227–235.
21. Jiang Y, Xu H, Warren A (2014) Insights into discriminating environmental quality status using taxonomicdistinctness based on a small species pool of ciliated protozoa in marine ecosystems. Sci. Total Environ. 468–469, 663–670.
22. Jiang Y, Yang EJ, Min JO, Kang SH, Lee SH (2013b) Using pelagic ciliated microzooplankton communities as anindicator for monitoring environmental condition under impact of summer sea-ice reduction in western ArcticOcean. Ecol. Indic. 34, 380–390.
23. Kathol M, Fischer H, Weitere M (2011) Contribution of bio�lm-dwelling consumers to pelagic-benthic coupling ina large river. Freshw. Biol. 56, 1017–1230.
24. Kazmi SSUH, Xuexi T, Xu G, Sikder MNA, Xu H (2020b) Vertical variability in taxonomic breadth of bio�lm-dwelling ciliates in marine bioassessment surveys. Reg. Stud. Mar. Sci. 38, 101366.
25. Kazmi SSUH, Xuexi T, Xu G, Xu H (2021) An approach to optimizing sampling effort for bioassessment surveysbased on periphytic ciliates according to water depths in marine ecosystems. Ecol. Ind. 122, 107222.
2�. Kchaou N, Elloumi J, Drira Z, Hamza A, Ayadi H, Bouain A, Aleya L (2009) Distribution of ciliates in relation toenvironmental factors along the coastline of the Gulf of Gabes, Tunisia. Estuar. Coast. Shelf Sci. 83, 414–424.
27. Menge BA, Berlow EL, Blanchette CA, Navarette SA, Yamada SB (1994) The keystone species concept: variationin interaction strength in a rocky intertidal habitat. Ecol. Monogr. 64, 249–286.
2�. Norf H, Arndt H, Weitere M (2009) Responses of bio�lm-dwelling ciliate communities to planktonic and benthicresource enrichment. Microb. Ecol. 57, 687–700.
29. Payne RJ (2013) Seven reasons why protists make useful bioindicators. Acta Protozool. 52, 105–113.
30. Sime-Ngando T, Gosselin M, Roy S, Chanut JP (1995) Signi�cance of planktonic ciliated protozoa in the lower St.Lawrence estuary: comparison with bacterial, phytoplankton, and particulate organic carbon. Aquat. Microb.Ecol. 9, 243–258.
31. Song W, Warren A, Xu H (2009) Free-Living Ciliates in the Bohai Sea and Yellow Sea, China. Beijing SciencePress.
Page 11/18
32. Van der Linden, P., Patrício, J., Marchini, A., Cid, N., Neto, J.M., Marques, J.C., 2012. A biological trait approach toassess the functional composition of subtidal benthic communities in an estuarine ecosystem. Ecol. Indic. 20,121–133.
33. Warwick RM, Clarke KR (1993) Comparing the severity of disturbance: a meta-analysis of marine macrobenthiccommunity data. Mar. Ecol. Prog. Ser. 92, 221–231.
34. Xu G, Wang Z, Yang Z, Xu H (2015b) Congruency analysis of bio�lm-dwelling ciliates as a surrogate ofeukaryotic microperiphyton for marine bioassessment. Mar. Pollut. Bull. 101, 600–604.
35. Xu G, Xu H (2016a) Can annual cyclicity of protozoan communities re�ect water quality status in coastalecosystems? Ecol. Indic. 67, 730–734.
3�. Xu G, Xu H (2017) An approach to analysis of functional redundancy in protozoan communities forbioassessment in marine ecosystems. Ecol. Indic. 77, 41–47.
37. Xu G, Zhang W, Xu H (2015a) Can dispersions be used for discriminating water status in coastal ecosystems? Acase study on bio�lm-dwelling microbial eukaryotes. Ecol. Indic. 57, 208–214.
3�. Xu G, Zhong X, Wang Y, Xu H (2014b) A multivariate approach to the determination of an indicator species poolfor community-based bioassessment of marine water quality. Mar. Pollut. Bull. 87, 147–151.
39. Xu G, Zhong X, Warren A, Xu H (2017) A multivariate approach to analyzing functional redundancy of marineperiphytic ciliates during the colonization process for bioassessment in coastal ecosystems. Mar. Pollut. Bull.117, 406-413.
40. Xu H, Jiang Y, Al-Rasheid KAS, Al-Farraj SA, Song W (2011) Application of an indicator based on taxonomicrelatedness of ciliated protozoan assemblages for marine environmental assessment. Environ. Sci. Pollut. Res.18, 1213–21.
41. Xu H, Song W, Warren A, Al-Rasheid KAS, Al-Farraj SA, Gong J, Hu H (2008) Planktonic protist communities in asemi-enclosed mariculture pond: structural variation and correlation with environmental conditions. J. Mar. Biol.Assoc. UK. 88 (7): 1353–1362.
42. Xu H, Zhang W, Jiang Y, Yang EJ (2014a) Use of bio�lm-dwelling ciliate communities to determine environmentalquality status of coastal water. Sci. Total Environ. 470–471, 511–518.
43. Zhang W, Xu H (2015) Seasonal shift in community pattern of periphytic ciliates and its environmental drivers incoastal waters of the Yellow Sea northern China. J. Mar. Biol. Ass. UK 95, 277–288.
44. Zhang W, Xu H, Jiang Y, Zhu M, Al-Rasheid KAS (2012) In�uence of enumeration time periods on analyzingcolonization features and taxonomic relatedness of periphytic ciliate communities using an arti�cial substratumfor marine bioassessment. Environ. Sci. Pollut. Res. 19, 3619–3627.
45. Zhang W, Xu H, Jiang Y, Zhu M, Al-Rasheid KAS (2012) Colonization dynamics in trophic-functional structure ofperiphytic protist communities in coastal waters. Mar. Biol. 159, 735–748.
4�. Zhong X, Xu G, Wang Y, Xu H (2014) An approach to determination of functional species pool for communityresearch. Ecol. Indic. 46, 78–83.
47. Zhong X, Xu G, Xu H (2017) An approach to analysis of colonization dynamics in community functioning ofprotozoa for bioassessment of marine pollution. Ecol. Ind. 78, 526-530.
Figures
Page 12/18
Figure 1
Maps showing the location of the study area (a, b) and sampling sites (c) in coastal waters of the Yellow Sea, nearQingdao, northern China. Site A is in a relatively unpolluted area; site B is in a slightly polluted area near the mouth ofJiaozhou Bay; site C is in a moderately polluted area due to rivers discharging into Jiaozhou Bay; and site D is in aheavily polluted area of Jiaozhou Bay, mainly due to organic pollutants and nutrients from sewage and industriale�uents that enter the bay via several rivers. Note: The designations employed and the presentation of the materialon this map do not imply the expression of any opinion whatsoever on the part of Research Square concerning thelegal status of any country, territory, city or area or of its authorities, or concerning the delimitation of its frontiers orboundaries. This map has been provided by the authors.
Page 13/18
Figure 2
mMDS ordinations of Response Units (RUs) of functional units of periphytic protozoan communities in coastalwaters of the Yellow Sea, showing the remarkable extent to which the overall community pattern (a), a complexmatrix of full FUs during a 1-year cycle, is matched by a succession of three small, mutually exclusive subsets, i.e.,response units (b–d), generated by the peeling procedure. The degree to which the pattern of the residual subsets (e)matches the full dataset is signi�cantly reduced compared to the other three subsets.
Page 14/18
Figure 3
Surface plot of response units (RUs), showing the spatial distribution and composition of the periphytic protozoanresponse units during a 1-year cycle at four sites (A–D) in coastal waters of the Yellow Sea, northern China.
Page 15/18
Figure 4
Shade plot with cluster analysis on index of association, showing the functional unit distribution and co-occurrenceof response units of periphytic protozoa among four study sites (A–D) in coastal waters of Yellow sea, northernChina.
Page 16/18
Figure 5
Temporal variations in relative abundances of RUs at four sampling sites (A-D); a) shows the data for site A, b) showsthe data for site B, c) shows the data for site C, and d) shows the data for site D. Abbreviations: RU1, response unit 1;RU2, response unit 2; RU3, response unit 3; RES, residual subunits.
Page 17/18
Figure 6
Spatial variations in average relative abundances of RUs at four sampling sites (StA-StD). Abbreviations: RU1,response unit 1; RU2, response unit 2; RU3, response unit 3; RES, residual subunits.
Page 18/18
Figure 7
Bootstrapped average analysis with metric multidimensional mMDS scaling ordinations, showing relationshipsbetween environmental conditions (a), and full FUs (b), RU1 (c), RU2 (d), RU3 (e) and RES (f), among the foursampling sites (StA-StD).
Supplementary Files
This is a list of supplementary �les associated with this preprint. Click to download.
TableS1.doc
TableS2.docx


![¨1¤]#v1%> (}«](https://img.pdfslide.net/doc/110x75/633db3cf827bd00c43098a51/1v1-.jpg)


