Embed Size (px)
Citation preview

©20
10 N
atu
re A
mer
ica,
Inc.
All
rig
hts
res
erve
d.
AnAlysis
nAture methods | ADVANCE ONLINE PUBLICATION | �
the predominance of rrnAs in the transcriptome is a major technical challenge in sequence-based analysis of cdnAs from microbial isolates and communities. several approaches have been applied to deplete rrnAs from (meta)transcriptomes, but no systematic investigation of potential biases introduced by any of these approaches has been reported. here we validated the effectiveness and fidelity of the two most commonly used approaches, subtractive hybridization and exonuclease digestion, as well as combinations of these treatments, on two synthetic five-microorganism metatranscriptomes using massively parallel sequencing. We found that the effectiveness of rrnA removal was a function of community composition and rnA integrity for these treatments. subtractive hybridization alone introduced the least bias in relative transcript abundance, whereas exonuclease and in particular combined treatments greatly compromised mrnA abundance fidelity. illumina sequencing itself also can compromise quantitative data analysis by introducing a G+C bias between runs.
Rapid technological advances in ultra-high-throughput sequenc-ing are making de novo sequencing of transcriptomes (RNA-seq) a viable alternative to microarray analysis of microbial isolates and communities1. A major technical challenge for de novo tran-scriptome sequencing is the low relative abundance of mRNAs in total cellular RNA (1–5%; ref. 2), the bulk of which is rRNAs and tRNAs3. Unlike eukaryotic mRNAs, which can be selectively synthesized into cDNA by virtue of their poly(A) tails4, bacte-rial and archaeal cDNAs are predominantly rRNA sequences5,6. Therefore, prokaryotic rRNAs are often removed before sequenc-ing to improve mRNA detection sensitivity. Different methods have been used to eliminate prokaryotic rRNA, including sub-tractive hybridization with rRNA-specific probes7,8, digestion with exonuclease that preferentially acts on rRNA, poly(A) tail addition to discriminate against rRNA9,10, reverse transcription with rRNA-specific primers followed by RNase H digestion to degrade rRNA:DNA hybrids11, and gel electrophoresis size separation and extraction of non-rRNA bands12.
Among these methods, subtractive hybridization and exo-nuclease digestion have become the most popular owing to the availability of commercial kits from Ambion (MICROBExpress Bacterial mRNA Enrichment kit) and Epicentre (mRNA-ONLY Prokaryotic mRNA Isolation kit). The former kit uses a subtrac-tive hybridization with capture oligonucleotides specific to 16S and 23S rRNAs. It has been applied to both bacterial isolates and environmental samples, in one or two rounds6,13–18. The Epicentre kit uses exonuclease to preferentially degrade processed RNAs with 5′ monophosphate (the majority of which are believed to be rRNAs)19,20. In some instances, these methods have been used in combination to improve rRNA removal21–23. There is no consensus, however, on the best approach, and existing data are anecdotal. Here we validated the performance of these kits with two synthetic five-member microbial communities using Illumina sequencing and found that rRNA removal efficiencies were com-munity- and RNA integrity–dependent and that only subtractive hybridization adequately preserved relative transcript abundance for quantitative analyses.
resultsexperimental designWe constructed two five-member synthetic microbial communities by pooling equimolar amounts of total RNAs extracted independ-ently from microbial isolates with sequenced genomes that span a wide phylogenetic, (G+C) content and genome-size range. Two of the five species were common to both communities (Table 1). We tested subtractive hybridization (Hyb), exonuclease digestion (Exo) and combined treatments in two experiments using the two synthetic communities. In experiment 1, we tested Hyb, Exo and Hyb followed by Exo (Hyb + Exo) using synthetic community 1. Then we conducted experiment 2 using synthetic community 2 to confirm the results of experiment 1 and expanded the depletion methods tested to also include two rounds of Hyb (2Hyb) as well as Exo followed by Hyb (Exo + Hyb) (Table 2). As a control, we used total RNA without rRNA removal. We initially assessed rRNA removal using RNA electropherograms (Agilent 2100 Bioanalyzer)
1Department of Energy Joint Genome Institute, Walnut Creek, California, USA. 2Energy Biosciences Institute, University of California-Berkeley, Berkeley, California, USA. 3Department of Molecular Genetics, Weizmann Institute of Science, Rehovot, Israel. 4Australian Centre for Ecogenomics, School of Chemistry and Molecular Biosciences, The University of Queensland, Brisbane, Australia. 5These authors contributed equally to this work. Correspondence should be addressed to P.H. ([email protected]).Received 12 ApRil; Accepted 30 August; published online 19 septembeR 2010; doi:10.1038/nmeth.1507
Validation of two ribosomal rnA removal methods for microbial metatranscriptomicsShaomei He1,2,5, Omri Wurtzel3,5, Kanwar Singh1, Jeff L Froula1, Suzan Yilmaz1, Susannah G Tringe1, Zhong Wang1, Feng Chen1, Erika A Lindquist1, Rotem Sorek3 & Philip Hugenholtz1,2,4
©20
10 N
atu
re A
mer
ica,
Inc.
All
rig
hts
res
erve
d.
� | ADVANCE ONLINE PUBLICATION | nAture methods
AnAlysis
(Supplementary Figs. 1 and 2 and Supplementary Note 1). We then sequenced technical replicates (after RNA pooling) distrib-uted within and between four runs (flowcells; runs 1 and 2 in experiment 1, and runs 3 and 4 in experiment 2) on an Illumina Genome Analyzer II sequencer to evaluate intra- and interrun variation (Table 2). We generated ~10–17 million 76-base-pair single-end reads for each sample, and for all but one sample we mapped 99% of reads to a reference, indicating good read quality and negligible contamination (Supplementary Tables 1 and 2 and Supplementary Note 2).
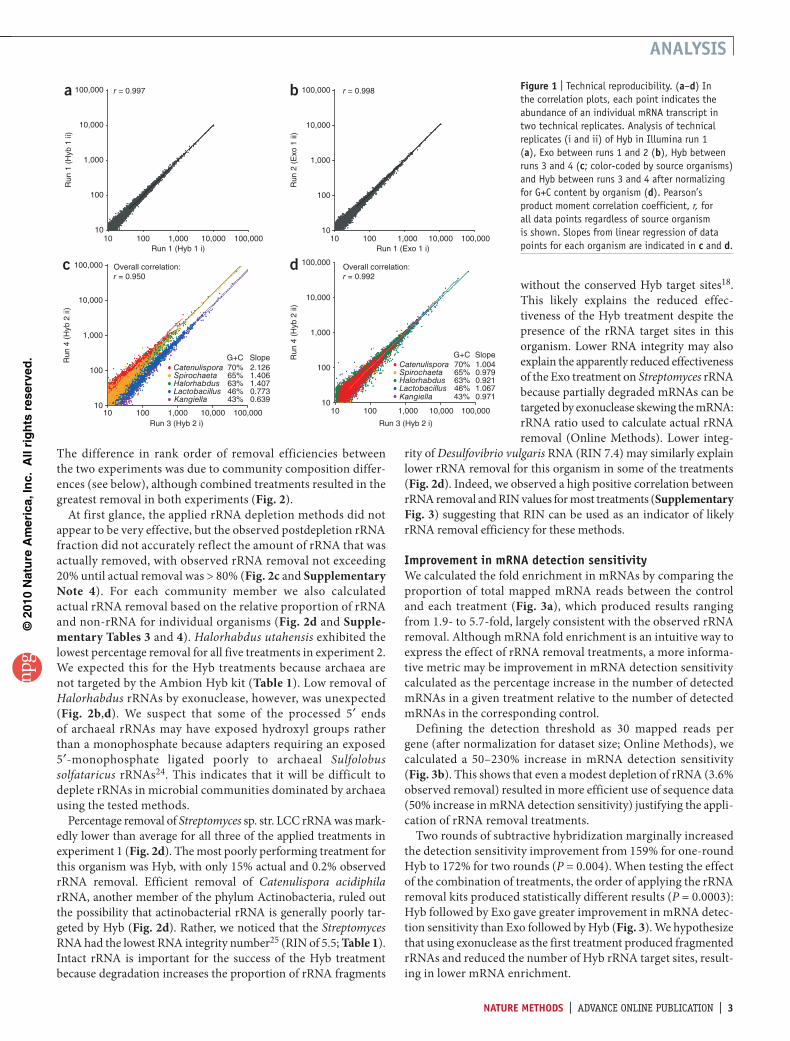
technical reproducibilityWe first evaluated technical reproducibility by comparing the rela-tive transcript abundance of technical replicates calculated as reads per gene normalized by total mapped mRNA reads. The four intra-run technical replicates in three independent runs (Hyb in run 1, and controls in runs 1, 3 and 4; Table 2) were highly reproducible (Pearson’s product-moment correlation coefficient, r = 0.997 ± 0.001; Fig. 1a), suggesting that both sample preparation–associated variation and intrarun sequencing variation were minor. In addi-tion, the sole interrun technical replicate between runs 1 and 2 (Exo 1 i and Exo 1 ii; Table 2) was also highly reproducible (Fig. 1b), suggesting negligible technical variation between these two runs. By contrast, the interrun technical replicates between runs 3 and 4 were less reproducible owing to multiple distinct regressions that correspond to individual organisms (Fig. 1c).
Linear regression slopes for each organism positively correlated with their genomic G+C content (Fig. 1c). This indicates that run 3 systematically underrepresented (G+C)-rich sequences relative to run 4, which we believe was due to variability in run quality (Table 2). Two simple normalization strategies based on the total mRNA counts from the source organism or gene G+C content (Supplementary Note 3) improved the overall correlation between technical replicates (Fig. 1d), confirming that the run-to-run variation was indeed largely associated with G+C content. Therefore, to accurately assess rRNA depletion efficiency and mRNA fidelity, we restricted comparisons of treatment-control pairs to the same run in experiment 2 (Table 2). We took the interrun average after we performed the intrarun comparison.
efficiency of rrnA depletionAs expected, the relative rRNA content of the controls was 95–97% of total RNA, typical of bacteria and archaea, with each community member being approximately equally represented in the controls (Fig. 2a,b). After the various treatments, the observed rRNA content decreased by as little as 3.6% (Exo) and up to 19.9% (Hyb + Exo). This decrease in rRNA percentage in total RNA reflected the redistribution of rRNA relative to non-rRNA owing to the treatment. For experiment 1, the rank order of rRNA removal efficiencies was Exo < Hyb < Hyb + Exo; for experiment 2, it was Hyb ≈ 2Hyb < Exo < Exo + Hyb < Hyb + Exo (‘≈’ indicates no statistically significant difference, P > 0.05).
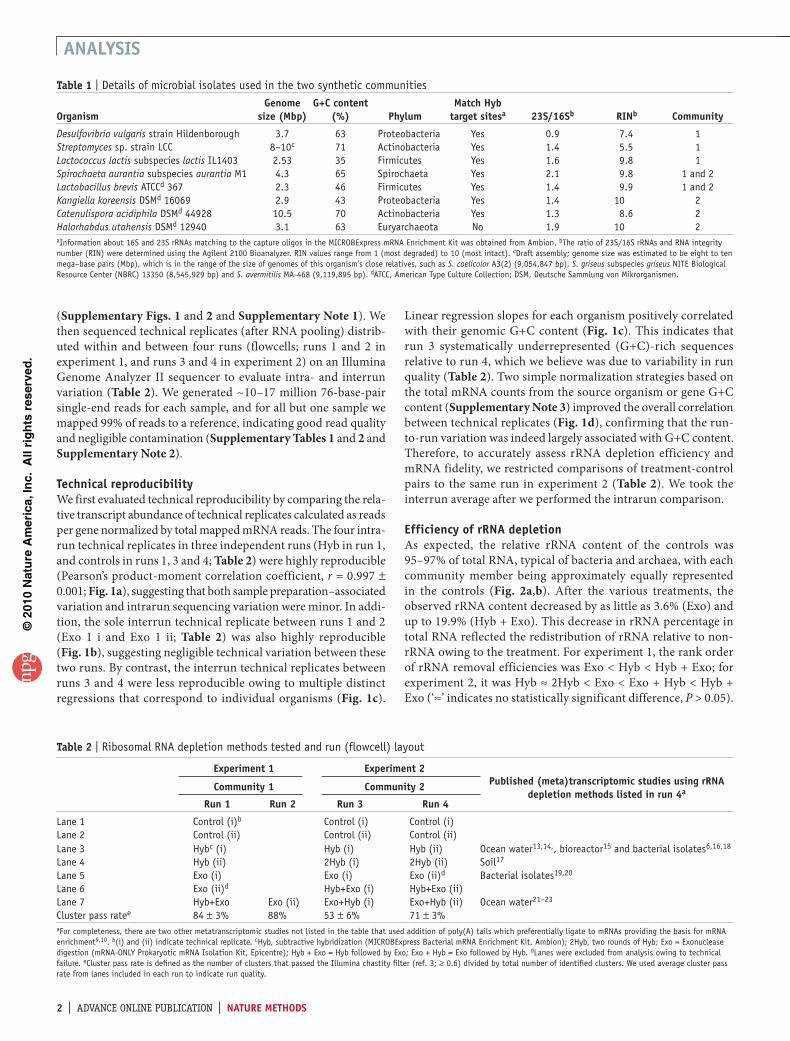
table 1 | Details of microbial isolates used in the two synthetic communities
organismGenome
size (mbp)G+C content
(%) Phylummatch hyb
target sitesa �3s/�6sb rinb Community
Desulfovibrio vulgaris strain Hildenborough 3.7 63 Proteobacteria Yes 0.9 7.4 1Streptomyces sp. strain LCC 8–10c 71 Actinobacteria Yes 1.4 5.5 1Lactococcus lactis subspecies lactis IL1403 2.53 35 Firmicutes Yes 1.6 9.8 1Spirochaeta aurantia subspecies aurantia M1 4.3 65 Spirochaeta Yes 2.1 9.8 1 and 2Lactobacillus brevis ATCCd 367 2.3 46 Firmicutes Yes 1.4 9.9 1 and 2Kangiella koreensis DSMd 16069 2.9 43 Proteobacteria Yes 1.4 10 2Catenulispora acidiphila DSMd 44928 10.5 70 Actinobacteria Yes 1.3 8.6 2Halorhabdus utahensis DSMd 12940 3.1 63 Euryarchaeota No 1.9 10 2aInformation about 16S and 23S rRNAs matching to the capture oligos in the MICROBExpress mRNA Enrichment Kit was obtained from Ambion. bThe ratio of 23S/16S rRNAs and RNA integrity number (RIN) were determined using the Agilent 2100 Bioanalyzer. RIN values range from 1 (most degraded) to 10 (most intact). cDraft assembly; genome size was estimated to be eight to ten mega–base pairs (Mbp), which is in the range of the size of genomes of this organism’s close relatives, such as S. coelicolor A3(2) (9,054,847 bp), S. griseus subspecies griseus NITE Biological Resource Center (NBRC) 13350 (8,545,929 bp) and S. avermitilis MA-468 (9,119,895 bp). dATCC, American Type Culture Collection; DSM, Deutsche Sammlung von Mikrorganismen.
table 2 | Ribosomal RNA depletion methods tested and run (flowcell) layout
experiment � experiment �Published (meta)transcriptomic studies using rrnA
depletion methods listed in run 4aCommunity � Community �
run � run � run 3 run 4
Lane 1 Control (i)b Control (i) Control (i)Lane 2 Control (ii) Control (ii) Control (ii)Lane 3 Hybc (i) Hyb (i) Hyb (ii) Ocean water13,14,, bioreactor15 and bacterial isolates6,16,18
Lane 4 Hyb (ii) 2Hyb (i) 2Hyb (ii) Soil17
Lane 5 Exo (i) Exo (i) Exo (ii)d Bacterial isolates19,20
Lane 6 Exo (ii)d Hyb+Exo (i) Hyb+Exo (ii)Lane 7 Hyb+Exo Exo (ii) Exo+Hyb (i) Exo+Hyb (ii) Ocean water21–23
Cluster pass ratee 84 ± 3% 88% 53 ± 6% 71 ± 3%aFor completeness, there are two other metatranscriptomic studies not listed in the table that used addition of poly(A) tails which preferentially ligate to mRNAs providing the basis for mRNA enrichment9,10. b(i) and (ii) indicate technical replicate. cHyb, subtractive hybridization (MICROBExpress Bacterial mRNA Enrichment Kit, Ambion); 2Hyb, two rounds of Hyb; Exo = Exonuclease digestion (mRNA-ONLY Prokaryotic mRNA Isolation Kit, Epicentre); Hyb + Exo = Hyb followed by Exo; Exo + Hyb = Exo followed by Hyb. dLanes were excluded from analysis owing to technical failure. eCluster pass rate is defined as the number of clusters that passed the Illumina chastity filter (ref. 3; ≥ 0.6) divided by total number of identified clusters. We used average cluster pass rate from lanes included in each run to indicate run quality.
©20
10 N
atu
re A
mer
ica,
Inc.
All
rig
hts
res
erve
d.
nAture methods | ADVANCE ONLINE PUBLICATION | 3
AnAlysis
The difference in rank order of removal efficiencies between the two experiments was due to community composition differ-ences (see below), although combined treatments resulted in the greatest removal in both experiments (Fig. 2).
At first glance, the applied rRNA depletion methods did not appear to be very effective, but the observed postdepletion rRNA fraction did not accurately reflect the amount of rRNA that was actually removed, with observed rRNA removal not exceeding 20% until actual removal was > 80% (Fig. 2c and Supplementary Note 4). For each community member we also calculated actual rRNA removal based on the relative proportion of rRNA and non-rRNA for individual organisms (Fig. 2d and Supplementary Tables 3 and 4). Halorhabdus utahensis exhibited the lowest percentage removal for all five treatments in experiment 2. We expected this for the Hyb treatments because archaea are not targeted by the Ambion Hyb kit (Table 1). Low removal of Halorhabdus rRNAs by exonuclease, however, was unexpected (Fig. 2b,d). We suspect that some of the processed 5′ ends of archaeal rRNAs may have exposed hydroxyl groups rather than a monophosphate because adapters requiring an exposed 5′-monophosphate ligated poorly to archaeal Sulfolobus solfataricus rRNAs24. This indicates that it will be difficult to deplete rRNAs in microbial communities dominated by archaea using the tested methods.
Percentage removal of Streptomyces sp. str. LCC rRNA was mark-edly lower than average for all three of the applied treatments in experiment 1 (Fig. 2d). The most poorly performing treatment for this organism was Hyb, with only 15% actual and 0.2% observed rRNA removal. Efficient removal of Catenulispora acidiphila rRNA, another member of the phylum Actinobacteria, ruled out the possibility that actinobacterial rRNA is generally poorly tar-geted by Hyb (Fig. 2d). Rather, we noticed that the Streptomyces RNA had the lowest RNA integrity number25 (RIN of 5.5; Table 1). Intact rRNA is important for the success of the Hyb treatment because degradation increases the proportion of rRNA fragments
without the conserved Hyb target sites18. This likely explains the reduced effec-tiveness of the Hyb treatment despite the presence of the rRNA target sites in this organism. Lower RNA integrity may also explain the apparently reduced effectiveness of the Exo treatment on Streptomyces rRNA because partially degraded mRNAs can be targeted by exonuclease skewing the mRNA:rRNA ratio used to calculate actual rRNA removal (Online Methods). Lower integ-
rity of Desulfovibrio vulgaris RNA (RIN 7.4) may similarly explain lower rRNA removal for this organism in some of the treatments (Fig. 2d). Indeed, we observed a high positive correlation between rRNA removal and RIN values for most treatments (Supplementary Fig. 3) suggesting that RIN can be used as an indicator of likely rRNA removal efficiency for these methods.
improvement in mrnA detection sensitivityWe calculated the fold enrichment in mRNAs by comparing the proportion of total mapped mRNA reads between the control and each treatment (Fig. 3a), which produced results ranging from 1.9- to 5.7-fold, largely consistent with the observed rRNA removal. Although mRNA fold enrichment is an intuitive way to express the effect of rRNA removal treatments, a more informa-tive metric may be improvement in mRNA detection sensitivity calculated as the percentage increase in the number of detected mRNAs in a given treatment relative to the number of detected mRNAs in the corresponding control.
Defining the detection threshold as 30 mapped reads per gene (after normalization for dataset size; Online Methods), we calculated a 50–230% increase in mRNA detection sensitivity (Fig. 3b). This shows that even a modest depletion of rRNA (3.6% observed removal) resulted in more efficient use of sequence data (50% increase in mRNA detection sensitivity) justifying the appli-cation of rRNA removal treatments.
Two rounds of subtractive hybridization marginally increased the detection sensitivity improvement from 159% for one-round Hyb to 172% for two rounds (P = 0.004). When testing the effect of the combination of treatments, the order of applying the rRNA removal kits produced statistically different results (P = 0.0003): Hyb followed by Exo gave greater improvement in mRNA detec-tion sensitivity than Exo followed by Hyb (Fig. 3). We hypothesize that using exonuclease as the first treatment produced fragmented rRNAs and reduced the number of Hyb rRNA target sites, result-ing in lower mRNA enrichment.
r = 0.998
10
100
1,000
10,000
100,000
10 100 1,000 10,000 100,000
Run
2 (
Exo
1 ii
)
Run 1 (Exo 1 i)
r = 0.997
10
100
1,000
10,000
100,000
10 100 1,000 10,000 100,000
Run
1 (
Hyb
1 ii
)
Run 1 (Hyb 1 i)
10
100
1,000
10,000
100,000
10 100 1,000 10,000 100,000
Run
4 (
Hyb
2 ii
)
Run 3 (Hyb 2 i)
CatenulisporaSpirochaetaHalorhabdusLactobacillusKangiella
G+C
Overall correlation:r = 0.950
10
100
1,000
10,000
100,000
10 100 1,000 10,000 100,000
Run
4 (
Hyb
2 ii
)
Run 3 (Hyb 2 i)
CatenulisporaSpirochaetaHalorhabdusLactobacillusKangiella
Overall correlation:r = 0.992
a
d
b
c
2.12670%65%63%46%43%
1.4061.4070.7730.639
Slope G+C 1.00470%
65%63%46%43%
0.9790.9211.0670.971
Slope
Figure � | Technical reproducibility. (a–d) In the correlation plots, each point indicates the abundance of an individual mRNA transcript in two technical replicates. Analysis of technical replicates (i and ii) of Hyb in Illumina run 1 (a), Exo between runs 1 and 2 (b), Hyb between runs 3 and 4 (c; color-coded by source organisms) and Hyb between runs 3 and 4 after normalizing for G+C content by organism (d). Pearson’s product moment correlation coefficient, r, for all data points regardless of source organism is shown. Slopes from linear regression of data points for each organism are indicated in c and d.

©20
10 N
atu
re A
mer
ica,
Inc.
All
rig
hts
res
erve
d.
4 | ADVANCE ONLINE PUBLICATION | nAture methods
AnAlysis
Fidelity of mrnA relative abundanceAnother metric by which we assessed the rRNA removal methods was fidelity: how well relative transcript abundance was pre-served after a given treatment relative to the untreated control, assuming an accurate representation of relative transcript abun-dance in the control. We calculated Bray Curtis (BC) similarities between samples by pairwise comparisons of relative transcript abundances of individual mRNAs above the detection threshold in the control. For each experiment, we inferred a dendrogram from the matrix of sample pair similarities using the unweighted pair group method with arithmetic mean (UPGMA) (Fig. 4). We also counted the number of mRNAs exhibiting greater than twofold change between the treatment and corresponding control and presented it as a percentage of the total detected mRNAs (Fig. 4).
The rank order of treatments providing better transcript fidel-ity relative to the control was the same in both experiments: Hyb (≈2Hyb) > Exo > Hyb + Exo (≈Exo + Hyb) and also was largely consistent for individual organisms (Supplementary Tables 5 and 6). Subtractive hybridization alone caused the smallest amount of transcript skewing with only 2–3% of transcripts exhibiting greater than twofold change in expression relative to the control, and one- and two-round Hyb treatments were not statistically
different (P = 0.81). Exo treatments pro-duced a higher degree of skewing than Hyb treatments alone (P < 0.05), probably owing to exonuclease action on partially degraded mRNAs. For example, genes from clusters of orthologous groups of proteins (COG) functional category J were significantly underrepresented in Exo treatments relative to the control (Fisher’s exact test P = 1.65−13 corrected for multiple- hypothesis testing; Online Methods). This category comprises all of the ribo-somal protein families that are known to have high turnover rates and mRNA pools with short half-lives that presumably are partially degraded. Exonuclease alone produced drastically different skewing in both communities (30% and 5% of genes exhibiting greater than twofold change in communities 1 and 2, respectively), indi-cating that mRNA degradation was also
dependent on community composition and that the mRNAs of members of community 1 were on the whole more sensitive to the exonuclease treatment than members of community 2 (Supplementary Tables 5 and 6).
0
20
40
60
80
100
0 20 40 60 80 100Actual rRNA removal (%)
rRNA0 = 94.9%rRNA0 = 96.9%Hyb 1Exo 1Hyb + Exo 1Hyb 22Hyb 2Exo 2Hyb + Exo 2Exo + Hyb 2
Obs
erve
d rR
NA
rem
oval
(%
)
Observed: 18% Actual: 82%
5.1% 23.0%
8.7% 25.0%
Control Hyb
Exo Hyb + Exo
Streptomyces rRNA
Desulfovibrio rRNA
Lactococcus rRNA
Lactobacillus rRNA
Spirochaeta rRNA
Total non-rRNA
3.1% 10.7% 11.3%
14.4% 20.9% 17.0%
Control Hyb 2Hyb
Exo Hyb + Exo Exo + Hyb
Catenulispora rRNA
Halorhabdus rRNA
Kangiella rRNA
Lactobacillus rRNA
Spirochaeta rRNA
Total non-rRNA
0255075
100
0255075
100
0255075
100
0255075
100
0255075
100
Experiment 1 Experiment 2
Hyb
2Hyb
Exo
Hyb+ Exo
Exo+ Hyb
Act
ual r
RN
A r
emov
al fo
r in
divi
dual
org
anis
m (
%)
d
a b
c
Halorh
abdus
Kangiel
la
Lact
obac
illus
Spiroch
aeta
Lact
ococ
cus
Desulf
ovib
rio
Strepto
myc
es
Caten
ulisp
ora
2.0
3.0
4.0
5.0
6.0
7.0
Fol
d en
richm
ent o
f m
RN
AIm
prov
emen
tin
sen
sitiv
ity (
%)
1.0
250
0
50
100
150
200
a
Experiment 1Experiment 2
Experiment 1Experiment 2
b
Exo + HybHyb + ExoExo2HybHyb
Exo + HybHyb + ExoExo2HybHyb
Figure 3 | Enrichment of mRNA in the synthetic communities. (a) Fold enrichment of total mRNA abundance. (b) Percentage improvement in mRNA detection sensitivity.
Figure � | Effectiveness of bulk rRNA removal. (a,b) Distribution of reads between rRNAs (divided by community member) and total non-rRNAs for each treatment in experiments 1 (a) and 2 (b). (c) Observed and actual rRNA percentage removals for the three and five treatments in experiments 1 and 2. Dashed lines are simulations of observed and actual rRNA percentage removals, when starting rRNA (in controls, rRNA0) accounted for 94.9% (community 1) and 96.9% (community 2) of total RNA. (d) Actual rRNA percentage removal for each organism. Error bars, s.d. There was no net rRNA removal for Spirochaeta by Exo in experiment 1, indicated by an arbitrary negative value.

©20
10 N
atu
re A
mer
ica,
Inc.
All
rig
hts
res
erve
d.
nAture methods | ADVANCE ONLINE PUBLICATION | �
AnAlysis
Hyb and Exo applied together produced the greatest skew in mRNA fidelity (>50% of detectable transcripts showing greater than twofold change from control) regardless of the order in which they were applied (Fig. 4). Somewhat unexpectedly, a consistent mRNA skew was introduced by the two tested combinations in experiment 2 (BC similarity = 90.6 ± 1.1%) despite both having a lower correlation to Exo treatment alone (BC similarity = 67.2 ± 1.8%) and Hyb treatment alone (BC similarity = 66.6 ± 3.0%). This suggests that the interaction between the two kits has a more complex effect on mRNA fidelity than a simple addition of the effect that each kit has alone and yet was also reproducible and independent of the order in which the kits were applied.
disCussionRecently, two studies showed that RNA-seq has high technical reproducibility using Illumina sequencing on a bacterial isolate18 and Genome Sequencer FLX pyrosequencing (Roche) on a bac-terial isolate and environmental samples26. We, too, found that technical replicates of Illumina sequencing were highly reproduc-ible with the notable exception of one interrun comparison. We discovered a consistent G+C content bias that would have been missed without data from multiple reference organisms with a broad G+C content range. We speculate that this bias is directly linked to Illumina run quality, with lower-quality runs having greater underrepresentation of high G+C content templates. A G+C content bias has previously been reported in Illumina sequences of mouse transcripts27, lending some support to this hypothesis.
Observed rRNA removal for the synthetic communities was within the 5–58% range calculated for published sequence-based metatranscriptomic analyses of natural communities using the same depletion methods14,17,21–23. However, the different removal treatments varied greatly in preserving relative
transcript abundance (mRNA fidelity), providing a second key determinant for method selection.
The Ambion kit (Hyb) has been pre-viously used to analyze ocean water13,14 and soil samples17. In the latter case, two rounds of rRNA depletion had been used, presumably on the assumption that this would result in improved mRNA enrich-ment. We did not find that two rounds of Hyb produced a significant improvement
in rRNA depletion. This suggests that rRNAs with target sites were efficiently removed in the first round and additional rounds only introduced extra unnecessary handling. Remaining rRNAs either had mismatches to the target sites or were fragments lack-ing a target site. We observed both instances. First, the rRNAs of the sole archaeal member of community 2, which are incompat-ible with the capture oligos, had the lowest depletion levels, which substantially compromised overall mRNA enrichment in com-munity 2, although 26–32% of rRNAs were still removed despite target mismatches. Second, RNA integrity (indicated by RIN) was positively correlated with Hyb removal (Supplementary Fig. 3), confirming that more fragmented rRNAs had lower removal effi-ciencies, consistent with a similar observation for a Burkholderia cenocepacia isolate18.
Unlike with the Hyb treatment, for which potential limitations are well recognized, variability in exonuclease treatment is less well understood. Differential RNA degradation by the processive 5′ to 3′ exonuclease used in the Epicentre kit (Exo) is based on the presence of 5′-monophosphates on mature rRNAs (susceptible) and 5′-triphosphates on intact mRNAs (resistant). However, our results demonstrated that some degradation of mRNAs must be occurring owing to a consistent drop in mRNA fidelity for both experiments. This is most likely due to the exonuclease targeting partially degraded mRNAs, supported by the observation that highly expressed genes with short half-lives were preferentially lost after Exo treatment. Conceivably, Exo treatment could provide a useful snapshot of stable full-length gene expression.
We believe that the findings from these two simple synthetic communities will be applicable to more complex natural com-munities. We therefore suggest the use of one round of Hyb for standard processing of microbial community RNAs with the caveat that archaeal-dominated communities will likely have low levels of mRNA enrichment. To overcome this limitation,
Similarity60 70 80 90 100
Control (1 i)
Control (1 ii)
Hyb (1 i)
Hyb (1 ii)
Exo (1 i)
Exo (1 ii)
Hyb + Exo (1)
10Control (1)
10
103
103
105
10
103
105
10
103
105
10
103
105
10
103
105
10
103
105
105 10 103 105
10 103 105
10 103 105
10 103 105
10 103 105
10 103 105
10 103 105
10
103
105
10
103
105
Hyb
(1)
3.2 ± 2.0%
Control (1)
Hyb
+ E
xo (
1) 51%Control (1)
Exo
(1)
29.5 ± 0.7%
a Control (2 i)
Control (2 ii)
Hyb (2 i)
2Hyb (2 i)
Exo (2 i)
Hyb + Exo (2 i)
Exo + Hyb (2 i)
Control (2)
Control (2)
Control (2)
Control (2)
Control (2)
Hyb
(2)
2.2 ± 1.3%
2Hyb
(2)
2.5 ± 1.8%
Exo
(2)
5.2 ± 0.5%
Hyb
+ E
xo (
2) 51.7 ± 2.3%
Exo
+ H
yb (
2) 53.0 ± 1.5%
b
Similarity100 90 80 70 60
Figure 4 | Fidelity of mRNA relative abundance. (a,b) Analysis of all seven samples in experiment 1 (a) and the seven samples from run 3 in experiment 2 (b). Bray Curtis similarities between samples are indicated by a dendrogram showing increasing loss of mRNA fidelity with distance from controls. Increasing loss of fidelity between treatments (y axes) and corresponding controls (x axes) is also visually shown using scatter plots. The average percentage and s.d. of mRNAs in treatments exhibiting greater than twofold difference from respective controls (indicated by diagonal dashed lines) is shown in each scatter plot.

©20
10 N
atu
re A
mer
ica,
Inc.
All
rig
hts
res
erve
d.
6 | ADVANCE ONLINE PUBLICATION | nAture methods
AnAlysis
sample-specific subtractive hybridization strategies are a prom-ising complement or alternative approach to generic capture beads26, particularly as our results predict that hybridization should not compromise transcript fidelity. Combined treatments should be avoided as they severely impact mRNA fidelity, and Exo treatment alone should not be used unless there is a specific bio-logical interest in studying full-length transcripts. Workup of total RNAs should include a determination of the RIN, and we suggest only sequencing RNAs with RIN > 7.0 to maximize the poten-tial effectiveness of the Hyb treatment. Finally, comparisons of samples between Illumina runs should be viewed cautiously given the potential for G+C content bias. These recommendations should help guide researchers in making informed decisions on how to enrich mRNA for de novo sequencing, particularly for microbial communities in which many more variables may be at play.
methodsMethods and any associated references are available in the online version of the paper at http://www.nature.com/naturemethods/.
Note: Supplementary information is available on the Nature Methods website.
ACknoWledGmentsWe thank M. Allgaier, T. Zhan, M. Hess and E. DeLong for helpful discussions and feedback, H.-P. Klenk (German Collection of Microorganisms and Cell Cultures), T. Zhang and F. Warnecke (Joint Genome Institute) for providing microbial biomass, L. Pennacchio for supporting and facilitating this project, and members of research and development and production teams at the Joint Genome Institute for sequencing support. S.H. and P.H. were supported by a grant from the Energy Biosciences Institute. R.S. was supported, in part, by the Israel Science Foundation Focal Initiatives in Research in Science and Technology program (1615/09), the EMBO Young Investigator program, the Minerva Foundation and the Yeda-Sela Center for basic research. O.W. was supported by the Kahn Center for Systems Biology of the Human Cell and an Azrieli Foundation Fellowship. The work was performed in part under the auspices of the US Department of Energy’s Office of Science, Biological and Environmental Research Program, and by the University of California, Lawrence Berkeley National Laboratory under contract DE-AC02-05CH11231, Lawrence Livermore National Laboratory under contract DE-AC52-07NA27344 and Los Alamos National Laboratory under contract DE-AC02-06NA25396.
Author ContriButionsS.H., K.S., S.G.T., F.C., E.A.L. and P.H. planned the experiments, S.H., K.S. and S.Y. executed the experiments, S.H., O.W., J.L.F., Z.W., R.S. and P.H. performed the data analysis and S.H. and P.H. wrote the manuscript.
ComPetinG FinAnCiAl interestsThe authors declare no competing financial interests.
Published online at http://www.nature.com/naturemethods/. reprints and permissions information is available online at http://npg.nature.com/reprintsandpermissions/.
1. Sorek, R. & Cossart, P. Prokaryotic transcriptomics: a new view on regulation, physiology and pathogenicity. Nat. Rev. Genet. ��, 9–16 (2010).
2. Neidhardt, F.C. & Umbarger, H.E. Chemical composition of Escherichia coli. in Escherichia coli and Salmonella: Cellular and Molecular Biology 2nd edn., vol. 1 (eds. Neidhardt, F.C. et al.) 13–17 (ASM Press, Washington, D.C., 1996).
3. Karpinets, T.V., Greenwood, D.J., Sams, C.E. & Ammons, J.T. RNA: protein ratio of the unicellular organism as a characteristic of phosphorous and
nitrogen stoichiometry and of the cellular requirement of ribosomes for protein synthesis. BMC Biol. 4, 30 (2006).
4. Zhao, J., Hyman, L. & Moore, C. Formation of mRNA 3′ ends in eukaryotes: mechanism, regulation, and interrelationships with other steps in mRNA synthesis. Microbiol. Mol. Biol. Rev. 63, 405–445 (1999).
5. Urich, T. et al. Simultaneous assessment of soil microbial community structure and function through analysis of the meta-transcriptome. PLoS ONE 3, e2527 (2008).
6. Mao, C., Evans, C., Jensen, R. & Sobral, B. Identification of new genes in Sinorhizobium meliloti using the Genome Sequencer FLX system. BMC Microbiol. 8, 72 (2008).
7. Su, C. & Sordillo, L.M. A simple method to enrich mRNA from total prokaryotic RNA. Mol. Biotechnol. �0, 83–85 (1998).
8. Pang, X. et al. Bacterial mRNA purification by magnetic capture-hybridization method. Microbiol. Immunol. 48, 91–96 (2004).
9. Frias-Lopez, J. et al. Microbial community gene expression in ocean surface waters. Proc. Natl. Acad. Sci. USA �0�, 3805–3810 (2008).
10. Shi, Y., Tyson, G.W. & DeLong, E.F. Metatranscriptomics reveals unique microbial small RNAs in the ocean′s water column. Nature 4�9, 266–269 (2009).
11. Dunman, P.M. et al. Transcription profiling-based identification of Staphylococcus aureus genes regulated by the agr and/or sarA loci. J. Bacteriol. �83, 7341–7353 (2001).
12. McGrath, K.C. et al. Isolation and analysis of mRNA from environmental microbial communities. J. Microbiol. Methods 7�, 172–176 (2008).
13. Gilbert, J.A. et al. Detection of large numbers of novel sequences in the metatranscriptomes of complex marine microbial communities. PLoS ONE 3, e3042 (2008).
14. Gilbert, J.A. et al. Potential for phosphonoacetate utilization by marine bacteria in temperate coastal waters. Environ. Microbiol. ��, 111–125 (2009).
15. He, S. et al. Metatranscriptomic array analysis of ′Candidatus Accumulibacter phosphatis′-enriched enhanced biological phosphorus removal sludge. Environ. Microbiol. ��, 1205–1217 (2010).
16. Hu, Z., Zhang, A.X., Storz, G., Gottesman, S. & Leppla, S.H. An antibody-based microarray assay for small RNA detection. Nucleic Acids Res. 34, e52 (2006).
17. Shrestha, P.M., Kube, M., Reinhardt, R. & Liesack, W. Transcriptional activity of paddy soil bacterial communities. Environ. Microbiol. ��, 960–970 (2009).
18. Yoder-Himes, D.R. et al. Mapping the Burkholderia cenocepacia niche response via high-throughput sequencing. Proc. Natl. Acad. Sci. USA �06, 3976–3981 (2009).
19. Burgmann, H. et al. Transcriptional response of Silicibacter pomeroyi DSS-3 to dimethylsulfoniopropionate (DMSP). Environ. Microbiol. 9, 2742–2755 (2007).
20. Garbeva, P. & de Boer, W. Inter-specific interactions between carbon-limited soil bacteria affect behavior and gene expression. Microb. Ecol. �8, 36–46 (2009).
21. Hewson, I. et al. Microbial community gene expression within colonies of the diazotroph, Trichodesmium, from the Southwest Pacific Ocean. ISME J. 3, 1286–1300 (2009).
22. Poretsky, R.S. et al. Comparative day/night metatranscriptomic analysis of microbial communities in the North Pacific subtropical gyre. Environ. Microbiol. ��, 1358–1375 (2009).
23. Hewson, I. et al. In situ transcriptomic analysis of the globally important keystone N2-fixing taxon Crocosphaera watsonii. ISME J. 3, 618–631 (2009).
24. Wurtzel, O. et al. A single-base resolution map of an archaeal transcriptome. Genome Res. �0, 133–141 (2010).
25. Schroeder, A. et al. The RIN: an RNA integrity number for assigning integrity values to RNA measurements. BMC Mol. Biol. 7, 3 (2006).
26. Stewart, F.J., Ottesen, E.A. & DeLong, E.F. Development and quantitative analyses of a universal rRNA-subtraction protocol for microbial metatranscriptomics. ISME J. 4, 896–907 (2010).
27. Rosenkranz, R., Borodina, T., Lehrach, H. & Himmelbauer, H. Characterizing the mouse ES cell transcriptome with Illumina sequencing. Genomics 9�, 187–194 (2008).

©20
10 N
atu
re A
mer
ica,
Inc.
All
rig
hts
res
erve
d.
nAture methodsdoi:10.1038/nmeth.1507
online methodsMicrobial isolates. One archaeal and seven bacterial isolates were used in this study (Table 1). Lactococcus lactis was grown in M17 medium (Difco) supplemented with 0.5% glucose, Lactobacillus brevis was grown in American Type Culture Collection (ATCC) medium 416, and both were incubated overnight in 50 ml shake flasks at 30 °C. Streptomyces sp. str. LCC was initially maintained on oatmeal agar (German Collection of Microorganisms and Cell Cultures (DSMZ) medium 84) at 30 °C, and axenic colonies from plates were transferred into yeast malt extract broth and grown at 30 °C. Other microbial isolates were grown using DSMZ rec-ommended media and conditions (http://www.dsmz.de/). All isolates had complete reference genomes with the exception of Streptomyces sp. str. LCC for which a draft genome comprising 5,197 contigs is available (http://img.jgi.doe.gov/er).
RNA extraction and synthetic metatranscriptome construction. Total RNA was extracted independently from each micro-bial isolate using the RiboPure Bacteria Kit (Ambion) with DNase I digestion, following the manufacturer’s instructions. Note that 5S rRNAs and tRNAs are largely excluded by this kit based on their size (<200 base pairs (bp)). A modification was made when extracting RNA from Halorhabdus (a halophile that grows only in high salt) by applying twice the recommended volume of RNAwiz buffer to cope with the high salt residues in the cell pellet. The quantity and quality of RNA was evalu-ated using Agilent 2100 Bioanalyzer electropherograms. Two synthetic metatranscriptomes were then constructed by pool-ing equimolar amounts of total RNAs from the two sets of five organisms, as described in Table 1. The pooled total RNA was aliquoted to form the starting material for the control (total RNA without rRNA removal) and various treatments (rRNA removal procedures), as well as their corresponding technical replicates (Table 2).
rRNA removal treatments. The MICROBExpress Bacterial mRNA Enrichment Kit (Ambion) and the mRNA-ONLY Prokaryotic mRNA Isolation Kit (Epicentre) were applied in various combinations to synthetic communities 1 and 2 (Table 2) according to manufacturers’ instructions. For each treatment, a technical replicate (following RNA pooling) was included, except for Hyb + Exo in experiment 1. For both experiments, ~8.5 μg of pooled total RNA was used as the starting material for each treat-ment evaluated. rRNA removal after each treatment was visually assessed by Agilent 2100 Bioanalyzer RNA electropherograms (Supplementary Fig. 1).
RNA fragmentation and cDNA synthesis. The pooled total RNAs from controls (100 ng) and mRNA-enriched RNAs by treat-ments (~5–60 ng) were chemically fragmented to ~150–250 bp by incubation with 1× fragmentation solution (Ambion) at 70 °C for 5 min. Double-stranded cDNAs were synthesized from fragmented RNAs using SuperScript Double-Stranded cDNA Synthesis Kit (Invitrogen), with the first strand primed by random hexamers and the second strand synthesized by nick translation.
Illumina library construction and sequencing. The Illumina genomic sample prep kit was used for Illumina library prepara-tion, following manufacturer’s instructions. Briefly, fragmented
cDNA was end repaired to generate blunt ends. An adenine was added to the 3′ end of the blunt-ended cDNA fragments, allow-ing the subsequent ligation of Illumina adaptors. A 200–500 bp size selection of ligation products was conducted by gel elec-trophoresis purification using the MiniElute Gel Extraction Kit (Qiagen) according to manufacturer’s instructions, except that the gel was dissolved at 37 °C, instead of the recommended 55 °C, to minimize denaturation of (A+T)-rich fragments28. A 12-cycle PCR with adaptor primers was applied to comparable amounts of adaptor-modified cDNA fragments. All sequencing was performed using the Illumina Genome Analyzer II platform to generate single-end 76 bp reads with the exception of sample Exo (1-ii), which was paired-end data. Technical replicates were distributed within and between four Illumina runs (flowcells) (Table 2).
Alignment and relative transcript abundance evaluation. Quality-filtered reads were aligned to the reference genomes using blastn with a word-size of 11. The alignment required a minimal length of 42 bp allowing up to six mismatches. The aver-age length of the alignment for samples in experiment 2 was 72.5 ± 3.0 bp. This indicates that the vast majority of sequences were fully mapped to their genome of origin. The number of reads mapped to each gene (including mRNA, rRNA, tRNA and inter-genic regions; Supplementary Table 2) was counted and normal-ized by the library size to account for different numbers of reads generated for each sample. This normalization was performed by dividing the raw read count per transcript by the number of total mapped reads in each Illumina lane and then multiplying by the average number of total mapped reads in the controls in each experiment. An mRNA was defined as ‘detected’ if the library size–normalized read count (relative transcript abundance) for a given mRNA was ≥30. This detection threshold was selected as it was found to be the minimum number of reads needed to pass a Chi-square statistical test for differential expression (P < 0.05) based on empirical simulations (corrected for multiple hypothesis testing; data not shown).
G+C content–associated interrun variation normalization. Technical reproducibility was evaluated using the Pearson’s product-moment correlation coefficient (r) of relative tran-script abundances of individual mRNAs between two technical replicates. As interrun variation associated with G+C content was observed, we tried two simple normalization strategies. The first strategy (by organism) was performed by normaliz-ing the relative transcript abundances of individual mRNAs by the total mRNA read count from its source organism in each run. As the taxonomic classification of mRNAs in real metatranscriptomic datasets may not be available, we also tried a second strategy (by gene), which normalized the tran-script abundance by the G+C content of individual genes, described below.
For each gene, NA′ = NA × (%G+C)a, in which NA is raw read count and NA′ is G+C content–normalized read count for a given gene in run A; %G+C is the G+C content of that gene; and a is the correction factor between runs A and B, determined by the best fit that minimizes the sum of the difference between NA′ and NB (read count from its corresponding technical replicate in run B) for all mRNAs with technical replicates in runs A and B.

©20
10 N
atu
re A
mer
ica,
Inc.
All
rig
hts
res
erve
d.
nAture methods doi:10.1038/nmeth.1507
rRNA percentage removal calculation. The observed and actual rRNA percentage removal was calculated as:
ObservedrRNA percentageremoval
Actual rRNA percentagerem
= −r r0 1
ooval 1= − × − −( / ) (( ) / ( ))r r r r1 0 0 11 1
r0 and r1 are the percentages of rRNA reads among all mapped reads in the control and treatment, respectively.
To accurately assess the rRNA depletion efficiency (mRNA fold enrichment, detection sensitivity improvement and fidelity, as described below), we restricted comparisons of treatment-control pairs to the same run in experiment 2 because of the observed G+C content bias between runs 3 and 4. The average and s.d. was derived from all available treatment-control comparisons in experiment 1 and all available intrarun comparisons from runs 3 and 4 in experiment 2.
mRNA enrichment and detection sensitivity increase calculation. The fold enrichment of total mRNA abundance and the percentage improvement in mRNA detection sensitivity were calculated as:
mRNA foldenrichment
PercentageimprovementinmRNAdetecti
= m m1 0/
oonsensitivity
= − ×(( ) / )M M M1 0 0 100
m0 and m1 are the percentage of total mRNA reads among all mapped reads in the control and treatment respectively; and M0 and M1 are the number of mRNAs above the detection threshold (30 reads per gene after normalization by library size) in the con-trol and treatment, respectively.
mRNA fidelity evaluation. mRNA fidelity is a measure of the preservation of relative transcript abundance between a treat-ment and corresponding control. As low-abundance transcripts may become detectable after an mRNA enrichment treatment, these transcripts may appear to be skewed because of statisti-cally insignificant read counts in the control. Therefore, we used a
filter to only include mRNAs that are above the 30-read detection threshold in a majority of the controls to assess mRNA fidelity. Individual mRNA read counts were further normalized by total read counts from all mRNAs included in the analysis. BC simi-larities between samples were calculated using Primer 6 (version 6.1.9) (PRIMER-E Ltd) to generate similarity matrices based on pairwise comparisons of relative transcript abundance for indi-vidual mRNAs included. A BC similarity-based hierarchical clus-tering of samples was performed using the UPGMA clustering algorithm. In addition, normalized read counts for individual mRNAs detected in the control were plotted against their nor-malized read counts in each treatment. The number of mRNAs exhibiting greater than twofold difference between a treatment and corresponding control was counted and represented as a pro-portion of total detected mRNAs in the corresponding control.
Underrepresented mRNA functional category identification. A gene expression index (GEI) for all mRNAs was calculated by dividing the number of reads in the mRNA per kilobase, followed by normalization according to the total number of mRNA reads in the sample. Differential expression between samples was deter-mined by performing a chi-square test of the GEI of all mRNAs in different conditions, followed by a Bonferonni correction for multiple-hypothesis testing with a threshold of P < 0.05. Available functional classifications of genes was downloaded from US National Center for Biotechnology Information (NCBI) records (http://www.ncbi.nlm.nih.gov/COG/), and enrichment for under-represented mRNAs in different COG functional categories was calculated with a single-sided Fisher’s exact test followed by a Bonferonni correction for multiple-hypothesis testing.
Other statistical analyses. Student’s t-tests were performed to obtain statistical significance (P value) when comparing two variables. The Pearson’s product-moment correlation coefficient (r) was used to determine the correlation between actual rRNA percent removal and RIN.
28. Quail, M.A. et al. A large genome center’s improvements to the Illumina sequencing system. Nat. Methods �, 1005–1010 (2008).


