Embed Size (px)
Citation preview
Vector diffraction from subwavelength opticaldisk structures: two-dimensional modeling ofnear-field profiles, far-field intensities, and detectorsignals from a DVD
Wei-Chih Liu and Marek W. Kowarz
Rigorous two-dimensional vector-diffraction patterns of a focused beam incident on an optical disk,specifically, a digital versatile disk ~DVD!, are examined both in the near field and in the far field. Anefficient finite-difference frequency-domain method is developed for calculating the electromagnetic fieldsin the neighborhood of subwavelength dielectric and metallic structures. The results of vector-diffraction theory are compared with those of scalar-diffraction theory for pressed DVD features thatconsist of pits or of bumps. The sum ~data! and difference ~tracking! signals from a split photodetectorare also calculated for different disk features and for different polarizations. The subwavelength fea-tures of a DVD result in considerable vector-diffraction effects both in the near-field profiles and in thedetector signals, depending not only on the polarization of illumination but also on whether the featuresare pits or bumps. This paper provides important insight into the vector-diffraction effects encounteredin high-density optical data storage systems. © 1999 Optical Society of America
OCIS codes: 210.0210, 050.1960, 210.4590.
vd
1. Introduction
Fast progress in nanotechnology and in microelec-tronics fabrication has led to numerous engineeredstructures that, in size, are comparable with orsmaller than the wavelength of visible light. Foroptical data storage systems smaller spot size is a keyrequirement for high-density recording. In fact, thedigital versatile disk ~DVD!, which is becoming thenew standard for multimedia distribution, has a min-imum feature size that is smaller than the readoutlaser wavelength ~see Section 4!. Since optical stor-age systems can employ various polarizations of in-cident light, and since features on the DVD havedimensions smaller than the wavelength of the laserlight, the reflected light signals are expected to showa strong polarization dependence. Theoretical mod-
W.-C. Liu [email protected]! is with the Rochester The-ory Center for Optical Science and Engineering, University ofRochester, Rochester, New York 14627-0171. M. W. Kowarz iswith the Integrated Materials and Microstructures Laboratory,Imaging Research and Advanced Development, Eastman KodakCompany, Rochester, New York 14650-2015.
Received 19 January 1999.0003-6935y99y173787-11$15.00y0© 1999 Optical Society of America
eling and analysis of these polarization effects re-quire rigorous vector-diffraction theory for dealingwith material boundaries.
Inspired by the exciting development in near-fieldoptics and in near-field microscopy,1–4 certain newtypes of optical storage system make use of near-fieldsignals from the disk surface to surpass the conven-tional resolution limit and to achieve a substantiallyhigher storage capacity. From the early stages ofnear-field optical microscopy there were numerousproposals for data storage systems that use the tip ofan optical fiber5 or a subwavelength slit-type probe6,7
to pick up near-field signals from optical disks. Apromising alternative to this approach is the solidimmersion lens, which employs an objective lens thatflies tens of nanometers from the surface of the stor-age medium.8–11 Detailed understanding of thesesystems requires the study of near-field profiles onthe disk surface. Although there are numerousmodeling studies of near-field optical systems, littlepublished research on near-field optics7,12,13 has fo-cused on high-density optical data storage systems.
To investigate vector diffraction from optical disks~or the closely related problem of vector diffractionfrom a grating with a finite number of periods!,arious numerical algorithms such as the finite-ifference time-domain ~FDTD! method,14,15 mode-
10 June 1999 y Vol. 38, No. 17 y APPLIED OPTICS 3787
7,16–20
f
ctis
w
ca
3
matching methods, the boundary elementmethod,21–24 and the integral method25–27 have beenused. Previous research on the subject can be subdi-vided into several types of configuration: plane fieldsincident on perfectly conducting structures17,20 or di-electric structures,21 plane fields incident on realisticmetallic structures,13,24,25,28 focused fields incident onperfectly conducting structures,18,19,22,26,27 and focusedfields incident on realistic metallic structures.14–16,23,29
Until recently,26,27,29 little attention was paid to themodeling of the DVD configuration, which has featuressmaller than the wavelength of the laser light thatwould cause considerable vector-diffraction effects innear-field distributions, far-field intensities, and detec-tor signals. Most of the previous studies modeled var-ious optical disk configurations with considerablylarger features.
Several of these studies emphasized especially thedetector signals generated by an optical disk. De-pine and Skigin28 illustrated that there are notabledifferences between the signals from a perfect con-ductor and those from a highly conducting metal.Kobayashi18 used vector-diffraction theory to treat aocused, truncated Gaussian beam @numerical aper-
ture ~NA! is 0.6# incident on a rectangular, perfectlyonducting grating. He examined the dependence ofhe readout and servo signals on the incident polar-zation, the depth of grooves and pits, and the featureize. Gerber and Mansuripur30 experimentally ob-
served that, when the incident medium is air, thedetector signals from metal-coated surfaces differ sig-nificantly for the two incident polarizations. Jud-kins et al.15 simulated a two-dimensional rewritableoptical disk with the FDTD method and experimen-tally validated the tracking performance.
In this paper we discuss the modeling of a DVDoptical storage system with rigorous vector-diffraction theory and present results for the near-field distributions, the far-field intensities, and thedetector signals. For this purpose we developed anefficient FDFD method for calculating the electro-magnetic fields in the neighborhood of realistic di-electric and metallic subwavelength structures to ahigh accuracy.29 Our two-dimensional simulationtreats the rigorous vector diffraction of a focused po-larized Gaussian beam that interacts with two-dimensional aperiodic pressed disk structures. Weexplore different DVD configurations that contain ei-ther pits or bumps in the disk surface ~see Section 4!.The signals from a split detector show a strong de-pendence on the polarization of the incident light andon the geometry of the features on the disk. Ourresults demonstrate that the vector diffraction effectsof the DVD configuration are more significant thanthose of earlier optical formats discussed in previousstudies. Most notable is the large difference be-tween the results for a disk with pressed pits versusthose for one with pressed bumps.
2. Numerical Methods
Since we are interested in steady-state phenomena,the electromagnetic field can be assumed to be time
788 APPLIED OPTICS y Vol. 38, No. 17 y 10 June 1999
harmonic and the FDFD method can be used to solvethe time-harmonic Maxwell equations. In source-free media that are nonmagnetic, isotropic, and in-homogeneous the time-harmonic Maxwell equationsmay be written as
¹ 3 E 5 ivH,
¹ z ~eE! 5 0,
¹ 3 H 5 2iveE,
¹ z H 5 0, (1)
here E is the electric field, H is the magnetic field,e is the complex electric permittivity, v is the angularfrequency, and a time dependence of exp~2ivt! hasbeen assumed. The information about materialproperties is included in e. With elimination of themagnetic field the Maxwell equations become
¹2E 1 v2eE 5 ¹~¹ z E!, (2)
¹ z ~eE! 5 0. (3)
Equation ~2! is in the form of a coupled generalHelmholtz equation and is the main equation weworked on. With properly imposed boundary condi-tions and grid geometry the divergence equation issatisfied automatically.31,32 To solve Eq. ~2!, weombine several techniques to develop an efficientnd ~to our knowledge! a novel FDFD method.
A. Concus–Golub Iteration
Concus and Golub33 have proposed an iterationscheme based on a fast cyclic-reduction Helmholtzsolver34–36 for the repeated solution of Helmholtz-likeequations. This method exploits the sparcity of thediscrete Helmholtz equation and can handle separa-ble equations of the form
¹2E~y, z! 1 v2e0~z!E~y, z! 5 f ~y, z!, (4)
where f ~y, z! is an arbitrary source term. This equa-tion can describe the layered optical disk structure.The cyclic reduction method can produce fast directsolutions at O~3n2 log n! for an n 3 n matrix, has asmall memory requirement, and can be well parallel-ized.37,38
In Eq. ~2! each component has the form of a generalHelmholtz equation
@¹2 1 v2e~y, z!#Ei 5 ¹i~¹ z E!, (5)
where the source term is the component from ¹~¹ z E!.The unknown electric field can be solved with theConcus–Golub iteration method. Specifically, forthe kth iteration we use the expression
~¹2 1 v2e0!Eik 5 2v2@e~y, z! 2 e0#Ei
k21 1 ¹i~¹ z Ek21!.
(6)
It has been demonstrated with finite differences33
that the number of necessary iterations can vary dra-matically depending on the function e~y, x!. Usu-ally, the smoother e~y, x! is, the faster the rate of
dsm
bftffdr
w
wa
c~mpm
pbtpt
p
d
convergence. When the Concus–Golub iterationmethod does not converge, we use the conjugate gra-dient method to overcome this difficulty.
B. Conjugate Gradient Method
Conjugate gradient methods are probably the mostpopular iterative techniques for solving systems oflinear equations. They are often referred to as sub-space iteration methods, because they solve a systemof linear equations A x 5 b by minimization of qua-
ratic functionals in Krylov subspaces, which arepanned by a series of vectors generated by repeatedultiplication by A.The Concus–Golub iteration can be used as a good
preconditioner in conjunction with a robust re-started general minimal residual conjugate gradi-ent method39 to fully solve for electric fields to avery high accuracy.40 From numerical experi-ments it was found that the internal iterations thatcorrespond to the Concus–Golub preconditioner donot need to converge to reach optimum computingperformance.40
C. Radiation Boundary Condition
To solve the Maxwell equations in an infinite domainnumerically, for example, in diffraction or scatteringproblems, it is usually necessary to limit the compu-tation to a finite domain and to impose a radiationboundary condition on the outer edge of the numeri-cal grid. The purpose of the radiation boundary con-dition is to absorb the scattered or radiated fieldswhen they arrive at the grid edge and to simulateboundless free space.
The Engquist–Majda41,42 and the Mur43 radiationoundary conditions and their variations have beenrequently used in FDTD calculations. Althoughheir original formulations are derived in FDTDramework, it is straightforward to adapt them torequency-domain format. In this paper we use Hig-on’s variation of the second-order finite-differenceadiation boundary condition:44,45
FScos a1 2ik
]
]zDScos a2 2ik
]
]zDGE 5 0, (7)
here a1 and a2 are the optimal angles for minimalreflection. The z direction is the primary direction of
ave propagation in our case, and the angles a1 and2 are zero. This boundary condition is equivalent
to the second-order Engquist–Majda radiationboundary condition,44 but it is better suited for thecyclic reduction method, because it involves the de-rivative in only one direction.
3. Configuration
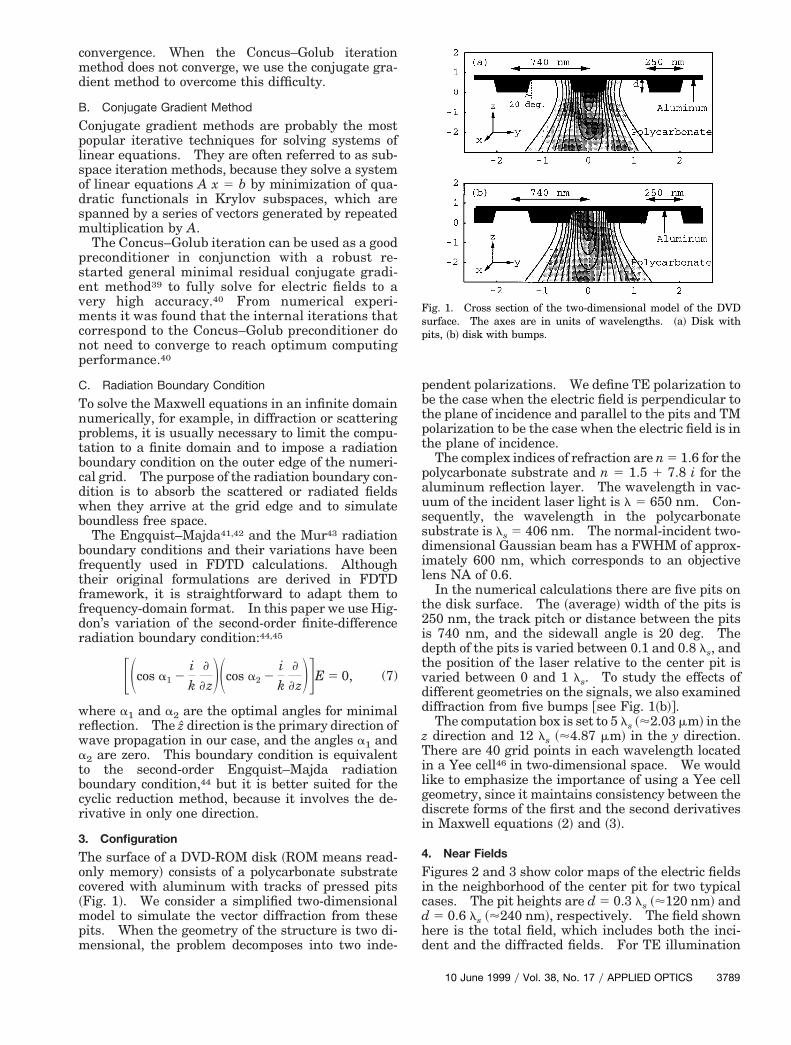
The surface of a DVD-ROM disk ~ROM means read-only memory! consists of a polycarbonate substrateovered with aluminum with tracks of pressed pitsFig. 1!. We consider a simplified two-dimensionalodel to simulate the vector diffraction from these
its. When the geometry of the structure is two di-ensional, the problem decomposes into two inde-
endent polarizations. We define TE polarization toe the case when the electric field is perpendicular tohe plane of incidence and parallel to the pits and TMolarization to be the case when the electric field is inhe plane of incidence.
The complex indices of refraction are n 5 1.6 for theolycarbonate substrate and n 5 1.5 1 7.8 i for the
aluminum reflection layer. The wavelength in vac-uum of the incident laser light is l 5 650 nm. Con-sequently, the wavelength in the polycarbonatesubstrate is ls 5 406 nm. The normal-incident two-dimensional Gaussian beam has a FWHM of approx-imately 600 nm, which corresponds to an objectivelens NA of 0.6.
In the numerical calculations there are five pits onthe disk surface. The ~average! width of the pits is250 nm, the track pitch or distance between the pitsis 740 nm, and the sidewall angle is 20 deg. Thedepth of the pits is varied between 0.1 and 0.8 ls, andthe position of the laser relative to the center pit isvaried between 0 and 1 ls. To study the effects ofdifferent geometries on the signals, we also examineddiffraction from five bumps @see Fig. 1~b!#.
The computation box is set to 5 ls ~'2.03 mm! in thez direction and 12 ls ~'4.87 mm! in the y direction.There are 40 grid points in each wavelength locatedin a Yee cell46 in two-dimensional space. We wouldlike to emphasize the importance of using a Yee cellgeometry, since it maintains consistency between thediscrete forms of the first and the second derivativesin Maxwell equations ~2! and ~3!.
4. Near Fields
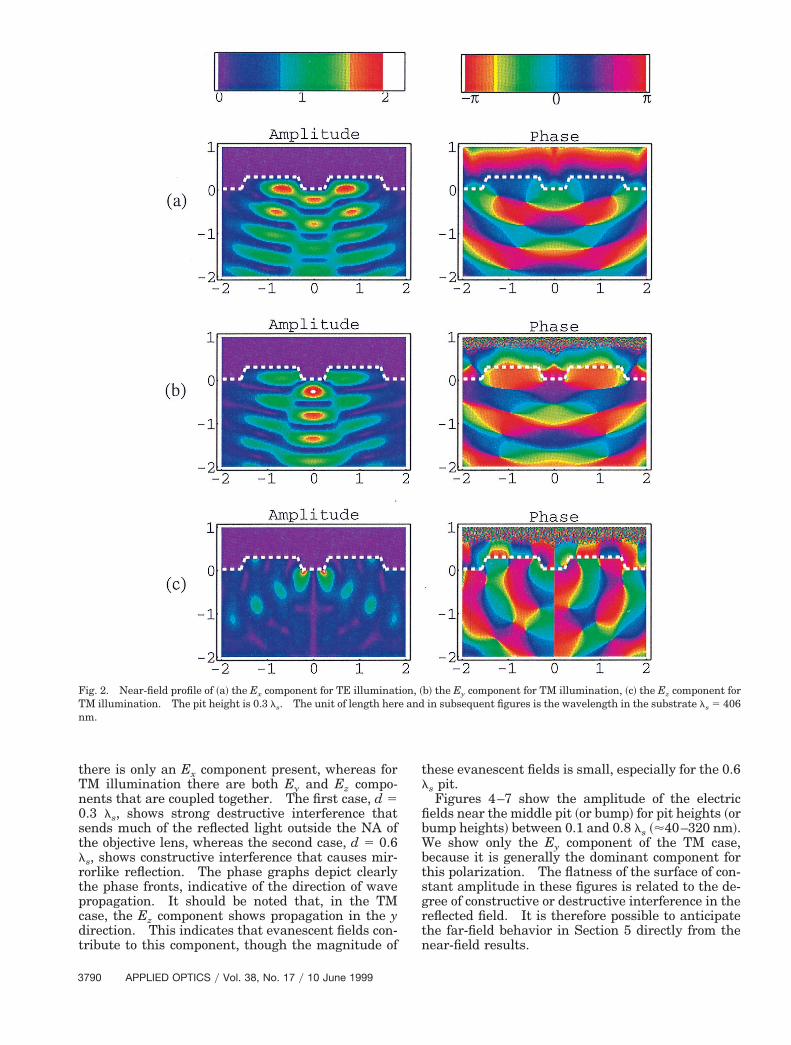
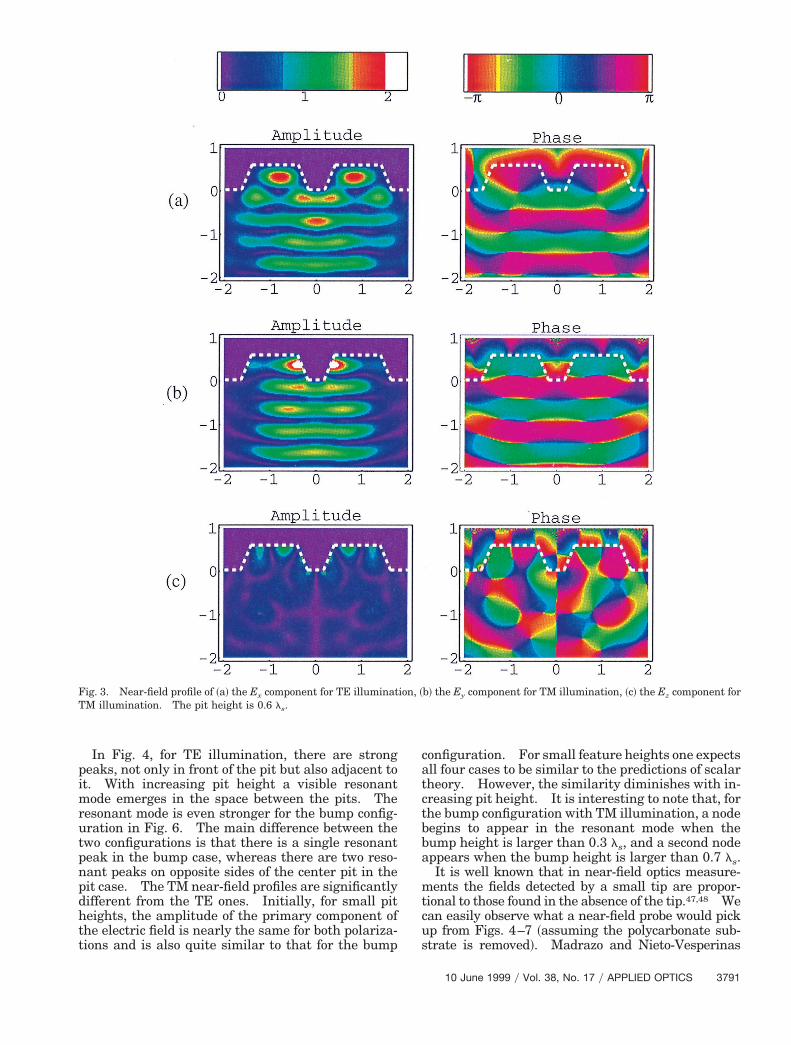
Figures 2 and 3 show color maps of the electric fieldsin the neighborhood of the center pit for two typicalcases. The pit heights are d 5 0.3 ls ~'120 nm! and
5 0.6 ls ~'240 nm!, respectively. The field shownhere is the total field, which includes both the inci-dent and the diffracted fields. For TE illumination
Fig. 1. Cross section of the two-dimensional model of the DVDsurface. The axes are in units of wavelengths. ~a! Disk withpits, ~b! disk with bumps.
10 June 1999 y Vol. 38, No. 17 y APPLIED OPTICS 3789
T
0 fibW
T
3
there is only an Ex component present, whereas forM illumination there are both Ey and Ez compo-
nents that are coupled together. The first case, d 5.3 ls, shows strong destructive interference that
sends much of the reflected light outside the NA ofthe objective lens, whereas the second case, d 5 0.6ls, shows constructive interference that causes mir-rorlike reflection. The phase graphs depict clearlythe phase fronts, indicative of the direction of wavepropagation. It should be noted that, in the TMcase, the Ez component shows propagation in the ydirection. This indicates that evanescent fields con-tribute to this component, though the magnitude of
Fig. 2. Near-field profile of ~a! the Ex component for TE illuminatM illumination. The pit height is 0.3 ls. The unit of length her
nm.
790 APPLIED OPTICS y Vol. 38, No. 17 y 10 June 1999
these evanescent fields is small, especially for the 0.6ls pit.
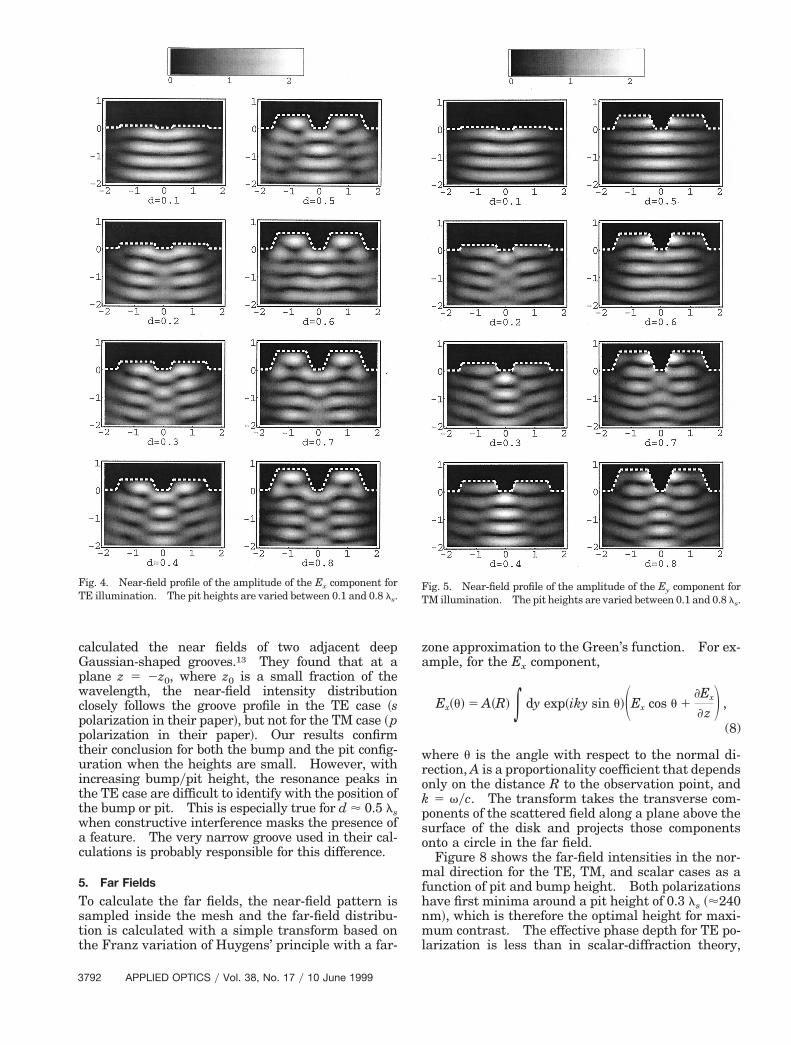
Figures 4–7 show the amplitude of the electricelds near the middle pit ~or bump! for pit heights ~orump heights! between 0.1 and 0.8 ls ~'40–320 nm!.e show only the Ey component of the TM case,
because it is generally the dominant component forthis polarization. The flatness of the surface of con-stant amplitude in these figures is related to the de-gree of constructive or destructive interference in thereflected field. It is therefore possible to anticipatethe far-field behavior in Section 5 directly from thenear-field results.
b! the Ey component for TM illumination, ~c! the Ez component forin subsequent figures is the wavelength in the substrate ls 5 406
ion, ~e and
T
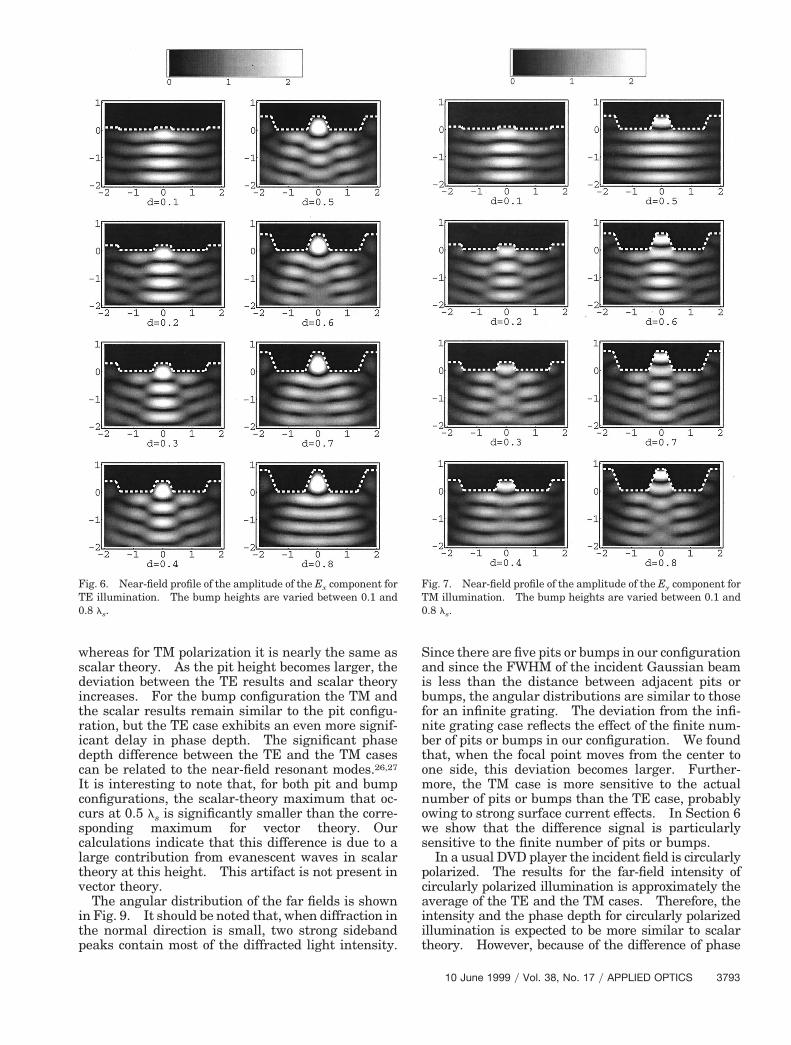
In Fig. 4, for TE illumination, there are strongpeaks, not only in front of the pit but also adjacent toit. With increasing pit height a visible resonantmode emerges in the space between the pits. Theresonant mode is even stronger for the bump config-uration in Fig. 6. The main difference between thetwo configurations is that there is a single resonantpeak in the bump case, whereas there are two reso-nant peaks on opposite sides of the center pit in thepit case. The TM near-field profiles are significantlydifferent from the TE ones. Initially, for small pitheights, the amplitude of the primary component ofthe electric field is nearly the same for both polariza-tions and is also quite similar to that for the bump
Fig. 3. Near-field profile of ~a! the Ex component for TE illuminatM illumination. The pit height is 0.6 ls.
configuration. For small feature heights one expectsall four cases to be similar to the predictions of scalartheory. However, the similarity diminishes with in-creasing pit height. It is interesting to note that, forthe bump configuration with TM illumination, a nodebegins to appear in the resonant mode when thebump height is larger than 0.3 ls, and a second nodeappears when the bump height is larger than 0.7 ls.
It is well known that in near-field optics measure-ments the fields detected by a small tip are propor-tional to those found in the absence of the tip.47,48 Wecan easily observe what a near-field probe would pickup from Figs. 4–7 ~assuming the polycarbonate sub-strate is removed!. Madrazo and Nieto-Vesperinas
b! the Ey component for TM illumination, ~c! the Ez component for
ion, ~10 June 1999 y Vol. 38, No. 17 y APPLIED OPTICS 3791
3
calculated the near fields of two adjacent deepGaussian-shaped grooves.13 They found that at aplane z 5 2z0, where z0 is a small fraction of thewavelength, the near-field intensity distributionclosely follows the groove profile in the TE case ~spolarization in their paper!, but not for the TM case ~ppolarization in their paper!. Our results confirmtheir conclusion for both the bump and the pit config-uration when the heights are small. However, withincreasing bumpypit height, the resonance peaks inthe TE case are difficult to identify with the position ofthe bump or pit. This is especially true for d ' 0.5 lswhen constructive interference masks the presence ofa feature. The very narrow groove used in their cal-culations is probably responsible for this difference.
5. Far Fields
To calculate the far fields, the near-field pattern issampled inside the mesh and the far-field distribu-tion is calculated with a simple transform based onthe Franz variation of Huygens’ principle with a far-
792 APPLIED OPTICS y Vol. 38, No. 17 y 10 June 1999
zone approximation to the Green’s function. For ex-ample, for the Ex component,
Ex~u! 5 A~R! * dy exp~iky sin u!SEx cos u 1]Ex
]z D ,
(8)
where u is the angle with respect to the normal di-rection, A is a proportionality coefficient that dependsonly on the distance R to the observation point, andk 5 vyc. The transform takes the transverse com-ponents of the scattered field along a plane above thesurface of the disk and projects those componentsonto a circle in the far field.
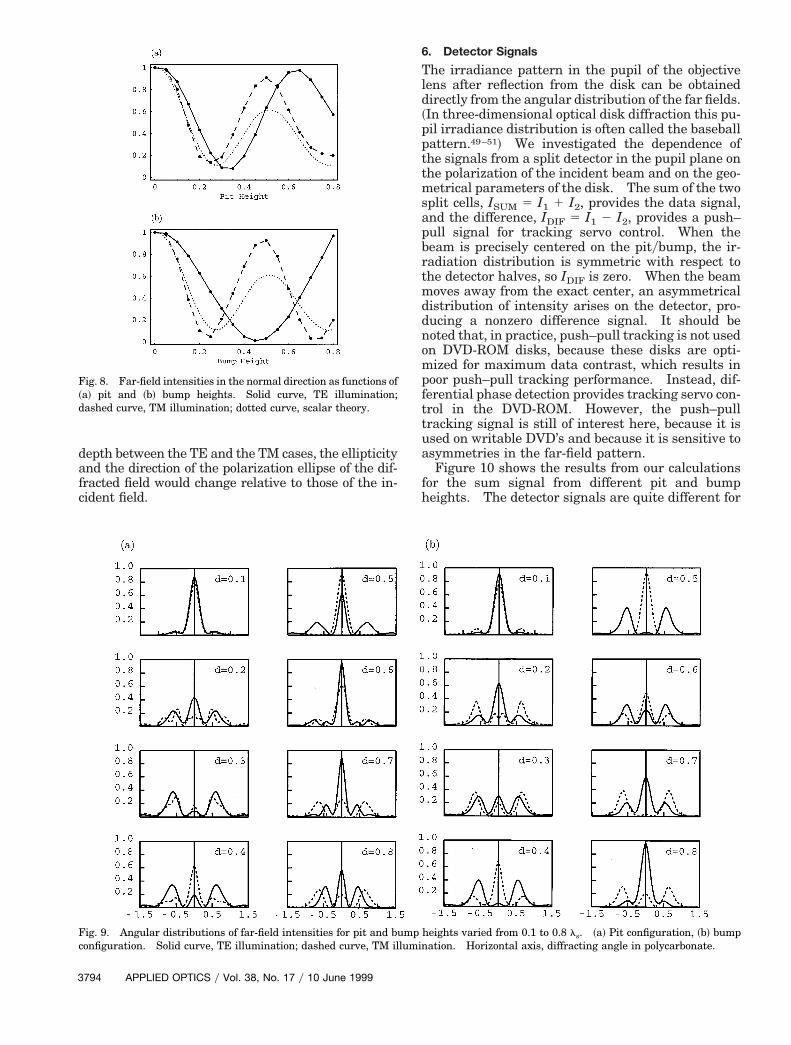
Figure 8 shows the far-field intensities in the nor-mal direction for the TE, TM, and scalar cases as afunction of pit and bump height. Both polarizationshave first minima around a pit height of 0.3 ls ~'240nm!, which is therefore the optimal height for maxi-mum contrast. The effective phase depth for TE po-larization is less than in scalar-diffraction theory,
Fig. 4. Near-field profile of the amplitude of the Ex component forTE illumination. The pit heights are varied between 0.1 and 0.8 ls.
Fig. 5. Near-field profile of the amplitude of the Ey component forTM illumination. The pit heights are varied between 0.1 and 0.8 ls.
T0
T0
whereas for TM polarization it is nearly the same asscalar theory. As the pit height becomes larger, thedeviation between the TE results and scalar theoryincreases. For the bump configuration the TM andthe scalar results remain similar to the pit configu-ration, but the TE case exhibits an even more signif-icant delay in phase depth. The significant phasedepth difference between the TE and the TM casescan be related to the near-field resonant modes.26,27
It is interesting to note that, for both pit and bumpconfigurations, the scalar-theory maximum that oc-curs at 0.5 ls is significantly smaller than the corre-sponding maximum for vector theory. Ourcalculations indicate that this difference is due to alarge contribution from evanescent waves in scalartheory at this height. This artifact is not present invector theory.
The angular distribution of the far fields is shownin Fig. 9. It should be noted that, when diffraction inthe normal direction is small, two strong sidebandpeaks contain most of the diffracted light intensity.
Fig. 6. Near-field profile of the amplitude of the Ex component forE illumination. The bump heights are varied between 0.1 and.8 ls.
Since there are five pits or bumps in our configurationand since the FWHM of the incident Gaussian beamis less than the distance between adjacent pits orbumps, the angular distributions are similar to thosefor an infinite grating. The deviation from the infi-nite grating case reflects the effect of the finite num-ber of pits or bumps in our configuration. We foundthat, when the focal point moves from the center toone side, this deviation becomes larger. Further-more, the TM case is more sensitive to the actualnumber of pits or bumps than the TE case, probablyowing to strong surface current effects. In Section 6we show that the difference signal is particularlysensitive to the finite number of pits or bumps.
In a usual DVD player the incident field is circularlypolarized. The results for the far-field intensity ofcircularly polarized illumination is approximately theaverage of the TE and the TM cases. Therefore, theintensity and the phase depth for circularly polarizedillumination is expected to be more similar to scalartheory. However, because of the difference of phase
Fig. 7. Near-field profile of the amplitude of the Ey component forM illumination. The bump heights are varied between 0.1 and.8 ls.
10 June 1999 y Vol. 38, No. 17 y APPLIED OPTICS 3793
3
depth between the TE and the TM cases, the ellipticityand the direction of the polarization ellipse of the dif-fracted field would change relative to those of the in-cident field.
Fig. 8. Far-field intensities in the normal direction as functions of~a! pit and ~b! bump heights. Solid curve, TE illumination;dashed curve, TM illumination; dotted curve, scalar theory.
Fig. 9. Angular distributions of far-field intensities for pit and buconfiguration. Solid curve, TE illumination; dashed curve, TM il
794 APPLIED OPTICS y Vol. 38, No. 17 y 10 June 1999
6. Detector Signals
The irradiance pattern in the pupil of the objectivelens after reflection from the disk can be obtaineddirectly from the angular distribution of the far fields.~In three-dimensional optical disk diffraction this pu-pil irradiance distribution is often called the baseballpattern.49–51! We investigated the dependence ofthe signals from a split detector in the pupil plane onthe polarization of the incident beam and on the geo-metrical parameters of the disk. The sum of the twosplit cells, ISUM 5 I1 1 I2, provides the data signal,and the difference, IDIF 5 I1 2 I2, provides a push–pull signal for tracking servo control. When thebeam is precisely centered on the pitybump, the ir-radiation distribution is symmetric with respect tothe detector halves, so IDIF is zero. When the beammoves away from the exact center, an asymmetricaldistribution of intensity arises on the detector, pro-ducing a nonzero difference signal. It should benoted that, in practice, push–pull tracking is not usedon DVD-ROM disks, because these disks are opti-mized for maximum data contrast, which results inpoor push–pull tracking performance. Instead, dif-ferential phase detection provides tracking servo con-trol in the DVD-ROM. However, the push–pulltracking signal is still of interest here, because it isused on writable DVD’s and because it is sensitive toasymmetries in the far-field pattern.
Figure 10 shows the results from our calculationsfor the sum signal from different pit and bumpheights. The detector signals are quite different for
heights varied from 0.1 to 0.8 ls. ~a! Pit configuration, ~b! bumpation. Horizontal axis, diffracting angle in polycarbonate.
mplumin
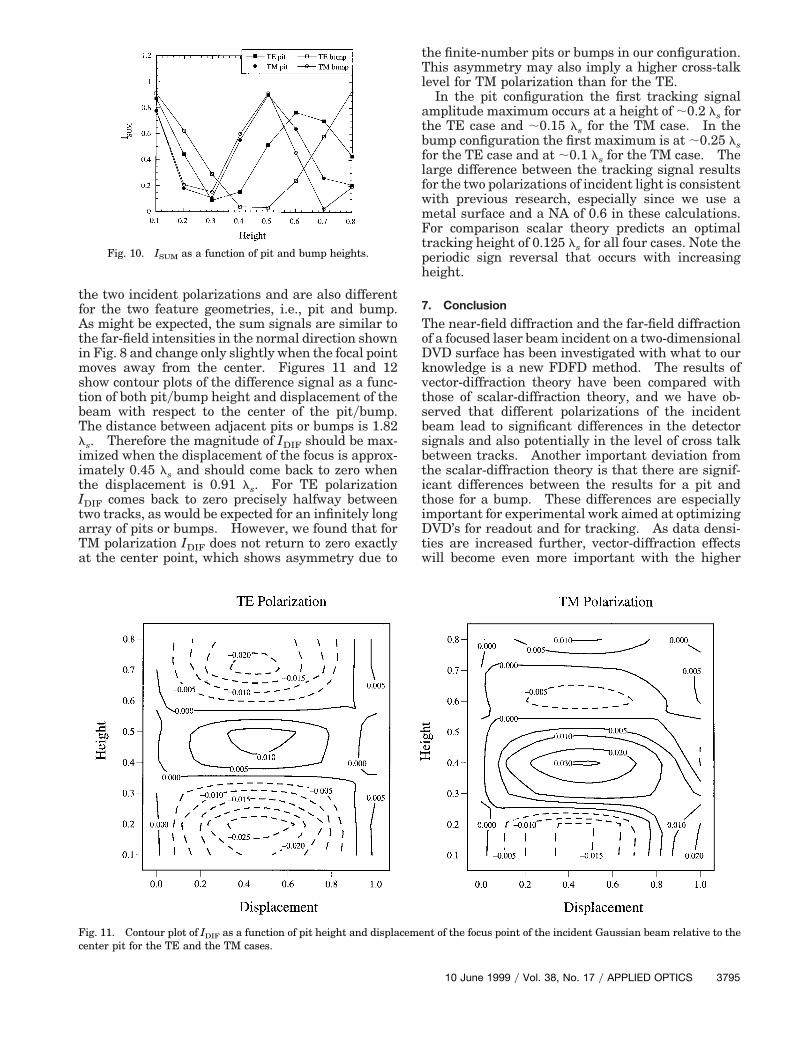
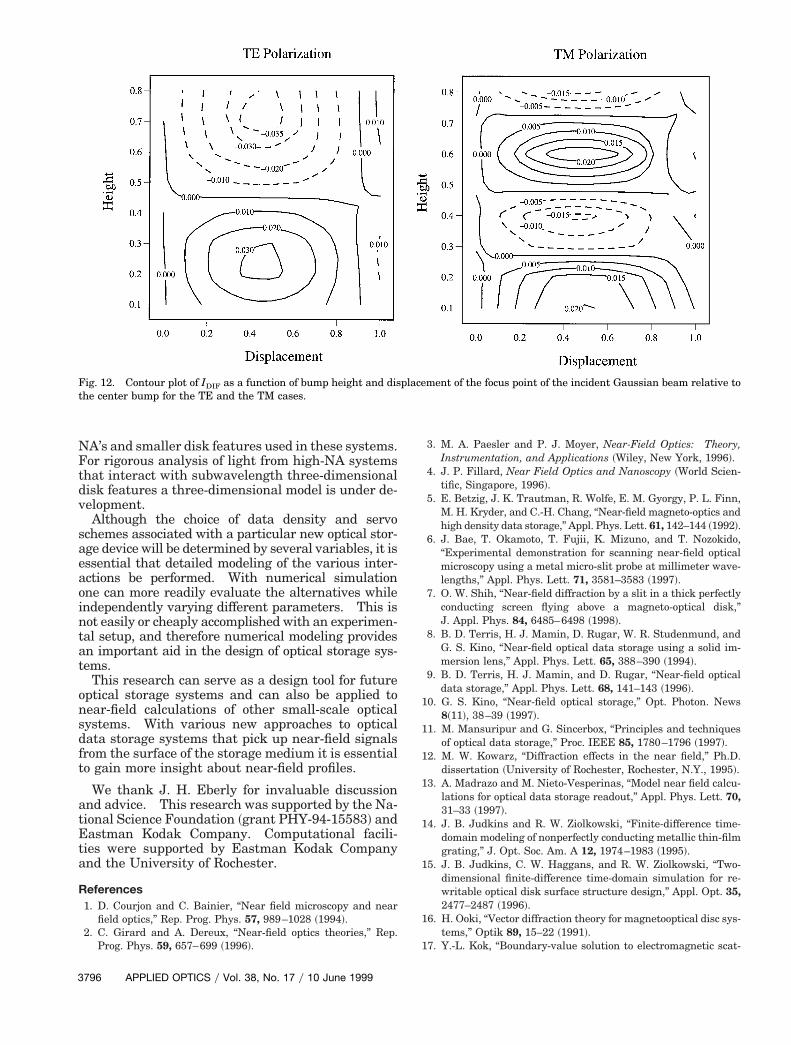
the two incident polarizations and are also differentfor the two feature geometries, i.e., pit and bump.As might be expected, the sum signals are similar tothe far-field intensities in the normal direction shownin Fig. 8 and change only slightly when the focal pointmoves away from the center. Figures 11 and 12show contour plots of the difference signal as a func-tion of both pitybump height and displacement of thebeam with respect to the center of the pitybump.The distance between adjacent pits or bumps is 1.82ls. Therefore the magnitude of IDIF should be max-imized when the displacement of the focus is approx-imately 0.45 ls and should come back to zero whenthe displacement is 0.91 ls. For TE polarizationIDIF comes back to zero precisely halfway betweentwo tracks, as would be expected for an infinitely longarray of pits or bumps. However, we found that forTM polarization IDIF does not return to zero exactlyat the center point, which shows asymmetry due to
Fig. 10. ISUM as a function of pit and bump heights.
Fig. 11. Contour plot of IDIF as a function of pit height and displacenter pit for the TE and the TM cases.
the finite-number pits or bumps in our configuration.This asymmetry may also imply a higher cross-talklevel for TM polarization than for the TE.
In the pit configuration the first tracking signalamplitude maximum occurs at a height of ;0.2 ls forthe TE case and ;0.15 ls for the TM case. In thebump configuration the first maximum is at ;0.25 lsfor the TE case and at ;0.1 ls for the TM case. Thelarge difference between the tracking signal resultsfor the two polarizations of incident light is consistentwith previous research, especially since we use ametal surface and a NA of 0.6 in these calculations.For comparison scalar theory predicts an optimaltracking height of 0.125 ls for all four cases. Note theperiodic sign reversal that occurs with increasingheight.
7. Conclusion
The near-field diffraction and the far-field diffractionof a focused laser beam incident on a two-dimensionalDVD surface has been investigated with what to ourknowledge is a new FDFD method. The results ofvector-diffraction theory have been compared withthose of scalar-diffraction theory, and we have ob-served that different polarizations of the incidentbeam lead to significant differences in the detectorsignals and also potentially in the level of cross talkbetween tracks. Another important deviation fromthe scalar-diffraction theory is that there are signif-icant differences between the results for a pit andthose for a bump. These differences are especiallyimportant for experimental work aimed at optimizingDVD’s for readout and for tracking. As data densi-ties are increased further, vector-diffraction effectswill become even more important with the higher
nt of the focus point of the incident Gaussian beam relative to the
ceme10 June 1999 y Vol. 38, No. 17 y APPLIED OPTICS 3795
3
NA’s and smaller disk features used in these systems.For rigorous analysis of light from high-NA systemsthat interact with subwavelength three-dimensionaldisk features a three-dimensional model is under de-velopment.
Although the choice of data density and servoschemes associated with a particular new optical stor-age device will be determined by several variables, it isessential that detailed modeling of the various inter-actions be performed. With numerical simulationone can more readily evaluate the alternatives whileindependently varying different parameters. This isnot easily or cheaply accomplished with an experimen-tal setup, and therefore numerical modeling providesan important aid in the design of optical storage sys-tems.
This research can serve as a design tool for futureoptical storage systems and can also be applied tonear-field calculations of other small-scale opticalsystems. With various new approaches to opticaldata storage systems that pick up near-field signalsfrom the surface of the storage medium it is essentialto gain more insight about near-field profiles.
We thank J. H. Eberly for invaluable discussionand advice. This research was supported by the Na-tional Science Foundation ~grant PHY-94-15583! andEastman Kodak Company. Computational facili-ties were supported by Eastman Kodak Companyand the University of Rochester.
References1. D. Courjon and C. Bainier, “Near field microscopy and near
field optics,” Rep. Prog. Phys. 57, 989–1028 ~1994!.2. C. Girard and A. Dereux, “Near-field optics theories,” Rep.
Prog. Phys. 59, 657–699 ~1996!.
Fig. 12. Contour plot of IDIF as a function of bump height and disthe center bump for the TE and the TM cases.
796 APPLIED OPTICS y Vol. 38, No. 17 y 10 June 1999
3. M. A. Paesler and P. J. Moyer, Near-Field Optics: Theory,Instrumentation, and Applications ~Wiley, New York, 1996!.
4. J. P. Fillard, Near Field Optics and Nanoscopy ~World Scien-tific, Singapore, 1996!.
5. E. Betzig, J. K. Trautman, R. Wolfe, E. M. Gyorgy, P. L. Finn,M. H. Kryder, and C.-H. Chang, “Near-field magneto-optics andhigh density data storage,” Appl. Phys. Lett. 61, 142–144 ~1992!.
6. J. Bae, T. Okamoto, T. Fujii, K. Mizuno, and T. Nozokido,“Experimental demonstration for scanning near-field opticalmicroscopy using a metal micro-slit probe at millimeter wave-lengths,” Appl. Phys. Lett. 71, 3581–3583 ~1997!.
7. O. W. Shih, “Near-field diffraction by a slit in a thick perfectlyconducting screen flying above a magneto-optical disk,”J. Appl. Phys. 84, 6485–6498 ~1998!.
8. B. D. Terris, H. J. Mamin, D. Rugar, W. R. Studenmund, andG. S. Kino, “Near-field optical data storage using a solid im-mersion lens,” Appl. Phys. Lett. 65, 388–390 ~1994!.
9. B. D. Terris, H. J. Mamin, and D. Rugar, “Near-field opticaldata storage,” Appl. Phys. Lett. 68, 141–143 ~1996!.
10. G. S. Kino, “Near-field optical storage,” Opt. Photon. News8~11!, 38–39 ~1997!.
11. M. Mansuripur and G. Sincerbox, “Principles and techniquesof optical data storage,” Proc. IEEE 85, 1780–1796 ~1997!.
12. M. W. Kowarz, “Diffraction effects in the near field,” Ph.D.dissertation ~University of Rochester, Rochester, N.Y., 1995!.
13. A. Madrazo and M. Nieto-Vesperinas, “Model near field calcu-lations for optical data storage readout,” Appl. Phys. Lett. 70,31–33 ~1997!.
14. J. B. Judkins and R. W. Ziolkowski, “Finite-difference time-domain modeling of nonperfectly conducting metallic thin-filmgrating,” J. Opt. Soc. Am. A 12, 1974–1983 ~1995!.
15. J. B. Judkins, C. W. Haggans, and R. W. Ziolkowski, “Two-dimensional finite-difference time-domain simulation for re-writable optical disk surface structure design,” Appl. Opt. 35,2477–2487 ~1996!.
16. H. Ooki, “Vector diffraction theory for magnetooptical disc sys-tems,” Optik 89, 15–22 ~1991!.
17. Y.-L. Kok, “Boundary-value solution to electromagnetic scat-
ment of the focus point of the incident Gaussian beam relative to
place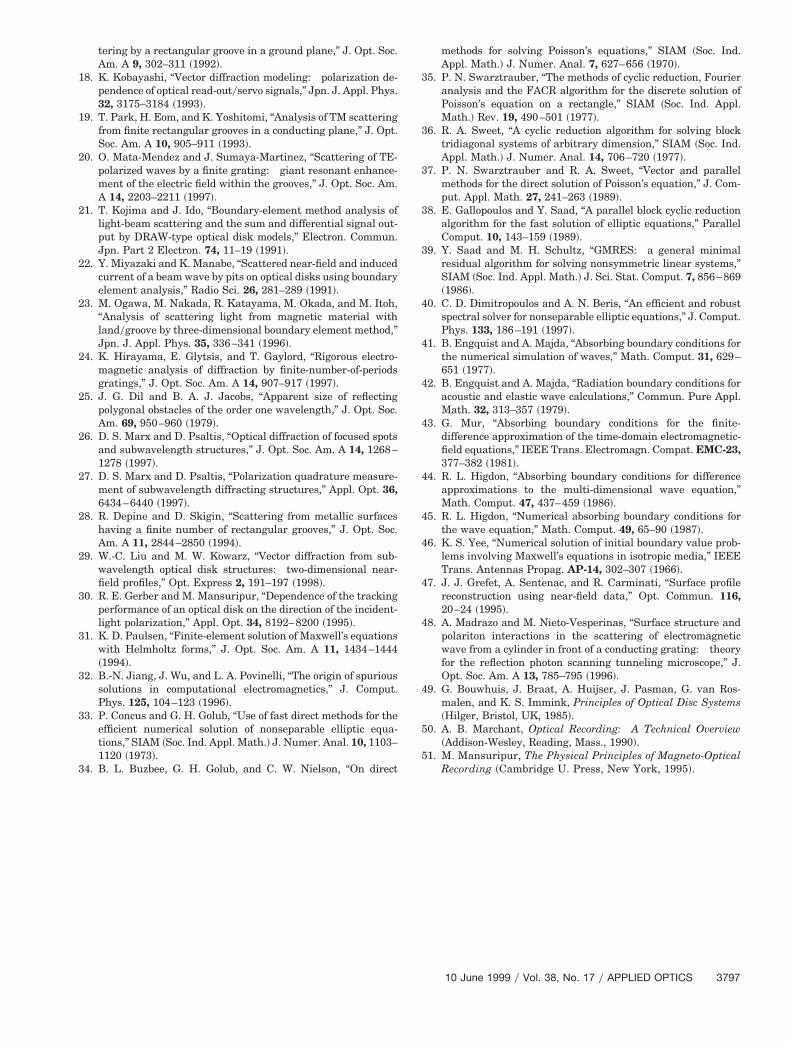
tering by a rectangular groove in a ground plane,” J. Opt. Soc. methods for solving Poisson’s equations,” SIAM ~Soc. Ind.
Am. A 9, 302–311 ~1992!.18. K. Kobayashi, “Vector diffraction modeling: polarization de-pendence of optical read-outyservo signals,” Jpn. J. Appl. Phys.32, 3175–3184 ~1993!.
19. T. Park, H. Eom, and K. Yoshitomi, “Analysis of TM scatteringfrom finite rectangular grooves in a conducting plane,” J. Opt.Soc. Am. A 10, 905–911 ~1993!.
20. O. Mata-Mendez and J. Sumaya-Martinez, “Scattering of TE-polarized waves by a finite grating: giant resonant enhance-ment of the electric field within the grooves,” J. Opt. Soc. Am.A 14, 2203–2211 ~1997!.
21. T. Kojima and J. Ido, “Boundary-element method analysis oflight-beam scattering and the sum and differential signal out-put by DRAW-type optical disk models,” Electron. Commun.Jpn. Part 2 Electron. 74, 11–19 ~1991!.
22. Y. Miyazaki and K. Manabe, “Scattered near-field and inducedcurrent of a beam wave by pits on optical disks using boundaryelement analysis,” Radio Sci. 26, 281–289 ~1991!.
23. M. Ogawa, M. Nakada, R. Katayama, M. Okada, and M. Itoh,“Analysis of scattering light from magnetic material withlandygroove by three-dimensional boundary element method,”Jpn. J. Appl. Phys. 35, 336–341 ~1996!.
24. K. Hirayama, E. Glytsis, and T. Gaylord, “Rigorous electro-magnetic analysis of diffraction by finite-number-of-periodsgratings,” J. Opt. Soc. Am. A 14, 907–917 ~1997!.
25. J. G. Dil and B. A. J. Jacobs, “Apparent size of reflectingpolygonal obstacles of the order one wavelength,” J. Opt. Soc.Am. 69, 950–960 ~1979!.
26. D. S. Marx and D. Psaltis, “Optical diffraction of focused spotsand subwavelength structures,” J. Opt. Soc. Am. A 14, 1268–1278 ~1997!.
27. D. S. Marx and D. Psaltis, “Polarization quadrature measure-ment of subwavelength diffracting structures,” Appl. Opt. 36,6434–6440 ~1997!.
28. R. Depine and D. Skigin, “Scattering from metallic surfaceshaving a finite number of rectangular grooves,” J. Opt. Soc.Am. A 11, 2844–2850 ~1994!.
29. W.-C. Liu and M. W. Kowarz, “Vector diffraction from sub-wavelength optical disk structures: two-dimensional near-field profiles,” Opt. Express 2, 191–197 ~1998!.
30. R. E. Gerber and M. Mansuripur, “Dependence of the trackingperformance of an optical disk on the direction of the incident-light polarization,” Appl. Opt. 34, 8192–8200 ~1995!.
31. K. D. Paulsen, “Finite-element solution of Maxwell’s equationswith Helmholtz forms,” J. Opt. Soc. Am. A 11, 1434–1444~1994!.
32. B.-N. Jiang, J. Wu, and L. A. Povinelli, “The origin of spurioussolutions in computational electromagnetics,” J. Comput.Phys. 125, 104–123 ~1996!.
33. P. Concus and G. H. Golub, “Use of fast direct methods for theefficient numerical solution of nonseparable elliptic equa-tions,” SIAM ~Soc. Ind. Appl. Math.! J. Numer. Anal. 10, 1103–1120 ~1973!.
34. B. L. Buzbee, G. H. Golub, and C. W. Nielson, “On direct
Appl. Math.! J. Numer. Anal. 7, 627–656 ~1970!.35. P. N. Swarztrauber, “The methods of cyclic reduction, Fourier
analysis and the FACR algorithm for the discrete solution ofPoisson’s equation on a rectangle,” SIAM ~Soc. Ind. Appl.Math.! Rev. 19, 490–501 ~1977!.
36. R. A. Sweet, “A cyclic reduction algorithm for solving blocktridiagonal systems of arbitrary dimension,” SIAM ~Soc. Ind.Appl. Math.! J. Numer. Anal. 14, 706–720 ~1977!.
37. P. N. Swarztrauber and R. A. Sweet, “Vector and parallelmethods for the direct solution of Poisson’s equation,” J. Com-put. Appl. Math. 27, 241–263 ~1989!.
38. E. Gallopoulos and Y. Saad, “A parallel block cyclic reductionalgorithm for the fast solution of elliptic equations,” ParallelComput. 10, 143–159 ~1989!.
39. Y. Saad and M. H. Schultz, “GMRES: a general minimalresidual algorithm for solving nonsymmetric linear systems,”SIAM ~Soc. Ind. Appl. Math.! J. Sci. Stat. Comput. 7, 856–869~1986!.
40. C. D. Dimitropoulos and A. N. Beris, “An efficient and robustspectral solver for nonseparable elliptic equations,” J. Comput.Phys. 133, 186–191 ~1997!.
41. B. Engquist and A. Majda, “Absorbing boundary conditions forthe numerical simulation of waves,” Math. Comput. 31, 629–651 ~1977!.
42. B. Engquist and A. Majda, “Radiation boundary conditions foracoustic and elastic wave calculations,” Commun. Pure Appl.Math. 32, 313–357 ~1979!.
43. G. Mur, “Absorbing boundary conditions for the finite-difference approximation of the time-domain electromagnetic-field equations,” IEEE Trans. Electromagn. Compat. EMC-23,377–382 ~1981!.
44. R. L. Higdon, “Absorbing boundary conditions for differenceapproximations to the multi-dimensional wave equation,”Math. Comput. 47, 437–459 ~1986!.
45. R. L. Higdon, “Numerical absorbing boundary conditions forthe wave equation,” Math. Comput. 49, 65–90 ~1987!.
46. K. S. Yee, “Numerical solution of initial boundary value prob-lems involving Maxwell’s equations in isotropic media,” IEEETrans. Antennas Propag. AP-14, 302–307 ~1966!.
47. J. J. Grefet, A. Sentenac, and R. Carminati, “Surface profilereconstruction using near-field data,” Opt. Commun. 116,20–24 ~1995!.
48. A. Madrazo and M. Nieto-Vesperinas, “Surface structure andpolariton interactions in the scattering of electromagneticwave from a cylinder in front of a conducting grating: theoryfor the reflection photon scanning tunneling microscope,” J.Opt. Soc. Am. A 13, 785–795 ~1996!.
49. G. Bouwhuis, J. Braat, A. Huijser, J. Pasman, G. van Ros-malen, and K. S. Immink, Principles of Optical Disc Systems~Hilger, Bristol, UK, 1985!.
50. A. B. Marchant, Optical Recording: A Technical Overview~Addison-Wesley, Reading, Mass., 1990!.
51. M. Mansuripur, The Physical Principles of Magneto-OpticalRecording ~Cambridge U. Press, New York, 1995!.
10 June 1999 y Vol. 38, No. 17 y APPLIED OPTICS 3797


