Embed Size (px)
Citation preview
[Abdullah, 2(6): June, 2013] ISSN: 2277-9655
http: // www.ijesrt.com (C) International Journal of Engineering Sciences & Research Technology [1514-1523]
IJESRT INTERNATIONAL JOURNAL OF ENGINEERING SCIENCES & RESEARCH
TECHNOLOGY Vehicular Trip Generation Modelling in Maiduguri Me tropolis
I Abdullah *1, U Tsoho2, A. Saminu3, H Garba4 *1,2 Department of civil Engineering, Nigerian Defence Academy, Kaduna
[email protected] Abstract
The purpose of the trip and modeling process is to identify those meaningful determinants of trip making behavior, and express their effect in mathematical way so that they can be used with confidence as a predictive tool. In the case of this study, data was collected through questionnaires to the various household in the study area. Two zones, namely-: State low-cost and Moduganari in Maiduguri Metropolitan Council. Thirty (30) households were interviewed in the state low-cost. Thereby extending the result collected over the whole houses in the study area. Similarly in the other zone seventeen (17) houses were considered later on it extended to the whole area. In state low-cost zone (2424) number of person trips per day was estimated, In Moduganari (4027) number of person trips per day was estimated. Of the various models of trip generation model, regression analysis was adapted for this work. Introduction Transportation has a very important role to play in general development of the country and especially in its economic development. It has been described as the vein and arterial for the flow of the economy of the Nation. In a developing country like Nigeria the goal of industrial development can be achieved through an efficient transportation system. Our social, cultural and political institutions can be built up and life of the people in general can be enriched through efficient transportation systems. Maiduguri being the capital state of Borno located within the northern part of the country and is presently witnessing rapid growth in population, economic activity, vehicular ownership and hence rapid traffic growth. Increasing urbanization gives rise to vexing problems of congestion. If metropolitan areas are to grow and prosper, it will be imperative to plan and build vast new facilities for public and private transport. These, as well as existing resources must be operated, so as to provide the largest possible free flow of traffic. But if a reasonable level of amenity is to be maintained, the added facilities must be planned to make a sparing, efficient use of land, convenient to uses, and to make a positive esthetic contribution to the environment. Transportation facilities are the basic requirement for community growth and development. With the huge capital investment required to finance urban projects of all kinds, the consequences of not planning have became more acute than ever, successful solutions to the complex mobility problems confronting urban areas throughout the nation require the full energies and imagination of many professionals, but
particularly of the traffic engineer. Transportation in general and particularly highway transport play an essential role in the life of any communication today. Good highways transport facilities are the result of sound planning. It is now being recognized that transport planning cannot be and must not be isolated from land use planning. Also when planning for the future, account must be taken for the vehicles in which people wish to travel and move their goods. In recent years, planners have developed methodologies for estimating the distribution of future traffic over an entire transportation network. These procedures have been used for both urban and statewide. Systems, involve the use of computer simulation programme comprised typically of five types of models:
1. Land use 2. Trip distribution 3. Trip generation 4. Traffic assignment 5. Model split The models are mathematical equations and
procedures that collectively relate travel patterns to land use, demographic characteristics, and parameters of the transportation system. The models are developed and “calibrated” for a given study area so as to reproduce existing travel patterns as determined from actual count. Assuming the basic relationships between travel, land use, and socio-economic characterics remain constant over time, planners use the models to evaluate future alternative land use and transportation system (Pignataro L, J 1973). Among the five models mentioned above, the trip generation model will be used for these analalysis of result.
[Abdullah, 2(6): June, 2013] ISSN: 2277-9655
http: // www.ijesrt.com (C) International Journal of Engineering Sciences & Research Technology [1514-1523]
Trip Genereation Models Trip generation models are concerned with
the estimation of the number of trips into and out of various traffic zones. This is based on the principle that land use generate trips, and that the number and type of “from home” trip is influenced by socio-economic variables such as car ownership or availability, house-hold income and size, occupational status, household composition e.g. no of workers per household. As may be gathered from the above, the number of variables considered to exert a casual effect on trip generation can be very great (Hobs F, D 1973).The traffic analyst has a choice of these methods of developing trip and models:
1) REGRESSION ANALYSIS METHOD 2) CATEGORY ANALYSIS METHOD 3) EXPANSION FACTOR METHOD
Aim and Objectives of the Study The aim and objectives of the study is divided into the following phases:
1) Inventories of the main traffic facilities, public transport services, present and future land uses, and appropriate population and economic data.
2) The determination of the existing interzonal travel pattern, and the factors which control them.
3) The determination of the manner in which the travel growth characteristics of individual zones interact and affect future travel distributions between zones.
Scope of the Project The scope of the project is to carry out a
survey of vehicular trip, household, in some selected areas in Maiduguri metropolis, taking into considerations of the attracted areas such as commercial centers. A questioner was sent to the selected areas so that all the information required is filled up appropriately. The information is then used to generate trip produced by using some mathematical relationship. Limitation of Work The work is limited to Maiduguri metropolis for interzonal trips. Methodology Data Collection And Analysis
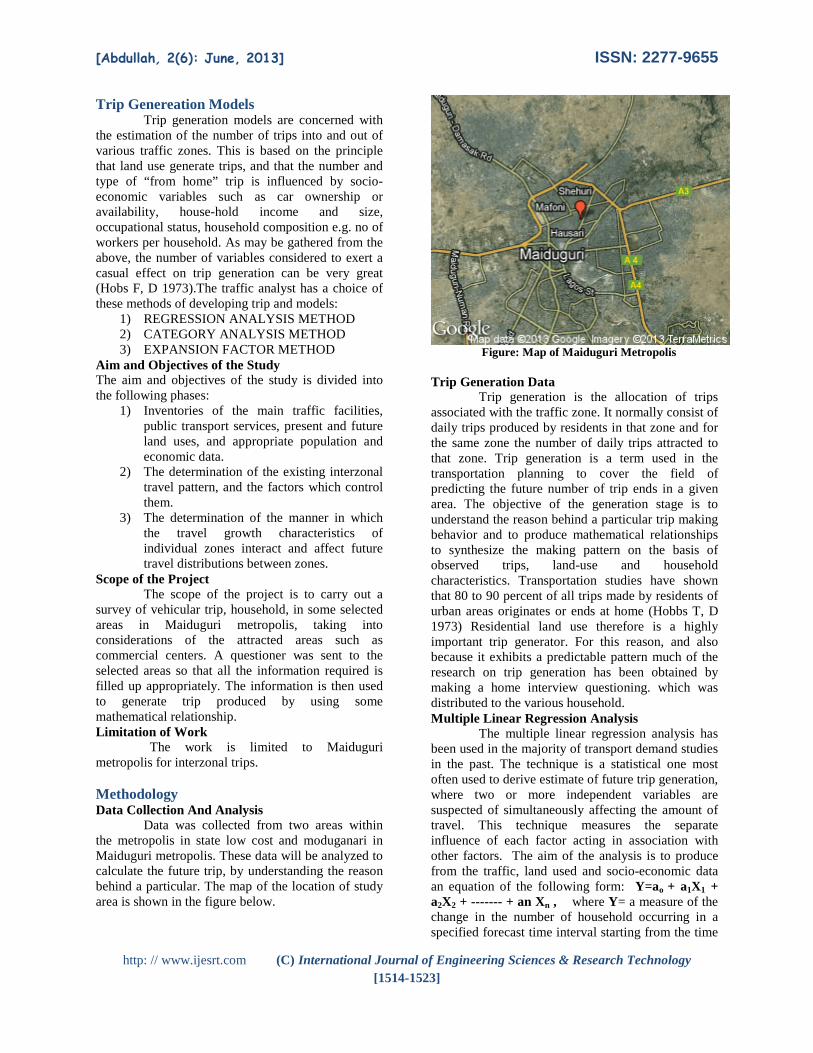
Data was collected from two areas within the metropolis in state low cost and moduganari in Maiduguri metropolis. These data will be analyzed to calculate the future trip, by understanding the reason behind a particular. The map of the location of study area is shown in the figure below.
Figure: Map of Maiduguri Metropolis Trip Generation Data
Trip generation is the allocation of trips associated with the traffic zone. It normally consist of daily trips produced by residents in that zone and for the same zone the number of daily trips attracted to that zone. Trip generation is a term used in the transportation planning to cover the field of predicting the future number of trip ends in a given area. The objective of the generation stage is to understand the reason behind a particular trip making behavior and to produce mathematical relationships to synthesize the making pattern on the basis of observed trips, land-use and household characteristics. Transportation studies have shown that 80 to 90 percent of all trips made by residents of urban areas originates or ends at home (Hobbs T, D 1973) Residential land use therefore is a highly important trip generator. For this reason, and also because it exhibits a predictable pattern much of the research on trip generation has been obtained by making a home interview questioning. which was distributed to the various household. Multiple Linear Regression Analysis
The multiple linear regression analysis has been used in the majority of transport demand studies in the past. The technique is a statistical one most often used to derive estimate of future trip generation, where two or more independent variables are suspected of simultaneously affecting the amount of travel. This technique measures the separate influence of each factor acting in association with other factors. The aim of the analysis is to produce from the traffic, land used and socio-economic data an equation of the following form: Y=ao + a1X1 + a2X2 + ------- + an Xn , where Y= a measure of the change in the number of household occurring in a specified forecast time interval starting from the time
[Abdullah, 2(6): June, 2013] ISSN: 2277-9655
http: // www.ijesrt.com (C) International Journal of Engineering Sciences & Research Technology [1514-1523]
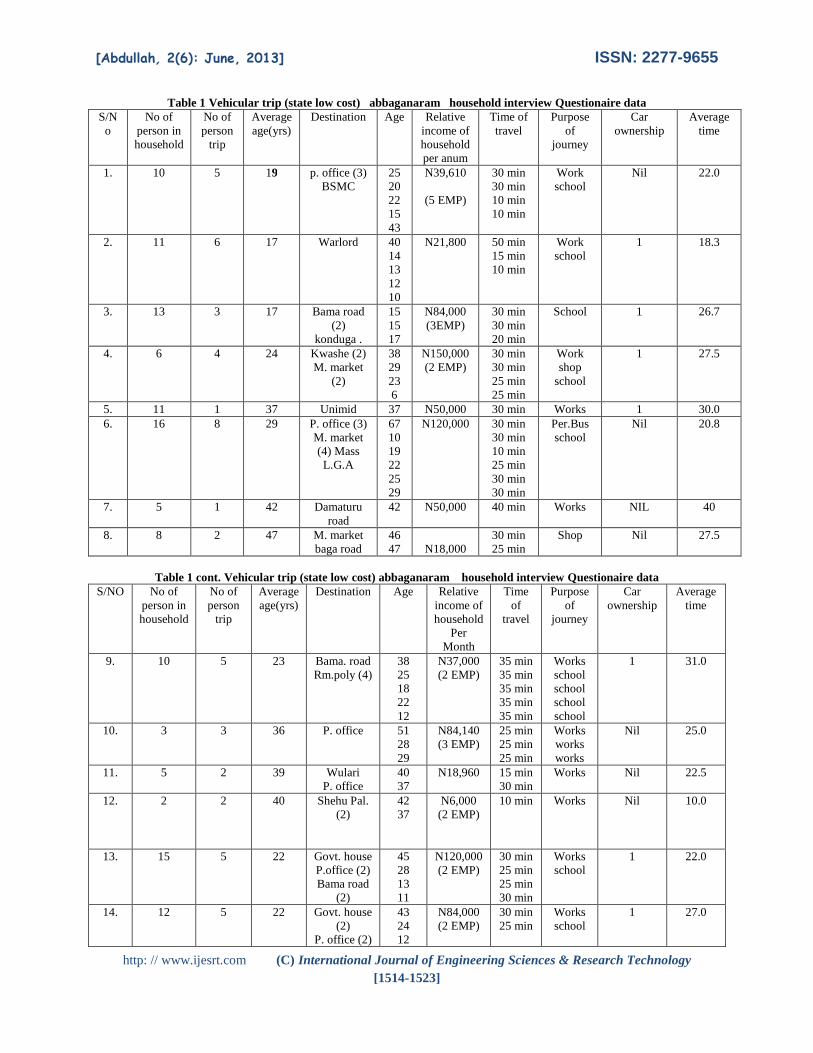
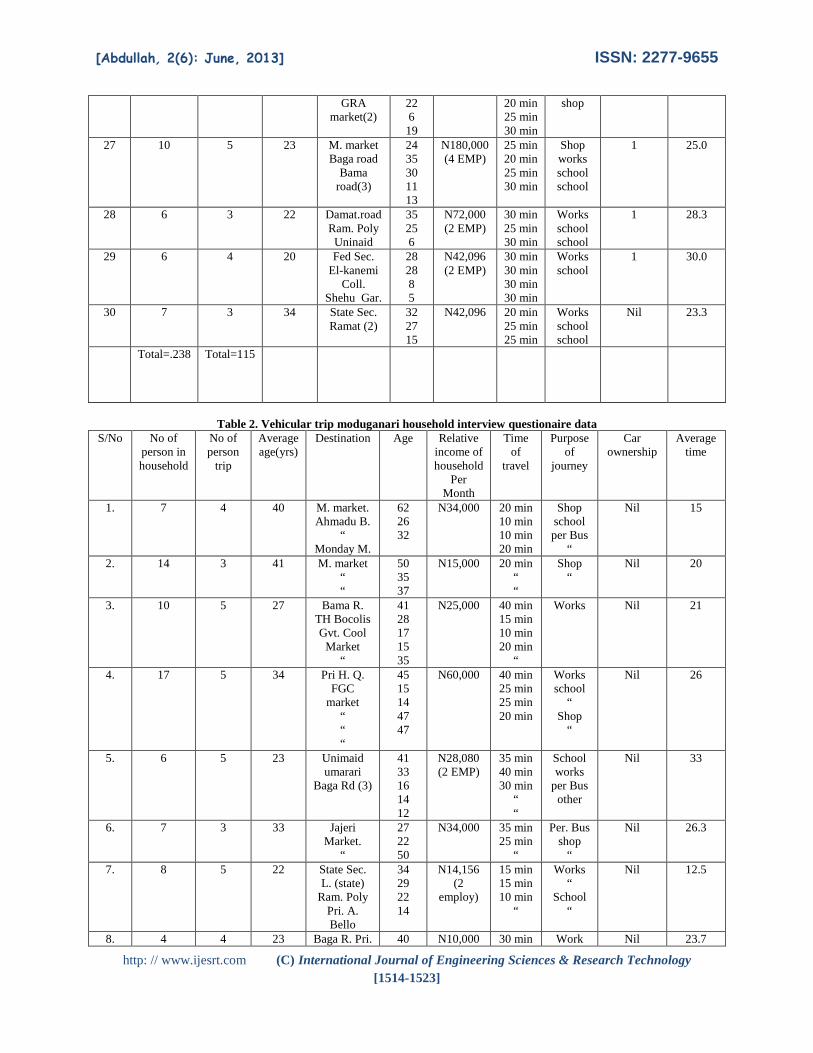
for which the latest data are available.X1, X2------Xn = independent variables, a0, a1, a2, -----an = regression coefficients In a typical regression analysis, the given data relates the present day values of the dependent variables (Y) and the independent variables (X----Xn) for all zones of the area under study(Salter 1974). The equation thus developed is used for determining the future value of trip knowing the estimated future values of the independent variables. By considering the data collected in the two zones of study, the dependent variables and independent variable are related to one another in order to obtain the regression analysis equation. The observed data in table 1 and 2 were use in MINI TABR14 for the regression analysis equation. From fig. in table 1 the dependent variables Y is defined as Y1, which is the total trip generated at a house in a day. The independent variables are: NP1 = No. of person in household, AA1 = Average Age, IN1 = Total income of the house hold and AT1 =Total time in minute, similarly same technique is applied to the second zone. The depended variable Y in Table 2 is defined as: Y2 = total trip generated at house in a day, NP2 = No. of person in house hold, AA2 = Average Age, IN2 = Total income of the house hold and AT2 = Total time in minute. Assumptions in Multiple Linear Regression
The regression analysis is based on the following important assumptions:
I. All the variables are independent of each others:
II. All the variables are normally distributed III. All variables are continuous IV. A linear relationship exists between the
dependent variable and the independent variables
V. Influence of independent variables is additive, is the inclusion of each variable in the equation contributes a district portion of the trip numbers. It is however, difficult to ensure that the
basic assumptions are satisfied in most of the trip generation studies. The so called independent variables in the regression equation are not truly independent of each other, and some sort of correlation normally exists among them. The Likely Sources of Error May Be
a) Errors in the determination of the existing values of the independent variables owing to inaccuracy or bias in the transportation survey.
b) Errors in the determination of the existing values of the dependent variables, also as a result of in accuracy or bias in the transportation survey. Although this may be
detected and corrected by adequate screen line checks.
c) Errors in the regression obtained owing to the scatter of the individual values and the inadequacy of data.
d) Difficulties in the prediction of future values of independent variables for the future estimate of the independent variables. If all the factors influencing the pattern of
movement areas were correctly identified, then it might be expected that trip generation equations obtained in one survey would be applicable to other survey in a giving environment. Analysis of Result The Multiple Regression Analysis Method
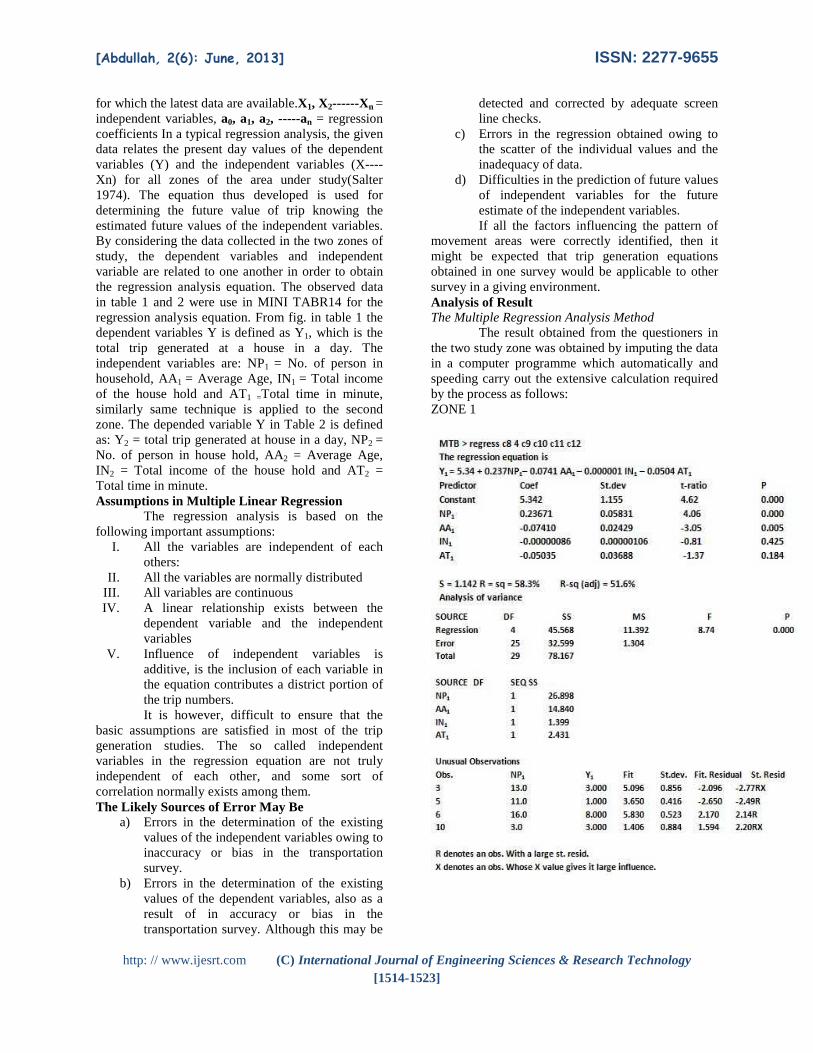
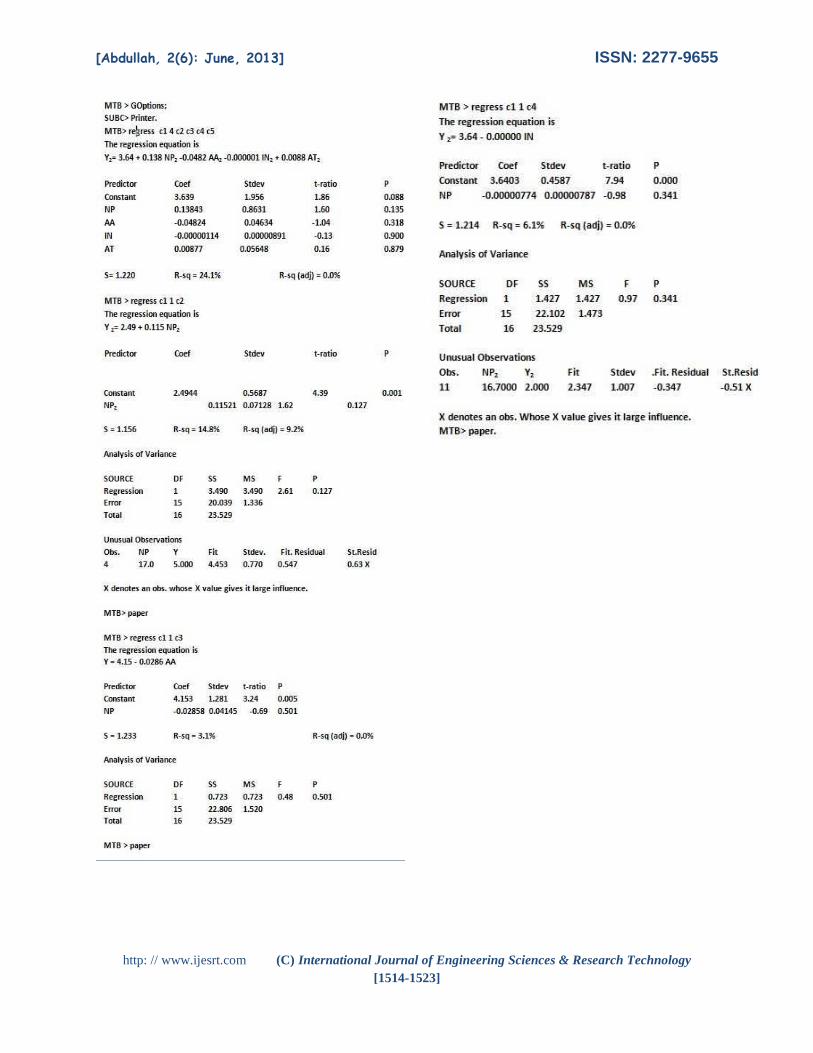
The result obtained from the questioners in the two study zone was obtained by imputing the data in a computer programme which automatically and speeding carry out the extensive calculation required by the process as follows: ZONE 1
[Abdullah, 2(6): June, 2013] ISSN: 2277-9655
http: // www.ijesrt.com (C) International Journal of Engineering Sciences & Research Technology [1514-1523]
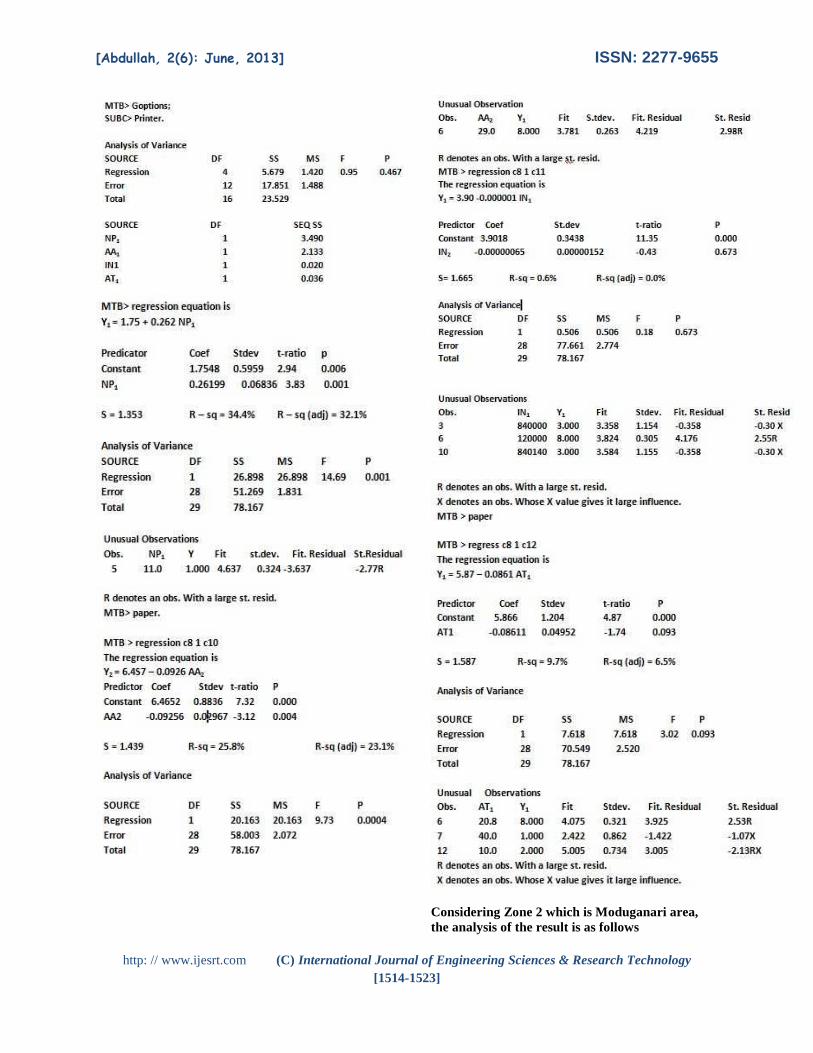
Considering Zone 2 which is Moduganari area, the analysis of the result is as follows
[Abdullah, 2(6): June, 2013] ISSN: 2277-9655
http: // www.ijesrt.com (C) International Journal of Engineering Sciences & Research Technology [1514-1523]
[Abdullah, 2(6): June, 2013] ISSN: 2277-9655
http: // www.ijesrt.com (C) International Journal of Engineering Sciences & Research Technology [1514-1523]
Table 1 Vehicular trip (state low cost) abbaganaram household interview Questionaire data S/No
No of person in household
No of person
trip
Average age(yrs)
Destination Age Relative income of household per anum
Time of travel
Purpose of
journey
Car ownership
Average time
1. 10 5 19 p. office (3) BSMC
25 20 22 15 43
N39,610
(5 EMP)
30 min 30 min 10 min 10 min
Work school
Nil 22.0
2. 11 6 17 Warlord 40 14 13 12 10
N21,800 50 min 15 min 10 min
Work school
1 18.3
3. 13 3 17 Bama road (2)
konduga .
15 15 17
N84,000 (3EMP)
30 min 30 min 20 min
School 1 26.7
4. 6 4 24 Kwashe (2) M. market
(2)
38 29 23 6
N150,000 (2 EMP)
30 min 30 min 25 min 25 min
Work shop
school
1 27.5
5. 11 1 37 Unimid 37 N50,000 30 min Works 1 30.0 6. 16 8 29 P. office (3)
M. market (4) Mass L.G.A
67 10 19 22 25 29
N120,000 30 min 30 min 10 min 25 min 30 min 30 min
Per.Bus school
Nil 20.8
7. 5 1 42 Damaturu road
42 N50,000 40 min Works NIL 40
8. 8 2 47 M. market baga road
46 47
N18,000
30 min 25 min
Shop Nil 27.5
Table 1 cont. Vehicular trip (state low cost) abbaganaram household interview Questionaire data
S/NO No of person in household
No of person
trip
Average age(yrs)
Destination Age Relative income of household
Per Month
Time of
travel
Purpose of
journey
Car ownership
Average time
9. 10 5 23 Bama. road Rm.poly (4)
38 25 18 22 12
N37,000 (2 EMP)
35 min 35 min 35 min 35 min 35 min
Works school school school school
1 31.0
10. 3 3 36 P. office 51 28 29
N84,140 (3 EMP)
25 min 25 min 25 min
Works works works
Nil 25.0
11. 5 2 39 Wulari P. office
40 37
N18,960 15 min 30 min
Works Nil 22.5
12. 2 2 40 Shehu Pal. (2)
42 37
N6,000 (2 EMP)
10 min Works Nil 10.0
13. 15 5 22 Govt. house P.office (2) Bama road
(2)
45 28 13 11
N120,000 (2 EMP)
30 min 25 min 25 min 30 min
Works school
1 22.0
14. 12 5 22 Govt. house (2)
P. office (2)
43 24 12
N84,000 (2 EMP)
30 min 25 min
Works school
1 27.0
[Abdullah, 2(6): June, 2013] ISSN: 2277-9655
http: // www.ijesrt.com (C) International Journal of Engineering Sciences & Research Technology [1514-1523]
7 15. 5 2 30 Custom (1)
P. office 19 40
N30,000 10 min 30 min
Works 1 20.0
16. 8 2 17 El-kanem 43 14 12 9 7
N30,000
15 min
Work school
Nil 15.0
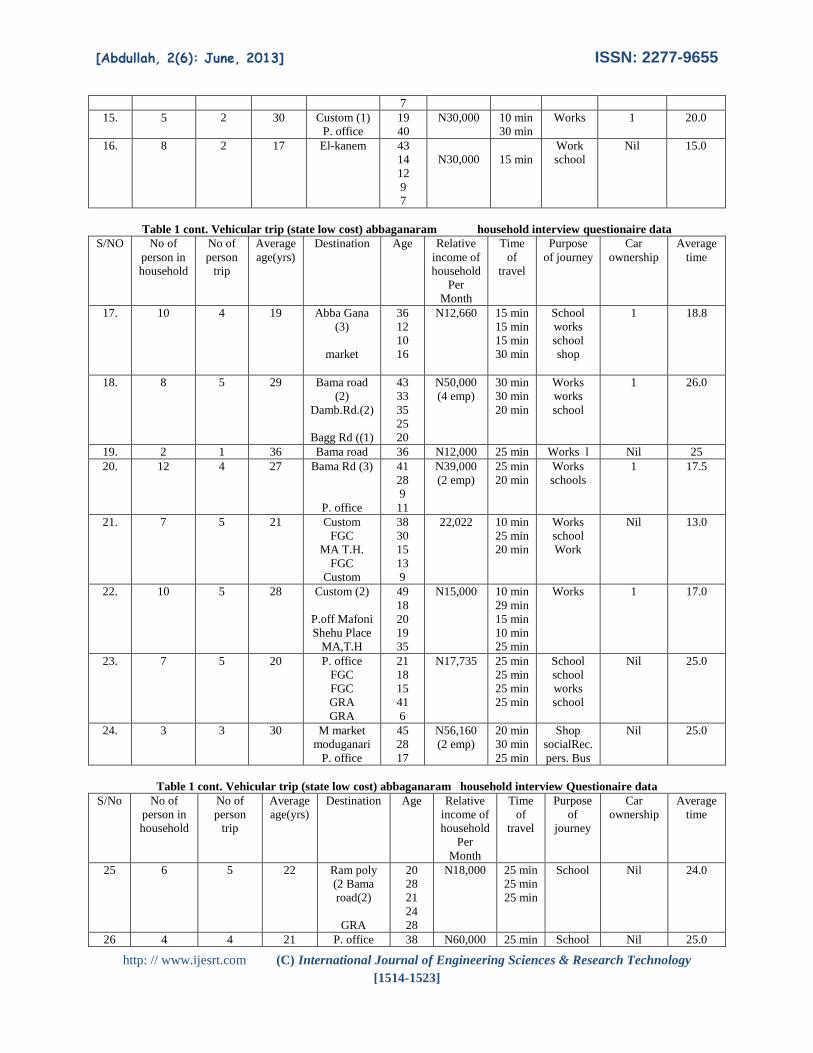
Table 1 cont. Vehicular trip (state low cost) abbaganaram household interview questionaire data
S/NO No of person in household
No of person
trip
Average age(yrs)
Destination Age Relative income of household
Per Month
Time of
travel
Purpose of journey
Car ownership
Average time
17. 10 4 19 Abba Gana (3)
market
36 12 10 16
N12,660 15 min 15 min 15 min 30 min
School works school shop
1 18.8
18. 8 5 29 Bama road (2)
Damb.Rd.(2)
Bagg Rd ((1)
43 33 35 25 20
N50,000 (4 emp)
30 min 30 min 20 min
Works works school
1 26.0
19. 2 1 36 Bama road 36 N12,000 25 min Works l Nil 25 20. 12 4 27 Bama Rd (3)
P. office
41 28 9 11
N39,000 (2 emp)
25 min 20 min
Works schools
1 17.5
21. 7 5 21 Custom FGC
MA T.H. FGC
Custom
38 30 15 13 9
22,022 10 min 25 min 20 min
Works school Work
Nil 13.0
22. 10 5 28 Custom (2)
P.off Mafoni Shehu Place
MA,T.H
49 18 20 19 35
N15,000 10 min 29 min 15 min 10 min 25 min
Works 1 17.0
23. 7 5 20 P. office FGC FGC GRA GRA
21 18 15 41 6
N17,735 25 min 25 min 25 min 25 min
School school works school
Nil 25.0
24. 3 3 30 M market moduganari
P. office
45 28 17
N56,160 (2 emp)
20 min 30 min 25 min
Shop socialRec. pers. Bus
Nil 25.0
Table 1 cont. Vehicular trip (state low cost) abbaganaram household interview Questionaire data
S/No No of person in household
No of person
trip
Average age(yrs)
Destination Age Relative income of household
Per Month
Time of
travel
Purpose of
journey
Car ownership
Average time
25 6 5 22 Ram poly (2 Bama road(2)
GRA
20 28 21 24 28
N18,000 25 min 25 min 25 min
School Nil 24.0
26 4 4 21 P. office 38 N60,000 25 min School Nil 25.0
[Abdullah, 2(6): June, 2013] ISSN: 2277-9655
http: // www.ijesrt.com (C) International Journal of Engineering Sciences & Research Technology [1514-1523]
GRA market(2)
22 6 19
20 min 25 min 30 min
shop
27 10 5 23 M. market Baga road
Bama road(3)
24 35 30 11 13
N180,000 (4 EMP)
25 min 20 min 25 min 30 min
Shop works school school
1 25.0
28 6 3 22 Damat.road Ram. Poly Uninaid
35 25 6
N72,000 (2 EMP)
30 min 25 min 30 min
Works school school
1 28.3
29 6 4 20 Fed Sec. El-kanemi
Coll. Shehu Gar.
28 28 8 5
N42,096 (2 EMP)
30 min 30 min 30 min 30 min
Works school
1 30.0
30 7 3 34 State Sec. Ramat (2)
32 27 15
N42,096 20 min 25 min 25 min
Works school school
Nil 23.3
Total=.238 Total=115
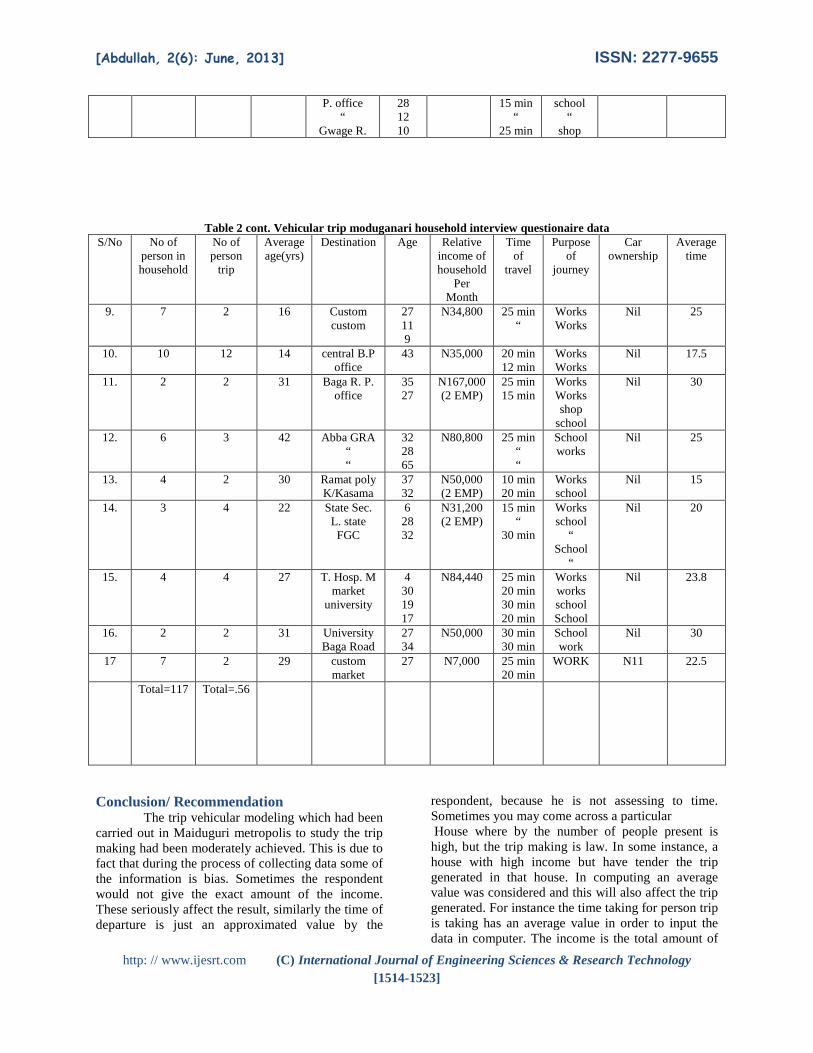
Table 2. Vehicular trip moduganari household interview questionaire data
S/No No of person in household
No of person
trip
Average age(yrs)
Destination Age Relative income of household
Per Month
Time of
travel
Purpose of
journey
Car ownership
Average time
1. 7 4 40 M. market. Ahmadu B.
“ Monday M.
62 26 32
N34,000 20 min 10 min 10 min 20 min
Shop school per Bus
“
Nil 15
2. 14 3 41 M. market “ “
50 35 37
N15,000 20 min “ “
Shop “
Nil 20
3. 10 5 27 Bama R. TH Bocolis Gvt. Cool Market
“
41 28 17 15 35
N25,000 40 min 15 min 10 min 20 min
“
Works Nil 21
4. 17 5 34 Pri H. Q. FGC
market “ “ “
45 15 14 47 47
N60,000 40 min 25 min 25 min 20 min
Works school
“ Shop
“
Nil 26
5. 6 5 23 Unimaid umarari
Baga Rd (3)
41 33 16 14 12
N28,080 (2 EMP)
35 min 40 min 30 min
“ “
School works
per Bus other
Nil 33
6. 7 3 33 Jajeri Market.
“
27 22 50
N34,000 35 min 25 min
“
Per. Bus shop
“
Nil 26.3
7. 8 5 22 State Sec. L. (state)
Ram. Poly Pri. A. Bello
34 29 22 14
N14,156 (2
employ)
15 min 15 min 10 min
“
Works “
School “
Nil 12.5
8. 4 4 23 Baga R. Pri. 40 N10,000 30 min Work Nil 23.7
[Abdullah, 2(6): June, 2013] ISSN: 2277-9655
http: // www.ijesrt.com (C) International Journal of Engineering Sciences & Research Technology [1514-1523]
P. office “
Gwage R.
28 12 10
15 min “
25 min
school “
shop
Table 2 cont. Vehicular trip moduganari household interview questionaire data S/No No of
person in household
No of person
trip
Average age(yrs)
Destination Age Relative income of household
Per Month
Time of
travel
Purpose of
journey
Car ownership
Average time
9. 7 2 16 Custom custom
27 11 9
N34,800 25 min “
Works Works
Nil 25
10. 10 12 14 central B.P office
43
N35,000 20 min 12 min
Works Works
Nil 17.5
11. 2 2 31 Baga R. P. office
35 27
N167,000 (2 EMP)
25 min 15 min
Works Works shop
school
Nil 30
12. 6 3 42 Abba GRA “ “
32 28 65
N80,800 25 min “ “
School works
Nil 25
13. 4 2 30 Ramat poly K/Kasama
37 32
N50,000 (2 EMP)
10 min 20 min
Works school
Nil 15
14. 3 4 22 State Sec. L. state FGC
6 28 32
N31,200 (2 EMP)
15 min “
30 min
Works school
“ School
“
Nil 20
15. 4 4 27 T. Hosp. M market
university
4 30 19 17
N84,440 25 min 20 min 30 min 20 min
Works works school School
Nil 23.8
16. 2 2 31 University Baga Road
27 34
N50,000 30 min 30 min
School work
Nil 30
17 7 2 29 custom market
27 N7,000 25 min 20 min
WORK N11 22.5
Total=117 Total=.56
Conclusion/ Recommendation
The trip vehicular modeling which had been carried out in Maiduguri metropolis to study the trip making had been moderately achieved. This is due to fact that during the process of collecting data some of the information is bias. Sometimes the respondent would not give the exact amount of the income. These seriously affect the result, similarly the time of departure is just an approximated value by the
respondent, because he is not assessing to time. Sometimes you may come across a particular House where by the number of people present is high, but the trip making is law. In some instance, a house with high income but have tender the trip generated in that house. In computing an average value was considered and this will also affect the trip generated. For instance the time taking for person trip is taking has an average value in order to input the data in computer. The income is the total amount of
[Abdullah, 2(6): June, 2013] ISSN: 2277-9655
http: // www.ijesrt.com (C) International Journal of Engineering Sciences & Research Technology [1514-1523]
all the workers in that particular house which is input in the computer as the variable dependent of the trip. With all this reasons together with problem of fuel scarcity affect the result obtained by the regression. In state low cost the regression is Y1 = 5.34 + 0.237NP1– 0.0741 AA1 – 0.000001 IN1 – 0.0504 AT1 and the regression square is 58.3% that is to say the relationship is just a little high than the average. The second equation in the second zone is Y2= 3.64 + 0.138 NP2 -0.0482 AA2 -0.000001 IN2 + 0.0088 AT2. The regression square is 24.1% which mean that the relationship is very low. References
[1] Baerwald, (1941),Associate Editors Transportation & Traffic and Hand Book
[2] KEEPER L.E (1976), The institute of Traffic engineering Delhi India
[3] Flaherty, C.A. (1983) , Highways and Traffic Engineering 2nd Edition Vol. I Edwar --- London
[4] Hobbs F.D. (1973), Traffic Planning 2nd Edition
[5] Kundiri A (1986) , Control Traffic flow with aid of a grade separation (unpublished)
[6] Mohammed A (1987), Hand out on urban and regional planning (-----)
[7] Pignataro L.J. (1973), Traffic Engineering Theory & practicePrentice-Hall, Inc Engl----
[8] Salter R.J (1974) , Highway Traffic Analysis and Design 2nd edition (1980) London
[9] Wright P.H. Paquent R.J (1974),Highway Engineering, 4ht edition New York, John Whiley & Sons