Embed Size (px)
Citation preview
Viral and Host Gene Expression in Human B-cell Lymphoma
Richard Gareth Jenner
Submitted to the University of London for the degree of Doctor of Philosophy
November 2002
Wohl Virion Centre
Department of Immunology and Molecular Pathology
Windeyer Institute of Medical Sciences
University College London

ProQuest Number: U642635
All rights reserved
INFORMATION TO ALL USERS The quality of this reproduction is dependent upon the quality of the copy submitted.
In the unlikely event that the author did not send a complete manuscript and there are missing pages, these will be noted. Also, if material had to be removed,
a note will indicate the deletion.
uest.
ProQuest U642635
Published by ProQuest LLC(2015). Copyright of the Dissertation is held by the Author.
All rights reserved.This work is protected against unauthorized copying under Title 17, United States Code.
Microform Edition © ProQuest LLC.
ProQuest LLC 789 East Eisenhower Parkway
P.O. Box 1346 Ann Arbor, Ml 48106-1346
Abstract
Kaposi’s sarcoma-associated herpesvirus (KSHV) was discovered in 1994 in Kaposi’s
sarcoma and has since fulfilled all criteria for causation. KSHV is also associated with
two forms of B-cell neoplasia; primary effusion lymphoma (PEL) and plasmablastic
multicentric Castleman’s disease (MCD). In most instances, PEL is thought to derive
from a post-germinal centre (GC) B-cell but the exact stage of B-cell development is
unknown. Also, of the 85 KSHV open reading frames that could contribute to viral
pathogenesis, the expression of only half has been characterised. It is therefore unclear
how KSHV interacts with its host B-cell and how this relates to lymphomagenesis.
This thesis concerns the creation and testing of two DNA arrays and their application to
the analysis of KSHV and human gene expression in PEL, This study shows that KSHV
genes can be divided into five groups based on their expression pattern; class I latent
genes, class II latent genes, primary lytic genes, secondary lytic genes and tertiary lytic
genes. By analogy with EBV, KSHV latent genes are likely to be necessary for the
control of B-cell development and for transformation. Comparison with other B-cell
tumour types reveals that PEL has a human gene expression profile similar to plasma
cells. This is characterised by low expression of genes involved in proliferation, B-cell
signalling, GC B-cell development and NF-kB activation but high expression of genes
with functions in the secretory pathway. As is the case for plasma cell tumours, high
expression of the vitamin D receptor renders PEL sensitive to growth inhibition by
vitamin D analogue drugs, PEL cells also over-express genes involved in inflammation,
cell adhesion and invasion, which may be responsible for their presentation in the body
cavities. These data suggest that KSHV promotes plasma cell development and that
PEL arises as a consequence of this virus-mediated B-cell activation.

For my parents

Acknowledgements
The completion of this thesis has depended on the efforts of a great many people other
than myself and for this I thank them. First and foremost thanks to my supervisor Paul
Kellam for his help, encouragement, dedication and enthusiasm. Also thanks to my
second supervisor Chris Boshoff for allowing me to exploit his time, knowledge (and
conference money!) to the benefit of this thesis. Many thanks are also due to Robin
Weiss for his support and sagely advice and for building the Wohl Virion Centre into
such an enjoyable environment in which to work. I am grateful to the MRC Laboratory
for Molecular Cell Biology for enrolling me in their graduate programme and for
funding me throughout this PhD.
Thanks also to the many members of the Wohl Virion centre past and present who have
helped me in the lab: Mariam Andrawiss, Dimitra Bourmpoulia, Ari Fassati, David
Griffiths, Tyson Sharp, Cecile Voisset and Lyubov Zaitseva. For help with computer
analysis, thanks to M. Mar Alba and Richard Myers. Thanks, of course, to Nicola
Gilbert and Liz Thomson. For reagents and equipment, thanks to Driss Talibi and Pieter
Goedhart for printing the KSHV arrays, Nicola Cattini, Karine Maillard and Richard
Wooster for printing the KSHV-human microarrays, Roger Buxton at the NIMR for the
generous use of the microarray scanner, Ursula Ayliffe and Rob Miller for the clinical
samples and to Lyn Healy and Mel Greaves for numerous cell lines.
Thank you to my parents for letting me treat the house like a hotel during the writing of
this thesis.
And lastly, thanks to Elaine Thomas for everything.
Contents
Abstract............................................................................................................................ 2
Acknowledgements.......................................................................................................... 4
Contents.............................................................................................................................5
Figures.............................................................................................................................11
Tables..............................................................................................................................14
Abbreviations..................................................................................................................15
Chapter 1
Introduction.................................................................................................................... 21
1.1 Tumours of B-cells............................................................................................... 22
1.1.1 The stages of B-cell development................................................................. 22
1.1.1.1 Generation of mature B-cells...................................................................23
1.1.1.2 The humoral immune response.............................................................. 26
1.1.1.3 Regulators of B-cell development.......................................................... 30
1.1.2 Epstein-Barr virus (EBV) control of B-cell development............................. 32
1.1.2.1 Infection of resting naïve B-cells............................................................36
1.1.2.2 Germinal centre (GC) B-cells..................................................................37
1.1.2.3 Peripheral blood memory B-cells............................................................37
1.1.2.4 Tonsil memory B-cells............................................................................38
1.1.2.5 Lytic virus replication and production of new virions........................... 39
1.1.3 B-cell tumourigenesis.....................................................................................39
1.1.3.1 Tumours of pre-B-cells........................................................................... 41
1.1.3.2 Tumours of mature B-cells......................................................................42
1.1.3.3 Tumours of GC B-cells.......................................................................... 42
1.1.3.4 Tumours of post-GC B-cells...................................................................44
1.1.3.5 Tumours of plasma cells......................................................................... 47
1.2 Kaposi’s sarcoma-associated herpesvirus (KSHV)............................................. 49
1.2.1 Human herpesviruses..................................................................................... 49
1.2.2 Herpesvirus morphology................................................................................50
1.2.3 The KSHV genome....................................................................................... 51
1.2.4 KSHV life cycle.............................................................................................55
1.2.4.1 Virus entry.............................................................................................56
1.2.4.2 Establishment of latency..........................................................................56
1.2.4.3 Lytic replication.......................................................................................57
1.2.4.4 DNA replication......................................................................................58
1.2.4.5 Herpesvirus assembly..............................................................................59
1.2.5 Diseases associated with KSHV.....................................................................60
1.2.5.1 Kaposi's sarcoma (KS)............................................................................60
1.2.5.2 Primary effusion lymphoma (PEL).........................................................62
1.2.5.3 Multicentric Castleman's disease (MCD)................................................64
1.2.6 Cell tropism....................................................................................................65
1.2.7 Epidemiology and transmission.................................................................... 66
1.2.8 Genes expressed during latent infection.........................................................67
1.2.8.1 Latent nuclear antigen (LNA-1)..............................................................68
1.2.8.2 Viral cyclin (v-cyclin).............................................................................70
1.2.8.3 Viral FLICE inhibitory protein (v-FLIP)................................................73
1.2.8.4 Kaposin................................................................................................... 73
1.2.8.5 K15..........................................................................................................74
1.2.9 Genes expressed during lytic replication....................................................... 75
1.2.9.1 Viral Bcl-2 (vBcl-2) and viral inhibitor of apoptosis (vIAP)................. 76
1.2.9.2 Viral interferon regulatory factors (vIRFs)............................................ 76
1.2.9.3 K3and K5............................................................................................... 78
1.2.9.4 Viral G-protein coupled receptor (vGPCR)........................................... 79
1.2.9.5 Viral 0X2 (vOX2)...................................................................................80
1.2.9.6 Viral macrophage inflammatory proteins (vMIPs)................................ 80
1.2.9.7 Viral interleukin-6 (vIL-6)......................................................................81
1.2.9.8 K1............................................................................................................81
1.3 DNA arrays..........................................................................................................83
1.3.1 Introduction to genomics................................................................................83
1.3.2 A description of DNA arrays..........................................................................84
1.3.3 Using DNA arrays to study gene expression..................................................88
1.3.4 Microarray data analysis................................................................................89
1.3.4.1 Direct analysis of differential expression................................................89
1.3.4.2 Analysis of multiple samples..................................................................92
1.3.4.3 Cluster analysis........................................................................................93
1.3.5 Application of arrays to oncology..................................................................95
1.3.5.1 Cancer classification..............................................................................96
6
1.3.5.2 Prediction of outcome..............................................................................98
1.3.5.3 Mechanisms of oncogenesis....................................................................99
1.3.5.4 Identification of therapeutic targets....................................................... 101
1.3.6 Array analysis of virus gene expression....................................................... 102
1.3.7 Array analysis of host gene expression during virus infection.....................103
1.3.7.1 Interferon response................................................................................ 106
1.3.7.2 Cytokines............................................................................................... 108
1.3.7.3 Stress responses..................................................................................... 108
1.3.7.4 Protein synthesis.................................................................................... 109
1.3.7.5 Cell cycle............................................................................................... 110
1.3.7.6 Summary: parallels with array analyses of cancer................................111
1.4 Scope of this thesis............................................................................................ 113
Chapter 2
Materials and Methods.................................................................................................. 114
2.1 Buffers and solutions........................................................................................... 114
2.2 Cell culture.......................................................................................................... 115
2.2.1 Thawing cells................................................................................................ 115
2.2.2 Passaging cells.............................................................................................. 116
2.2.3 Freezing cells................................................................................................ 116
2.2.4 Culture of clinical samples........................................................................... 116
2.2.5 Harvesting cells for analysis......................................................................... 117
2.2.5.1 KSHV array........................................................................................... 117
2.2.5.2 KSHV-human microarray..................................................................... 117
2.2.5.3 Northern blotting................................................................................... 117
2.3 DNA primers....................................................................................................... 118
2.4 Creation of array probes...................................................................................... 121
2.4.1 DNA purification.......................................................................................... 121
2.4.2 Polymerase chain reaction (PCR) amplification.......................................... 121
2.4.3 PCR purification...........................................................................................121
2.4.4 Preparation of competent bacteria................................................................ 122
2.4.5 Cloning......................................................................................................... 122
2.4.6 Screening for positive colonies.................................................................... 123
2.4.7 Purifying plasmid DNA................................................................................ 123
2.4.8 Verifying clone identity................................................................................ 124
2.4.9 DNA sequencing.......................................................................................... 124
7
2 A 10 Array PCR.................................................................................................. 125
2.4.11 Array PCR purification and precipitation................................................... 125
2.4.12 Printing the DNA arrays............................................................................. 126
2.5 KSHV array......................................................................................................... 126
2.5.1 Oligonucleotide labelling............................................................................. 126
2.5.2 Hybridisation of labelled oligonucleotides to the KSHV array....................127
2.5.3 Total RNA purification................................................................................. 128
2.5.4 DNase treatment of RNA............................................................................. 128
2.5.5 Total RNA labelling..................................................................................... 129
2.5.6 Hybridisation................................................................................................ 130
2.5.7 Scanning and data extraction........................................................................ 131
2.5.8 Data processing............................................................................................ 131
2.5.9 Cluster analysis............................................................................................. 132
2.6 KSHV-human microarray................................................................................... 133
2.6.1 Total RNA purification................................................................................. 133
2.6.2 mRNA purification....................................................................................... 133
2.6.3 mRNA labelling............................................................................................ 134
2.6.4 Hybridisation................................................................................................ 135
2.6.5 Scanning and data extraction........................................................................ 136
2.6.6 Cluster analysis............................................................................................. 137
2.6.7 Mann-Whitney U (Wilcoxon-rank) test....................................................... 137
2.7 Non-array computer analyses.............................................................................. 138
2.8 Non-array PCR.................................................................................................... 138
2.8.1 PCR for KSHV and EBV............................................................................. 138
2.8.2 Real-time PCR..............................................................................................138
2.8.3 RT-PCR........................................................................................................ 139
2.9 Northern blotting................................................................................................. 140
2.9.1 mRNA purification....................................................................................... 140
2.9.2 Denaturing agarose gel electrophoresis and blotting.................................... 141
2.9.3 Radiolabelled probe synthesis and hybridisation......................................... 141
2.10 Western blotting................................................................................................ 142
2.11 Flow cytometry.................................................................................................. 143
2.12 Immunofluorescence assay (IFA)..................................................................... 144
2.13 Cell proliferation assay......................................................................................144
Chapter 3
Manufacture and validation of DNA arrays..................................................................145
3.1 Introduction.........................................................................................................145
3.2 Results.................................................................................................................147
3.2.1 The KSHV array...........................................................................................147
3.2.1.1 Production of the KSHV array.............................................................. 147
3.2.1.2 Characteristics of the KSHV array........................................................153
3.2.1.3 The KSHV array produces consistent and reproducible measurements of
gene expression.................................................................................................157
3.2.1.4 Data normalisation................................................................................159
3.2.2 The KSHV-human microarray.....................................................................160
3.2.2.1 Production of the KSHV-human microarray.........................................160
3.2.2.2 Sensitivity of the KSHV-human microarray.........................................163
3.2.2.3 Creating a common reference sample for gene expression profiling.... 163
3.2.2.4 Filtering noise from the data and its effects on reproducibility.............166
3.2.2.5 Cluster analysis of experimental replicates...........................................173
3.2.3 Comparison between nylon and glass arrays................................................ 174
3.3 Discussion...........................................................................................................175
3.3.1 The sensitivity and dynamic range of both KSHV arrays compare well with
other array systems................................................................................................175
3.3.2 Experimental replication demonstrates low variability between expression
measurements........................................................................................................177
3.4 Summary of Chapter 3 ........................................................................................178
Chapter 4
KSHV gene expression in PEL.....................................................................................179
4.1 Introduction.........................................................................................................179
4.2 Results.................................................................................................................185
4.2.1 Gene expression analysis by KSHV arrays..................................................185
4.2.2 KSHV gene expression during latency.........................................................187
4.2.3 KSHV gene expression during lytic replication - genes sharing similar
functions are co-ordinately expressed...................................................................192
4.2.4 Presumed non-coding regions are transcribed.............................................. 197
4.2.5 KSHV encodes four full-length IRFs...........................................................200
4.2.6 KSHV gene expression in different PEL samples........................................206
4.3 Discussion.................. 209
9
4.3.1 KSHV possesses class I and class II latent genes.........................................209
4.3.2 The transcription programme of KSHV lytic replication............................ 210
4.3.3 A comparison with the KSHV array study of Paulose-Murphy et al...........212
4.3.4 vIRFs have complex expression patterns.....................................................213
4.3.5 Transcript mapping using DNA arrays.........................................................214
4.4 Summary of Chapter 4 ..................................................................................... 216
Chapter 5
Host gene expression in PEL.........................................................................................217
5.1 Introduction.........................................................................................................217
5.2 Results.................................................................................................................219
5.2.1 Sample preparation.......................................................................................219
5.2.2 B-cell tumour ordering by developmental stage..........................................221
5.2.3 Classification of clinical samples.................................................................223
5.2.4 Gene expression signatures in B-cell tumours.............................................225
5.2.5 Low expression of B-cell signatures in PEL correlates with the expression of
Blimp-1..................................................................................................................231
5.2.6 The unfolded protein response (UPR) and other ER stress pathways are
activated in plasma cell tumours...........................................................................237
5.2.7 Anti-viral response against KSHV and EBV type III latency..................... 243
5.2.8 PEL cells over-express genes involved in inflammation, adhesion and
invasion................................................................................................................ 245
5.2.9 PEL cells express VLA-6.............................................................................247
5.2.10 PEL is sensitive to vitamin D analogue drug EB 1089 (Seocalcitol).........249
5.3 Discussion...........................................................................................................251
5.3.1 KSHV may promote plasma cell development............................................252
5.3.2 Anti-viral gene activity relates to patterns of virus gene expression........... 253
5.3.3 PEL gene expression helps explain its pathology........................................254
5.3.4 The processes underlying plasma cell differentiation and their status in PEL
...............................................................................................................................255
5.3.5 The plasma cell phenotype of PEL suggests novel therapies...................... 257
Chapter 6
Summary and directions for future research.................................................................259
References.....................................................................................................................265
10
Figures
Chapter 1
Figure 1.1. The generation of mature B-cells..................................................................25
Figure 1.2. The humoral immune response..................................................................... 29
Figure 1.3. A model for EBV control of B-cell development....................................... 35
Figure 1.4. Morphology of the KSHV virion.................................................................. 50
Figure 1.5. The KSHV genome.......................................................................................52
Figure 1.6. The KSHV life cycle.....................................................................................55
Figure 1.7. A model for LNA-1 and v-cyclin function during the cell cycle..................72
Figure 1.8. Array methodology....................................................................................... 87
Figure 1.9. Array analysis methods.................................................................................90
Chapter 3
Figure 3.1. PCR of KSHV array clones with insert-specific primers............................149
Figure 3.2. Purified array probe DNA........................................................................... 151
Figure 3.3. KSHV array topology..................................................................................152
Figure 3.4. KSHV arrays hybridised with ^^P-labelled oligonucleotides complementary
to the common PCR primer tags....................................................................................154
Figure 3.5. Characteristics of the KSHV array.............................................................. 156
Figure 3.6. Correlations between duplicate experiments...............................................158
Figure 3.7. Normalising between KSHV arrays............................................................ 160
Figure 3.8. Purified KSHV-human microarray probe DNA..........................................162
Figure 3.9. The reference RNA specifically hybridises to all viral array elements 165
Figure 3.10. Expression ratio is independent of total signal intensity...........................166
Figure 3.11. Defining criteria for data filtering............................................................. 169
Figure 3.12. Filtering the data by signal to background ratio increases the correlation
between experimental replicates....................................................................................172
Figure 3.13. Cluster analysis of experimental replicates............................................... 173
Figure 3.14. Comparison between KSHV gene expression measurements from nylon
and glass arrays..............................................................................................................174
Chapter 4
Figure 4.1. Hybridisation of RNA from PEL cells to the KSHV array.........................186
Figure 4.2. Hierarchical clustering of KSHV gene expression data..............................191
11
Figure 4.3. KSHV programme of lytic gene expression................................................193
Figure 4.4. Three classes of KSHV lytic genes............................................................. 194
Figure 4.5. Human homologues of KSHV K3 and K5 proteins.................................... 196
Figure 4.6. Expression of KSHV genes by function......................................................197
Figure 4.7. Expression of presumed non-coding intergenic regions............................. 198
Figure 4.8. Transcript mapping between oriLyt-R and v-FLIP..................................... 199
Figure 4.9. Homology of KSHV ORFs with human interferon regulatory factors (IRFs).
201
Figure 4.10. Splicing creates three long ORFs with homology to full-length IRFs......202
Figure 4.11. Expression of KIO and KlO.l................................................................... 205
Figure 4.12. Expression of KSHV genes across multiple PEL samples....................... 207
Figure 4.13. A gene expression map of the KSHV genome..........................................215
Chapter 5
Figure 5.1. Purified total RNA...................................................................................... 220
Figure 5.2. Assembly of B-cell tumours according to developmental stage by gene
expression profiling....................................................................................................... 222
Figure 5.3. Flow cytometry of primary tumour samples...............................................223
Figure 5.4. Viruses present in effusion lymphomas...................................................... 224
Figure 5.5. Hierarchical clustering of 26 samples and a filtered set of 1987 genes......226
Figure 5.6. Detail of the proliferation / splicing signature............................................ 227
Figure 5.7. Detail of the GC / B-cell signature..............................................................229
Figure 5.8. Detail of the NF-KB signature.....................................................................230
Figure 5.9. Genes under-expressed by PEL cells relative to other B-cell tumour types.
.......................................................................................................................................233
Figure 5.10. Expression of Blimp-1 measured by RT-PCR.......................................... 235
Figure 5.11. Genes with increased expression in all post-GC tumours.........................236
Figure 5.12. Increased expression of ER and Golgi genes and activation of the unfolded
protein response (UPR) in PEL and plasma cell tumours.............................................238
Figure 5.13. Expression of ATF6 protein measured by western blotting..................... 239
Figure 5.14. Detail of the central portion of the PEL cluster........................................ 241
Figure 5.15. Expression of genes associated with Alzheimer’s disease increases in PEL
and plasma cell tumours................................................................................................ 242
Figure 5.16. Induction of anti-viral genes in EBV type III latency and KSHV infection.
.......................................................................................................................................244
12
Figure 5.17. Identification of genes that define PEL................................................... 246
Figure 5.18. High expression of VLA-6 on PEL cells................................................. 248
Figure 5.19. PEL is sensitive to the vitamin D analogue drug EB 1089 (Seocalcitol). 250
Chapter 6
Figure 6.1. A model for KSHV control of B-cell development.................................... 261
13
TablesChapter 1
Table 1.1. Immunoglobulin (Ig) gene status and surface marker expression by stage of
B-cell development..........................................................................................................22
Table 1.2. EBV expression programmes......................................................................... 33
Table 1.3. EBV latent genes and their functions............................................................. 34
Table 1.4. B-cell tumours and their classification by developmental stage....................40
Table 1.5. Human herpesviruses and their disease associations..................................... 49
Table 1.6. KSHV open reading frames (ORFs), their protein products and function 54
Table 1.7. Regulatory classes of herpesvirus genes expressed during lytic replication
after de novo infection.....................................................................................................57
Table 1.8. Different array types and their respective probing methods.......................... 86
Table 1.9. Viruses whose effects on host gene expression have been measured using
DNA arrays.................................................................................................................... 105
Chapter 2
Table 2.1. Constituents of buffers and solutions........................................................... 114
Table 2.2. Cell lines used in this study.......................................................................... 115
Table 2.3. DNA primers................................................................................................ 120
Chapter 3
Table 3.1. KSHV array probe clones.............................................................................148
Table 3.2. Additional probes cloned for the KSHV-human microarray....................... 161
Table 3.3. Composition of the common reference RNA mixture used with the KSHV-
human microarray.......................................................................................................... 164
Table 3.4. Experimental replicates analysed using the KSHV-human microarray 167
Table 3.5. Pearson correlation coefficients between filtered data from experimental
replicates........................................................................................................................ 171
Chapter 4
Table 4.1. Known expression patterns of individual KSHV genes............................... 184
Table 4.2. Functional annotation of KSHV genes by homology...................................195
Table 4.3. Location of probes detecting novel transcripts............................................. 198
Chapter 5
Table 5.1. Samples analysed by the KSHV-human microarray....................................220
14
Abbreviations
ABL Abelson murine leukaemiaActivated-DLBCL Activated B-like diffuse large B-cell lymphomaAg AntigenAICD APP intracellular domainAIDS Acquired immunodeficiency syndromeAIDS-KS AIDS-associated KSALCL Anaplastic large cell lymphomaAML Acute myeloid leukaemiaAMP Adenosine monophosphateAP KSHV assembly proteinAPL Acute promyelocytic leukaemiaAPP Amyloid precursor proteinARFl ADP-ribosylation factor 1ATF Activating transcription factorATP Adenosine triphosphateATXl Antioxidant protein 1BAFF B-cell activating factor of the tumour-necrosis-factor familyBak Bcl-2-antagonist/killerB-ALL Precursor B-cell acute lymphoblastic leukaemiaBARF Bam A restriction fragmentBART Bam A rightward transcriptBax Bcl-2-associated X proteinBCBL Body cavity-based lymphomaBel B-cell lymphomaBCR B-cell receptorbcr Breakpoint cluster regionbFGF Basic fibroblast growth factorBIR Baculovirus lAP repeatBKS BHV-4, KSHV and swinepoxBL Burkitt’s lymphomaBLAST Basic local alignment search toolBLC B-lymphocyte chemokineBlimp-1 B-lymphocyte-induced maturation protein-1BLPD B-cell lymphoproliferative diseaseBMVEC Bone marrow microvascular endothelial cellbp Base-pairBRCAl Breast cancer 1BSA Bovine serum albuminBSAP B-cell specific activator proteinC/EBP CCAAT/enhancer binding proteinCAP Adenyl cyclase-associated proteinCBP CREB-binding proteinCCD Charge coupled deviceCDC Cell division cycleCDK Cyclin dependent kinaseChkl Checkpoint kinase 1CHX CyclohexamideCIITA MHC class II transcriptional activatorCKI CDK inhibitorCLL Chronic lymphocytic leukaemiac-myc Myelocytomatosis viral oncogene homologueCNS Central nervous systemCOX-2 Cyclooxygenase-2CREB Cyclic AMP response element binding proteinCryoEM Cryogenic electron microscopyCtIP C-terminal binding protein interacting proteinCTL Cytotoxic T lymphocyteD Ig diverse region
15
dATP Deoxyadenosine triphosphatedCTP Deoxycytidine triphosphateddATP Dideoxyadenosine triphosphateddCTP Dideoxycytidine triphosphateddGTP Dideoxyguanosine triphosphateddUTP Dideoxyuridine triphosphateDEPC Diethylene pyrocarbonatedGTP Deoxyguanosine triphosphateDHFR Dihydrofolate reductasedITP Deoxyinosine triphosphateDLBCL Diffuse large B-cell lymphomaDMSG Dimethyl sulphoxideDMVEC Dermal microvascular endothelial cellDNA Deoxyribonucleic aciddNTP Deoxynucleotide triphosphate mixDSMZ Deutsche Sammlung von Mikroorganismen und ZellkulturenDTP DithiothreitoldTTP Deoxythymidine triphosphatedUTPase Deoxyuridine triphosphataseEBER Epstein-Barr encoded RNAEBP Early B-cell factorEBI3 EBV induced gene 3EBNA Epstein-Barr nuclear antigenEBNA-LP Epstein-Barr nuclear antigen leader-proteinEBV Epstein-Barr virusEDTA Ethylenediaminetetraacetic acideIF-2B Eukaryotic initiation factor 2BEM Electron microscopeEMA Epithelial membrane antigenEMAP2 Endothelial monocyte-activating protein 2Env HIV envelopeEOR ER overload responseER Endoplasmic reticulumERAD ER-associated degradationERCC3 Excision repair cross-complementing 3ERK3 Extracellular signal-related kinase 3EST Expressed sequence tagFACS Fluorescence activated cell sortingFADD Fas-associated death domainFAST Fas-activated serine/threonineFCS Foetal calf serumFGFR3 Fibroblast growth factor receptor 3FITC Fluorescein isothiocyanateFL Follicular lymphomaFLICE FADD interleukin-1 P-converting enzymeFLIP FLICE inhibitory proteinGag HIV group associated antigenGAPDH Glyceraldehyde 3-phosphate dehydrogenaseGAS Interferon-y activation sitegB Glycoprotein BGC Germinal centreGC-DLBCL GC B-like diffuse large B-cell lymphomaGCNl General control of amino-acid syndesis 1GROa Growth related protein alphaGRP Glucose-regulated proteinHAART Highly active anti-retroviral therapyHADH2 Hydroxyacyl-Coenzyme A dehydrogenase, type IIHB-EGF Heparin binding epidermal growth factor-like growth factorHBV Hepatitis B virusHCC Hepatocellular carcinomaHCL Hairy cell leukaemiaHCMV Human cytomegalovirusHCV Hepatitis C virus
16
HFF Human foreskin fibroblastsHFV Human foamy virus (simian foamy virus (SFV) cpz(hu))HHV Human-herpesvirusHIF-1 Hypoxia-inducible factor-1HIV-1 Human immunodeficiency virus-1HL Hodgkin’s lymphomaHLA Human leukocyte antigenHOX HomeoboxHPV Human papilloma virusHRP Horseradish peroxidaseHRS Hodgkin and Reed-StembergHrs HoursHSV Herpes-simplex virusHTLV-1 Human T-cell leukaemia virus-1HUGO Human genome organisationHUVEC Human umbilical vein endothelial cellHVS Herpesvirus saimiriJAP Inhibitor of apoptosisICAM Intracellular adhesion moleculeIFA Immunofluorescence assayIg ImmunoglobulinIGFl Insulin-like growth factor 1IgH Ig heavy chainIgL Ig light chainIL InterleukinIM Infectious mononucleosis (IM)IPI International Prognostic IndicatorIPTG Isopropylthio-P-D-galactosideIREl High inositol-requiring protein 11RES Internal ribosome entry siteIRE Interferon regulatory factorISG Interferon stimulated geneISGF-3Y Interferon stimulated gene factor 3 gammaISRE Interferon-stimulated response elementITAM Immunoreceptor tyrosine-based activation motifIkB Inhibitor of NF-kBJ Ig joining regionJAK3 Janus-activated kinase 3JNK Jun N-terminal kinaseK I5 M K15 minor formK15P K15 predominant formkb KilobaseKDR Kinase domain receptorKS Kaposi's sarcomaKSHV Kaposi’s sarcoma-associated herpesvirusL&H Lymphocytic and histiocyticLANA-2 Latency-associated nuclear antigen-2LAT Latency-associated transcriptLB Luria-BertaniLCL Lymphoblastoid cell lineLDL Low density lipoproteinLMP Latent membrane proteinLMP7 Large multifunctional protease 7LNA-1 Latent nuclear antigen-1Log(2) Log base 2LOWESS Locally weighted scatterplot smoothingLrp Lung resistance proteinLUR Long unique coding regionLYSPIOO-A Lymphoid-specific SPlOO homologue AMadp2 Mitotic arrest deficient-like protein 2MAPK Mitogen-activated protein kinaseMCD Multicentric Castleman’s diseaseMCL Mantle cell lymphoma
17
Mcl-l Myeloid cell leukaemia-1MCP Major viral capsid proteinMCP-1 Macrophage chemoattractant protein-1MCP-2 Macrophage chemoattractant protein-1MDC Macrophage-derived chemokineMDc Molecular Dynamics countsMDM2 Mouse double minute2MDV Marek’s disease virusMECl-1 Multicatalytic endopeptidase complex-1MESA MOPS-EDT A-sodium acetateMHC Major histocompatibility complexMHV-68 Murine gammaherpesvirus 68MIP Macrophage inflammatory proteinMIR Modulator of immune recognitionMLL Mixed-lineage leukaemiaMM Multiple myelomaMMLV Moloney murine leukaemia virusMMSET Multiple myeloma SET domain proteinMPIF-2 Myeloid progenitor inhibitory factor-2mRNA Messenger RNAMtal Metastasis associated 1MUMl Multiple myeloma oncogene 1MxA Myxovirus resistance protein AMZ Marginal zoneNCI National Cancer InstituteNDRGl N-myc downstream regulated gene 1Nef HIV negative factorNEAT Nuclear factor of activated T cellsNF-kB Nuclear factor of K light polypeptide gene enhancer in B-cellsNK Natural killerNPC Nasopharyngeal carcinomaNPCl Niemann-Pick disease, type ClOBP Origin binding proteinOBP-1 Origin binding protein-1ORCl Origin recognition complex 1ORF Open reading frameOriLyt Origin of lytic replicationORP Oxygen regulated proteinP/CAF P300/CBP-associated factorP/S Penicillin and streptomycinPAA Phosphonoacetic acidPAF Primase-associated factorPALS Periarteriolar lymphoid sheathPBMC Peripheral blood mononuclear cellsPBS Phosphate-buffered salinePBX Pre-B-cell leukaemic homeoboxPCA Principle component analysisPCL Plasma cell leukaemiaPCNA Proliferating cell nuclear antigenPCR Polymerase chain reactionPE PhycoerythrinPEL Primary effusion lymphomaPERV Porcine endogenous retrovirusPKA Protein kinase APKB Protein kinase BPKC Protein kinase CPKR Double-stranded DNA dependent protein kinasePLC-y Phospholipase C-gammaPML Promyelocytic leukaemiaPMT Photomultiplier tubePOD PML oncogenic domainsPPRT Pyrophosphate phosphoribosyltransferasePr KSHV protease
18
pRb Retinoblastoma proteinPre-BCR Pre-B-cell receptor complexP/S 100 units/ml penicillin and 100 p-g/ml streptomycinPTLD Post-transplant lymphoproliferative disorderPVDF Polyvinylidene fluoridePVM Pneumonia virus of miceRA All-trans-retinoic acidRAFTK Related adhesion focal tyrosine kinaseRAG Recombinase-activating geneRANTES Regulated on activation normal T-cell expressed and secretedRap Replication-associated proteinRAP LDL-related protein-associated protein 1RBP-Jk Recombination-signal binding protein Ig Jk regionRCCl Regulator of chromosome condensation 1RDA Representational difference analysisRIPA RadioimmunoprecipitationRNA Ribonucleic acidRNAi RNA interferenceRPMI Roswell Park Memorial InstituteRSV Respiratory syncytial virusRT Reverse transcriptaseRT-PCR Reverse transcription-polymerase chain reactionSIP Site 1 proteaseS2P Site 2 proteaseSAGE Serial analysis of gene expressionSAP SLAM-associated proteinSAPK Stress-activated protein kinaseSCAP SREBP cleavage-activating proteinSCF Stem-cell factorses Saline sodium citrateSD Standard deviationsDENS Background subtracted signal densitySDF-1 Stromal cell-derived factor-1SDS Sodium dodecyl sulphateSE Standard errorSERS Splicing factor, arginine/serine-richSMZL Spleen marginal zone lymphomaSNURF Small nuclear ribonucleoprotein upstream reading frameS0D2 Superoxide dismutase 2SOM Self-organising mapSRBCT Small round blue-cell tumoursSREBP Sterol regulatory element binding proteinssDBP ssDNA binding proteinsDENS Background-subtracted signal density (ArrayVision)SSPE Saline sodium phosphate EDTASSR Signal sequence receptorSTAT Signal transducer and activator of transcriptionSTP Saimiri transforming proteinSV40 Simian virus 40sVCA Small viral capsid antigenSVM Support vector machineT TimeTAE Tris-acetate-EDTATAP-1 Transporter associated with antigen processing-1TARC Thymus activation-regulated chemokineTat HIV transactivator of transcriptionTdT Terminal deoxynucleotide transferaseTE Tris-EDTATEGT Testis enhanced gene transcriptTEMED T etramethylethy lenediamineTh Helper T-cellTIMP2 Tissue inhibitor of metalloproteinase 2TM Tris-magnesium (TM)
19
TMAP Tyrosine 3-monooxygenase activation proteinTMV Tobacco mosaic virusTNF Tumour necrosis factorTNFR-1 Tumour necrosis factor receptor-1TPA 12-0-tetradecoylphorbol 13 -acetateTR Terminal repeatsTRADD Tumour necrosis factor receptor-associated death domainTRAP Tumour necrosis factor receptor-associated factorTRAMP Translocating chain-association membrane proteintRNA Transfer RNATSGlOl Tumour susceptibility gene 101U Unit (except in Mann Whitney U test)U2AF1 U2 small nuclear RNA auxiliary factor 1UBEIL Ubiquitin-activating enzyme El-likeUPR Unfolded protein responseuv Ultra-violetV Ig variable regionvBcl-2 Viral Bcl-2vCBP Viral complement binding proteinv-cyclin Viral cyclinVDAC3 Voltage-dependent anion channel 3VDR Vitamin D receptorVEGF Vascular endothelial growth factorVEGFR-3 VEGF receptor-3v-FLIP Viral FLICE inhibitory proteinvGCPR Viral G-protein coupled receptorvIAP Viral inhibitor of apoptosisVIDA Virus DatabaseVif HIV virion infectivity factorvIRF Viral interferon regulatory factorVLA-6 Very late antigen-6vMIP Viral macrophage inflammatory proteinvOX-2 Viral OX-2VSV Vesicular stomatitis virusvzv Varicella-Zoster virusXBP-1 X-box binding protein-1X-Gal 5-bromo-4-chloro-3-indolyl-P-D-galactosideXLP X-linked lymphoproliferative diseaseXPCC Xeroderma pigmentosum complementation group C
20
Chapter 1
Introduction
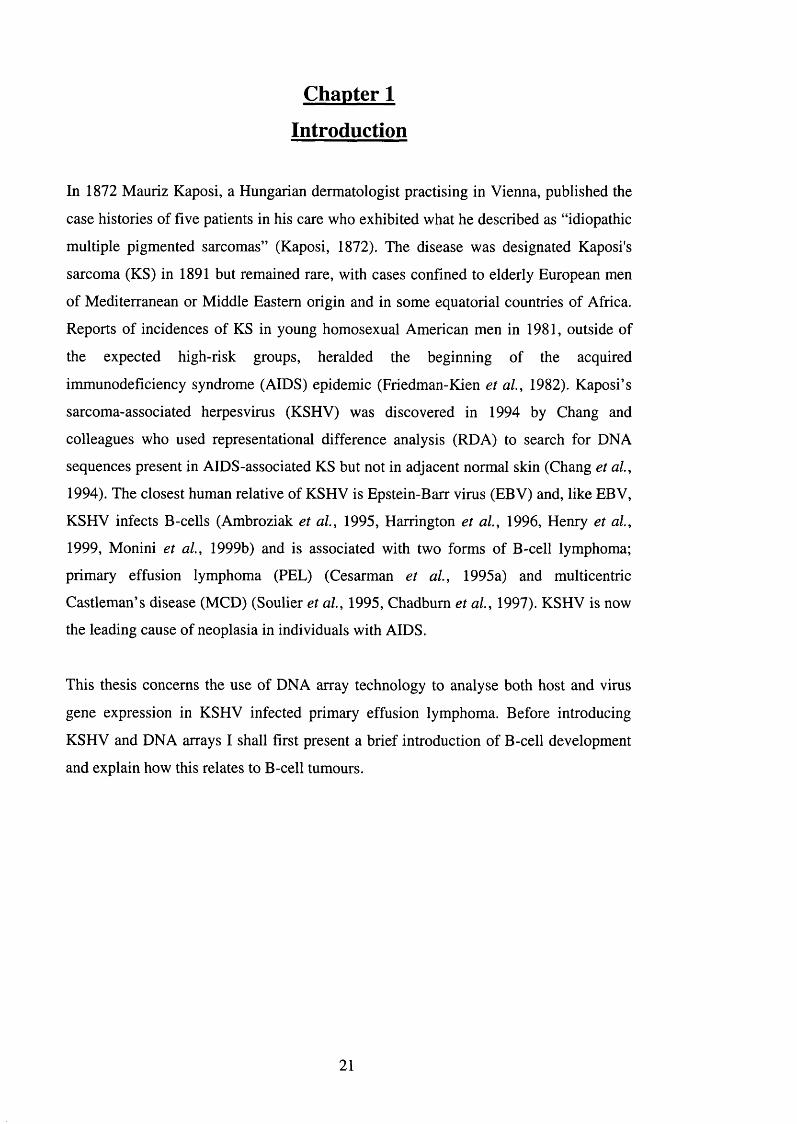
In 1872 Mauriz Kaposi, a Hungarian dermatologist practising in Vienna, published the
case histories of five patients in his care who exhibited what he described as “idiopathic
multiple pigmented sarcomas” (Kaposi, 1872). The disease was designated Kaposi's
sarcoma (KS) in 1891 but remained rare, with cases confined to elderly European men
of Mediterranean or Middle Eastern origin and in some equatorial countries of Africa.
Reports of incidences of KS in young homosexual American men in 1981, outside of
the expected high-risk groups, heralded the beginning of the acquired
immunodeficiency syndrome (AIDS) epidemic (Friedman-Kien et al, 1982). Kaposi’s
sarcoma-associated herpesvirus (KSHV) was discovered in 1994 by Chang and
colleagues who used representational difference analysis (RDA) to search for DNA
sequences present in AIDS-associated KS but not in adjacent normal skin (Chang et al,
1994). The closest human relative of KSHV is Epstein-Barr virus (EBV) and, like EBV,
KSHV infects B-cells (Ambroziak et al, 1995, Harrington et al, 1996, Henry et al,
1999, Monini et al, 1999b) and is associated with two forms of B-cell lymphoma;
primary effusion lymphoma (PEL) (Cesarman et al, 1995a) and multicentric
Castleman’s disease (MCD) (Soulier et al, 1995, Chadbum et al, 1997). KSHV is now
the leading cause of neoplasia in individuals with AIDS.
This thesis concerns the use of DNA array technology to analyse both host and virus
gene expression in KSHV infected primary effusion lymphoma. Before introducing
KSHV and DNA arrays I shall first present a brief introduction of B-cell development
and explain how this relates to B-cell tumours.
21
1 .1 T u m o u r s o f B ‘C e U s
1.1.1 The stages of B-cell development
B -cells are a lymphoid cell lineage that, upon encounter with specific antigen,
differentiate into antibody secreting plasma cells. Plasma cells are therefore the final
mediators o f the humoral immune response. B -cell development can be viewed as a
temporally ordered series o f discrete stages spanning haematopoietic stem cell to
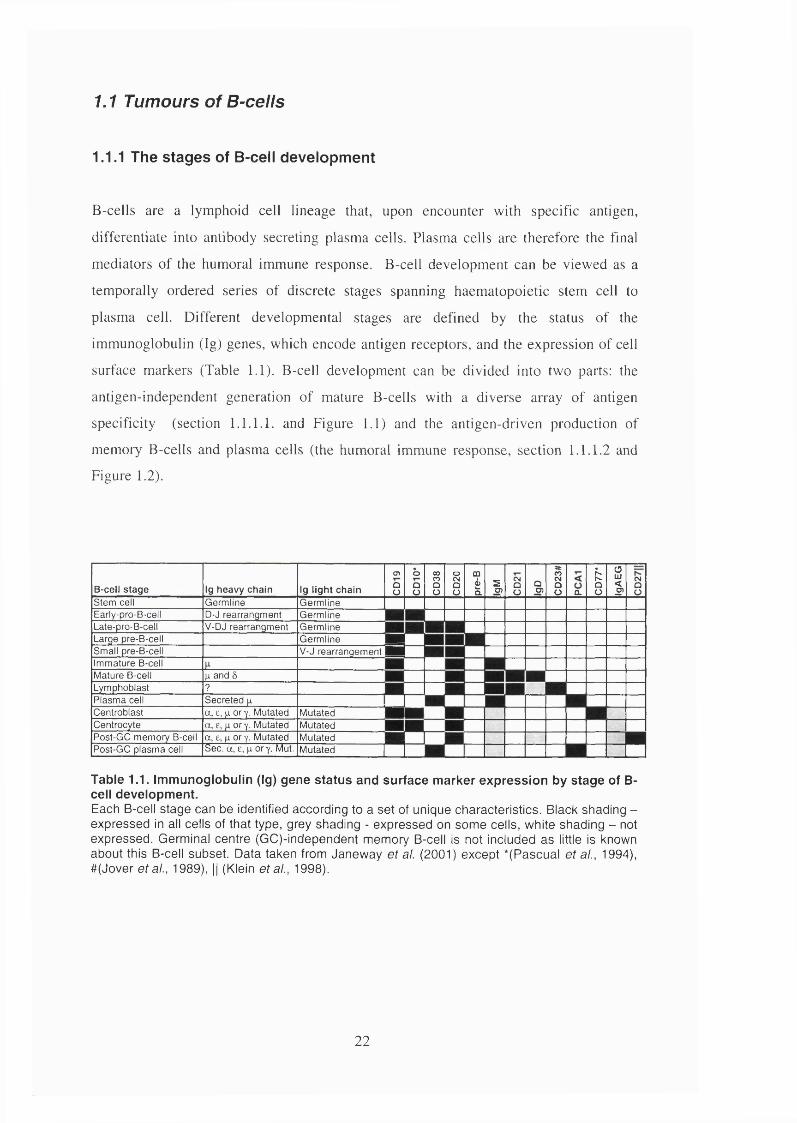
plasma cell. Different developmental stages are defined by the status o f the
immunoglobulin (Ig) genes, which encode antigen receptors, and the expression o f cell
surface markers (Table 1.1). B -cell development can be divided into two parts: the
antigen-independent generation o f mature B -cells with a diverse array o f antigen
specificity (section 1.1.1.1. and Figure 1.1) and the antigen-driven production o f
memory B-cells and plasma cells (the humoral immune response, section 1.1.1.2 and
Figure 1.2).
B -cell s t a g e Ig h e a v y c h a in Ig l ig h t c h a in
o>QO
b
8 iO
IÜ
mAQ.
sO) a
ÜQO) I
Ü Q.
kQO
2<g
so
Stem cell Germline GermlineEarly-pro-B-cell D-J rearrangment GermlineLate-pro-B-cell V-DJ rearrangment GermlineLarge pre-B-cell Germline ■ ■Small pre-B-cell V-J rearrangement WÊÊImmature B-cellMature B-cell p and 6Lymphoblast ?Plasma cell Secreted pCentroblast a, e, p or y . Mutated Mutated ^ ■ ■ 1Centrocyte a, e, pory. Mutated MutatedPost-GC memojv B-cell a, e, p or Y- Mutated Mutated mPost-GC plasma cell Sec. a , e, pory. Mut. Mutated 1 ^ nTable 1.1. Immunoglobulin (Ig) gene status and surface marker expression by stage of B- cell development.Each B-cell stage can be identified according to a set of unique characteristics. Black shading - expressed in all cells of that type, grey shading - expressed on some cells, white shading - not expressed. Germinal centre (GC)-independent memory B-cell is not included as little is known about this B-cell subset. Data taken from Janeway et al. (2001) except *(Pascual et ai, 1994), #(Jover et ai, 1989), || (Klein et ai, 1998).
22
1.1.1.1 Generation of m ature B-cells
B-cells are formed in the bone marrow from pluripotent haematopoietic stem cells
(Figure 1.1). This requires survival factors, such as interleukin (IL)-7 (Lee et al, 1989),
stem-cell factor (SCF) (McNiece et al, 1991) and stromal cell-derived factor-1 (SDF-1)
(Nagasawa et al, 1996), produced by bone marrow stromal cells. The earliest
committed member of the B-cell lineage is the early pro-B-cell, which can be identified
by the expression of cell surface CD 19, part of the B-cell co-receptor. During this stage,
diverse (D) and joining (J) gene segments encoding the Ig heavy chain (IgH) are joined
by recombination (Hozumi and Tonegawa, 1976, Early et al, 1980, Hardy et al, 1991).
The variable region (V) is then recombined with the DJ segments in the late pro-B-cell
stage. The enzymes responsible include recombinase-activating genes 1 and 2 (RAG-1
and 2) (Oettinger et al, 1990) and terminal deoxynucleotide transferase (TdT) (Komori
et al, 1993). Successful IgH rearrangement leads to formation of the large pre-B-cell
stage, characterised by production of p heavy chain. This is encoded by a transcript
containing the rearranged VDJ segments spliced to the p constant exon (Rabbitts,
1978). The p heavy chain forms part of the pre-B-cell receptor complex. Studies with
transgenic mice show that the formation of this receptor is necessary for further B-cell
development (Loffert et al, 1996). The subsequent small pre-B-cell stage is
characterised by rearrangement of the genes encoding the Ig light chain (IgL) (Ehlich
and Kuppers, 1995, ten Boekel et al, 1995). There are two loci encoding light chain
gene segments, K and X. The k loci are rearranged first, and if this fails, the X loci are
rearranged (Arakawa et al, 1996). Productive rearrangement leads to synthesis of IgL,
which combines with the p heavy chain to form IgM. The cell is now an immature B-
cell, IgM is the antigen receptor component of the B-cell receptor (BCR) complex,
which also contains the signalling molecules Iga and IgP (CD79 a and b). Signalling
from the complete BCR leads to down-regulation of RAG expression, preventing
further Ig rearrangements (Grawunder et al, 1995). In the case of strongly self-reactive
B-cells, RAG expression is maintained and development is arrested while the light
chains are replaced (receptor editing) (Tiegs et al, 1993, Prak and Weigert, 1995). If
this fails to prevent self-recognition, the cell is removed by apoptosis, a process termed
clonal deletion (Nemazee et al, 1991, Chen et al, 1995). Weakly self-reactive
immature B-cells become anergic (non-responsive) or ignorant, that is antigen binding
does not trigger intracellular signalling (reviewed in Comall et al, 1995).
23
The stochastic choice between multiple copies of heavy chain V, D and J segments and
light chain V and J segments leads to the production of a population of immature B-
cells with many different antigen specificities (combinatorial diversity). These leave the
bone marrow in the blood and are attracted into follicles of secondary lymphoid organs
by B-lymphocyte chemokine (BLC) (Gunn et al, 1998). Here, immature B-cells
differentiate into mature B-cells, which co-express IgD formed by alternative splicing to
the 5 heavy chain constant region. Less than half of immature B-cells survive to form
mature B-cells. Some are removed by clonal deletion (Russell et al, 1991) while others
fail to compete for entry into lymphoid follicles (Cyster et al, 1994, Fulcher and
Basten, 1994). The follicles provide essential survival signals, such as B-cell activating
factor of the tumour-necrosis-factor family (BAFF) (Harless et al, 2001). Also, low-
level signalling through the B-cell receptor is necessary for mature B-cell survival (Lam
et al, 1997, Turner et al, 1997, Levine et al, 2000, Heltemes and Manser, 2002). B-
cells that succeed in entering lymphoid follicles can enter the circulation and, in the
absence of contact with specific antigen, survive with a half-life of 3-8 weeks.
B-cells also enter the spleen marginal zone (MZ), where they become non-circulating
MZ B-cells. Migration to the MZ rather than the follicles may be favoured by lower
intensity BCR signalling (Cariappa et al, 2001) and expression of integrins aLp2 and
a4pl (Lu and Cyster, 2002). Another subset of B-cells, B-1 cells, mature
predominantly in the body cavities (Macpherson et al, 2001). B-1 cells can be defined
by CD5 and IgM expression with low expression of IgD but their origin is unclear
(reviewed in Berland and Wortis, 2002).
24
Bone marrow
Early pro-B-cell
Late pro-B-cell
Largepre-B-cell
Clonaldeletion
Smallpre-B-cell
ImmatureB-cellStem cell
rrangem ert rrangemant
Periphery
MatureB-cell
Follicle MZ B-cellC lonald eletion
Secondary lymphoid organ
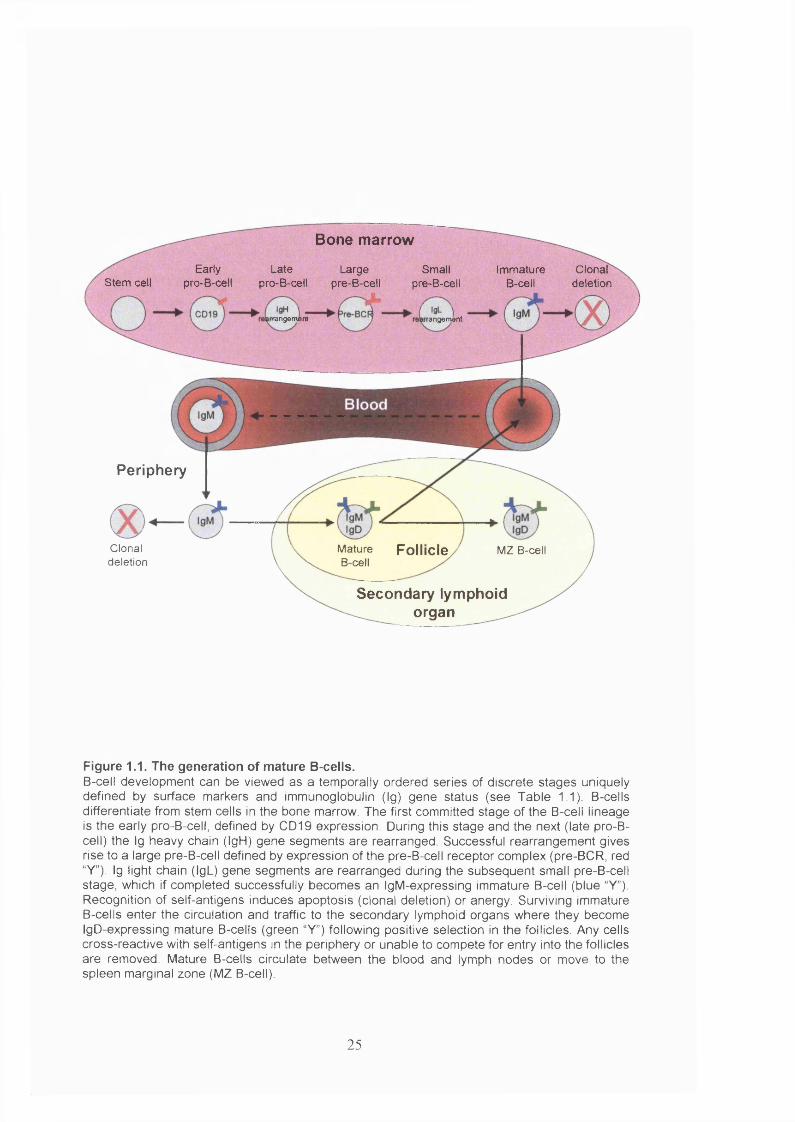
Figure 1.1. The generation of mature B-cells.B-cell development can be viewed as a temporally ordered series of discrete stages uniquely defined by surface markers and immunoglobulin (Ig) gene status (see Table 1.1). B-cells differentiate from stem cells in the bone marrow. The first committed stage of the B-cell lineage is the early pro-B-cell, defined by GDI9 expression. During this stage and the next (late pro-B- cell) the Ig heavy chain (IgH) gene segments are rearranged. Successful rearrangement gives rise to a large pre-B-cell defined by expression of the pre-B-cell receptor complex (pre-BCR, red “Y”). Ig light chain (IgL) gene segments are rearranged during the subsequent small pre-B-cell stage, which if completed successfully becomes an IglVI-expressing immature B-cell (blue “Y”). Recognition of self-antigens induces apoptosis (clonal deletion) or energy. Surviving immature B-cells enter the circulation and traffic to the secondary lymphoid organs where they become IgD-expressing mature B-cells (green “Y”) following positive selection in the follicles. Any cells cross-reactive with self-antigens in the periphery or unable to compete for entry into the follicles are removed. Mature B-cells circulate between the blood and lymph nodes or move to the spleen marginal zone (MZ B-cell).
25
1.1.1.2 The humoral immune response
The next phase of B-cell development, the production of antibody-secreting plasma
cells, is summarised in Figure 1.2. Antigen is presented by dendritic cells in the T-cell
zones of lymph nodes or periarteriolar lymphoid sheath (PALS) of the spleen. Antigen-
specific CD4-I- T-cells adhere to the dendritic cells and differentiate into effector helper
T-cells ( T h ). B-cells are attracted to the T-cell zones by CCL19 and CCL21 (Cyster et
al, 1999, Reif et al, 2002) and antigen-specific B-cells are sequestered. B-cells
internalise antigen bound by surface Ig and present it on major histocompatibility
complex (MHC) class II molecules. Recognition of this antigen by Th cells leads to
activation of the B-cell (Hanna, 1964). Activation occurs through ligation of CD40
(Valle et al, 1989, Moelle et al, 1992), CD30 (Shanebeck et al, 1995) and release of
IL-4 (Valle et al, 1989). The activated B-cells, termed lymphoblasts, proliferate to form
a primary focus (Jacob et al, 1991a, Garside et al, 1998).
Lymphoblasts can migrate into a lymphoid follicle where they continue to proliferate,
forming a germinal centre (GC) (reviewed in MacLennan, 1994). GC B-cells consist of
centroblasts, defined by expression of CD77, and centrocytes that are CD77 negative
and express higher levels of Ig. Proliferating GC B-cells displace resting B-cells to the
periphery of the follicle (so called mantle zone B-cells). The purpose of the GC reaction
is the production of high affinity Ig of different isotypes. Different isotypes (IgA, E or
G) comprise different heavy chain constant regions (a, 8 and y respectively). This
occurs through class switching, the further rearrangement of the Ig heavy chain locus to
allow the use of the a, e and y heavy chain segments that lie downstream of p. and Ô
(reviewed in Stavnezer, 1996). Class switching requires CD40 ligation, while the
specific isotype selected is governed by the cytokines present. The affinity of the B-cell
receptor for the specific antigen also increases in the GC (termed affinity maturation)
(Berek et al, 1991, Jacob et al, 1991b). This is achieved by somatic hypermutation, the
introduction of point mutations in the variable regions of heavy- and light-chain genes.
This occurs by the creation of double-stranded breaks and their subsequent repair by an
error-prone DMA polymerase (reviewed in Diaz and Casali, 2002). Somatic
hypermutation may also occur outside of the GC at unknown sites (Takahashi et al,
1998). Further receptor editing can also occur in the GC (Han et al, 1997a,
Papavasiliou et al, 1997). GC B-cells with high affinity antigen receptors out-compete
those with lower affinity receptors in receiving survival signals through the BCR
26
(Kelsoe, 1996, Pulendran et al, 1997). B-cell survival and proliferation in the GC
requires the continued presence of T-cells and follicular dendritic cells (FDCs)
(Humphrey et al, 1984, Liu et al, 1989).
B-cells that survive the selection process in the GC differentiate into either plasmablasts
(pre-plasma cells) or memory B-cells (reviewed in Choi, 1997, Han et al, 1997b). The
signals governing this cell fate decision are uncertain but studies suggest that plasma
cell development is favoured by high-affinity antigen receptor (Smith et al, 1997),
signals from OX40L (Stuber and Strober, 1996). IL-10 (Choe and Choi, 1998) and IL-6
(Kawano et al, 1995, Jego et al, 2001). The alternative development of memory B-
cells is favoured by IL-4 (Zhang et al, 2001a) and signalling through CD40 (Arpin et
al, 1995).
Together with memory T-cells, memory B-cells form the organism’s immunological
memory (Schittek and Rajewsky, 1990). They are long-lived, non-dividing cells that
can be identified by CD27 expression (Klein et al, 1998). Memory B-cells circulate in
the blood or colonise the spleen MZ (Liu et al, 1988, Dunn-Walters et al, 1995). Upon
secondary antigen stimulation these B-cells are reactivated to form plasma cells
secreting high-affmity antibody (Berek et al, 1987, Arpin et al, 1997, McHeyzer-
Williams and Ahmed, 1999). Memory B-cells lacking mutated Ig genes can be formed
independently of the GC (Toyama et al, 2002).
Plasmablasts continue to divide (Sze et al, 2000) and begin to synthesise secreted
antibody from alternatively spliced Ig mRNA. Plasmablasts formed in lymph node or
splenic follicles migrate to the bone marrow where they terminally differentiate into
non-dividing plasma cells (Benner et al, 1981, Dilosa et al, 1991, Takahashi et al,
1998). Those originating in gut-associated lymphoid tissue migrate to gut epithelia.
Plasma cells can be identified by expression of CD38 (Leo et al, 1992) and CD138
(Sanderson et al, 1989) in association with low levels of B-cell specific antigens, MHC
class II (Abney et al, 1978, Halper et al, 1978) and the lymph node homing receptor
CCR7 (Hargreaves et al, 2001). The cells are specialised to secrete large amounts of Ig
and have well developed endoplasmic reticulum (ER) and Golgi. Plasma cell life span is
dictated by the capacity of the spleen (Sze et al, 2000), possibly due to the limited
number of plasmablast-associated dendritic cells that provide survival signals (Garcia
De Vinuesa et al, 1999). Plasma cells produced in the latter stages of the humoral
27
immune response can survive for over a year in the spleen and bone marrow of mice
(Slifka et al, 1998).
B-cells can also differentiate into plasma cells independently of the GC. Lymphoblasts
proliferating in the primary focus can form plasmablasts that migrate to the medullary
cord of the lymph nodes (red pulp of the spleen) where they differentiate into plasma
cells (Toellner et al, 1996, Luther et al, 1997). These cells secrete non-mutated
pentameric-IgM, providing an initial low-affinity antibody response. B-cells can also
respond to some antigens, such as bacterial polysaccharide, without requiring T-cell
help. This is the prominent means of activation of B-1 cells and MZ B-cells (reviewed
in Martin and Kearney, 2000). T-cell independent responses also give rise to unmutated
low-affmity IgM secreting plasma cells (Dal Porto et al, 1998, Oliver et al, 1999,
Berland and Wortis, 2002). The majority of plasma cells formed by extra-follicular
responses are short lived (2-3 days) (Ho et al, 1986, Smith et al, 1996). However, as
for post-GC plasma cells, some survive for longer depending on the capacity of the
spleen (Sze et al, 2000).
28
MemoryB-cell
igA ,E,M ,G
T-cell zone
CassswBcnmg
Centroblast CentrocyteGerminal
centre
MatureB-cell
Lymphoblast
Secondary lymphoid organ
Lymphoblast Plasmablast Plasma blast
IgM * MedullaryMtry— N cord
r CD38j|
Plasma cell
Bone X igA.E.M.G marrow J t .
CD38 )•«<
Plasma cell
MZ B-cell
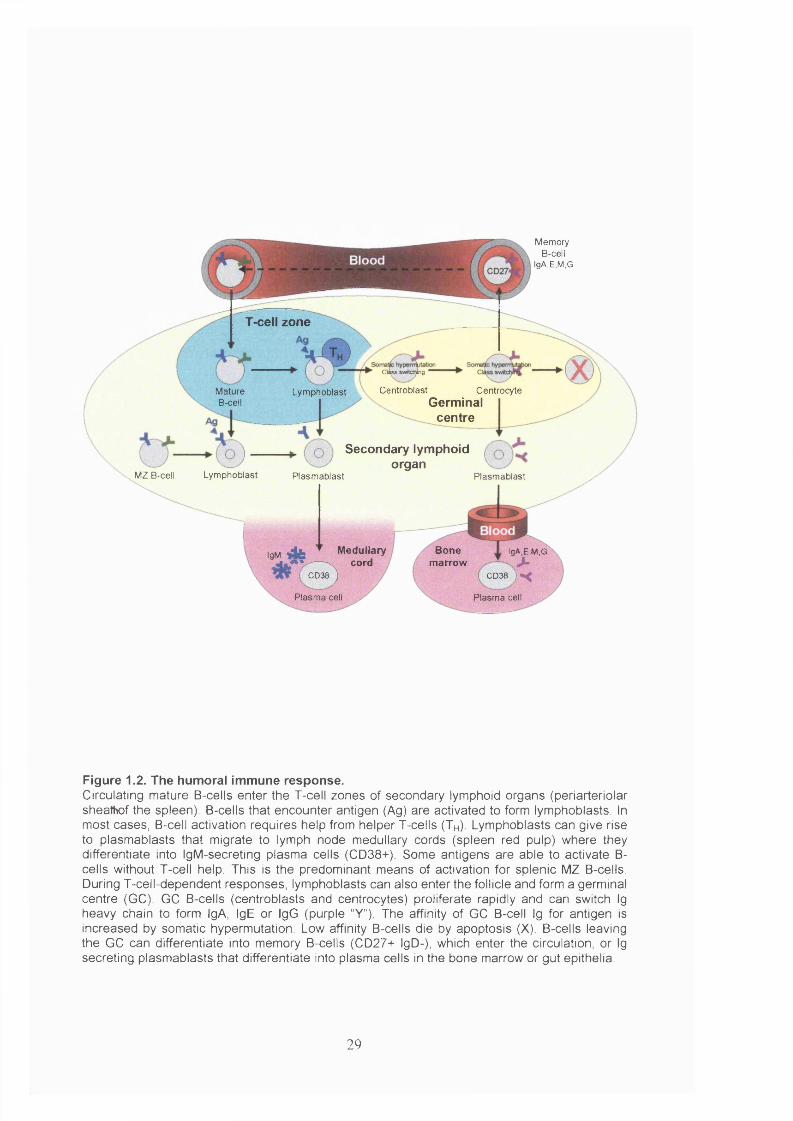
Figure 1.2. The humoral immune response.Circulating mature B-cells enter the T-cell zones of secondary lymphoid organs (periarteriolar sheathof the spleen). B-cells that encounter antigen (Ag) are activated to form lymphoblasts. In most cases, B-cell activation requires help from helper T-cells (T h ). Lymphoblasts can give rise to plasmablasts that migrate to lymph node medullary cords (spleen red pulp) where they differentiate into IgM-secreting plasma cells (CD38+). Some antigens are able to activate B- cells without T-cell help. This is the predominant means of activation for splenic MZ B-cells. During T-cell-dependent responses, lymphoblasts can also enter the follicle and form a germinal centre (GC). GC B-cells (centroblasts and centrocytes) proliferate rapidly and can switch Ig heavy chain to form IgA, IgE or IgG (purple “Y”). The affinity of GC B-cell Ig for antigen is increased by somatic hypermutation. Low affinity B-cells die by apoptosis (X). B-cells leaving the GC can differentiate into memory B-cells (CD27+ IgD-), which enter the circulation, or Ig secreting plasmablasts that differentiate into plasma cells in the bone marrow or gut epithelia.
29
1.1.1.3 Regulators of B-cell development
B-cell development appears to be controlled by a small number of master regulatory
genes. Differentiation of both lymphoid and myeloid cell lineages from haematopoietic
stem cells is controlled by the Ets-family member PU.l (reviewed in Schebesta et ai,
2002). Low PU.l expression specifically induces lymphoid development by activating
expression of the IL-7 receptor a-chain. Progression to the early pro-B-cell stage
requires the transcription factors E2A and early B-cell factor (EBP) (Bain et al, 1994,
Zhuang et al, 1994, Lin and Grosschedl, 1995, O'Riordan and Grosschedl, 1999).
These proteins cooperatively induce the expression of the surrogate light chains of the
pre-B-cell receptor, Iga and IgP and RAG-1 and 2.
Development beyond the early pro-B-cell stage requires Pax5 (B-cell specific activator
protein (BSAP)) (Urbanek et al, 1994). E2A and EBP are expressed in B-cells from
Pax5 deficient mice indicating Pax5 acts downstream (Nutt et al, 1997, Nutt et al,
1998). However, Pax5 is also necessary for the earlier commitment to the lymphoid
lineage. Pax5 activates the expression of B-cell genes CD19 and Iga (Goebel et al,
2001) while simultaneously repressing myeloid-specific genes (Nutt et al, 1999). The
maintenance of mature B-cell identity and function also requires Pax5 (Horcher et al,
2001).
Members of the nuclear factor of k light polypeptide gene enhancer in B-cells (NP-kB)
gene family have roles throughout B-cell development. Experiments with knockout
mice have revealed roles for different combinations of NP-KB family members in the
formation of pro-B-cells, immature B-cells and for the survival of mature B-cells
(reviewed in Gerondakis et al, 1999). CD40 ligation leads to increased NP-KB activity
during B-cell activation (Lalmanach-Girard et al, 1993, Berberich et al, 1994, Prancis
et al, 1995, Hsing and Bishop, 1999) and defects in B-cell activation are a common
phenotype of NP-kB knockout mice (reviewed in Gerondakis et al, 1999). Loss of NP-
kB is associated with a block in the G1 phase of the cell cycle and increased apoptosis
due to the absence of the B-cell lymphoma (Bcl)-2 family member Bfl-1. This
requirement for NP-kB prevents inappropriate B-cell activation in the absence of T-cell
help or multivalent T-cell independent antigens. NP-kB activity is also necessary for
30
class switching (Snapper et al, 1996, Doi et al, 1997) and for up-regulation of Bcl-xL
and Bfl-1 in the GC (Lee et al, 1999a).
Differentiation into GC B-cells requires the transcription factor BCL-6 (Dent et al,
1997, Fukuda et al, 1997, Ye et al, 1997). Lymphoblasts that do not up-regulate BCL-
6 expression differentiate into extrafollicular plasmablasts rather than forming a GC
(Fukuda et al, 1997). Microarray analysis has revealed that BCL-6 expression is
necessary to maintain expression of GC B-cell markers and inhibit the expression of
genes associated with B-cell activation and plasmacytic differentiation (Shaffer et al,
2000). When BCL-6 expression is decreased, plasmacytic differentiation is induced
through B-lymphocyte-induced maturation protein-1 (Blimp-1) (Reljic et al, 2000,
Shaffer et al, 2000).
Two transcription factors. Blimp-1 and IRF4, promote plasma cell development. Blimp-
1 is up-regulated upon plasma cell differentiation in the GC and in extrafollicular sites
(Soro et al, 1999, Angelin-Duclos et al, 2000) and is sufficient to induce plasma cell
development (Turner et al, 1994, Schliephake and Schimpl, 1996, Messika et al, 1998,
Piskurich et al, 2000). IRF4 is expressed in the same subset of GC B-cells as Blimp-1
(Angelin-Duclos et al, 2000, Falini et al, 2000) and is necessary for the formation of
Ig-secreting B-cells (Mittrucker et al, 1997). Blimp-1 expression is induced by IL-6 but
inhibited by CD40 (Randall et al, 1998, Knodel et al, 2001), perhaps explaining the
respective effects of these agents on cell fate in the GC (section 1.1.1.2). Blimp-1
promotes plasma cell development by repressing the transcription the B-cell
transcription factors EBF, E2A, Pax5, PU.l and Spi-B (Lin et al, 2002, Shaffer et al,
2002), MHC class II transcriptional activator (CUTA) (Piskurich et al, 2000),
myelocytomatosis viral oncogene homologue (c-myc) (Lin et al, 1997b) and BCL-6
(Shaffer et al, 2002).
31
1.1.2 Epstein-Barr virus (EBV) control of B-cell development
EBV (human-herpesvirus (HHV)-4) was discovered in 1964 in cells cultured from
Burkitt’s lymphoma (BL) (Epstein et al, 1964). The virus is estimated to be present in
around 96% of endemic BL cases in Africa (Magrath, 1990). EBV is also associated
with the B-cell neoplasia classical Hodgkin’s lymphoma (HL) and B-cell
lymphoproliferative disease (BLPD) and the epithelium-derived nasopharyngeal
carcinoma (NPC). EBV-associated tumours are discussed in section 1.1.3. The
oncogenic potential of EBV was established by the transformation of infected B-cells in
culture to create lymphoblastoid cell lines (LCLs) (Henle et al, 1967, Pope, 1967, Pope
et al, 1968, Nilsson et al, 1971). However, the virus benignly infects and persists for
life in around 90% of the world’s population (Henle et al, 1969). The explanation for
this apparently contradictory behaviour is thought to lie in its interaction with host B-
cells and how this affects B-cell development.
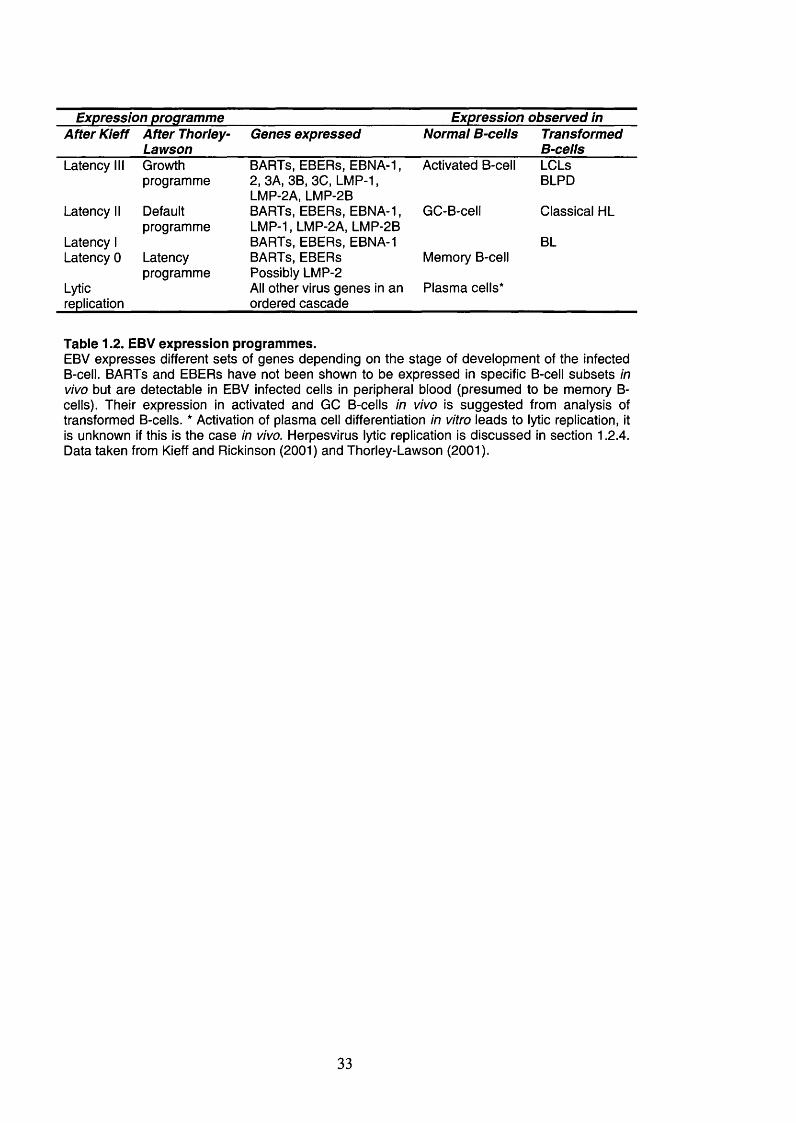
EBV expresses five different sets of genes depending on the stage of development of
the infected B-cell (Table 1.2). This pattern of EBV expression is maintained in
tumours derived from these infected cells. The largest of group of genes, the lytic genes,
is involved with virus replication. The other four sets are only expressed during virus
latency and are named EBV latency types III, II, I and 0. The genes expressed during
latency are thought to control B-cell development by mimicking B-cell signalling
pathways. The virus also uses B-cell transcription factors to regulate the expression of
its own genes. The functions of the EBV latent genes are detailed in Table 1.3. It has
been proposed that EBV drives the development of memory B-cells for use as a
reservoir of latent infection (Thorley-Lawson and Babcock, 1999). A model for how the
virus achieves this is illustrated in Figure 1.3 and discussed below. EBV-associated B-
cell tumours are thought to arise as a consequence of this virus-induced activation of
memory B-cell development (section 1.1.3).
32
Expression programme Expression observed inAfter Kieff After Thoriey-
LawsonGenes expressed Normai B-ceiis Transformed
B-ceiisLatency III Growth BARTs, EBERs, EBNA-1, Activated B-cell LCLs
programme 2, 3A, 3B, 30, LMP-1, BLPDLMP-2A, LMP-2B
Latency II Default BARTs, EBERs, EBNA-1, GC-B-cell Classical HLprogramme LMP-1, LMP-2A, LMP-2B
Latency 1 BARTs, EBERs, EBNA-1 BLLatency 0 Latency BARTs, EBERs Memory B-cell
programme Possibly LMP-2Lytic All other virus genes in an Plasma cells*replication ordered cascade
Table 1.2. EBV expression programmes.EBV expresses different sets of genes depending on the stage of development of the infected B-cell. BARTs and EBERs have not been shown to be expressed in specific B-cell subsets in vivo but are detectable in EBV infected cells in peripheral blood (presumed to be memory B- cells). Their expression in activated and GC B-cells in vivo is suggested from analysis of transformed B-cells. * Activation of plasma cell differentiation in vitro leads to lytic replication, it is unknown if this is the case in vivo. Herpesvirus lytic replication is discussed in section 1.2.4. Data taken from Kieff and Rickinson (2001) and Thorley-Lawson (2001).
33
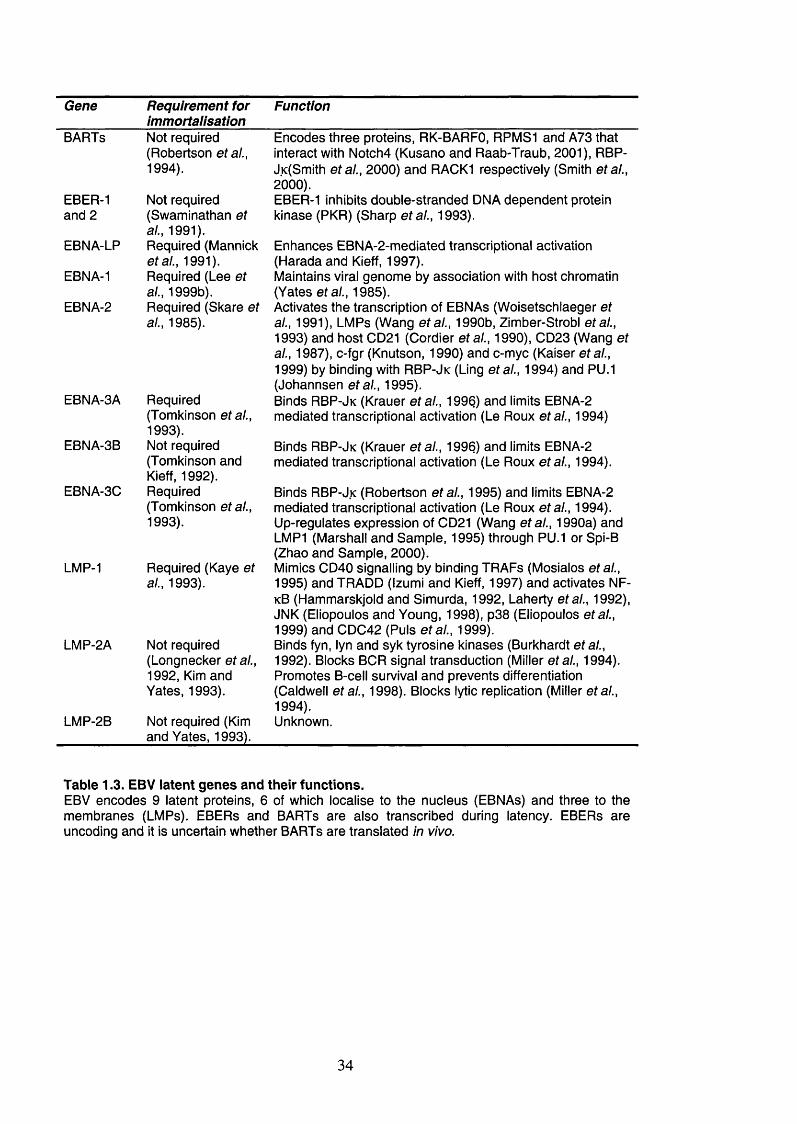
Gene Requirement forImmortalisation
Function
BARTs
EBER-1 and 2
EBNA-LP
EBNA-1
EBNA-2
EBNA-3A
EBNA-3B
EBNA-3C
LMP-1
LMP-2A
LMP-2B
Not required (Robertson etal.,1994).
Not required (Swaminathan et al., 1991).Required (Mannick etal., 1991). Required (Lee et al., 1999b). Required (Skare et al., 1985).
Required (Tomkinson etal., 1993).Not required (Tomkinson and Kieff, 1992). Required (Tomkinson etal.,1993).
Required (Kaye et al., 1993).
Not required (Longnecker et al., 1992, Kim and Yates, 1993).
Not required (Kim and Yates, 1993).
Encodes three proteins, RK-BARFO, RPMS1 and A73 that interact with Notch4 (Kusano and Raab-Traub, 2001), RBP- jK(Smith etal., 2000) and RACK1 respectively (Smith etal.,2000).EBER-1 inhibits double-stranded DNA dependent protein kinase (PKR) (Sharp etal., 1993).
Enhances EBNA-2-mediated transcriptional activation (Harada and Kieff, 1997).Maintains viral genome by association with host chromatin (Yates etal., 1985).Activates the transcription of EBNAs (Woisetschlaeger et al., 1991), LMPs (Wang etal., 1990b, Zimber-StrobI etal.,1993) and host CD21 (Cordier etal., 1990), CD23 (Wang et al., 1987), c-fgr (Knutson, 1990) and c-myc (Kaiser etal., 1999) by binding with RBP-Jk (Ling etal., 1994) and PU.l (Johannsen etal., 1995).Binds RBP-Jk (Krauer etal., 1996) and limits EBNA-2 mediated transcriptional activation (Le Roux etal., 1994)
Binds RBP-Jk (Krauer etal., 1996) and limits EBNA-2 mediated transcriptional activation (Le Roux etal., 1994).
Binds RBP-Jk (Robertson etal., 1995) and limits EBNA-2 mediated transcriptional activation (Le Roux etal., 1994). Up-regulates expression of CD21 (Wang etal., 1990a) and LMP1 (Marshall and Sample, 1995) through PU.l or Spi-B (Zhao and Sample, 2000).Mimics CD40 signalling by binding TRAFs (Mosialos etal.,1995) and TRADD (Izumi and Kieff, 1997) and activates NF- kB (Hammarskjold and Simurda, 1992, Laherty etal., 1992), JNK (Eliopoulos and Young, 1998), p38 (Eliopoulos etal., 1999) and CDC42 (Puis etal., 1999).Binds fyn, lyn and syk tyrosine kinases (Burkhardt etal.,1992). Blocks BCR signal transduction (Miller etal., 1994). Promotes B-cell survival and prevents differentiation (Caldwell etal., 1998). Blocks lytic replication (Miller etal.,1994).Unknown.
Table 1.3. EBV latent genes and their functions.EBV encodes 9 latent proteins, 6 of which localise to the nucleus (EBNAs) and three to the membranes (LMPs). EBERs and BARTs are also transcribed during latency. EBERs are uncoding and it is uncertain whether BARTs are translated In vivo.
34
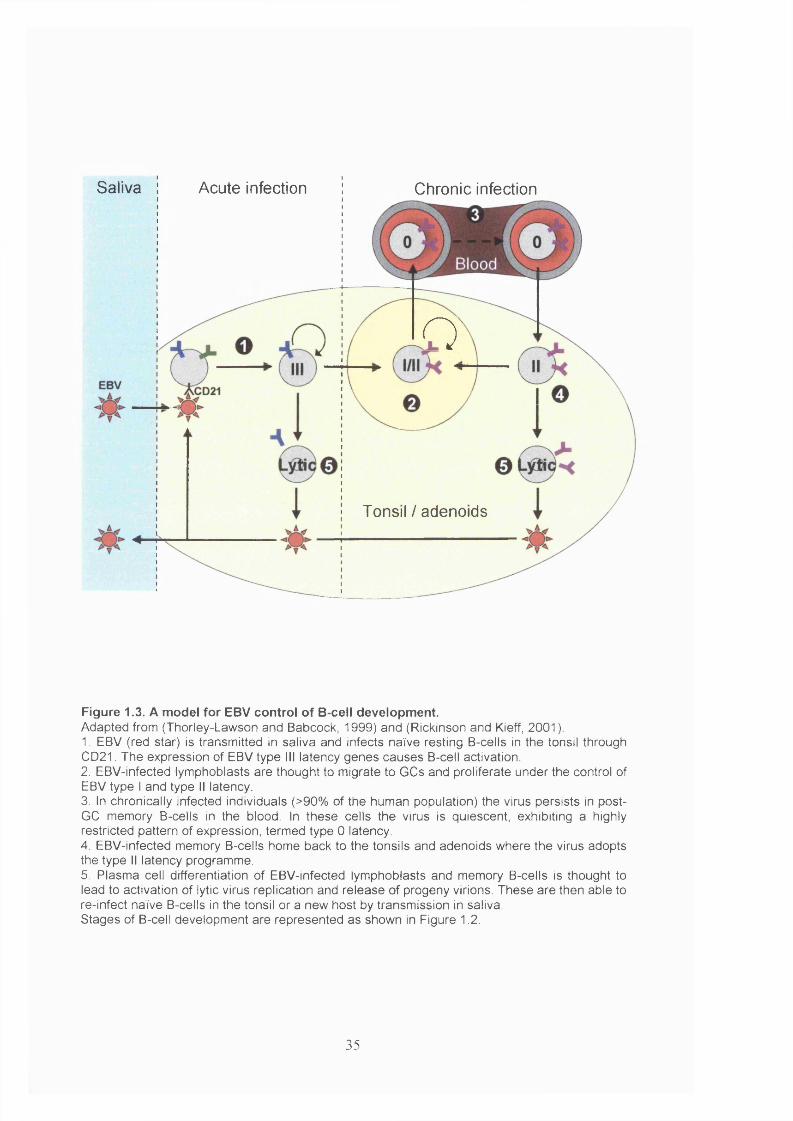
Saliva Chronic infectionAcute infection
o
Tonsil / adenoids
Figure 1.3. A model for EBV control of B-cell development.Adapted from (Thorley-Lawson and Babcock, 1999) and (Rickinson and Kieff, 2001).1. EBV (red star) is transmitted in saliva and infects naïve resting B-cells in the tonsil through CD21, The expression of EBV type III latency genes causes B-cell activation.2. EBV-infected lymphoblasts are thought to migrate to GCs and proliferate under the control of EBV type I and type II latency.3. In chronically infected individuals (>90% of the human population) the virus persists in post- GC memory B-cells in the blood. In these cells the virus is quiescent, exhibiting a highly restricted pattern of expression, termed type 0 latency.4. EBV-infected memory B-cells home back to the tonsils and adenoids where the virus adopts the type II latency programme.5. Plasma cell differentiation of EBV-infected lymphoblasts and memory B-cells is thought to lead to activation of lytic virus replication and release of progeny virions. These are then able to re-infect naïve B-cells in the tonsil or a new host by transmission in saliva.Stages of B-cell development are represented as shown in Figure 1.2.
35
A model for EBV control of B-cell development
The section numbers relate to Figure 1.3.
1.1.2.1 Infection of resting naïve B-cells
EBV is transmitted in saliva (Yao et al, 1985) and is thought to initially infect naïve
resting mantle zone B-cells (IgD+) present in nasopharyngeal lymphoid tissue (Aman
et al, 1984, Joseph et al, 2000a). Virus entry is mediated by gp350/220 interaction
with cell surface CD21 (Fingeroth et al, 1984, Nemerow et al, 1985), which forms part
of the B-cell co-receptor. This mimics signalling from complement component C3d and
the infected cell enters the cell cycle (Matsumoto et al, 1993). After infection, the latent
genes Epstein-Barr nuclear antigen (EBNA) leader-protein (EBNA-LP) and EBNA-2
(Allday et al, 1989, Rooney et al, 1989) are expressed from promoters containing Pax5
sites (Tierney et al, 2000). EBNA-2 activates the expression of the rest of the latent
virus genes, namely BARTs (Bam A rightward transcripts), Epstein-Barr encoded
RNAs (EBERs), Epstein-Barr nuclear antigens (EBNAs) 1, 3A, 3B and 3C and latent
membrane proteins (LMPs) 1, 2A and 2B (Wang et al, 1990b, Woisetschlaeger et al,
1991, Zimber-StrobI et al, 1993). This expression programme is known as type III
latency (Kieff and Rickinson, 2001) or the growth programme (Thorley-Lawson and
Babcock, 1999, Table 1.2).
EBNA-2 also activates the expression of a number of cellular genes associated with B-
cell activation, such as CD23 and c-myc. Indeed, LCLs established after in vitro
infection are nearly indistinguishable from B-cells proliferating in response to antigen
and T-cell help in their expression of markers of adhesion, activation and differentiation
(reviewed in Kieff and Rickinson, 2001). This is due to the expression of latent genes
that mimic normal B-cell signalling pathways (Table 1.3). EBNA-2 activates
expression through the B-cell transcription factors recombination-signal binding protein
Ig Jk region (RBP-Jk) (Ling et al, 1994) and PU.l (Johannsen et al, 1995). RBP-Jk
(Artavanis-Tsakonas et al, 1995) and CD23 (Hubmann et al, 2002) are regulated by
Notch, which can partially replace EBNA-2 function (Gordadze et al, 2001). LMP-1
mimics signalling from CD40 (Mosialos et al, 1995, Kilger et al, 1998, Busch and
Bishop, 1999, Uchida et al, 1999). The virus protein directly binds tumour necrosis
factor (TNF) receptor-associated factors (TRAFs) 1 and 3 and TRAF2 via TNF
36
receptor-associated death domain (TRADD) (Izumi and Kieff, 1997), leading to
activation of NF-kB (Hammarskjold and Simurda, 1992, Laherty et al, 1992), Jun N-
terminal kinase (JNK) (Eliopoulos and Young, 1998) and p38 (Eliopoulos et al, 1999)
signalling pathways. Both LMP-1 and CD40 also activate signal transducers and
activators of transcription (STATs) through binding Janus-activated kinase 3 (JAK3)
(Gires et al, 1999). LMP-2A mimics signalling from the BCR by binding the tyrosine
kinases lyn, fyn and syk (Burkhardt et al, 1992) and can rescue B-cell development in
Ig knockout mice (Caldwell et al, 1998).
EBV induction of B-cell proliferation increases the number of virus-infected cells. In
vitro this results in the formation of continuously proliferating LCLs. In vivo the
numbers of virus infected lymphoblasts are controlled by cytotoxic T lymphocyte
(CTL) immunosurveillance (Yao et al, 1985, Tan et al, 1999).
1.1.2.2 Germinal centre (GC) B-cells
It is thought EBV-infected lymphoblasts migrate to GCs in the tonsils and adenoids
(Thorley-Lawson and Babcock, 1999). EBV infected GC B-cells (IgD- CDlO-k) express
a more restricted set of latent genes, so called type 11 latency or the default programme
(Babcock et al, 2000). Type 11 latency is defined by the expression of BARTs, EBERs,
EBNA-1 and LMPs 1, 2A and 2B. EBNA-1 is expressed by EBV in all dividing cells
and is necessary for maintenance of the EBV genome (Yates et al, 1985). Some GC B-
cells may only express type 1 latent genes as this is observed in BL, a tumour of GC B-
cells (see section 1.1.3.3). It is not known how transition to a GC B-cell is achieved but
the extinction of EBNA-2 expression is likely to be important as it blocks
differentiation (Polack et al, 1996). The expression of LMP-1 and LMP-2A in infected
GC B-cells could provide the CD40 and BCR signals necessary for survival (Thorley-
Lawson and Babcock, 1999, Rickinson and Kieff, 2001).
1.1.2.3 Peripheral blood memory B-cells
EBV is found in post-GC memory B-cells (CD 19+ IgD-) in the peripheral blood
(Babcock et al, 1998). These cells are thought to be the reservoir of latent infection.
Consistent with this, EBV-infected memory B-cells, rather than lymphoblasts,
accumulate in immunosuppressed patients (Babcock et al, 1999). EBV-infected
37
memory B-cells are thought to be derived from EBV-infected GC B-cells. This could be
due to the mimicking of CD40 signalling by LMP-1, which favours memory B-cell
development (Arpin et al, 1995). Reverse transcription-polymerase chain reaction (RT-
PCR) shows that peripheral blood memory B-cells express only BARTs (Chen et al,
1999), EBERs (Tierney et al, 1994) and possibly LMP-2 (Qu and Rowe, 1992, Tierney
et al, 1994, Babcock et al, 1999, Babcock et al, 2000). This is the latency programme
or latency type 0. None of the growth-promoting genes required for transformation
(Table 1.2), which are also the main CTL targets (Rickinson and Kieff, 2001), are
expressed, enabling the virus to persist in a benign state. As memory B-cells are non
dividing, EBNA-1 also needs not be expressed.
1.1.2.4 Tonsil memory B-cells
The colonisation of memory B-cells allows the virus to spread throughout the
circulation. PCR detection of EBV in B-cell subsets suggests that EBV-infected
memory B-cells preferentially return to the tonsils and adenoids (Laichalk et al, 2002)
where they re-express EBNA-1, LMP-1 and LMP-2A (type II latency) (Babcock et al,
2000, Babcock and Thorley-Lawson, 2000). It is thought that LMP-1 and LMP-2A
mimic survival signals from T-cells and the BCR respectively to maintain the infected
memory B-cell pool. That LMP-2A could provide a survival signal rather than an
activation signal is consistent with blockade of antigen signalling due to BCR
desensitisation (Miller et al, 1994), its inability to drive proliferation (Longnecker et
al, 1992, Kim and Yates, 1993) and its ability to rescue B-cell development in Ig
knockout mice (Caldwell et al, 1998). Also, the reactivation of memory B-cells in the
tonsils by induction of type II latency could lead to GC re-entry and the amplification of
infected memory B-cells.
Infectious mononucleosis (IM) is a reaction to acute EBV infection observed in 30-50%
of adolescents and adults (Steven, 1996). In IM, EBV type III latency is also observed
in tonsil memory B-cells (Kurth et al, 2000), an event never witnessed in healthy
carriers (Joseph et al, 2000b). EBV is able to infect resting memory B-cells in vitro
(Aman et al, 1984, Thorley-Lawson and Mann, 1985). Therefore the proliferation of
EBV-infected memory B-cells in older individuals may reflect the inability to elicit a
strong naïve CTL response against the virus. However, only resting post-GC memory
38
B-cells accumulate in the peripheral blood suggesting that the normal EBV-B-cell
interactions are maintained in IM.
1.1.2.5 Lytic virus replication and production of new virions
EBV replication in the tonsils and overlying epidermis is observed in individuals with
acute IM (Weiss and Movahed, 1989, Anagnostopoulos et al, 1995). Terminal
differentiation of the infected lymphoblast into a plasma cell may lead to the induction
of lytic virus replication (Crawford and Ando, 1986, Niedobitek et al, 1991b,
Anagnostopoulos et al, 1995). Lytic EBV replication is observed in chronically
infected immunosuppressed patients (Greenspan et al, 1985). Also, all EBV-carriers
shed the virus into their saliva throughout their lives (Yao et al, 1989). This suggests
that plasma cell differentiation of circulating EBV-infected memory B-cells may also
lead to the induction of lytic virus replication. Infection of naïve B-cells in the tonsils
occurs continuously in chronically infected healthy individuals (Joseph et al, 2000a).
Therefore, the production of new virus in the tonsils maintains the virus in the host and
allows transmission in saliva.
1.1.3 B-ceii tum ourigenesis
Tumours retain many of the characteristics of the cell type from which they arise. This
is especially true of B-cell neoplasia where distinctive morphology, immunophenotypes
and immunoglobulin gene sequences allow them to be classified by their cell of origin
(reviewed in Kuppers et al, 1999, Dunn-Walters et al, 2001, Jaffe et al, 2001). This is
consistent with the model that malignant B-cells are frozen at otherwise transitory
developmental stages (Greaves, 1986) due to a block in differentiation (Potter, 1978).
Tumours corresponding to almost all stages of B-cell development have been described
in humans (Table 1.4). The stage of B-cell development is now the main criteria for
tumour classification (Jaffe et al, 2001). Different tumour types possess different
mutations and chromosomal translocations suggesting varied mechanisms of
transformation. The study of normal B-cell development has indicated that
tumourigenesis reflects the biology of the particular stage of B-cell development from
which the cancer was derived. Discovering the stage of B-cell development a tumour
represents is therefore critical for understanding its pathogenesis. The significant role
39
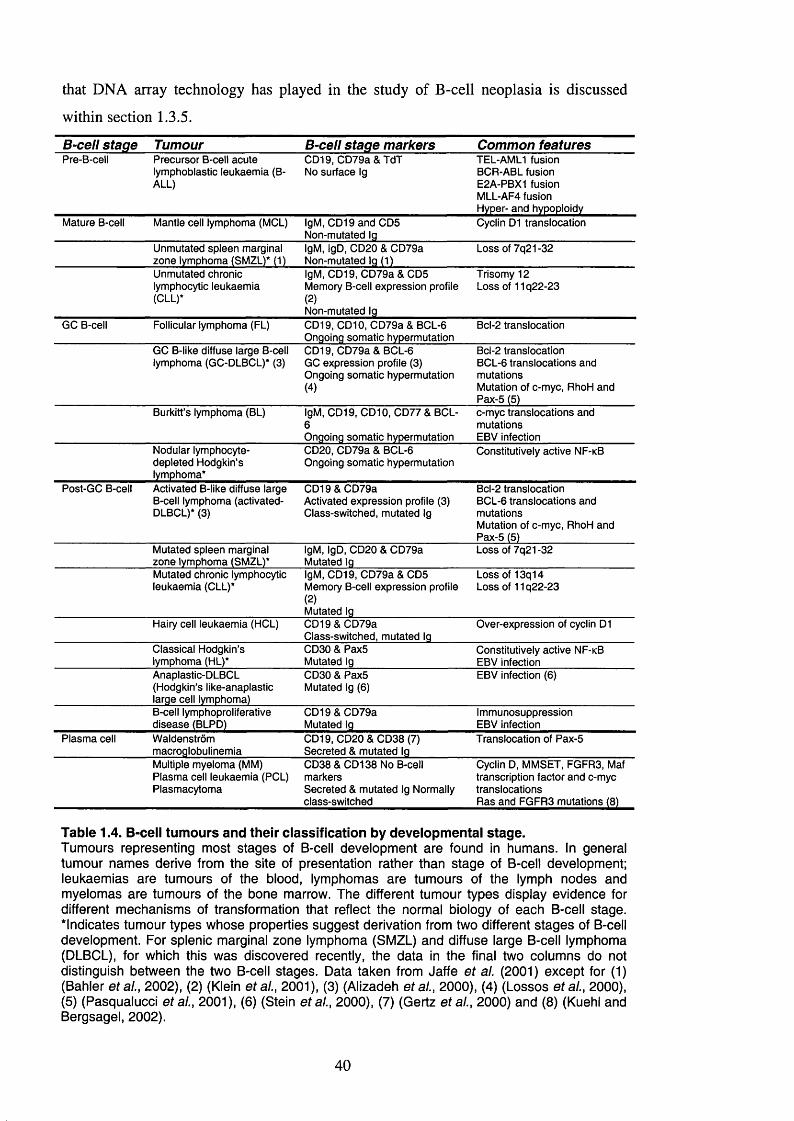
that DNA array technology has played in the study of B-cell neoplasia is discussed
within section 1.3.5.
B-cell stage Tumour B-cell stage markers Common featuresPre-B-cell Precursor B-cell acute
lymphoblastic leukaemia (B- ALL)
CD19, C D 79a & TdT No surface Ig
TEL-AML1 fusion BCR-ABL fusion E2A-PBX1 fusion MLL-AF4 fusion Hyper- and hypoploidy
Mature B-cell Mantle cell lymphoma (MCL) IgM, C D 1 9 a n d CDS Non-mutated Ig
Cyclin D1 translocation
Unmutated spleen marginal zone lymphoma (SM ZL)* (1)
IgM, IgD, C D 20 & C D 79a Non-mutated Ig (1)
Loss of 7q21-32
Unmutated chronic lymphocytic leukaemia (CLL)*
IgM, CD19, C D 79a & CDS Memory B-cell expression profile (2)Non-mutated Ig
Trisomy 12 Loss of 11q22-23
GC B-cell Follicular lymphoma (FL) C D19, C D 10, C D 79a & BCL-6 Ongoing somatic hypermutation
Bcl-2 translocation
GC B-like diffuse large B-cell lymphoma (GC-DLBCL)* (3)
CD19, C D 7 9 a & BCL-6 GC expression profile (3) Ongoing somatic hypermutation (4)
Bcl-2 translocation BCL-6 translocations and mutationsMutation of c-myc, RhoH and Pax-S (S)
Burkitt’s lymphoma (BL) IgM, CD19, C D 10, C D 77 & BCL- 6Ongoing somatic hypermutation
c-myc translocations andmutationsEBV infection
Nodular lymphocyte- depleted Hodgkin’s lymphoma*
CD20, C D 79a & BCL-6 Ongoing somatic hypermutation
Constitutively active N F-kB
Post-GC B-cell Activated B-like diffuse large B-cell lymphoma (activated- DLBCL)* (3)
C D 1 9 & C D 7 9 aActivated expression profile (3)Class-switched, mutated Ig
Bcl-2 translocation B CL-6 translocations and mutationsMutation of c-myc, RhoH and Pax-5 (5)
Mutated spleen marginal zone lymphoma (SMZL)*
IgM, IgD, C D 20 & C D 79a Mutated Ig
Loss of 7q21-32
Mutated chronic lymphocytic leukaemia (CLL)*
IgM, CD19, C D 79a & CDS Memory B-cell expression profile (2)Mutated Ig
Loss of 13q14 Loss of 11 q22-23
Hairy cell leukaemia (HCL) C D 1 9 & C D 7 9 a Class-switched, mutated Ig
Over-expression of cyclin D1
Classical Hodgkin’s lymphoma (HL)*
C D30 & PaxS Mutated Ig
Constitutively active N F-kB EBV infection
Anaplastic-DLBCL (Hodgkin’s like-anaplastic large cell lymphoma)
C D 30 & PaxS Mutated Ig (6)
EBV infection (6)
B-cell lymphoproliferative disease (BLPD)
C D 1 9 & C D 7 9 a Mutated Ig
Immunosuppression EBV infection
Plasm a cell Waldenstrommacroglobulinemia
CD19, C D 2 0 & C D 3 8 (7) Secreted & mutated Ig
Translocation of Pax-5
Multiple myeloma (M M) Plasm a cell leukaemia (PCL) Plasmacytoma
C D 3 8 & C D 1 3 8 No B-cell markersSecreted & mutated Ig Normally class-switched
Cyclin D, M M S E T, FG FR3, Maf transcription factor and c-myc translocationsRas and FG FR 3 mutations (8)
Table 1.4. B-cell tumours and their classification by developmental stage.Tumours representing most stages of B-cell development are found In humans. In general tumour names derive from the site of presentation rather than stage of B-cell development; leukaemias are tumours of the blood, lymphomas are tumours of the lymph nodes and myelomas are tumours of the bone marrow. The different tumour types display evidence for different mechanisms of transformation that reflect the normal biology of each B-cell stage. ^Indicates tumour types whose properties suggest derivation from two different stages of B-cell development. For splenic marginal zone lymphoma (SMZL) and diffuse large B-cell lymphoma (DLBCL), for which this was discovered recently, the data In the final two columns do not distinguish between the two B-cell stages. Data taken from Jaffe et al. (2001) except for (1) (Bahler etal., 2002), (2) (Klein etal., 2001), (3) (Allzadeh etal., 2000), (4) (Losses etal., 2000), (5) (PasqualuccI etal., 2001), (6) (Stein etal., 2000), (7) (Gertz etal., 2000) and (8) (Kuehl and Bergsagel, 2002).
40
1.1.3.1 Tumours of pre-B-cells
Precursor B-cell acute lymphoblastic leukaemia (B-ALL) is a neoplasm of pro- and pre-
B-cells (reviewed in Jaffe et al, 2001). In the vast majority of cases tumour cells
express TdT, involved in Ig rearrangement. Some have completed both heavy and light
chain rearrangement, others just heavy chain, suggesting transformation of different
stages of development (Korsmeyer et al, 1983). The earliest stage (early precursor B-
ALL) expresses CD 19, CD22, CD79a and human leukocyte antigen (HLA)-DR, the
intermediate stage (common ALL) also expresses CD 10 and the most mature stage (pre-
B-ALL) expresses cytoplasmic p heavy chains. Surface Ig is normally absent from all
stages.
Around one third of paediatric B ALL cases have altered numbers of chromosomes.
These are classified as either hypoploidy, hyperploidy with under 50 chromosomes or
hyperploidy with over 50 chromosomes. A number of different chromosomal
translocations are also associated with B ALL. These may be derived from mistakes
made during Ig rearrangement. The most common is the t(12;21)(pl3;q22) translocation
that fuses the gene encoding the TEL transcription factor with acute myeloid leukaemia
(AML) 1 (Golub et al, 1995, Romana et al, 1995, Shurtleff et al, 1995). AMLl
regulates transcription in normal haematopoiesis and its fusion with TEL impairs its
DNA binding activity, preventing its function (reviewed in Westendorf and Hiebert,
1999, Perry et al, 2002). The t(9;22)(q34;qll.2) translocation fuses the breakpoint
cluster region (bcr) gene with that encoding the tyrosine kinase Abelson murine
leukaemia (ABL) (Heisterkamp et al, 1983, Groffen et al, 1984, Prakash and Yunis,
1984, Shtivelman et al, 1985, Fainstein et al, 1987). The ABL virus encodes the
related oncogene product, v-ABL, and also causes pre-B-cell leukaemia. The bcr-ABL
fusion protein possesses elevated ABL tyrosine kinase activity that correlates with its
ability to transform cells (Lugo et al, 1990, Anderson and Mladenovic, 1996). This
may be due to the downstream activation of Ras, which is necessary for transformation
(Mandanas et al, 1993, Sawyers et al, 1995).
Two translocations fuse regulators of homeobox (HOX) gene expression with
transcriptional activators. Pre-B-cell leukaemic homeobox (PBX) 1 is the mammalian
homologue of extradenticle, required for HOX activity in Drosophila (Peifer and
Wieschaus, 1990). A quarter of childhood pre-B-ALL cases exhibit translocations that
41
fuse the E2A transcriptional regulator at 19pl3.3 with PBXl at lq23 (Nourse et al,
1990, Hunger et al, 1991). As discussed in section 1.1.1, E2A is a transcriptional
activator of B-cell development and, unlike PBXl, E2A-PBX1 activates transcription
from promoters with PBXl sites (Van Dijk et al, 1993). This property leads to
proliferation and transformation in transgenic mice (Dedera et al, 1993). The mixed-
lineage leukaemia (MLL) locus at llq23 is fused to other loci, such as AF4 at 4q21, in
a small number of B ALL cases (Djabali et al, 1992, Gu et al, 1992, McCabe et al,
1992, Tkachuk et al, 1992). Like PBXl, MLL regulates the expression of HOX genes
during development (Yu et al, 1998) and MLL fusion proteins act as dominant alleles
(Corral et al, 1996, Lavau et al, 1997, Dobson et al, 1999).
1.1.3.2 Tum ours of m ature B-cells
Tumours of mature naïve B-cells are relatively rare, probably reflecting the non
dividing and genetically stable nature of these cells. Mantle cell lymphoma (MCL) is
likely to be derived from mature naïve B-1 cells due to its immunophenotype (IgM+
IgD± CD 19+ CD5+ CD 10- BCL-6 ) (reviewed in Jaffe et al, 2001) and Ig gene status
(rearranged but normally unmutated) (Hummel et al, 1994). A translocation between
the cyclin D1 and IgH genes is observed in virtually all cases (Rimokh et al, 1994, Li et
al, 1999a), which leads to constitutive over-expression of cyclin D1 (Oka et al, 1994,
de Boer et al, 1995). Cyclin Dl, in a complex with cyclin dependent kinase (CDK) 4,
phosphorylates and inactivates Rb protein thus triggering entry into S phase of the cell
cycle. Around half of splenic marginal zone lymphomas (SMZLs) have unmutated Ig
heavy chains, indicating an origin from mature naïve B-cells (Bahler et al, 2002).
These tumour cells express surface IgM, IgD, CD20 and CD79a in the absence of CD5,
CDIO, CD23 and cyclin Dl (reviewed in Jaffe et al, 2001).
1.1.3.3 Tum ours of GC B-cells
Most human B-cell tumours are derived from cells at the GC or post-GC stage of
development. This suggests that the GC is a particularly tumourigenic environment. GC
B-cells undergo rapid clonal expansion and generate double-stranded DNA breaks
during class switching, somatic hypermutation and receptor editing. This puts the cell at
risk for the generation of oncogenic chromosomal translocations. Also, somatic
hypermutation of a non-Ig locus could result in an oncogenic mutation. Any alteration
42
that renders the cell independent of normal selection in the GC or that maintains the GC
phenotype can therefore give rise to a continuously proliferating tumour.
Burkitt’s lymphoma (BL)
BL cells express CD19, CDIO and BCL-6, indicative of a GC B-cell origin (reviewed in
Rickinson and Kieff, 2001). The common expression of CD77 and non-class-switched
IgM indicates transformation of a centroblast rather than centrocyte. Also, Ig sequences
in BL exhibit intra-clonal diversity, characteristic of ongoing hypermutation (Klein et
ai, 1995, Tamaru et al, 1995). All BL cases show one of three translocations that bring
the c-myc proto-oncogene under the control of the IgH, IgL X or IgL K promoter (Zech
et al, 1976). The break-points in sporadic BL tend to be within the Ig switch region,
suggesting an error during class-switch recombination (Magrath, 1990). Breakages in
endemic BL chromosomes are more often within J region introns or rearranged V(D)J
sequences characteristic of somatic hypermutation (Goossens et al, 1998). In all cases,
translocation results in the constitutive expression of c-myc, driving continuous cellular
proliferation and preventing differentiation. In some cases, the coding region of the c-
myc is also mutated, possibly due to somatic hypermutation in the neighbouring Ig
locus (Yano et al, 1993, Bhatia et al, 1995, Hoang et al, 1995). Although present in
96% of BL in Africa (endemic BL), EBV is only associated with 20% of cases in North
America and Europe (Sixbey, 2000). The virus is also associated with 25-40% of AIDS-
associated BL (Raphael et al, 1991). As only a subset of cases involve EBV, the virus
would appear to be acting as a cofactor to myc dysregulation. The provision of B-cell
survival signals by LMP-1 and LMP-2A may aid transformation (see section 1.1.2).
EBNA-1 may also promote the acquisition of mutations through the enhancement of
RAG expression (Srinivas and Sixbey, 1995).
Follicular lymphoma (FL)
FL is also derived from GC B-cells. The tumour cells express CD19, CDIO and BCL-6
and exhibit ongoing somatic hypermutation (Zelenetz et al, 1992). FL possesses a
characteristic t(14;I8) translocation that juxtaposes the anti-apoptotic gene Bcl-2 and
the J region of IgH (Tsujimoto et al, 1984, Tsujimoto et al, 1985). This renders the
tumour cells resistant to signals that would otherwise promote apoptosis (Nunez et al,
1990). Unlike c-myc translocations in BL, the breakpoint involved in this translocation
43
is located at the 5’ end of J or D heavy chain segments. These are therefore likely to
reflect mistakes occurring during receptor editing in the GC (Han et al, 1997a,
Papavasiliou et al, 1997).
Diffuse large B-cell lymphoma (DLBCL)
DLBCL accounts for around 40% of cases of non-Hodgkin’s lymphoma (NHL) in the
West. Microarray analysis has demonstrated that DLBCL is made up of two distinct
tumour types; one resembling GC B-cells (GC B-like DLBCL) and one resembling
activated B-cells (activated B-like DLBCL) (Alizadeh et al, 2000, see section 1.3.5.1).
Both forms have somatically mutated Ig genes, but this is ongoing in GC B-like
DLBCL (Lossos et al, 2000). The GC form also expresses BCL-6. The t(14;18)
translocation occurs in 20-30% of cases and another 30% have translocations involving
BCL-6 (Ye et al, 1993, Ye et al, 1995). As is the case for c-myc translocations,
breakages around BCL-6 are probably formed during class switching. In addition, BCL-
6 and other proto-oncogenes, such as c-myc, RhoH and Pax5, are often mutated in a
manner reminiscent of somatic hypermutation (Migliazza et al, 1995, Pasqualucci et
al, 1998, Pasqualucci et al, 2001).
1.1.3.4 Tum ours of post-GC B-cells
Hodgkin’s lymphoma (HL)
For over a century the cellular origin of Hodgkin’s disease remained enigmatic. The
discovery that the Hodgkin and Reed-Stemberg (HRS) tumour cells contained
rearranged Ig genes revealed the disease to be a B-cell lymphoma (Kuppers et al, 1994,
Kanzler et al, 1996) and the disease has been renamed Hodgkin’s lymphoma (HL)
accordingly. HL comprises two distinct disease entities; nodular lymphocyte-
predominant HL and classical HL. As discussed for DLBCL, tumours derived from
post-GC B-cells can be distinguished from those derived from GC B-cells by the
presence of hypermutated but clonal Ig genes. The analysis of Ig gene sequences in HL
demonstrated that nodular lymphocyte-predominant HL is a malignancy of GC B-cells.
The tumour is composed of lymphocytic and histiocytic (L&H) HRS cells that show
evidence of ongoing somatic hypermutation (Braeuninger et al, 1997, Marafioti et al,
1997, Ohno et al, 1997) and express BCL-6 (Falini et al, 1996). In contrast, the Ig
44
genes of classical HRS cells are mutated but this process is no longer occurring
(Kanzler et al, 1996, Marafioti et al, 2000) and the cells do not express BCL-6
(Carbone et al, 1998b). The Ig gene mutations either disrupt the open reading frame
(ORF) or regulatory region preventing their expression (Kuppers et al, 1994, Kanzler et
al, 1996, Marafioti et al, 2000). These cells should therefore have been lost in the GC.
However, classical HRS cells contain constitutively active NF-kB that prevents
apoptosis by inducing the expression of Bfl-1 and Bcl-xL (Bargou et al, 1996, Bargou
et al, 1997). This can be due to loss-of-function mutations of inhibitor of NF-kB (IkB)
(Cabannes et al, 1999, Emmerich et al, 1999, Jungnickel et al, 2000), activation of
IkB kinase (Krappmann et al, 1999) or over-expression of TRAFl (Durkop et al,
1999).
A link between classical HL and EBV infection was first suggested due to the risk
associated with a history of IM (Gutensohn and Cole, 1980). The virus can be detected
in around 50% of cases in the West and nearly 100% of cases in Africa, Asia and South
America (Ambinder et al, 1993, Weinreb et al, 1996, Hayashi et al, 1997). The virus
is specifically found in HRS cells in classical HL and not the surrounding infiltrate
(Weiss et al, 1987, Anagnostopoulos et al, 1989, Weiss et al, 1989, Wu et al, 1990).
EBV sequences are clonal indicating that infection preceded expansion (Boiocchi et al,
1993). The virus exhibits type II latency and thus expresses the NF-KB activator LMP-1
(Niedobitek et al, 1991a, Pallesen et al, 1991). LMP-1 also promotes turnover of IkB
(Sylla et al, 1998). Therefore, NF-kB activation, as a result of mutation or virus
infection, may be a common requirement for classical HL tumourigenesis. It has also
been demonstrated that LMP-1-induced down-regulation of CD99 in B-cells is
sufficient to generate a HRS cell phenotype (Kim et al, 1998, Kim et al, 2000). The
delivery of survival signals from LMP-2A may also contribute to the survival of
otherwise crippled HRS B-cells.
Anaplastic large cell lymphoma (ALCL) is a tumour of T-cells. A distinct group of
tumours within this classification were found to instead derive from B-cells and have
been reclassified as anaplastic-DLBCL (reviewed in Stein et al, 2000). Tumour cells
have mutated Ig genes (Kuze et al, 1998) and resemble HRS cells both
morphologically and in the expression of Pax5 (Krenacs et al, 1998, Foss et al, 1999)
suggesting a similar derivation. As with classical HL, EBV DNA (Hummel et al, 1995,
Kuze et al, 1996) and LMP-1 (Lazzi et al, 1998) are frequently detected.
45
B-cell lymphoproliferative d isorder (BLPD)
EBV is associated with a further tumour of post-GC B-cells, BLPD, that can form in
immunosuppressed individuals. Those at risk include transplant recipients, where it is
termed post-transplant lymphoproliferative disorder (PTLD) (Lucas et al, 1997), those
suffering from AIDS (Beral et al, 1991, Gaidano et al, 1998) or those with hereditary
mutations in SLAM-associated protein (SAP), where it is termed X-linked
lymphoproliferative disease (XLP) (Purtilo et al, 1975, Hamilton et al, 1980). At least
90% of PTLD and 80% of AIDS-associated BLPD are infected with EBV (Rickinson
and Kieff, 2001). In both cases, the proliferation of EBV infected cells is associated
with the loss of EBV-specific CTL activity (Hague et al, 1997, Perera et al, 1998).
Immunostaining usually demonstrates a type III latency pattern, consistent with the
lymphoblastoid appearance of the cells (Young et al, 1989, Hamilton-Dutoit et al,
1991, Hamilton-Dutoit et al, 1993). BLPD cases in AIDS patients contain mutated Ig
genes indicating a post-GC origin (Delecluse et al, 1999). Type III latency is not
observed in post-GC B-cells in healthy hosts but is a characteristic of IM (section
1.1.2). Therefore, as is the case for IM, the tumour may reflect the inappropriate
induction of type III latency in memory B-cells due to a failure of immune control
(Thorley-Lawson, 2001).
Tum ours of memory B-cells
Half of spleen marginal zone lymphoma (SMZL) cases have somatically hypermutated
Ig (Bahler et al, 2002), suggesting they may be derived from MZ memory B-cells.
Similarly chronic lymphocytic leukaemia (CLL) also exhibits Ig mutations in around
50% of cases (Schroeder and Dighiero, 1994, Oscier et al, 1997, Fais et al, 1998).
CLL was thought to derive from B-1 cells due to the expression of CD5 (Dighiero et al,
1996) but microarray analysis has suggested that CLL is instead derived from memory
B-cells (Klein et al, 2001). Therefore, unmutated CLL may be derived from GC-
independent memory B-cells (Toyama et al, 2002). Hairy cell leukaemia (HCL)
expresses class-switched (Kluin-Nelemans et al, 1990) hypermutated Ig (Maloum et
al, 1998), characteristic of post-GC B-cells. The chronic, indolent nature of HCL
suggests it may have a similar cell of origin as CLL.
46
1.1.3.5 Tumours of plasma cells
Tumours of post-GC plasma cells maintain many of the features of this cell type
including secretion of Ig (usually IgG) and expression of CD38 and CD 138 in the
absence of B-cell markers (reviewed in Jaffe et al, 2001). The Ig genes are highly
mutated with evidence for selection by antigen (Bakkus et al, 1992, Vescio et al,
1995). Plasma cell malignancies include multiple myeloma (MM), plasma cell
leukaemia (PCL) and plasmacytoma, which represent different sites of presentation of
the same disease, and Waldenstrom macroglobulinemia (lymphoplasmacytic
lymphoma).
Waldenstrom macroglobulinemia is a rare condition typically diagnosed by monoclonal
serum IgM secreted by the tumour cells. Although rarely class-switched, Ig sequences
usually show evidence of somatic hypermutation. A translocation between
chromosomes 9 and 14 involving the B-cell transcription factor Pax5 is reported in 50%
of cases (lida et al, 1996, lida et al, 1999).
Most MM tumours have translocations involving an Ig switch region suggesting the
initial transforming event occurred in the GC (Bergsagel et al, 1996). The translocation
partner is usually a member of one of three groups of genes; cyclin D genes (Dl at
llq l3 , D2 at 12pl3 or D3 at 6p21) (Chesi et al, 1996, Shaughnessy et al, 2001),
multiple myeloma SET domain protein (MMSET) or fibroblast growth factor receptor 3
(FGFR3) at 4pl6 (Chesi et al, 1997, Chesi et al, 1998) and the b-ZIP transcription
factors c-Maf or MAFB at 16q23 and 20qll respectively (Chesi et al, 1998, Hanamura
et al, 2001). C-myc expression is elevated by further complex translocations late during
MM tumour progression (Foumey et al, 1990, Nobuyoshi et al, 1991, Shou et al,
2000). Unlike the translocations involving Ig loci, these are unlikely to represent errors
of B-cell specific DNA-modification mechanisms (Bergsagel and Kuehl, 2001).
Constitutive activation of the mitogen-activated protein kinase (MAPK) pathway is a
common property of MM cells. Mutations that activate the N-ras or Kras2 proto
oncogenes are present in 40% of MM tumours (Liu et al, 1996, Chesi et al, 2001). The
MAPK pathway is also activated by MM-associated FGFR3 mutations (Chesi et al,
2001). Furthermore, both IL-6 (Kawano et al, 1988, Klein et al, 1989) and insulin-like
growth factor 1 (IGFl) (Georgii-Hemming et al, 1996, Ferlin et al, 2000, Ge and
47

Rudikoff, 2000) stimulate MM cell proliferation and survival through MAPK. IL-6 acts
during normal B-cell development as a plasmablast growth and survival factor (Jego et
al, 2001) and is produced by bone marrow stromal cells after plasma cell adhesion
(Uchiyama et al, 1993). IGFl is also produced by stromal cells and attracts plasma
cells to the bone marrow (Asosingh et al, 2000). Therefore, MM pathogenesis may
depend on its local environment and reflect the constitutive activation of normal plasma
cell survival pathways.
48
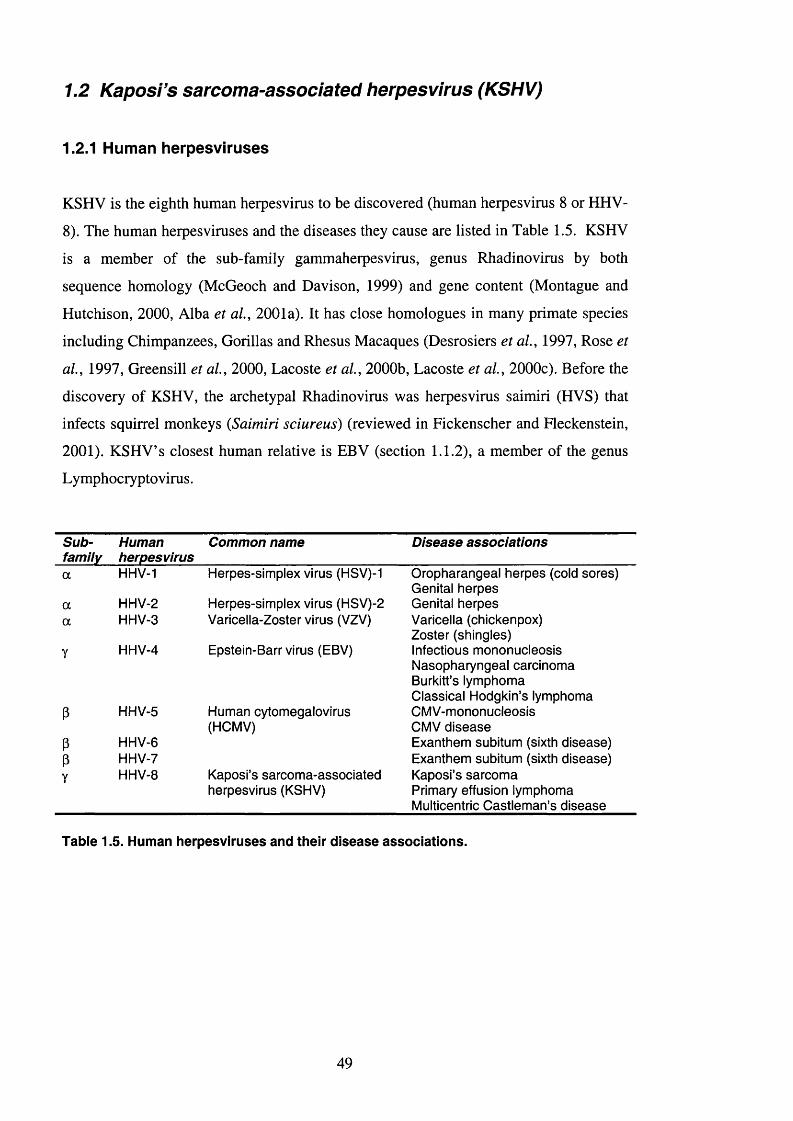
1.2 Kaposi's sarcoma-associated herpesvirus (KSHV)
1.2.1 Human herpesv iruses
KSHV is the eighth human herpesvirus to be discovered (human herpesvirus 8 or HHV-
8). The human herpesviruses and the diseases they cause are listed in Table 1.5. KSHV
is a member of the sub-family gammaherpesvirus, genus Rhadinovirus by both
sequence homology (McGeoch and Davison, 1999) and gene content (Montague and
Hutchison, 2000, Alba et al, 2001a). It has close homologues in many primate species
including Chimpanzees, Gorillas and Rhesus Macaques (Desrosiers et al, 1997, Rose et
al, 1997, Greensill et al, 2000, Lacoste et al, 2000b, Lacoste et al, 2000c). Before the
discovery of KSHV, the archetypal Rhadinovirus was herpesvirus saimiri (HVS) that
infects squirrel monkeys {Saimiri sciureus) (reviewed in Fickenscher and Fleckenstein,
2001). KSHV’s closest human relative is EBV (section 1.1.2), a member of the genus
Lymphocrypto virus.
Sub Human Common name Disease associationsfam ily herpesvirusa HHV-1 Herpes-simplex virus (HSV)-I Oropharangeal herpes (cold sores)
Genital herpesa HHV-2 Herpes-simplex virus (HSV)-2 Genital herpesa HHV-3 Varicella-Zoster virus (VZV) Varicella (chickenpox)
Zoster (shingles)Y HHV-4 Epstein-Barr virus (EBV) Infectious mononucleosis
Nasopharyngeal carcinoma Burkitfs lymphoma Classical Hodgkin’s lymphoma
P HHV-5 Human cytomegalovirus CMV-mononucleosis(HCMV) CMV disease
P HHV-6 Exanthem subitum (sixth disease)P HHV-7 Exanthem subitum (sixth disease)Y HHV-8 Kaposi’s sarcoma-associated
herpesvirus (KSHV)Kaposi’s sarcoma Primary effusion lymphoma Multicentric Castleman’s disease
Table 1.5. Human herpesviruses and their disease associations.
49
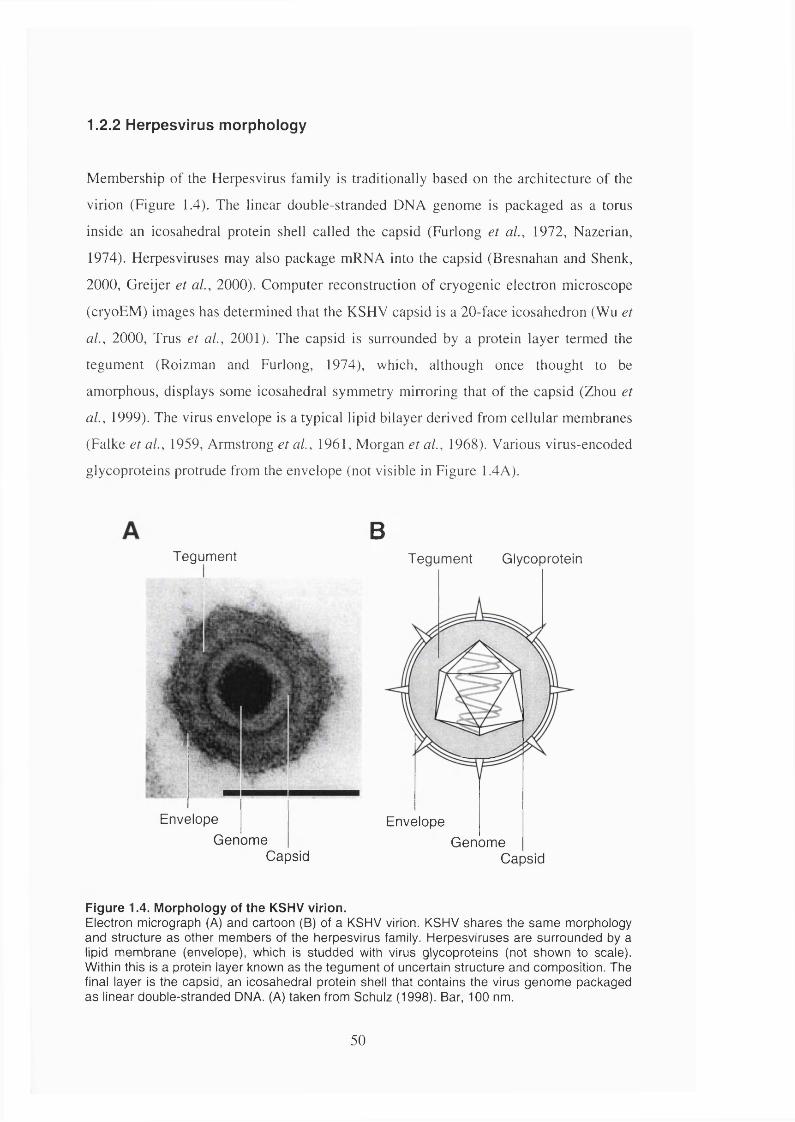
1.2.2 Herpesvirus morphology
Membership o f the Herpesvirus family is traditionally based on the architecture o f the
virion (Figure 1.4). The linear double-stranded D N A genom e is packaged as a torus
inside an icosahedral protein shell called the capsid (Furlong et al , 1972, Nazerian,
1974). Herpesviruses may also package mRNA into the capsid (Bresnahan and Shenk,
2000, Greijer et ai , 2000). Computer reconstruction o f cryogenic electron microscope
(cryoEM ) images has determined that the KSHV capsid is a 20-face icosahedron (Wu et
al, 2000, Trus et al , 2001). The capsid is surrounded by a protein layer termed the
tegument (Roizman and Furlong, 1974), which, although once thought to be
amorphous, displays some icosahedral symmetry mirroring that o f the capsid (Zhou et
al, 1999). The virus envelope is a typical lipid bilayer derived from cellular membranes
(Falke et al , 1959, Armstrong et al , 1961, Morgan et al , 1968). Various virus-encoded
glycoproteins protrude from the envelope (not visible in Figure 1.4A).
BTegument Tegument Glycoprotein
EnvelopeGenome
Capsid
EnvelopeGenome
Capsid
Figure 1.4. Morphology of the KSHV virion.Electron micrograph (A) and cartoon (B) of a KSHV virion. KSHV shares the same morphology and structure as other members of the herpesvirus family. Herpesviruses are surrounded by a lipid membrane (envelope), which is studded with virus glycoproteins (not shown to scale). Within this is a protein layer known as the tegument of uncertain structure and composition. The final layer is the capsid, an icosahedral protein shell that contains the virus genome packaged as linear double-stranded DNA. (A) taken from Schulz (1998). Bar, 100 nm.
50
1.2.3 The KSHV genome
The KSHV genome consists of a 140.5 kilobase (kb) long unique coding region (LUR)
flanked by multiple GC rich -800 base-pair (bp) terminal repeats (TR) (Russo et al,
1996), giving a total estimated size of around 170 kb (Renne et al, 1996a, Figure 1.5).
Open reading frame (ORF) analysis of the viral genome determined that it contains 81
ORFs of greater than 100 amino acids (Russo et al, 1996), although it is not known
exactly how many form exons or complete genes. Of these ORFs, 66 have homologues
in the related rhadinovirus HVS and are numbered based on HVS nomenclature. ORFs
thought to be unique for KSHV were named K1 to K15 although K8 and K13 were
subsequently found to have homologues and additional unique ORFs (K4.1, K4.2, K8.1,
KlO.l, K10.5, K ll.l and K14.1) have since been included. Genes conserved in all
sequenced herpesviruses are grouped in 7 blocks in the genome with sub-family, genus
and virus specific genes in between (Chee et al, 1990, Russo et al, 1996). Function has
been assigned to many of the genes based on the known roles of homologues in other
herpesviruses but the exact role of around half is presently unknown (summarised in
Table 1.6).
51
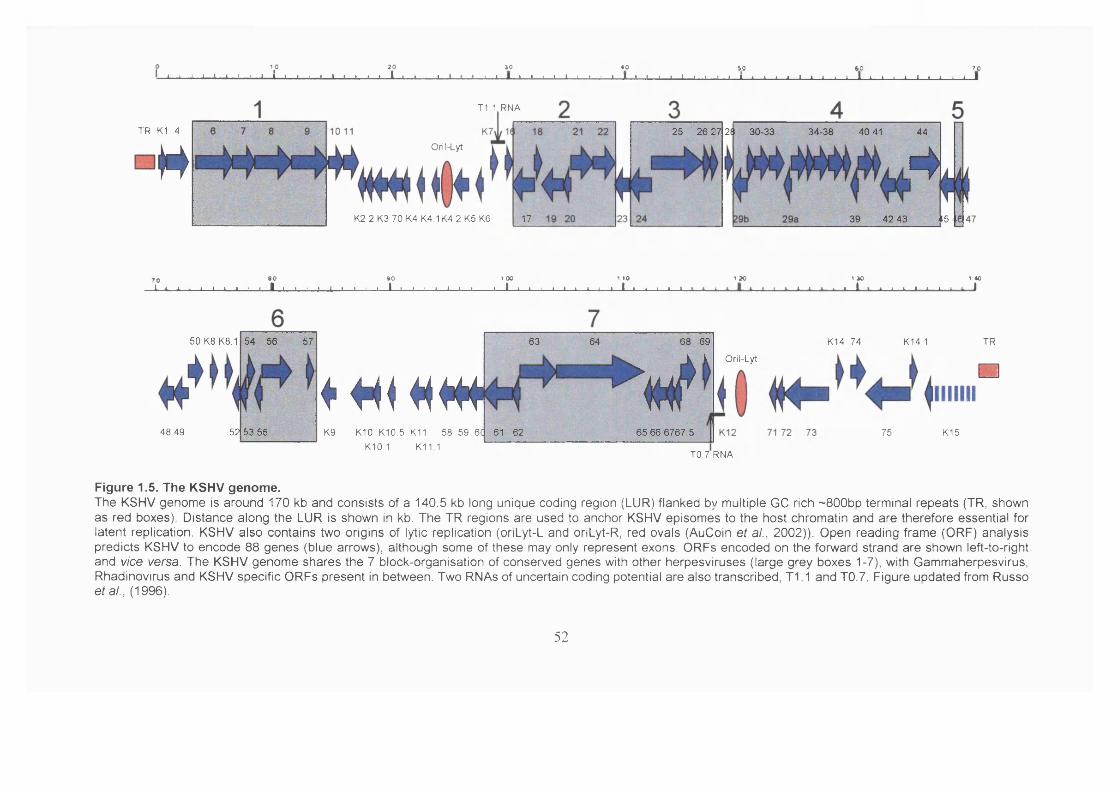
10 20
J 1----- 1-----1-----1-----1-----1------ !— J--- 1-----1___ I___ I___ l _ _ l ___I___I-----1------1---1— I------ 1 I L.JO 4 0 5 0 6 0 7 0
I. . 1 .. 1 — I 1----- 1----- 1------1----- 1------1----- 1------1-------1— I----! L. J i I 1------ 1----- 1----- 1 i, .1 i___ I I I___ I____L . 1 , ,1 i , I ■ » » ■ ' ' I___ I
TR K1 4HT1.1 RNA
Oril-Lyt
K2 2 K3 70 K4 K4 1K4.2 K5 K6 17
25 26 27 23 30-33 34-38 40 41 44
439 42 43 *5 ■ «
TO 6 0 9 0 1 00 1 1 0 1 2 0 1 JO 1 4 0
I X A n i t 1 I 1 ■ I I I I • I 1 I 1-----------1-----1---- 1----- 1-----1-----1----- 1-----1----- 1-----1-----1-----i 1 1 1 1 1 1 1 1 1 i— I 1 1 1 1 X ..A , X . x , 1. Am i . A . i — 1 - X — J
50 KB KB. 1 54 56 57
48 49 5 2 5 3 55
63 64 6B 69
^ k k
*4! 41#*K9 K10 K10.5 K11 58 59 6C 61 62
V65 66 6767.5 ||
K10.1 K i l l
Oril-Lyt
K14 74 K14.1 TR
n
75 K15
TO.7 RNA
Figure 1.5. The KSHV genome.The KSHV genome is around 170 kb and consists of a 140.5 kb long unique coding region (LUR) flanked by multiple GC rich ~800bp terminal repeats (TR, shown as red boxes). Distance along the LUR is shown in kb. The TR regions are used to anchor KSHV episomes to the host chromatin and are therefore essential for latent replication. KSHV also contains two origins of lytic replication (oriLyt-L and oriLyt-R, red ovals (AuCoin et al., 2002)). Open reading frame (ORF) analysis predicts KSHV to encode 88 genes (blue arrows), although some of these may only represent exons. ORFs encoded on the forward strand are shown left-to-right and vice versa. The KSHV genome shares the 7 block-organisation of conserved genes with other herpesviruses (large grey boxes 1-7), with Gammaherpesvirus, Rhadinovirus and KSHV specific ORFs present in between. Two RNAs of uncertain coding potential are also transcribed. T i l and T0.7. Figure updated from Russo eta!., (1996).
52
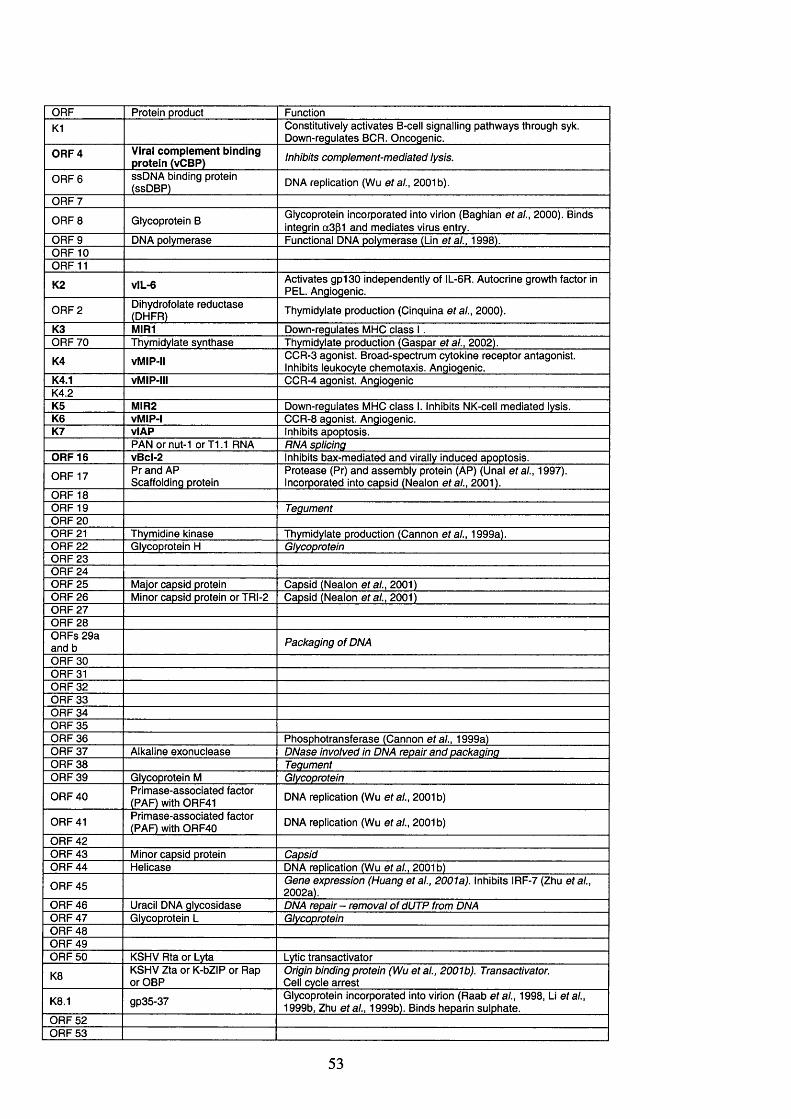
ORF Protein product Function
K l Constitutively activates B-cell signailing pathways through syk. Down-regulates BCR. Oncogenic.
O R F 4 V ira l com plem ent binding protein (vCB P) I n h ib i t s c o m p l e m e n t - m e d i a t e d i y s i s .
O R F 6 ssDNA binding protein (ssDBP) DNA replication (W u e t a i . , 2001b).
O R F 7
O R F 8 Glycoprotein BGlycoprotein incorporated into virion (Baghian e t a i . , 2000). Binds integrin a331 and m ediates virus entry.
O R F 9 DNA polymerase Functional DNA polymerase (Lin e t a i . , 1998).O R F 10O R F 11
K2 vlL -6 Activates gp130 independently of IL-6R. Autocrine growth factor in PEL. Angiogenic.
O R F 2 Dihydrofolate reductase (D HFR ) Thymidylate production (Cinquina e t a i , 2000).
K3 MIR1 Down-regulates M HO class 1.O R F 70 Thymidylate synthase Thymidylate production (Gaspar e t a i . , 2002).
K4 vM IP-ll C C R -3 agonist. Broad-spectrum cytokine receptor antagonist. Inhibits leukocyte chemotaxis. Angiogenic.
K4.1 vM IP 'lll C C R -4 agonist. AngiogenicK4.2K5 M IR 2 Down-regulates MHO class 1. Inhibits NK-cell mediated lysis.K6 vM IP-l C C R -8 agonist. Angiogenic.K7 vlAP Inhibits apoptosis.
PAN or nut-1 or T1.1 RNA R N A s p a c i n g
O R F 16 vB cl-2 Inhibits bax-m ediated and virally induced apoptosis.
O R F 17 Pr and AP Scaffolding protein
Protease (Pr) and assembly protein (AP) (Unal e t a i . , 1997). Incorporated into capsid (Nealon e t a i . , 2001).
O R F 18O R F 19 T e g u m e n t
O R F 20O R F 21 Thymidine kinase Thymidylate production (Cannon e t a i . , 1999a).O R F 22 Glycoprotein H G l y c o p r o t e i n
O R F 23O R F 24O R F 25 Major capsid protein Capsid (Nealon e t a i . , 2001)O R F 26 Minor capsid protein or TR I-2 Capsid (Nealon e t a i . , 2001)O R F 27O R F 28O R Fs 29a and b P a c k a g i n g o f D N A
O R F 30O R F 31O R F 32O R F 33O R F 34O R F 35O R F 36 Phosphotransferase (Cannon e t a i . , 1999a)O R F 37 Aikaline exonuclease D N a s e i n v o l v e d in D N A r e p a i r a n d p a c k a g i n g
O R F 38 T e g u m e n t
O R F 39 Glycoprotein M G l y c o p r o t e i n
O R F 40 Primase-associated factor (PAF) with 0R F 41 DNA replication (W u e t a i . , 2001b)
O R F 41 Primase-associated factor (PAF) with O R F40 D NA replication (W u e t a i . , 2001b)
O R F 42O R F 43 Minor capsid protein C a p s i d
O R F 44 Helicase DNA replication (W u e t a i . , 2001b)
O R F 45 G e n e e x p r e s s i o n ( H u a n g e t a l . , 2 0 0 1 a ) . Inhibits IR F-7 (Zhu e t a l . , 2002a).
O R F 46 Uracil DNA glycosidase D N A r e p a i r - r e m o v a l o f d U T P f r o m D N AO R F 47 Glycoprotein L G l y c o p r o t e i n
O R F 48O R F 49O R F 50 K SHV Rta or Lyta Lytic transactivator
K8 K SHV Zta or K-bZIP or Rap or OBP
O r ig in b i n d i n g p r o t e i n ( W u e t a i . , 2 0 0 1 b ) . T r a n s a c t i v a to r . Cell cycle arrest
K8.1 gp35-37 Glycoprotein incorporated into virion (Raab e t a i . , 1998, Li e t a i . ,
1999b, Zhu e t a i . , 1999b). Binds heparin sulphate.O R F 52O R F 53
53
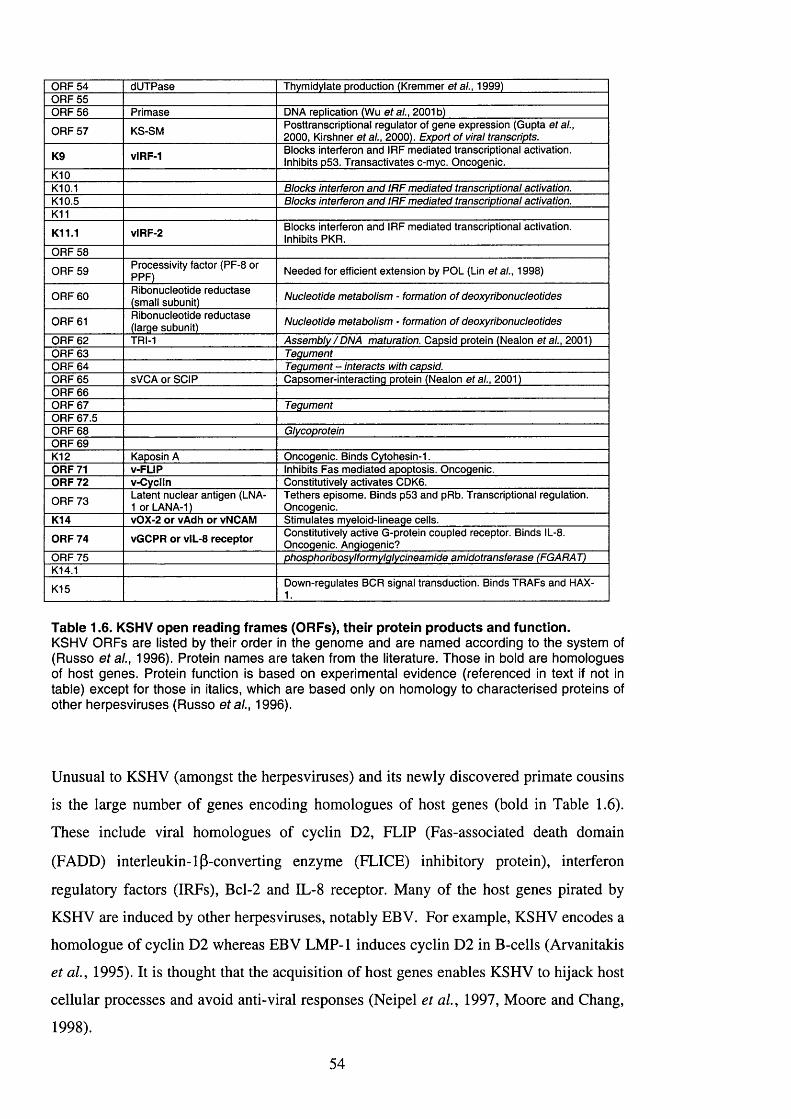
O R F 54 dUTPase Thymidylate production (Kremmer e t a i . , 1999)O R F 55O R F 56 Primase DNA replication (W u e t a i . , 2001b)
O R F 57 KS-SMPosttranscriptional regulator of gene expression (Gupta e t a i . ,
2000, Kirshner a t a ! ., 2000). E x p o r t o f v ir a l t r a n s c r i p t s .
K9 vlRF-1 Blocks interferon and IR F mediated transcriptional activation. Inhibits p53. Transactivates c-myc. Oncogenic.
K10K10.1 B l o c k s i n t e r f e r o n a n d I R F m e d i a t e d t r a n s c r i p t i o n a l a c t i v a t i o n .
K10.5 B l o c k s i n t e r f e r o n a n d I R F m e d i a t e d t r a n s c r i p t i o n a l a c t i v a t i o n .
K11
K11.1 vlRF-2 Blocks interferon and IRF mediated transcriptional activation. Inhibits PKR.
O R F 58
O R F 59Processivity factor (PF-8 or PPF)
Needed for efficient extension by POL (Lin e t a i . , 1998)
O R F 60Ribonucleotide reductase (small subunit)
N u c l e o t i d e m e t a b o l i s m - f o r m a t io n o f d e o x y r i b o n u c i e o t i d e s
O R F 61Ribonucleotide reductase (large subunit)
N u c l e o t i d e m e t a b o l i s m - f o r m a t io n o f d e o x y r i b o n u c i e o t i d e s
O R F 62 TRI-1 A s s e m b l y / D N A m a tu r a t io n . Capsid protein (Nealon e t a i . , 2001)O R F 63 T e g u m e n t
O R F 64 T e g u m e n t - i n t e r a c t s w i th c a p s i d .
O R F 65 SVGA or SCIP Capsomer-interacting protein (Nealon e t a i . , 2001)O R F 66O R F 67 T e g u m e n t
O R F 67.5O R F 68 G l y c o p r o t e i n
O R F 69K12 Kaposin A Oncogenic. Binds Cytohesin-1.ORF 71 v-FLIP Inhibits Fas m ediated apoptosis. Oncogenic.ORF 72 v-Cyclln Constitutively activates CDK6.
O R F 73Latent nuclear antigen (LNA- 1 or LANA-1)
Tethers episome. Binds p53 and pRb. Transcriptional regulation. Oncogenic.
K14 vOX-2 or vAdh or vNCAM Stimulates myeloid-lineage cells.
ORF 74 vGCPR or viL-8 receptor Constitutively active G-protein coupled receptor. Binds IL-8. Oncogenic. Angiogenic?
O R F 75 p h o s p h o r i b o s y l f o r m y l g l y c i n e a m i d e a m i d o t r a n s f e r a s e ( F G A R A T )
K14.1
K15Down-regulates BCR signal transduction. Binds TRAFs and HAX- 1.
Table 1.6. KSHV open reading frames (ORFs), their protein products and function.KSHV ORFs are listed by their order in the genome and are named according to the system of (Russo et al., 1996). Protein names are taken from the literature. Those in bold are homologues of host genes. Protein function is based on experimental evidence (referenced in text if not in table) except for those in italics, which are based only on homology to characterised proteins of other herpesviruses (Russo etai., 1996).
Unusual to KSHV (amongst the herpesviruses) and its newly discovered primate cousins
is the large number of genes encoding homologues of host genes (bold in Table 1.6).
These include viral homologues of cyclin D2, FLIP (Fas-associated death domain
(FADD) interleukin-ip-converting enzyme (FLICE) inhibitory protein), interferon
regulatory factors (IRFs), Bcl-2 and IL-8 receptor. Many of the host genes pirated by
KSHV are induced by other herpesviruses, notably EBV. For example, KSHV encodes a
homologue of cyclin D2 whereas EBV LMP-1 induces cyclin D2 in B-cells (Arvanitakis
et ai, 1995). It is thought that the acquisition of host genes enables KSHV to hijack host
cellular processes and avoid anti-viral responses (Neipel et al, 1997, Moore and Chang,
1998).
54
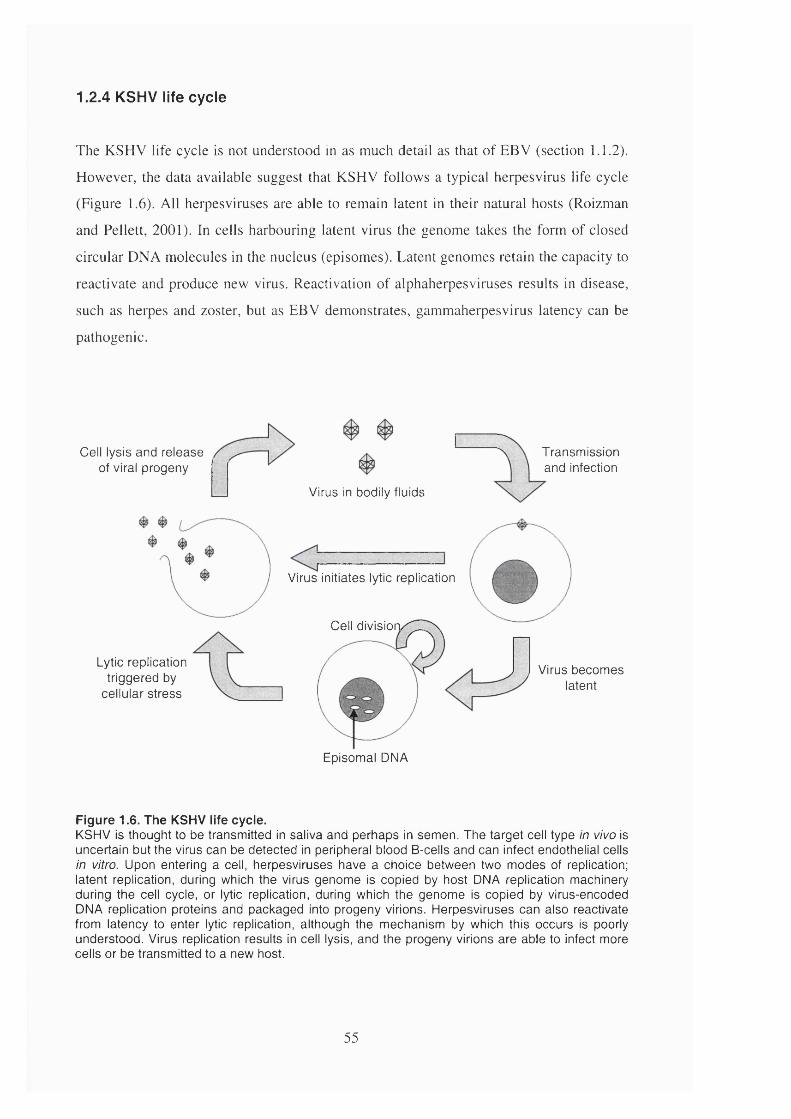
1.2.4 KSHV life cycle
The KSHV life cycle is not understood in as much detail as that o f EBV (section 1.1.2).
However, the data available suggest that KSHV follow s a typical herpesvirus life cycle
(Figure 1.6). All herpesviruses are able to remain latent in their natural hosts (Roizman
and Pellett, 2001). In cells harbouring latent virus the genom e takes the form o f closed
circular D N A m olecules in the nucleus (episom es). Latent genom es retain the capacity to
reactivate and produce new virus. Reactivation o f alphaherpesviruses results in disease,
such as herpes and zoster, but as EBV demonstrates, gammaherpesvirus latency can be
pathogenic.
Cell lysis and release of viral progeny
Virus in bodily fluids
Lytic replication triggered by
cellular stress
Virus initiates lytic replication
Cell d iv is io rv ^ Z ^
Transmission and infection
Virus becomes latent
Episomal DNA
Figure 1.6. The KSHV life cycle.KSHV is thought to be transmitted in saliva and perhaps in semen. The target cell type in vivo is uncertain but the virus can be detected in peripheral blood B-cells and can infect endothelial cells in vitro. Upon entering a cell, herpesviruses have a choice between two modes of replication; latent replication, during which the virus genome is copied by host DNA replication machinery during the cell cycle, or lytic replication, during which the genome is copied by virus-encoded DNA replication proteins and packaged into progeny virions. Herpesviruses can also reactivate from latency to enter lytic replication, although the mechanism by which this occurs is poorly understood. Virus replication results in cell lysis, and the progeny virions are able to infect more cells or be transmitted to a new host.
55
1.2.4.1 Virus entry
Initial binding of KSHV to the cell surface is through heparin sulphate and is necessary
for virus infection of human foreskin fibroblasts (HFF), 293 cells and B-cells (Akula et
al, 2001b). This interaction is mediated by the KSHV glycoproteins gB and gp35-37
(Akula et al, 2001a). Akula et al, (2002) have shown that virus entry involves gB-
mediated interaction with integrin a3|3l. Infection can be competed with the natural
ligand fibronectin, specific antibodies and soluble integrin. Integrin a3pi is expressed on
in vitro target cells of KSHV and transfection of human integrin a3 into hamster CHO-
B2 cells enhances infection. However, the absence of complete inhibition by any
blocking method and the limited 2-3 fold increase in infection observed by expression of
integrin a3 suggests that other receptors have yet to be found. Electron microscopy of
infected endothelial cells shows that KSHV enters the cell by membrane fusion or
endocytosis (Dezube et al, 2002). By analogy to herpes-simplex virus 1 (HSV-1), entry
by the endosomal route is unlikely to be productive (Campadelli-Fiume et al, 1988).
1.2.4.2 Establishm ent of latency
Following virus entry, linear herpesvirus genome translocates to the nucleus. By analogy
with EBV, the virus genes transcribed in response to the cellular environment determine
whether the virus enters a state of relative quiescence known as latency, or whether it
begins the programme of lytic gene expression. During latency KSHV exists in the
nucleus as closed circular episomal DNA (Decker et al, 1996, Renne et al, 1996a). It is
thought that the host DNA replication machinery copies the viral DNA early during S
phase as is the case for EBV (Hampar et al, 1974, Gussander and Adams, 1984). The
initial amplification of the one infecting KSHV genome to the 40 or more present in PEL
cells (Cesarman et al, 1995a) probably occurs during the first round of cellular DNA
replication following infection. During mitosis, KSHV DNA is tethered through the TR
sequences to histone HI on host chromatin via the KSHV-encoded latent nuclear antigen
(LNA-1) (Ballestas et al, 1999, Cotter and Robertson, 1999, Ballestas and Kaye, 2001).
LNA-1 is therefore the functional homologue of EBV EBNA-1. During latency,
herpesvirus gene expression is typically restricted to only a few genes (Roizman and
Pellett, 2001). The number of latent genes varies between herpesviruses; HSV-1
expresses only presumed non-coding latency-associated transcripts (LATs) (Wagner et
56
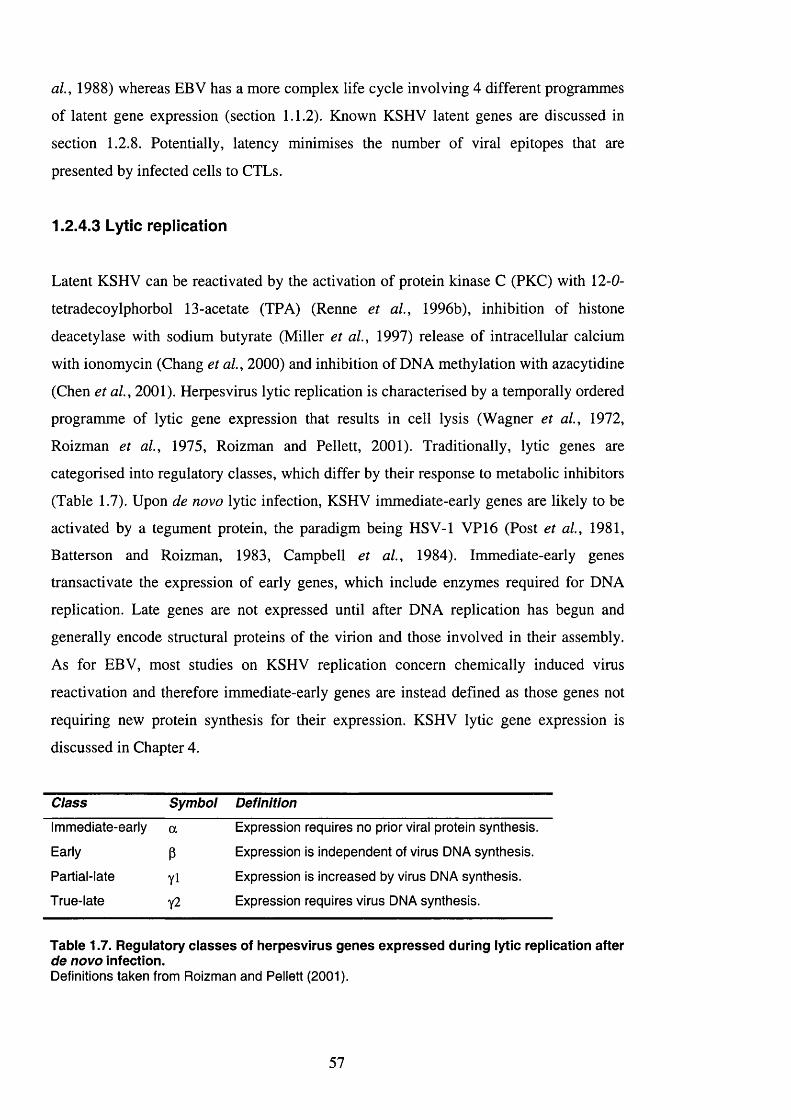
al, 1988) whereas EBV has a more complex life cycle involving 4 different programmes
of latent gene expression (section 1.1.2). Known KSHV latent genes are discussed in
section 1.2.8. Potentially, latency minimises the number of viral epitopes that are
presented by infected cells to CTLs.
1.2.4.3 Lytic replication
Latent KSHV can be reactivated by the activation of protein kinase C (PKC) with 12-0-
tetradecoylphorbol 13-acetate (TPA) (Renne et al, 1996b), inhibition of histone
deacetylase with sodium butyrate (Miller et al, 1997) release of intracellular calcium
with ionomycin (Chang et al, 2000) and inhibition of DNA méthylation with azacytidine
(Chen et al, 2001). Herpesvirus lytic replication is characterised by a temporally ordered
programme of lytic gene expression that results in cell lysis (Wagner et al, 1972,
Roizman et al, 1975, Roizman and Pellett, 2001). Traditionally, lytic genes are
categorised into regulatory classes, which differ by their response to metabolic inhibitors
(Table 1.7). Upon de novo lytic infection, KSHV immediate-early genes are likely to be
activated by a tegument protein, the paradigm being HSV-1 VP 16 (Post et al, 1981,
Batterson and Roizman, 1983, Campbell et al, 1984). Immediate-early genes
transactivate the expression of early genes, which include enzymes required for DNA
replication. Late genes are not expressed until after DNA replication has begun and
generally encode structural proteins of the virion and those involved in their assembly.
As for EBV, most studies on KSHV replication concern chemically induced virus
reactivation and therefore immediate-early genes are instead defined as those genes not
requiring new protein synthesis for their expression. KSHV lytic gene expression is
discussed in Chapter 4.
Class Symbol Definition
Immediate-early a Expression requires no prior viral protein synthesis.
Early P Expression is independent of virus DNA synthesis.
Partial-late yl Expression is increased by virus DNA synthesis.
True-late Y2 Expression requires virus DNA synthesis.
Table 1.7. Regulatory classes of herpesvirus genes expressed during lytic replication after de novo infection.Definitions taken from Roizman and Pellett (2001).
57
The immediate-early KSHV ORF 50 encodes Rta (also known as Lyta), which is
necessary (Lukac et al, 1999) and sufficient (Gradoville et al, 2000) to activate lytic
replication. Rta is able to activate its own promoter giving a rapid autocatalytic rise in
expression. Sites necessary for Rta induced transcription have been found in the
promoters of viral T l.l RNA (Song et al, 2001, Chang et al, 2002), T0.7 RNA (Chang
et al, 2002) and ORF 57 (Duan et al, 2001). Cellular factors are also likely to be
important for the reactivation of KSHV from latency. CREB-binding protein (CEP) and
c-Jun bind to Rta and activate Rta mediated transcription (Gwack et al, 2002) while Rta
activation of the KSHV thymidine kinase promoter is dependant on Spl (Zhang et al,
1998). The promoter of ORF 50 is heavily methylated in latent PEL cell lines and
infected peripheral blood mononuclear cells (PBMC) (Chen et al, 2001). Déméthylation
of the promoter is induced by TPA treatment explaining how this agent activates the lytic
cycle of KSHV. It is unknown what the triggers of déméthylation might be in vivo, but
they are likely to be indicative of cellular stress.
Other KSHV proteins have roles in the early stages of lytic replication. Cell cycle arrest
appears to be a universal mechanism of herpesvirus lytic replication (Flemington, 2001).
For KSHV, cell cycle arrest in G1 is mediated by activation of p21^^^ by the early
protein encoded by K8 (Wu et al, 2002). K8 may also activate the expression of other
viral lytic genes, as is the case for its EBV homologue Zta (Chevallier-Greco et al, 1986,
Lieberman et al, 1990). KSHV ORF 57 encodes KS-SM, a post-transcriptional activator
of gene expression (Gupta et al, 2000). KS-SM may function in a similar manner to its
homologues in other herpesviruses, which export viral mRNA from the nucleus (Sandri-
Goldin, 1998, Semmes et al, 1998, Goodwin et al, 1999).
1.2.4.4 DNA replication
Lytic replication can be monitored by the appearance of linear progeny herpesvirus
DNA. This is observed in PEL cells after treatment with TPA (Renne et al, 1996b). A
number of DNA replication enzymes are conserved between all herpesviruses suggesting
DNA replication proceeds by a conserved mechanism. This has been most extensively
studied using HSV-1 for which DNA synthesis has been reconstituted in vitro (reviewed
in Boehmer and Lehman, 1997). DNA replication proceeds via a rolling-circle
mechanism and requires HSV-1 encoded DNA polymerase, processivity factor, single
stranded DNA binding protein (ssDBP), the tripartite DNA helicase-primase complex
58
and origin binding protein (OBP). KSHV homologues of these proteins form a
replication complex that is able to replicate DNA containing the EBV lytic origin of
replication (oriLyt) in vitro (Lin et ah, 1998, Wu et al, 2001b). Two KSHV oriLyts have
since been identified in the genome (AuCoin et al, 2002) (Figure 1.5).
Characteristically, KSHV replication complexes form adjacent to nuclear promyelocytic
leukaemia (PML) oncogenic domains (PODs), which exclude and marginate cellular
DNA (Ishov and Maul, 1996, Ishov et al, 1997, Wu et al, 2001b). Herpesviruses also
encode a number of genes involved in nucleotide metabolism and DNA repair, such as
thymidylate synthase and uracil-DNA glycosidase. These are not necessary for HSV-1
DNA replication in cultured cells but are likely to be needed in vivo.
1.2.4.5 H erpesvirus assem bly
Packaging of progeny herpesvirus DNA into newly formed capsids occurs in the nucleus
(reviewed in Roizman and Knipe, 2001). KSHV genes whose products are known to
form part of the capsid are ORF 25 (major capsid protein (MCP)), ORF 17 (scaffolding
protein), ORF 62 (TRI-1), ORF 26 (TRI-2) and ORF 65 (small viral capsid antigen
(sVCA) (Nealon et al, 2001). Herpesvirus capsids bud from the inner nuclear membrane
and then fuse to the outer nuclear membrane, releasing them into the cytoplasm
(reviewed in Mettenleiter, 2002). The evidence for this comes primarily from EM studies
of HSV-1 infection. Two HSV-1 proteins, Ul31 and Ul34 are necessary for budding into
the peri-nuclear space. Herpesviruses are thought to acquire their tegument and envelope
in the cytoplasm (Siminoff and Menefee, 1966, Stackpole, 1969). The tegument interacts
with the virus capsid on one side and the cytoplasmic tails of the viral glycoproteins on
the other, thereby securing the integrity of the virus particle. The interaction with the
capsid is through the homologous gene family defined by HSV-1 Ul36 (McNabb and
Courtney, 1992). Tegument-associated capsids obtain their envelope by budding into
vesicles of the trans-Golgi network by interaction with viral membrane glycoproteins.
The envelope proteins gE/I and gM play a prominent role in this process (Brack et a l ,
1999, Brack et al, 2000). The final act of KSHV replication is cell lysis and the release
of infectious viral progeny (Renne et al, 1996b, Cannon et al, 2000, Roizman and
Pellett, 2001).
59
1.2.5 D iseases assoc ia ted with KSHV
1.2.5.1 K aposi's sarcom a (KS)
There are four epidemiologically distinct forms of KS; classic, endemic, post-transplant
or iatrogenic and AIDS-associated. Classic KS is the form originally described by
Kaposi and occurs predominantly in elderly men of Southern European, Arabic or Jewish
ancestry (Franceschi and Geddes, 1995). In parts of equatorial Africa, KS has pre-existed
the current HIV epidemic. This is the endemic form and is usually more aggressive than
classic KS, affecting the lymph nodes as well as the extremities and also occurring in
children (Bayley, 1984, Downing et al, 1984). This paediatric lymph nodal form may be
a manifestation of primary infection, analogous to EBV-associated infectious
mononucleosis (Boshoff and Weiss, 2001). Over the last 20 years the incidence of KS in
patients receiving organ transplants and other immunosuppressive therapy has increased
(Harwood et al, 1979). This is more common in countries where classic or endemic KS
occurs or in patients originating from these countries that have since moved elsewhere
(reviewed in Boshoff and Weiss, 2001). AIDS-associated KS is the most common
neoplasm in patients with AIDS (Beral et al, 1990, Rabkin et al, 1995). The distribution
of AIDS-KS, occuring primarily in homosexual men, is consistent with a sexually
transmitted cofactor.
There are a number of lines of evidence that KSHV causes KS:
■ KSHV DNA is found in all KS lesions (reviewed in Schulz, 1998, Boshoff and
Weiss, 2001) but not in surrounding healthy skin or other vascular tumours (lARC,
1997).
■ KSHV DNA, RNA and proteins are detectable in KS spindle cells, the presumed
neoplastic component (Boshoff et al, 1995, Li et al, 1996, Davis et al, 1997,
Rainbow et al, 1997, Staskus et al, 1997, Sturzl et al, 1997, Dupin et al, 1999,
Kellam et al, 1999, Katano et al, 2000a).
■ KSHV is monoclonal in advanced lesions suggesting that virus infection precedes
clonal expansion (Judde et al, 2000).
■ The incidence of KS is high in populations with a high KSHV seroprevalence (see
section 1.2.7).
60
■ The detection of KSHV by PCR in the peripheral blood (Whitby et al, 1995, Moore
et al, 1996c), or seroconversion to KSHV antigens (Gao et ai, 1996, Martin et al,
1998), predicts the subsequent development of KS.
■ Treatment with inhibitors of herpesvirus DNA polymerase reduces the rate of
appearance of new KS lesions in AIDS patients (Jones et al, 1995, Glesby et al,
1996, Mocroft et al, 1996).
Early stage KS lesions, known as the patch stage, are composed of small, irregular,
endothelial-lined spaces that surround normal blood vessels. These are accompanied by
an infiltrate of inflammatory cells, such as CD8+ T-cells, monocyte/macrophages and
dendritic cells (Uccini et al, 1997, Ensoli and Sturzl, 1998, Fiorelli et al, 1998). As the
disease progresses, a spindle-celled vascular process expands throughout the dermis and
these spindle cells form slit-like, vascular channels that contain red blood cells (plaque
stage). Late stage lesions, known as the nodular stage, consist of sheets of spindle cells
and slit-like vascular spaces. The spindle cells are thought to be the tumour cells but their
origin is unclear. The majority express lymphatic endothelial cell markers, such as
vascular endothelial growth factor (VEGF) receptor-3 (VEGFR-3) and podoplanin
(Jussila et al, 1998, Dupin et al, 1999, Weninger et al, 1999) while some express
proteins more characteristic of smooth muscle, macrophages and dendritic cells or
several of these at once (Nickoloff and Griffiths, 1989, Sturzl et al, 1992, Uccini et al,
1994). This suggests that the cells most likely derive from a multipotent precursor cell
whose progeny give rise to haematopoietic and endothelial cells.
In early KS lesions, only around 10% of spindle and endothelial cells are KSHV positive
(Dupin et al, 1999). In late stage nodular lesions around 90% of spindle cells contain
KSHV, suggesting that the virus provides a growth advantage to infected cells (Boshoff
et al, 1995, Staskus et al, 1997, Sturzl et al, 1999a). These data indicate that early stage
KS is a polyclonal hyperplasia that only develops into a true clonal malignancy as the
disease progresses. This is supported by work showing that KSHV terminal repeat
sequences in nodular KS lesions display all patterns of clonality (mono, oligo and
polyclonal) (Judde et al, 2000) suggesting the disease begins as a polyclonal hyperplasia
that develops (through oligoclonality) into a monoclonal tumour. This may be analogous
to EBV-associated PTLD that can progress from a polyclonal hyperplasia to monoclonal
tumours in the context of immunosuppression (Knowles et al, 1995). Also, regression of
AIDS-KS can occur (Janier et al, 1985, Brooks, 1986), especially after the start of
61
highly active anti-retroviral therapy (HAART) (Lebbe et al, 1998), and post-transplant
KS upon the withdrawal of immunosuppressive therapy (Zisbrod et al, 1980).
Paracrine factors may be involved in disease progression (Gallo, 1998, Dupin et al,
1999). KS spindle cells promote KS-like lesions in nude mice by recruiting and inducing
the growth of mouse cells (Salahuddin et al, 1988, Ensoli et al, 1989, Ensoli et al,
1994). This may be mediated by the ThI cytokines interferon (IFN)-y, TNF, IL-1 and IL-
6 produced by the invading inflammatory cells. IFN-y reactivates latent virus (Chang et
al, 2000) and ThI cytokines increases KSHV DNA load in cultured PBMC (Monini et
al, 1999b). IL-6 enhances the proliferation of KS cells in culture (Miles et al, 1990).
Also, these cytokines induce the production of basic fibroblast growth factor (bPGF) by
spindle cells, which functions as a KS cell growth factor. These ThI cytokines lead to
further inflammatory cell recruitment through the production of the chemokines
macrophage chemoattractant protein-1 (MCP-1), IL-8, regulated on activation normal T-
cell expressed and secreted (RANTES), macrophage inhibitory protein (MlP)-la and Ip
and the angiogenic factors bPGF and VEGF. KSHV also encodes a number of cytokine
homologues that may be involved in KS pathogenesis (see section 1.2.9).
The more aggressive nature of AIDS-KS may be due to the severe immunosuppression
of these patients allowing KSHV replication. The induction of KS cell growth,
angiogenesis and KSHV replication by human immunodeficiency virus-1 (HIV-1) Tat
may also exacerbate the condition (Vogel et al, 1988, Ensoli et al, 1990, Ensoli et al,
1993, Harrington et al, 1997).
1.2.5.2 Primary effusion iymphoma (PEL)
Unusual malignant lymphomas presenting in the body cavities of AIDS patients were
described in 1989 and termed body cavity-based lymphoma (BCBL) (Knowles et al,
1989). Soon after the discovery of KSHV in KS, Cesarman and co-workers found that
KSHV was specifically associated with this rare form of lymphoma (Cesarman et al,
1995a). The existence of BCBLs negative for KSHV prompted the re-naming of KSHV-
positive cases as PEL to reflect the initial presentation (Nador et al, 1996). PEL
normally manifests as malignant effusions in the pleural, pericardial or peritoneal
cavities, but without significant tumour mass (reviewed in Cesarman and Knowles,
1999). PEL cells specifically home to the serous membranes to which they adhere
62
(Carbone and Gaidano, 1997). The majority of PEL patients are HIV positive with
advanced immunosuppression (Komanduri et al, 1996). However, PEL has also been
observed in HIV negative men and women (Carbone et al, 1996, Nador et al, 1996,
Said et al, 1996). PEL cells contain rearranged Ig genes, indicating a B-cell origin
(Knowles et al, 1989, Cesarman et al, 1995a). The stage of B-cell development
represented by PEL is discussed in Chapter 5.
The association between KSHV and PEL has been confirmed by multiple studies
(Pastore et al, 1995, Carbone et al, 1996, Otsuki et al, 1996, Gessain et al, 1997,
Karcher and Alkan, 1997). KSHV is present within every PEL cell (Lennette et al, 1996,
Kellam et al, 1997, Rainbow et al, 1997, Dupin et al, 1999, Katano et al, 2000b) and,
in around 80% of cases, PEL cells also contain EBV (Cesarman and Knowles, 1999).
EBV co-infection is primarily observed in AIDS patients. The presence of clonal Ig gene
rearrangements suggests PEL is a clonal tumour (Nador et al, 1996). KSHV terminal
repeats are also clonal in PEL, demonstrating that KSHV infection preceded tumour
expansion (Judde et al, 2000). PEL is uncommon, even in populations with high KSHV
seroprevalence, suggesting other factors are necessary for its development. The high
incidence of EBV co-infection suggests it may be one such factor. However, the finding
that EBV doesn’t express EBNA 2 and 3 and only low levels of LMP-1 (Horenstein et
al, 1997, Szekely et al, 1998, Callahan et al, 1999) makes it unlikely that EBV is
directly driving PEL cell proliferation. As with KS, HIV Tat may also be involved in the
exacerbation of PEL as it can induce PEL cells to migrate and adhere to endothelial cells
(Chirivi et al, 1999). PEL cases rarely show alterations of the Bcl-2, ras and p53 genes
but the regulatory region of the BCL-6 gene is frequently mutated (Gaidano et al, 1999).
PEL cells do not exhibit c-myc translocations (Cesarman et al, 1995a, Karcher and
Alkan, 1997) but do posses numerous other chromosomal abnormalities (Knowles et al,
1995, Drexler et al, 1998, Cesarman and Knowles, 1999, Gaidano et al, 1999). The lack
of any common abnormality is consistent with direct transformation by KSHV.
Similar to KS, PEL cell growth is enhanced by cytokines. Interleukins 6 and 10 and their
receptors are expressed at high levels by PEL cells in vitro (Drexler et al, 1999). The
growth of PEL cells in severe combined immunodeficiency (SCID) mice is inhibited by
antibodies to human IL-6, indicating that it acts as an autocrine growth factor (Poussât et
al, 1999). VEGF may also act as an autocrine growth factor in vivo (Aoki and Tosato,
63
1999). KSHV encodes a number of homologues of cellular genes, including IL-6, which
may be involved in PEL tumourigenesis (sections 1.2.8 and 1.2.9).
1.2.5.3 Multicentric C astlem an 's d isease (MCD)
MCD is an unusual lymphoproliferative disorder that is characterised by
lymphadenopathy, episodes of fever and splenic infiltration (reviewed in Peterson and
Frizzera, 1993). MCD is more common in HIV infected individuals where it is often an
aggressive disease. A characteristic of MCD is its close association with KS, which led
Soulier and colleagues to look for, and find, KSHV DNA in MCD tissue (Soulier et ai,
1995). KSHV is present in almost all cases of MCD in AIDS patients and in around half
of those in HIV negative individuals (Corbellino et ai, 1996, Gessain et al, 1996, Luppi
et al, 1996, Chadbum et al, 1997). KSHV positive MCD cases are now recognised as
forming a distinct subset of MCD, named plasmablastic MCD, which contains large
plasmablastic cells, all of which harbour KSHV (Dupin et al, 1999, Dupin et al, 2000,
Parravicini et al, 2000, Du et al, 2001). These plasmablasts localise mainly in the
mantle zone of B-cell follicles. Consistent with this, the lack of somatic mutations in the
rearranged Ig heavy and light chain genes indicate that they originate from naïve B-cells
(Du et al, 2001). KSHV infected plasmablasts are CD20+ CD5- CD23- CD30- CD38-
CD45- (Dupin et al, 1999, Parravicini et al, 2000). The cells show IgM X light-chain
restriction (Dupin et al, 2000) whereas neighbouring KSHV negative mantle zone B-
cells and interfollicular plasma cells are polytypic. Unlike PEL cells, co-infection by
EBV has not been detected in MCD plasmablasts (Dupin et al, 2000, Du et al, 2001).
Similar to PEL, IL-6 and its viral homologue have been implicated in MCD pathogenesis
(section 1.2.9).
Despite invariable expression of cytoplasmic IgM X (Dupin et al, 2000), studies
examining the number of KSHV terminal repeats (Judde et al, 2000) or Ig
rearrangements (Du et al, 2001) indicate that MCD plasmablasts are polyclonal in
origin. A number of patients with KSHV-associated plasmablastic MCD will progress to
develop a monoclonal plasmablastic lymphoma (Dupin et al, 1999, Dupin et al, 2000,
Du et al, 2001, Oksenhendler et al, 2002). This is therefore akin to the development of
KS from a polyclonal neoplasia into a monoclonal tumour (section 1.2.5.1).
64
1.2.6 Cell tropism
All gammaherpesviruses infect lymphoid cells (Roizman and Pellett, 2001). As
previously discussed, KSHV is associated with B-cell lymphoma. KSHV can also be
detected in peripheral blood CD 19+ B-cells of individuals with KS (Ambroziak et al,
1995, Harrington et al, 1996, Henry et al, 1999, Monini et al, 1999b). Infection of
human tissue grafts in SCID mice reveals that after a period of lytic infection, latent
virus is detected primarily in CD 19+ B-cells (Dittmer et al, 1999). However, neither
primary nor transformed human B-cells support latent infection in vitro (Mesri et al,
1996, Friborg et al, 1998, Renne et al, 1998). Productive infection can be detected in
cells identified as monocytes in KS lesions and KSHV DNA in monocytes in peripheral
blood (Blasig et al, 1997, Henry et al, 1999, Monini et al, 1999b). These cells may be
identical to the circulating KSHV-positive macrophage-like spindle cells identified in KS
patients (Sirianni et al, 1997). However, these data have not been reproduced by others
(Parravicini et al, 2000). KSHV has also been found in purified peripheral blood T-cells,
albeit rarely (Harrington et al, 1996, Henry et al, 1999). The infection of CD34+ stem
cells (Henry et al, 1999, Mikovits et al, 2001) may explain how KSHV DNA becomes
present in both lymphoid and myeloid lineages.
KS spindle cells lose the virus in culture (Foreman et al, 1997). Therefore, a number of
attempts have been made to derive an in vitro infection system to act as a model. The
human embryonic-kidney epithelial cell line 293 supports productive infection and
limited serial passage by KSHV, but only 1% of cells become infected (Foreman et al,
1997, Friborg et al, 1998). Similarly, around 1-5% of bone marrow microvascular and
human umbilical vein endothelial cells (BMVECs and HUVECs respectively) support
KSHV infection (Flore et al, 1998). Although only a small number of cells become
infected, the paracrine induction of VEGF and its receptor, kinase domain receptor
(KDR), leads to transformation of all cells in the culture and KSHV infection is
maintained (Flore et al, 1998, Masood et al, 2002). This may therefore represent a
valuable model for early-stage KS lesions. In addition to endothelial cells in KS lesions,
KSHV mRNA has been detected in kératinocytes of the overlying epidermis (Foreman et
al, 1997, Reed et al, 1998). KSHV is also able to infect kératinocytes in vitro (Cerimele
et al, 2001). This suggests that, similar to EBV, KSHV infection of epithelial cells may
play a role in transmission of the virus.
65
Of all the cell types tested, KSHV infection of dermal microvascular endothelial cells
(DMVECs) is the most efficient (Moses et al, 1999, Cannon et al, 2000, Ciufo et al,
2001, Dezube et al, 2002). The majority of cells become latently infected and convert to
a spindle-cell morphology, with around 5% spontaneously entering lytic replication
(Moses et al, 1999, Ciufo et al, 2001). This may therefore more closely model late-
stage KS lesions. However, DMVECs are not transformed by KSHV and require either
immortalisation by human papilloma virus (HPV) E6 and E7 (Moses et al, 1999) or
addition of fresh cells (Ciufo et al, 2001) for their propagation. Infection of DMVECs
has been used to study the effects of KSHV latency and lytic replication on host gene
expression (section 1.3.7).
1.2.7 Epidemiology and transm ission
Unlike most human herpesviruses, KSHV is not spread universally through the human
population. The seroprevalence of KSHV in northern Europe, North America and Asia is
generally found to be fewer than 5% (Gao et al, 1996, Simpson et al, 1996, Kedes et
al, 1997a, Katano et al, 2000a). As with KS, in the West KSHV antibodies are found
predominantly in HIV-positive homosexual men (Gao et al, 1996, Kedes et al, 1996,
Lennette et al, 1996, Simpson et al, 1996, Kedes et al, 1997a). The seroprevalence in
this population is 32-85% depending on the antigen tested (Lennette et al, 1996,
Simpson et al, 1996). The highest seroprevalence in healthy populations are found in
sub-Saharan Africa (40%) (Ablashi et al, 1999, Schulz, 2000), consistent with the
localisation of endemic KS. In Mediterranean countries, the seroprevalence averages
10%, explaining the concentration of classic KS cases in patients of this extraction. The
incidence of classic KS in Italy varies by region in parallel to KSHV prevalence (Geddes
et al, 1995, Calabro et al, 1998, Whitby et al, 1998). Classic KS and KSHV antibodies
are common in both Sephardi and Ashkenazi Jews suggesting that KSHV entered the
Jewish population before the Diaspora (Zahger et al, 1993, Fenig et al, 1998,
Davidovici et al, 2001).
KSHV can be sub-typed based on the sequence of ORF K1 (Nicholas et al, 1998,
McGeoch and Davison, 1999). Different subtypes have different geographical
distributions and are associated with different ethnic groups (Cook et al, 1999,
Hayward, 1999, Meng et al, 1999, Poole et al, 1999, Zong et al, 1999a, Lacoste et al,
66
2000a). Subtype B is almost exclusively linked with Africa, subtype C is found in
patients from the Middle East and Mediterranean Europe, subtype A in western Europe
and North America, subtype D in a small number of individuals from the Pacific Islands
and subtype E from people indigenous to South America. The sequence divergence of
K1 suggests it is currently under some sort of evolutionary pressure (Kasolo et al, 1998,
Nicholas et al, 1998, Zong et al, 1999a) but it is unknown how this might affect its
function (section 1.2.9.8).
In homosexual men, KSHV infection is associated with the number of male partners and
history of sexually transmitted infections (Martin et al, 1998, Grulich et al, 1999).
KSHV seroprevalence is also associated with HIV infection in female prostitutes and
high-risk sexual behaviour in American women (Cannon et al, 2001). This relationship
between seroprevalence and sexual behaviour suggests that KSHV can be transmitted
sexually. Consistent with this, KSHV has been found in the genital tract of seropositive
women (Whitby et al, 1999) and in prostate and semen (Monini et al, 1996, Staskus et
al, 1997, Diamond et al, 1998, Pellett et al, 1999). In Africa, KSHV is likely to be
acquired at an early age as endemic KS is seen in children (Ziegler and Katongole-
Mbidde, 1996). In endemic areas, the prevalence of antibodies to KSHV increases
steadily with age (Olsen et al, 1998, Sitas et al, 1999, Rezza et al, 2000) and this
occurs before puberty (Bourboulia et al, 1998, He et al, 1998, Mayama et al, 1998,
Gessain et al, 1999). Mother-to-child and sibling-to-sibling transmissions have been
shown to occur in South Africa and French Guyana (Bourboulia et al, 1998,
Plancoulaine et al, 2000). Familial transmission of KSHV has also been documented in
Italian, Israeli and Egyptian children (Andreoni et al, 1999, Whitby et al, 2000,
Davidovici et al, 2001). The presence of KSHV DNA in saliva (Koelle et al, 1997,
Cattani et al, 1999) suggests this may be the route of such transmission.
1.2.8 G enes exp ressed during latent infection
It became apparent soon after the discovery of the virus that cells infected in vivo
contained closed circular viral DNA (Decker et al, 1996, Renne et al, 1996a) and a
highly restricted pattern of gene expression (Zhong et al, 1996), hallmarks of latent
infection. Because KSHV is latent in the majority of tumour cells it seems likely that the
67
genes expressed during latency play a major role in the pathogenesis of KSHV
associated cancer.
Genes shown thus far to be expressed in all infected cells are LNA-1, encoded by ORF
73 (Kedes et al, 1997b, Kellam et al, 1997, Rainbow et al, 1997), v-cyclin (ORF 72)
and v-FLIP (ORF 71). These genes, all adjacent in the genome, are co-transcribed on two
polycistronic mRNAs, LTl (LNA-l/v-cyclin/v-FLIP) and LT2 (v-cyclin/v-FLIP)
(Dittmer et al, 1998, Sarid et al, 1999, Talbot et al, 1999), in all PEL and KS spindle
cells (Davis et al, 1997, Staskus et al, 1997, Dittmer et al, 1998, Reed et al, 1998,
Ascherl et al, 1999, Sarid et al, 1999, Sturzl et al, 1999b). The presence of LNA-1
protein has been demonstrated in all infected cells in KS, PEL and MCD (Lennette et al,
1996, Kellam et al, 1997, Rainbow et al, 1997, Dittmer et al, 1998, Dupin et al, 1999,
Dupin et al, 2000, Katano et al, 2000b, Parravicini et al, 2000). v-Cyclin (Platt et al,
2000) and v-FLIP (Low et al, 2001) proteins are expressed in latent PEL cells in vitro.
In addition, the T0.7 transcript is expressed in all KSHV infected cells (Blasig et al,
1997, Staskus et al, 1997, Sturzl et al, 1997, Sadler et al, 1999, Staskus et al, 1999,
Sturzl et al, 1999b). K15 protein is expressed in all PEL cells in vitro and in KSHV-
positive plasmablasts in vivo (Sharp et al, 2002).
1.2.8.1 Latent nuclear antigen (LNA-1)
As well as acting to tether the viral episomes to the host chromosomes, LNA-1 has been
shown to possess a number of other functions. Transient transfection studies show that
LNA-1 can up-regulate expression from a number of different promoter sequences
(Radkov et al, 2000, Renne et al, 2001) including that of telomerase (Knight et al,
2001). LNA-1 transactivates expression from the LT1/LT2 promoter (Jeong et al, 2001,
Renne et al, 2001) suggesting it may maintain expression of these transcripts while the
majority of the viral genome remains silent. LNA-1 can also repress transcription from
some promoters (Krithivas et al, 2000, Schwam et al, 2000, Renne et al, 2001),
although it is unclear whether LNA-1 represses host or viral gene expression in vivo. In
this regard, LNA-1 may be functionally equivalent to EBNA-2. The effects of LNA-1 on
transcription may be due to its binding to a number of cellular proteins implicated in
transcriptional regulation such as RINGS (Platt et al, 1999), activating transcription
factor (ATF)-4/cyclic AMP response element binding protein (CREB)-2 (Lim et al,
2000) and mSinSA (Krithivas et al, 2000). mSinSA is a component of a co-repressor
68
complex that recruits histone deacetylases to promoters. LNA-1 also interacts with other
members of this complex, SAP30 and CIR, although it is unknown whether this actually
occurs in KSHV infected cells. The promoter of Rta, the viral transactivator of lytic
replication, is heavily methylated in latent cells and thus transcriptionally inactive (Chen
et al, 2001). Méthylation of DNA leads to the loss of histone HI and recruitment of
repressor complexes containing mSin3A and histone deacetylase. Therefore it is
tempting to speculate that LNA-1 acts to repress Rta expression, thus maintaining
latency.
LNA-1 binds p53, repressing its transcriptional activity and its ability to induce apoptosis
(Friborg et al, 1999). LNA-1 is complexed with p53 in PEL cell lines and so may be
responsible for inhibiting the p53-dependent induction of apoptosis by gamma-radiation
that is observed in PEL cells. LNA-1 also transactivates promoters that are dependent on
retinoblastoma protein (pRb)-E2F and associates with the hypophosphorylated form of
pRb in transfected cell lines (Radkov et al, 2000). This binding of LNA-1 to pRb is
dependent on the “pocket region” of pRb that mediates its interaction with E2F. LNA-1
is also able to abrogate the induction of cell cycle arrest induced by pRb. These data
suggest that LNA-1 is able to compete with E2F for binding of pRb, freeing E2F to
activate the transcription of genes involved in cell cycle progression. Aberrant E2F
activity can trigger apoptosis via the p53 pathway. Therefore the inhibition of p53 by
LNA-1 allows latent KSHV to promote cell cycle progression whilst inhibiting
apoptosis. This suggests that LNA-1 is functionally equivalent to oncogenic proteins in
other DNA tumour viruses such as large T antigen of simian virus 40 (SV40) and E6/E7
of HPV. Consistent with this, LNA-1 is able to transform primary rat embryo fibroblasts
in co-operation with H-ras and render them tumourigenic in nude mice (Radkov et al,
2000).
Interestingly, pRb is thought to mediate some of its repressive effects on transcription via
the recruitment of histone deacetylases and is able to bind the mSin3A co-repressor
complex via RBPl (Lai et al, 2001). The other binding partner of LNA-1, RING3,
transactivates cell cycle regulatory genes through E2F and is able to bind E2F containing
complexes (Denis et al, 2000). Therefore the effects of LNA-1 on transcription may be
mediated through pRb and E2F pathways (Figure 1.7).
69
1.2.8.2 Viral cyclin (v-cyclln)
KSHV encoded v-cyclin is a human cyclin D homologue, most closely related to cyclin
D2. Human cyclin D binds to and activates CDK4 and CDK6, which are able to
phosphorylate pRb, releasing the repression on E2F. E2F is then free to activate the
transcription of S-phase genes, such as cyclin E, whose products are needed to progress
from G1 to S phase of the cell cycle (reviewed in Adams, 2001). v-cyclin is also able to
phosphorylate pRb in vitro in complexes with CDK6 and, to a lesser extent, CDK4
(Godden-Kent et al, 1997, Li et al, 1997). However, unlike cellular cyclin D/CDK6
complexes, phosphorylation of pRb by v-cyclin/CDK6 is insensitive to inhibition by the
CDK inhibitors (CKI) pl6™“ “, p2l“ '”‘ and p27™‘ (Swanton et al., 1997). Ectopic
expression of v-cyclin in quiescent fibroblasts prevents CKI imposed G1 arrest and
stimulates entry into S-phase. This provides a model of how v-cyclin may dysregulate
the cell cycle by encoding its own G1 cyclin. The targeting of the pRb-E2F pathway by
both LNA-1 and v-cyclin (Figure 1.7) may explain their transcriptional co-regulation.
v-cyclin/CDK6 can also phosphorylate histone HI (Godden-Kent et al, 1997, Li et al,
1997) and the CDK2 substrates p27^^ (Ellis et al, 1999, Mann et al, 1999), Id-2, cell
division cycle (GDC) 25a (Mann et al, 1999), E2F-4 (Duro et al, 1999), origin
recognition complex 1 (ORCl) and CDC6 (Laman et al, 2001). v-cyclin/CDK6
phosphorylation of p27^^^ induces its ubiquitin-mediated destruction and in doing so
overcomes p27^^^ induced cell cycle arrest (Ellis et al, 1999, Mann et al, 1999). As
well as inhibiting D-type cyclin-CDK complexes, p27^^^ also inhibits cyclinE/CDK2.
The degradation of p27™’ induced by v-cyclin/CDK6 therefore results in D-type and E-
type cyclin/CDK activity independent of cellular controls. The relevance of this for in
vivo pathogenesis is suggested by the observation that lymphocytes are largely
maintained in GO/Gl by high levels of p27^^^ and that CDK6 precipitated from PEL
cells is able to phosphorylate pRb and p27^^^ (Ellis et al, 1999).
Origin recognition complex 1 (ORCl) and CDC6 are candidate replication proteins
whose phosphorylation is thought to be important for recognition of the origins of DNA
replication. Their phosphorylation by v-cyclin/CDK6 may explain the ability of this
complex to functionally substitute for cyclinA/CDK2 to initiate DNA replication (Laman
et al, 2001). v-cyclin/CDK6 also prolongs S-phase in transfected cell lines.
70
v-cyclin can also trigger apoptosis in cells with elevated levels of CDK6 (Ojala et al,
1999) probably by phosphorylating and inactivating the cellular anti-apoptotic factor
Bcl-2 (Ojala et al, 2000). It is unclear why latent virus might want to trigger apoptosis.
However, the phosphorylation of Bcl-2 may be linked to its role in the cell cycle since in
uninfected cells the phosphorylation of Bcl-2, possibly by cyclinB/Cdc2, is a marker of
M phase events (Ling et al, 1998). Interestingly, the KSHV Bcl-2 homologue (vBcl-2)
encoded by ORF 16 protects against v-cyclin/CDK6 induced apoptosis (Ojala et al,
2000). Also, p53 loss prevents v-cyclin-mediated induction of apoptosis, allowing cell
expansion (Verschuren et al, 2002). This could be recapitulated by LNA-1 during latent
infection.
v-cyclin/CDK6 has a much expanded substrate repertoire to host cyclinD/CDK
complexes and mimics cyclinE/CDK2, cyclinA/CDK2 and possibly cyclinB/Cdc2
(Figure 1.7). Therefore, the apparent redundancy between v-cyclin and LNA-1 in both
targeting pRb is only likely to encompass one aspect of their respective functions.
71

U n in fe c te d
HDACmSinS Cyclin D Cyclin E Cyclin A
CDK 4/6 CDK 2 CDK 2
orcl^Arrest I
ApotosisCyclin E yclin A
P14ARF
DNASynthesis
In fec ted
HDACmSin3 v-Cyclin v-Cyclin v-Cyclin
CDK 6 CDK 6 CDK 6
LNA-1 orcl '
Cyclin E :J"yCyclin A
P14ARF
m m i
DNASynthesis
Figure 1.7. A model for LNA-1 and v-cyclin function during the cell cycle.In uninfected cells passage across the restriction point (R) during G1 is controlled by the binding of the retinoblastoma protein (pRb) to E2F (reviewed in Harbour and Dean, 2000, Adams, 2001). The phosphorylation of pRb by cyclinD/CDK complexes frees E2F from the inhibitory effects of histone deacetylase (HDAC) allowing the transcription of genes such as cyclins E and A which are needed for passage into S-phase (S). cyclin E/C DK2 activity leads to the phosphorylation and destruction of p27 '^^ allowing the cell cycle to proceed. CyclinA/CDK2 activity during S-phase, for example phosphorylation of the candidate replication proteins orcl and cdc6, leads to DNA synthesis. Aberrant cell growth can trigger cell cycle arrest or apoptosis in late G1 due to E2F-
y |A R F /|ARF u. ,i._ omediated activation of pi 4 expressionp53 complex preventing p53 degradation
p i4 binds to the mouse double minute 2 (MDM2)-
In KSHV infected cells, the latent proteins LNA-1 and v-cyclin act at multiple points during the cell cycle. Binding of LNA-1 to hypophosphorylated pRb frees E2F allowing transcription of S-phase genes (Radkov et a/., 2000). As LNA-1 can also bind mSin3 (Krithivas et al., 2000) this too may be present in the LNA-1-pRB complex. The kinase RING3 is known to bind E2F (Denis et a/., 2000) and LNA-1 can bind RINGS (Platt et a!., 1999) suggesting LNA-1 may be directly involved in E2F-stimulated gene expression, v-cyclin activates CDK6 to phosphorylate pRb (Godden-Kent et a/., 1997, Li et al., 1997), further shifting the equilibrium towards free E2F. Unlike host cyclinD/CDK complexes, v-cyclin/CDK6 is immune to inhibition by the CDK inhibitors pio'^ "*®, p21 "^ and p27* ' (Swanton et al., 1997). Like host cyclinE/CDK2, v-cyclin CDK6 is able to phosphorylate p27* ' overcoming p27 "^ mediated cell cycle arrest (Ellis et al., 1999, Mann et al., 1999). v-cyclin/CDK6 is also able to phosphorylate the cyclinA/CDK2 substrates 0RC1 and CDC6 (Laman et al., 2001). This may explain the ability of v-cyclin/CDK6 to functionally substitute for cyclin A/CDK2 to initiate DNA replication. LNA-1 binds p53, repressing its transcriptional activity and its ability to induce apoptosis (Friborg et al., 1999). Thus, by substituting its own proteins at multiple stages during the cell cycle, KSHV is able to control cell cycle progression independently of cellular controls.
72
1.2.8.3 Viral FLICE inhibitory protein (v-FLIP)
v-FLIP is a homologue of the cellular protein FLIP (Irmler et al, 1997). FLIPs contain
death-effector domains that interact with the adapter protein Fas-associated death domain
(FADD), inhibiting the recruitment and subsequent activation of the protease FLICE by
the CD95 (Fas) death receptor. v-FLIPs from other gammaherpesviruses were found to
protect cells from Fas, tumour necrosis factor receptor-1 (TNFR-1), translocating chain-
association membrane protein (TRAMP) and TNF-related apoptosis-inducing ligand
receptor (TRAIL-R) mediated apoptosis (Bertin et al, 1997, Thome et al, 1997). KSHV
v-FLIP is also able to protect cells from Fas-mediated apoptosis and permits clonal
growth in the presence of Fas ligand. Furthermore, v-FLIP expressing B-cells develop
into tumours in mice by preventing death-receptor induced apoptosis triggered by CTL
immunosurveillance (Djerbi et al, 1999). Indeed, KS cells were shown to be resistant to
Fas-mediated apoptosis before v-FLIP was identified (Mori et al, 1996). v-FLIP has also
been directly implicated in the pathogenesis of KS because expression of v-FLIP
transcripts is increased in late-stage KS lesions, which also show reduced apoptosis
(Sturzl et al, 1999a). v-FLIP also binds to inhibitor of N F - k B ( I k B ) kinase, resulting in
its activation and the downstream induction of NF-KB (Liu et al, 2002). Activation of
NF-KB by KSHV may be necessary for the survival of PEL cells (Keller et al, 2000).
v-FLIP is likely to be expressed from an internal ribosome entry site (1RES) located
within the v-cyclin ORF (Bieleski and Talbot, 2001, Grundhoff and Ganem, 2001, Low
et al, 2001). Two cellular proteins are known to be expressed from 1RES elements
specifically during the G2/M phase of the cell cycle. The use of an 1RES for translation
enables these mRNAs to bypass the general inhibition of cap-dependent translation in
G2/M phase-arrested cells. Therefore expression of v-FLIP from an 1RES would ensure
the infected cell is protected from CTL-induced cell killing throughout the cell cycle
(Bieleski and Talbot, 2001).
1.2.8.4 Kaposin
In situ hybridisation shows that the T0.7 transcript, encoding kaposin A, is expressed in
all KS tumours examined, from early to late stages (Staskus et al, 1997, Sturzl et al,
1997, Sturzl et al, 1999b) and in PEL and MCD (Staskus et al, 1999). In advanced
tumours the vast majority of spindle cells are positive for this transcript indicating it may
73
have an important role in latent infection. Although T0.7 has been shown to be expressed
in uninduced PEL cell lines (Renne et al, 1996b), more recent results indicate it is not
present in PEL cell lines, but in its place exists a longer transcript whose length varies in
different cell lines and KS biopsies (Sadler et al, 1999). These mRNAs are 3' coterminal
with T0.7 and extend into a series of polymorphic direct repeats; DRl and DR2. These
transcripts are expressed during latency and up-regulated upon stimulation of lytic
replication with TPA (Sadler et al, 1999). Translation of the longer transcripts appears
to be initiated from CUG and GUG codons in vitro giving rise to kaposins B and C.
These can be detected in a small subsets of cells in cultures of the PEL cell line BCBL-1
(Kliche et al, 2001) but their function is unknown. All transcripts contain the K12 ORF
that encodes the small 60 amino acid protein kaposin A (Russo et al, 1996, Sadler et al,
1999). Kaposin A is a transmembrane protein that is present in many, but not all, BCBL-
1 cells (Kliche et al, 2001). Expression of kaposin A transforms NIH3T3 cells (Kliche et
al, 2001) and Rat-3 cells, which can form highly vascular sarcomas upon subcutaneous
injection into athymic nude mice (Muralidhar et al, 1998). The phenotypic changes
associated with kaposin A-mediated transformation require the binding and subsequent
membrane recruitment of the guanine nucleotide exchange factor cytohesin-1 (Kliche et
al, 2001).
1.2.8.5 K15
The finding that KSHV encodes a functional homologue of the major latent nuclear
antigen of EBV suggests it may also contain an equivalent of the EBV LMP-1, 2A and
2B. K15 of KSHV shares a similar genomic location and intron-exon structure to EBV
LMP-2A and both encode proteins predicted to have 12 transmembrane domains (Glenn
et al, 1999, Poole et al, 1999, Choi et al, 2000). K15 exists in two distinct forms, P
(predominant) and M (minor), which share very little sequence homology (Poole et al,
1999). The M form is thought to have derived from recombination with an unknown
herpesvirus. It is currently unknown how the sequence differences may affect the
functions of these two forms. K15 transcripts can be detected weakly by northern blot in
latent PEL cell lines and are up-regulated by TPA (Glenn et al, 1999, Choi et al, 2000).
K15 protein is latently expressed in PEL cell lines and in MCD, and protein levels do not
increase during lytic replication (Sharp et al, 2002). Like EBV LMP-1, both forms of
K15 have putative SH2, SH3 and TRAP binding domains (Glenn et al, 1999, Choi et al,
2000). Recombinant K15-P localises to membranes and interacts with TRAFs (Glenn et
74
al, 1999). More detailed analysis shows that the majority of K15 protein is localised to
the mitochondria and ER where it interacts with HAX-1, a protein of anti-apoptotic
function (Sharp et al, 2002). K l5 may also act to down-regulate BCR signal
transduction (Choi et al, 2000).
1.2.9 G enes expressed during lytic replication
ORE 25 mRNA, encoding MCP (Moore et al, 1996b, Nealon et al, 2001), can only be
detected in late stage KS in a subset of T0.7 expressing cells (Staskus et al, 1997). This
result is echoed in PEL (Staskus et al, 1999) suggesting that only a minority of infected
cells are actively producing new virus in these lesions. This is in contrast to MCD where
many infected cells express MCP RNA (Staskus et al, 1999). vIL-6 is expressed in 10-
30% of KSHV-positive plasmablasts in MCD (Parravinci et al, 1997, Du et al, 2001)
but only 1-5% in PEL and KS (Moore et al, 1996a, Ascherl et al, 1999, Staskus et al,
1999, Katano et al, 2000b, Parravicini et al, 2000, Brousset et al, 2001). Other lytic
proteins are also expressed in a higher proportion of cells in MCD than in PEL or KS
(Katano et al, 2000b). This suggests that MCD tissue may be a major site for the
production of new virus within the infected host. This is supported by the finding that
KSHV terminal repeats (Judde et al, 2000) and Ig rearrangements (Du et al, 2001) are
polyclonal in MCD.
The presence of replicating virus in KS, PEL and MCD suggests that lytic gene products
may be in part responsible for the pathogenesis of these diseases. This is consistent with
the finding that KSHV from KS, PEL and MCD has demethylated ORE 50 promoters
compared to KSHV from PBMCs (Chen et al, 2001). It is also of note that patients with,
or at risk of developing KS, have high antibody titres against KSHV lytic proteins
(Goudsmit et al, 2000). Lytically expressed gene products could play a role in the
pathogenesis of early KS hyperplasia through paracrine mechanisms as discussed in
section 1.2.5.1. This is supported by the observation that KSHV infection of primary
endothelial cells leads to transformation even though only 1-5% of cells become infected
(section 1.2.6). Gene expression studies have identified a number of lytic genes in the
KSHV genome (Chapter 4). A number of these are potentially involved in KSHV
pathogenesis.
75
1.2.9.1 Viral Bcl-2 (vBcl-2) and viral inhibitor of apop to sis (vlAP)
Viral Bcl-2 shares around 60% homology with human Bcl-2 family members such as
Bcl-2 and myeloid cell leukaemia-1 (Mcl-l) (Sarid et al, 1997). Transfected vBcl-2
inhibits Bax-mediated (Sarid et al, 1997) and virally induced (Cheng et al, 1997,
Friborg et al, 1998) apoptosis. The protein does not heterodimerise with Bcl-2-
associated X protein (Bax) or Bcl-2-antagonist/killer (Bak) (Cheng et al, 1997) and is
not cleavable by caspases (Bellows et al, 2000). vBcl-2 interacts with, and inhibits the
proapototic functions of the Bcl-2 family member Diva (Inohara et al, 1998).
Interestingly, unlike most Bcl-2 family members, both Diva and vBcl-2 contain poorly
conserved BH3 domains.
The protein encoded by the K7 ORF, vIAP, contains a BIR (baculovirus lAP repeat) and
is most closely related to a splice variant of the human protein survivin (Wang et al,
2002). Both survivin and vIAP also share some homology with Bcl-2 family members in
a putative BH2 domain. vIAP is able to bind to Bcl-2 through this BH2 domain and to
caspase 3 through its BIR domain. As with vBcl-2, K7 can protect cells from Bax-
induced apoptosis, as well as that induced by TNF-a, anti-Fas antibody. Thus, vIAP and
vBcl-2 may act during lytic replication to inhibit host responses against viral DNA
replication to ensure the cell survives long enough for the virus to assemble progeny.
1.2.9.2 Viral interferon regulatory factors (vIRFs)
Interferons (IFN) are named due to their ability to interfere with virus infection (Isaacs
and Lindenmann, 1957). Type I IFNs (IFN-a and IFN-P) are induced directly by virus
infection while type II IFN (IFN-y) is synthesised in response to the recognition of
infected cells by T lymphocytes and NK cells. Interferons stimulate an antiviral state in
target cells by inducing the transcription of genes containing an IFN-stimulated response
element (ISRE) or IFN-y activation site (GAS) in their promoter. These sites are bound
by interferon regulatory factors (IRFs), which regulate the expression of both IFN and
downstream genes. It is not surprising that many viruses target the production or actions
of interferons (reviewed in Goodboum et al, 2000).
Type I interferon has an inhibitory effect on the induction of KSHV lytic replication in
PEL cell lines (Monini et al, 1999a, Zoeteweij et al, 1999, Chang et al, 2000), possibly
76
explaining the beneficial effect of administration of this drug to KS patients (reviewed in
Krown, 1998), Type II interferon activates lytic replication (Chang et al, 2000)
indicating that the virus may be able to respond to host antiviral responses against latent
proteins by killing and escaping from the infected cell.
The KSHV genome contains a number of ORFs with homology to IRFs. Of these, ORFs
K9 and K ll.l, encoding vIRF-1 and vIRF-2 respectively, have been functionally
annotated. vIRF-1 blocks type I and type II interferon and host IRF mediated
transcriptional activation (Gao et al, 1997, Flowers et al, 1998, Li et al, 1998, Zimring
et al, 1998, Burysek et al, 1999a). This inhibition of host interferon signalling has
functional consequences. The expression of vIRF-1 blocks the induction of the cell cycle
inhibitor p21 ^ by IFN-P (Gao et al, 1997) and IFN-a induced cell cycle arrest in the
B-cell line Daudi (Flowers et al, 1998). vIRF-1 can also confer resistance to IRF-1
mediated induction of apoptosis by TNF-a (Burysek et al, 1999a). Although vIRF-1 is
able to bind IRF-1 and interferon consensus sequence binding protein (ICSBP) in vitro
(Burysek et al, 1999a) and IRF-3 and IRF-7 in vivo (Lin et al, 2001) this does not
appear to affect the properties of host IRFs. Rather vIRF-1 acts by competing with host
IRFs for binding the co-activators GBP (Li et al, 2000, Seo et al, 2000, Lin et al, 2001)
and p300 (Burysek et al, 1999a, Lin et al, 2001). Binding of vIRF-1 represses the
histone acetylase activity of p300 and prevents binding of p300/CBP-associated factor
(P/CAF), also a histone acetylase (Li et al, 2000). This is likely to be the same
mechanism of action as adenovirus El A (Juang et al, 1998). vIRF-I therefore prevents
host IRFs from acting to open up chromatin allowing the transcription of interferon
responsive genes. Importantly, endogenous vIRF-I in a lytically infected PEL cell line
(BCBL-1) is also associated with p300 (Li et al, 2000) and expression of antisense
vIRF-1 in BCBL-1 cells leads to increased activity of IRF regulated promoters but
decreased expression of KSHV lytic genes (Li et al, 1998). This shows that the action of
vIRF-1 to control host antiviral responses is necessary for optimal lytic replication of
KSHV.
Over-expression of vIRF-1 in NIH3T3 cells leads to transformation and tumour
formation in nude mice (Gao et al, 1997, Li et al, 1998). Human IRF-2 also acts as an
oncogene in this assay and also functions as a transcriptional repressor by inhibiting the
recruitment of p300/CBP. Interferons induce growth arrest by repressing c-myc
transcription through IRF-1. vIRF-1 is able to activate transcription of c-myc, which is
77
necessary for NIH3T3 transformation. Transactivation of c-myc by vIRF-1 is enhanced
by CBP but inhibited by p300 and P/CAF 1 (Jayachandra et al, 1999). Therefore, vIRF-
1 interaction with CBP can lead to transcriptional activation and repression. vlRF-1 also
binds p53, blocking both phosphorylation and acétylation mediated activation and
preventing p53-mediated apoptosis (Nakamura et al, 2001).
Like vIRF-1, vIRF-2 (encoding only a DNA binding domain) binds host IRFs (IRF-1,
lRF-2 and ICSBP) and p300 in vitro and does not bind ISRE sequences. vIRF-2 also
inhibits IRF-1 and IRF-3 mediated transcriptional activation of an IFN-a promoter
(Burysek et al, 1999b). Additionally, vIRF-2 blocks IFN-a mediated inhibition of
vesicular stomatitis virus (VSV) replication. This may be due to the binding of vIRF-2 to
PKR and subsequent inhibition of its kinase activity (Burysek and Pitha, 2001). PKR is
induced by interferons and activated by virally produced dsRNA and acts to limit viral
replication by inhibiting protein synthesis, activating anti-viral signal cascades and
triggering apoptosis (reviewed in Goodboum et al, 2000). PKR is also targeted by many
other viruses including EBV, through EBER-1 (Sharp et al, 1993). Therefore viral IRFs
may have additional properties to their host homologues.
1.2.9.3 K3 and K5
K3 and K5, also named modulator of immune recognition (MIR) 1 and 2, are 40%
identical at the amino acid level and are both able to down-regulate MHC class I
molecules in transfected cells (Coscoy and Ganem, 2000, Ishido et al, 2000b, Stevenson
et al, 2000, Haque et al, 2001a). A number of viruses down-regulate surface MHC
expression (reviewed in Alcami and Koszinowski, 2000) but K3 and K5 are unusual in
that they ubiquitinate MHC class I, promoting its endocytosis (Coscoy et al, 2001,
Hewitt et al, 2002). The murine gammaherpesvirus 68 (MHV-68) K3 orthologue
mediates virus evasion of CD8+ T-cells in vivo (Stevenson et al, 2002). This suggests
K3 and K5 act to minimise the number of lytic KSHV peptides displayed to CTLs. K5
only significantly down-regulates HLA-A and -B allotypes whereas K3 is also able to
down-regulate HLA-C and -E (Ishido et al, 2000b). The down-regulation of HLA-C and
-E leaves cells open to attack by natural killer (NK) cells. To avoid this, K5 is also able
to down-regulate the NK cell ligands intracellular adhesion molecule (ICAM)-I and B7-
2 (CD86) inhibiting NK cell-mediated cytotoxicity (Ishido et al, 2000a, Coscoy and
Ganem, 2001). Latent PEL cell lines also express reduced levels of MHC class I and
78
transporter associated with antigen processing-1 (TAP-1) (Brander et al, 2000). As K3
and K5 are not expressed during latency (Nicholas et al, 1997a, Sun et al, 1999, Zhu et
al, 1999a, Haque et al, 2000), it is unknown which latent gene product is responsible
for this.
1.2.9.4 Viral G-protein coupled receptor (vGPCR)
vGPCR is most closely related to the IL-8 receptors CXCRl and CXCR2 and, like these,
binds IL-8 (Arvanitakis et al, 1997), which is produced in KS lesions (Sciacca et al,
1994). The protein constitutively signals through PKC (Arvanitakis et al, 1997) and
protein kinase B (PKB) (Montaner et al, 2001) and activates related adhesion focal
tyrosine kinase (RAFTK), lyn (Munshi et al, 1999), JNK/stress-activated protein kinase
(SAPK), p38 MARK (Bais et al, 1998) and NF-kB (Couty et al, 2001, Montaner et al,
2001, Pati et al, 2001, Schwarz and Murphy, 2001). The activation of PKB is necessary
for the ability of vGPCR to promote endothelial cell survival (Montaner et al, 2001).
The activation of multiple signalling pathways may also explain how vGPCR is able to
transform transfected NIH3T3 cells (Bais et al, 1998). Although vGPCR is
constitutively active it can be further activated by growth related protein alpha (GROa)
(Gershengom et al, 1998, Pati et al, 2001).
In 1992, before KSHV was discovered, it was found that cells isolated from AIDS-KS
expressed elevated levels of VEGF (Weindel et al, 1992). AIDS-KS secreted VEGF
functions as an autocrine growth factor (Masood et al, 1997) and is angiogenic
(Nakamura et al, 1997), suggesting it could have a role in KS pathology. It may
therefore be significant that vGPCR transfected cells secrete elevated amounts of VEGF
into the medium which can induce the switch of HUVEC cells to an angiogenic
phenotype (Bais et al, 1998). The up-regulation of VEGF is through vGPCR’s activation
of the p38MAPK pathway (Sodhi et al, 2000). Transgenic mice expressing vGPCR
under the control of a T and NK cell specific promoter develop VEGF expressing
angioproliferative lesions reminiscent of KS (Yang et al, 2000). vGPCR also confers a
spindle cell morphology on endothelial cells in culture (Pati et al). DNA array analysis
shows that vGPCR expression in KS derived cells leads to up-regulation of VEGF, as
well as IL-6 and GROa (Poison et al, 2002). The constitutive activity of vGPCR could
therefore have a role in the development of early stage KS lesions.
79
1.2.9.5 Viral 0X2 (vOX2)
vOX2 is the KSHV homologue of the cellular protein 0X2 (CD200) (Russo et al, 1996).
However, unlike its cellular counter part, which delivers a restrictive signal (Hoek et al,
2000), vOX2 stimulates monocytes, macrophages and dendritic cells to produce the
inflammatory cytokines IL-ip and TNF-a (Chung et al, 2002). Expression of this
protein by KSHV infected endothelial cells could therefore activate the infiltrating
myeloid-lineage cells that are characteristic of KS.
1.2.9.6 Viral m acrophage inflammatory proteins (vMiPs)
KSHV encodes three chemokines named vMIP-I (encoded by K6), vMIP-II (K4) and
vMIP-III (K4.1). These are most closely related to the cellular chemokines thymus
activation-regulated chemokine (TARC), macrophage-derived chemokine (MDC) and
exodus-2 (K4 and K6) and myeloid progenitor inhibitory factor-2 (MPIF-2) (K4.1)
(McGeoch and Davison, 1999). All three vMIPs are angiogenic in the chick
chorioallantoic assay (Boshoff et al, 1997, Stine et al, 2000) implicating them in the
pathogenesis of KS. vMIP-I is a specific agonist of CCR8 (Dairaghi et al, 1999, Endres
et al, 1999) and vMIP-III of CCR4 (Stine et al, 2000). vMIP-II also acts as an agonist
of CCR8 (Sozzani et al, 1998) and of CCR3 on eosinophils (Boshoff et al, 1997).
However, it is generally regarded to be a broad-spectrum antagonist, blocking signalling
through CCRl, CCR2, CCR3, CCR5, CXCR4 (Kledal et al, 1997), CX3CR1 (Chen et
al, 1998b) and XCRl (Shan et al, 2000). The binding of CX3CR1 inhibits the
chemotaxis of activated leukocytes, which may be advantageous to prolonging viral
infection.
The host response to viral infection is mediated mainly by ThI cells and several viruses
have developed strategies to limit ThI responses (reviewed in Spriggs, 1996). Th2
cytokines down-regulate ThI responses (reviewed in Del Prete, 1998). The vMIP
receptors CCR3, CCR4 and CCR8 are found preferentially on Th2 cells and both vMIP-
II (Sozzani et al, 1998) and vMIP-III (Stine et al, 2000) preferentially chemoattract this
cell type. Therefore one function of the KSHV chemokines may be to favor a Th2, rather
than a ThI microenvironment thus protecting KSHV infected cells from ThI immunity
(Stine et al, 2000). Alternatively, during lytic infection the KSHV chemokines may be
potent chemoattractants for the circulating host cells of KSHV. The angiogenic
80
properties of the vMIPs may be a by-product of their chemotactic effects; eotaxin
(CCLll) attracts micro vascular endothelial cells via CCR3 and is angiogenic in vivo
(Salcedo et al, 2001) and vMIP-I induces chemotaxis of HUVECs via CCR8 (Haque et
a/., 2001b).
1.2.9.7 Viral interleukin-6 (vlL-6)
vIL-6 shares many of its properties with its human counterpart. It is able to prevent
plasmacytoma cell apoptosis (Moore et al, 1996a, Nicholas et al, 1997b) and promote
proliferation of myeloma cells (Burger et al, 1998). vlL-6 signals through the gpl30
subunit of the lL-6 receptor without need for the lL-6 receptor alpha chain (gp80)
(Molden et al, 1997, Mullberg et al, 2000, Chow et al, 2001) and activates the
JAK/STAT pathway (Molden et al, 1997, Wan et al, 1999). Mice inoculated with vlL-6
transfected N1H3T3 cells develop more highly vascularised tumours than control mice
and the tumours also express higher levels of VEGF (Aoki et al, 1999). Interestingly,
human lL-6 was implicated in the pathogenesis of AIDS-KS (Miles et al, 1990) and
MCD (Ishiyama et al, 1994) before KSHV was discovered. lL-6 is also an autocrine
growth factor for PEL (Asou et al, 1998). All these properties are highly advantageous
for KSHV infection thus providing a clear rationale for KSHV to have pirated the host
lL-6 gene.
1.2.9.8 K1
K1 is the most leftward ORF in the KSHV genome, in a position equivalent to LMP-1 in
EBV and saimiri transforming protein (STP) in HVS. Like these two proteins, K1
encodes a transmembrane protein. Expression of K1 in rodent fibroblasts leads to
transformation and K1 can substitute for STP in HVS to immortalise marmoset T
lymphocytes and induce lymphoma in common marmosets (Lee et al, 1998b). Kl-
transgenic mice also develop tumours that resemble spindle cell sarcomas and
plasmablastic lymphoma (Prakash et al, 2002). However, unlike LMP-1 and STP, K1 is
unlikely to be expressed during latency and so it is unclear if this property of K1 is
relevant for KSHV induced transformation. K1 instead functions to allow optimum lytic
reactivation (Lagunoff et al, 2001). The predicted size and structure of K1 is similar to
those of a single-domain Ig superfamily receptor. K1 also contains a functional
immunoreceptor tyrosine-based activation motif (ITAM) (Lee et al, 1998a) through
81
which it is able to constitutively activate B-cell signalling pathways through syk
phosphorylation leading to nuclear factor of activated T cells (NFAT) (Lagunoff et al,
1999) and NF-KB dependant transcription (Samaniego et al, 2001, Prakash et al, 2002).
Like vGPCR and vIL-6, K1 expression also stimulates cytokine secretion (Samaniego et
a/., 2001).
Like IgX and Ig K light chains, which form part of the BCR, K1 interacts with BCR heavy
( p ) chains in the ER (Lee et al, 2000a). But unlike IgÀ and Ig K , which direct BCR
complexes to the cell surface, K1 interacts with p chains to retain BCR complexes in the
ER. The down-regulation of BCR by K1 along with the co-stimulatory molecule B7-2 by
K5 may inhibit T-cell activation by KSHV lytic antigens displayed on MHC class I I .
82
1.3 DNA arrays
1.3.1 Introduction to genom ics
As more and more genomes give up their coding content to modem automated high-
throughput sequencing methods so increases the sheer scale of the challenges facing
biology. No longer restricted to dissecting biological mechanisms or pathways one step
at a time we are now theoretically able to address the cell or organism as a whole. This
change in biological methodology is supremely relevant to virus research. Virology has
been post-genomic since the first sequencing of a complete genome, that of the phi XI74
bacteriophage, by Sanger and colleagues in 1977 (Sanger et al, 1977a). The publication
of the first draft of the human genome sequence, predicting 30,000-40,000 genes,
similarly heralded the beginning of the human genomic era (International Human
Genome Sequencing Consortium, 2001, Venter et al, 2001).
Although providing us with clues, nucleotide sequence alone does not tell us what the
genes do or where and when they do it. Answering these questions has dictated novel
experimental approaches and technologies, collectively termed functional genomics.
Gene function can be investigated in parallel by molecular genetics. Gene expression can
be prevented using RNA interference (RNAi) (Fire et al, 1998) or by random insertion
of transposable elements (Smith et al, 1995), or expressed exogenously, using MaRX
for example (Hannon et al, 1999). Protein-protein interactions can be identified on a
genomic scale using the yeast two-hybrid system (Ito et al, 2000, Uetz et al, 2000), The
questions of where and when a gene is expressed can also provide clues to its function.
This may lead to the identification of that gene as a potential diagnostic marker or drug
target. Furthermore, gene promoters act to constantly tune genomic activity to the
changing inputs of information about the identity, internal state and surrounding
environment of the cell. Therefore the complement of genes that are expressed
(transcriptome) dictates cellular phenotype and function. This provides fingerprints or
expression signatures that identify a cellular process or response, a cell type or a disease
state.
The measurement of the total protein complement of the cell (proteome) is possible on a
genomic scale using 2-dimensional gels (O'Farrell, 1975) or, more recently, protein
arrays (Lueking et al, 1999, Haab et al, 2001). Similarly, a number of methods have
83
been developed to measure mRNA levels on a genomic scale. These include differential
display (Liang and Pardee, 1992), subtractive hybridisation (Bonaldo et al, 1996), serial
analysis of gene expression (SAGE) (Velculescu et al, 1995) and highly parallel
northern blotting (Brown et al, 2001). However, the method that has gained the widest
acceptance is DNA arrays.
1.3.2 A description of DNA arrays
The history of the DNA array can be traced back to work in the 1970s. In 1975, Ed
Southern lent his name to the technique of detecting specific DNA fragments in a
mixture separated by gel electrophoresis (Southern, 1975). This method exploits the fact
that DNA is exquisitely specific for its complementary sequence even when present in a
complex mixture. As the use of molecular biology proliferated in laboratories,
researchers began using Southern blotting to interrogate the sequence of DNA carried by
clones in libraries and from this it was only a small step to the use of gridded libraries in
which each clone could be uniquely identified by its position in a microtitre plate and
corresponding position on a filter (Lennon and Lehrach, 1991). Two main innovations
led to the development of DNA arrays. The first is robotics, giving the ability to
automate array construction with reproducibility and accuracy at a microscopic scale.
The second is the vast amounts of data that can be stored on today's relatively
inexpensive personal computers.
DNA arrays take a number of different forms but all have a number of things in
common. All consist of an ordered array of DNA probes of known sequence, identified
by their location on a solid-phase support. Each probe or set of probes is complementary
to a specific gene or expressed sequence tag (EST). A solution containing thousands of
labelled nucleic acid targets is incubated with the array. Each probe specifically
hybridises to complementary sequences present in the nucleic acid mix thus separating
the labelled targets according to sequence. The intensity of the label at each probe
location gives a measure of the concentration of that sequence in the starting target
mixture. Therefore, DNA arrays can be used to measure the relative concentration of
specific mRNA species in total cellular mRNA, and thus the activity of the
corresponding genes.
84
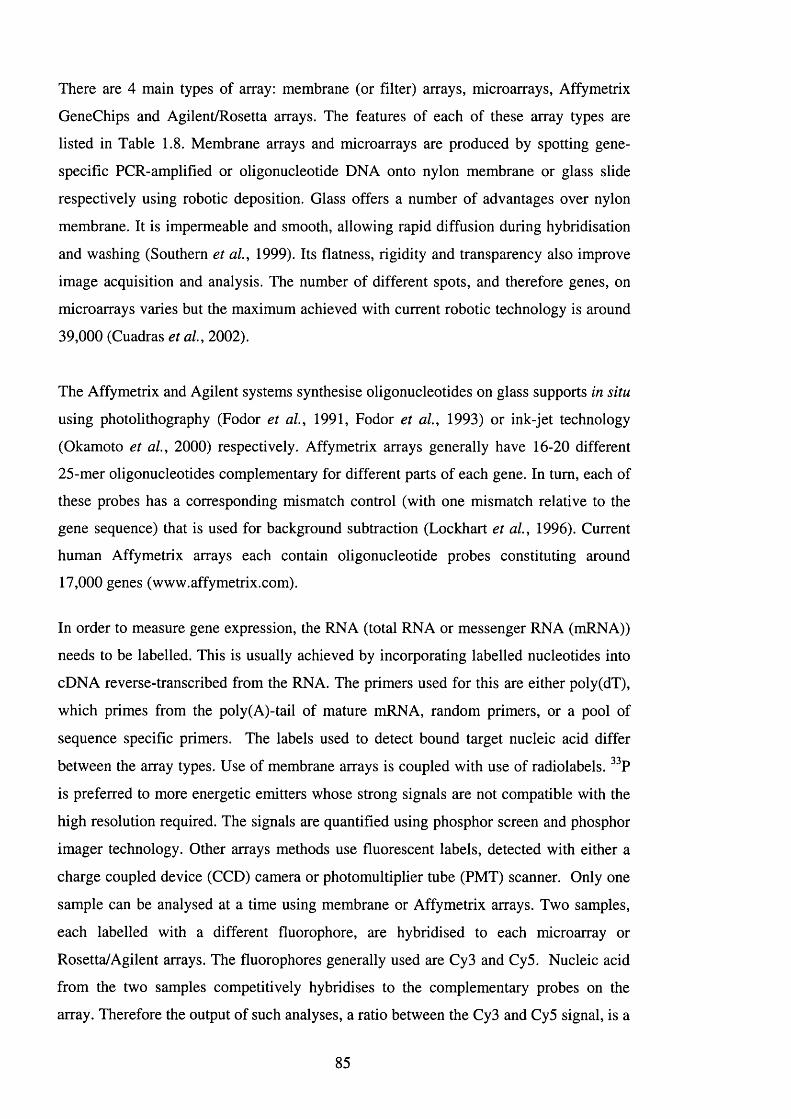
There are 4 main types of array: membrane (or filter) arrays, microarrays, Affymetrix
GeneChips and Agilent/Rosetta arrays. The features of each of these array types are
listed in Table 1.8. Membrane arrays and microarrays are produced by spotting gene-
specific PCR-amplified or oligonucleotide DNA onto nylon membrane or glass slide
respectively using robotic deposition. Glass offers a number of advantages over nylon
membrane. It is impermeable and smooth, allowing rapid diffusion during hybridisation
and washing (Southern et al, 1999). Its flatness, rigidity and transparency also improve
image acquisition and analysis. The number of different spots, and therefore genes, on
microarrays varies but the maximum achieved with current robotic technology is around
39.000 (Cuadras et al, 2002).
The Affymetrix and Agilent systems synthesise oligonucleotides on glass supports in situ
using photolithography (Fodor et al, 1991, Fodor et al, 1993) or ink-jet technology
(Okamoto et al, 2000) respectively. Affymetrix arrays generally have 16-20 different
25-mer oligonucleotides complementary for different parts of each gene. In turn, each of
these probes has a corresponding mismatch control (with one mismatch relative to the
gene sequence) that is used for background subtraction (Lockhart et al, 1996). Current
human Affymetrix arrays each contain oligonucleotide probes constituting around
17.000 genes (www.affymetrix.com).
In order to measure gene expression, the RNA (total RNA or messenger RNA (mRNA))
needs to be labelled. This is usually achieved by incorporating labelled nucleotides into
cDNA reverse-transcribed from the RNA. The primers used for this are either poly(dT),
which primes from the poly(A)-tail of mature mRNA, random primers, or a pool of
sequence specific primers. The labels used to detect bound target nucleic acid differ
between the array types. Use of membrane arrays is coupled with use of radiolabels.
is preferred to more energetic emitters whose strong signals are not compatible with the
high resolution required. The signals are quantified using phosphor screen and phosphor
imager technology. Other arrays methods use fluorescent labels, detected with either a
charge coupled device (CCD) camera or photomultiplier tube (PMT) scanner. Only one
sample can be analysed at a time using membrane or Affymetrix arrays. Two samples,
each labelled with a different fluorophore, are hybridised to each microarray or
Rosetta/Agilent arrays. The fluorophores generally used are Cy3 and Cy5. Nucleic acid
from the two samples competitively hybridises to the complementary probes on the
array. Therefore the output of such analyses, a ratio between the Cy3 and Cy5 signal, is a
85
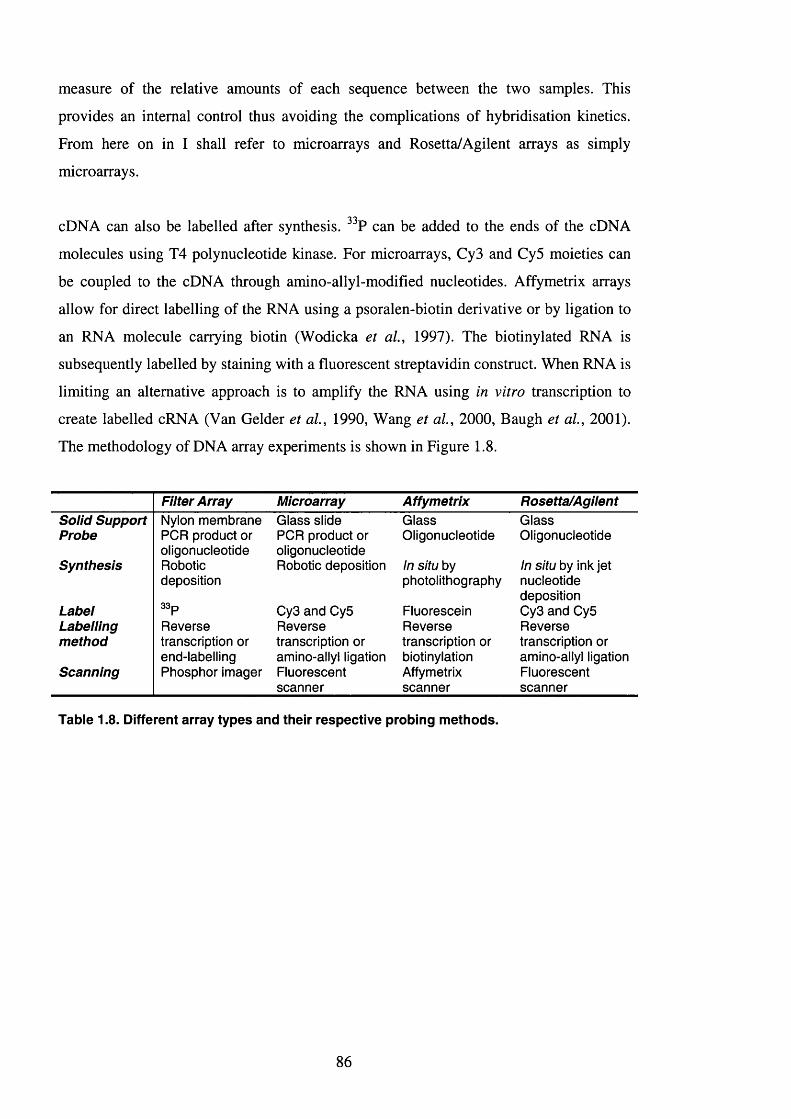
measure of the relative amounts of each sequence between the two samples. This
provides an internal control thus avoiding the complications of hybridisation kinetics.
From here on in I shall refer to microarrays and Rosetta/Agilent arrays as simply
microarrays.
cDNA can also be labelled after synthesis. can be added to the ends of the cDNA
molecules using T4 polynucleotide kinase. For microarrays, Cy3 and Cy5 moieties can
be coupled to the cDNA through amino-allyl-modified nucleotides. Affymetrix arrays
allow for direct labelling of the RNA using a psoralen-biotin derivative or by ligation to
an RNA molecule carrying biotin (Wodicka et al, 1997). The biotinylated RNA is
subsequently labelled by staining with a fluorescent streptavidin construct. When RNA is
limiting an alternative approach is to amplify the RNA using in vitro transcription to
create labelled cRNA (Van Gelder et al, 1990, Wang et al, 2000, Baugh et al, 2001).
The methodology of DNA array experiments is shown in Figure 1.8.
Filter Array Microarray Affymetrix Rosetta/AgilentSolid Support Nylon membrane Glass slide Glass GlassProbe PCR product or PGR product or Oligonucleotide Oligonucleotide
oligonucleotide oligonucleotideSynthesis Robotic Robotic deposition In situ by In situ by ink jet
deposition photolithography nucleotidedeposition
Label 3 3 p Cy3 and Cy5 Fluorescein Cy3 and Cy5Labelling Reverse Reverse Reverse Reversemethod transcription or transcription or transcription or transcription or
end-labelling amino-allyl ligation biotinylation amino-allyl ligationScanning Phosphor imager Fluorescent Affymetrix Fluorescent
scanner scanner scanner
Table 1.8. Different array types and their respective probing methods.
86
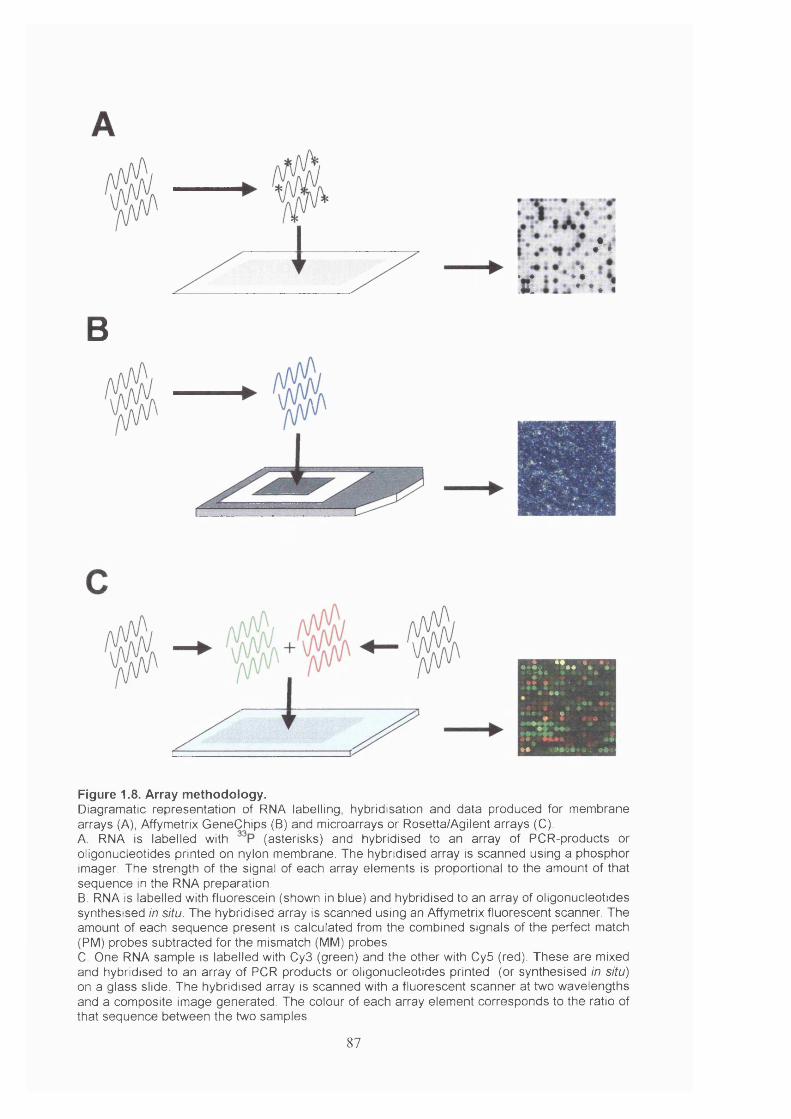
ï
A l*### #• €
B
*4 ; . **V \
! >e . #
•• . «ftK
Figure 1.8. Array methodology.Diagramatic representation of RNA labelling, hybridisation and data produced for membrane arrays (A), Affymetrix GeneChips (B) and microarrays or Rosetta/Agilent arrays (C).A RNA is labelled with (asterisks) and hybridised to an array of PCR-products or oligonucleotides printed on nylon membrane. The hybridised array is scanned using a phosphor imager. The strength of the signal of each array elements is proportional to the amount of that sequence in the RNA preparation.B. RNA is labelled with fluorescein (shown in blue) and hybridised to an array of oligonucleotides synthesised in situ. The hybridised array is scanned using an Affymetrix fluorescent scanner. The amount of each sequence present is calculated from the combined signals of the perfect match (PM) probes subtracted for the mismatch (MM) probes.0. One RNA sample is labelled with Cy3 (green) and the other with Cy5 (red). These are mixed and hybridised to an array of PCR products or oligonucleotides printed (or synthesised in situ) on a glass slide. The hybridised array is scanned with a fluorescent scanner at two wavelengths and a composite image generated. The colour of each array element corresponds to the ratio of that sequence between the two samples.
87
1.3.3 Using DNA arrays to study gene expression
As arrays measure the amount of a given sequence in a complex mixture they can be
used to measure the level at which a gene is expressed (number of RNA molecules) or
the number of copies in the genome (number of DNA molecules). Affymetrix arrays can
be used to detect variations in sequence as they contain probes able to detect single-base
mismatches (Pease et al, 1994). Microarrays have also been used to identify genes with
secreted or membrane-associated products (Diehn et al, 2000), mRNA species in the
process of translation (Johannes et al, 1999, Zong et al, 1999b) and promoter elements
that bind a specific protein (Ren et al, 2000, Iyer et al, 2001). However, arrays have the
greatest utility for the measurement of mRNA abundance.
The first microarray contained just 48 probes for the model plant Ambidopsis (Schena et
al, 1995). Analysis of differential expression between root and leaves acted as proof of
principle that arrays could be used to compare the genes expressed between two samples.
The first genome-scale array based expression analyses were of the yeast Saccharomyces
cerevisiae whose entire transcriptome has been measured under various experimental
conditions and in a whole series of mutants (DeRisi et al, 1997, Cho et al, 1998, Chu et
al, 1998, Spellman et al, 1998, Gasch et al, 2000, Hughes et al, 2000). This work has
helped assign function to many of the three-quarters of yeast ORFs that had no known
function and piece together molecular pathways within these cells. These studies
demonstrated three important features of microarray expression analyses; firstly that the
expression pattern of a gene or EST associates it with a particular function or cellular
response, so called “guilt by association” (Chu et al, 1998), secondly that groups of
genes which act in a common process are co-regulated, and thirdly that the genes
expressed in a cell provide information about its state.
The power of microarray analysis was soon turned towards the analysis of human disease
with the identification of inflammatory disease-related genes (Heller et al, 1997) and
those expressed in cancer (DeRisi et al, 1996, Pérou et al, 1999). Microarrays have now
become a major tool for the analysis of human diseases, particular cancer. Before I
discuss the application of microarrays to the analysis of cancer and viral infection I shall
first introduce some of the tools necessary for the analysis of such large amounts of data.
88
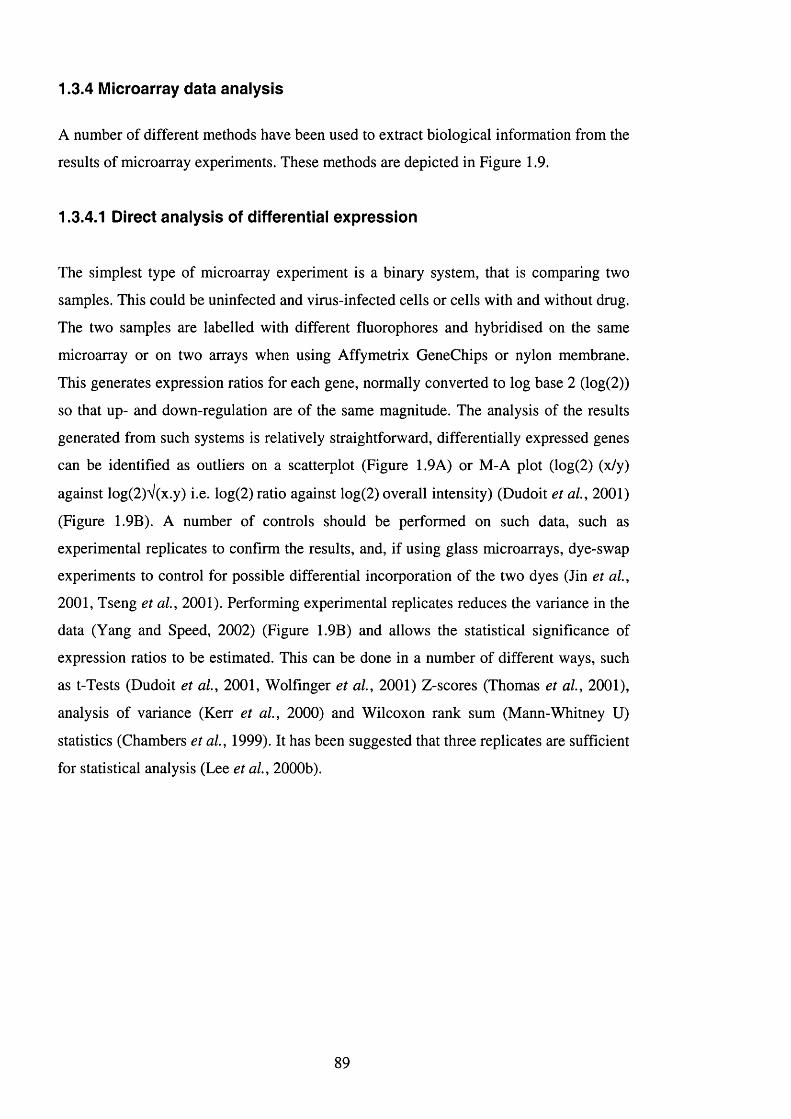
1.3.4 Microarray data analysis
A number of different methods have been used to extract biological information from the
results of microarray experiments. These methods are depicted in Figure 1.9.
1.3.4.1 Direct analysis of differential expression
The simplest type of microarray experiment is a binary system, that is comparing two
samples. This could be uninfected and virus-infected cells or cells with and without drug.
The two samples are labelled with different fluorophores and hybridised on the same
microarray or on two arrays when using Affymetrix GeneChips or nylon membrane.
This generates expression ratios for each gene, normally converted to log base 2 (log(2))
so that up- and down-regulation are of the same magnitude. The analysis of the results
generated from such systems is relatively straightforward, differentially expressed genes
can be identified as outliers on a scatterplot (Figure 1.9A) or M-A plot (log(2) (x/y)
against log(2)V(x.y) i.e. log(2) ratio against log(2) overall intensity) (Dudoit et al, 2001)
(Figure 1.9B). A number of controls should be performed on such data, such as
experimental replicates to confirm the results, and, if using glass microarrays, dye-swap
experiments to control for possible differential incorporation of the two dyes (Jin et al,
2001, Tseng et al, 2001). Performing experimental replicates reduces the variance in the
data (Yang and Speed, 2002) (Figure 1.9B) and allows the statistical significance of
expression ratios to be estimated. This can be done in a number of different ways, such
as t-Tests (Dudoit et al, 2001, Wolfmger et al, 2001) Z-scores (Thomas et al, 2001),
analysis of variance (Kerr et al, 2000) and Wilcoxon rank sum (Mann-Whitney U)
statistics (Chambers et al, 1999). It has been suggested that three replicates are sufficient
for statistical analysis (Lee et al, 2000b).
89
Figure 1.9. Array analysis methods (opposite).A. Scatter plots comparing signals for oligonucleotide probes on Affymetrix arrays between HCMV infected and uninfected ceils at three timepoints. Differential expression is measured by distance from the line x=y. Figure taken from Zhu et a i, (1998).B. M-A plots for comparing two samples using one microarray (n=1) or 8 microarrays (n=8). This shows that experimental replication increases the significance of differentially expressed genes (green spots). Figure taken from Callow et a i, (2000).C. Average-linkage hierarchical clustering of 128 B-cell lymphoma samples (arrays) and 4026 array elements. Each column represents one array and each row one array element. Relative gene expression level is represented as a pseudo-colored representation of log(2) expression ratio with red being above and green below the row/column median level of expression as shown by the scale below. Groups of genes with related functions cluster together (identified by coloured bars on the right). Figure taken from Alizadeh et a i, (2000).D. Self-organising map (SOM) of yeast expression data. The map consists of 24 nodes in which the genes share a similar expression pattern (mean expression shown by black line, limits by red lines). The nodes are arranged in a 4x6 matrix and related clusters are placed in adjacent positions in the grid. Figure taken from Young, (2000).E. Principle component analysis (PGA) of an artificial data set. PGA is able to separate the 9 distinct expression patterns contained within the data in 2-dimensional space. Figure taken from Quackenbush, (2001).
90
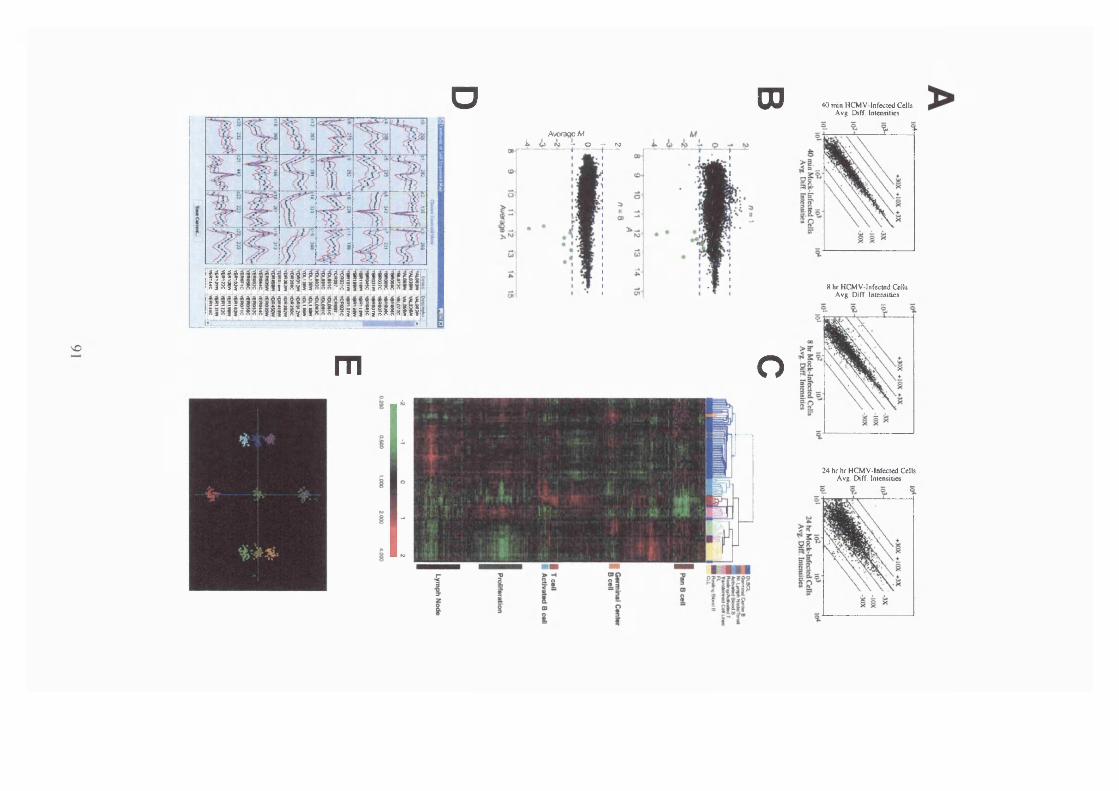
o D3
mi i i i i s i i s i i i iIII
m
AvcfogoM 1 ^ it) y O ^ no
o
40 min HCMV-lnfecled Cells Avg. Diff. Iffiensities
8 hr HCMV-Infected Cells Avg. Diff. Intensities
24 hr hr HCMV-Infected Cells Avg. Diff. Intensities
1.3.4.2 Analysis of multiple samples
More commonly, more than two samples are analysed in array experiments. This can be
in the form of a timecourse, looking at how the expression pattern of a cell population
changes over time in response to a specific stimulus, or multiple independent samples,
such as comparing different tissues in a single mouse or the same tissue between mice.
When analysing more than two samples with microarrays the question of what to
compare the data to arises. In timecourse experiments the samples are normally
hybridised against RNA from the zero time point, creating expression measurements
relative to untreated cells (Iyer et al, 1999). When analysing a number of independent
samples a common reference RNA is used (Pérou et al, 1999). The purpose of this
reference is to bind to as many of the array elements as possible so providing expression
ratios for all the genes expressed in the samples of interest. The reference RNA is
normally a pool of RNA from the samples to be analysed or from related samples in
plentiful supply, such as cell lines. Theoretically, a common reference could also be
made from the array probes by in vitro transcription. The common reference RNA is
generally labelled with Cy3 and experimental sample RNA with Cy5. The expression
ratios generated for each gene (Cy5/Cy3) is therefore a measurement of gene expression
level in the sample relative to the reference. The reference RNA is a common
denominator for all samples and can be removed by transforming the data so that the
median expression ratio for each gene across all samples equals 0 (median centring).
This replaces Cy3 as the denominator with the median Cy5 signal so that the expression
of each gene in each sample is now relative to its median expression level in all samples.
Before array data can be analysed in this way the results from the different arrays need to
be normalised. This adjusts for differences in the labelling and detection efficiencies for
the labels and for possible differences in the quantity of RNA. Affymetrix and membrane
array experiments have the additional variable of hybridisation efficiency that is not
controlled for as it is in microarray experiments. For microarrays, the most common
method for normalising the data is to apply a scaling factor that sets the average or
median expression ratio to 1. This assumes that the number of genes up-regulated
balances the genes down-regulated so, on average, there is no change in expression. It
also assumes that the expression ratio is independent of signal intensity. For some
microarray experiments this is not the case and other methods, such as LOWESS (locally
92
weighted scatterplot smoothing), which calculates lines of best-fit by local linear
regression, may be more appropriate (Yang et al, 2002). Membrane array and
Affymetrix array data also need to be normalised before analysis. Membrane arrays can
be normalised by equalising array-wide mean expression or by using housekeeping genes
(DeRisi et al, 1996, Heller et al, 1997, Chambers et al, 1999). The housekeeping gene
method assumes that the expression of human genes with basic cellular functions
remains constant over different experimental conditions.
1.3.4.3 C luster analysis
The large amount of data generated by array experiments of this kind has dictated the
application of complex mathematical techniques for its analysis. These methods,
collectively termed cluster analysis, act to reduce the dimensionality of the data by
identifying common patterns.
Hierarchical clustering
The first method to be used, and now the most common, is average-linkage hierarchical
clustering (Hartigan, 1975, Eisen et al, 1998). This groups genes by their expression
pattern across the samples (gene vector), and samples by the expression pattern of the
genes (sample vector). Data are assembled into a matrix of log(2) expression ratios, with
each row representing a single array element (gene) and each column the results from
one array (sample). Gene and sample expression vectors are compared in pair-wise
fashion by their Pearson correlation coefficient. The two most common vectors are
joined by a node and the average vector calculated. This average vector replaces the two
joined vectors and the process is repeated. This agglomeratively builds up a dendrogram
relating all the genes or samples by their expression pattern (Figure 1.9C). The shorter
the branch connecting two genes or samples, the more similar the expression patterns.
The tree structures force the reordering of the genes and samples in the expression matrix
so that genes or samples with similar expression patterns become grouped together.
Expression levels are depicted as a colour scale with green representing negative and red
positive log(2) expression values. This provides a simple pictorial means for identifying
groups of co-expressed genes.
93
Grouping of the data in this manner reveals a number of important features of microarray
data. Genes with similar function tend to be co-expressed and so cluster together (Eisen
et al, 1998). This property suggests functions for novel or poorly characterised genes
based on the known functions of the genes with which they cluster. It also shows that
samples from similar sources cluster together because they express similar sets of genes
(Pérou et al, 1999). This allows cancer classification (Alizadeh et al, 2000) and sample
identification by expression pattern (Ross et al, 2000).
K-m eans clustering, self-organising m aps and principle com ponent
analysis
The agglomerative nature of hierarchical clustering has several limitations. As the
clusters grow in size, the average vector may no longer represent any of the genes within
that cluster (Quackenbush, 2001). For any given dendrogram of n elements there are 2"'
ordering of the data (any node can be rotated 180° without changing the branch length)
and there is no means within the clustering algorithm to determine the ordering that
maximises the similarity between adjacent vectors (Eisen et al, 1998). Also, the
clustering of genes is based on local decisions without considering the structure of the
entire dataset (Tamayo et al, 1999). Due to these limitations the use of divisive
clustering techniques, such as k-means clustering (Tavazoie et al, 1999) and self-
organising maps (SOM) (Kohonen, 1991, Tamayo et al, 1999), have been proposed.
These differ from hierarchical clustering in that instead of building up clusters from
single genes, they iteratively partition the data into a set number of clusters. K-means
clustering partitions the data into k clusters in which the data is more related than
between clusters. This is achieved by minimising the sum of squares between the vectors
within each cluster. Self-organising maps is a neural network-based algorithm that
reduces the dimensionality of the data by assigning genes to a set number of nodes
(clusters) arranged in 2-dimensional space. The nodes represent the most prominent
patterns in the data and similar patterns occur as neighbouring nodes (Figure 1.9D). The
topology and number of nodes must be defined by the user. Another form of SOMs is the
1-dimensional SOM, which orders nodes along an axis according to their similarity. This
has uses in ordering the clusters produced by hierarchical clustering (Chu et al, 1998,
Eisen et al, 1998).
94

A disadvantage of both k-means clustering and SOMs is that the user needs to decide on
the number of partitions in the data. One way to identify how many groups are truly
present in the data is principle component analysis (PCA or multi-dimensional scaling).
PCA finds r new variables (components) that best explain the variation in the data
consisting of n original variables, where r is less than n (Raychaudhuri et al, 2000). Each
of these new variables is a linear combination of the original variables. For example, use
of PCA revealed that just two variables (r=2) accounted for over 90% of the variance in
yeast cell cycle data consisting of 7 time points (n=7). Plotting these two principle
components against each other showed how the 7-dimensional data clusters in 2-
dimensional space. Therefore this can be used to find how many clusters there are in the
data (Figure 1.9E).
Supervised clustering
All of these above methods are unsupervised, that is one does not place any constraints
on the data with regards to which genes should be clustered together. Supervised
methods, such as support vector machine (SVM), find the variables that are most
correlated with a division that can then be used to classify a training set of data into
known classes (Golub et al, 1999, Brown et al, 2000, Furey et al, 2000). The accuracy
of the algorithm is then gauged by asking it to predict the class of an independent test
data set or, if that is not possible, the original data set by leave-one-out cross-validation.
Supervised techniques can be useful to differentiate samples based on variables that may
only be related to a small number of genes, such as clinical outcome. They can also be
useful to find patterns of gene expression in biological samples containing extraneous
material, such as the inclusion of other tissue types in cancer biopsies.
1.3.5 Application of arrays to oncology
The field that has perhaps witnessed the greatest benefits from the use of arrays is
oncology. Array analysis of gene expression has proven to be a particularly powerful
means for understanding B-cell tumours. Historically, much of cancer research has been
focused on the analysis of genes that are expressed differentially in cancer cells
compared with their normal counterparts. The first study to investigate this
systematically used SAGE (Zhang et al, 1997). Arrays have since become the
95
technology of choice for expression profiling of tumours. Array studies of cancer can be
divided into four main types:
1. Cancer classification
2. Prediction of outcome
3. Mechanisms of oncogenesis
4. Identification of therapeutic targets
I shall discuss how arrays have led to advances in each of these areas in turn, with
particular reference to the study of B-cell neoplasia. However, these subjects are all
inter-linked as cancers with separate classifications are likely to have different
mechanisms of transformation, and therefore different markers for prognosis and targets
for therapy.
1.3.5.1 Cancer classification
Different classes of cancer have different clinical courses and responses to treatment and
can thus be considered distinct disease entities. Therefore, assigning a tumour to a known
class (class prediction) is critical for its management and therapy. Historically, cancers
are classified by their morphology but this can be limited, and in some cases, incorrect.
Also, for many tumours, no single test, including cytogenetic analysis and
immunophenotyping, is sufficient to establish a diagnosis. Additionally, the diversity in
clinical course within some diagnostic categories suggests the presence of unrecognised
cancer sub-types requiring tailored therapy. However, prior to arrays there was no
general approach for identifying new cancer classes (class discovery).
The first study to use arrays to address these issues was that of Golub et al, (1999),
who chose acute leukaemia as a test case. The authors used SOMs to find differences in
gene expression between ALL and AML and employed a supervised learning algorithm
to find the 50 genes that were most able to predict between the two cancer classes. The
classification between one of these two types is critical, as the two cancers have different
responses to chemotherapy. This demonstrated that cancer could be classified according
to gene expression profile. The study also showed that by measuring the expression of
thousands of genes one can find relatively small groups that are predictive and for which
the measurement of expression is readily transferable to a clinical assay. A number of
96
other studies have extended this work on acute leukaemia. ALL associated with
chromosomal translocation involving the MLL has an expression profile distinct from
ALL and AML, consistent with transformation of an early haematopoietic progenitor
expressing select multi-lineage markers (Armstrong et al, 2002). In addition, T-ALL
can be split into three types indicative of leukaemic arrest at three specific stages of
normal T-cell development - pro-T, early cortical thymocyte and late cortical thymocyte
(Ferrando et al, 2002). Another study using a larger number of samples and supervised
techniques was able to find a group of genes whose expression predicts between T-ALL,
E2A-PBX1, bcr-ABL, TEL-AMLl, MLL and hyperploid >50 sub-types of ALL with a
diagnostic accuracy of 96% (Yeoh et al, 2002).
Ultimately, if arrays are to be used for cancer diagnosis in clinical practice they should
be standardised and able to classify multiple cancer types. This would also generate a
large and ever-expanding dataset that would hone the ability of a supervised learning
algorithm to differentiate between classes. Classification between multiple cancer classes
has been achieved by a number of groups (Khan et al, 2001, Ramaswamy et al, 2001,
Su et al, 2001, Pomeroy et al, 2002). PCA combined with supervised learning is able to
differentiate tumour classes within morphologically similar groups; small round blue-cell
tumours (SRBCTs) of childhood (Khan et al, 2001) and embryonal tumours of the
central nervous system (CNS) (Pomeroy et al, 2002). Ramas wamy et al, (2001)
analysed 218 samples comprising 14 different tumour types. They found that hierarchical
clustering is unable to separate many of the epithelium-derived tumours but that SVMs
can correctly classify 78% of tumours. Similarly, Su et al, (2001) used SVMs to predict
the tissue of origin of 175 carcinomas of 11 classes after hierarchical clustering failed to
separate them.
As described briefly in section 1.1.3, array analysis has revealed novel class divisions in
B-cell tumour types previously thought homogenous. Alizadeh et al, (2000) compared
the gene expression of DLBCL, FL and CLL with normal B-cells from different stages
of development. Unexpectedly, hierarchical clustering identified two distinct sub-types
of DLBCL, GC B-like and activated B-like, which can be differentiated by the
expression of different sets of genes. As their names suggest, the two sub-types differ
with respect to clusters of genes expressed in normal B-cell types; GC B-like DLBCL
over-expresses genes characteristic of GC B-cells, such as BCL-6 and A-myb, whereas
activated B-like DLBCL expresses genes induced by in vitro activation of peripheral
97
blood B-cells such as FLIP and IRF4. This finding suggests that the two sub-types of
DLBCL are derived from different stages of B-cell development. This was confirmed by
a later study that showed the presence of ongoing Ig somatic mutation in GC B-like but
not activated B-like DLBCL (Lossos et al, 2000). Importantly, an independent study,
using Affymetrix arrays as opposed to microarrays, confirmed the two types of DLBCL
(Shipp et al, 2002). Similarly, hierarchical clustering of multiple myeloma shows that
patient samples fall into 4 categories, MMl to MM4, with MMl being the most similar
to normal plasma cells and MM4 more closely resembling multiple myeloma cell lines
(Zhan et al, 2002). MM4 cases are also associated with clinical parameters linked with
poor prognosis such as high serum P2-microglobulin levels. Interestingly, MM3 and
MM4 are associated with high expression of interferon-inducible genes suggestive of
virus infection.
Another aim of array studies of tumour classification is the identification of tumour-
specific markers that could be used as a simple clinical assay. Membrane array analysis
of 31 haematopoietic cell lines showed that clusterin was expressed in all ALCL cell
lines but not in any other tumour types (Wellmann et al, 2000). This was then confirmed
by immunohistochemistry on paraffin sections.
1.3.5.2 Prediction of outcom e
As discussed in the previous section, cancer classification is important for selection of
the optimum therapy. Arrays have also been used to find gene expression patterns that
are able to predict the clinical course of a patient’s disease and offer a prognosis. Most of
these studies use supervised learning to find genes correlated with cured versus fatal or
refractory. Although this has proved successful, the analysis method in not ideal as it
does not offer a continuous measure of correlation between gene expression and clinical
outcome.
The first study to find clinical correlates of gene expression was that of Alizadeh et al,
(2000), who noted that activated B-like DLBCL was associated with significantly lower
survival time than GC B-like DLBCL. They also showed that this prognostic indicator is
independent of the currently accepted International Prognostic Indicator (IPI) therefore
providing an additional and complementary measure. A later study, using supervised
techniques, failed to find associations between DLBCL sub-type and outcome but did
98
find an alternative gene set predictive of outcome, with genes involved in BCR
signalling being associated with poor prognosis (Shipp et al, 2002). Interestingly,
comparison of CLL gene expression and clinical outcome also identified activation of
BCR signalling pathways as being predictive of poor prognosis (Rosenwald et al, 2001).
These pathways may provide survival signals as described in section 1.1.1.1.
Supervised learning has also been used to find genes able to predict clinical outcome for
a number of other cancer types, including embryonal tumours of the CNS (Pomeroy et
al, 2002), ALL (Yeoh et al, 2002), prostate cancer (Singh et al, 2002) and breast
cancer (van 't Veer et al, 2002). Yeoh et al were unable to find a single predictor that
functioned for all sub-types of ALL but their within-type predictors for T-ALL and
hyperploid >50 subtypes were 97% and 100% accurate respectively. Interestingly, they
were also able to predict the subsequent appearance of secondary AML after therapy
failure in the T-ALL sub-type even though this originates from a separate stem cell
population. In breast cancer, chemo- or hormonal therapy reduces the risk of metastasis
by one third but it is estimated that it is only necessary for 20-30% of patients (Early
Breast Cancer Trialists' Collaborative Group, 1998a, Early Breast Cancer Trialists'
Collaborative Group, 1998b). Similarly, it is important to identify those 30% of patients
at risk of reoccurrence of prostate cancer after surgery so as to avoid treating the cured
majority (Roberts et al, 2001a, Roberts et al, 2001b). The studies of Singh et al and
Van’t Veer et al, (2002) found gene expression patterns that identified these two
respective groups of at-risk patients. Van’t Veer et al, (2002) identified a 70-gene set
that is predictive of the interval to breast cancer metastasis and outperforms current
clinical predictors. Patients with the poor prognosis signature have a 15-fold odds ratio
for a short interval to metastasis. Therefore, a metastasis gene expression signature is
present in the primary tumour before any métastasés actually develop. The genes
associated with poor prognosis include those involved in the cell cycle, invasion,
metastasis and angiogenesis, providing a theoretical framework for how métastasés
develop.
1.3.5.3 M echanism s of oncogenesis
An approach for using arrays to investigate mechanisms of transformation is to compare
cancer cells to their equivalent normal counterparts and looking for differences in gene
expression that may explain the malignant phenotype.
99
B-cell tumours retain many of the characteristics of the cell type from which they arise
suggesting that the malignant cells are frozen at discrete developmental stages (section
1.1.3). Arrays have shown that this is also the case for gene expression patterns. These
data confirm that different tumours are caused by the inappropriate activation of normal
developmental-stage specific pathways. For example, the two distinct types of DLBCL
found by Alizadeh et al., (2000) are defined by their relationship to different stages of B-
cell development (GC and activated B-cells). FL, derived from GC B-cells, over
expresses Pax5 and Id-2 (Husson et al, 2002), whose protein products are implicated in
the inhibition of plasma cell development in the GC (Sun et al, 1991, Usui et al, 1997,
Morrow et al, 1999). Similarly, array analysis shows that BCL-6 inhibits plasma cell
differentiation by blocking transcription of the plasma cell transcription factor Blimp-1
(Shaffer et al, 2000). BCL-6 also acts to keep cells in cycle by maintaining c-myc
expression, which is inhibited by Blimp-1 (Lin et al, 1997b). These properties of BCL-6
explain why its constitutive activation by chromosomal translocation is associated with
DLBCL (section 1.1.3.3). Microarray analysis of CLL has also linked its development to
normal B-cell biology. As described in section 1.1.3.4, CLL exhibits evidence of somatic
hypermutation in around 50% of patients. This suggests that the disease could in fact
comprise two distinct diseases, derived from different stages of B-cell development.
However, microarray analysis demonstrated that, in all cases, CLL gene expression
resembles that of memory B-cells. Therefore, unmutated CLL may be derived from GC-
independent memory B-cells. Gene expression profiling also revealed that although
resembling memory B-cells, CLL over-expresses genes belonging to the Raf/ERK
pathway and certain cytokine receptors (Klein et al, 2001). This suggests a common
mechanism of transformation for CLL regardless of whether the cells have passed
through the GC. The occurrence of a common transforming event in memory B-cells,
which are genetically stable, rather than the GC, is consistent with the lack of
chromosomal translocations in this tumour type. Similarly, results from arrays
comparing multiple myeloma to normal plasma cells are consistent with tumourigenesis
being linked to the dysregulation of normal plasma cell function. Multiple myeloma cells
over-express heparin binding epidermal growth factor-like growth factor (HB-EGF),
CCRl, CCR2 and CXCR4 (De Vos et al, 2001). CCRl, CCR2 and CXCR4 are
receptors for M IP-la, MCP-2 and SDF-1 respectively, involved in the migration of cells
to the bone marrow. This is therefore consistent with the concept that multiple myeloma
cells rely on normal plasma cell biology for their growth and viability (section 1.1.3.5).
100
Furthermore, HB-EGF is an essential autocrine growth factor for multiple myeloma cells
(De Vos et al, 2001).
It is unclear how cancers progress from being a locally growing tumour to a fatal
metastasis. Array analysis of metastatic cells selected by serial propagation of cell lines
in vivo shows that highly metastatic cells over-express fibronectin, rhoC and thymosin
P4, all previously linked with métastasés (Clark et al, 2000). Additionally, it was
demonstrated that rhoC is necessary and sufficient to confer metastatic potential in vitro.
A number of other studies have suggested molecular bases of transformation, such as
activation of the sonic hedgehog pathway in sporadic desmoplastic medulloblastomas
(Pomeroy et al, 2002), or metalloproteinases in colon adenocarcinoma (Notterman et al,
2001), but these results have not been confirmed experimentally.
1.3.5.4 Identification of therapeutic targets
One of the reasons for identifying expression patterns associated with different cancer
classes or poor prognosis is the discovery of possible therapeutic targets (Golub et al,
1999). These could be previously known drug targets for other diseases or completely
novel targets requiring a specific drug development program. An example of the first
possibility is the identification of PKC-P as a possible target for treatment of DLBCL
cases with a poor prognosis expression signature (Shipp et al, 2002). An example of the
second is the identification of the tyrosine kinase C-MER as a possible target for ALL
associated with the E2A-PBX1 fusion gene (Yeoh et al, 2002).
Arrays can also be used to probe the mechanism of action of drugs and to find drug side
effects (Marton et al, 1998). Analysis of gene expression changes after treatment of
acute promyelocytic leukaemia (APL) cells with all-trans-retinoic acid (RA) revealed
that it is the up-regulation of ubiquitin-activating enzyme El-like (UBEIL) that mediates
the pro-apoptotic effects of the drug (Kitareewan et al, 2002).
Another approach is to correlate gene expression to the sensitivity of tumour cell lines to
anti-cancer agents in an attempt to find the targets. The NCl-60 is a group of 60 cell lines
maintained at the United States National Cancer Institute (NCI) that have been
characterised pharmacologically by their response to treatment with over 70,000
therapeutic agents (Grever et al, 1992). The expression pattern of these cell lines has
101
since been analysed with cDNA microarrays (Scherf et ai, 2000) and Affymetrix
GeneChips (Staunton et ai, 2001) in an attempt to correlate gene expression pattern to
drug sensitivity. These large datasets therefore allow one to compare the gene expression
of a clinical sample to those of the 60 cell lines in order to predict to which agents it may
be sensitive. Staunton et al, (2001) used supervised learning techniques to find gene
expression-based classifiers of drug sensitivity or resistance for 88 compounds. As each
gene expression predictor contained between 5 and 200 genes these data do not reveal
the actual targets of the drugs but do suggest mechanisms of action. As these gene
expression predictors were designed to be independent of tumour tissue of origin, the
authors suggest that differences seen may be genetic allowing a future use in
personalised medicine.
1.3.6 Array analysis of virus gene expression
Similar to S. cerevisaie (section 1.3.3), human pathogens are ideally suited to DNA array
analysis as probes for every gene can be printed on single array. Therefore, the complete
gene expression profile of an entire genome can be elucidated from the results of a single
experiment. Arrays for pathogens such as Mycobacterium tuberculosis (Wilson et al,
1999), Plasmodium falciparum (Hayward et al, 2000, Rathod et al, 2002),
Streptococcus pneumoniae (de Saizieu et al, 2000), Salmonella typhimurium (Eckmann
et a l , 2000, Rosenberger et a l , 2000) and Listeria monocytogenes (Cohen et a l , 2000)
have been synthesised and used to monitor the expression of the pathogens' genes during
growth ex vivo, infection of human cells and treatment with drugs used in the clinic
(reviewed in Cummings and Reiman, 2000, Kellam, 2000). In addition to the
measurement of gene expression, arrays can also be used to compare genomes, for
example to find regions of the genome deleted in different bacterial strains (Dorrell et
al, 2001).
Arrays are also proving to be ideally suited to the simultaneous measurements of gene
expression for large DNA viruses, having been used to follow the life cycle of human
cytomegalovirus (HCMV) (Chambers et al, 1999), herpes simplex virus-1 (HSV-1)
(Stingley et al, 2000), KSHV (Jenner et al, 2001, see Chapters 3 and 4) (Paulose-
Murphy et al, 2001) and MHV-68 (Ahn et al, 2002). DNA arrays were also
102
instrumental in the discovery that HCMV packages viral RNAs into its capsid
(Bresnahan and Shenk, 2000).
Herpesvirus genes are divided into the kinetic classes, immediate-early, early and late
based on their response to chemical inhibitors of protein synthesis and viral DNA
replication (see section 1.2.4.3). The kinetic class relates to stage of the virus life cycle
and so provides information on both the function of virus genes and the mechanisms of
virus replication. The array studies of Chambers et al, (1999), Stingley et al, (2000),
and Ahn et al, (2002) used DNA arrays to categorise the genes of HCMV, HSV-1 and
MHV-68 respectively into these kinetic classes. This method is more efficient than those
used previously such as northern blotting or RNase protection. In addition to confirming
the majority of existing data, these analyses have also discovered the kinetic class of
many genes. For example, before the study of Chambers et al, (1999) only 30% of the
HCMV genome had been characterised by expression. This therefore provides a means
of assigning function to poorly annotated genes. Classification of every virus gene in
this way also allows further analyses, such as the search for common promoter elements
that may be responsible for the timing of expression (Chambers et al, 1999). The
combination of DNA arrays and cloned herpesvirus genomes allows each gene to be
deleted systematically and the effects on virus gene expression monitored. An
experiment of this type revealed that the immediate-early HSV-1 gene ICP27 is
necessary for the expression of a sub-set of early and late genes (Stingley et al, 2000).
Arrays also reveal the effects that other agents, such as novel anti-viral drugs, have on
virus gene expression (Zhu et al, 2002b). The identification of cell-type specific patterns
of gene expression can also be investigated with DNA arrays (Stingley et al, 2000). One
limitation of arrays acknowledged by all these studies is the difficulty in differentiating
between overlapping transcripts. However, the creation of tiling arrays (Shoemaker et
al, 2001) should allow all viral transcripts to be mapped. I shall discuss the results of
array analysis of KSHV gene expression in Chapter 4.
1.3.7 Array analysis of host gene expression during virus infection
During infection, the host and virus genome compete to control the cell. As described for
EBV in section 1.1.2, virus control of the host cell can be a critical aspect of viral
persistence and replication. DNA arrays allow the visualisation of virus-host interactions
103
by their effects on host gene expression. Arrays have been used to monitor host gene
expression upon infection by viruses representing all orders except for the ssDNA
viruses (Table 1.9). The majority of these studies followed virus-induced changes in
gene expression after in vitro infection either at a selected time point or as a timecourse.
Three studies have followed gene expression after infection in vivo (Taylor et al, 2000,
Bigger et al, 2001, Domachowske et al., 2002) and three studies have followed
herpesvirus reactivation from latency in vitro (Poole et at., 2002) and ex vivo (Hill et al,
2001, Tsavachidou et al, 2001). Gene expression in latently infected cells has also been
examined in vitro (Chang and Laimins, 2000, de La Fuente et al, 2000, Vertegaal et al,
2000, Mikovits et al, 2001, Carter et al, 2002, Moses et al, 2002, Poole et al, 2002).
Array analyses of virally transformed cells in vitro or virus-associated cancers in vivo
reveal virus-associated gene expression that may be responsible for oncogenesis (Honda
et al, 2001, Okabe et al, 2001, Wu et al, 2001a, Xu et al, 2001, lizuka et al, 2002, Li
et al, 2002).
The use of microarrays to compare the effects of inactivated viruses with their active
counterparts helps distinguish responses dependent on virus gene expression (Browne et
al, 2001, Geiss et al, 2001, Mossman et al, 2001). In addition, the effects of individual
virus genes on host gene expression can be measured by either knocking genes out
(Hobbs and DeLuca, 1999, Stingley et al, 2000) or by expressing them in isolation.
Virus proteins that have had their effects on host gene expression analysed in this way
include Tat (De La Fuente et al, 2002) and Nef (Simmons et al, 2001, Shaheduzzaman
et al, 2002) of HIV-1, LNA-1 (Renne et al, 2001) and vGPCR (Poison et al, 2002) of
KSHV, LMP-1 (Kleines et al, 2000) and EBNA-2 (Spender et al, 2002) of EBV, IE86
of human cytomegalovirus (HCMV) (Song and Stinski, 2002), hepatitis B virus (HBV)
protein x (HBx) (Han et al, 2000, Wu et al, 2001a) and E6 and E7 of HPV-16 (Nees et
al, 2000). Studies of this type will help to deconstruct the expression patterns of
infection at a mechanistic level.
104
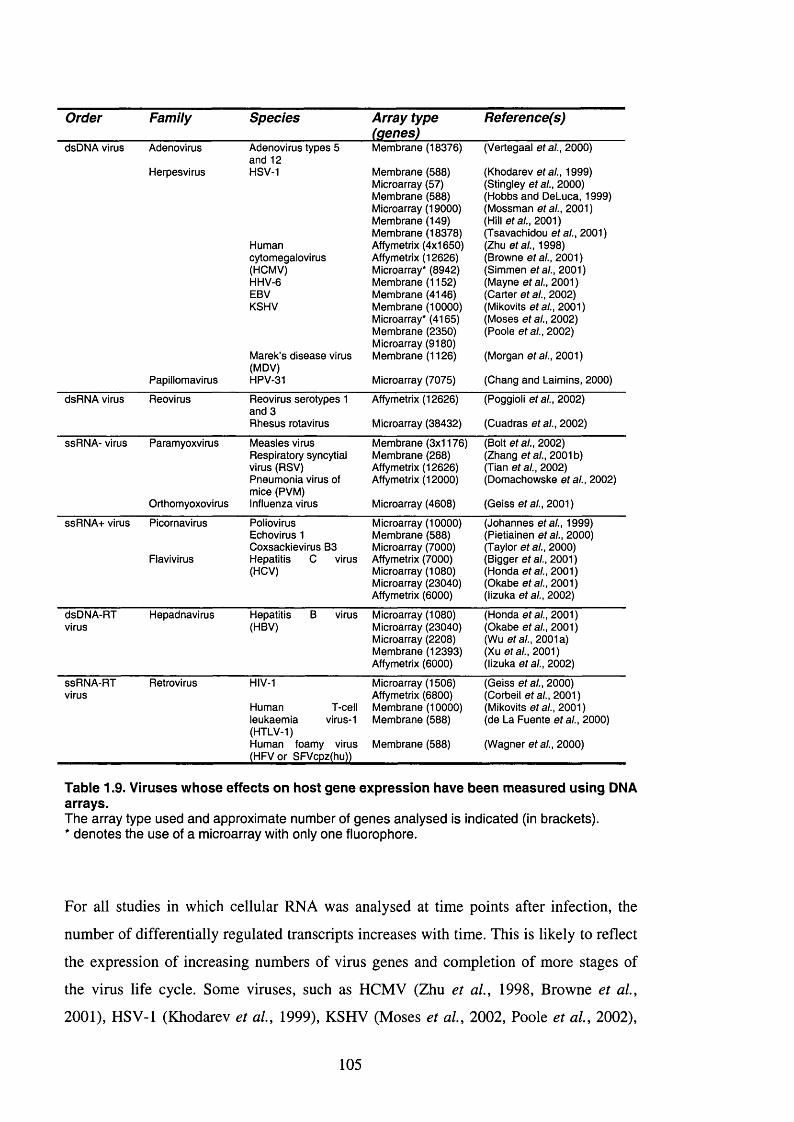
Order Family Species Array type (penes)
Reference(s)
dsDNA virus Adenovirus
Herpesvirus
Adenovirus types 5and 12HSV-1
Humancytomegalovirus(H CM V)H HV-6EBVKSHV
M arek’s disease virus (M DV)
Mem brane (18376) (Vertegaal e t a l . , 2000)
Membrane (588) Microarray (57) Mem brane (588) Microarray (19000) Mem brane (149) Mem brane (18378) Affymetrix (4x1650) Affymetrix (12626) Microarray* (8942) Membrane (1152) Membrane (4146) Membrane (10000) Microarray* (4165) Mem brane (2350) Microarray (9180) Membrane (1126)
(Khodarev e t a ! . , 1999) (Stingley e t a ! . , 2000) (Hobbs and DeLuca, 1999) (Mossman e t a ! . , 2001)(Hill e fa /., 2001) (Tsavachidou e t a ! . , 2001) (Zhu e t a ! . , 1998)(Browne e t a!. , 2001) (Simmen e t a ! . , 2001) (Mayne e t a!. , 2001)(Carter e t a ! . , 2002) (Mikovits e t a ! . , 2001) (Moses e t a!. , 2002)(Poole e t a ! . , 2002)
(Morgan e t a ! . , 2001)
Papillomavirus HPV-31 Microarray (7075) (Chang and Laimins, 2000)
dsRNA virus Reovirus Reovirus serotypes 1 and 3Rhesus rotavirus
Affymetrix (12626)
Microarray (38432)
(Poggioli e t a ! . , 2002)
(Cuadras e t a ! . , 2002)
ssRNA- virus Paramyoxvirus
Orthomyoxovirus
Measles virus Respiratory syncytial virus (RSV) Pneumonia virus of mice (PVM ) Influenza virus
Mem brane (3x1176) Mem brane (268) Affymetrix (12626) Affymetrix (12000)
Microarray (4608)
(Bolt e fa /., 2002)(Zhang e t a ! . , 2001b)(Tian e t a !. , 2002) (Domachowske e t a ! . , 2002)
(Geiss e t a ! . , 2001)
SSRNA+ virus Picornavirus
Flavivirus
Poliovirus Echovirus 1 Coxsackievirus B3 Hepatitis C virus (HCV)
Microarray (10000) Mem brane (588) Microarray (7000) Affymetrix (7000) Microarray (1080) Microarray (23040) Affymetrix (6000)
(Johannes e t a ! . , 1999) (Pietiainen e t a ! . , 2000) (Taylor e t a!. , 2000) (Bigger e t a l . , 2001) (Honda e t a l . , 2001) (Okabe e t a l . , 2001) (lizuka e t a l . , 2002)
dsDNA -RTvirus
Hepadnavirus Hepatitis B virus (HBV)
Microarray (1080) Microarray (23040) Microarray (2208) Membrane (12393) Affymetrix (6000)
(Honda e t a l . , 2001) (Okabe e t a l . , 2001) (Wu e t a l . , 2001a) (Xu e t a l . , 2001) (lizuka e t a l . , 2002)
ssRN A-RTvirus
Retrovirus HIV-1
Human T-cell leukaemia virus-1 (HTLV-1)Human foamy virus (H FV or SFVcpz(hu))
Microarray (1506) Affymetrix (6800) Membrane (10000) Membrane (588)
Membrane (588)
(Geiss e t a l . , 2000) (Corbeil e t a l . , 2001) (Mikovits e t a l . , 2001)(de La Fuente e t a l . , 2000)
(W agner e t a l . , 2000)
Table 1.9. Viruses whose effects on host gene expression have been measured using DNA arrays.The array type used and approximate number of genes analysed is indicated (in brackets).* denotes the use of a microarray with only one fluorophore.
For all studies in which cellular RNA was analysed at time points after infection, the
number of differentially regulated transcripts increases with time. This is likely to reflect
the expression of increasing numbers of virus genes and completion of more stages of
the virus life cycle. Some viruses, such as HCMV (Zhu et ai, 1998, Browne et al.,
2001), HSV-1 (Khodarev et al, 1999), KSHV (Moses et al, 2002, Poole et al, 2002),
105
HPV-31 (Chang and Laimins, 2000), rhesus rotavirus (Cuadras et al, 2002), respiratory
syncytial virus (RSV) (Zhang et al, 2001b) and influenza virus (Geiss et al, 2001), have
pleiotropic effects on host gene expression, modulating the transcription of many genes
across numerous functional groups. This may also be the case for many other viruses but
the authors of these studies did not present these data. Some of the differences between
expression patterns generated by different viruses could be due to cell-type specific
expression patterns or differences in the array methodologies used. This problem is
highlighted when comparing the studies on KSHV-induced changes in DMVEC gene
expression (Moses et al, 2002, Poole et al, 2002). 96 differentially expressed genes
found by Poole et al, (2002) were also represented on the array used by Moses et al,
(2002), Of these, only 19 were also found to change by Moses et al, (2002). Even with
these limitations, comparisons can be made between array results from infection by
different viruses. Common expression changes can be found in host genes of certain
functional groups including:
1. Interferon response
2. Cytokines
3. Stress responses
4. Protein synthesis
5. Cell cycle
1.3.7.1 Interferon response
Infection by HCMV, EBV (type III latency), KSHV, Marek’s disease virus (MDV),
rhesus rotavirus, measles virus, RSV, pneumonia virus of mice (PVM), hepatitis C virus
(HCV) and HIV-1 all lead to an increase in the expression of interferon-stimulated genes
(Zhu et al, 1998, Bigger et al, 2001, Browne et al, 2001, Corbeil et al, 2001, Morgan
et al, 2001, Bolt et al, 2002, Carter et al, 2002, Cuadras et al, 2002, Domachowske et
al, 2002, Poole et al, 2002, Tian et al, 2002). Induction of these genes is indicative of
the activation of the cellular anti-viral response (reviewed in Goodboum et al, 2000). A
function for interferon responsive genes in the anti-viral response is supported by array
analysis showing that the induction of interferon-responsive genes in the liver of a
chimpanzee during infection with HCV correlates with the clearance of viraemia (Bigger
et al, 2001).
106
Some viruses are able to suppress the transcriptional induction of host anti-viral genes.
Although UV-inactivated HSV-1 leads to up-regulation of interferon-stimulated genes,
transcriptionally active HSV-1 is able to counteract this and keep the level of these genes
constant (Mossman et al, 2001). The use of mutant HSV-1 demonstrated that the
immediate-early transcription factor VP 16 is necessary to counter the anti-viral
transcriptional response. This study also showed that, because of this, VP16 is
dispensable for the infection of cells that do not generate an anti-viral response. The
number of interferon-response genes up-regulated by UV-inactivated HCMV is also
greater than for transcriptionally active virus (Browne et al, 2001). Treatment of cells
with HCMV gB alone recapitulates the host interferon-response gene transcription
pattern suggesting that gB binding is responsible for this up-regulation (Simmen et al,
2001). There is no change in the expression of interferon responsive genes upon
influenza virus infection (Geiss et al, 2001) and expression is reduced upon HPV-31
infection (Chang and Laimins, 2000). HPV-16 oncoproteins E6 and/or E7 alone also
repress the host anti-viral response (Nees et al, 2000), suggesting these proteins are
responsible for this effect in HPV-31. Array data therefore shows that HSV-1, HCMV,
influenza virus and HPV-31 all express genes that act to inhibit the host anti-viral
response at the transcriptional level.
Contrary to their counterparts in HPV-16, E6 and E7 from benign HPV-6b have no effect
on host gene expression (Nees et al, 2000). Also, in vivo infection by the pathogenic
J3666 strain of PVM induces expression of interferon response genes, whereas the non-
pathogenic strain 15 does not (Domachowske et al, 2002). Therefore, the host response
against viral infection varies according to pathogenicity. The active repression of the
interferon response by some viruses and not others may reflect differences in the
replication strategy (acute versus chronic infection). The change in KSHV replication
strategy that accompanies the induction of KSHV lytic replication increases the host
anti-viral response against the virus in DMVECs (Poole et al, 2002). Differences in host
gene expression may also reflect the mechanism by which the virus counters the anti
viral response. For example, viruses can inhibit the function of interferon-response genes
at the post-transcriptional level (reviewed in Goodboum et al, 2000).
107
1.3.7.2 Cytokines
Similar to their effects on interferon-responsive genes, HCMV, HHV-6, rhesus rotavirus,
RSV and PVM all lead to increased expression of various cytokine genes (Zhu et al,
1998, Browne et al, 2001, Mayne et al, 2001, Zhang et al, 2001b, Cuadras et al, 2002,
Domachowske et al, 2002). HHV-6 infection of T-cells leads to the up-regulation of
pro-inflammatory cytokines but down-regulation of anti-inflanunatory cytokines (Mayne
et al, 2001). This is characteristic of a ThI response, which may favour HHV-6
persistence. HCMV infection leads to the up-regulation of genes involved in the
synthesis of prostaglandin E2, such as cyclooxygenase-2 (COX-2) (Zhu et al, 1998,
Browne et al, 2001), which may act to trigger an immune response against the virus.
COX-2 is also induced following heat-shock reactivation of HSV-1 (Hill et al, 2001),
suggesting this may be a common feature of herpesvirus lytic replication. The induction
of cytokine genes by RSV, PVM, coxsackievirus B3 and HHV-6 may be responsible for
the inflanunatory cell infiltrate observed during virus infection in vivo.
Compared to infection by the pathogenic J3666 strain of PVM, the non-pathogenic strain
15 leads to a much-reduced expression of chemokine genes (Domachowske et al, 2002).
Similar to its effect on the interferon response, influenza virus also inhibits the
expression of many cytokine genes (Geiss et al, 2001). Also, although HCMV and RSV
infection lead to increased expression of some cytokine genes, this is greatly increased if
the viruses are first inactivated, thus suggesting virus gene products act to inhibit this
response (Browne et al, 2001, Zhang et al, 2001b). Therefore, as with interferon-
responsive genes, cytokine expression varies according to virus type, the genes expressed
and pathogenicity. However, analysis of many array studies demonstrates that expression
of some cytokines may be a common feature of infection by all viruses. IL-6 is up-
regulated upon infection by HSV-1, HCMV, HHV-6, HPV, influenza and coxsackievirus
B3 and expression of RANTES is induced by HCMV, rhesus rotavirus, HPV-16 E6 and
E7, RSV, PVM and HTLV-1.
1.3.7.3 S tre ss resp o n ses
The induction of stress-response genes is common to infection by many viruses (HSV-1,
HCMV, rhesus rotavirus, measles virus, PVM, influenza virus, echovirus 1,
coxsackievirus B3 and HIV-1 (Zhu et al, 1998, Khodarev et al, 1999, Pietiainen et al.
108
2000, Taylor et al, 2000, Corbeil et al, 2001, Geiss et al, 2001, Hill et al, 2001, Boit et
al, 2002, Cuadras et al, 2002, Domachowske et al, 2002). Activating transcription
factor (ATF) 4, implicated in the ER stress response (Fawcett et al, 1999), is up-
regulated by HSV-1, measles virus, echovirus 1 and coxsackievirus B3 (Khodarev et al,
1999, Pietiainen et al, 2000, Taylor et al, 2000, Bolt et al, 2002). Infection by influenza
virus causes up-regulation of metallothionein genes, independent of virus replication
(Geiss et al, 2001). Induction of metallothionein gene expression is also observed upon
KSHV reactivation (Poole et al, 2002), infection by coxsackievirus B3 (Taylor et al,
2000) and the pathogenic J3666 strain of PVM (Domachowske et al, 2002). This up-
regulation may be due to oxidative stress (Palmiter, 1998). The elevated expression of
superoxide dismutase 2 (S0D2) after HSV-1 infection (Mossman et al, 2001) and
reactivation (Hill et al, 2001), and hypoxia-inducible factor-1 alpha (HIF-la) after
KSHV reactivation (Poole et al, 2002) may also be to counter oxidative stress.
Replication of HIV-1 in T-cells leads to the decrease in expression of mitochondrial
genes and DNA repair genes, suggesting a role in HIV-associated cytotoxicity (Corbeil
et al, 2001).
1.3.7.4 Protein syn thesis
Array analysis demonstrates that many host genes are down-regulated upon HSV-1,
HCMV, rhesus rotavirus, influenza virus and HIV-1 infection (Khodarev et al, 1999,
Browne et al, 2001, Corbeil et al, 2001, Geiss et al, 2001, Cuadras et al, 2002). It is
known that HSV-1, rotaviruses, influenza virus, picomaviruses and HIV-1 act to inhibit
host cell protein synthesis whilst maintaining the production of virus proteins. Therefore,
the increase in expression of genes involved in protein synthesis that occurs during
HCMV, rhesus rotavirus, influenza virus and coxsackievirus B3 infection (Zhu et al,
1998, Taylor et al, 2000, Geiss et al, 2001, Cuadras et al, 2002) may be related to this
mechanism. The inhibition of protein synthesis may be controlled by proteins encoded
by the virus. HSV-1 down-regulates protein synthesis by blocking the maturation of
cellular RNA (Hardy and Sandri-Goldin, 1994). Microarray analysis of ICP27 mutant
virus confirms that this gene is necessary for this effect (Stingley et al, 2000). The
specific up-regulation of host genes required for HIV-1 replication may be controlled by
Nef (Simmons et al, 2001).
109
The host cell also acts to inhibit protein synthesis as part of the anti-viral response
initiated by PKR (Meurs et al, 1992). Induction of select protein synthesis genes may
allow the virus to overcome this block. Picornavirus infection leads to the shutdown of
host translation by activating proteolysis of translation initiation factors (Gradi et al,
1998). Microarrays have been used to find which host genes are still translated during
this virus induced host shut-off (Johannes et al, 1999). As these genes are protected
from viral repression they may have important anti-viral functions.
1.3.7.5 Cell cycle
Different viruses also have different effects on the cell cycle. Array analyses have shown
that this may be due to differential effects on host gene expression. Infection by HSV-1,
reovirus serotype 3, echovirus 1 and HlV-1 lead to cell cycle arrest at the 02 to M
transition. All of these viruses up-regulate GADD45 (Hobbs and DeLuca, 1999,
Khodarev et al, 1999, Pietiainen et al, 2000, Corbeil et al, 2001, Poggioli et al, 2002),
a cdc2 kinase inhibitor (Wang et al, 1999), suggesting this may be a common
mechanism for virus induction of cell cycle arrest. HSV-1 also up-regulates two other
genes associated with p53-induced cell cycle arrest, p21 and mouse double minute 2
(MDM2). Their induction by HSV-1 is independent of p53 and instead due to the
immediate-early HSV-1 gene ICPO (Hobbs and DeLuca, 1999). In addition to the up-
regulation of GADD45, reovirus serotype 3 up-regulates chkl and weel, inhibitors of
cdc2 kinase activity in M-phase, and a number of mitotic spindle checkpoint genes.
Furthermore, reovirus serotype 1, which does not cause cell cycle arrest, has no effect on
the expression of these genes (Poggioli et al, 2002).
Contrary to these viruses, HPV-31 infection stimulates entry into the cell cycle through
E7 (Dyson et al, 1989, Munger et al, 1989) and p21 is down-regulated accordingly
(Chang and Laimins, 2000). Expression of E6 and E7 alone also leads to down-
regulation of cell cycle arrest and differentiation genes, including p21, and up-regulation
of genes involved in cell cycle progression (Nees et al, 2000). DMVECs latently
infected with KSHV under-express GADD45 and p57-KlP2, involved in cell cycle arrest
in Gi, and over-express cell cycle progression genes (Moses et al, 2002). HTLV-1
infection also activates the expression of cell cycle progression genes (de La Fuente et
al, 2000).
110
The alternative effects of different viruses on cell cycle gene expression is likely to
reflect to the different replication strategies of these viruses; acute lytic replication by
HSV-1, HIV-1 and reovirus, versus chronic infection by HTLV-1, KSHV (latency) and
HPV. The up-regulation of proliferation-associated genes by HTLV-1, KSHV and HPV
may also explain their oncogenic potential. Indeed, kératinocytes immortalised by HPV-
16 E6 and E7 also show this pattern, with the additional up-regulation of a number of
genes involved in metastasis (Nees et al, 2000). Furthermore, HBx increases the
expression of genes involved in cell cycle progression while inhibiting those involved in
cell cycle arrest, including p21, a pattern that is conserved in hepatocellular carcinoma
(HCC) (Wu et al, 2001a, Xu et al, 2001).
1.3.7.6 Summary; parallels with array analyses of cancer
Array studies of cancer and virus infection meet in the analysis of virus-driven
tumourigenesis. A number of studies have investigated differential gene expression
between HBV and HCV-associated HCC (Honda et al, 2001, Okabe et al, 2001, lizuka
et al, 2002). Gene expression patterns able to differentiate between HBV and HCV-
associated tumours, found using supervised techniques, include the increased expression
of liver detoxification enzymes (Okabe et al, 2001, lizuka et al, 2002) and decreased
expression of interferon response genes (lizuka et al, 2002) in HBV cancers. However,
the contribution of the viruses to the gene expression patterns of the cancers is not clear
from these studies.
A number of other parallels can be drawn between array studies of virus infection and
those of cancer discussed earlier (section 1.3.5). Similar to the classification of cancer,
the differences between the transcriptional changes associated with different viruses
suggest that it may be possible to generate expression profiles that could be used to
classify viruses and diagnose virus infection. A precedent for this is the specific
responses generated in immune-system cells exposed to different bacteria (Boldrick et
al, 2002, Nau et al, 2002) and the distinction between E.coli, C. albicans and influenza
virus by dendritic cells (Huang et al, 2001b). Also, it may be possible to define an
infecting virus as pathogenic or non-pathogenic due to the differences between the
resulting expression patterns. This is akin to finding groups of genes able to predict
outcome in array studies of cancer (section 1.3.5.2). Data gathered thus far suggest that
gene expression changes in response to host infection may reveal how some viruses enter
111
a chronic latency period and others replicate acutely, and how this may be related to
oncogenic potential. Similar patterns of expression induced by members of different
virus families may point to examples of convergent evolution. Common differentially
expressed genes may represent specific cellular weaknesses or key anti-viral responses
and are therefore those on which the most attention should be focused.
The identification of differentially expressed genes may suggest targets for therapeutic
intervention. HCMV replication relies on the up-regulation of prostaglandin E2
expression (Nokta et al, 1996, Speir et al, 1998, Zhu et al, 1998) and can be blocked
with COX-2 inhibitors (Zhu et al, 2002b). Also, microarray analysis of KSHV infected
DMVECs, a model for KS (Moses et al, 1999, Ciufo et al, 2001), revealed over
expression of the proto-oncogene c-kit, the receptor for SCF (Moses et al, 2002). This
up-regulation is essential for KSHV-mediated transformation and the c-kit inhibitor STI
571 (Gleevec) inhibits SCF-dependent proliferation of KSHV-infected cells. These
results suggest that arrays will aid in the achievement of the ultimate goal of virus
research, the cure or prevention of disease.
112

7.4 Scope of this thesis
Discovering the stage of development from which a B-cell tumour is derived is
fundamental for understanding the transformation process, site of presentation and
tumour pathology. It may also provide information critical for successful treatment. For
virally driven tumours, it is also important to know which viral genes are expressed, how
they act within the host cell, and how this relates to pathogenesis
The aim of this thesis is to exploit the power of DNA arrays to understand how the
interaction between KSHV and its B-cell host relates to PEL pathogenesis. This takes the
form of a number of specific questions:
1. Can DNA arrays give sensitive yet specific measurements of KSHV gene
expression that are reproducible upon experimental replication?
2. When during the virus life cycle is each KSHV gene expressed?
3. Can DNA arrays be used to discover novel genes?
4. How does the host cell react to KSHV infection?
5. From which stage of B-cell development does PEL derive?
6. Can PEL gene expression explain the unusual tumour phenotype?
The results of attempts to answer these questions, together with their interpretation, are
the subjects of Chapters 3 to 5. Chapter 3 deals with the construction and testing of two
DNA arrays; the KSHV array, containing probes for all KSHV genes, and the KSHV-
human microarray, which unites these with 5428 probes for human genes. Chapter 4
contains the results of applying these arrays to the analysis of KSHV gene expression
during latency and after the induction of lytic replication in PEL. Chapter 5 compares the
expression of human genes in PEL to other B-cell tumours in order to explain its unique
properties. Finally, in Chapter 6, the results of these analyses are brought together to
suggest a model for KSHV control of B-cell development.
113
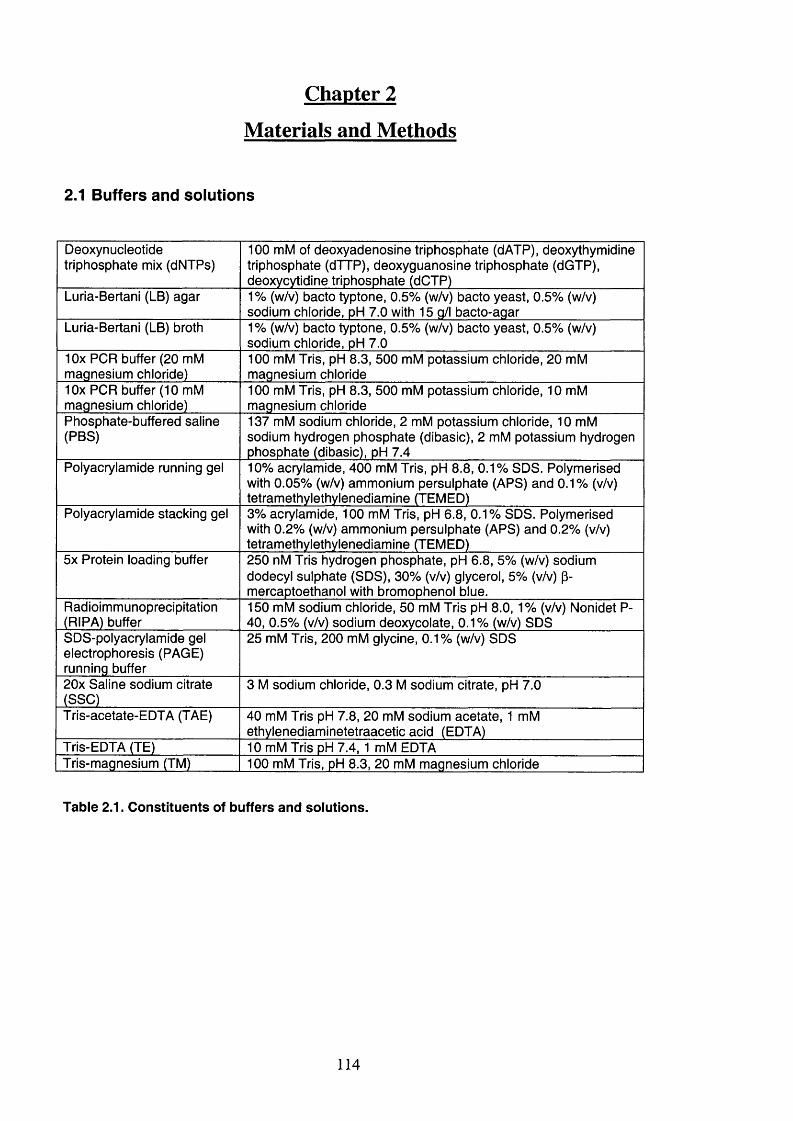
Chapter 2
Materials and Methods
2.1 Buffers and solutions
Deoxynucleotide triphosphate mix (dNTPs)
100 mM of deoxyadenosine triphosphate (dATP), deoxythymidine triphosphate (dTTP), deoxyguanosine triphosphate (dGTP), deoxycytidine triphosphate (dGTP)
Luria-Bertani (LB) agar 1% (w/v) bacto typtone, 0.5% (w/v) bacto yeast, 0.5% (w/v) sodium chloride, pH 7.0 with 15 g/l bacto-agar
Luria-Bertani (LB) broth 1% (w/v) bacto typtone, 0.5% (w/v) bacto yeast, 0.5% (w/v) sodium chloride, pH 7.0
lOx PGR buffer (20 mM magnesium chloride)
100 mM Tris, pH 8.3, 500 mM potassium chloride, 20 mM magnesium chloride
lOx PGR buffer (10 mM magnesium chloride)
100 mM Tris, pH 8.3, 500 mM potassium chloride, 10 mM magnesium chloride
Phosphate-buffered saline (PBS)
137 mM sodium chloride, 2 mM potassium chloride, 10 mM sodium hydrogen phosphate (dibasic), 2 mM potassium hydrogen phosphate (dibasic), pH 7.4
Polyacrylamide running gel 10% acrylamide, 400 mM Tris, pH 8.8, 0.1% SDS. Polymerised with 0.05% (w/v) ammonium persulphate (APS) and 0.1% (v/v) tetramethylethylenediamine (TEMED)
Polyacrylamide stacking gel 3% acrylamide, 100 mM Tris, pH 6.8, 0.1% SDS. Polymerised with 0.2% (w/v) ammonium persulphate (APS) and 0.2% (v/v) tetramethylethylenediamine (TEMED)
5x Protein loading buffer 250 nM Tris hydrogen phosphate, pH 6.8, 5% (w/v) sodium dodecyl sulphate (SDS), 30% (v/v) glycerol, 5% (v/v) p- mercaptoethanol with bromophenol blue.
Radioimmunoprecipitation (RIPA) buffer
150 mM sodium chloride, 50 mM Tris pH 8.0, 1% (v/v) Nonidet P- 40, 0.5% (v/v) sodium deoxycolate, 0.1% (w/v) SDS
SDS-polyacrylamide gel electrophoresis (PAGE) running buffer
25 mM Tris, 200 mM glycine, 0.1% (w/v) SDS
20x Saline sodium citrate (SSG)
3 M sodium chloride, 0.3 M sodium citrate, pH 7.0
Tris-acetate-EDTA (TAE) 40 mM Tris pH 7.8, 20 mM sodium acetate, 1 mM ethylenediaminetetraacetic acid (EDTA)
Tris-EDTA (TE) 10 mM Tris pH 7.4, 1 mM EDTATris-magnesium (TM) 100 mM Tris, pH 8.3, 20 mM magnesium chloride
Table 2.1. Constituents of buffers and solutions.
114
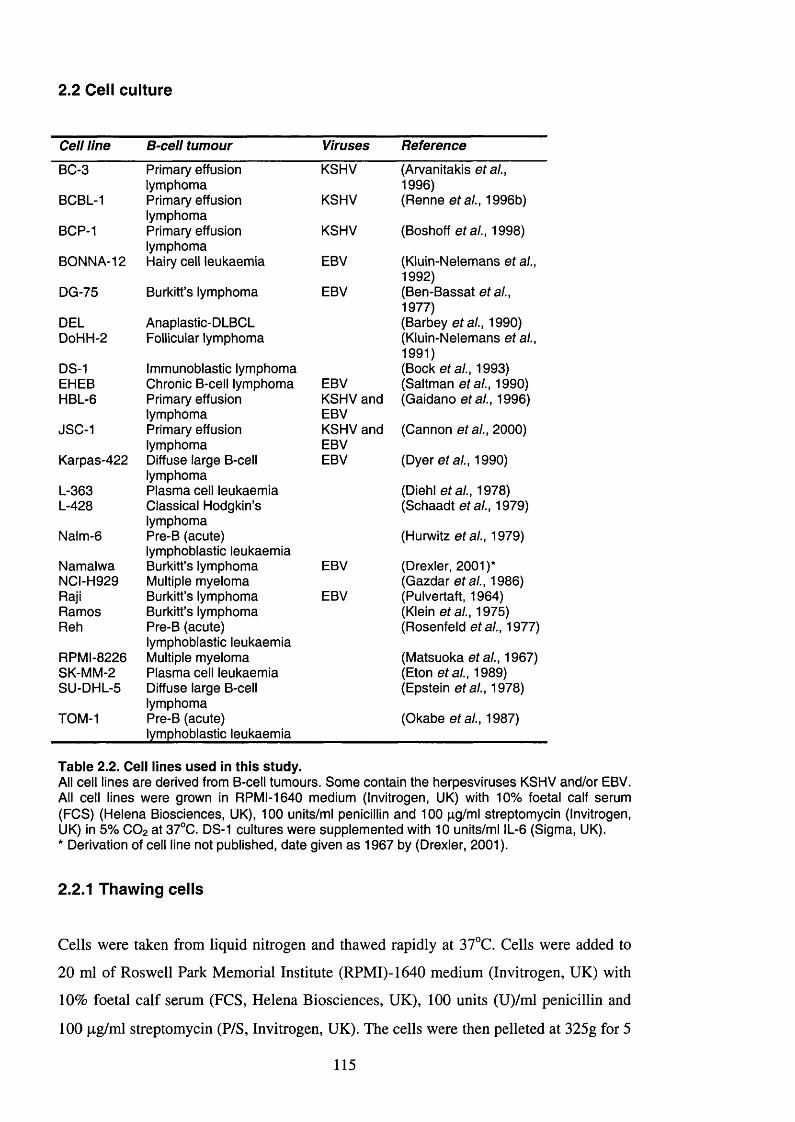
2.2 Cell culture
Cell line B-cell tum our Viruses Reference
BC-3 Primary effusion lymphoma
KSHV (Arvanitakis etal., 1996)
BCBL-1 Primary effusion lymphoma
KSHV (Renne etal., 1996b)
BCP-1 Primary effusion lymphoma
KSHV (Boshoff etal., 1998)
BONNA-12 Hairy cell leukaemia EBV (Kluin-Nelemans et al., 1992)
DG-75 Burkitt’s lymphoma EBV (Ben-Bassat etal., 1977)
DEL Anaplastic-DLBCL (Barbey etal., 1990)DoHH-2 Follicular lymphoma (Kluin-Nelemans et al.,
1991)DS-1 Immunoblastic lymphoma (Bock etal., 1993)EHEB Chronic B-cell lymphoma EBV (Saltman etal., 1990)HBL-6 Primary effusion
lymphomaKSHV and EBV
(Gaidano etal., 1996)
JSC-1 Primary effusion lymphoma
KSHV and EBV
(Cannon etal., 2000)
Karpas-422 Diffuse large B-cell lymphoma
EBV (Dyer etal., 1990)
L-363 Plasma cell leukaemia (Diehl etal., 1978)L-428 Classical Hodgkin’s
lymphoma(Schaadt etal., 1979)
Nalm-6 Pre-B (acute) lymphoblastic leukaemia
(Hurwitz etal., 1979)
Namalwa Burkitt’s lymphoma EBV (Drexler, 2001)*NCI-H929 Multiple myeloma (Gazdar etal., 1986)Raji Burkitt’s lymphoma EBV (Pulvertaft, 1964)Ramos Burkitt’s lymphoma (Klein etal., 1975)Reh Pre-B (acute)
lymphoblastic leukaemia(Rosenfeld etal., 1977)
RPMI-8226 Multiple myeloma (Matsuoka etal., 1967)SK-MM-2 Plasma cell leukaemia (Eton etal., 1989)SU-DHL-5 Diffuse large B-cell
lymphoma(Epstein etal., 1978)
TOM-1 Pre-B (acute) lymphoblastic leukaemia
(Okabe etal., 1987)
Table 2.2. Cell lines used In this study.All cell lines are derived from B-cell tumours. Some contain the herpesviruses KSHV and/or EBV. Ail cell lines were grown in RPMI-1640 medium (Invitrogen, UK) with 10% foetal calf serum (PCS) (Helena Biosciences, UK), 100 units/ml penicillin and 100 p.g/ml streptomycin (Invitrogen, UK) in 5% CO2 at 37°C. DS-1 cultures were supplemented with 10 units/ml IL-6 (Sigma, UK).* Derivation of ceil line not published, date given as 1967 by (Drexler, 2001).
2.2.1 Thawing cells
Cells were taken from liquid nitrogen and thawed rapidly at 37°C. Cells were added to
20 ml of Roswell Park Memorial Institute (RPMI)-1640 medium (Invitrogen, UK) with
10% foetal calf serum (PCS, Helena Biosciences, UK), 100 units (U)/ml penicillin and
100 pg/ml streptomycin (P/S, Invitrogen, UK). The cells were then pelleted at 325g for 5
115
minutes, resuspended in 10 ml media and counted with a haemocytometer. The cells
were centrifuged for a further 5 minutes and resuspended at 5x10^ cells/ml or at the
density recommended by the Deutsche Sammlung von Mikroorganismen und
Zellkulturen (DSMZ).
2.2.2 Passag ing cells
Cells were cultured in RPMI-1640 with 20% PCS and P/S in 5% CO2 at 37°C for the
initial 1-2 weeks after thawing. The cell line NC1-H929 was initially supplemented with
2 mM L-glutamine, 1 mM sodium pyruvate and 50 |liM P-mercaptoethanol (Invitrogen,
UK) in accordance with DSMZ guidelines. DS-1 was supplemented with 10 U/ml IL-6
(Sigma, UK). Cells were transferred to medium containing 10% PCS for continued
culture. Cells were split 1:2 to 1:7, depending on cell density and rate of growth,
approximately twice a week.
2.2.3 Freezing cells
Cells were centrifuged at 325g for 5 minutes and resuspended at 5x10^ cells/ml in cold
RPMI-1640 with 20% PCS and P/S. An equal volume of media containing 20% PCS,
P/S and 20% dimethyl sulphoxide (DMSO, Sigma, UK) was added drop-wise. Cells
were aliquoted into cryovials (Nunc, USA) and gradually cooled to -80°C in an
isopropanol-containing cryo-container (Nalgene, USA) before being transferred to liquid
nitrogen.
2.2.4 Culture of clinical sam ples
Two frozen samples taken from lymphomatous effusions presented in the pleural cavities
of two AIDS patients (PEL-SY and BEL) were obtained from Ursula Ayliffe
(Department of Virology, University College London). These were thawed as before and
cells layered on Lymphoprep (Nycomed, Norway) and centrifuged for 30 minutes at
700g. Viable cells were taken from the interface, washed and resuspended in RPMI-1640
with 20% PCS and P/S. PEL-SY was cultured in RPMI-1640, 10% PCS and P/S. BEL
was cultured in RPMI-1640 with GlutaMAX I (Invitrogen, UK), 20% PCS and P/S
supplemented with Ix non-essential amino acids, 1 mM sodium pyruvate and 50 pM (3-
mercaptoethanol (Invitrogen, UK).
116
2.2.5 Harvesting cells for analysis
2.2.5.1 KSHV array
BC-3 cells were split 1:2 in fresh medium and the following day centrifuged through
Lymphoprep and resuspended at 5x10^ cells/ml in fresh medium. The cells were split
into two flasks and TPA added to one at 20 ng/ml (Sigma, UK, dissolved in DMSO at
0.2 mg/ml). 2x10^ cells were removed from both flasks after 0, 2, 4, 10, 24, 34, 48 and
72 hours, centrifuged at 325g for 5 minutes and washed with 1 ml phosphate buffered
saline (PBS, 4°C). The number of cells taken was increased to 1x10 at 72 hours to
compensate for the decrease in viability. Cells were lysed with 350 pi RLT lysis buffer
(Qiagen, UK) and processed immediately (section 2.5.3) or frozen at -80°C.
2.2.5.2 KSHV-human microarray
All cell lines were split 1:4 in their respective media, grown to around 1x10 cells/ml and
split 1:4 again. Cells were then harvested at IxlOf cells/ml, except for when this was not
possible (Table 5.1). Cells were centrifuged at 325g for 5 minutes, lysed in TRIzol
(Invitrogen, UK) at 1 ml per 10 cells and frozen in liquid nitrogen. DS-1 was also grown
in the absence of IL-6 for 18 days before harvesting. For the induction of virus lytic
replication, BC-3, HBL-6, JSC-1 and Raji cells were grown up to 1x10 cells/ml as
before, split 1:2 and TPA added at 20 ng/ml. Cell viability was assessed by adding an
equal volume of 0.4% trypan blue (Invitrogen, UK), incubating at 37°C for 30 minutes
and calculating the proportion of blue (dead) cells with a haemocytometer.
2.2.5.3 Northern blotting
BC-3 cells were grown up to 1.5x10^ per ml, centrifuged through lymphoprep and the
viable cells at the interface recovered. These were washed in 20 ml medium and
resuspended at 5x10^ cells/ml. TPA was added at 20 ng/ml. The culture was split into 7
equal aliquots. Cyclohexamide (CHX) was added at 33 pg/ml. Phosphonoacetic acid
(PAA) was added at 0.5 mM. Cells were pelleted by centrifugation at 350g for 5
minutes, washed in I ml PBS and frozen in ethanol/dry ice. Cells were stored at -80°C.
117
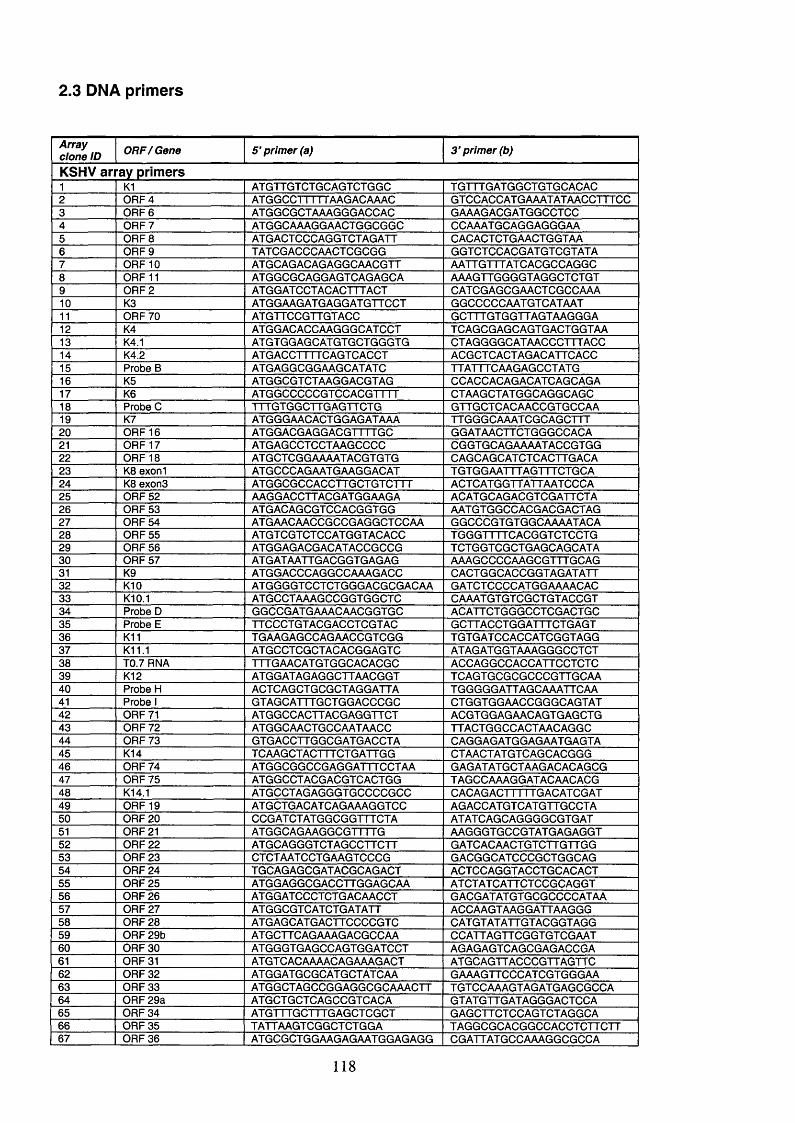
2.3 DNA primers
Array clone ID ORF/Gene 5 ’ primer (a) 3 ’ primer (b)
KSHV array primers1 K1 A TG TTG TC TG C A G TC TG G C TG TTTG ATG G CTG TG G AG A G2 0 R F 4 ATGG CC TTTTTA A G AC AA AC GTGGAGGATGAAATATAAGGTTTGG3 0 R F 6 ATG G CG CTA AAG G G A CCAC GAAAGAGGATGG GGTGG4 0 R F 7 A TG G CA AA G G AA CTG G CG G C CGAAATGGAGGAGG GAA5 0 R F 8 A TG A C TCC C A G G TC TA G A TT CAGAGTGTGAAGTGGTAA6 0 R F 9 TA TC G A CC C A A C TC G C G G G G TG TGGAGG ATGTGG TATA7 O R F 10 A TG C A G AC AG A G G C AA CG TT AATTGTTTATGAGGG GAGGG8 O RF 11 ATG G CG CA G G AG TC A G A G C A A A A G TTG G G G TA G G G TG TG T9 O R F 2 ATG G A TC C TA C A C TTTA C T GATGGAGGGAAGTGGGGAAA10 K3 ATG G AA G A TG A G G A TG TTC C T GGGGCGG AATGTGATAAT11 O R F 70 A TG TTC C G TTG TA C C G G TTTG TG G TTA G TA A G G G A12 K4 A TG G AC A C C A A G G G C A TC C T TG AG G G AG G AG TG AG TG G TAA13 K4.1 A TG TG G A G C A TG TG C TG G G TG CTAGGG G G A TAA CG G TTTA G C14 K4.2 A 1G A C O TT I 1 GAG rCAC C 1 AGGGTGAGTAGAGATTGAGG15 Probe B ATG AG G G G G AAG CATATC TTATTTGAAGAGGGTATG16 K5 ATG G GGTGTAAG GAGGTAG CGAGGAGAGAGATGAGGAGA17 K6 A TG G G G G G G G 1C C A G G 1 1 1 1' C TAAGGTATGGGAGGG AG G18 Probe 0 TTTG TG G C TTG A G TTC TG G TTG CTC AC A AC G G TG G CA A19 K7 ATGG GAAG AG TGGAGATAAA TTG G G G A AA TG G G AG G TTT20 O R F 16 ATGG AG G AG G A G G TTTTG G G G A TAAGTTCTGGGGGAGA21 O R F 17 ATGAGCGTGGTAAGGGGG C G G TGGAGAAAATAGGGTGG22 O RF 18 ATG C TGGGAAAATAGGTGTG CAGGAGGATGTGAGTTGAGA23 K8 exoni ATGCGG AG AATGAAGGAGAT TG TG G A A TTTA G TTTG TG G A24 K8 exon3 ATGG G G G G AG G TTG G TG TG TTT A GTG ATGGTTATTAATCGGA25 O R F 52 AAGGAGGTTAGGATGG AAGA AGATGG AG AG GTGGATTGTA26 O R F 53 ATGAGAGG GTGGAGGG TGG AATGTGGGGAGGAGGAGTAG27 O R F 54 ATGAAGAAGGGGGGAGGGTCGAA GGGGGGTGTGGGAAAATAGA28 O R F 55 A TG TGGTG TGGATGGTAGACC 1G G G I I I ! G A C G G IG 1GGTG29 O R F 56 ATGGAGAGGAGATAGGGGGG TG TG G TG G G TG AG G AG G ATA30 O R F 57 ATG ATAATTG AG G G TG AG AG A AAGGGGGAAGGGTTTGGAG31 K9 ATGGAGGGAGGGGAAAGAGG CAG TG G G AG C G G TA G ATA TT32 K10 A TG G G G TGGTGTGG GAGGGGAGAA GATGTGGGGATGGAAAAGAG33 K10.1 A TG C G TAAAG GGGGTG GGTG C AA ATG TG TCG G TG TA G G G T34 Probe D GGGCGATGAAAG AAGG GTGG A G ATTGTGGG GGTCGAGTGG35 Probe E TTGCGTGTAGGAGGTGGTAG G G TTA G G TG G A TTTC TG A G T36 K11 TG AAGAGG GAGAAG GGTGGG TG TG ATG G ACC ATG G G TA G G37 K11.1 ATGCGTGGGTAG AG GGAGTG ATAG ATG G TAAAG G G G G TG T38 T0 .7 RNA TTTGAAGATGTGGGAGAGG C AGGAGGGGAGGATTGGTCTG39 K12 ATG G ATAG AG G G TTAAG G G T TG AG TGGGGG GGGGTTGGAA40 Probe H AG TCAGGTGGGGTAGGATTA TG GGGG A TTAG G A AATTG A A41 Probe 1 GTAG GATTTGGTG GAGGGGG C TG G TG G A A G G G G G CA G TA T42 O R F 71 ATGG CG AG TTAG G AG G TTG T A C G TG G AG AAC AG TG A G G TG43 O R F 72 ATGG GAAGTGCGAATAAGG TTAGTGGG GAGTAAGAGGG44 O R F 73 G TGAGGTTGGGGATGAGG TA CAGG AG A TG G AG AATG A G TA45 K14 TG AA G G TA G TTTC TG ATTG G C TAAGTATGTG AG GAGGGG46 O R F 74 A TG G G GGGGGAGGATTTG GTAA GAGATATGGTAAGAGAGAGGG47 O RF 75 A TGG GGTAGGACGTGAGTGG TAGG GAAAGGATAGAAGAGG48 K14.1 ATGCGTAGAGGGTG GGGGGGG G AG AG A G I I IT T G A G A IG G A T49 O R F 19 ATGGTGAGATGAGAAAGGTGG AG AG G ATG TCATG TTG G G TA50 O R F 20 G G G ATGTATG GGGGTTTGTA A TATG A G G A G G G G G G TG AT51 O R F 21 A TG G G AG A AG G G G TTTTG A A G G G TG G G G TATG A G AG G T52 O R F 22 A TG CA G G G TG TAG G G TTG TT GATG AC AA G TG TG TTG TTG G53 O R F 23 GTGTAATGGTGAAGTGGGG G A G GGGATGGGGCTGGGAG54 O R F 24 TG G AG AGGGATACGGAGAGT ACTG CAG G TAG CTG G AG AG T55 O R F 25 ATGG AG G G G AG CTTG G AG G AA A TG TA TGATTGTG GGGAGGT56 O R F 26 ATGG ATCGGTGTGAGAAGGT G AGGATATGTGCGG GGGATAA57 O R F 27 A TG G G G TG ATG TG A TATT AGGAAGTAAGGATTAAGGG58 O R F 28 ATGAGGATGAGTTGGGGGTG CATG TA TA TTG TA G G G TA G G59 O R F 29b ATGCTTGAGAAAGAGGGGAA C G ATTA G TTG G G TG TG G AA T60 O R F 30 ATG G G TG A G G G AG TG G ATG CT AGAGAGTG AG GGAGAGGGA61 O R F 31 ATGTGACAAAACAGAAAGAGT A TG C A G TTA C C G G TTA G TTC62 O R F 32 ATGG ATGGGGATGGTATGAA GAAAG TTG G CATG G TG G G AA63 O R F 33 A TG G G TAGGGGG AG GGGGAAAGTT TGTGGAAAGTAGATGAGGGGGA64 O R F 29a A TGCTGGTGAGG CG TGAGA G TATG TTG ATA G G G A G TC G A65 O R F 34 ATG TTTG G TTTG A G G TG G G T G AGGTTGTGGAGTGTAGGGA66 O R F 35 TA TTAA G TG G G G TG TG G A TA G G G G G AG G G G G AG C TCTTG TT67 O R F 36 ATG C G G TG G AA G A G AA TG G A G AG G C G A TTATGGGAAAGGGGCGA
118
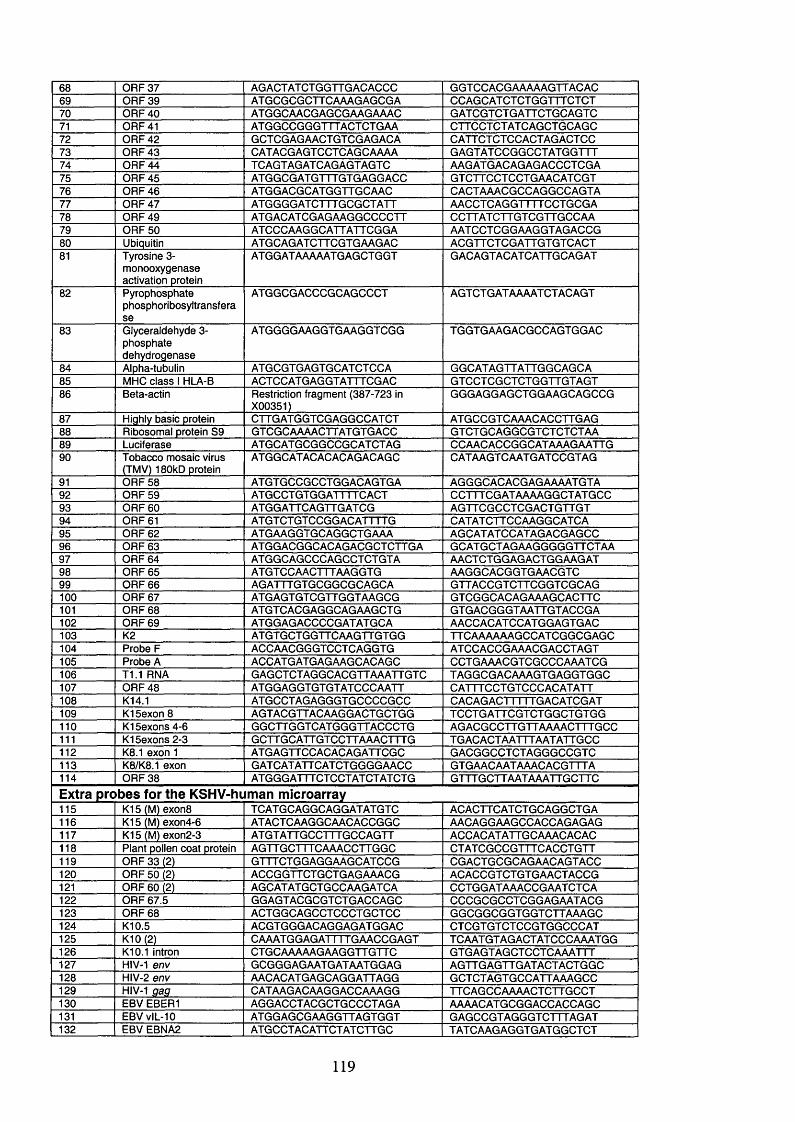
68 O R F 37 AG A CTA TC TG G TTG A C A CC C GGTGGAGGAAAAAG TTAGAG69 O R F 39 A TG C G C G CTTCA AA G A G CG A G G AG G ATG TG TG G TTTG TG T70 O R F 40 ATGGCAACGAGGGAAGAAAC G A TG G TG TG A TTG TG G AG TG71 O R F 41 ATG G CC G G G TTTA C TC TG A A GTTGGTGTATG AG GTGGAGG72 O R F 42 G C TCG A G A AC TG TCG AG A CA GATTGTGTGGAGTAGAGTGG73 O R F 43 CA TACG AG TCCTCAG CAAAA G A G TATG G G G G G TA TG G TTT74 O R F 44 TCA G TAG A TCA G AG TAG TC AAGATGAGAGAGAGGG TGGA75 O R F 45 A TG G C G A TG TTTG TG A G G A C C G TGTTG G TG G TG AAG ATG G T76 O R F 46 A TG G ACG C ATG G TTG C AAC GAGTAAAGGGGAGGGGAGTA77 O R F 47 A TG G G G A TC TTTG C G C TA TT A A G G 1G A G G T T T IG G I'GGGA78 O R F 49 A TG AC ATC G A G A A G G C C C C TT GGTTATG TTG TG G TTG G G A A79 O R F 50 A TC C C AA G G CA TTATTCG G A A ATGGTGGGAAGGTAG AG GG80 Ubiquitin ATG C AG A TCTTC G TG AA G A C A G G TTG TG G ATTG TG TG AG T81 Tyrosine 3-
monooxygenase activation protein
A TG G ATAAAAATG AG CTG G T G AG A GTAG ATGATTGGAGAT
82 Pyrophosptiatephosphoribosyltransferase
A TG G CG AC C C G C A G G C C T AG TG TGATAAAATGTAGAGT
83 Glyceraldehyde 3-phosphatedehydrogenase
A TG G G G AA G G TG A AG G TG G G TG G TG A AG A G G G G A G TG G AG
84 Alpha-tubulin ATGGGTGAGTGGATGTGGA G G G A TA G TTA TTG G G AG G A85 MHO class 1 HLA-B AGTGGATGAGGTATTTGGAG G TG G TG G G TG TG G TTG TA G T86 Beta-actin Restriction fragment (387-723 in
X00351)G GGAG G AG G TG G A AG G A G G G G
87 Highly basic protein GTTGATG G TG G AG G G G ATG T ATGG GGTGAAAGAGGTTGAG88 Ribosomal protein S9 GTGGGAAAAGTTATGTGAGG G TG TG G AG G G G TG TG TG TA A89 Luciferase ATGG ATGGGGGG GGATGTAG GGAAGAGGGGGATAAAGAATTG90 Tobacco mosaic virus
(TM V) 180kD proteinATGGGATAGAGAGAGAGAGG GATAAGTGAATGATG GGTAG
91 O R F 58 A TG TGGGGGG TGGAGAGTGA AGGGGAGAGGAGAAAATG TA92 O R F 59 ATGG G TG TG G ATTTTG AG T GGTTTG GATAAAAGGGTATGGG93 O R F 60 ATGG ATTG AG TTG ATG G A G TTG G G G TG G A G TG TTG T94 O R F 61 A TG TG TG TG G G G A G A ITTTG G ATATGTTGGAAGGGATGA95 O R F 62 ATGAAGGTGGAGGGTGAAA AGGATATGGATAGAGGAGGG96 O R F 63 ATGG AG GGGAGAGAGGGTGTTG A G G ATG G TA G AA G G G G G TTG TAA97 O R F 64 ATGG GAGGGGAGGGTGTGTA AAG TG TG G AG AG TG G AAG AT98 O R F 65 ATGTGGAAGTTTAAGGTG AA G G GAGGGTGAAGGTG99 O R F 66 A G ATTTGTGGGGGGGAGG A G TTAG G G TG TTG G G TG G G A G100 O R F 67 A TG AG TG TG G TTG G TA AG G G GTGGGGAGAGAAAGGAGTTG101 O R F 68 ATGTGAGGAGGGAGAAGGTG G TG AG G G G TAA TTG TAG G G A102 O R F 69 ATGGAGAGGGGGATATGGA AAGGAGATGGATGGAGTGAG103 K2 ATG TG G TG G TTG A AG TTG TG G TTGAAAAAAGGG ATGGGGGAGG104 Probe F AGGAAGGGGTGGTGAGGTG ATGGAGGGAAAGGAGGTAGT105 Probe A AGGATGATGAGAAGGAGAGG GGTGAAAGGTGGGGGAAATGG106 T1.1 RNA GAGGTGTAGGGAGG TTAAATTGTG TA G G G G AG A A AG TG A G G TG G G107 O R F 48 ATGG AG G TG TG TA TG G G AA TT G A TTTGGTGTG GGAGATATT108 K14.1 ATGGGTAGAGGGTGGGGGGG G CACAGAC'I 1 1 1 IG A G A IG G A I109 K15exon 8 AGTAGG TTAGAAGGAGTGGTG G TG G TG A TTG G TG TG G G TG TG G110 K15exons 4-6 GGG TTG G TG ATG G G TTA G G G TG A G AGGGGTTGTTAAAAGTTTGGG111 K15exons 2-3 G GTTGGATTGTGGTTAAAGTTTG TG AG AG TAATTTAATATTGGG112 K8.1 exon 1 ATGAGTTGGAGAGAGATTGGG GAGGGGG TG TAG G G G G G TG113 K8/K8.1 exon GATG ATATTGATGTG GGGAAGG G TGAAG AATAAAGAGG TTTA114 O R F 38 ATG G GATTTGTGG TATGTATGTG G TTTG G TTAA TAAA TTG G TTG
Extra probes for the KSHV-human microarray115 K15 (M) exon8 TG ATGGAGGGAGGATATGTG A G A G TTGATGTGGAGGGTGA116 K15 (M) exon4-6 ATAGTGAAGGGAAGAGGGGG AAGAGGAAGGGAGGAGAGAG117 K15 (M) exon2-3 A TG TA TTG G G TTTG G G A G TT AGGAGATATTGGAAAGAGAG118 Plant pollen coat protein AGTTGGTTTGAAAGGTTGGG GTATG G G G G TTTG A G G TG TT119 O R F 33 (2) G TTTGTGGAGGAAGGATGGG GGAGTGGGGAGAAGAGTAGG120 O R F 50 (2) AGGGGTTGTGGTGAGAAAGG AGAGGGTGTGTGAAGTAGGG121 O R F 60 (2) AGGATATGGTGGGAAGATGA GGTGGATAAAGGGAATGTGA122 O R F 67.5 GGAGTAGGGGTG TGAGGAGG GGGGG GGGTGG GAGAATAGG123 O R F 68 AGTGGGAGGGTGGGTGGTGG G G G G G G G G TG G TG TTA AA G G124 K10.5 A G GTGGGAGAGGAGATGG AG G TG G TG TG TG G G TG G G G G AT125 K 1 0 (2 ) G AAATGGAGATTTTGAAGGGAGT TGAATGTAGAGTATGGGAAATGG126 K10.1 intron GTGGAAAAAGAAGGTTGTTG GTGA G TAG G TG G TG AA ATTT127 HIV-1 env G G G GG AG AATGATAATGG AG A G TTG A G TTG A TAG TAG TG G G128 H IV-2 env A AGAGATGAGGAGGATTAGG GGTGTAGTGGGATTAAAGG G129 HIV-1 gag GATAAGAGAAGGAGGAAAGG TTGAGGGAAAAGTGTTGGG T130 EBV EBER1 AGGAGGTAGGGTGGGGTAGA AAAAGATGGGGAGGAGGAGG131 EBV vlL-10 A TG G AG G G A AG G TTAG TG G T G AG G G G TAG G G TG TTTAG AT132 EBV EBNA2 A TGG GTAGATTGTATGTTGG TATG A AG A G G TG A TG G G TG T
119
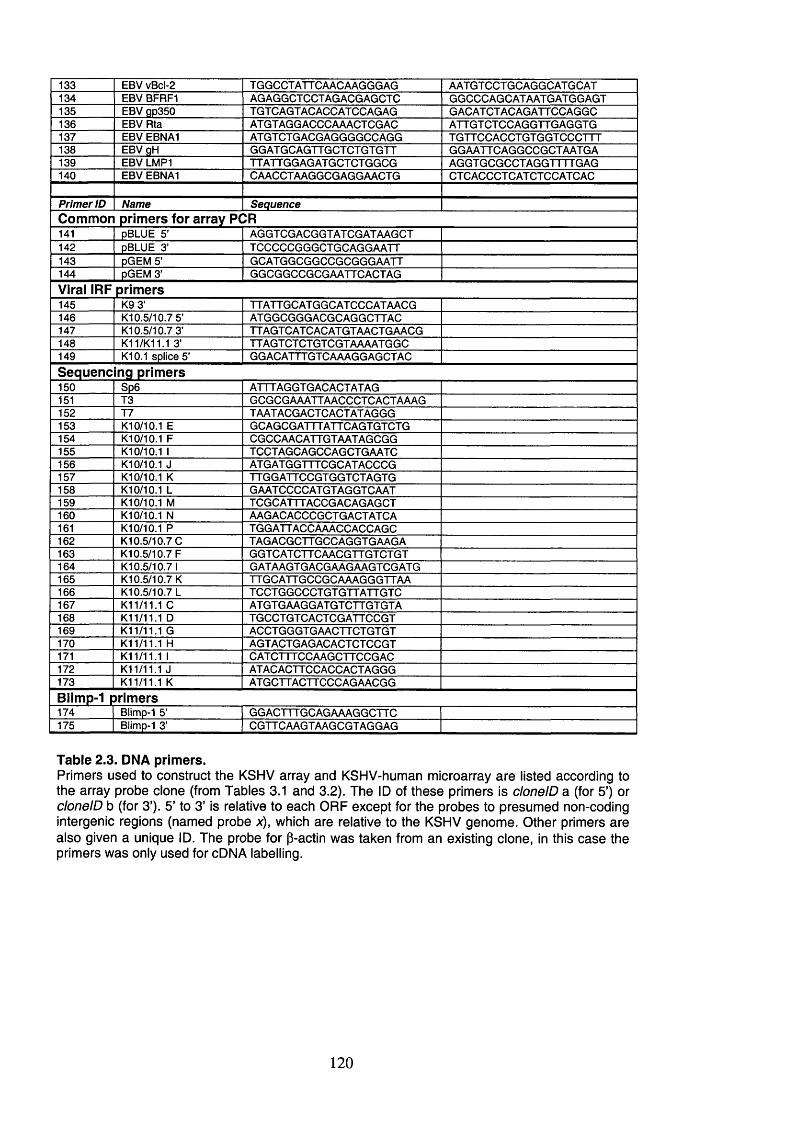
133 EBV vBcl-2 TG G C CTATTCAA CA AG G G AG A A TG TC C TG C A G G C A TG C A T134 EBV BFRF1 A G AG G C TC C TAG AC G A G C TC G G C C C A G C A TA A TG A TG G A G T135 EBV gp350 TG TC AG TAC A CC ATC CA G AG G AC ATC TA C A G A TTC C A G G C136 EBV Rta A TG TA G G A CC CAA AC TCG A C A TTG TC TC C A G G TTG A G G TG137 EBV EBNA1 A TG TC TG A C G A G G G G C C A G G TG TTC C A C C TG T G G TC C C TT T138 EBV gH G G A TG C A G TTG C TC TG TG TT G G AA TTC A G G C C G C TA A TG A139 EBV LMP1 TTA TTG G A G A TG C TC TG G C G A G G TG C G C C TA G G TTTTG A G140 EBV EBNA1 CAAC CTA AG G CG A G G AA C TG C TC A C C C TC A TC TC C A TC AC
Primer ID Name SequenceCommon primers for array PGR141 pBLUE 5 ’ A G G TCG AC G G TA TC G A TAA G C T142 pBLUE 3' TC C C C C G G G C TG C A G G A A TT143 pG EM 5’ G C A TG G CG G C CG C G G G A A TT144 pG EM 3 ’ G G C G G C C G C G A A TTC A CTA G
Viral IRF primers145 K9 3' TTA TTG C ATG G G ATC C CA TAA CG146 K10.5 /10 .7 5 ’ A TG G CG G G A C G C A G G C TTA C147 K10.5 /10 .7 3 ’ TTAG TCA TCA CA TG TAA CTG AA CG148 K11/K11.1 3 ’ TTA G TC TC TG TC G TA A A A TG G C149 K10.1 splice 5 ’ G G AC ATTTG TCAA AG G AG C TA C
Sequenc ng primers150 Sp6 ATTTAG G TG A CAC TATA G151 T3 GCGCGAAATTAA CC C TCA CTA AA G152 T7 TAATAC G AC TC AC TA TA G G G153 K10/10.1 E G C A G C G A TTTA TTC A G TG TC TG154 K10/10.1 F CGC CA ACA TTG TA ATAG C G G155 K10/10.1 1 TCC TAG CA G C C A G C TG A A TC156 K10/10.1 J A TG A TG G TTTC G C A TA C C C G157 K10/10.1 K TTG G A TTC C G TG G TC TA G TG158 K10/10.1 L G AATCCCCATG TAG G TC/kAT159 K10/10.1 M TC G C A TTTA C C G A C A G A G C T160 K10/10.1 N A AGAC ACC CG C TG ACTATCA161 K10/10.1 P T G G A T T A C C /W \C C A C C A G C162 K10.5 /10 .7 C TAG A CG C TTG C C A G G TG AA G A163 K10.5 /10 .7 F G G TC ATC TTCA A C G TTG TCTG T164 K10.5/10.71 GATAAGTGACG/VAGAAGTCGATG165 K10.5 /10.7 K TTG C ATTG C CG CA AA G G G TTA A166 K10.5 /10.7 L T C C TG G C C C TG TG TTA TTG TC167 K11/11.1 C A TG TG A A G G A TG TC TTG TG TA168 K11/11.1 D T G C C TG TC A C TC G A TTC C G T169 K 11/11.1 G A C C TG G G TG A A C TTC TG TG T170 K 11/11.1 H A G TA C TG A G A C A C TC TC C G T171 K 11/11.1 1 C A TC TTTC C A A G C TTC C G A C172 K11/11.1 J A TA CA CTTC CA CC A CTA G G G173 K11/11.1 K A TG C TTAC TTCCCA G AA CG G
Biimp-1 primers174 Blimp-1 5’ G GAC TTTG CA G /kA AG G C TTC175 Blimp-1 3 ’ C G TTC AAG TAA G C G TAG G A G
Table 2.3. DNA primers.Primers used to construct the KSHV array and KSHV-human microarray are listed according to the array probe clone (from Tables 3.1 and 3.2). The ID of these primers is clonelD a (for 5’) or clonelD b (for 3’). 5’ to 3’ is relative to each ORF except for the probes to presumed non-coding intergenic regions (named probe x), which are relative to the KSHV genome. Other primers are also given a unique ID. The probe for p-actin was taken from an existing clone, in this case the primers was only used for cDNA labelling.
120
2.4 Creation of array probes
2.4.1 DNA purification
DNA was purified from BC-3 and HBL- 6 cells using a Qiagen QIAamp DNA mini kit
(Qiagen, UK). 2x10^ BC-3 or HBL- 6 cells were resuspended in 200 pi PBS with 20 pi
proteinase K (Qiagen, UK). 200 pi of buffer AL was added, the solution vortexed, and
incubated at 56°C for 10 minutes. This was then applied to a QIAamp spin column and
centrifuged at 14,000g for 1 minute. The column was washed once with 500 pi buffer
AWl, then with 500 pi buffer AW2, and DNA eluted with 100 pi of buffer AE. The
concentration of the purified DNA was calculated from the UV absorbance at 260 nm
using a UV spectrophotometer (Camlab, UK). An absorbance of 1 cm' was taken to be
equivalent to 50 pg/ml DNA.
2.4.2 Polym erase chain reaction (PGR) amplification
A PCR was performed for each pair of array primers (Table 2.3) from BC-3 DNA
(except for the M-form of K15 where HBL- 6 DNA was used) using a Peltier thermal
cycler (MJ research, USA). The constituents of each reaction were:
DNA (approx. 25 ng/pl) 2 piPrimers (approx. 100 pM) 2 pi eachPCR buffer (20 mM MgCU) 5 pidNTPs (10 mM) 1 piTaq DNA polymerase (5 U/pl) 0.25 piDistilled water 37.75 pi
The reaction conditions were:
1. 94°C 2 minutes2. 94°C 30 seconds3. 55°C 30 seconds4. 72°C 30 seconds5. Steps 2-4 an additional 24 times
2.4.3 PCR purification
1 volume of the PCR reaction was mixed with l/5‘ volume 40% glycerol and separated
on a 1% w/v agarose gel in Ix Tris-acetate-ethylenediaminetetraacetic acid (EDTA)
(TAE) containing 0.2 pg/ml ethidium bromide (Sigma, UK) at lOOV. The band of the
121
correct size was excised from the gel and DNA purified with the QIAquick gel extraction
protocol (Qiagen, UK). 3 volumes of buffer QG (v/w) were added to the gel slice and
incubated at 50°C for 10 minutes. 1 volume of isopropanol was added, the solution
vortexed and then applied to a QIAquick column. The solution was passed through the
column by centrifugation (14,000g, 1 minute) or a vacuum, washed with 500 pi buffer
QG and then with 750 pi buffer PE. DNA was eluted in 30 pi of buffer EB.
2.4.4 Preparation of com petent bacteria
XL-1 Blue Escherichia coli (Stratagene, UK) were streaked out onto Luria-Bertani (LB)-
agar plates containing tetracyclin (10 pg/ml) and incubated at 37°C for 16 hours. A
colony was picked and used to inoculate 5 ml LB-broth (with tetracyclin) and shaken at
37°C for 16 hours. This was added to 500 ml LB-broth and shaken at 37°C until the
absorbance at 600 nm was 0.6 (around 3 hours). The culture was then put on ice to cool
for 10 minutes. The bacteria were pelleted at 3000g for 10 minutes at 4°C and
resuspended in 15 ml of 100 mM calcium chloride (4°C). After incubation on ice for 30
minutes, the bacteria were centrifuged again and then resuspended in 2.5 ml of 100 mM
calcium chloride containing 15% glycerol by volume (4°C). The bacterial suspension
was frozen with liquid nitrogen in 200 pi aliquots. The transformation efficiency of the
competent bacteria was calculated as the number of colonies per mg pBluescript II KS
DNA per ml bacteria and accepted if this value was above 10 .
2.4.5 Cloning
PCR products were cloned into either pGEM-T Easy (Promega, UK) or pBluescript II
KS (Stratagene, UK) (see sections 3.2.1.1 and 3.2.2.1). Before cloning, the terminal
phosphates were removed from linear pBluescript II KS by incubating with 1 unit of calf
intestinal phosphatase (Promega, UK) at 37°C for 30 minutes and then 50°C for one
hour. Dephosphorylated vector was purified by gel extraction (section 2.4.3). Before
PCR products were ligated into pBluescript II KS they were blunt-ended. 2 pi
(approximately 400 ng) of DNA was first phosphorylated by incubation with 1 unit of T4
polynucleotide kinase (Promega, UK), 1 pi dATP (100 pM) and 1 pi T4 polynucleotide
kinase buffer in 10 pi final volume at 37°C for 30 minutes. Nucleotides were then
incorporated by the addition of 0.5 pi Klenow DNA polymerase (2 U/pl) (Roche, UK),
122
0.5.|Lil dNTPs (2 mM) and 1.5 |Lil Tris-magnesium (TM) buffer at 37°C for 20 minutes.
The reaction was inactivated at 70°C for 30 minutes. 3 p.1 of blunt-end DNA was ligated
into 100 ng pBluescript II KS using 3 units of T4 DNA ligase (Promega, UK), 1 pi ligase
buffer in 10 pi final volume supplemented with 1 mM ATP at 16°C for 16 hours. PCR
products were ligated directly into 50 ng of pGEM-T Easy under the same conditions
except for the absence of the additional ATP. The ligation reaction was cooled to 4°C
and added to 90 pi of competent XL-1 Blue E.coli (section 2.4.4). After incubation at
4°C for 30 minutes, the bacteria were subjected to heat-shock at 42°C for 45 seconds and
then placed immediately on ice. 400 pi LB-broth was added and the bacteria incubated at
37°C for 1 hour. Subsequently, 4 pi isopropylthio-p-D-galactoside (IPTG) (200 mg/ml.
Sigma, UK) and 20 pi 5-bromo-4-chloro-3-indolyl-p-D-galactoside (X-Gal) (50 mg/ml,
Promega, UK) were added and 200 pi of bacterial suspension was plated onto LB-agar
containing ampicillin at 20 pg/ml. The plates were incubated at 37°C for 16 hours.
2.4.6 Screening for positive colonies
Bacterial colonies containing the PCR product were identified by their white colour due
to disruption of the LacZ ORF. Colonies were screened by PCR for the presence of
plasmid inserts of the correct size. The ingredients of the PCR were as in section 2.4.1
except in half-volumes. The primers used were T7 and T3 for pBluescript II KS clones
and T7 and Sp6 for pGEM-T Easy clones (Table 2.3). The conditions used were:
1. 94°C 5 minutes2. 94°C 30 seconds3. 50°C 30 seconds4. 72°C 30 seconds5. Steps 2-4 an additional 29 times6 . 72°C 10 minutes
Positive colonies were added to 3 ml LB-broth and grown at 37°C for 16 hours.
2.4.7 Purifying plasm id DNA
500 pi of bacterial suspension was frozen at -80°C in sterile 20% glycerol by volume.
Plasmid DNA was purified from the remaining bacteria using QIAprep miniprep
protocol (Qiagen, UK), a modified alkaline lysis method (Bimboim and Doly, 1979). 1.5
ml of culture was pelleted at 14,000g for 10 minutes and the bacteria resuspended in 250
123
|Lil buffer PL Bacteria were lysed with the addition of 250 \x\ buffer P2 and the solution
neutralised with 350 \i\ buffer N3. Genomic DNA was pelleted by centrifugation at
14,000g for 10 minutes and the supernatant applied to a QIAprep column. The solution
was passed through the column by centrifugation (14,000g, 1 minute) or with a vacuum.
The column was washed once with 500 pi buffer PB, twice with 750 pi buffer PE, and
plasmid DNA eluted with 50 pi distilled water (around 200 ng/pl).
2.4.8 Verifying cione identity
The identities of the clones were verified by PCR with the primers originally used to
amplify the insert. 2 pi (around 400 ng) of purified plasmid DNA was used under the
PCR conditions described previously (section 2.4.2).
2.4.9 DNA sequencing
The identity of the clones were also verified by DNA sequencing using an automated
application of the chain-termination method (Sanger et al., 1977b). 1 pi of plasmid DNA
was added to 4 pi of Beckman QuickStart mix (containing dATP, dCTP, dTTP, dITP,
ddUTP, ddOTP, ddCTP, ddATP and thermosequenase DNA polymerase in Tris buffer,
pH 8.9) and 5 pmoles of T7 or Sp6 primer. The solution was placed in a thermal cycler
and subjected to the following conditions:
1. 94°C 3 minutes2. 96°C 20 seconds3. 50°C 20 seconds4. 60°C 4 minutes5. Steps 1-3 an additional 29 times
This incorporates fluorescent di-deoxynucleotides into daughter DNA strands. DNA was
precipitated from the sequencing reaction by adding 2 pi sodium acetate (1.5 M), 2 pi
EDTA (50 mM, Sigma, UK) and 1 pi glycogen (20 mg/ml, Beckman Coulter, UK) in a
final volume of 20 pi, vortexing, and then adding 60 pi 95% (v/v) ethanol/water (-20°C)
and leaving on ice for 10 minutes. DNA was pelleted by centrifugation at 14,000g for 15
minutes at 4°C. The supernatant was removed, the pellet washed with 200 pi 70%
ethanol/water (-20°C), and the tube left open at room temperature until dry. DNA was
resuspended in 40 pi de-ionised formamide (JT Baker, USA) for 15 minutes and
124
transferred to a 96-well plate. The sequences were determined using an automated
capillary DNA sequencer (Beckman Coulter, UK) as per the manufacturer’s instructions.
2.4.10 Array PCR
The array PCR was designed to amplify large quantities of DNA probe in a specific
manner. The PCR employs two primers specific for the vector sequences that abut the
inserted DNA. The primers used depend on the vector; pBlue 5’ and 3’ for pBluescript II
KS and pGEM 5’ and 4’ for pGEM-T Easy. The sequences are listed in Table 2.3
(primers 141-144). A PCR buffer containing 1 mM rather than 2 mM magnesium was
found to give cleaner products from pBluescript II KS clones (Table 2.1). Probes were
amplified from a 1:40 dilution of purified plasmid DNA (section 2.4.7) in distilled water
by PCR in 96-well plates. The constituents of each individual PCR reaction were:
DNA (approx. 5 ng/pl) 4 piPrimers (approx. 100 pM) 4 pi eachPCR buffer (10 or 20 mM MgCU) 10 pidNTPs (10 mM) 2 piTaq DNA polymerase (5 U/pl) 0.5 piDistilled water 77.5 pi
The reaction conditions were:
1. 94°C 2 minutes2. 94°C 30 seconds3. 55°C 30 seconds4. 12°C 30 seconds5. Steps 2-4 an additional 39 times6 . 72°C 7 minutes
2.4.11 Array PCR purification and precipitation
Array PCRs were purified using the QIAquick 96 PCR purification kit (Qiagen, UK). A
96-well PCR purification block was mounted on a vacuum manifold and 1 ml buffer PB
added to each of the wells. 200 pi of PCR product (for pGEM-T Easy clones this
constitutes 10 pg DNA) were added to each well (one well per clone) and mixed. The
solution was pulled through the block by applying a vacuum. This process was repeated
for pBluescript II KS clones as these PCRs only produce around 2.5 pg DNA. The plates
were then washed twice with 900 pi buffer PE and vacuum-dried for 10 minutes. Excess
wash buffer was removed by blotting the plate on paper towel and the DNA
125
subsequently eluted with 100 |il buffer EB. Purified DNA was precipitated in 100 p,l
batches with 30 |xl ammonium acetate (8 M) and 125 pi isopropanol (-20°C). This was
left on ice for 2 hours before the DNA was pelleted by centrifugation at 2300g for 1 hour
at 4°C. The plates were inverted to remove supernatant and the DNA pellets washed with
100 pi 80% (v/v) ethanol (-20°C) and spun again at 2300 g for 30 minutes at 4°C. The
plates were inverted once more and all supernatant removed by spinning the plates
upside down at 20g for 1 minute. Each purified PCR product was resuspended in 25 pi
of distilled water (400 ng/pl) for printing on nylon membrane to create the KSHV array
or in 5 pi of distilled water (2 pg/pl) for printing on glass to create the KSHV-human
microarray.
2.4.12 Printing the DNA arrays
Around 90 nl (36 ng) of purified DNA for each KSHV probe was spotted onto Hybond-P
nylon membrane (Amersham Pharmacia Biotech, UK) in duplicate by Driss Talibi at
Eurogentec (Liege, Belgium) to create the 288-element KSHV array (section 3.2.1). The
arrays were denatured in 0.5 M sodium hydroxide, 0.66 M sodium chloride for 10
minutes, soaked in distilled water for 10 minutes and then neutralised in 40 mM
phosphate buffer (pH 7.3) for 10 minutes. After drying the DNA was UV cross-linked to
the membrane (Stratagene, UK).
Together with 5428 probes for human genes (Clark et a l, 2002), KSHV probe DNA was
spotted onto glass slides (Nunc, USA) to create the 5808-element KSHV-human
microarray. This was performed by Karine Maillard and Nicola Cattini at the Institute of
Cancer Research (Sutton, UK) using a Flexis gridder (Genomic Solutions, UK).
2.5 KSHV array
2.5.1 Oligonucleotide iabeiiing
The quality of array element spotting was determined by the hybridisation of ^P-labelled
oligonucleotides probes specific for common primer sequence present at the ends of the
PCR products. The oligonucleotides (pGEM 5’ and pBlue 5’) were labelled with
126
[y_33p]_ATP (ICN, UK) using T4 polynucleotide kinase (Promega, UK) in the following
reaction:
Kinase buffer 2 |il[y-^^P]-ATP 5 1pGEM 5’ 100 pmolespBlue 5’ 200 pmolesT4 polynucleotide kinase 1 pi Distilled water up to 20 pi
37°C, 45 minutes.
This was precipitated for 16 hours at -20°C with 2 pi lithium chloride (4 M) and 60 pi
95% ethanol. DNA was pelleted by centrifugation at 14,000g for 30 minutes at 4°C,
washed with 250 pi of 70% ethanol (-20°C) and spun at 14,000g for 10 minutes at 4°C.
The supernatant was then removed, the pellet dried at room temperature (around 30
minutes) and resuspended in 1 0 0 pi distilled water.
2.5.2 Hybridisation of iabelied oiigonucleotides to the KSHV array
The arrays were incubated with 10 ml ExpressHyb (Clontech, UK) containing 0.1 mg/ml
denatured (95°C for 5 minutes) salmon sperm DNA (Roche, UK) in a hybridisation
bottle (Hybaid, UK) at 42°C for 30 minutes. The oligonucleotide probe was added to 5
ml ExpressHyb containing 0.1 mg/ml salmon sperm DNA and incubated with the KSHV
array at 42°C in a rotating hybridisation oven (Hybaid, UK) for 18 hours.
The hybridisation solution was decanted from the bottle and replaced with 2x sodium
chloride sodium citrate (SSC), 0.1% sodium dodecyl sulphate (SDS) and incubated at
50°C for 30 minutes. The arrays were then transferred to a box and shaken in 2x SSC,
0.1% SDS at 50°C for 30 minutes. This was then repeated with O.lx SSC, 0.1% SDS.
The arrays were wrapped in Saran wrap (Dow, USA) and exposed to a phosphor screen
(Amersham Pharmacia Biotech, UK) for 24 hours.
After the screen was scanned with a phosphor imager (Storm 860, Amersham Pharmacia
Biotech, UK, section 2.5.7), the arrays were stripped of bound labelled cDNA to allow
them to be re-used. Arrays were heated to 95°C in 0.5% SDS and allowed to cool to
room temperature. The success of the procedure was monitored by re-exposing the array
127
to a phosphor screen. 99% of all bound oligonucleotides were found to be removed. The
arrays were wrapped in Saran wrap and stored at 4°C.
2.5.3 Total RNA purification
Total RNA was purified from cells lysed in RLT lysis buffer (section 2.2.5.1) using the
RNeasy Mini protocol (Qiagen, UK). If frozen, the lysate was thawed on ice and then all
samples were homogenised by centrifugation through a QIAshredder column (14,000 g,
2 minutes). 1 volume (700 p.1) of 70% ethanol was added, the solution mixed, applied to
an RNeasy mini spin column and centrifuged at 14,000g for 15 seconds. The column was
washed once with 700 p.1 buffer RWl, twice with 700 pi buffer RPE and total RNA
eluted by applying 50 pi of diethylene pyrocarbonate (DEPC)-treated distilled water (add
0.1% DEPC (v/v), shake, incubate at 37°C for 16 hours then autoclave) and centrifuging
at 14,000g for 1 minute. The concentration of the purified RNA was calculated from the
UV absorbance at 260 nm using a UV spectrophotometer (Camlab, UK). An absorbance
of 1 cm' was taken to be equivalent to 40 pg/ml RNA. The purity of RNA was measured
by the ratio of the absorbencies at 260 nm and 280 nm.
2.5.4 DNase treatm ent of RNA
Contaminating DNA was removed from RNA by treatment with DNase 1 (Promega, UK)
according to the following protocol:
RNA (1 pg/pl) 100 piDNase buffer 20 piDNase 1(1 U/pl), 10 piDistilled water 70 pi
This was incubated at 37°C for 1 hour. Volumes were adjusted for differing amounts of
RNA. The reaction was stopped by adding 1/10^ volume of terminator mix (O.IM EDTA
pH 8.0, 1 mg/ml glycogen). The DNase enzyme was removed by adding an equal
volume of phenol:chloroform:isoamylalcohol (25:24:1, Sigma, UK). The mixture was
vortexed for 15 seconds, centrifuged at 14,000g for 10 minutes and the top aqueous layer
transferred to a fresh tube. This was then repeated once with
phenol : chloroform: isoamylalcohol and once with chloroform (Sigma, UK) to remove
any remaining phenol. RNA was precipitated at -20°C for 1 hour with 1/5 *’ volume
128
ammonium acetate (8 M) and 3 volumes of 95% ethanol (-20°C). RNA was pelleted by
centrifugation at 14,000g for 30 minutes at 4°C, washed with 200 pi 70% ethanol (-20°C)
and dried on the bench at room temperature (about 10 minutes). RNA was resuspended
at 5 pg/pl and, if not used immediately, stored at -80°C.
2.5.5 Total RNA labelling
Between 4 and 24 pg of total RNA were labelled with using a modified version of
the Strip-EZ RT protocol (Ambion, USA). Varying amounts of total RNA were used
because KSHV lytic replication reduces the levels of cellular mRNA. A pool of 123
different primers was used in the labelling reaction. 0.6 nmoles of all 3’ PCR primers of
each probe on the array (relative to the ORE) and the 5’ primers for probes of presumed
non-coding intergenic regions (Table 2.3) were pooled together. This combined primer
set had a volume of 4.5 ml containing each primer at 0.13 pM. 3 pi of this primer mix
was annealed to 2 pi RNA at 70°C for 10 minutes and then placed on ice for 2 minutes. 1
pi of luciferase RNA at varying concentrations (1 pg/pl to 10 ng/pl, see section 3.2.1.2)
were spiked into the reaction during this stage. cDNA was synthesised from the annealed
primers using Moloney murine leukaemia virus (MMLV) reverse transcriptase (RT)
(Ambion, USA) in the following reaction:
RNA and primers 6 piStrip-EZ buffer 2 piStrip-EZ dNTPs 2 pi[a-” P]dATP (ICN, UK) 4MMLV RT (200 U/nl) 1 (ilDEPC-treated water 5 pi
This was incubated at 42°C for 90 minutes. The labelled cDNA was separated from
unincorporated nucleotides using a Microspin S-400 column (Amersham Pharmacia
Biotech, UK). The column was first prepared by centrifugation at 800g for 1 minute. The
cDNA was then made up to 100 pi with DEPC-treated water and applied to the column.
The column was centrifuged at 800g for 2 minutes and the cDNA recovered in the flow
through. The incorporation of ^ P was measured by pipetting 1 pi of a 1:10 dilution onto
a MicroBeta filtermat (Wallac, Finland), melting MeltiLex A solid scintillant on top of it
and measuring the light emitted with a 1450 MicroBeta scintillation counter (Wallac,
Finland).
129
2.5.6 Hybridisation
The KSHV arrays were washed in O.lx saline sodium citrate (SSC) solution with 0.1%
(w/v) SDS at 64°C for 5 minutes. The arrays were then transferred to a hybridisation
bottle (Hybaid, UK) and incubated with 10 ml ExpressHyb (Clontech, UK) containing
0.1 mg/ml denatured (95°C for 5 minutes) salmon sperm DNA (Invitrogen, UK) at 64°C
for 30 minutes. The labelled cDNA was made up to 200 p.1 with distilled water and
denatured with 22 p,l 1 M sodium hydroxide, 10 mM EDTA at 64°C for 20 minutes. 222
p.1 of sodium hydrogen phosphate (1 M) was added to neutralise the alkali. Repetitive
DNA sequences were hybridised to 5 pg of Cot-1 DNA (Invitrogen, UK) by incubation
at 64°C for a further 10 minutes. Finally, the denatured cDNA was added to 5 ml
ExpressHyb containing 0.1 mg/ml salmon sperm DNA and incubated with the KSHV
array at 64°C in a rotating hybridisation oven (Hybaid, UK) for 18 hours.
The hybridisation solution was decanted from the bottle and the arrays washed with 2x
SSC, 0.1% SDS at 65°C for 30 minutes. The arrays were then transferred to a box and
shaken in 2x SSC, 0.1% SDS at 65°C for 30 minutes. This was then repeated with O.lx
SSC, 0.1% SDS. The arrays were then wrapped in Saran wrap (Dow, USA) and exposed
to a phosphor screen (Amersham Pharmacia Biotech, UK) for 48 hours.
After the screen was scanned with a phosphor imager (Storm 860, Amersham Pharmacia
Biotech, UK, section 2.5.7), the arrays were stripped of bound labelled cDNA to allow
them to be re-used. The Strip-EZ system incorporates a modified nucleotide into the
cDNA that can be cleaved, fragmenting the DNA and allowing it to be taken back into
solution. The cDNA was first degraded by incubation of the arrays with 10 ml distilled
water containing 100 pi probe degradation dilution buffer (Ambion, USA) and 50 pi
DNA probe degradation buffer (Ambion, USA) for 5 minutes at room temperature. The
arrays were then washed in 10 ml of 2% SDS containing 100 pi blot reconstitution buffer
(Ambion, USA) at 6 8 °C for 20 minutes. The success of the procedure was monitored by
re-exposing the array to a phosphor screen. 99% of the bound cDNA was found to be
removed by this method. The arrays were wrapped in Saran wrap and stored at 4°C.
130
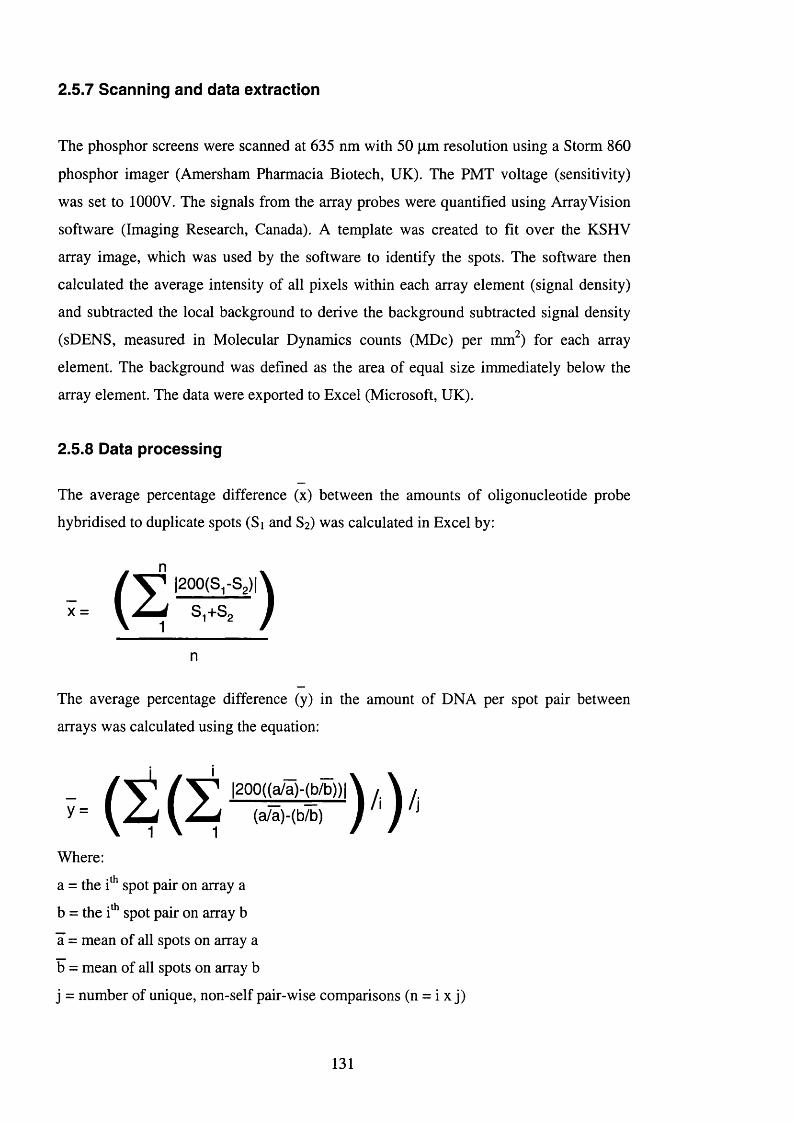
2.5.7 Scanning and data extraction
The phosphor screens were scanned at 635 nm with 50 pm resolution using a Storm 860
phosphor imager (Amersham Pharmacia Biotech, UK). The PMT voltage (sensitivity)
was set to lOOOV. The signals from the array probes were quantified using Array Vision
software (Imaging Research, Canada). A template was created to fit over the KSHV
array image, which was used by the software to identify the spots. The software then
calculated the average intensity of all pixels within each array element (signal density)
and subtracted the local background to derive the background subtracted signal density
(sDENS, measured in Molecular Dynamics counts (MDc) per mm^) for each array
element. The background was defined as the area of equal size immediately below the
array element. The data were exported to Excel (Microsoft, UK).
2.5.8 Data processing
The average percentage difference (x) between the amounts of oligonucleotide probe
hybridised to duplicate spots (Si and 8 2 ) was calculated in Excel by:
X =
|200(S,-S,)| \
S ,+S , f
The average percentage difference (y) in the amount of DNA per spot pair between
arrays was calculated using the equation:
/ ' ^ / " V I200((a/a)-(b/b))|\ , \(a/a)-(b/b) J 'J hy =
Where:
a = the i‘ spot pair on array a
b = the i*’ spot pair on array b
â = mean of all spots on array a
b = mean of all spots on array b
j = number of unique, non-self pair-wise comparisons (n = i x j)
131
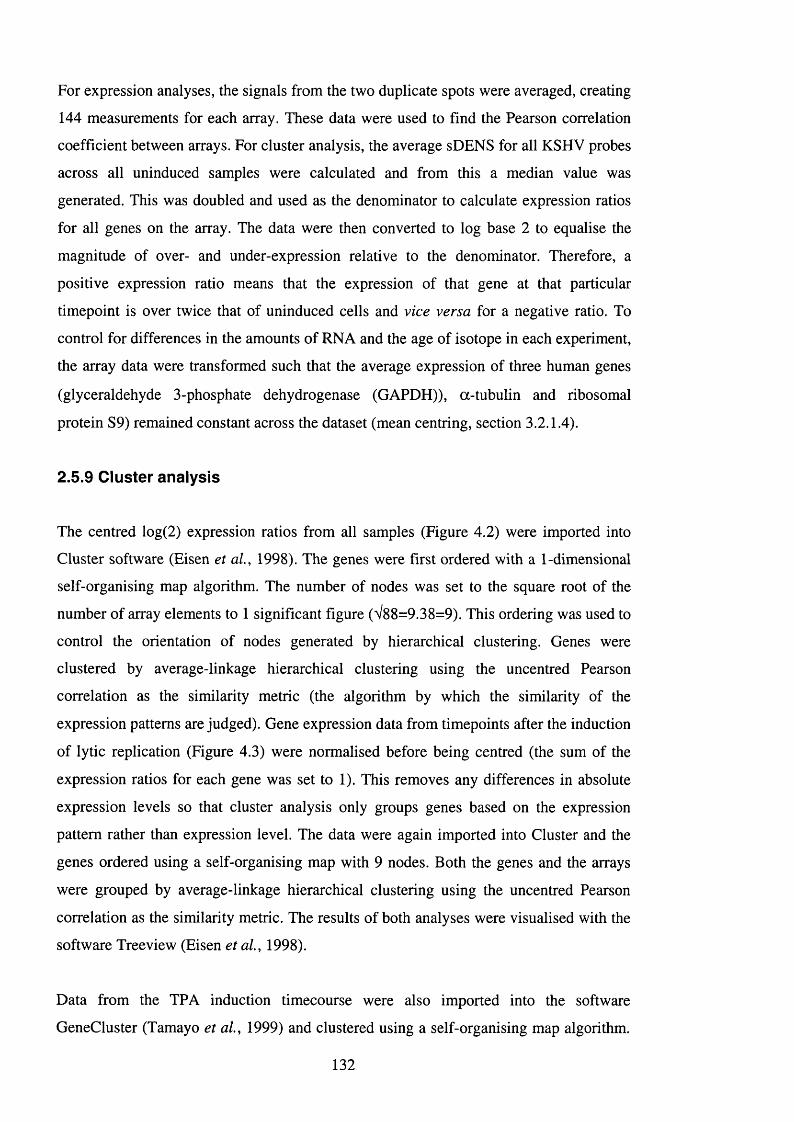
For expression analyses, the signals from the two duplicate spots were averaged, creating
144 measurements for each array. These data were used to find the Pearson correlation
coefficient between arrays. For cluster analysis, the average sDENS for all KSHV probes
across all uninduced samples were calculated and from this a median value was
generated. This was doubled and used as the denominator to calculate expression ratios
for all genes on the array. The data were then converted to log base 2 to equalise the
magnitude of over- and under-expression relative to the denominator. Therefore, a
positive expression ratio means that the expression of that gene at that particular
timepoint is over twice that of uninduced cells and vice versa for a negative ratio. To
control for differences in the amounts of RNA and the age of isotope in each experiment,
the array data were transformed such that the average expression of three human genes
(glyceraldehyde 3-phosphate dehydrogenase (GAPDH)), a-tubulin and ribosomal
protein S9) remained constant across the dataset (mean centring, section 3.2.1.4).
2.5.9 C luster analysis
The centred log(2) expression ratios from all samples (Figure 4.2) were imported into
Cluster software (Eisen et al, 1998). The genes were first ordered with a 1-dimensional
self-organising map algorithm. The number of nodes was set to the square root of the
number of array elements to 1 significant figure (V88=9.38=9). This ordering was used to
control the orientation of nodes generated by hierarchical clustering. Genes were
clustered by average-linkage hierarchical clustering using the uncentred Pearson
correlation as the similarity metric (the algorithm by which the similarity of the
expression patterns are judged). Gene expression data from timepoints after the induction
of lytic replication (Figure 4.3) were normalised before being centred (the sum of the
expression ratios for each gene was set to 1). This removes any differences in absolute
expression levels so that cluster analysis only groups genes based on the expression
pattern rather than expression level. The data were again imported into Cluster and the
genes ordered using a self-organising map with 9 nodes. Both the genes and the arrays
were grouped by average-linkage hierarchical clustering using the uncentred Pearson
correlation as the similarity metric. The results of both analyses were visualised with the
software Treeview (Eisen et al, 1998).
Data from the TPA induction timecourse were also imported into the software
GeneCluster (Tamayo et a l, 1999) and clustered using a self-organising map algorithm.
132
The number of nodes was set to three, arranged in a 3x1 matrix. The clustered data were
exported to Excel for analysis.
2.6 KSHV-human microarray
2.6.1 Total RNA purification
Frozen TRIzol lysates (section 2.2.5.2) were thawed at 37°C and centrifuged at 12,000g
for 10 minutes at 4°C to remove insoluble material. The supernatant was transferred to a
new tube and left at room temperature for 5 minutes. 0.2 ml of chloroform was then
added per ml of TRIzol and the solution shaken by hand for 15 seconds. After incubation
at room temperature for 2-3 minutes, the aqueous layer was separated from the organic
layer by centrifuging at 12,000g for 15 minutes at 4°C. The top aqueous layer was
transferred to a new tube and 0.5 ml (per ml TRIzol) isopropanol was added to
precipitate RNA. The solution was vortexed and incubated at room temperature for 10
minutes before the RNA was pelleted by centrifugation at 12,000g for 15 minutes at 4°C.
The supernatant was discarded and the pellet washed with 1 ml 75% ethanol and
centrifuged at 7500g for 5 minutes at 4°C. The supernatant was removed once more and
the pellet dried at room temperature (around 5 minutes). The RNA was then resuspended
in 100 |Lil DEPC-treated distilled water. RNA was quantified by UV-spectrophotometry
as before (section 2.5.3) and then DNase treated (section 2.5.4). After re-purification the
RNA was resuspended in 100 pi DEPC-treated distilled water and re-quantified. 1 pg
was resolved by agarose gel electrophoresis to verify degradation of the RNA had not
taken place. If the RNA was not used immediately it was stored at -80°C.
2.6.2 mRNA purification
mRNA was purified from total RNA using Oligotex (Qiagen, UK), which separates
nucleic acids containing poly-dA sequences through hybridisation to oligo-dT bound-
microscopic polystyrene-latex particles. Before purification, the Oligotex suspension was
warmed to 37°C, vortexed and then returned to room temperature and buffer GEE heated
to 70°C. Total RNA was made up to 250 pi and mixed with 250 pi buffer QBE and 15 pi
Oligotex suspension. This was incubated at 70°C for 3 minutes to denature the RNA and
then annealed at room temperature for 20 minutes. Subsequently, the Oligotex was
pelleted by centrifugation at 14,000g for 2 minutes and the supernatant discarded. The
133
pellet was resuspended in 400 pi buffer 0W2, mixed and applied to a Qiagen spin
column. This was centrifuged at 14,000g for 1 minute, the Oligotex resuspended in an
additional 400 pi buffer 0W2 and centrifuged again. The bound mRNA was eluted by
resuspending the Oligotex in 200 pi of buffer OEB (70°C) and centrifuging through the
column at 14,000g for 1 minute. This was repeated to give a final volume of 400 pi. The
mRNA was quantified by UV spectrophotometry in a disposable plastic cuvette (UVette,
Eppendorf, UK). Purified mRNA was stored at -80°C.
2.6.3 mRNA labelling
mRNA was concentrated to approximately 100 ng/pl by centrifugation through a
Microcon YM-30 column (Millipore, UK) at 14,000g for 8 minutes. The mRNA was
recovered by inverting the column and centrifuging at lOOOg for 3 minutes. Reference
RNA was made by mixing dilute mRNA in the proportions shown in section 3.2.2.3 and
then concentrating this mixture. Luciferase and TMV RNA were spiked into 1 pg of
cellular mRNA and random nonomer primers (MWG Biotech, Germany) annealed in the
following reaction:
mRNA (1 pg)Random nonomer (0.2 pM) 1 piLuciferase RNA (1 ng/pl) 1 piTMV RNA (0.1 ng/pl) 1 piDEPC-treated water up to 16 pi
This was mixed and heated at 65°C for 5 minutes and then incubated at room
temperature for a further 5 minutes. The RNA was then added to the labelling reaction
that uses Superscript II RT (Invitrogen, UK) to synthesise fluorescently labelled cDNA.
Cy5 was used for individual samples, Cy3 for the reference RNA mixture.,
strand buffer 8 piDTT (0.1 M) 4 piLow-dC dNTPs (5 mM except dCTP 2 mM) 4 pi Cy3 or Cy5 dCTP (1 mM) 4 piSuperscript II (200 U/pl) 4 pi
This was left at room temperature for 10 minutes and then incubated at 42°C for 16
hours. Subsequently, the DNA was denatured with 20 pi of sodium hydroxide (O.IM), 5
pi EDTA (0.5 M, pH 8.0) at 70°C for 10 minutes and then neutralised with 20 pi
134
hydrochloric acid (0.1 M). 3 |xg of Cot-1 DNA (Invitrogen, UK) was added to suppress
hybridisation of repetitive DNA and the volume made up to 500 pi with Tris-EDTA (TE,
pH 8.0). Unincorporated nucleotides were gradually removed and the mRNA
concentrated by centrifugation through a Microcon YM-30 column. 20 pi (1/25 *’ by
volume) was saved to run on an agarose gel and the remainder was centrifuged at
14,000g for 6 minutes. 20 pi of the filtrate was saved for the gel. The Microcon column
was placed in a new tube and filled with 300 pi of TE and centrifuged for a further 8
minutes. This was repeated one further time and then the concentrated labelled cDNA
recovered by inverting the Microcon column and centrifuging at lOOOg for 3 minutes.
The desired volume was 13 pi or below. One 25* of this was run on a 1% agarose gel
(no ethidium bromide) with the previously saved samples. The Cy5 incorporation and
removal of unincorporated Cy5-dCTP was verified by scanning the gel with a
fluorimeter at 635 nm (Storm 860, Amersham Pharmacia Biotech, UK). If not used
immediately, the labelled cDNA was stored at -20°C.
2.6.4 Hybridisation
The hybridisation mix was made as follows:
20x saline sodium phosphate EDTA (SSPE, Sigma, UK) 1 pipoly-dA (8 pg/pl, Amersham Pharmacia Biotech, UK) 2 piYeast tRNA (4 pg/pl, Sigma, UK) 2 piCy5-labelled cDNA Cy 3-labelled reference cDNATE (pH 8.0) up to 45 pi10% SDS (added last) 1 pi
The cDNA was denatured at 98°C for 2 minutes and then incubated at 37°C for 20
minutes. Meanwhile the microarray hybridisation chamber (custom made at the Institute
of Cancer Research) was warmed to 65°C. The microarrays were denatured in distilled
water at 95°C for 2 minutes and then washed in 95% ethanol for 2 minutes. The arrays
were immediately dried by centrifugation at 200 g for 2 minutes and then warmed at
65°C for around 15 minutes in the hybridisation chamber. 1 pi of lOOx Denhardt’s
solution (Sigma, UK) was added to the hybridisation mix and any insoluble material
removed by centrifugation at 14,000g for 15 minutes. The supernatant was then pipetted
onto the centre of the microarray and an ethanol-washed glass coverslip (22x64 mm. No.
0 thickness, Chance-Propper, UK) dropped on top from a pair of forceps. 150 pi of 4x
135
SSPE (65°C) was added to the side of the microarray to maintain the humidity and the
chamber closed by means of screws. The chamber was then inunersed in a 65°C water
bath for 16 hours.
The microarray was transferred from the water bath to 2x SSPE at 50°C until the
coverslip became detached and then washed in 2x SSPE at room temperature for 2
minutes, Ix SSPE for 2 minutes and O.lx SSPE for 3 minutes. The microarray was
rapidly dried by centrifugation at 200 g for 2 minutes and then scanned with a GenePix
4000 microarray scanner (Axon Instruments, USA).
2.6.5 Scanning and data extraction
The microarrays were scanned with a GenePix 4000 microarray scanner, controlled by
GenePix Pro 3.0 software (Axon Instruments, USA), at 10 p.m resolution. Cy3 and Cy5
were simultaneously excited at 532 nm and 635 nm respectively and the resultant light
detected with two PMTs. The voltages across the PMTs were adjusted so that the signals
from the array elements were balanced. The PMTs were generally set around 900V to
maximise the signal to background ratio (section 3.2.2.2). The GenePix software
combines the data from the two channels to create a single composite image. Arrays
found to have hybridised unevenly or with high background were repeated. A template,
created at the Institute of Cancer Research, was fitted over the array image using a spot-
finding software algorithm. Array elements from which no signal could be detected were
flagged as not found by the GenePix software. All 5808 elements on each array were
checked by eye and the template altered if necessary. Array elements spoiled by debris,
scratches or with a high local background were flagged as bad. Data were extracted from
the image by the software using the adjusted template. Signal intensity is measured as the
average number of bits, from 0 to 65535, for spot pixels in the image file. The GenePix
software-derived normalisation factor (average ratio between signals in the Cy3 and Cy5
channels) was verified to be 1±0.3. If outside of this range, the PMT voltages were
adjusted and the microarray rescanned. Expression ratios were calculated as the median
of the ratios between the local background-subtracted Cy3 and Cy5 signals on a pixel-
by-pixel basis by the software. The data were exported to Array Analyser, a spreadsheet
created in Excel, and the median of ratios filtered using Boolean operators to remove
flagged array elements and elements for which the signal to background ratio was below
1.5 in the Cy3 channel or 2 in the Cy5 channel (section 3.2.2.4). An exception is the
136
KSHV genes in Figure 4.12 for which the data were only filtered for flagged array
elements.
2.6.6 C luster analysis
The filtered median of ratios for the samples to be analysed were assembled and
imported into Cluster software (Eisen et a l, 1998). Array elements for which expression
measurements had been filtered from 20% or more of the arrays were removed and the
data converted to log base 2. The arrays were then median centred (the median
expression ratio within each array was set to 0) and the genes median centred (the
median expression ratio of each array element across all arrays was set to 0). The genes
and arrays were ordered with a 1-dimensional self-organising map algorithm. The
number of gene nodes was set to the square root of the number of array elements to 1
significant figure and the number of array nodes to the square root of the number of
arrays to 1 significant figure. This ordering was used to control the orientation of nodes
generated by hierarchical clustering. Genes and arrays were clustered by average-linkage
hierarchical clustering using the uncentred Pearson correlation as the similarity metric.
The results were visualised with the software Treeview (Eisen et a l, 1998).
2.6.7 Mann-Whltney U (Wilcoxon-rank) te s t
The filtered data for 38 arrays were assembled and filtered for genes present in 80% of
the arrays and then median centred for both genes and arrays in Cluster as before (section
2.6.6). The data were then exported to Excel and the expression ratio for each array
element converted into ranks relative to that array element across all arrays. A U-value
for each array element was calculated by:
U i = H i ,1 H i ,2 + ( ( n i , i ( r i i , i + 1 ) ) / 2 ) - R i
Where:
rij,i = the number of non-filtered expression ratios for the i* array element in the PEL
samples.
Dj,2 = the number of non-filtered expression ratios for the i‘ array element in the non-
PEL samples.
Ri = sum of ranks for the i^ array element in the PEL samples.
137
The U values were converted to the standard normal variable for the array element (Zi)
with the equation:
- ((rijini2)/2)Zi =
The probability associated with each Z-value was calculated in Excel
(NORMSDIST(Zi))
2.7 Non-array com puter analyses
Open reading frames (ORFs) were identified using ORFinder
(www.ncbi.nlm.nih.gov/gorf). Homology was initially assessed with Basic Local
Alignment Search Tool (BLAST)p (www.ncbi.nlm.nih.gov/blast) (Altschul et al, 1990).
Alignments were performed with ClustalW (Thompson et a l, 1994) and visualised with
Boxshade (bioweb.pasteur.fr/seqanal/interfaces/boxshade-simple.html). Phylogenetic
trees were constructed by the neighbour-joining method using the program NEIGHBOR
of the PHYLIP package (Felsenstein, 1993) with the help of M. Mar Alba. The tree was
visualised with TREEVIEW (Page, 1996). Branches generated with a bootstrap value of
below 90% were collapsed. Splice sites were predicted and verified by software at the
Berkeley Drosophila Genome Project (www.fruitfiy.org/seq_tools/splice.html).
2.8 Non-array PCR
2.8.1 PCR for KSHV and EBV
The presence of KSHV and EBV in cell lines were determined by PCR from 100 ng of
DNA with primers for ORE 33 (primers 63 a and b) and BFRFl (primers 134 a and b)
respectively (Table 2.3). PCR conditions were as described in section 2.4.2.
2.8.2 Real-time PCR
Cells were taken from the PEL cell line BC-3 at various timepoints after the induction of
lytic replication in parallel with the samples for the KSHV array (section 2.2.5.1). DNA
was purified as in section 2.4.1. The real-time PCR was performed by Dimitra
138
Bourmpoulia. DNA was amplified by PCR performed using a real-time PCR TaqMan
assay (7700 Sequence Detector, Perkin-Elmer Biosystems, UK) as described previously
(Lallemand et a l, 2000). The number of KSHV genomes per cell was calculated by
multiplying the signal for KSHV DNA by 2 (to normalise for the diploid human
genome) and dividing by the signal for human DNA.
2.8.3 RT-PCR
Total RNA was purified by the methods detailed in sections 2.5.3 and 2.6.1 and
contaminating DNA removed by treatment with DNase I (section 2.5.4). 1 p,l of oligo-dT
primers (500 p,g/ml) were annealed to 5 pg of total RNA in 12 pi final volume by
heating at 70°C for 10 minutes and then chilling on ice. cDNA was synthesised using
Superscript II RT (Invitrogen, UK) in the following reaction:
RNA and primers 12 piFirst strand buffer (Invitrogen, UK) 4 pi Dithiothreitol (DTT, 0.1 M) 2 pidNTPs (10 mM) 1 pi
This was incubated at 42°C for 2 minutes, I pi of Superscript II (200 U/pl) added, and
then incubated for a further 48 minutes. The reaction was terminated by heating to 70°C
for 15 minutes.
cDNA was amplified, together with DNA controls, using the Expand Long Template
System (Roche, UK) except for KlO.l splice (Figure 4.I0A) and Blimp-1 (Figure 5.10),
where the PCR conditions of section 2.4.2 were used. For the Expand system, the
following constituents were mixed in thin-walled tubes:
cDNA or DNA 2 piPrimers 1+1 piExpand buffer 3 2.5 piExpand polymerase 0.25 pidNTPs (10 mM) 1.25 piDistilled water 17 pi
139
The PCR conditions used were:1.95°C 30 seconds2. 58°C 20 seconds3. 68°C 3 minutes4. Repeat steps 1-3 an additional 9 times5. 95°C 30 seconds6. 58°C 20 seconds7. 68°C 4 minutes8. Repeat steps 5-7 an additional 24 times
Bands were resolved on a 0.8% agarose gel containing 0.2 |Lig/ml ethidium bromide. The
bands of the expected sizes were purified from the gel (section 2.4.3) and ligated into
pGEM-T Easy (section 2.4.5). The ligation reaction was used to transform XL-1 Blue
E.coli and the resultant colonies were cultured on LB-agar with ampicillin selection.
Plasmid DNA was purified from bacteria using QIAprep Mini kit (section 2.4.7). Full-
length vIRF clones were identified by restriction mapping; KlO/10.1 clones were
digested with Eco RI, Sma I and Pst I, KlO.5/10.7 with Eco RI and Xho I and K11/vIRF-
2 with Eco RI, Nde I and Pvu II (Promega, UK). All digests were performed with 1 pi
DNA, ipl of the recommended buffer (Promega, UK), 1 pg bovine serum albumin
(BSA) and 1 pi of enzyme in a total volume of 10 pi for 1 hour at 37°C except for Sma I
digests, which were performed at 25°C. The products were resolved by agarose gel
electrophoresis. vIRF clones were sequenced following the methodology of section 2.4.9
using T7 and Sp6 primers, their respective array primers and those additionally listed in
Table 2.3. Probe H clones were sequenced with T7, Sp6 and primers 40a and 41b.
Contigs were assembled with Sequencher software (Gene Codes, USA).
2.9 Northern blotting
2.9.1 mRNA purification
mRNA was purified with the QuickPrep Micro mRNA purification kit (Amersham
Pharmacia Biotech, UK). This functions by the same principle as the Qiagen Oligotex kit
(section 2.6.2). The cell pellet generated in section 2.2.5.3 was thawed and lysed with
400 pi Extraction Buffer. 800 pi Elution Buffer was then added and the cell extract was
centrifuged at 14,000g for 1 minute. 1 ml of supernatant was mixed with 1ml oligo-dT
cellulose (65°C) for 3 minutes at room temperature and the cellulose pelleted at 14,000g
for 10 seconds. The supernatant was discarded and the pellet wash 4 times with 1 ml
140
High Salt Buffer and twice with 1 ml Low Salt Buffer. The oligo-dT cellulose was then
resuspended in 0.3 ml Low Salt Buffer, applied to a Microspin column and centrifuged at
14,000g for 5 seconds. The filtrate was discarded and the column washed three times
with 0.5 ml of Low Salt Buffer. mRNA was eluted with two volumes of 200 pi Elution
Buffer (65°C) and quantified by UV spectrophotometry (section 2.5.3). The RNA was
precipitated with IMO*’ volume glycogen (10 mg/ml), 1/10‘*’ volume potassium acetate
(2.5 M, pH 5) and 2.5 volumes of 95% ethanol at -20°C for 16 hours. The RNA was
pelleted at 14,000g for 30 minutes at 4°C and then washed with 70% ethanol. After
drying at room temperature, the pellet was resuspended at 0.5 pg/ml (KlO.l northern) or
2 pg/ml (KIO northern).
2.9.2 Denaturing agarose gel e lectrophoresis and blotting
1% agarose (w/v) was dissolved in 72 ml DEPC-treated distilled water. To this was
added 18 ml formaldehyde (12.3 M) and 10 ml lOx MOPS-EDTA-sodium acetate
(MESA) buffer (Sigma, UK) and the gel poured. The gel was run for 5 minutes at 50 V
before loading the samples. 1 volume of RNA was mixed with 3 volumes of RNA
loading buffer (Sigma, UK), incubated at 65°C for 10 minutes and chilled on ice. The
samples were run with 4 pg Millenium RNA size markers (Ambion, USA) for 5 hours at
50V. The size marker lane was cut from the gel and stained for 16 hours in sodium
hydroxide (0.1 M) with 0.5 pg/ml ethidium bromide (Sigma, UK). The rest of the gel
was rinsed in three changes of distilled water and inverted on top of ZetaProbe GT nylon
membrane (BioRad, UK), itself on top of a wick of 3MM paper (Whatmann, UK)
immersed in lOx SSPE. The gel was covered in 3MM paper and a stack of absorbent
paper towels and compressed with weights to allow the RNA to transfer to the membrane
by capillary action. After 16 hours the membrane was washed in 2x SSPE and baked at
80°C for 2 hours.
2.9.3 Radiolabelled probe syn thesis and hybridisation
Clones of KlO.l (array probe clone 33, Table 3.1), the entire KIO (amplified from BC-3
DNA with primers 32a and 125b (Table 2.3) and cloned into pGEM-T Easy) and
GAPDH (array probe clone 83, Table 3.1) were linearised by digestion with Pst I, Sac II
and Not I respectively, which cut the respective vectors at the 5’ end of the insert
(relative to the start codon). The digests were resolved by agarose gel electrophoresis and
141
the linear DNA excised and purified. Radioactive probes were synthesised from the
linearised DNA by the incorporation of [a-^^P]dATP (ICN, UK) with the Strip EZ PCR
protocol (Ambion, USA) in the following reaction:
DNA around 50 ngStrip-EZ buffer 2 p.1Strip-EZ dNTPs 2 piAntisense primer (10 pM) 2 piTaq (5U/pl) 0.2 pi[a-’¥]dATP 2 HiDistilled water up to 20 pi
The conditions used were:
1. 95°C 30 seconds2. 55°C 20 seconds3. 72°C 2 minutes4. Repeat steps 1-3 an additional 34 times.
The radiolabelled probe was purified from unincorporated nucleotides with a Microspin
column and the activity of the probe measured (see section 2.5.5). The blot was rinsed
with 2x SSPE and then incubated in 15 ml of ExpressHyb (Clontech, UK) containing 0.1
mg/ml denatured salmon sperm DNA (Roche, UK) at 55°C for 30 minutes. The probe
was added to 45 ml of ExpressHyb with 0.1 mg/ml denatured salmon sperm DNA and
hybridised to the blot at 55‘ C for 16 hours. After this, the blot was washed with 2x SSPE
at 55°C for 30 minutes and then repeated on a shaker at room temperature. The blot was
finally washed in two changes of 2x SSPE / 0.1% (w/v) SDS for 30 minutes each at
65°C. The blot was then wrapped up in Saran wrap (Dow, USA) and presented to a
phosphor screen (Amersham Pharmacia Biotech, UK) or BioMax film (Kodak, UK).
Film was developed in a Compact X4 film processor (X-ograph, UK).
Blots were stripped of hybridised probe as in section 2.5.6 but at 68°C. Blots were then
re-probed for GAPDH.
2.10 W estern blotting
9x10^ cells were pelleted at 350g for 5 minutes at 4°C and washed in PBS (4°C). All
supernatant was removed and cells lysed in 1 ml radioimmunoprecipitation (RIPA)
buffer (4°C) containing “Complete” protease inhibitor cocktail (1 tablet per 2 ml RIPA
buffer, Roche, UK) and benzonase (Merck, UK) at 0.06 U/ml. Cell lysates were stored at
142
-80°C before use. 12 )l i 1 of cell lysate was mixed with 3 )l i 1 loading buffer and the
constituent proteins separated on a 10% acrylamide gel by SDS-polyacrylamide gel
electrophoresis (PAGE). Proteins were transferred to Hybond-P polyvinylidene fluoride
(PVDF) membrane in protein electrophoresis buffer with 10% ethanol by the application
of 100 mA for 16 hours at 4°C. Protein transfer was verified by staining with ponceau S
(0.25%) and the blot blocked in PBS containing 0.1% Tween-20 (Polyoxyethylene
sorbitan monolaureate; Sigma, UK) and 2% powdered milk (w/v, Tesco, UK). The blot
was then incubated with mouse anti-ATF6 antibody (Imgenex, USA) at 1:250 (2 pg/ml)
in PBS, 0.1% Tween-20, 2% milk. After washing 4 times with PBS, 0.1% Tween-20, the
blot was incubated with rabbit anti-mouse conjugated with horseradish peroxidase (HRP;
Dako, UK) at 1:2000 in PBS, 0.1% Tween-20, 2% milk. The blot was washed 4 more
times in PBS, 0.1% Tween-20 and stained with ECL (Amersham Pharmacia Biotech,
UK). Chemiluminescence was visualized using Hyperfilm (Amersham Pharmacia
Biotech, UK) and a Compact X4 film processor (X-ograph, UK). The sizes of the
resultant bands were estimated from Benchmark protein size standards (Invitogen, UK).
Equal loading of total protein on each lane of the gel was assessed by staining a gel run
in parallel with 0.25% Brilliant Blue R (Sigma, UK) in 45% ethanol / 10% acetic acid for
20 minutes. Excess stain was removed by washing in 20% ethanol / 10% acetic acid for
16 hours.
2.11 Flow cytom etry
Expression of cell surface CDS, 14, 19, 27, 29 (integrin pi), 49f (integrin a6) and 138
were determined by flow cytometry. Cells were taken from culture and washed twice in
PBS with 0.01% azide. Cells were then incubated with CD3-phycoerythrin (PE) (230
pg/ml, Dako, UK), CD 14-fluorescein isothiocyanate (FITC) (200 pg/ml. Sigma, UK),
CD19-PE (12.5 pg/ml, Beckton-Dickinson biosciences), CD27-FITC (100 pg/ml,
Cymbus, UK), CD138-FITC (100 pg/ml, Cymbus, UK), CD49f-FITC (100 pg/ml,
Cymbus, UK) or CD29-FITC (100 pg/ml, Cymbus, UK) at 10 pi per 10 cells for 1 hour
at 4°C. Cells were also incubated with isotype controls at the same concentration: CDS
and 19 - anti-mouse IgGi-PE (Sigma, UK), CD 14, 27 and 49f - anti-mouse IgG2a-FITC
(Sigma, UK), CD29 and 138 anti-mouse IgGi-FITC (Dako, UK). Cells were washed 3
times in PBS with 0.01% azide. Ten thousand events were collected and analysed using a
143
FACScan with Cellquest software (Becton Dickinson, UK). Significance for correlation
with array data was found using the Fisher exact test.
2.12 Im m unofluorescence a ssay (IFA)
2x10^ cells were taken from culture and washed twice with PBS and fixed in 100 [i\ 2%
paraformaldeyde (v/v) for 20 minutes at room temperature. Cells were then washed once
with PBS and permeablised with 100 ml 0.2% (v/v) Triton for 15 minutes at room
temperature. Cells were washed twice with PBS and then incubated with a 1 in 100
dilution (15 pg/ml) of LN53 (rat IgGzc monoclonal antibody against LNA-1, (Kellam et
al, 1999) in PBS with 2% FCS for 20 minutes at room temperature. Cells were also
incubated with a 1 in 66 dilution (15 pg/ml) of rat anti-HIV-2 Env as an isotype control
(gift from Elaine Thomas, Wohl Virion Centre, University College London). Cells were
washed three times in PBS with 2% FCS and subsequently incubated with a 1 in 120
dilution of anti-rat Ig-FTTC (Dako, UK) in PBS with 2% FCS for 20 minutes at room
temperature. Cells were washed a final two times in PBS with 2% FCS and resuspended
in PBS.
2.13 Cell proliferation assay
Cells were grown to approximately 1x10 cells/ml, pelleted at 350g for 5 minutes and
seeded in 96-well plates at 1.5x10 cells/ml (3x10 cells/well) in their normal medium
(see section 2.2). EB 1089 (4x10'^ M in isopropanol; Leo Pharmaceutical Products,
Denmark) was added at half log serial dilutions between 10' to 10'^° M in RPMI-1640
medium with 10% FCS and P/S. Cells were incubated at 37°C in 5% CO2 for 72 hours
before methyl-^H-thymidine (Amersham Pharmacia Biotech, UK) was added at 10
pCi/ml and the cells incubated for an additional 5 hours. Cells were harvested (Tomtec,
USA) onto Filtermat A filters (Wallac, Finland), washed and incorporation measured
using MeltiLex A and a 1450 MicroBeta scintillation counter (Wallac, Finland). The
significance of the correlation with array data was determined using Student’s t-Test.
144
Chapter 3
Manufacture and validation of DNA arrays
3.11ntroduction
The expression pattern of a gene relates to its function and consequently the genes
expressed within a cell dictate its internal state and response to extracellular stimuli. This
also applies to virus genes, which must function within the context of the host cell. DNA
arrays allow the expression of hundreds or thousands of genes to be monitored
simultaneously. Using this technology, it is therefore possible to relate activity of the
genome to the phenotype of the cell. The application of DNA array technology to the
study of virology has extended our knowledge of virus gene expression, cellular
responses to infection and virus control of host gene expression (sections 1.3.6 and
1.3.7).
The size of herpesvirus genomes hinders the comprehensive analysis of their activity by
traditional methods. Herpesviruses are therefore ideal candidates for DNA array
technology because every viral gene can be printed onto a single array. This allows the
complete gene expression profile of the genome (transcriptome) to be elucidated from
the results of a single experiment. The first virus to have its transcriptome mapped in this
way was human cytomegalovirus (HCMV) (Chambers et a i, 1999). This study used a
microarray containing oligonucleotide probes for all HCMV ORFs, spotted in triplicate
on glass slides. The array was used to examine virus gene expression in infected
fibroblasts in the presence and absence of metabolic inhibitors to classify all virus genes
by kinetic class (Table 1.7). Each experiment was performed in triplicate to minimise
experimental variation and allow the significance of expression changes to be assessed
The effect virus infection has on the host cell often underlies disease. Methods that allow
the measurement of expression for a few host genes at a time provide only a limited
means with which to study these effects. A number of studies have shown that
measurements of gene expression using DNA arrays can reveal changes in cellular gene
expression that occur upon virus infection (section 1.3.7). The simultaneous analysis of
the expression of thousands of genes at once offers a more complete picture of how
viruses interact with the host genome. The presence of KSHV in human neoplasia
145

suggests that KSHV infection can lead to cancer. Array analysis has proven to be a
powerful tool for understanding cancer derivation, revealing potential mechanisms of
transformation and predicting sensitivity to therapy.
Global analysis of cellular gene expression therefore promises much for the study of
virally driven cancers. The aims of this chapter are to create and to test DNA arrays for
the analysis of KSHV and human gene expression in B-cell lymphoma.
146
3.2 Results
3.2.1 The KSHV array
3.2.1.1 Production of the KSHV array
A KSHV array was created to allow expression analysis of the entire viral genome. To
represent fully the coding potential of the KSHV genome on the array, a set of PCR
primers were designed to amplify around 350 bp from the 5’ end of all predicted KSHV
ORFs (Paul Kellam and Chris Boshoff). In addition, primers were designed to gene-
specific exons and presumed non-coding regions of the genome (section 4.2.4). Primers
were also designed to amplify sequences from cellular “housekeeping” genes to use for
normalisation (section 3.2.1.4). The genes chosen were ubiquitin, tyrosine 3-
monooxygenase activation protein (TMAP), pyrophosphate phosphoribosyltransferase
(PPRT), glyceraldehyde 3-phosphate dehydrogenase (GAPDH), a-tubulin, MHC class I
HLA-B, (3-actin, highly basic protein and ribosomal protein S9. Primers were also made
to amplify luciferase and tobacco mosaic virus (TMV) 180kD protein genes to act as
positive and negative controls respectively. Each of these 114 primer pairs was used to
amplify probe sequences from genomic DNA or cDNA. Each probe was given a code
number, from 1 to 114, to facilitate identification. These are listed in Table 3.1 along
with the gene name and corresponding region of the KSHV genome. The sequences of
the primers used can be found in Table 2.3.
Each array probe was cloned into either pGEM-T Easy (probes 1-46) or pBluescript 11
KS (probes 47-114) (section 2.4.5). The identity of each cloned array probe was
confirmed by PCR with probe-specific primers (Figure 3.1) and DNA sequencing
(section 2.4.9). Cloned array probes were checked for the possibility of cross
hybridisation, both against each other and against host genes, by searching GenBank
using pairwise sequence analysis (www.ncbi.nlm.nih.gov/BLAST). No array probes
were found to have significant homology to other sequences aside the sequence they
represent.
147
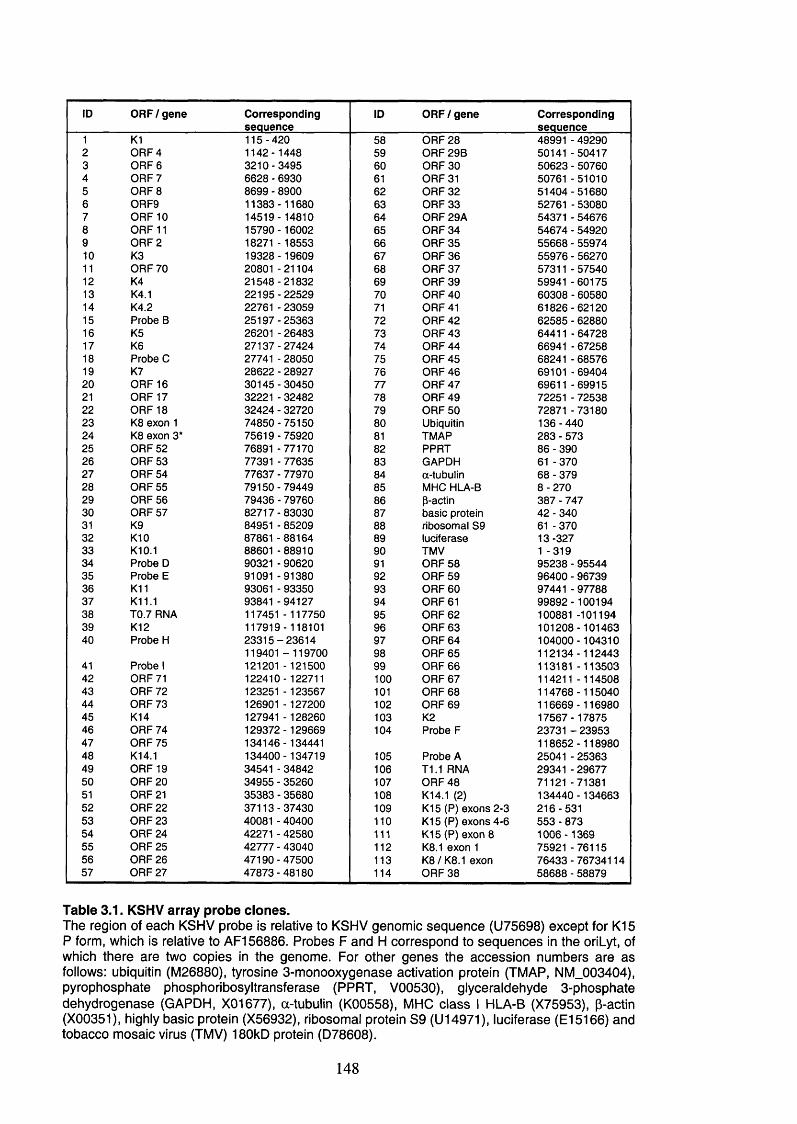
ID ORF / gene Correspondingsequence
ID ORF / gene Correspondingsequence
1 K1 1 1 5 -4 2 0 58 O R F 28 48991 - 492902 O R F 4 1 1 4 2 -1 4 4 8 59 O R F 2 9 B 50141 -5 0 4 1 73 O R F 6 3 2 1 0 -3 4 9 5 60 O R F 30 50 623 - 507604 O R F 7 6628 - 6930 61 O R F 31 50761 - 510105 O R F 8 8699 - 8900 62 O R F 32 5 1 4 0 4 -5 1 6 8 06 0 R F 9 1 1 3 8 3 -1 1 6 8 0 63 O R F 33 52761 - 530807 O R F 10 1 4 5 1 9 -1 4 8 1 0 64 O R F 29A 54371 - 546768 O R F 11 1 5 7 9 0 - 16002 65 O R F 34 54674 - 549209 O R F 2 18271 - 18553 66 O R F 35 55 668 - 5597410 K3 1 9 3 2 8 - 19609 67 O R F 36 55 976 - 5627011 O R F 70 20801 -2 1 1 0 4 68 O R F 37 57311 - 5754012 K4 2 1 5 4 8 -2 1 8 3 2 69 O R F 39 59941 -6 0 1 7 513 K4.1 2 2 1 9 5 -2 2 5 2 9 70 O R F 40 60308 - 6058014 K4.2 22761 - 23059 71 O R F 41 6 1 8 2 6 -6 2 1 2 015 Probe B 2 5 1 9 7 -2 5 3 6 3 72 O R F 42 62585 - 6288016 K5 26201 - 26483 73 O R F 43 64411 - 6472817 K6 2 7 1 3 7 -2 7 4 2 4 74 O R F 44 66941 - 6725818 Probe C 27741 - 28050 75 O R F 45 68241 - 6857619 K7 28622 - 28927 76 O R F 46 69101 -6 9 4 0 420 O R F 16 3 0 1 4 5 -3 0 4 5 0 77 O R F 47 69611 -6 9 9 1 521 O R F 17 32221 - 32482 78 O R F 49 72251 - 7253822 O R F 18 32424 - 32720 79 O R F 50 72871 -7 3 1 8 023 K8 exon 1 7 4 8 5 0 -7 5 1 5 0 80 Ubiquitin 1 3 6 -4 4 024 K8 exon 3* 7 5 6 1 9 -7 5 9 2 0 81 TM A P 283 - 57325 O R F 52 76891 -7 7 1 7 0 82 P P R T 86 - 39026 O R F 53 77391 - 77635 83 G A P D H 61 - 37027 O R F 54 77637 - 77970 84 a-tubulin 68 - 37928 O R F 55 7 9 1 5 0 -7 9 4 4 9 85 M HC HLA-B 8 - 2 7 029 O R F 56 79436 - 79760 86 P-actin 387 - 74730 O R F 57 8 2 7 1 7 -8 3 0 3 0 87 basic protein 42 - 34031 K9 84951 - 85209 88 ribosomal 8 9 61 - 37032 KIO 87861 -8 8 1 6 4 89 luciferase 1 3 -3 2 733 K10.1 88601 -8 8 9 1 0 90 TM V 1 -3 1 934 Probe D 90321 - 90620 91 O R F 58 95238 - 9554435 Probe E 91091 -9 1 3 8 0 92 O R F 59 96 400 - 9673936 K11 93061 - 93350 93 O R F 60 97441 - 9778837 K11.1 93841 -9 4 1 2 7 94 O R F 61 99892 - 10019438 T 0 .7 RNA 117451 - 117750 95 O R F 62 100881 -10119439 K12 1 1 7 9 1 9 -1 1 8 1 0 1 96 O R F 63 1 0 1 2 0 8 -1 0 1 4 6 340 Probe H 2 3 3 1 5 -2 3 6 1 4 97 O R F 64 1 0 4 0 0 0 -1 0 4 3 1 0
119401 - 119700 98 O R F 65 1 1 2 1 3 4 -1 1 2 4 4 341 Probe 1 121201 - 121500 99 O R F 66 113181 -1 1 3 5 0 342 O R F 71 1 2 2 4 1 0 -1 2 2 7 1 1 100 O R F 67 114211 - 11450843 O R F 72 123251 - 123567 101 O R F 68 1 1 4 7 6 8 -1 1 5 0 4 044 O R F 73 126901 - 127200 102 O R F 69 116669 - 11698045 K14 127941 - 128260 103 K2 1 7 5 6 7 - 1787546 O R F 74 129372 - 129669 104 Probe F 23731 - 2395347 O R F 75 1 3 4 1 4 6 - 134441 1 1 8 6 5 2 - 11898048 K14.1 1 3 4 4 0 0 -1 3 4 7 1 9 105 Probe A 25041 - 2536349 O R F 19 34541 - 34842 106 T1.1 RNA 29341 - 2967750 O R F 20 34955 - 35260 107 O R F 48 71121 -7 1 3 8 151 O R F 21 35383 - 35680 108 K14.1 (2) 1 3 4 4 4 0 -1 3 4 6 6 352 O R F 22 3 7 1 1 3 -3 7 4 3 0 109 K15 (P) exons 2 -3 2 1 6 -5 3 153 O R F 23 40081 - 40400 110 K15 (P) exons 4 -6 55 3 - 87354 O R F 24 42271 - 42580 111 K 1 5 (P )e x o n 8 1 0 0 6 -1 3 6 955 O R F 25 42777 - 43040 112 K8.1 exon 1 75921 -7 6 1 1 556 O R F 26 4 7 1 9 0 -4 7 5 0 0 113 K8 / K8.1 exon 7 6 4 3 3 -7 6 7 3 4 1 1 457 O R F 27 4 7 8 7 3 -4 8 1 8 0 114 O R F 38 58 688 - 58879
Table 3.1. KSHV array probe clones.The region of each KSHV probe is relative to KSHV genomic sequence (U75698) except for K15 P form, which is relative to API 56886. Probes F and H correspond to sequences in the oriLyt, of which there are two copies in the genome. For other genes the accession numbers are as follows: ubiquitin (M26880), tyrosine 3-monooxygenase activation protein (TMAP, NM_003404), pyrophosphate phosphoribosyltransferase (PPRT, V00530), glyceraldehyde 3-phosphate dehydrogenase (GAPDH, X01677), a-tubulin (K00558), MHC class I HLA-B (X75953), P-actin (X00351), highly basic protein (X56932), ribosomal protein S9 (U14971), luciferase (E l5166) and tobacco mosaic virus (TMV) 180kD protein (D78608).
148
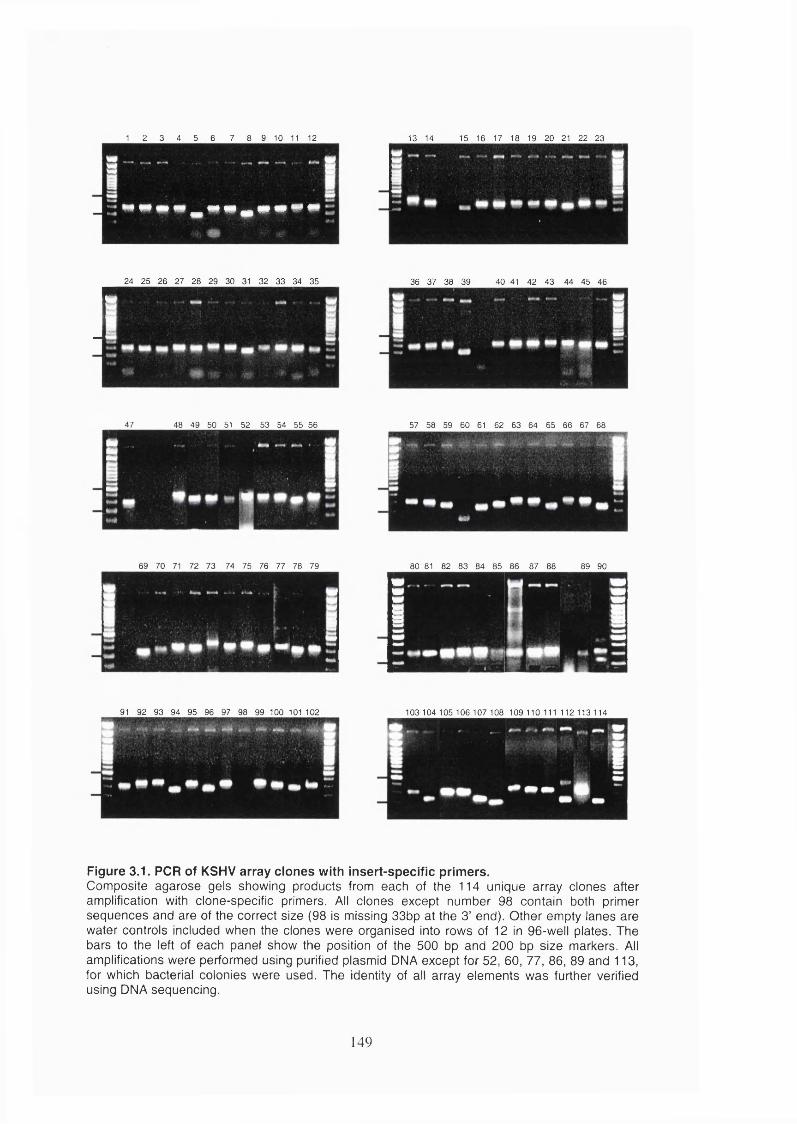
1 2 3 4 5 6 7 8 9 10 11 12 13 14 15 16 17 18 19 20 21 22 23
2 4 2 5 2 6 2 7 2 8 2 9 3 0 3 1 3 2 3 3 3 4 3 5 3 6 3 7 3 8 3 9 4 0 4 1 4 2 4 3 4 4 4 5 4 6I4 7 4 8 4 9 5 0 5 1 5 2 5 3 5 4 5 5 5 6 5 7 5 8 5 9 6 0 6 1 6 2 6 3 6 4 6 5 6 6 6 7 6 8
6 9 7 0 7 1 7 2 7 3 7 4 7 5 7 6 7 7 7 8 7 9 8 0 8 1 8 2 8 3 8 4 8 5 8 6 8 7 8 8 8 9 9 0
9 1 9 2 9 3 9 4 9 5 9 6 9 7 9 8 9 9 1 0 0 1 0 1 1 0 2 1 0 3 1 0 4 1 0 5 1 0 6 1 0 7 1 0 8 1 0 9 1 1 0 1 1 1 1 1 2 1 1 3 1 1 4
Figure 3.1. PCR of KSHV array clones with insert-specific primers.Composite agarose gels showing products from each of the 114 unique array clones after amplification with clone-specific primers. All clones except number 98 contain both primer sequences and are of the correct size (98 is missing 33bp at the 3’ end). Other empty lanes are water controls included when the clones were organised into rows of 12 in 96-well plates. The bars to the left of each panel show the position of the 500 bp and 200 bp size markers. All amplifications were performed using purified plasmid DNA except for 52, 60, 77, 86, 89 and 113, for which bacterial colonies were used. The identity of all array elements was further verified using DNA sequencing.
149
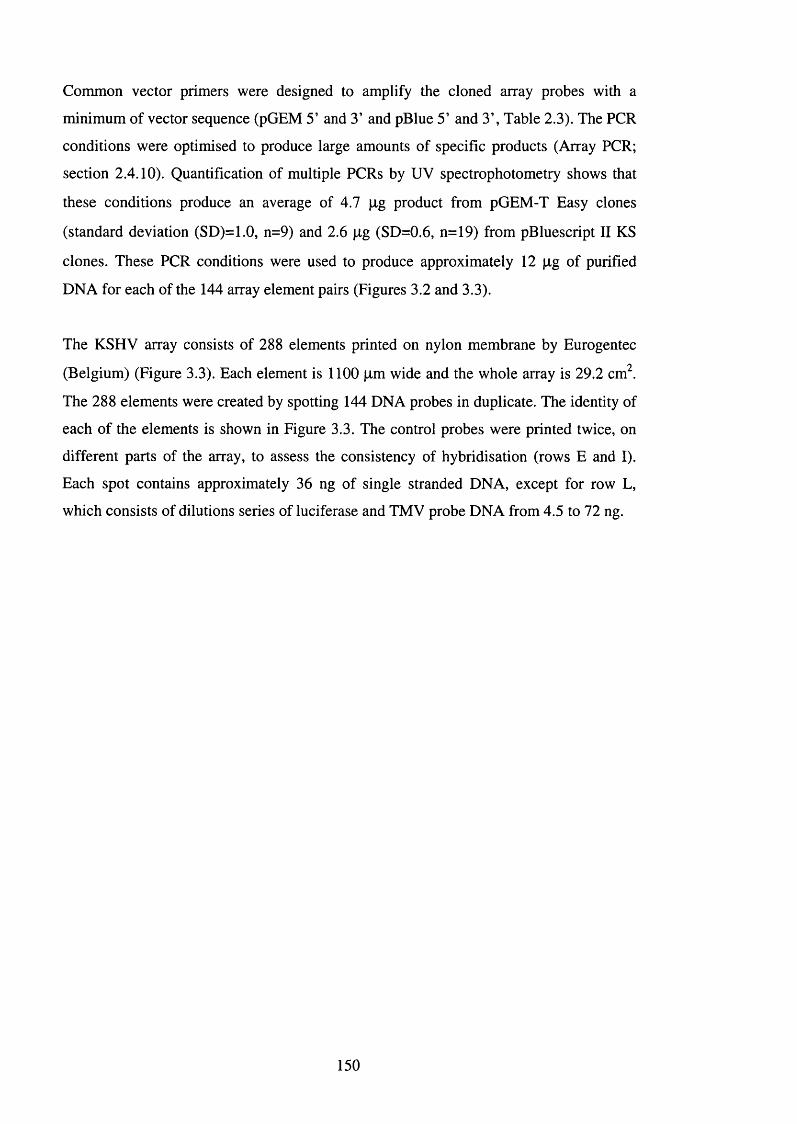
Common vector primers were designed to amplify the cloned array probes with a
minimum of vector sequence (pGEM 5’ and 3’ and pBlue 5’ and 3’, Table 2.3). The PGR
conditions were optimised to produce large amounts of specific products (Array PGR;
section 2.4.10). Quantification of multiple PGRs by UV spectrophotometry shows that
these conditions produce an average of 4.7 pg product from pGEM-T Easy clones
(standard deviation (SD)=1.0, n=9) and 2.6 pg (SD=0.6, n=19) from pBluescript II KS
clones. These PGR conditions were used to produce approximately 12 pg of purified
DNA for each of the 144 array element pairs (Figures 3.2 and 3.3).
The KSHV array consists of 288 elements printed on nylon membrane by Eurogentec
(Belgium) (Figure 3.3). Each element is 1100 pm wide and the whole array is 29.2 cm .
The 288 elements were created by spotting 144 DNA probes in duplicate. The identity of
each of the elements is shown in Figure 3.3. The control probes were printed twice, on
different parts of the array, to assess the consistency of hybridisation (rows E and I).
Each spot contains approximately 36 ng of single stranded DNA, except for row L,
which consists of dilutions series of luciferase and TMV probe DNA from 4.5 to 72 ng.
150
Figure 3.2. Purified array probe DNA.Agarose gels showing purified PCR products for each array probe (144, including water controls). Each panel shows a specific row of the array, with probes arranged in column order from 1 to 12. In each panel the first lane after the size markers is a mass control (80 ng). The identity of each DNA species is shown in Figure 3.3. The bars to the left of each panel show the position of the 500 bp and 200 bp size markers. 90 nl (0.3%) of each DNA probe solution was spotted onto nylon membranes in duplicate to create the KSHV arrays.
151
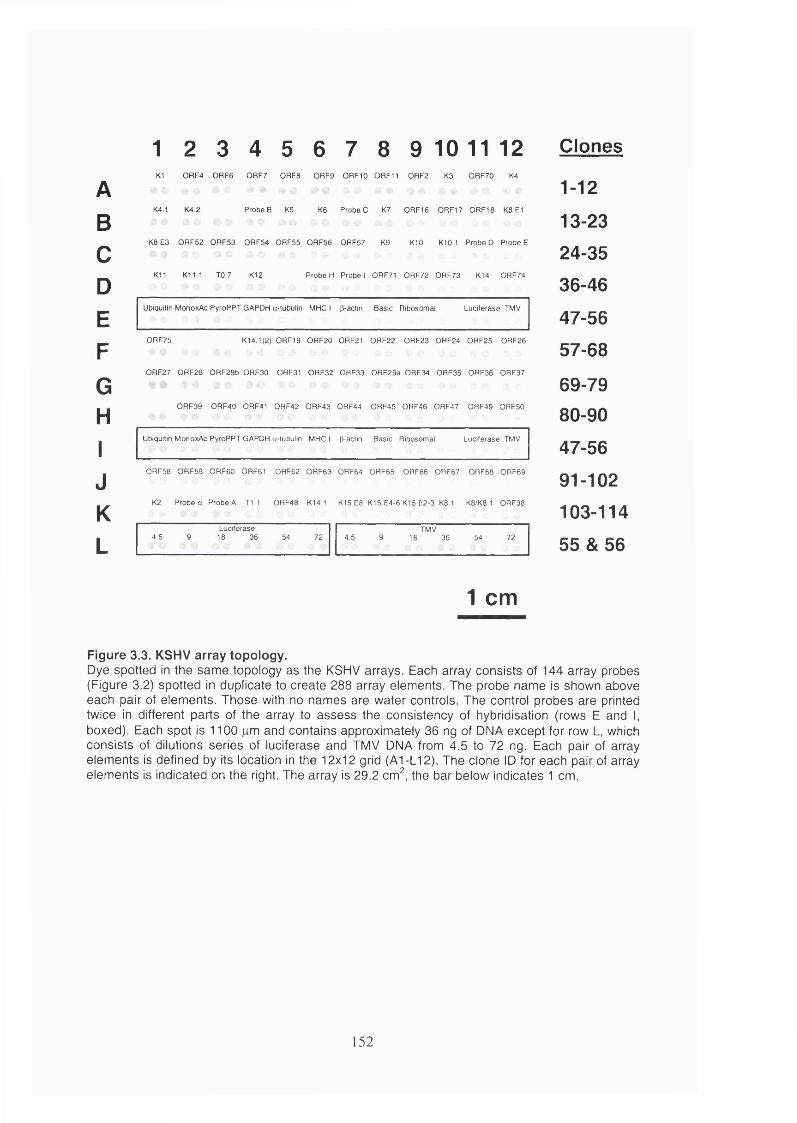
ABCDEFGHIJKL
1 2 3 4 5 6 7 8 9 10 11 12K1 0 R F 4 0 R F 6 0 R F 7 0 R F 8 0 R F 9 ORF10 0RF11 0 R F 2 K3 ORF70 K4
K4.1 K4.2 Probe B K5 K6 Probe C K7 0RF16 0RF17 0RF18 K8E1
K8E3 ORF52 ORF53 ORF54 ORF55 ORF56 ORF57 K9 K10 K10.1 Probe D Probe E
K11 K11.1 T0.7 K12 Probe H Probe 1 0RF71 ORF72 ORF73 K14 ORF74
Ubiquitin MonoxAc PyroPPT GAPDH a-tubulin MHC 1 fi-actin Basic Ribosomal Luciferase TMV
ORF75 K14.1(2) 0RF19 ORF20 0RF21 ORF22 ORF23 ORF24 ORF25 ORF26
ORF27 ORF28 ORF29b ORF30 0RF31 ORF32 ORF33 ORF29a ORF34 ORF35 ORF36 ORF37
ORF39 ORF40 0RF41 ORF42 ORF43 ORF44 ORF45 ORF46 ORF47 ORF49 ORF50
Ubiquitin MonoxAc PyroPPT GAPDH u-tubulin MHC 1 [i-actin Basic Ribosomal Luciferase TMV
ORF58 ORF59 ORF60 ORF61 ORF62 ORF63 ORF64 ORF65 ORF66 ORF67 ORF68 ORF69
K2 Probe a Probe A 11.1 ORF48 K14.1 K15E8 K15E4-6K15E2-3 K8.1 K8/K8.1 ORF38
4.5 9Luciferase 18 36 54 72 4.5 9
TMV 18 36 54 72
Clones
1-12
13-2324-3536-46
47-5657-68
69-7980-9047-5691-102103-11455&56
1 cm
Figure 3.3. KSHV array topology.Dye spotted in the same topology as the KSHV arrays. Each array consists of 144 array probes (Figure 3.2) spotted in duplicate to create 288 array elements. The probe name is shown above each pair of elements. Those with no names are water controls. The control probes are printed twice in different parts of the array to assess the consistency of hybridisation (rows E and I, boxed). Each spot is 1100 juim and contains approximately 36 ng of DNA except for row L, which consists of dilutions series of luciferase and TMV DNA from 4.5 to 72 ng. Each pair of array elements is defined by its location in the 12x12 grid (A1-L12). The clone ID for each pair of array elements is indicated on the right. The array is 29.2 cm^, the bar below indicates 1 cm.
152
3.2.1.2 Characteristics of the KSHV array
The spotting of every element on each array was checked by hybridisation of ^P-labelled
oligonucleotides complementary to the two sets of common PCR primers (Figure 3.4,
sections 2.5.1 and 2.5.2). The arrays were scanned and the signals quantified using a
phosphor imager (section 2.5.7). Only complete, evenly spotted arrays were used in
subsequent experiments (arrays 1-5 and 7-11). The signal from each array element is
calculated by the Array Vision software as the background subtracted signal density
(sDENS), given in the units Molecular Dynamics counts (MDc)/mm^. The average
difference between the sDENS (the amounts of oligonucleotide probe hybridised) to
duplicate spots within each array is ±5% (n=1396) (section 2.5.8). Therefore, the amount
of DNA deposited between duplicate array elements is reproducible. Spotting between
arrays was also found to be consistent. Analysis of arrays 2, 3, 4, 5 and 7, all hybridised
with the same batch of labelled oligonucleotides, reveals that the average variation in the
amount of DNA per spot pair between arrays is ±11.8% (n=1008). The average Pearson
correlation coefficient between the amounts of DNA spotted between these arrays is 0.97
(n=10). This reproducibility in the amount of probe DNA deposited within and between
arrays results in low variation between gene expression measurements (section 3.2.1.3).
153
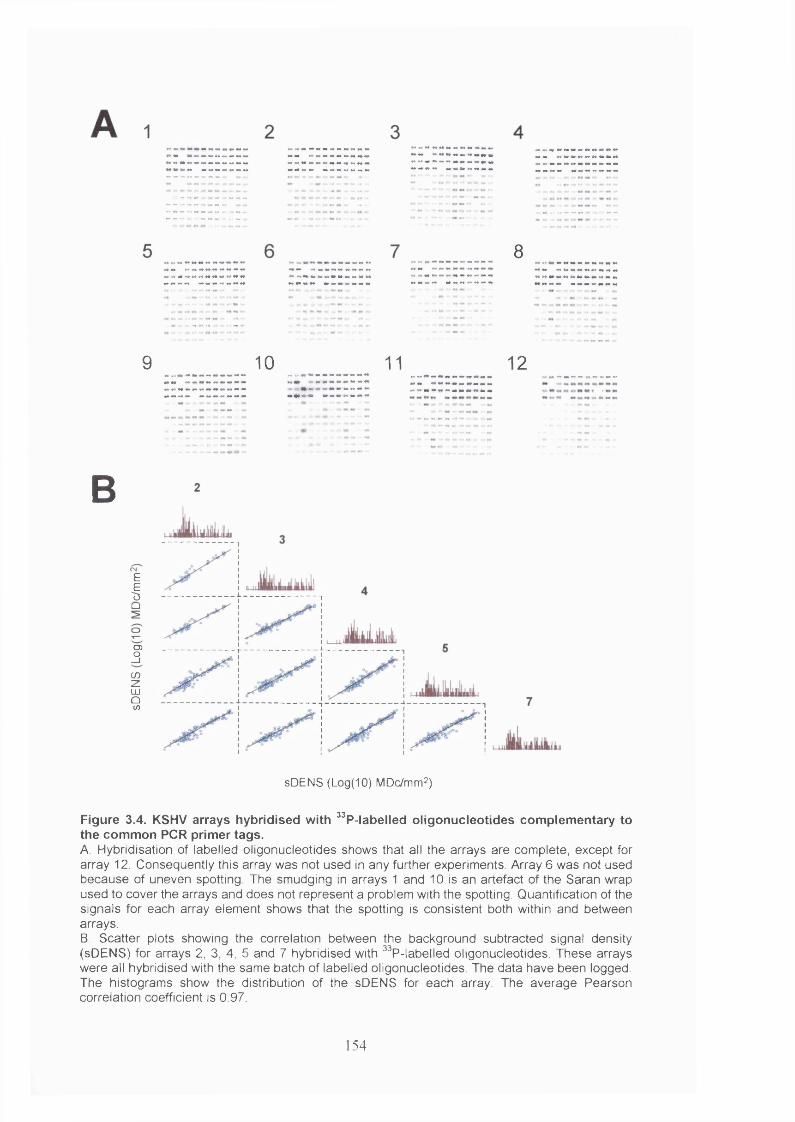
8
9 10 11 12
B
E
I
8C/DZLUQü)
s D E N S (L o g (1 0 ) M D c /m m 2 )
Figure 3.4. KSHV arrays hybridised with ” P-labelled oligonucleotides complementary to the common PCR primer tags.A. Hybridisation of labelled oligonucleotides shows that all the arrays are complete, except for array 12. Consequently this array was not used in any further experiments. Array 6 was not used because of uneven spotting. The smudging in arrays 1 and 10 is an artefact of the Saran wrap used to cover the arrays and does not represent a problem with the spotting. Quantification of the signals for each array element shows that the spotting is consistent both within and between arrays.B. Scatter plots showing the correlation between the background subtracted signal density (sDENS) for arrays 2, 3, 4, 5 and 7 hybridised with ^^P-labelled oligonucleotides. These arrays were all hybridised with the same batch of labelled oligonucleotides. The data have been logged. The histograms show the distribution of the sDENS for each array. The average Pearson correlation coefficient is 0.97.
154
As Figure 3.4A shows, the amount of DNA in each spot is not constant within each
array. Therefore the relationship between the amount of DNA spotted and hybridisation
efficiency was determined. The PCR dilution series of luciferase and TMV probe DNA
spans a range of 2 p,g. Known amounts of labelled luciferase cDNA were hybridised to
the arrays and the signal quantified (Figure 3.5A). This shows that the hybridisation
signal spans an average range of 2 ' MDc/mm^. Therefore the amount of DNA spotted
only has a small effect on the signal produced.
To control for the sensitivity of the arrays, luciferase RNA was spiked into the samples
before labelling. This showed that 10 pg luciferase RNA in 10 p,g total RNA
(1:1,000,000 by weight) could be detected at 10-fold above background. On average, 10
|Xg total RNA was found to be equivalent to 10 cells and 10 pg luciferase is
approximately 10 copies. Therefore, this concentration is equivalent to approximately 10
copies/cell. The TMV elements acted as negative controls and on average gave a signal
only 1.3 fold above background (SD=0.3, n=90). Varying the amount of luciferase RNA
spiked into the labelling reaction demonstrates that the relationship between RNA
concentration and signal produced is proportional (Figure 3.5B). The arrays are thus able
to measure relative changes in RNA abundance.
To test further the specificity of the arrays, RNA was extracted from Ramos cells, a
KSHV-negative cell line derived from BL, and hybridised to an array. Almost all of the
virus genes appeared negative showing that the vast majority of the probes are specific
for KSHV RNA. However, five elements, corresponding to ORFs 35, 50, 60, 68 and K15
exon 8 exhibited cross-hybridisation with Ramos cellular RNA (Figure 3.5C). These five
elements were therefore not included in the expression analyses described in Chapter 4.
The specificity of the KSHV array is also illustrated in Figures 4.2 and 4.12.
155
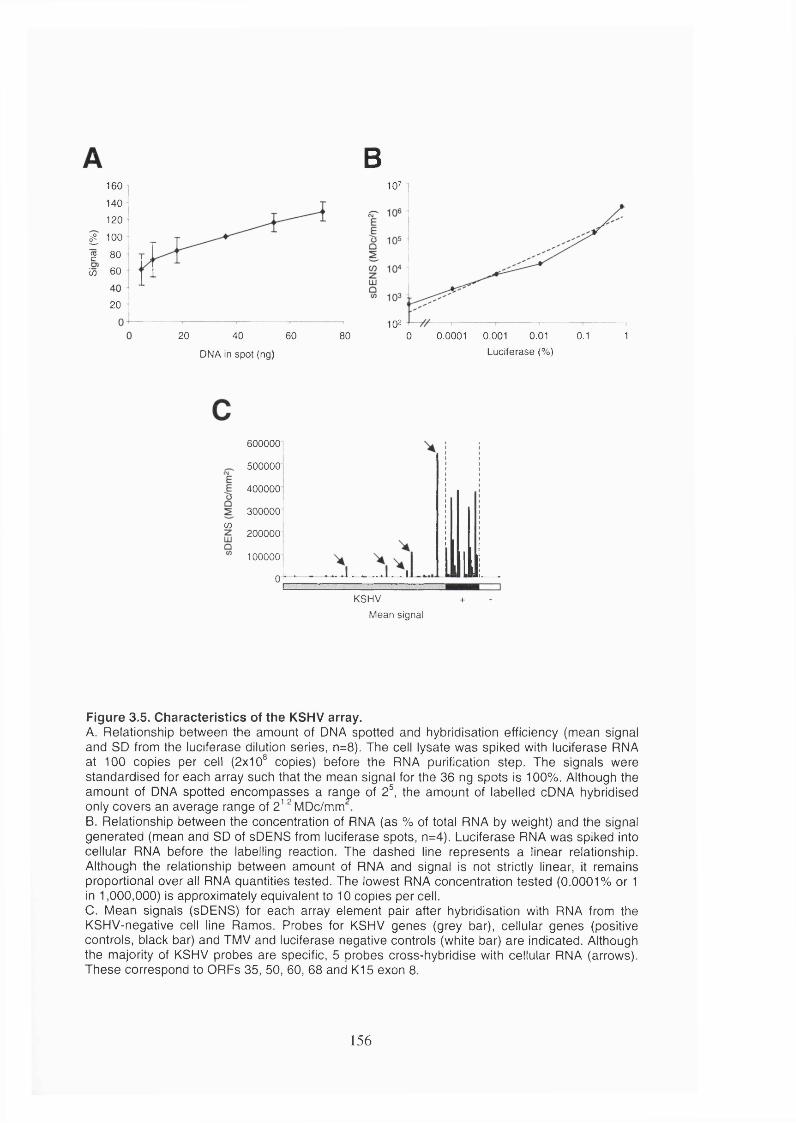
B160 1Q7
140 I
120 ^
^ 100
g 80
w 60
20
20 40 60
DNA in spot (ng)
80102
0 0.0001 0.001 0.01 0.1 1
Luciferase (%)
ce
600000
500000■
400000
300000
200000 '
100000 0- ■ *«-•-1-.* ta « • ■l a - ji_J- 1 l l i .
KSHV +
Mean signal
Figure 3.5. Characteristics of the KSHV array.A. Relationship between the amount of DNA spotted and hybridisation efficiency (mean signal and SD from the luciferase dilution series, n=8). The cell lysate was spiked with luciferase RNA at 100 copies per cell (2x10® copies) before the RNA purification step. The signals were standardised for each array such that the mean signal for the 36 ng spots is 100%. Although the amount of DNA spotted encompasses a range of 2®, the amount of labelled cDNA hybridised only covers an average range of 2^^ MDc/mmB. Relationship between the concentration of RNA (as % of total RNA by weight) and the signal generated (mean and SD of sDENS from luciferase spots, n=4). Luciferase RNA was spiked into cellular RNA before the labelling reaction. The dashed line represents a linear relationship. Although the relationship between amount of RNA and signal is not strictly linear, it remains proportional over all RNA quantities tested. The lowest RNA concentration tested (0.0001% or 1 in 1,000,000) is approximately equivalent to 10 copies per cell.C. Mean signals (sDENS) for each array element pair after hybridisation with RNA from the KSHV-negative cell line Ramos. Probes for KSHV genes (grey bar), cellular genes (positive controls, black bar) and TMV and luciferase negative controls (white bar) are indicated. Although the majority of KSHV probes are specific, 5 probes cross-hybridise with cellular RNA (arrows). These correspond to ORFs 35, 50, 60, 68 and K15 exon 8.
156
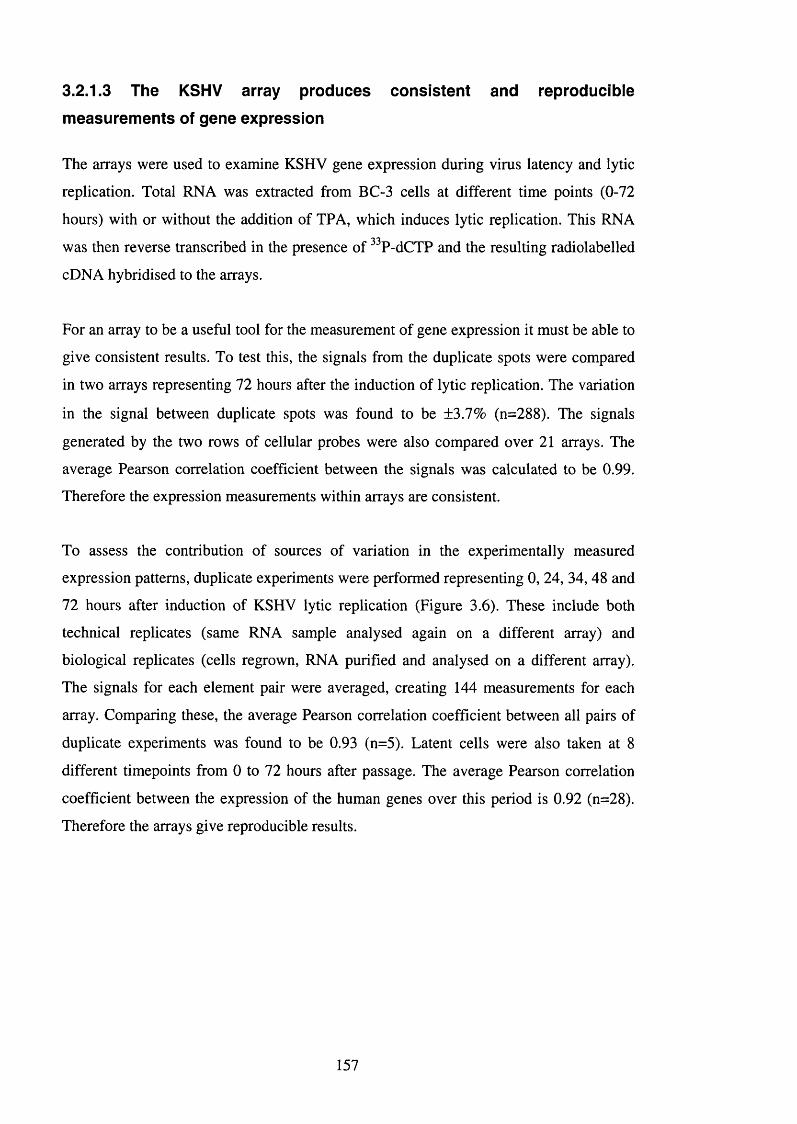
3.2.1.3 The KSHV array produces consisten t and reproducible
m easurem ents of gene expression
The arrays were used to examine KSHV gene expression during virus latency and lytic
replication. Total RNA was extracted from BC-3 cells at different time points (0-72
hours) with or without the addition of TPA, which induces lytic replication. This RNA
was then reverse transcribed in the presence of ^^P-dCTP and the resulting radiolabelled
cDNA hybridised to the arrays.
For an array to be a useful tool for the measurement of gene expression it must be able to
give consistent results. To test this, the signals from the duplicate spots were compared
in two arrays representing 72 hours after the induction of lytic replication. The variation
in the signal between duplicate spots was found to be ±3.7% (n=288). The signals
generated by the two rows of cellular probes were also compared over 21 arrays. The
average Pearson correlation coefficient between the signals was calculated to be 0.99.
Therefore the expression measurements within arrays are consistent.
To assess the contribution of sources of variation in the experimentally measured
expression patterns, duplicate experiments were performed representing 0, 24, 34, 48 and
72 hours after induction of KSHV lytic replication (Figure 3.6). These include both
technical replicates (same RNA sample analysed again on a different array) and
biological replicates (cells regrown, RNA purified and analysed on a different array).
The signals for each element pair were averaged, creating 144 measurements for each
array. Comparing these, the average Pearson correlation coefficient between all pairs of
duplicate experiments was found to be 0.93 (n=5). Latent cells were also taken at 8
different timepoints from 0 to 72 hours after passage. The average Pearson correlation
coefficient between the expression of the human genes over this period is 0.92 (n=28).
Therefore the arrays give reproducible results.
157
1Q6
105
10"
103
102102
T=0r=0.99
103 10" 105sDENS (MDc/mm2)
10®
1 0 ^ I
^ 106
IU 105 1 O
W 1 0 " ’zLU
W 103 ^
T=24+T PAr= 0 .97
103 10" 105 106 107sDENS (MDc/miT|2)
107
106
105
10"
103
T =34+TPAr=0.99
T = 48+T P A
1021 02 1 03 1 0 " 1 05 1 06 1 07
sDENS (MDc/mtT|2)
106 107 106
105 • 10"
103
102
CO
r= 0 .80
106
T=72+TPAr= 0.89
sDENS (MDc/nnm2)
102 103 1 0 " 105 106 107 106sDENS (MDc/mm2)
Figure 3.6. Correlations between duplicate experiments.Each panel shows a scatter plot comparing the results from two arrays hybridised with labelled cDNAs generated from technical replicates (T (time)=0 and T=72+TPA) or biological replicates (T=24+TPA, T=34+TPA and T=48+TPA). Data show the mean sDENS for each pair of duplicate spots. The sample names and Pearson correlation coefficient are shown above each graph. The average correlation is 0.93.
158
3.2.1.4 Data normalisation
Before it can be interpreted, data from multiple array experiments must be normalised to
remove differences in absolute signal intensity caused by labelling and hybridisation
efficiencies (section 1,3.4.2). The housekeeping gene method of array data normalisation
transforms the data from each array so that the average expression of cellular genes with
roles in fundamental cellular processes becomes constant (DeRisi et ai, 1996, Heller et
al, 1997, Chambers et al, 1999). This assumes that the expression levels of these human
genes remain constant over different experimental conditions. However, this assumption
was found to be invalid for this study as the expression of some genes increases relative
to others after TPA induction of lytic replication. In order to circumvent this problem,
hierarchical clustering was used to compare the expression patterns of the cellular genes.
The mRNA levels of GAPDH, a-tubulin and ribosomal protein S9 were deemed to be
constant due to their covariance across the TPA induction dataset (Pearson correlation
coefficients of 0.96 or above; Figure 3.7A). These genes were used to normalise the data
for each array using the following formula:
For n arrays:
X ’a,i = Xa.i + (H K n - H K a)
Where:
Xa,i = expression ratio (see section 2.5.8) for the i*’ element of array a
X ’a.i = normalised X aj
HKa = mean ratio for co-varying housekeeping genes in array a
HKn = mean HKa across all n arrays
This transforms the data such that the mean housekeeping gene expression ratio for each
array (HKa) becomes equal to the mean across all arrays (HK„; Figure 3.7B).
159
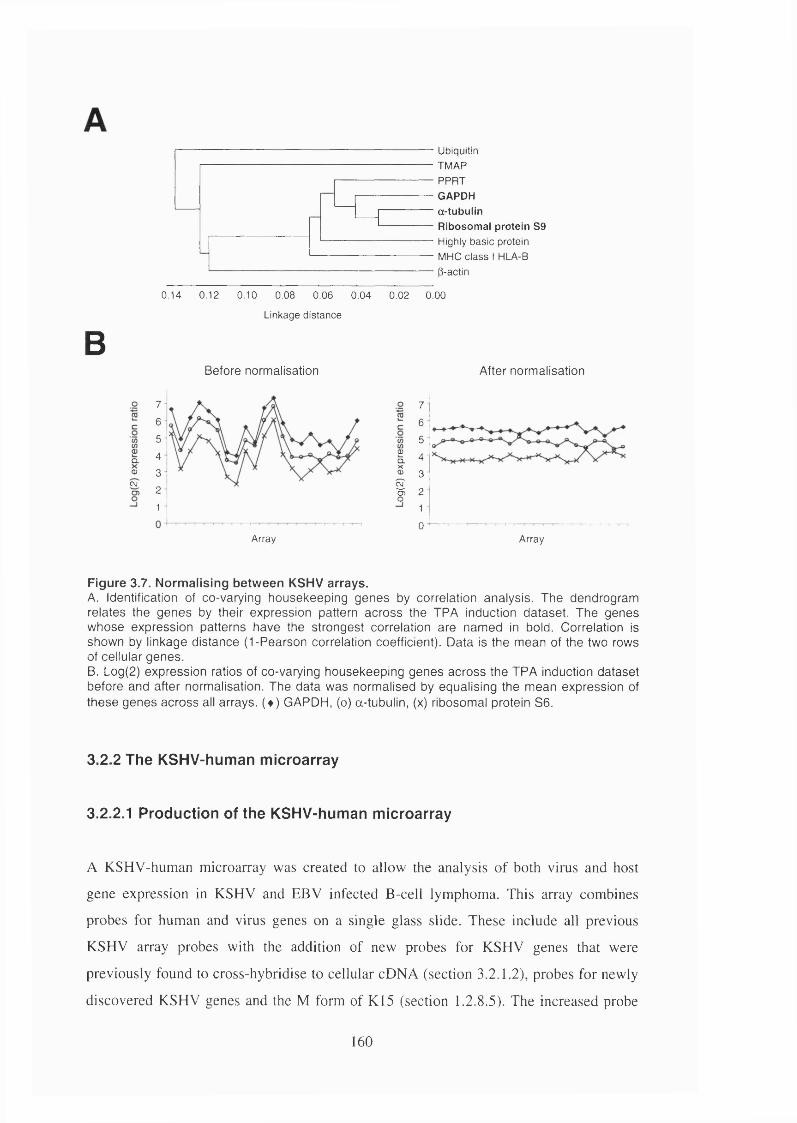
B
C L
mcv
7
65
4
3 '
2 1
UbiquitinTMAPPPRTG APDH
a-tubulin
R ibosom al protein S9Highly basic protein MHC cla ss I HLA-B P-actin
0.14 0.12 0.10 0.08 0.06 0.04 0.02 0.00
Linkage distance
Before normalisation
2Q.5SS’
After normalisation
Array
7
65
4
3
21
0Array
Figure 3.7. Normalising between KSHV arrays.A. Identification of co-varying housekeeping genes by correlation analysis. The dendrogram relates the genes by their expression pattern across the TPA induction dataset. The genes whose expression patterns have the strongest correlation are named in bold. Correlation is shown by linkage distance (1-Pearson correlation coefficient). Data is the mean of the two rows of cellular genes.B. Log(2) expression ratios of co-varying housekeeping genes across the TPA induction dataset before and after normalisation. The data was normalised by equalising the mean expression of these genes across all arrays. (♦) GAPDH, (o) a-tubulin, (x) ribosomal protein S6.
3.2.2 The KSHV-human microarray
3.2.2.1 Production of the KSHV-human microarray
A KSHV-human microarray was created to allow the analysis o f both virus and host
gene expression in KSHV and EBV infected B -cell lymphoma. This array combines
probes for human and virus genes on a single glass slide. These include all previous
KSHV array probes with the addition o f new probes for KSHV genes that were
previously found to cross-hybridise to cellular cD N A (section 3.2.1.2), probes for newly
discovered KSHV genes and the M form of K15 (section 1.2.8.5). The increased probe
160
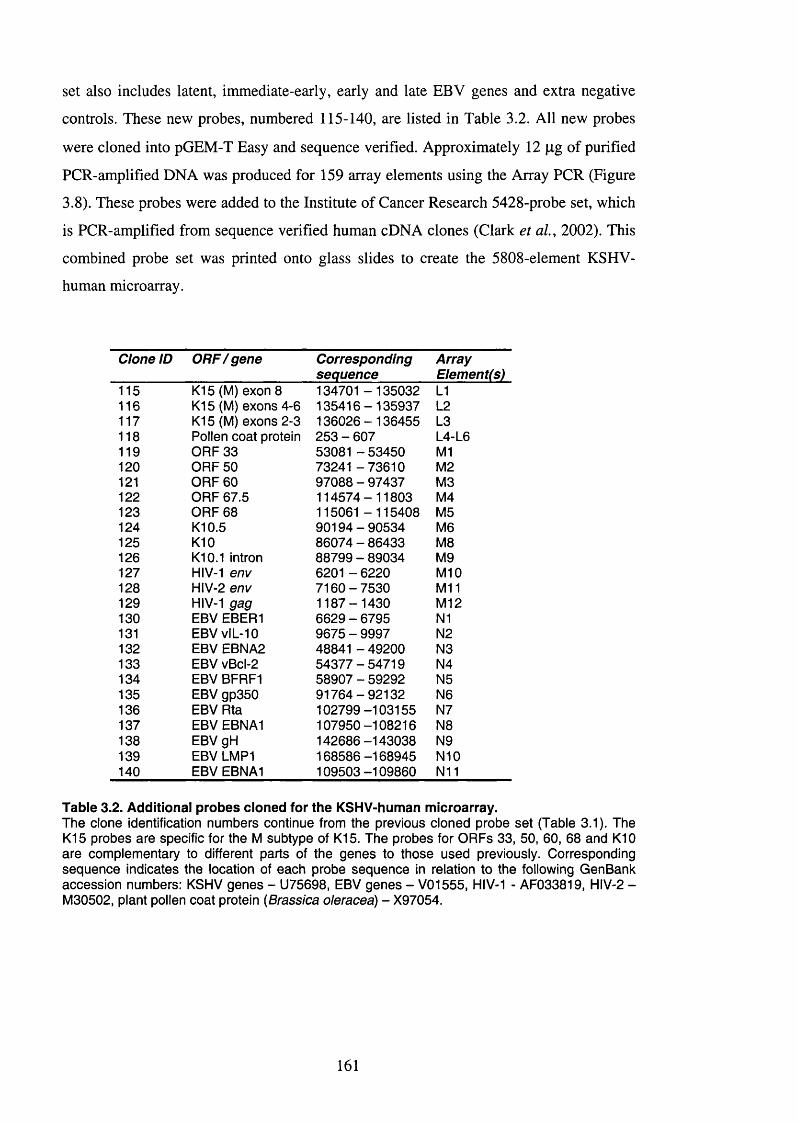
set also includes latent, immediate-early, early and late EBV genes and extra negative
controls. These new probes, numbered 115-140, are listed in Table 3.2. All new probes
were cloned into pGEM-T Easy and sequence verified. Approximately 12 p,g of purified
PCR-amplified DNA was produced for 159 array elements using the Array PCR (Figure
3.8). These probes were added to the Institute of Cancer Research 5428-probe set, which
is PCR-amplified from sequence verified human cDNA clones (Clark et al, 2002). This
combined probe set was printed onto glass slides to create the 5808-element KSHV-
human microarray.
Clone ID O RF/gene Correspondingsequence
ArrayElement(s)
115 K15 (M) exon 8 134701 -135032 LI116 K15 (M) exons 4-6 135416-135937 L2117 K15 (M) exons 2-3 136026-136455 L3118 Pollen coat protein 253 - 607 L4-L6119 ORF33 53081 - 53450 Ml120 ORF50 73241 -73610 M2121 ORF 60 97088 - 97437 M3122 ORF 67.5 114574-11803 M4123 ORF 68 115061 - 115408 M5124 K10.5 90194-90534 M6125 K10 86074 - 86433 M8126 K10.1 intron 88799 - 89034 M9127 HIV-1 env 6201 - 6220 M10128 HIV-2 env 7160-7530 M il129 HIV-1 gag 1187-1430 M12130 EBV EBER1 6629 - 6795 Nl131 EBV vlL-10 9675 - 9997 N2132 EBV EBNA2 48841 - 49200 N3133 EBV vBcl-2 54377-54719 N4134 EBV BFRF1 58907 - 59292 N5135 EBV gp350 91764-92132 N6136 EBV Rta 102799 -103155 N7137 EBV EBNA1 107950 -108216 N8138 EBV gH 142686 -143038 N9139 EBV LMP1 168586 -168945 N10140 EBV EBNA1 109503 -109860 N i l
Table 3.2. Additional probes cloned for the KSHV-human microarray.The clone identification numbers continue from the previous cloned probe set (Table 3.1). The K15 probes are specific for the M subtype of K15. The probes for ORFs 33, 50, 60, 68 and K10 are complementary to different parts of the genes to those used previously. Corresponding sequence indicates the location of each probe sequence in relation to the following GenBank accession numbers: KSHV genes - U75698, EBV genes - V01555, HIV-1 - AF033819, HIV-2 - M30502, plant pollen coat protein {Brassica oleracea) - X97054.
161
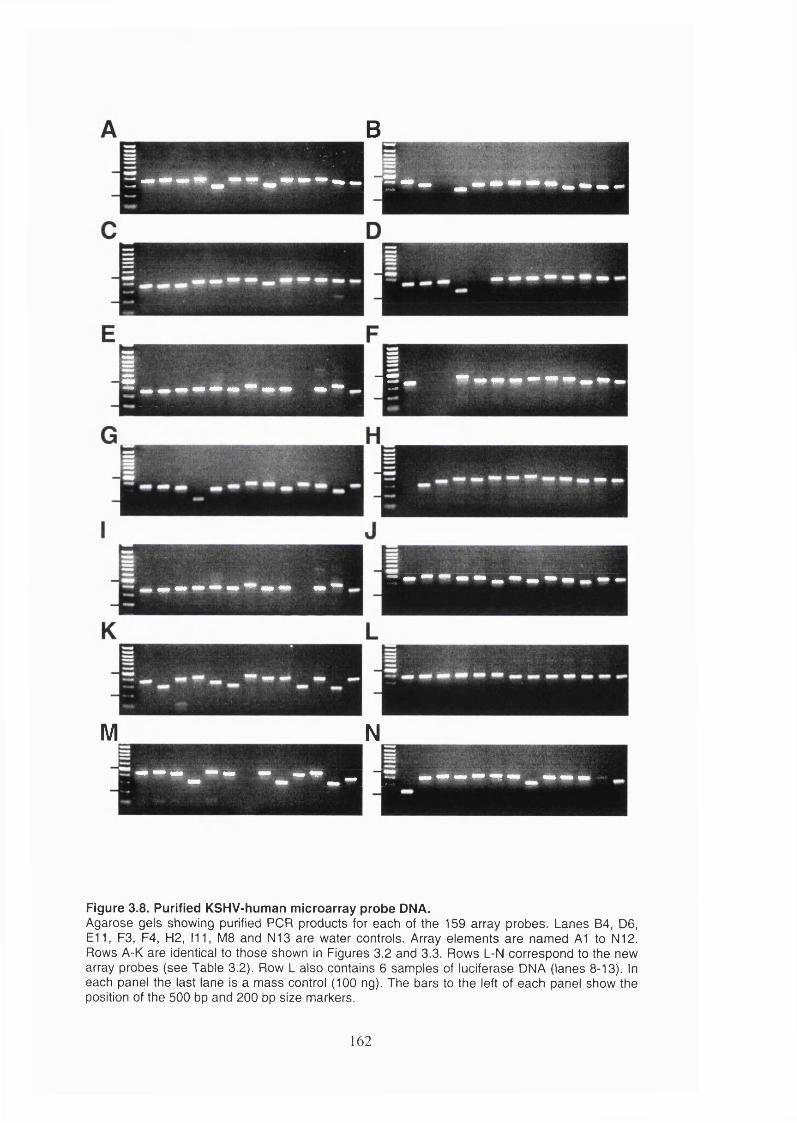
B
M N
Figure 3.8. Purified KSHV-human microarray probe DNA.Agarose gels showing purified PCR products for each of the 159 array probes. Lanes B4, D6, E l l , F3, F4, H2, 111, MB and N13 are water controls. Array elements are named A1 to N12. Rows A-K are identical to those shown in Figures 3.2 and 3.3. Rows L-N correspond to the new array probes (see Table 3.2). Row L also contains 6 samples of luciferase DNA (lanes 8-13). In each panel the last lane is a mass control (100 ng). The bars to the left of each panel show the position of the 500 bp and 200 bp size markers.
162
5.2.2.2 Sensitivity of the KSHV-human m icroarray
The sensitivity and specificity of the microarrays were tested by spiking known amounts
of luciferase or TMV RNA into the labelling reaction. This showed that the relationship
between the actual ratio of RNA in the Cy3 and Cy5-labelled samples and the expression
ratio calculated was accurate. Spiking luciferase RNA into the Cy3 and Cy5 labelling
reactions at a ratio of 1:1 produces a expression ratio of 1.14 (SD 0.085, n=8) and
spiking with a ratio of 1:10 gives an expression ratio of 10.19, SD=0.075, n=8). Each
array contains 6 negative control spots (HIV and Drosophila DNA). From a total of 40
arrays, 240 negative control spots were analysed. All negative control spots were found
to have signals below 1.3x background in both channels. The mean signal to background
ratio is 0.99 in the Cy3 channel (SD=0.07) and 1.02 in the Cy5 channel (SD=0.06). TMV
RNA was spiked into both the Cy3 and Cy5 labelling reactions (section 2.6.3) to test the
sensitivity of the KSHV-human microarray for low-copy number transcripts. 100 pg of
TMV RNA could be detected in a total of 1 p,g of mRNA (1:10,000 by weight) with a
mean Cy3 signal of 1.97x background (SD=0.93) and a mean Cy5 signal of 3.56x
background (SD=2.41, n=80). 1 pg mRNA was found to be equivalent to 5x10^ cells
and 100 pg TMV RNA is 2x10^ copies. Therefore, the KSHV-human microarray can
detect TMV RNA at a concentration equivalent to approximately 6 copies/cell.
Microarrays were scanned at high PMT voltages as this was found to maximise the
signal to background ratio (see section 2.6.5). Under these conditions, the signal
generated from 10 ng luciferase RNA spiked into 1 pg mRNA (1:100) was above the
maximum allowed by the array scanner. Therefore, the upper limit of detection was
below 2000 RNA copies per cell. However, in 40 array experiments only 0.5% of
elements reach this level.
3.2.2.3 Creating a com m on reference sam ple for gene expression profiling
The gene expression patterns of a number of different samples were to be compared
using the KSHV-human microarray (see Chapters 4 and 5). A common reference RNA
approach was taken because previous studies have shown that this method allows multi
comparative analyses of this kind (section 1.3.4.2). It is important that a reference
contains RNA representing the whole sample series to be analysed as this maximises the
number of expression ratios generated for each sample. The samples analysed in this
163
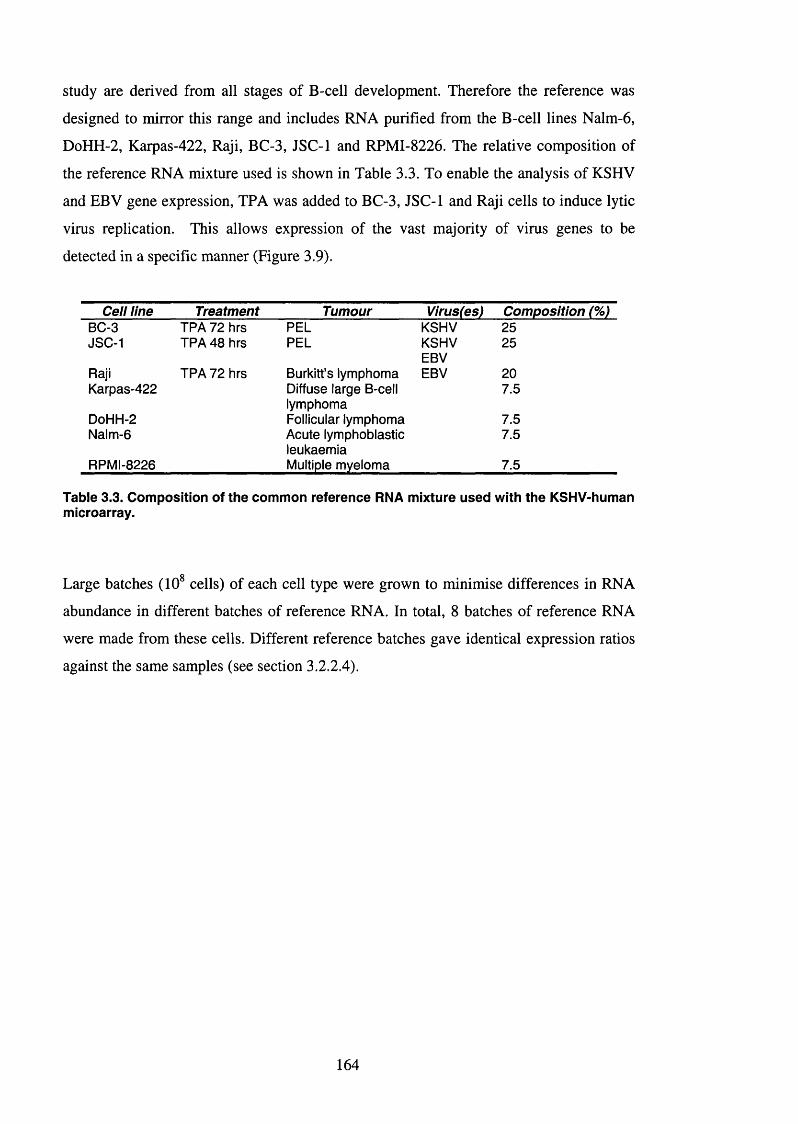
study are derived from all stages of B-cell development. Therefore the reference was
designed to mirror this range and includes RNA purified from the B-cell lines Nalm-6,
DoHH-2, Karpas-422, Raji, BC-3, JSC-1 and RPMI-8226. The relative composition of
the reference RNA mixture used is shown in Table 3.3. To enable the analysis of KSHV
and EBV gene expression, TPA was added to BC-3, JSC-1 and Raji cells to induce lytic
virus replication. This allows expression of the vast majority of virus genes to be
detected in a specific manner (Figure 3.9).
Cell line Treatment Tumour Virus(es) Composition (%)BC-3 TPA 72 hrs PEL KSHV 25JSC-1 TPA 48 hrs PEL KSHV
EBV25
Raji TPA 72 hrs Burkitt’s lymphoma EBV 20Karpas-422 Diffuse large B-cell
lymphoma7.5
DoHH-2 Follicular lymphoma 7.5Nalm-6 Acute lymphoblastic
leukaemia7.5
RPMI-8226 Multiple myeloma 7.5
Table 3.3. Composition of the common reference RNA mixture used with the KSHV-human microarray.
Large batches (10 cells) of each cell type were grown to minimise differences in RNA
abundance in different batches of reference RNA. In total, 8 batches of reference RNA
were made from these cells. Different reference batches gave identical expression ratios
against the same samples (see section 3.2.2.4).
164
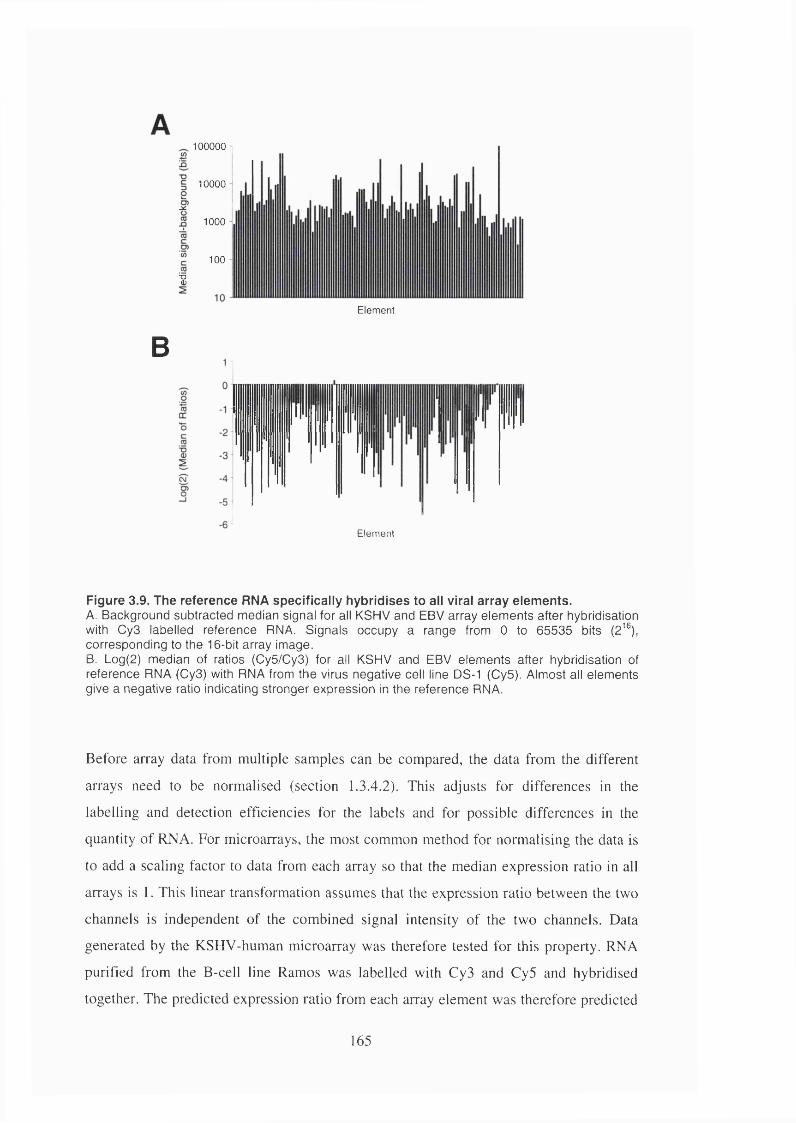
1 0 0 0 0 0
10000
%
B
1000
100
I
Element
Element
Figure 3.9. The reference RNA specifically hybridises to all viral array elements.A. Background subtracted median signal for all KSHV and EBV array elements after hybridisation with CyS labelled reference RNA. Signals occupy a range from 0 to 65535 bits (2 ®), corresponding to the 16-bit array image.B. Log(2) median of ratios (Cy5/CyS) for all KSHV and EBV elements after hybridisation of reference RNA (CyS) with RNA from the virus negative cell line DS-1 (Cy5). Almost all elements give a negative ratio indicating stronger expression in the reference RNA.
Before array data from multiple samples can be compared, the data from the different
arrays need to be normalised (section 1.3.4.2). This adjusts for differences in the
labelling and detection efficiencies for the labels and for possible differences in the
quantity of RNA. For microarrays, the most common method for normalising the data is
to add a scaling factor to data from each array so that the median expression ratio in all
arrays is 1. This linear transformation assumes that the expression ratio between the two
channels is independent of the combined signal intensity of the two channels. Data
generated by the KSHV-human microarray was therefore tested for this property. RNA
purified from the B-cell line Ramos was labelled with Cy3 and Cy5 and hybridised
together. The predicted expression ratio from each array element was therefore predicted
165
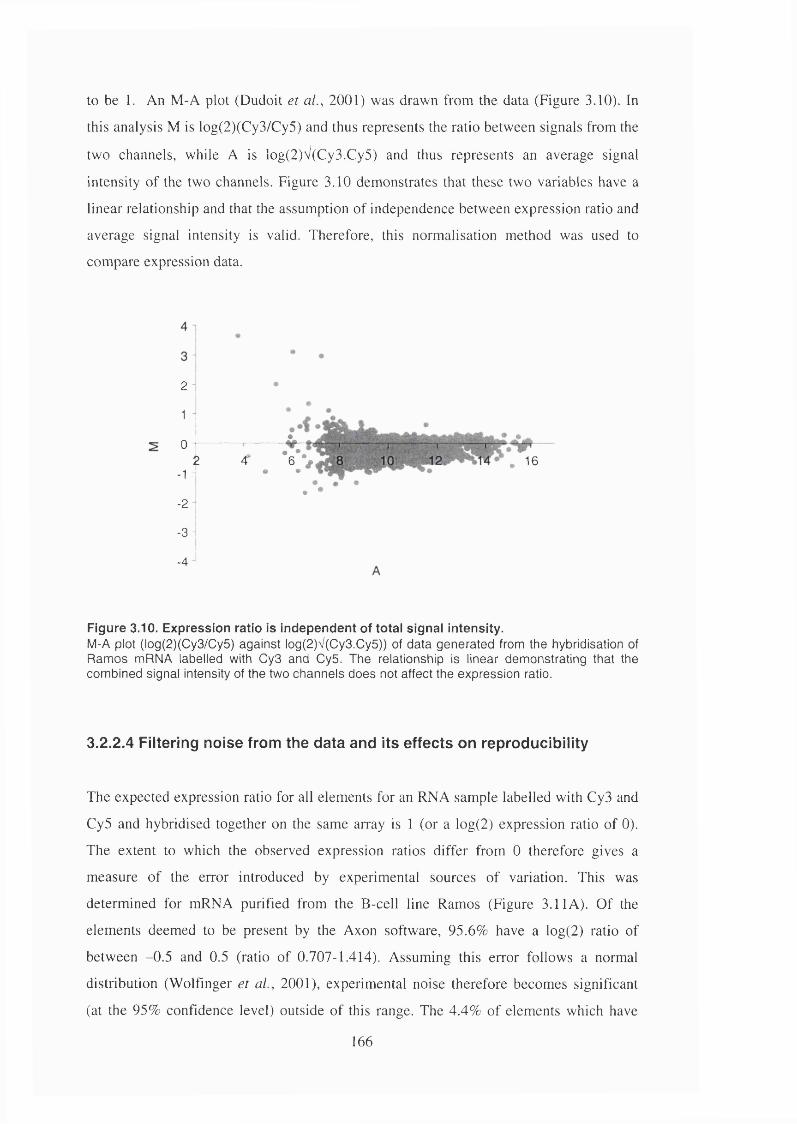
to be 1. An M-A plot (Dudoit et ai, 2001) was drawn from the data (Figure 3.10). In
this analysis M is log(2)(Cy3/Cy5) and thus represents the ratio between signals from the
two channels, while A is log(2)V(Cy3.Cy5) and thus represents an average signal
intensity of the two channels. Figure 3.10 demonstrates that these two variables have a
linear relationship and that the assumption of independence between expression ratio and
average signal intensity is valid. Therefore, this normalisation method was used to
compare expression data.
2 -
1 I
& #1 4* *6’ V
-1 " o •
•-2
-3 :
. 16
-4
Figure 3.10. Expression ratio is independent of totai signal intensity.M-A plot (log(2)(Cy3/Cy5) against log(2)V(Cy3.Cy5)) of data generated from the hybridisation of Ramos mRNA labelled with Cy3 and Cy5. The relationship is linear demonstrating that the combined signal intensity of the two channels does not affect the expression ratio.
3.2.2.4 Filtering noise from the data and its effects on reproducibility
The expected expression ratio for all elements for an RNA sample labelled with Cy3 and
Cy5 and hybridised together on the same array is 1 (or a log(2) expression ratio of 0).
The extent to which the observed expression ratios differ from 0 therefore gives a
measure of the error introduced by experimental sources of variation. This was
determined for mRNA purified from the B-cell line Ramos (Figure 3.11 A). Of the
elements deemed to be present by the Axon software, 95.6% have a log(2) ratio of
between -0.5 and 0.5 (ratio of 0.707-1.414). Assuming this error follows a normal
distribution (Wolfmger et al, 2001), experimental noise therefore becomes significant
(at the 95% confidence level) outside of this range. The 4.4% of elements which have
166
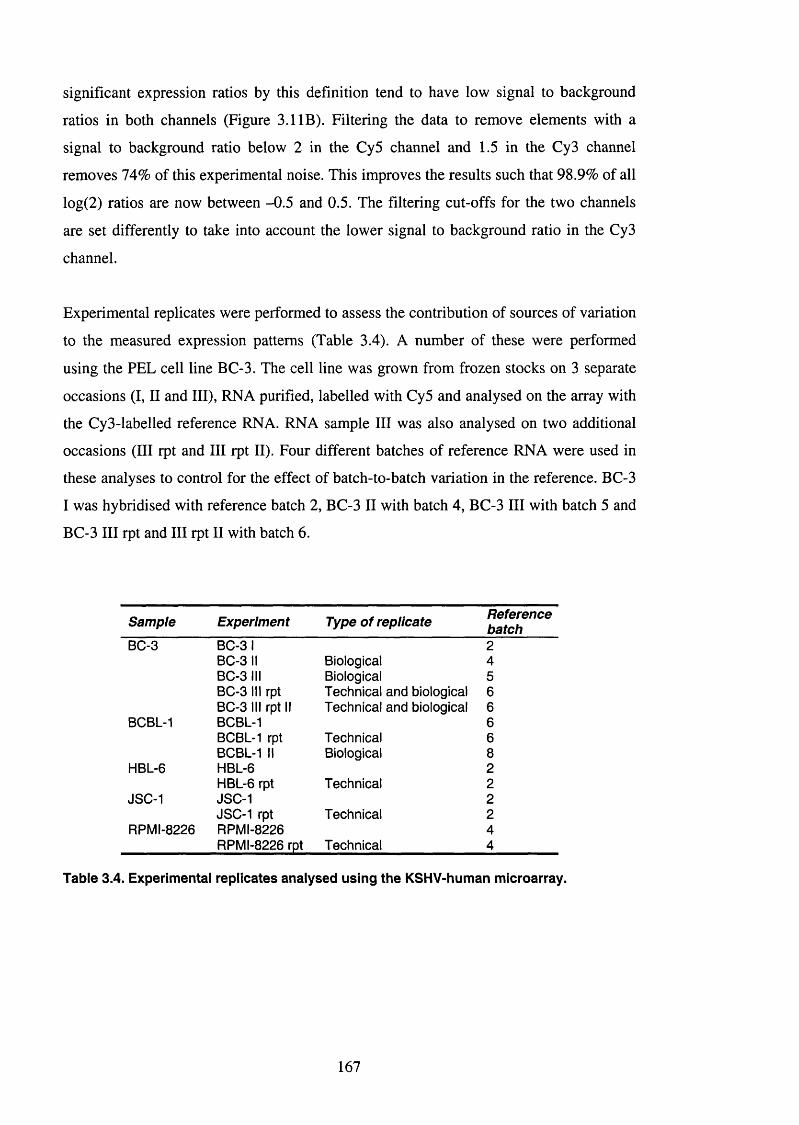
significant expression ratios by this definition tend to have low signal to background
ratios in both channels (Figure 3.1 IB). Filtering the data to remove elements with a
signal to background ratio below 2 in the Cy5 channel and 1.5 in the Cy3 channel
removes 74% of this experimental noise. This improves the results such that 98.9% of all
log(2) ratios are now between -0.5 and 0.5. The filtering cut-offs for the two channels
are set differently to take into account the lower signal to background ratio in the Cy3
channel.
Experimental replicates were performed to assess the contribution of sources of variation
to the measured expression patterns (Table 3.4). A number of these were performed
using the PEL cell line BC-3. The cell line was grown from frozen stocks on 3 separate
occasions (I, II and III), RNA purified, labelled with Cy5 and analysed on the array with
the Cy3-labelled reference RNA. RNA sample III was also analysed on two additional
occasions (III rpt and III rpt II), Four different batches of reference RNA were used in
these analyses to control for the effect of batch-to-batch variation in the reference. BC-3
I was hybridised with reference batch 2, BC-3 II with batch 4, BC-3 III with batch 5 and
BC-3 III rpt and III rpt II with batch 6.
Sample Experiment Type o f replicate Referencebatch
BC-3 BC-3! 2BC-3 II Biological 4BC-3 III Biological 5BC-3 III rpt Technical and biological 6BC-3 III rpt II Technical and biological 6
BCBL-1 BCBL-1 6BCBL-1 rpt Technical 6BCBL-1 II Biological 8
HBL-6 HBL-6 2HBL-6 rpt Technical 2
JSC-1 JSC-1 2JSC-1 rpt Technical 2
RPMI-8226 RPMI-8226 4RPMI-8226 rpt Technical 4
Table 3.4. Experimental replicates analysed using the KSHV-human microarray.
167
The data from the three BC-3 technical replicates were used to assess the relationship
between signal to background ratio and experimental variation, by the method of Ross et
al, (2002). The background subtracted signal intensity for each channel was binned into
10-gene sets with increasing minimum signal intensities and plotted against the mean of
the standard deviation of the triplicates for each set of binned genes. As was found with
the Ramos array data, weak signals tend to contain more experimental noise (Figure
3.11C). The effect is particularly noticeable for the Cy5 channel which shows an increase
in variation (SD>0.3) in elements with a signal to background ratio below 2. The SD for
elements with stronger signals tends towards 0.2, as was also found by Ross et al,
(2002). The filtering criteria used to reduce the experimental noise in the Ramos array
therefore also removes the most variable data between technical replicates.
The effect of the filtering criteria on positive and negative control data (section 3.2.2.2)
was assessed. Filtering removes all data for all negative control elements on all arrays
examined whereas the majority of the low-copy number control data is maintained
(Figure 3.1 ID). Therefore, filtering ensures data that doesn’t represent genuine gene
expression is removed.
168
Figure 3.11. Defining criteria for data fiitering (opposite).A. Histogram of iog(2) expression ratios generated from Ramos mRNA iabeiled with CyS and Cy5 and hybridised to the same array. The expected ratio for each eiement is 0 so the measured expression ratio is equai to the error. The fitted normai distribution is shown in red. The dashed verticai iines border the region containing 95% of the data. These therefore represent the 95% confidence limits and all data beyond these limits is significantly different from a iog(2) ratio of 0 (p<0.05).B. Scatter plot showing signal to background ratios for the CyS and Cy5 channels of the data shown in (A). Data in pink corresponds to those elements that lie beyond the 95% confidence levels shown in (A). These data have low signal to background ratios in both channels. 74% of these elements are removed by filtering for signal to background ratios below 1.5 and 2 in the CyS and Cy5 channels respectively. The grey box indicates data removed by these filtering criteria. Note that Cy5 signals are stronger than their CyS counterparts.C. Standard deviation of triplicate BC-S technical replicates plotted against mean signal to background ratio. The data are ordered by increasing signal to background ratio and both variables are shown as a moving average with a window size of 10. Trend lines (red) are fitted with a power function. The grey boxes indicate the data removed by the fiitering criteria shown in (B). Weak signals in the Cy5 channel show greater variation. The SD of stronger signals tends to 0.2 in both channels.D. Mean, SD and SE (standard error) of the signal to background ratio for the control elements named beneath in each of the two channels (n=40 arrays). The dashed red lines show the fiitering cut-offs for each channel. Data below these lines are removed by the fiitering criteria. The majority of the positive low copy-number control data (spiked TMV RNA at 6 copies/cell) are maintained after filtering whereas all negative control data are removed. Note that Cy5 signals are stronger than their CyS counterparts.
169
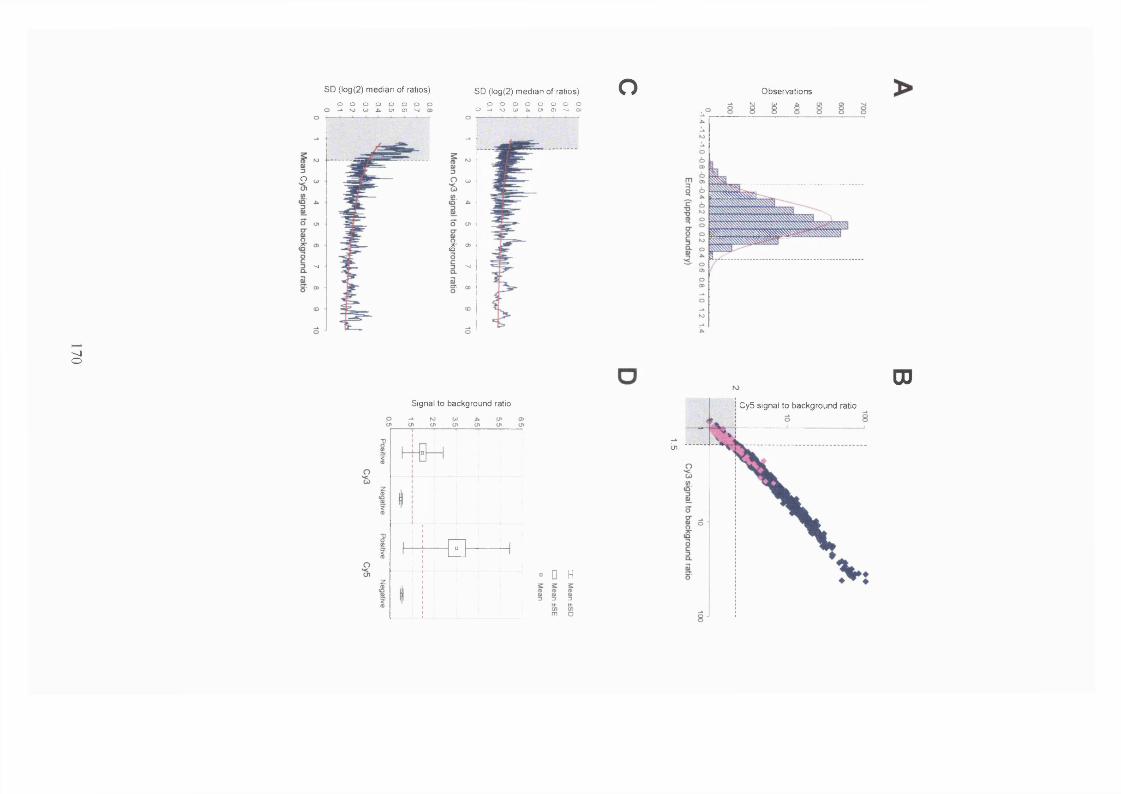
SD (log(2) median of ratios)
o p o o o o o o
o
N) o> oi a>
SD (log(2) median of ratios)o o o o o o o o
o - k N > C i ) i ^ m o > ' v i o o
o
£
Observations
N * 8
issssmssmsi
.a.v
'-joUJ
Signal to background ratio
Q -D H
Cy5 signal to background ratio
cn
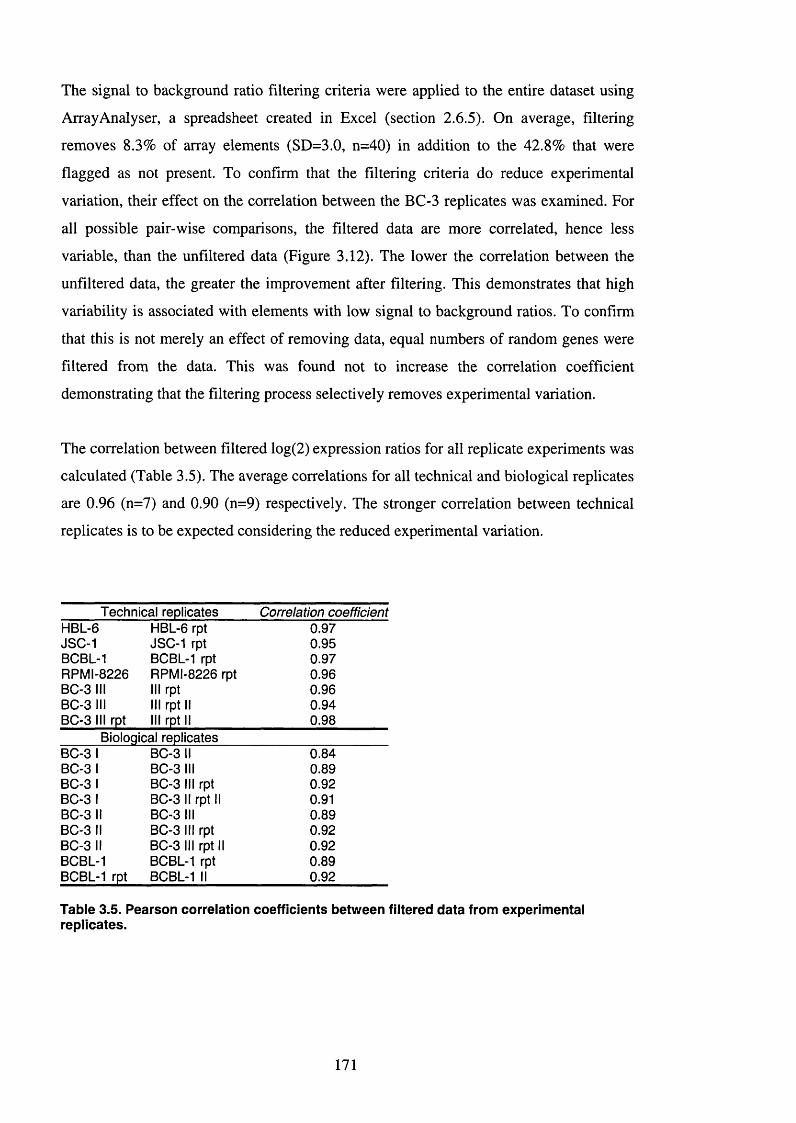
The signal to background ratio filtering criteria were applied to the entire dataset using
ArrayAnalyser, a spreadsheet created in Excel (section 2.6.5). On average, filtering
removes 8.3% of array elements (SD=3.0, n=40) in addition to the 42.8% that were
flagged as not present. To confirm that the filtering criteria do reduce experimental
variation, their effect on the correlation between the BC-3 replicates was examined. For
all possible pair-wise comparisons, the filtered data are more correlated, hence less
variable, than the unfiltered data (Figure 3.12). The lower the correlation between the
unfiltered data, the greater the improvement after filtering. This demonstrates that high
variability is associated with elements with low signal to background ratios. To confirm
that this is not merely an effect of removing data, equal numbers of random genes were
filtered from the data. This was found not to increase the correlation coefficient
demonstrating that the filtering process selectively removes experimental variation.
The correlation between filtered log(2) expression ratios for all replicate experiments was
calculated (Table 3.5). The average correlations for all technical and biological replicates
are 0.96 (n=7) and 0.90 (n=9) respectively. The stronger correlation between technical
replicates is to be expected considering the reduced experimental variation.
Technical replicates Correlation coefficientHBL-6 HBL-6 rpt 0.97JSC-1 JSC-1 rpt 0.95BCBL-1 BCBL-1 rpt 0.97RPMI-8226 RPMI-8226 rpt 0.96BC-3 III III rpt 0.96BC-3 III III rpt II 0.94BC-3 III rpt III rpt II 0.98
Biological replicatesBC-31 BC-3 II 0.84BC-3 1 BC-3 III 0.89BC-3 1 BC-3 III rpt 0.92BC-3 1 BC-3 II rpt II 0.91BC-3 II BC-3 III 0.89BC-3 II BC-3 III rpt 0.92BC-3 II BC-3 III rpt II 0.92BCBL-1 BCBL-1 rpt 0.89BCBL-1 rpt BCBL-1 II 0.92
Table 3.5. Pearson correlation coefficients between filtered data from experimental replicates.
171
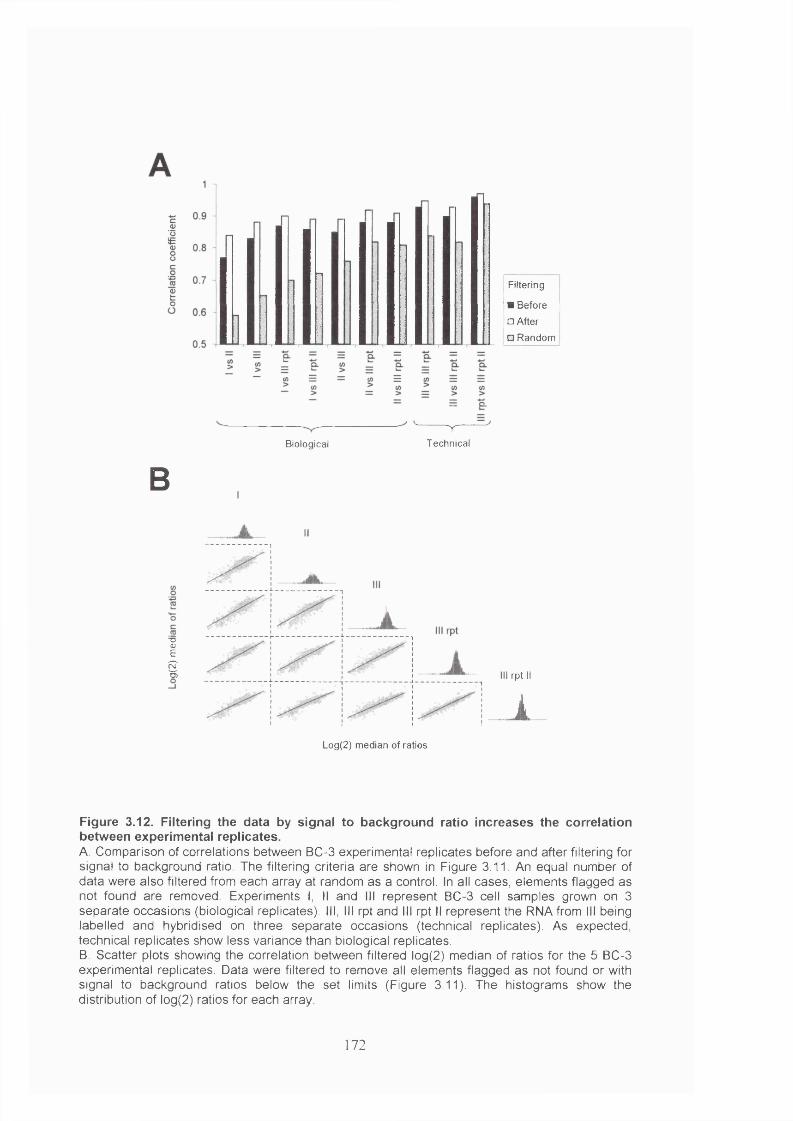
B
Filtering
■ Before
□ After
□ Random
Biological
YTechnical
■SE§
Log(2) median of ratios
III rpt II
1
Figure 3.12. Filtering the data by signal to background ratio increases the correlation between experimental replicates.A. Comparison of correlations between BC-3 experimental replicates before and after filtering for signal to background ratio. The filtering criteria are shown in Figure 3.11. An equal number of data were also filtered from each array at random as a control. In all cases, elements flagged as not found are removed. Experiments I, II and III represent BC-3 cell samples grown on 3 separate occasions (biological replicates). Ill, III rpt and III rpt II represent the RNA from III being labelled and hybridised on three separate occasions (technical replicates). As expected, technical replicates show less variance than biological replicates.B. Scatter plots showing the correlation between filtered log(2) median of ratios for the 5 BC-3 experimental replicates. Data were filtered to remove all elements flagged as not found or with signal to background ratios below the set limits (Figure 3.11). The histograms show the distribution of log(2) ratios for each array.
172
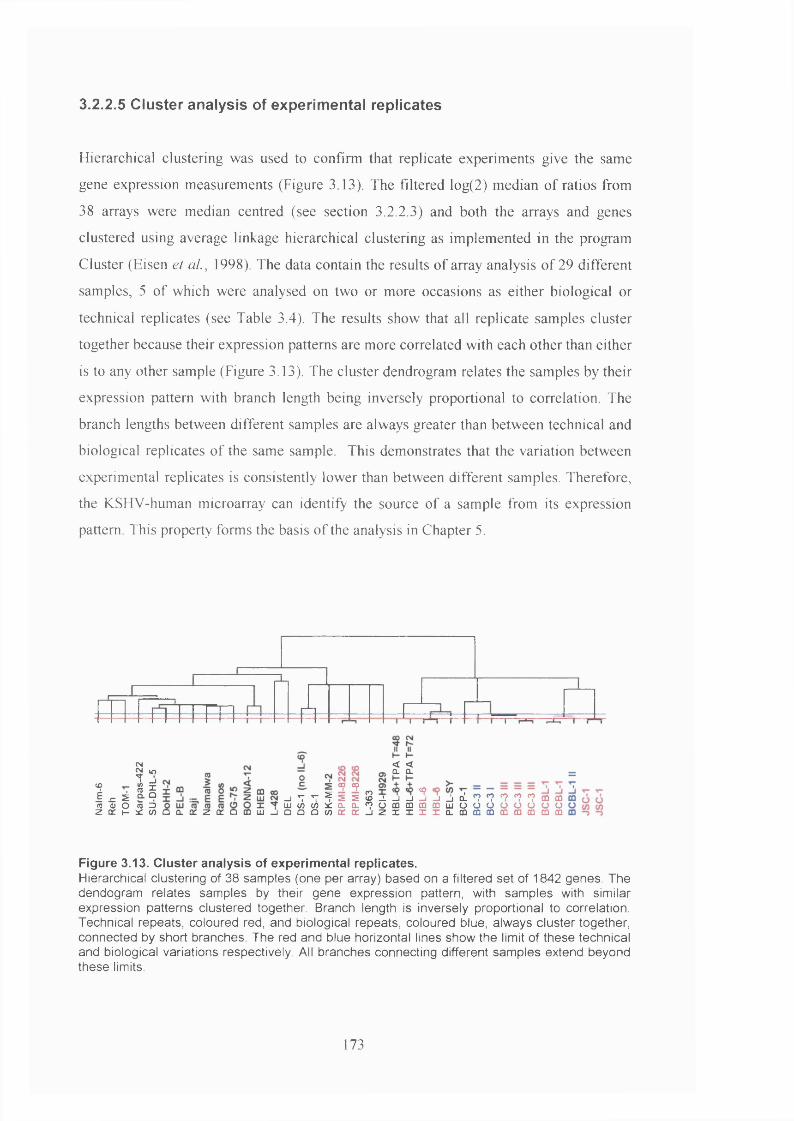
3.2.2.5 Cluster analysis of experimental replicates
Hierarchical clustering was used to confirm that replicate experiments give the same
gene expression measurements (Figure 3.13). The filtered log(2) median of ratios from
38 arrays were median centred (see section 3.2.2.3) and both the arrays and genes
clustered using average linkage hierarchical clustering as implemented in the program
Cluster (Eisen et ai, 1998). The data contain the results of array analysis of 29 different
samples, 5 of which were analysed on two or more occasions as either biological or
technical replicates (see Table 3.4). The results show that all replicate samples cluster
together because their expression patterns are more correlated with each other than either
is to any other sample (Figure 3.13). The cluster dendrogram relates the samples by their
expression pattern with branch length being inversely proportional to correlation. The
branch lengths between different samples are always greater than between technical and
biological replicates of the same sample. This demonstrates that the variation between
experimental replicates is consistently lower than between different samples. Therefore, the KSHV-human microarray can identify the source of a sample from its expression
pattern This property forms the basis of the analysis in Chapter 5.
#
l . g«J 0» O Z K t -
l iu O Q - C n Z C t Q C Q L i J - J
®? *9
h i
_ i ' 7 ' 7 ^ S s S _ L ! j ! j 2 ! j _ j t i . ‘7 ‘? ‘? ‘7 ‘?0QCD U J ( / ) ( / ) i i : a . Q . < ? O O D C Q C D O D U J Ü O O O O ü O O O Q Q ( / ) ( r C C - l Z X X X X Q . m a Q C D m O Q C D C Q C Q
Figure 3.13. Cluster analysis of experimental replicates.Hierarchical clustering of 38 samples (one per array) based on a filtered set of 1842 genes. The dendogram relates samples by their gene expression pattern, with samples with similar expression patterns clustered together. Branch length is inversely proportional to correlation. Technical repeats, coloured red, and biological repeats, coloured blue, always cluster together, connected by short branches. The red and blue horizontal lines show the limit of these technical and biological variations respectively. All branches connecting different samples extend beyond these limits.
173
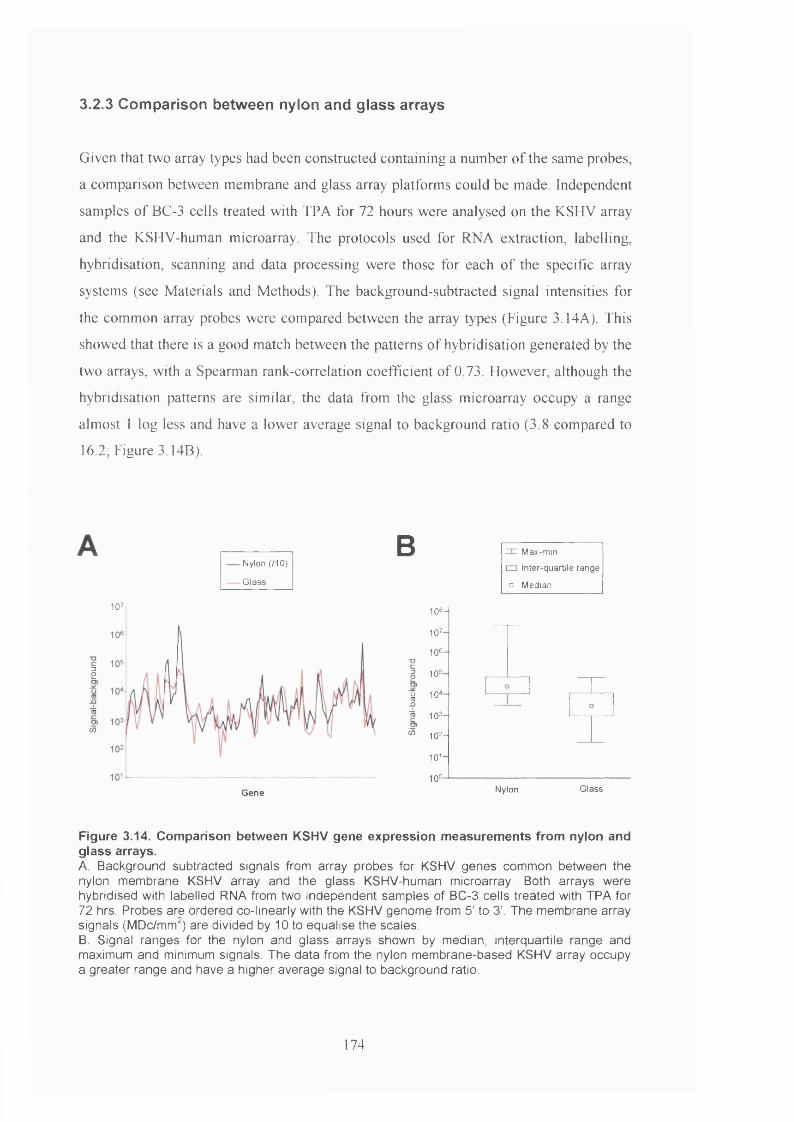
3.2.3 Comparison between nylon and glass arrays
Given that two array types had been constructed containing a number of the same probes,
a comparison between membrane and glass array platforms could be made. Independent
samples of BC-3 cells treated with TPA for 72 hours were analysed on the KSHV array
and the KSHV-human microarray. The protocols used for RNA extraction, labelling,
hybridisation, scanning and data processing were those for each of the specific array
systems (see Materials and Methods). The background-subtracted signal intensities for
the common array probes were compared between the array types (Figure 3.14A). This
showed that there is a good match between the patterns of hybridisation generated by the
two arrays, with a Spearman rank-correlation coefficient of 0.73. However, although the
hybridisation patterns are similar, the data from the glass microarray occupy a range
almost 1 log less and have a lower average signal to background ratio (3.8 compared to 16.2; Figure 3.148).
10 ?
■ Nylon (/10 )
Glass
8fO
B
108-107-106 -
T3
I 106-I 10'- i 103- « 102-
101- 10° -
M ax-m ln
□ Inter-quartile range
□ M edian
G ene Nylon Glass
Figure 3.14. Comparison between KSHV gene expression measurements from nylon and glass arrays.A. Background subtracted signals from array probes for KSHV genes common between the nylon membrane KSHV array and the glass KSHV-human microarray. Both arrays were hybridised with labelled RNA from two independent samples of BC-3 cells treated with TPA for 72 hrs. Probes are ordered co-linearly with the KSHV genome from 5’ to S’. The membrane array signals (MDc/mm^) are divided by 10 to equalise the scales.B Signal ranges for the nylon and glass arrays shown by median, interquartile range and maximum and minimum signals. The data from the nylon membrane-based KSHV array occupy a greater range and have a higher average signal to background ratio.
174
3.3 Discussion
The creation of two DNA arrays for the analysis of KSHV gene expression adds to the
growing number of viruses for which this technology has been applied (Chambers et al,
1999, Bresnahan and Shenk, 2000, Stingley et al, 2000, Tenner et al, 2001, Paulose-
Murphy et al, 2001, Ahn et al, 2002). The two arrays are designed for different tasks.
The KSHV array provides a means for the simultaneous analysis of expression of almost
every virus gene. This will greatly increase the number of genes whose time of
expression is known and provide a window through which one can observe virus
genomic activity. The KSHV-human microarray, containing probes for over 5000 human
genes, is the first array allowing simultaneous global measurements of gene expression
for both host and virus. The results from such studies will reveal host-pathogen
interactions that may underlie disease pathology. The microarray also includes probes for
EBV, allowing virus gene expression measurements from EBV infected cells and,
therefore, from each of the three genomes contained within the majority of PEL cells.
3.3.1 The sensitivity and dynamic range of both KSHV arrays com pare well
with o ther array system s
Both the KSHV array and KSHV-human microarray comprise purified DNA probes
produced from sequence-verified clones. The vast majority of probes are specific by in
silico prediction and by experimental testing against human RNA. In addition, signals
from negative control elements on each array are consistently absent. Such tests are vital
for allowing gene expression measurements from arrays to be trusted (Schena et al,
1995, Lockhart et al, 1996, Schena et al, 1996, Stingley et al, 2000).
Both arrays are able to detect low copy-number transcript controls. The KSHV array can
detect RNA spiked into total RNA at 1:1,000,000, equivalent to around 10 copies/cell.
The KSHV-human microarray can detect RNA spiked into mRNA at 1:10,000,
equivalent to around 6 copies/cell. Expressed as absolute measurements of RNA
abundance, both arrays are of equivalent sensitivity (around 1-3x10^ RNA molecules).
These limits are in the ranges previously reported for microarrays (Schena et al, 1996,
Wilson et al, 1999) and Affymetrix GeneChips (Lockhart et al, 1996). Using spiked
control RNA, Schena et al, (1996) reported a sensitivity of 1:500,000 in total RNA by
weight and Lockhart et al, (1996) reported a sensitivity of 6x10^ RNA molecules. This
175
sensitivity for low copy-number RNA allows the detection of latent KSHV transcripts
(Chapter 4). Analyses of variation between experimental replicates in the context of
signal strength shows weak signals tend to contain more experimental noise. This is in
agreement with previous findings (Cohen et al, 2000, Geiss et al, 2000, Ross et al,
2000). Filtering the data by signal to background ratio removes these experimental
sources of variation thus increasing the reproducibility between gene expression
measurements.
Hybridisation efficiency is a function of the concentration of probe DNA in the spot and
concentration of labelled target cDNA in solution. Experiments with the KSHV array
show that it is the concentration of labelled cDNA in solution that is limiting. A linear
increase in signal over a range of 3 logs is observed for a 4-log increase in labelled
cDNA without saturation. This allows measurements of gene expression independent of
probe concentration (Duggan et al, 1999). Together with the excellent correlation in the
amount of probe spotted between arrays, this allows reproducible measurements of gene
expression using the KSHV array.
Both KSHV arrays show proportional increases in signal as RNA concentration
increases. However, the phosphor imager used to scan the nylon membrane KSHV
arrays can detect RNA concentrations at 1:120 (around 80,000 copies/cell) with signal
intensities two logs below the saturation limit, whereas the Axon array scanner saturates
at concentrations of 1:100 (around 2000 copies/cell). This does not limit the detection of
human RNA transcripts, as only 0.5% of elements saturate, consistent with known RNA
distributions in human cells (Lewin, 1992). The dynamic range of the KSHV array
allows the quantification of the high concentrations of T l.l RNA that occur in cells
undergoing lytic replication (above 10,000 copies/cell; Staskus et al, 1997, Zhong and
Ganem, 1997, section 4.2.2). Comparison of data from each array hybridised with
biological replicates of the same sample shows that detection of (3-radiation on nylon
membrane offers a greater signal to background ratio and a greater data range than
detection of fluorescence on glass. The greater signal to background ratio may be
because of the increased surface area of nylon membrane. The difference between the
dynamic ranges is a reflection of the dynamic range of the PMTs in the two scanner
types. Even with these caveats, the data produced by the two arrays are highly correlated.
This has a number of implications. It suggests firstly that the data produced by both
176
arrays are true representations of actual transcript abundance and secondly, that results
from different array systems are cross-comparable.
3.3.2 Experimental replication dem onstra tes iow variability betw een
expression m easurem ents
The KSHV arrays show reproducible measurements of expression both within arrays and
between arrays. The variation in signal between duplicate spots is ±3.7%. This compares
well with the variation of 3.4% previously measured between duplicate spots printed on
membrane arrays (Chen et al, 1998a). The average correlation between technical
replicates for the KSHV array and the KSHV-human microarray are 0.94 and 0.96
respectively. For biological replicates this drops to 0.92 and 0.90 respectively. These
compare favourably with correlations between previously published technical replicates
(0.87 (DeRisi et al, 1997), 0.96 (Cohen et al, 2000), 0.84-0.86 (Mayne et al, 2001),
0.91 (Ahn et al) and biological replicates (0.83-0.92 (Ross et al, 2000), 0.97 (Scherf et
al, 2000), 0.90 (Zhang et al, 2001b). As also shown by others, low variability between
experimental replicates creates unique expression profiles that can be used to identify
samples (Alizadeh et al, 2000, Pérou et al, 2000, Ross et al, 2000).
The experiments discussed in this chapter provide controls for the biological
interpretation of the array-based expression measurements within the following chapters.
The KSHV array was used to examine KSHV gene expression during latency and after
induction of lytic replication in the PEL cell line BC-3 (Chapter 4). The KSHV-human
microarray was used to examine to cellular expression profile of PEL in comparison to
other B-cell lymphomas and to find correlations between KSHV and host gene
expression (Chapters 4 and 5).
177
3.4 Summary of Chapter 3
1. Two DNA arrays, consisting of purified, sequence validated DNA probes, were
created for the analysis of KSHV and host gene expression.
2. Both arrays are sensitive at the 5-10 RNA copies/cell level and are able to detect
increasing RNA concentrations over a physiological range.
3. Gene expression measurements between experimental replicates are reproducible,
allowing sample identification by cluster analysis.
4. Elements with a low signal to background ratio are responsible for much of the
experimental variation and can be removed by filtering.
5. The two arrays produce comparable results.
178
Chapter 4
KSHV gene expression in PEL
4.1 Introduction
KSHV is predicted to encode at least 85 ORFs, only half of which have an annotated
function (Table 1.6). These include a number of homologues of cellular genes (Moore et
al, 1996a, Russo et al, 1996) that may determine the pathogenicity of KSHV (Neipel et
al, 1997). Like all herpesviruses, KSHV is able to establish a latent infection in cells,
persisting as episomal DNA (section 1.2.4.2). During latency, herpesvirus gene
expression is typically restricted to only a few genes. The full repertoire of gene
expression occurs during lytic replication, when virus progeny are produced and the host
cell is destroyed (Renne et al, 1996b). This procee^ through a te^orally ordered
transcription programme of lytic genes (Wagner et al,f^ Roizman et alj . The timing of a
gene’s expression within this programme gives clues as to its function (section 1.2.4.3).
For example, genes that are expressed early include enzymes required for DNA
replication while those expressed later, after DNA replication has occurred, generally
encode structural proteins of the virion.
A number of studies have described the expression of individual KSHV genes (Table
4.1). KSHV gene expression is most often assessed in cell lines established from PEL,
but virus gene products have also been detected in PEL, KS and MCD biopsies. KSHV is
latent in the majority of PEL cells in culture and can be induced to enter lytic replication
with the mitogens butyric acid or TPA (Renne et al, 1996b, Miller et al, 1997). The
identification of latent genes is critical as these are likely to be responsible for the clonal
expansion observed in PEL, late-stage KS and MCD-associated plasmablastic lymphoma
(section 1.2.5). The strictest definition of a latent gene is the expression of the final gene
product (non-coding RNA or protein) in every member of a particular cell population.
Three KSHV genes are classified as latent by these criteria, LNA-1, kaposin, encoded by
T0.7 RNA, and K15 (see section 1.2.8). v-cyclin and v-FLIP are transcribed together on
two polycistronic mRNAs, LTl and LT2, originating from the LNA-1 promoter, that can
be detected in all infected cells in KS and PEL (Davis et al, 1997, Staskus et al, 1997,
Dittmer et al, 1998, Reed et al, 1998, Ascherl et al, 1999, S arid et al, 1999, Sturzl et
al, 1999b, Talbot et al, 1999). v-cyclin and v-FLIP proteins can be detected in latent
179
PEL cell lines (Platt et al, 2000, Low et al, 2001) and the levels of neither protein nor
transcript is significantly induced upon the induction of lytic replication.
39 lytic genes have been identified in the KSHV genome due to the induction of their
expression during lytic replication in PEL cells (Table 4.1). Of these, 22 have been
categorised as immediate-early, early or late according to their expression in the presence
of cyclohexamide and inhibitors of herpesvirus DNA polymerase (section 1.2.4.3). A
number of lytic genes have been implicated in KSHV pathogenesis due to their detection
in KSHV-associated diseases and their functional properties in vitro and in vivo (section
1.2.9). These include vIL-6, vBcl-2, vIRF-1 and vGPCR. KSHV lytic genes may
function in the paracrine amplification of early disease. The increased expression of
many lytic genes in MCD, notably vIL-6 (Table 4.1), suggests that they may be
responsible for the lymphoproliferation that is characteristic of this disease.
The expression pattern of only around half of KSHV’s complement of 85 predicted
genes is known. Furthermore, the fragmented analysis of gene expression across many
different studies, using different samples and different techniques, prevents an ordered
programme of lytic gene expression from being constructed. Expression of the KSHV
genome has been analysed systematically by one study (Sarid et al, 1998). Transcripts
were categorised into three classes based on their expression in uninduced and lytically
induced PEL cells; class I (constitutive expression), class II (present in uninduced cells
but up-regulated with TPA) and class III (only present after induction). However, only
one timepoint after lytic induction was studied (48 hours) and large probes were used
that were not specific for individual genes or the direction of transcription. Also,
although class I transcripts correspond to latent genes and class III transcripts to lytic
genes, the significance of the 20 identified class II transcripts is uncertain. Therefore, the
expression pattern of many KSHV genes, and how this relates to the ordered series of
events that occurs during lytic replication, remain largely unknown.
The parallel measurement of gene expression with DNA array technology (section
1.3.3), coupled with the pattern-matching capability of cluster analysis (section 1.3.4.3),
offers a means to identify latent genes and reconstruct programmes of herpesvirus gene
expression. The aims of this chapter are to use the KSHV array (section 3.2.1) to analyse
KSHV gene expression both during latency and lytic replication in PEL.
180
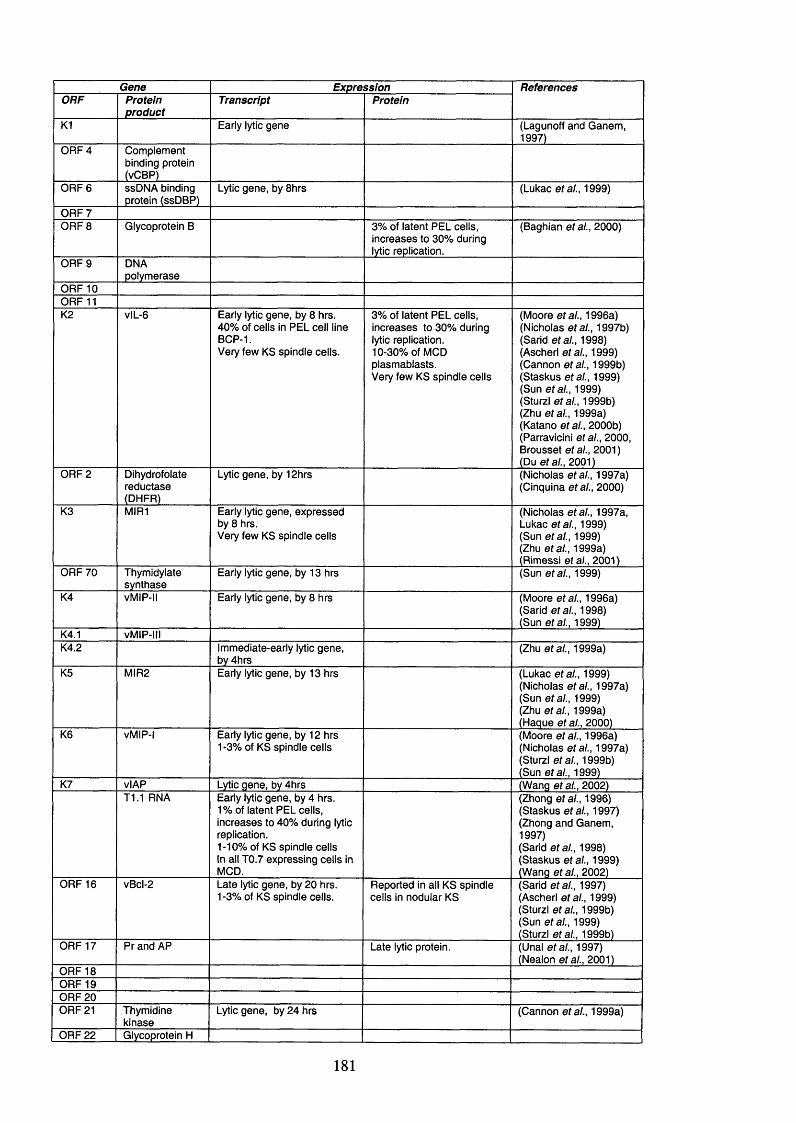
Gene Expression ReferencesORF Protein
productTranscript Protein
K1 Early lytic gene (Lagunoff and Ganem , 1997)
O RF 4 Complement binding protein (vCBP)
O R F 6 ssDNA binding protein (ssDBP)
Lytic gene, by 8hrs (Lukac et ai., 1999)
O R F 7O R F 8 Glycoprotein B 3% of latent PEL cells,
increases to 30% during lytic replication.
(Baghian et al., 2000)
O R F 9 DNApolymerase
O R F 10O R F 11K2 vlL-6 Early lytic gene, by 8 hrs.
40% of cells in PEL cell line BCP-1.Very few KS spindle cells.
3% of latent PEL cells, increases to 30% during lytic replication.10-30% of M CD plasmablasts.Very few KS spindle cells
(Moore et al., 1996a) (Nicholas et al., 1997b) (Sarid et al., 1998) (Ascherl et ai., 1999) (Cannon et al., 1999b) (Staskus et al., 1999) (Sun et al., 1999)(Sturzl et al., 1999b) (Zhu et al., 1999a) (Katano et al., 2000b) (Parravicini et al., 2000, Brousset et al., 2001) (Du et al., 200^)
O R F 2 Dihydrofolatereductase(D HFR )
Lytic gene, by 12hrs (Nicholas et al., 1997a) (Cinquina et al., 2000)
K3 MIR1 Early lytic gene, expressed by 8 hrs.Very few KS spindle cells
(Nicholas et al., 1997a, Lukac et al., 1999)(Sun et al., 1999)(Zhu et al., 1999a) (Rimessi et al., 2001)
O R F 70 Thymidylatesynthase
Early lytic gene, by 13 hrs (Sun et al., 1999)
K4 vM IP-ll Early lytic gene, by 8 hrs (Moore et al., 1996a) (Sarid et al., 1998) (Sun et al., 1999)
K4.1 vM IP-lllK4.2 Immediate-early lytic gene,
by 4hrs(Zhu et al., 1999a)
K5 M IR 2 Early lytic gene, by 13 hrs (Lukac et al., 1999) (Nicholas et al., 1997a) (Sun et al., 1999)(Zhu et al., 1999a) (Hague et al., 2000)
K6 vM IP-l Early lytic gene, by 12 hrs 1-3% of KS spindle cells
(Moore et al., 1996a) (Nicholas et al., 1997a) (Sturzl et al., 1999b) (Sun et al., 1999)
K7 vlAP Lytic gene, by 4hrs (W ang et al., 2002)T1.1 RNA Early lytic gene, by 4 hrs.
1% of latent PEL cells, increases to 40% during lytic replication.1-10% of KS spindle cells In all T0 .7 expressing cells in MCD.
(Zhong et al., 1996) (Staskus et al., 1997) (Zhong and Ganem, 1997)(Sarid et al., 1998) (Staskus et al., 1999) (W ang et al., 2002)
O R F 16 vBcl-2 Late lytic gene, by 20 hrs. 1 -3% of KS spindle cells.
Reported in all KS spindle cells in nodular KS
(Sarid et al., 1997) (Ascherl et al., 1999) (Sturzl et al., 1999b) (Sun et al., 1999) (Sturzl et al., 1999b)
O R F 17 Pr and AP Late lytic protein. (Unal et al., 1997) (Nealon et al., 2001)
O R F 18O R F 19O R F 20O R F 21 Thymidine
kinaseLytic gene, by 24 hrs (Cannon et al., 1999a)
O R F 22 Glycoprotein H
181
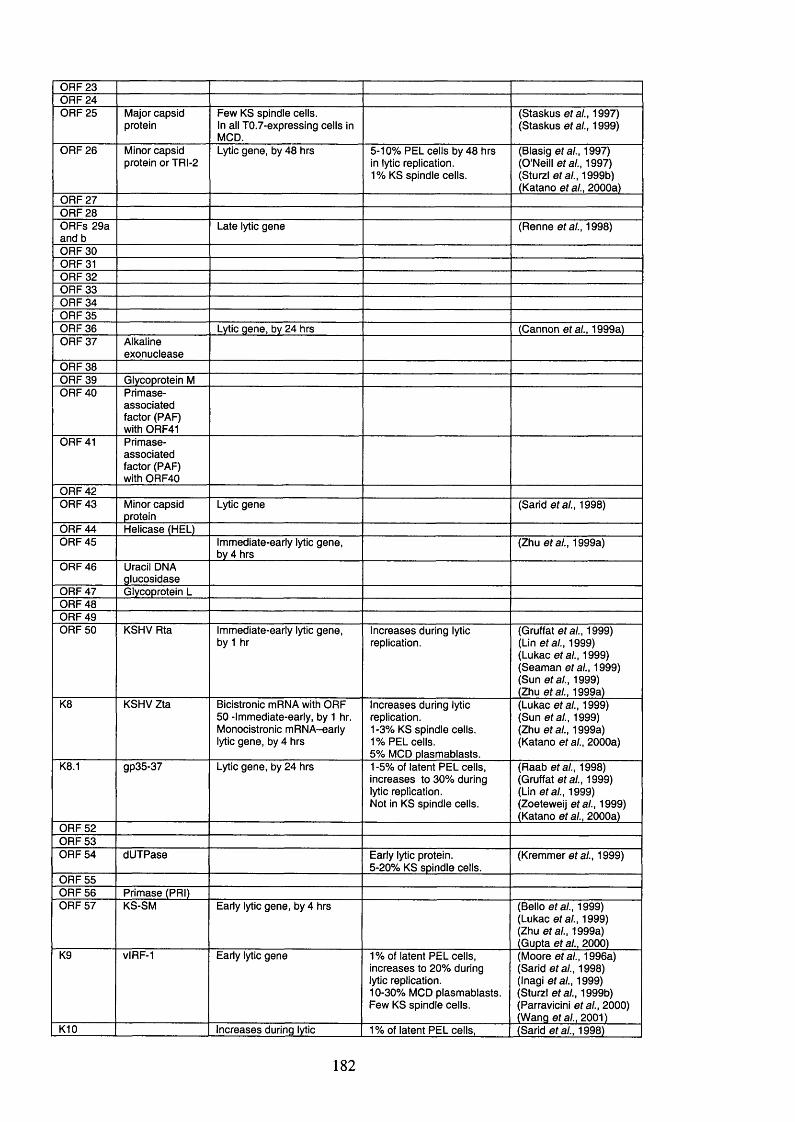
O R F 23O R F 24O R F 25 Major capsid
proteinFew KS spindle cells.In all T0.7-expressing cells in MCD.
(Staskus etal., 1997) (Staskus etal., 1999)
O R F 26 Minor capsid protein or TR I-2
Lytic gene, by 48 hrs 5-10% PEL cells by 48 hrs in lytic replication.1 % KS spindle cells.
(Blasig etal., 1997) (O'Neill etal., 1997) (Sturzl etal., 1999b) (Katano etal., 2000a)
O R F 27O R F 28ORFs 29a and b
Late lytic gene (R enne etal., 1998)
O R F 30O R F 31O R F 32O R F 33O R F 34O R F 35O R F 36 Lytic gene, by 24 hrs (Cannon etal., 1999a)O R F 37 Alkaline
exonucleaseO R F 38O R F 39 Glycoprotein MO R F 40 Primase-
associated factor (RAF) with 0R F 41
O R F 41 Primase- associated factor (RAF) with O R F40
O R F 42O R F 43 Minor capsid
proteinLytic gene (Sarid etal., 1998)
O R F 44 Helicase (HEL)O R F 45 Immediate-early lytic gene,
by 4 hrs(Zhu etal., 1999a)
O R F 46 Uracil DNA glucosidase
O R F 47 Glycoprotein LO R F 48O R F 49O R F 50 K SHV Rta Immediate-early lytic gene,
by 1 hrIncreases during lytic replication.
(Gruffat etal., 1999) (Lin etal., 1999) (Lukac etal., 1999) (Seam an etal., 1999) (Sun etal., 1999) (Zhu etal., 1999a)
K8 K SHV Zta Bicistronic m RNA with O RF 50 -Immediate-early, by 1 hr. Monocistronic m RN A -early lytic gene, by 4 hrs
Increases during lytic replication.1-3% KS spindle cells.1 % PEL cells.5% M CD plasmablasts.
(Lukac etal., 1999) (Sun etal., 1999) (Zhu etal., 1999a) (Katano etal., 2000a)
K8.1 gp35-37 Lytic gene, by 24 hrs 1-5% of latent PEL cells, increases to 30% during lytic replication.Not in KS spindle cells.
(R aab etal., 1998) (Gruffat etal., 1999) (Lin etal., 1999) (Zoeteweij etal., 1999) (Katano et al., 2000a)
O R F 52O R F 53O R F 54 dUTPase Early lytic protein.
5-20% KS spindle cells.(Krem m er etal., 1999)
O R F 55O R F 56 Primase (PRI)O R F 57 KS-SM Early lytic gene, by 4 hrs (Bello etal., 1999)
(Lukac etal., 1999) (Zhu etal., 1999a) (Gupta etal., 2000)
K9 viRF-1 Early lytic gene 1 % of latent PEL cells, increases to 20% during lytic replication.10-30% M CD plasmablasts. Few KS spindle cells.
(M oore etal., 1996a) (Sarid etal., 1998) (Inagi etal., 1999) (Sturzl etal., 1999b) (Parravicini etal., 2000) (W ang etal., 2001)
K10 Increases during iytic 1 % of latent PEL cells. (Sarid etal., 1998)
182
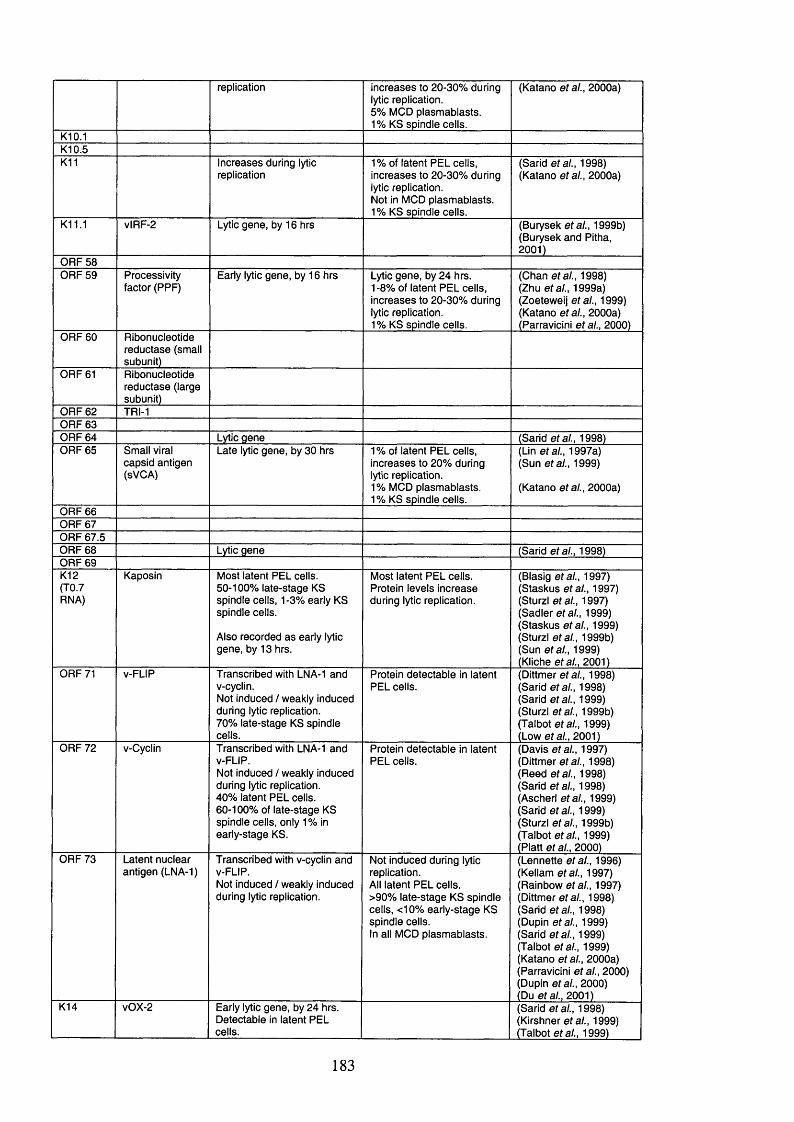
replication increases to 20 -30% during lytic replication.5% M CD plasmablasts.1% KS spindle cells.
(Katano etal., 2000a)
K10.1K10.5K11 Increases during lytic
replication1% of latent PEL cells, increases to 20 -30% during lytic replication.Not in M CD plasmablasts. 1% KS spindle cells.
(Sarid etal., 1998) (Katano etal., 2000a)
K11.1 vlRF-2 Lytic gene, by 16 hrs (Burysek etal., 1999b) (Burysek and Pitha, 2001)
O R F 58O R F 59 Processivity
factor (RPF)Early lytic gene, by 16 hrs Lytic gene, by 24 hrs.
1 -8% of latent PEL cells, increases to 20 -30% during lytic replication.1% KS spindle cells.
(Chan etal., 1998)(Zhu etal., 1999a) (Zoeteweij et al., 1999) (Katano etal., 2000a) (Parravicini et al., 2000)
O R F 60 Ribonucleotide reductase (small subunit)
O R F 61 Ribonucleotide reductase (large subunit)
O R F 62 TRI-1O R F 63O R F 64 Lytic gene (Sarid etal., 1998)O R F 65 Small viral
capsid antigen (SVGA)
Late lytic gene, by 30 hrs 1 % of latent PEL cells, increases to 20% during lytic replication.1% M C D plasmablasts. 1% KS spindle cells.
(Lin etal., 1997a) (Sun etal., 1999)
(Katano et al., 2000a)
O RF 66O R F 67O R F 67.5O R F 68 Lytic gene (Sarid etal., 1998)O RF 69K12(T0.7RNA)
Kaposin Most latent PEL cells. 50-100% late-stage KS spindle cells, 1-3% early KS spindle cells.
Also recorded as early lytic gene, by 13 hrs.
Most latent PEL cells. Protein levels increase during lytic replication.
(Blasig etal., 1997) (Staskus etal., 1997) (Sturzl etal., 1997) (Sadler etal., 1999) (Staskus etal., 1999) (Sturzl etal., 1999b) (Sun etal., 1999) (Kliche etal., 2001)
O RF 71 v-FLIP Transcribed with LNA-1 and v-cyclin.Not induced / weakly induced during lytic replication.70% late-stage KS spindle cells.
Protein detectable in latent PEL cells.
(Dittmer etal., 1998) (Sarid etal., 1998) (Sarid etal., 1999) (Sturzl etal., 1999b) (Talbot etal., 1999) (Low et al., 2001)
O R F 72 v-Cyclin Transcribed with LNA-1 and v-FLIP.Not induced / weakly induced during lytic replication.40% latent PEL cells. 60-100% of late-stage KS spindle cells, only 1% in early-stage KS.
Protein detectable in latent PEL cells.
(Davis etal., 1997) (Dittmer etal., 1998) (Reed etal., 1998) (Sarid etal., 1998) (Ascherl etal., 1999) (Sarid etal., 1999) (Sturzl etal., 1999b) (Talbot etal., 1999) (Platt et al., 2000)
O RF 73 Latent nuclear antigen (LNA-1)
Transcribed with v-cyclin and v-FLIP.Not induced / weakly induced during lytic replication.
Not induced during lytic replication.All latent PEL cells.>90% late-stage KS spindle cells, <10% early-stage KS spindle cells.In all M C D plasmablasts.
(Lennette etal., 1996) (Kellam etal., 1997) (Rainbow etal., 1997) (Dittmer etal., 1998) (Sarid etal., 1998) (Dupin etal., 1999) (Sarid etal., 1999) (Talbot etal., 1999) (Katano etal., 2000a) (Parravicini etal., 2000) (Dupin et al., 2000)(Du etal., 2001)
K14 vO X-2 Early lytic gene, by 24 hrs. Detectable in latent PEL cells.
(Sarid etal., 1998) (Kirshner etal., 1999) (Talbot etal., 1999)
183
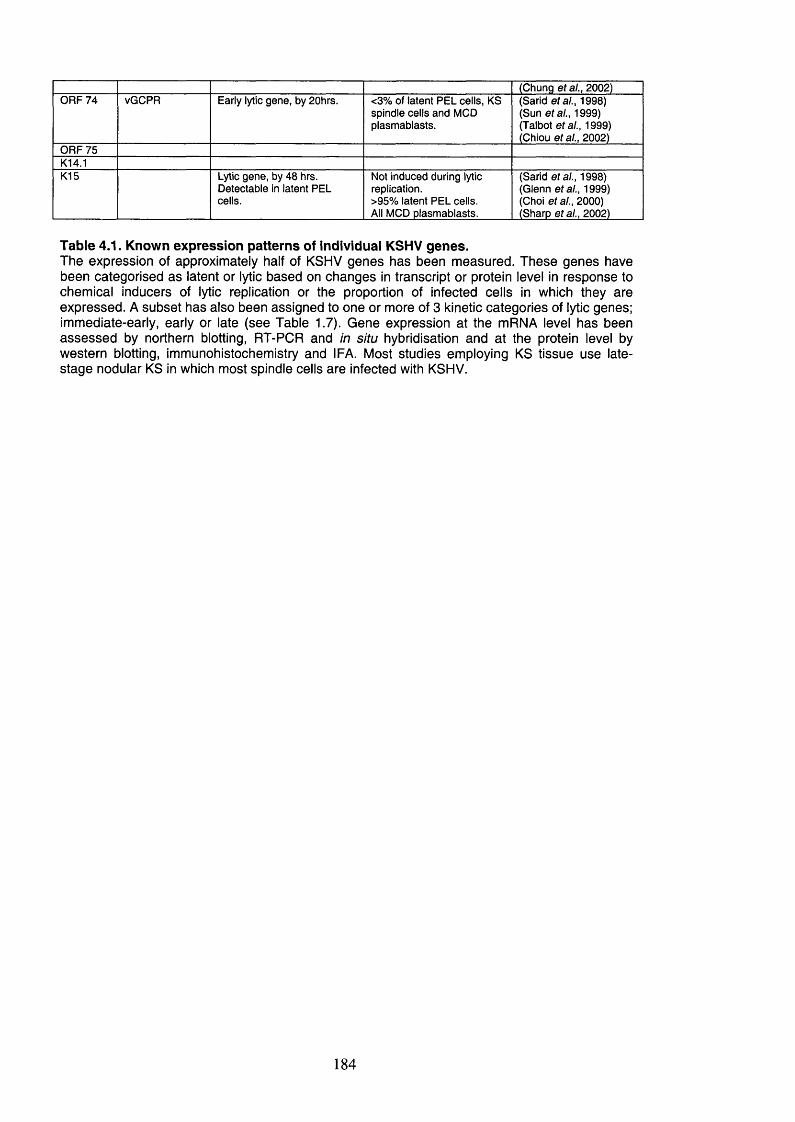
(Chung etal., 2002)O R F 74 vGCPR Early lytic gene, by 20hrs. <3% of latent PEL cells, KS
spindle cells and M CD plasmablasts.
(Sarid etal., 1998) (Sun etal., 1999) (Talbot etal., 1999) (Chiou etal., 2002)
O R F 75K14.1K15 Lytic gene, by 48 hrs.
Detectable in latent PEL cells.
Not induced during lytic replication.>95% latent PEL cells. All M CD plasmablasts.
(Sarid etal., 1998) (Glenn etal., 1999) (Choi et al., 2000) (Sharp etal., 2002)
Table 4.1. Known expression patterns of individual KSHV genes.The expression of approximately half of KSHV genes has been measured. These genes have been categorised as latent or lytic based on changes in transcript or protein level in response to chemical inducers of lytic replication or the proportion of infected cells in which they are expressed. A subset has also been assigned to one or more of 3 kinetic categories of lytic genes; immediate-early, early or late (see Table 1.7). Gene expression at the mRNA level has been assessed by northern blotting, RT-PCR and in situ hybridisation and at the protein level by western blotting, immunohistochemistry and I FA. Most studies employing KS tissue use late- stage nodular KS in which most spindle cells are infected with KSHV.
184
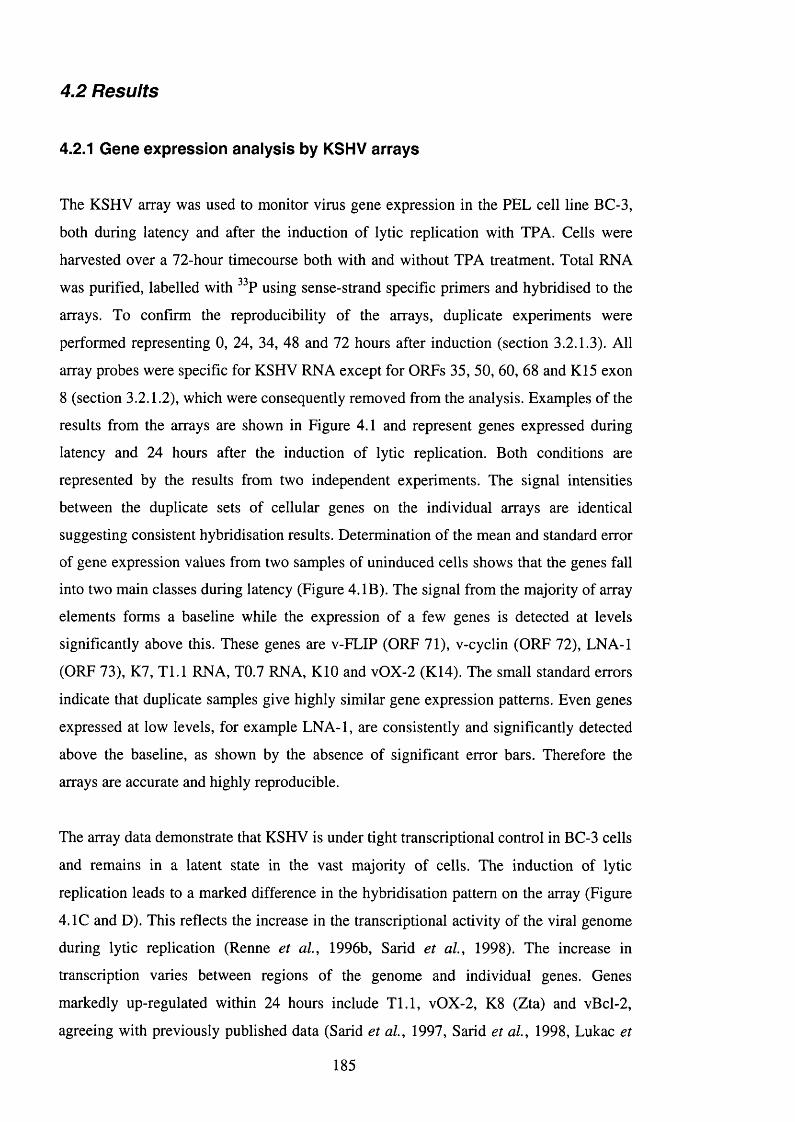
4.2 Results
4.2.1 Gene expression analysis by KSHV arrays
The KSHV array was used to monitor virus gene expression in the PEL cell line BC-3,
both during latency and after the induction of lytic replication with TPA. Cells were
harvested over a 72-hour timecourse both with and without TPA treatment. Total RNA
was purified, labelled with ^ P using sense-strand specific primers and hybridised to the
arrays. To confirm the reproducibility of the arrays, duplicate experiments were
performed representing 0, 24, 34, 48 and 72 hours after induction (section 3.2.1.3). All
array probes were specific for KSHV RNA except for ORFs 35, 50, 60, 68 and K15 exon
8 (section 3.2.1.2), which were consequently removed from the analysis. Examples of the
results from the arrays are shown in Figure 4.1 and represent genes expressed during
latency and 24 hours after the induction of lytic replication. Both conditions are
represented by the results from two independent experiments. The signal intensities
between the duplicate sets of cellular genes on the individual arrays are identical
suggesting consistent hybridisation results. Determination of the mean and standard error
of gene expression values from two samples of uninduced cells shows that the genes fall
into two main classes during latency (Figure 4. IB). The signal from the majority of array
elements forms a baseline while the expression of a few genes is detected at levels
significantly above this. These genes are v-FLIP (ORF 71), v-cyclin (ORF 72), LNA-1
(ORF 73), K7, T l.l RNA, T0.7 RNA, KIO and vOX-2 (K14). The small standard errors
indicate that duplicate samples give highly similar gene expression patterns. Even genes
expressed at low levels, for example LNA-1, are consistently and significantly detected
above the baseline, as shown by the absence of significant error bars. Therefore the
arrays are accurate and highly reproducible.
The array data demonstrate that KSHV is under tight transcriptional control in BC-3 cells
and remains in a latent state in the vast majority of cells. The induction of lytic
replication leads to a marked difference in the hybridisation pattern on the array (Figure
4.1C and D). This reflects the increase in the transcriptional activity of the viral genome
during lytic replication (Renne et al, 1996b, Sarid et al, 1998). The increase in
transcription varies between regions of the genome and individual genes. Genes
markedly up-regulated within 24 hours include T l.l, vOX-2, K8 (Zta) and vBcl-2,
agreeing with previously published data (Sarid et al, 1997, Sarid et al, 1998, Lukac et
185
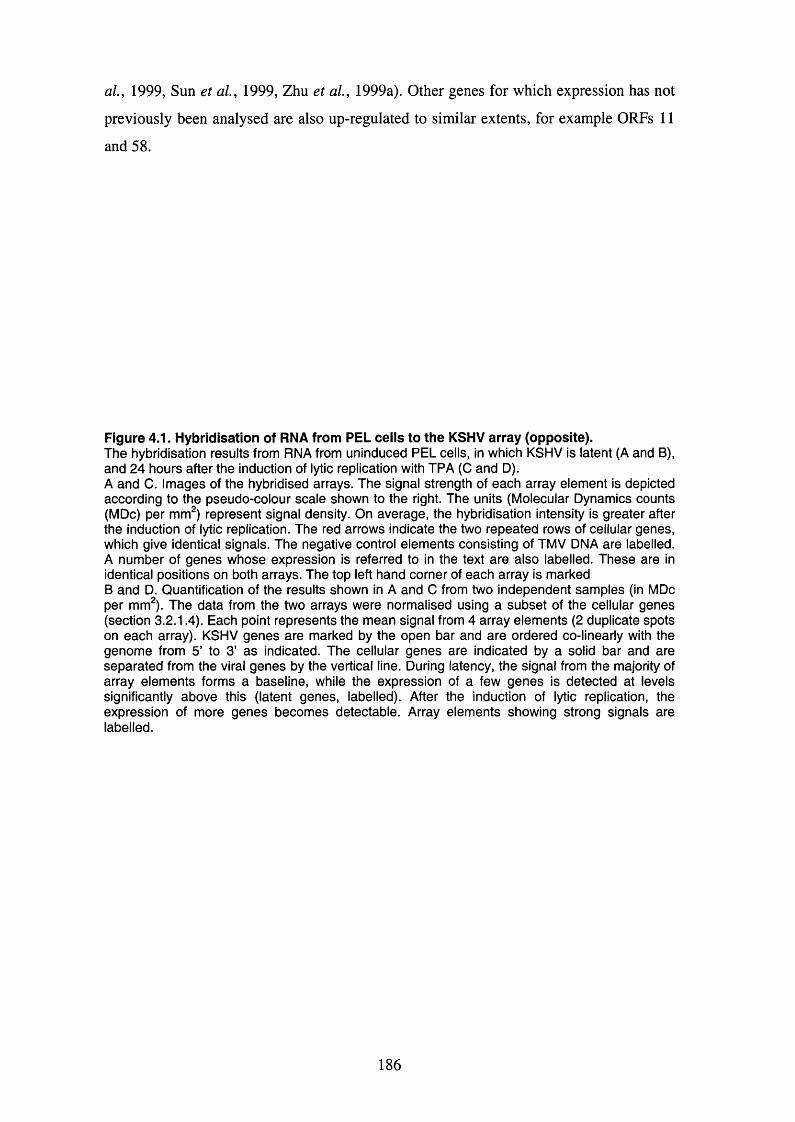
al, 1999, Sun et al, 1999, Zhu et al, 1999a). Other genes for which expression has not
previously been analysed are also up-regulated to similar extents, for example ORFs 11
and 58.
Figure 4.1. Hybridisation of RNA from PEL ceils to the KSHV array (opposite).The hybridisation results from RNA from uninduced PEL cells, in which KSHV is latent (A and B), and 24 hours after the induction of lytic replication with TPA (C and D).A and C. Images of the hybridised arrays. The signal strength of each array element is depicted according to the pseudo-colour scale shown to the right. The units (Molecular Dynamics counts (MDc) per mm^) represent signal density. On average, the hybridisation intensity is greater after the induction of lytic replication. The red arrows indicate the two repeated rows of cellular genes, which give identical signals. The negative control elements consisting of TMV DNA are labelled. A number of genes whose expression is referred to in the text are also labelled. These are in identical positions on both arrays. The top left hand corner of each array is marked B and D. Quantification of the results shown in A and C from two independent samples (in MDc per mm^). The data from the two arrays were normalised using a subset of the cellular genes (section 3.2.1.4). Each point represents the mean signal from 4 array elements (2 duplicate spots on each array). KSHV genes are marked by the open bar and are ordered co-linearly with the genome from 5’ to 3’ as indicated. The cellular genes are indicated by a solid bar and are separated from the viral genes by the vertical line. During latency, the signal from the majority of array elements forms a baseline, while the expression of a few genes is detected at levels significantly above this (latent genes, labelled). After the induction of lytic replication, the expression of more genes becomes detectable. Array elements showing strong signals are labelled.
186
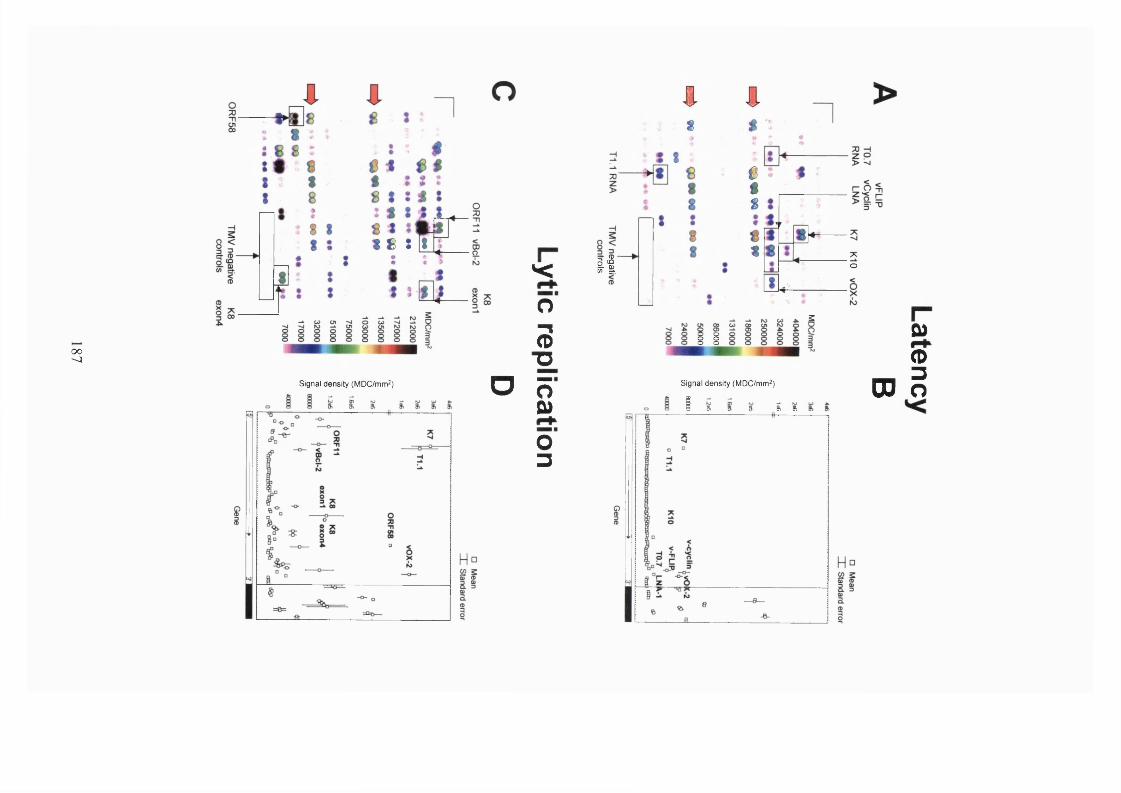
00'-J
tiè z %
Signal density (MDC/mm^)
< o3
"O
O Ô0)
o3
If
t &« $
1 1
Signal density (MDC/mm^)
0 & & 3i 9) 9)
eii
to
20)
<D _ 3DO o
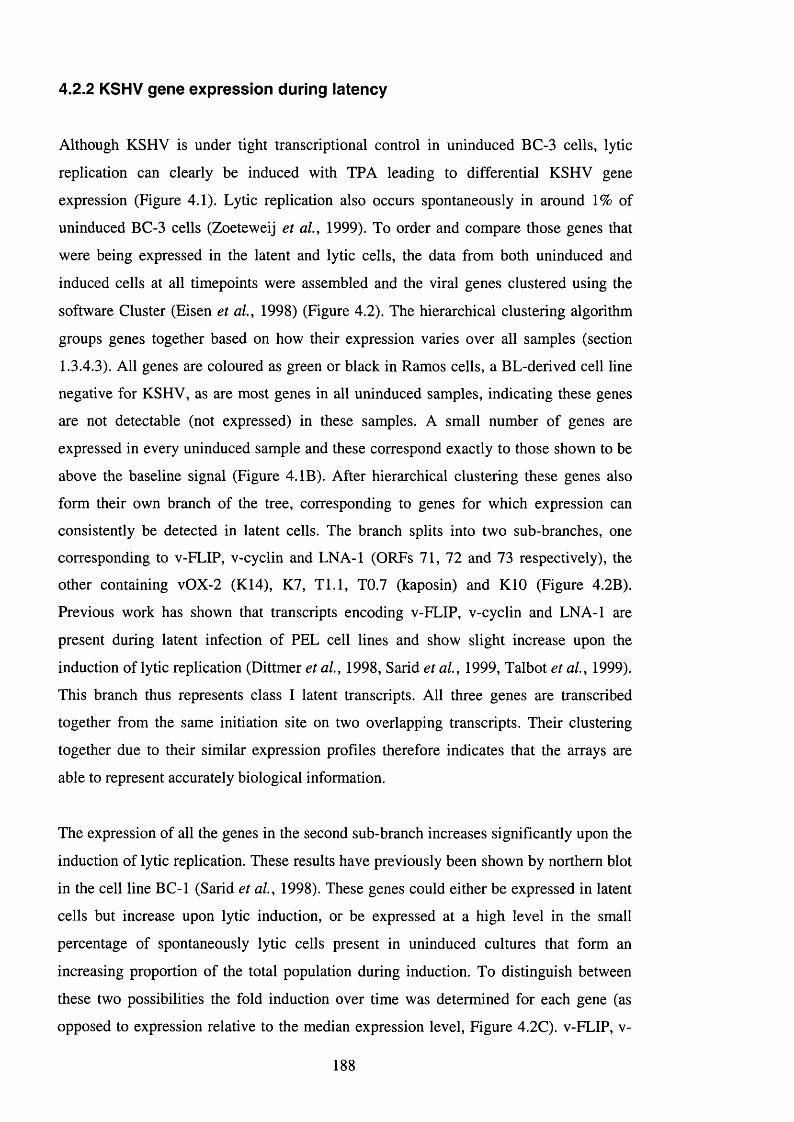
4.2.2 KSHV gene expression during latency
Although KSHV is under tight transcriptional control in uninduced BC-3 cells, lytic
replication can clearly be induced with TPA leading to differential KSHV gene
expression (Figure 4.1). Lytic replication also occurs spontaneously in around 1% of
uninduced BC-3 cells (Zoeteweij et al, 1999). To order and compare those genes that
were being expressed in the latent and lytic cells, the data from both uninduced and
induced cells at all timepoints were assembled and the viral genes clustered using the
software Cluster (Eisen et ai, 1998) (Figure 4.2). The hierarchical clustering algorithm
groups genes together based on how their expression varies over all samples (section
1.3.4.3). All genes are coloured as green or black in Ramos cells, a BL-derived cell line
negative for KSHV, as are most genes in all uninduced samples, indicating these genes
are not detectable (not expressed) in these samples. A small number of genes are
expressed in every uninduced sample and these correspond exactly to those shown to be
above the baseline signal (Figure 4. IB). After hierarchical clustering these genes also
form their own branch of the tree, corresponding to genes for which expression can
consistently be detected in latent cells. The branch splits into two sub-branches, one
corresponding to v-FLIP, v-cyclin and LNA-1 (ORFs 71, 72 and 73 respectively), the
other containing vOX-2 (K14), K7, T l.l, T0.7 (kaposin) and KIO (Figure 4.2B).
Previous work has shown that transcripts encoding v-FLlP, v-cyclin and LNA-1 are
present during latent infection of PEL cell lines and show slight increase upon the
induction of lytic replication (Dittmer et al, 1998, Sarid et al, 1999, Talbot et al, 1999).
This branch thus represents class 1 latent transcripts. All three genes are transcribed
together from the same initiation site on two overlapping transcripts. Their clustering
together due to their similar expression profiles therefore indicates that the arrays are
able to represent accurately biological information.
The expression of all the genes in the second sub-branch increases significantly upon the
induction of lytic replication. These results have previously been shown by northern blot
in the cell line BC-1 (Sarid et al, 1998). These genes could either be expressed in latent
cells but increase upon lytic induction, or be expressed at a high level in the small
percentage of spontaneously lytic cells present in uninduced cultures that form an
increasing proportion of the total population during induction. To distinguish between
these two possibilities the fold induction over time was determined for each gene (as
opposed to expression relative to the median expression level. Figure 4.2C). v-FLIP, v-
188
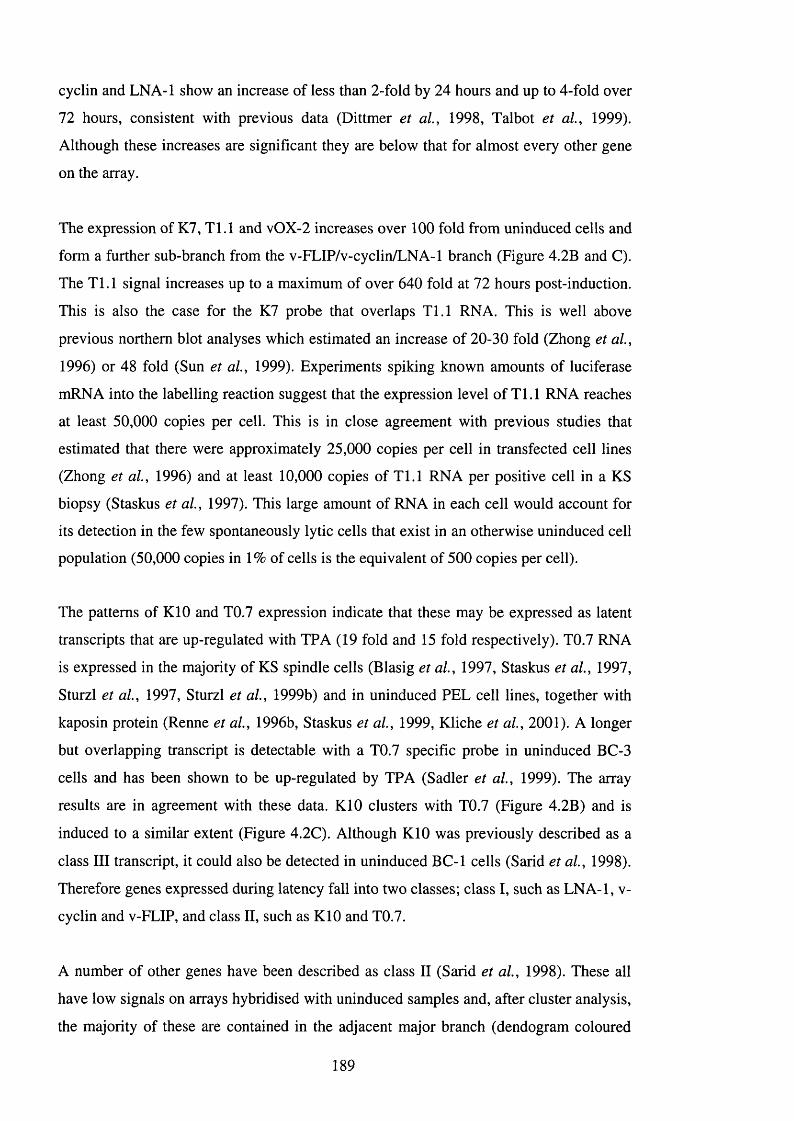
cyclin and LNA-1 show an increase of less than 2-fold by 24 hours and up to 4-fold over
72 hours, consistent with previous data (Dittmer et al, 1998, Talbot et al, 1999).
Although these increases are significant they are below that for almost every other gene
on the array.
The expression of K7, T l.l and vOX-2 increases over 100 fold from uninduced cells and
form a further sub-branch from the v-FLIP/v-cyclin/LNA-1 branch (Figure 4.2B and C).
The T l.l signal increases up to a maximum of over 640 fold at 72 hours post-induction.
This is also the case for the K7 probe that overlaps T l.l RNA. This is well above
previous northern blot analyses which estimated an increase of 20-30 fold (Zhong et al,
1996) or 48 fold (Sun et al, 1999). Experiments spiking known amounts of luciferase
mRNA into the labelling reaction suggest that the expression level of T l.l RNA reaches
at least 50,000 copies per cell. This is in close agreement with previous studies that
estimated that there were approximately 25,000 copies per cell in transfected cell lines
(Zhong et al, 1996) and at least 10,000 copies of T l.l RNA per positive cell in a KS
biopsy (Staskus et al, 1997). This large amount of RNA in each cell would account for
its detection in the few spontaneously lytic cells that exist in an otherwise uninduced cell
population (50,000 copies in 1% of cells is the equivalent of 500 copies per cell).
The patterns of KIO and T0.7 expression indicate that these may be expressed as latent
transcripts that are up-regulated with TPA (19 fold and 15 fold respectively). T0.7 RNA
is expressed in the majority of KS spindle cells (Blasig et al, 1997, Staskus et al, 1997,
Sturzl et al, 1997, Sturzl et al, 1999b) and in uninduced PEL cell lines, together with
kaposin protein (Renne et al, 1996b, Staskus et al, 1999, Kliche et al, 2001). A longer
but overlapping transcript is detectable with a T0.7 specific probe in uninduced BC-3
cells and has been shown to be up-regulated by TPA (Sadler et al, 1999). The array
results are in agreement with these data. KIO clusters with T0.7 (Figure 4.2B) and is
induced to a similar extent (Figure 4.2C). Although KIO was previously described as a
class III transcript, it could also be detected in uninduced BC-1 cells (Sarid et al, 1998).
Therefore genes expressed during latency fall into two classes; class I, such as LNA-1, v-
cyclin and v-FLIP, and class II, such as KIO and T0.7.
A number of other genes have been described as class II (Sarid et al, 1998). These all
have low signals on arrays hybridised with uninduced samples and, after cluster analysis,
the majority of these are contained in the adjacent major branch (dendogram coloured
189

green in Figure 4.2A). Genes in this branch can just be detected at low levels in
uninduced cells and are the first to be expressed at high levels after lytic induction. It is
likely that these genes were originally classified as class II due to their accumulation in
the minority of lytic cells present in uninduced cultures and that KSHV encodes far
fewer class II genes than previously stated. Taken together, these data suggest that care
must be taken in assigning KSHV gene expression classes, as genes that are expressed
abundantly in the lytic cycle, such as T l.l RNA, will be detected in a latent cell culture
where a small fraction of cells enter the lytic cycle spontaneously.
190
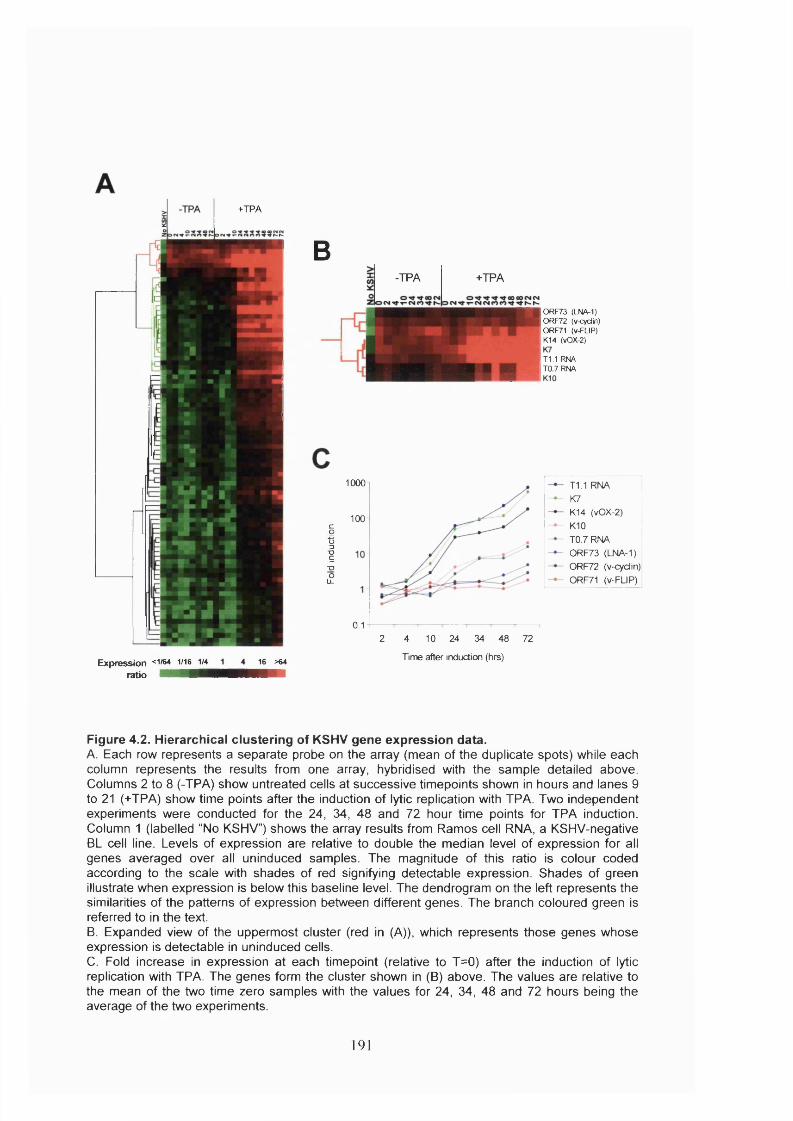
+TPA
B-TPA +TPA
ORF73 (LNA-1)ORF72 (v-cydin)ORF71 (v-FLIP)K14 (vOX-2)
T1.1 RNATO 7 RNA
1000
100§1-ao
Li.
0.12 4 10 24 34 48 72
T l.l RNA K7K14 (vOX-2)KIOT0.7 RNA ORF73 (LNA-1) ORF72 (v-cydin) 0RF71 (v-FLIP)
Expression <1/64 1/16 1/4 ratio tÊ Ê ^ Ê Ê Ê K
16 >64 Time after induction (hrs)
Figure 4.2. Hierarchical clustering of KSHV gene expression data.A. Each row represents a separate probe on the array (mean of the duplicate spots) while each column represents the results from one array, hybridised with the sample detailed above. Columns 2 to 8 (-TPA) show untreated cells at successive timepoints shown in hours and lanes 9 to 21 (+TPA) show time points after the induction of lytic replication with TPA. Two independent experiments were conducted for the 24, 34, 48 and 72 hour time points for TPA induction. Column 1 (labelled “No KSHV”) shows the array results from Ramos cell RNA, a KSHV-negative BL cell line. Levels of expression are relative to double the median level of expression for all genes averaged over all uninduced samples. The magnitude of this ratio is colour coded according to the scale with shades of red signifying detectable expression. Shades of green illustrate when expression is below this baseline level. The dendrogram on the left represents the similarities of the patterns of expression between different genes. The branch coloured green is referred to in the text.B. Expanded view of the uppermost cluster (red in (A)), which represents those genes whose expression is detectable in uninduced cells.C. Fold increase in expression at each timepoint (relative to T=0) after the induction of lytic replication with TPA. The genes form the cluster shown in (B) above. The values are relative to the mean of the two time zero samples with the values for 24, 34, 48 and 72 hours being the average of the two experiments.
191
4.2.3 KSHV gene expression during iytic replication - genes sharing similar
functions are co-ordinately expressed
Most of the KSHV genes are not detectable in latent BC-3 cells. However, their
expression increases over time after the induction of lytic replication (Figure 4.2A).
Different genes reach significant levels of expression at different timepoints and cluster
analysis arranges these into three main groups. To determine whether the timing of gene
expression correlates with proposed gene function, the data from the TPA induction
timecourse were ordered with a 1-D self-organising map and the lytic genes grouped by
hierarchical clustering (Figure 4.3). The order of the genes reflects the relative time when
expression is first detected, becoming progressively later down the gene list. Hierarchical
clustering separates the genes into three main branches in which genes share similar
patterns of expression. These classes were named primary lytic genes, secondary lytic
genes and tertiary lytic genes. The mean expression pattern of genes in each of these
classes was determined, illustrating the time at which each group of genes was detected
at levels greater than double the uninduced median gene expression level (Figure 4.4A).
Although the expression of the tertiary lytic genes was not significantly above the
uninduced median expression level until after 48 hours, their level of expression starts to
increase prior to this. Therefore, the relative times gene expression is detected by any
method is intrinsically linked to the sensitivity of the detection system used. In addition,
to perform extensive cross comparisons, all genes should be measured by the same
method at the same time.
To confirm that these gene groups are stable and not merely artefacts of the clustering
process, the data were also clustered using a self-organising map algorithm as
implemented in the programme GeneCluster (Tamayo et al, 1999). This algorithm finds
the same three patterns in the data and 93% of genes are placed in the same cluster by
each of the two clustering methods (Figure 4.4B). Therefore, these three classes of
KSHV genes are true representations of the data and may correspond to three distinct
regulatory classes.
192
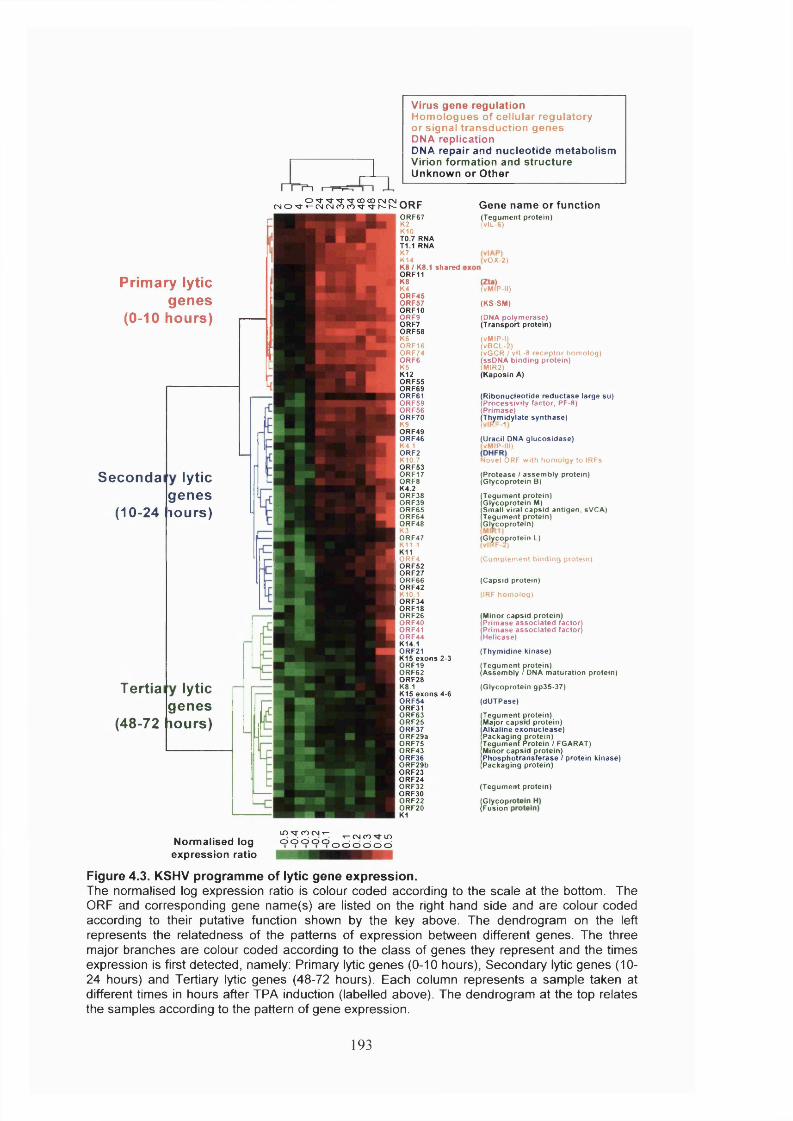
Virus gene regulationHomologues of cellular regulatory or signal transduction genes DNA replicationDNA repair and nucleotide metabolism Virion formation and structure Unknown or Other
0'^T'sr'sr^oooDc\icM/-,DcC M O - ^ - ï - c M C M c o r o T i - T j - i ^ t ^ U K r
Prim ary lytic genes
(0-10 hours)
Seconda lytic genes lo u rs )
Tertia lytic genes lo u rs )(48-72
(10-24
Normaiised iog expression ratio
lO '^C O C SlT -o o d o o
ORF67K2K10T0.7 RNA T l . l RNA K7 K14K8 / K8.1 s h a re d ,0RF11K8K40RF4SORF57ORF10ORF9ORF7ORF58K60R F 16ORF740R F 6K5K12ORF55ORF690RF610R F 59ORF56ORF70K9ORF49ORF46K4.10R F 2K10.7ORF530R F 17ORF8K4.2ORF38ORF39ORF65ORF64ORF48K3ORF47K11.1K11ORF4ORF52ORF27ORF66ORF42K10.1ORF340R F 18ORF26ORF40ORF41ORF44K14.10RF21K15 ex o n s 2-30R F 19ORF62ORF28K8.1K15 ex o n s 4-6ORF54ORF31ORF63ORF25ORF37ORF29aORF75ORF43ORF36ORF29bORF23ORF24ORF32ORF30ORF22ORF20K1
Gene name or function(T eg u m en t pro te in ) îvlL-6)
vOX-2)
}v m /p -II)
(KS-SM)
(DNA p o ly m erase)(T ran sp o rt p ro te in)
(vMIP-l)(vBCL-2)(vGCR / vlL-8 re c e p to r hom olog) (ssDNA bind ing pro te in )!m IR2)(K aposin A)
iR ib o n u cleo tid e r e d u c ta se large su ) P ro cess iv ity fac to r, PF-8)
P rim ase)Thym idylate s y n th a se )
(Uracil DNA g lu c o s id a se ) vMIP-lll)
Novel ORF w ith hom olgy to IRFs
(P ro te a se I a s se m b ly protein) (G lycopro tein B)
T eg u m en t p ro tein)G lycopro te in M)Sm all viral c a p s id an tig en , sVCA) T eg u m en t p ro tein)G lycopro tein )
(G lycopro tein L)
(C o m p lem en t b in d in g p ro tein)
(C apsid p ro tein)
(IRF hom olog)
(M inor c a p s id p ro te in )(P rim ase a s s o c ia te d factor)(P rim ase a s so c ia te d factor)(H elicase)
(T hym idine k inase)
(T eg u m en t p ro te in )(A ssem bly / DNA m atu ratio n p ro te in)
(G lycopro tein gp3S-37)
(dU TPase)
T eg u m en t p ro te in )M ajor c a p s id pro te in )A lkaline e x o n u c ie a se )P ack ag in g pro te in )T eg u m en t P ro te in I FGARAT)M inor c a p s id pro te in ) P h o s p h o tra n s fe ra s e / p ro te in k inase) P ack ag in g p ro te in )
(T eg u m en t pro te in )
(G lycopr (F usion I
T- CN n in ociddcid
Figure 4.3. KSHV programme of lytic gene expression.The normalised log expression ratio is colour coded according to the scale at the bottom. The ORF and corresponding gene name(s) are listed on the right hand side and are colour coded according to their putative function shown by the key above. The dendrogram on the left represents the related ness of the patterns of expression between different genes. The three major branches are colour coded according to the class of genes they represent and the times expression is first detected, namely; Primary lytic genes (0-10 hours), Secondary lytic genes (10- 24 hours) and Tertiary lytic genes (48-72 hours). Each column represents a sample taken at different times in hours after TPA induction (labelled above). The dendrogram at the top relates the samples according to the pattern of gene expression.
193
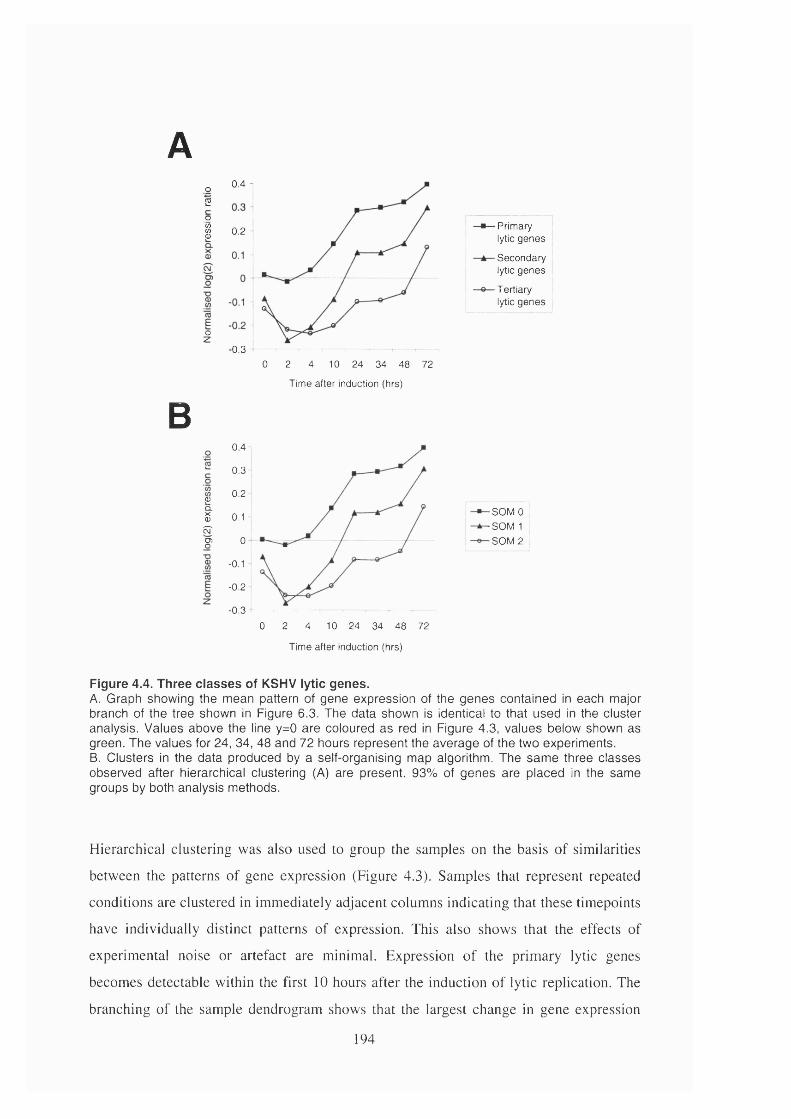
A
B
0.4 1o201 0.2
oz•0.3
2!&LS’
0 2 4 10 24 34 48 72
Time after induction (hrs)
0.4
0.3
0.2
0.1
0
- 0.1
- 0.2
-0.3
0 2 4 10 24 34 48 72
-Primary lytic genes
-Secondary lytic genes
-Tertiary lytic genes
-SOM 0
-SOM 1 ■SOM 2
Time after induction (hrs)
Figure 4.4. Three classes of KSHV lytic genes.A. Graph showing the mean pattern of gene expression of the genes contained in each major branch of the tree shown in Figure 6.3. The data shown is identical to that used in the cluster analysis. Values above the line y=0 are coloured as red in Figure 4.3, values below shown as green. The values for 24, 34, 48 and 72 hours represent the average of the two experiments.B. Clusters in the data produced by a self-organising map algorithm. The same three classes observed after hierarchical clustering (A) are present. 93% of genes are placed in the same groups by both analysis methods.
Hierarchical clustering was also used to group the samples on the basis o f similarities
between the patterns o f gene expression (Figure 4.3). Samples that represent repeated
conditions are clustered in immediately adjacent columns indicating that these timepoints
have individually distinct patterns o f expression. This also shows that the effects o f
experimental noise or artefact are minimal. Expression o f the primary lytic genes
becom es detectable within the first 10 hours after the induction o f lytic replication. The
branching o f the sample dendrogram shows that the largest change in gene expression
194
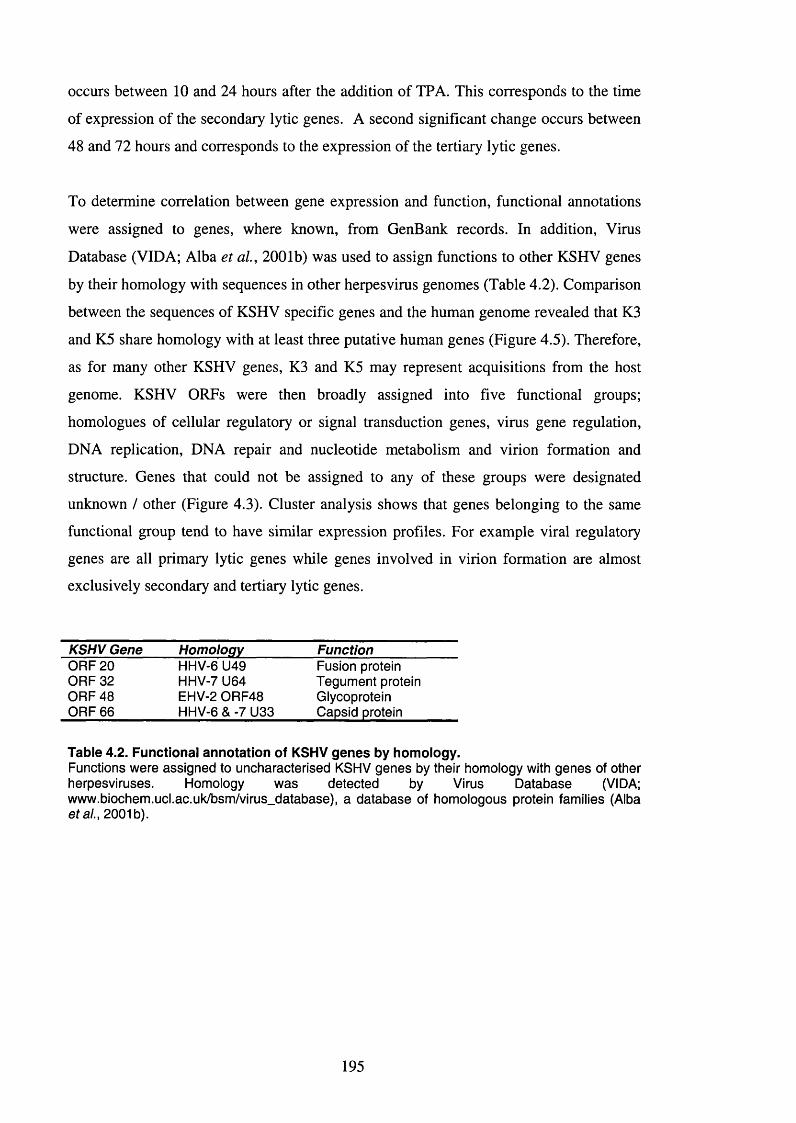
occurs between 10 and 24 hours after the addition of TPA. This corresponds to the time
of expression of the secondary lytic genes. A second significant change occurs between
48 and 72 hours and corresponds to the expression of the tertiary lytic genes.
To determine correlation between gene expression and function, functional annotations
were assigned to genes, where known, from GenBank records. In addition. Virus
Database (VIDA; Alba et al, 2001b) was used to assign functions to other KSHV genes
by their homology with sequences in other herpesvirus genomes (Table 4.2). Comparison
between the sequences of KSHV specific genes and the human genome revealed that K3
and K5 share homology with at least three putative human genes (Figure 4.5). Therefore,
as for many other KSHV genes, K3 and K5 may represent acquisitions from the host
genome. KSHV ORFs were then broadly assigned into five functional groups;
homologues of cellular regulatory or signal transduction genes, virus gene regulation,
DNA replication, DNA repair and nucleotide metabolism and virion formation and
structure. Genes that could not be assigned to any of these groups were designated
unknown / other (Figure 4.3). Cluster analysis shows that genes belonging to the same
functional group tend to have similar expression profiles. For example viral regulatory
genes are all primary lytic genes while genes involved in virion formation are almost
exclusively secondary and tertiary lytic genes.
KSHV Gene Homology FunctionORF 20 HHV-6 U49 Fusion proteinORF 32 HHV-7 U64 Tegument proteinORF 48 EHV-2 ORF48 GlycoproteinORF 66 HHV-6 & -7 U33 Capsid protein
Table 4.2. Functional annotation of KSHV genes by homology.Functions were assigned to uncharacterised KSHV genes by their homology with genes of other herpesviruses. Homology was detected by Virus Database (VIDA; www.biochem.ucl.ac.uk/bsm/virus_database), a database of homologous protein families (Alba etal., 2001b).
195
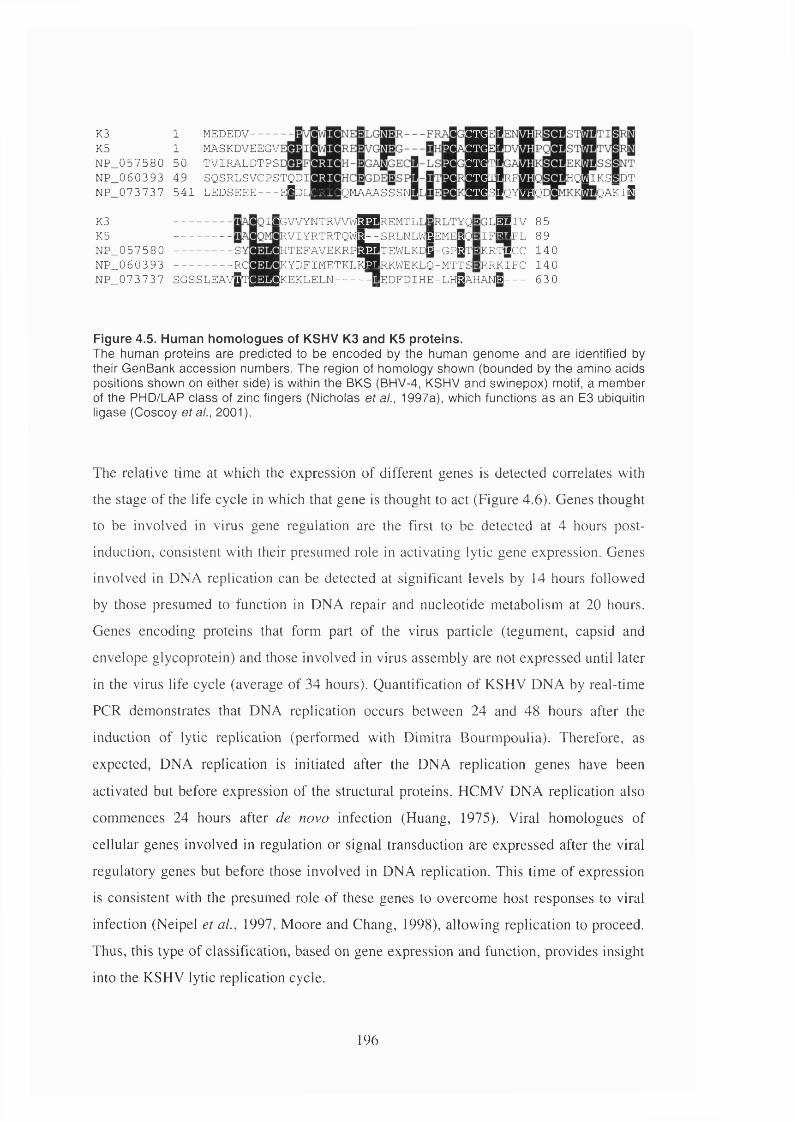
K3 1K5 1NP_057580 50 NP 060393 49
MEDEDV----MASKDVEEGV TVIRALDTPS SQSRLSVCPSTQDI
NP_073737 541 LEDSEEE--- eS d T .BBiBIo MA A A E A EM
CTGgLc t g B ec t g H l'jcTGWLc t g H l
IURF HQIIKSSDTDYÏÏ2Q IqakiS
K3 -------K5 -------NP_057580 --------- SNP_0603 93 --------- RCNP_0737 37 S G S S L E A V 0 T ^ E k EKLELN
liGWYNTRWwSIjjREMTL 'QTOWRVIYRTRTQW g- - SRLNLWfgEME[SQ
|HTEFAVEKRp|^nTEWLKDg-GP@T KYDFIMETKLKfflRKWEKLQ-MTTS
R g TV 85 jlFfflpL 89 jKRTgCC 140 Ir r k i f c 14 0
[EDFDIHE-LHgAHANj^ 63 0
Figure 4.5. Human homologues of KSHV K3 and K5 proteins.The human proteins are predicted to be encoded by the human genome and are identified by their GenBank accession numbers. The region of homology shown (bounded by the amino acids positions shown on either side) is within the BKS (BHV-4, KSHV and swinepox) motif, a member of the PHD/LAP class of zinc fingers (Nicholas et al., 1997a), which functions as an E3 ubiquitin ligase (Coscoy et a!., 2001).
The relative time at which the expression of different genes is detected correlates with
the stage of the life cycle in which that gene is thought to act (Figure 4.6). Genes thought
to be involved in virus gene regulation are the first to be detected at 4 hours post
induction, consistent with their presumed role in activating lytic gene expression. Genes involved in DNA replication can be detected at significant levels by 14 hours followed
by those presumed to function in DNA repair and nucleotide metabolism at 20 hours.
Genes encoding proteins that form part of the virus particle (tegument, capsid and
envelope glycoprotein) and those involved in virus assembly are not expressed until later
in the virus life cycle (average of 34 hours). Quantification of KSHV DNA by real-time
PGR demonstrates that DNA replication occurs between 24 and 48 hours after the
induction of lytic replication (performed with Dimitra Bourmpoulia). Therefore, as
expected, DNA replication is initiated after the DNA replication genes have been
activated but before expression of the structural proteins. HCMV DNA replication also
commences 24 hours after de novo infection (Huang, 1975). Viral homologues of
cellular genes involved in regulation or signal transduction are expressed after the viral
regulatory genes but before those involved in DNA replication. This time of expression
is consistent with the presumed role of these genes to overcome host responses to viral
infection (Neipel et ai, 1997, Moore and Chang, 1998), allowing replication to proceed.
Thus, this type of classification, based on gene expression and function, provides insight into the KSHV lytic replication cycle.
196
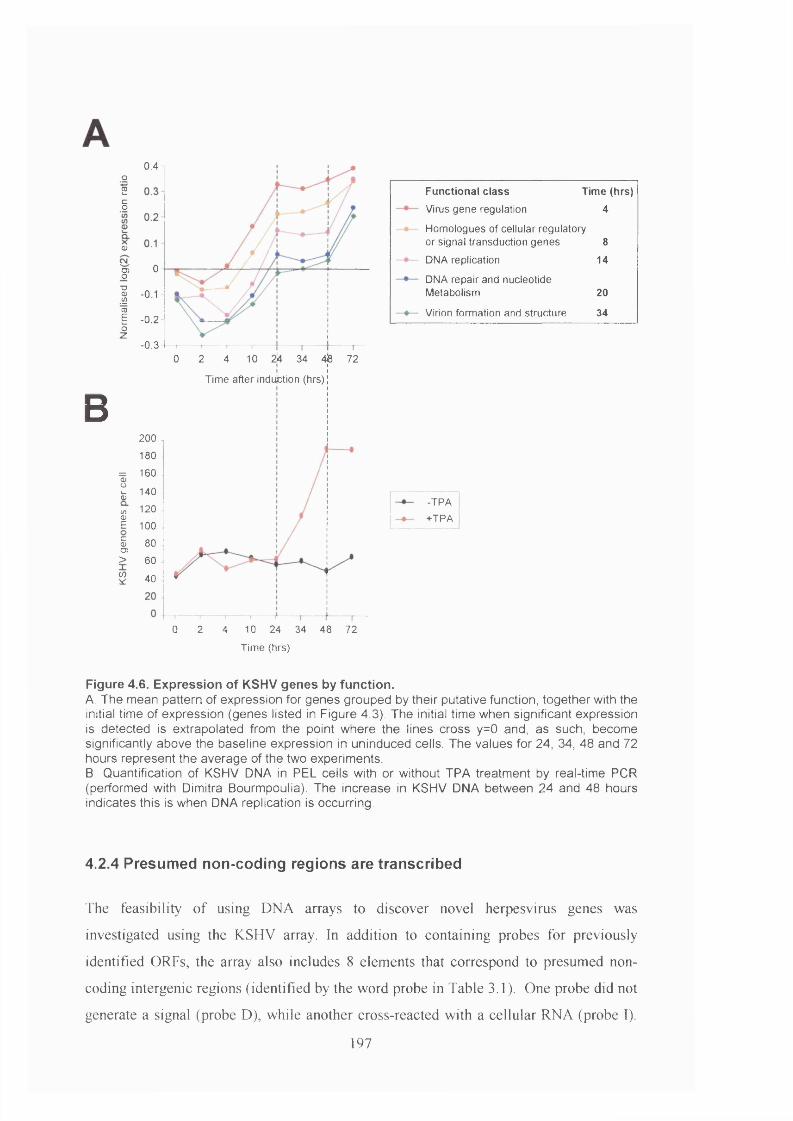
B
0.4 1o2§
2g 0
1 ■ ° ' ' "
ço- 0 . 2 -
—. *
§oZ
-0 .30 2 4 10 2l4 34 4l8 72
T im e a f te r indujction (h rs)
200180
= 160nS3 140
m 120 <üE 100
S 800 5
> 60
^ 40
0 2 4 10 24 34 48 72
F u nction al c lass Tim e (hrs)
V irus g e n e re g u la tio n 4
H o m o lo g u e s o f c e l lu la r re g u la to ryo r s ig n a l tra n s d u c t io n g e n e s 8
D NA re p lic a tio n 14
D NA re p a ir a n d n u c le o tid e M e ta b o lis m 20
V irion fo rm a tio n a n d s t ru c tu re 34
-T P A
+ T P A
T im e (h rs )
Figure 4.6. Expression of KSHV genes by function.A. The mean pattern of expression for genes grouped by their putative function, together with the initial time of expression (genes listed in Figure 4.3). The initial time when significant expression is detected is extrapolated from the point where the lines cross y=0 and, as such, become significantly above the baseline expression in uninduced cells. The values for 24, 34, 48 and 72 hours represent the average of the two experiments.B. Quantification of KSHV DNA in PEL cells with or without TPA treatment by real-time PCR (performed with Dimitra Bourmpoulia). The increase in KSHV DNA between 24 and 48 hours indicates this is when DNA replication is occurring.
4.2.4 Presumed non-coding regions are transcribed
The feasibility of using DNA arrays to discover novel herpesvirus genes was
investigated using the KSHV array. In addition to containing probes for previously
identified ORFs, the array also includes 8 elements that correspond to presumed non-
coding intergenic regions (identified by the word probe in Table 3.1). One probe did not
generate a signal (probe D), while another cross-reacted with a cellular RNA (probe I).
197
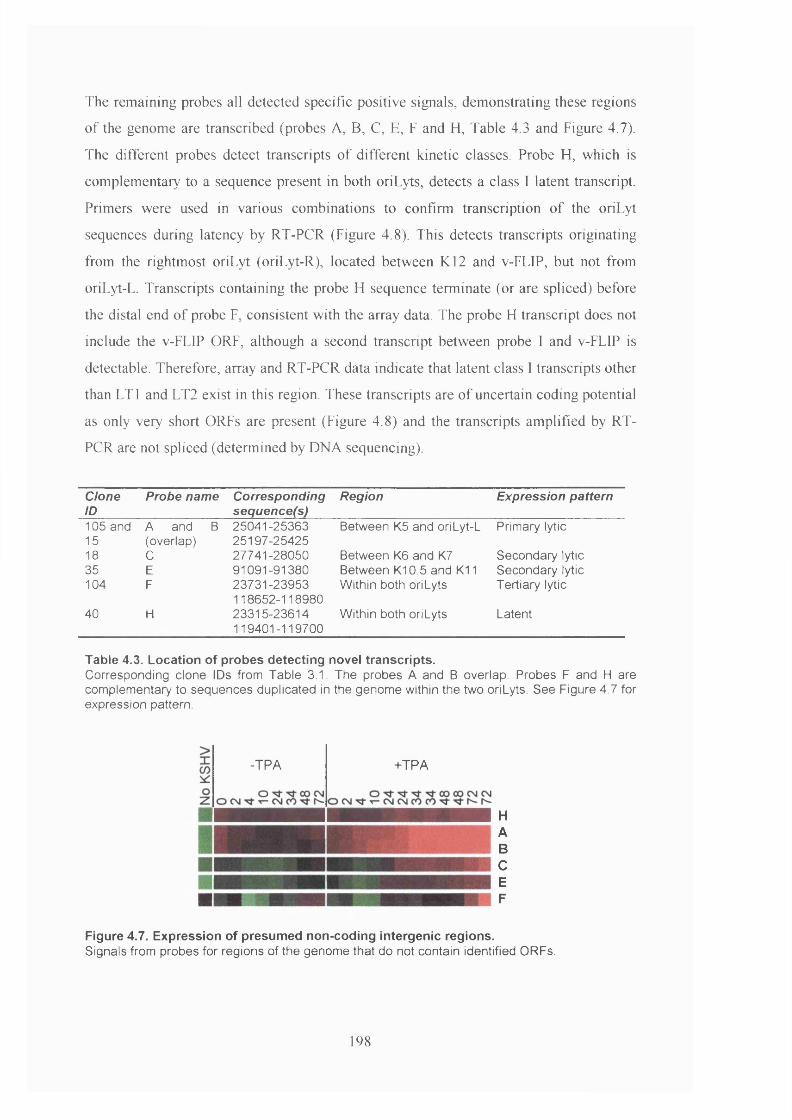
The remaining probes all detected specific positive signals, demonstrating these regions of the genome are transcribed (probes A, B, C, E, F and H, Table 4.3 and Figure 4.7).
The different probes detect transcripts of different kinetic classes. Probe H, which is
complementary to a sequence present in both oriLyts, detects a class 1 latent transcript.
Primers were used in various combinations to confirm transcription of the oriLyt
sequences during latency by RT-PCR (Figure 4.8). This detects transcripts originating
from the rightmost oriLyt (oriLyt-R), located between K12 and v-FLIP, but not from
oriLyt-L. Transcripts containing the probe H sequence terminate (or are spliced) before
the distal end of probe F, consistent with the array data. The probe H transcript does not
include the v-FLIP ORF, although a second transcript between probe I and v-FLIP is
detectable. Therefore, array and RT-PCR data indicate that latent class I transcripts other
than LTl and LT2 exist in this region. These transcripts are of uncertain coding potential
as only very short ORFs are present (Figure 4.8) and the transcripts amplified by RT-
PCR are not spliced (determined by DNA sequencing).
CloneID
Probe name Correspondingsequence(s)
Region Expression pattern
105 and A and B 25041-25363 Between K5 and oriLyt-L Primary lytic15 (overlap) 25197-2542518 0 27741-28050 Between K6 and K7 Secondary lytic35 E 91091-91380 Between K10.5 and K11 Secondary lytic104 F 23731-23953 Within both oriLyts Tertiary lytic
118652-11898040 H 23315-23614 Within both oriLyts Latent
119401-119700
Table 4.3. Location of probes detecting novel transcripts.Corresponding clone IDs from Table 3.1. The probes A and B overlap. Probes F and H are complementary to sequences duplicated in the genome within the two oriLyts. See Figure 4.7 for expression pattern.
-TPA +TPA
HABCEF
Figure 4.7. Expression of presumed non-coding intergenic regions.Signals from probes for regions of the genome that do not contain identified ORFs.
198
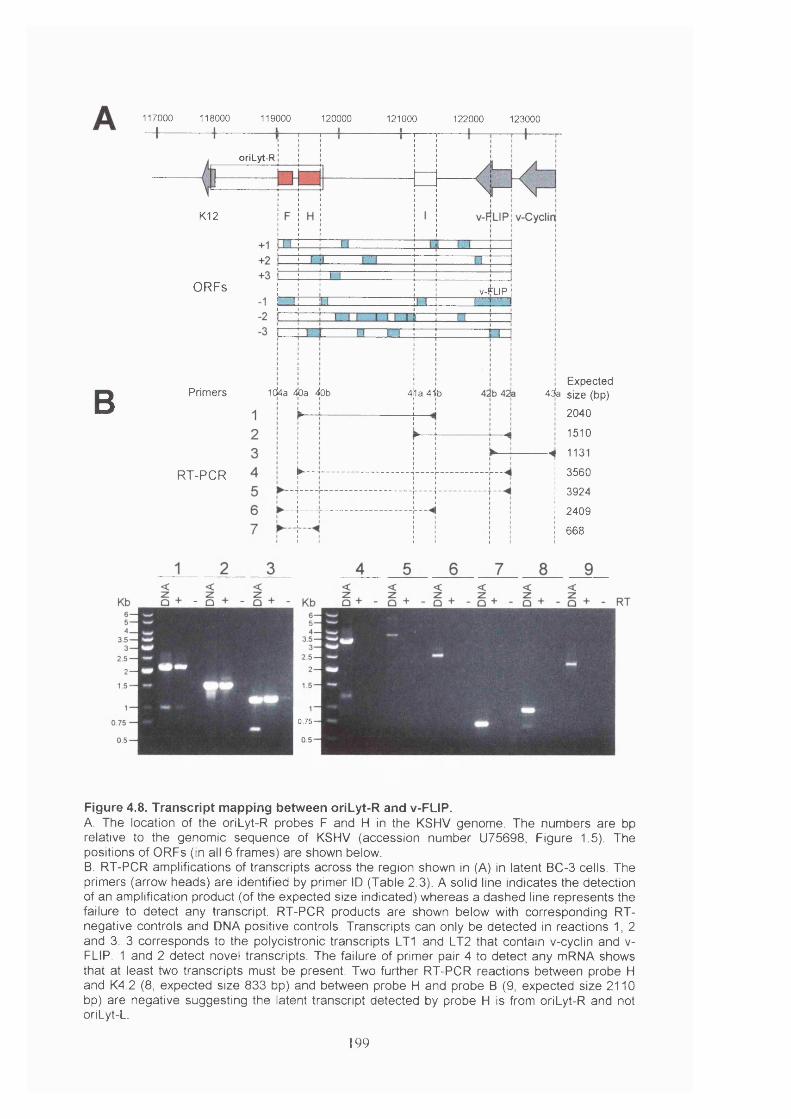
B
117000 118000 119000 120000 121000 122000 123000
oriLyt-R
K12
ORFs v-FLIP I
10l4a 40a 40bPrim ers 4ha 4il 43la
RT-PCR
Expected size (bp)
20 40
1510
1131
3560
3924
2 4 09
668
0 ,7 5 -
Figure 4.8. Transcript mapping between oriLyt-R and v-FLIP.A. The location of the orlLyt-R probes F and H in the KSHV genome. The numbers are bp relative to the genomic sequence of KSHV (accession number U75698, Figure 1.5). The positions of ORFs (in all 6 frames) are shown below.B. RT-PCR amplifications of transcripts across the region shown in (A) in latent BC-3 cells. The primers (arrow heads) are identified by primer ID (Table 2.3). A solid line indicates the detection of an amplification product (of the expected size indicated) whereas a dashed line represents the failure to detect any transcript. RT-PCR products are shown below with corresponding RT- negative controls and DNA positive controls. Transcripts can only be detected in reactions 1, 2 and 3. 3 corresponds to the polycistronic transcripts LTl and LT2 that contain v-cyclin and v- FLIP. 1 and 2 detect novel transcripts. The failure of primer pair 4 to detect any mRNA shows that at least two transcripts must be present. Two further RT-PCR reactions between probe H and K4.2 (8, expected size 833 bp) and between probe H and probe B (9. expected size 2110 bp) are negative suggesting the latent transcript detected by probe H is from oriLyt-R and not oriLyt-L.
199
4.2.5 KSHV encodes four full-length IRFs
It has previously been noted that the co-expression of uncharacterised genes with those
of known function may provide a means of gaining insights into the functions of these
genes (Risen et al, 1998). Probe B corresponds to a sequence located between K10.5 and
K ll. This region of the genome encodes vIRF-1 (ORB K9) and vIRF-2 (ORB K ll.l)
(see section 1.2.9.2) and a further two putative ORBs which have homology to IRBs;
KlO.l and K10.5 (Russo et al, 1996, Burysek et al, 1999a, GenBank accession U93872,
submitted by Neipel et al). vlRB-1, vlRB-2, KlO.l and K ll are ail classified as
secondary lytic genes by cluster analysis (Bigure 4.3). Probe E is also clustered in this
branch (labelled K10.7 in Bigure 4.3). This information, along with its genomic location,
suggested that this probe might represent a novel ORB with homology to the known
vlRBs. ORB analysis shows that the array probe forms part of a novel open reading
frame (named K10.7) that corresponds to nucleotides 91394-90936 in KSHV genomic
sequence U75698. Multiple sequence alignment shows that this ORB shares homology
with vlRB-1, vlRB-2, KlO.l and human IRBs in part of the N-terminal DNA binding
domain (Bigure 4.9A).
The adjacent clustering of K ll and vlRB-2 on the array (Bigure 4.3) suggests that these
two ORBs may be co-transcribed. KIO, K10.5 and K ll share homology with vlRB-1 and
human IRBs in the C-terminal interaction domain (Bigure 4.9B). This therefore suggests
that KIO and KlO.l, K10.5 and K10.7, and K ll and vlRB-2 may be spliced together in
pairs to give three longer ORBs encoding putative proteins with homology to both the C-
terminal interaction domain and the N-terminal DNA binding domain of known IRBs.
RT-PCR across the predicted long ORBs showed that the transcripts are indeed spliced
(Bigure 4.10A). Sequencing reveals that the removal of an intron generates a complete
ORB across each transcript (Bigure 4.10B). Each intron contains a donor, acceptor,
branch point and polypyrimidine tract sequence that follow the consensus sequence for
recognition by the host cell spliceosome (Bigure 4.IOC). These novel transcripts encode
for three putative IRB-related proteins, KlO/10.1, KlO.5/10.7 and Kll/vlRB-2 with
predicted molecular weights of 98, 62.5 and 75 kD respectively. Therefore, together with
vlRB-1, KSHV encodes four genes with homology to full-length IRBs. Phylogenetic
analysis indicates that the three spliced KSHV IRBs derive from genome duplications of
an ancestral vlRB-1 (Bigure 4.9C). The translation of these spliced transcripts is
200
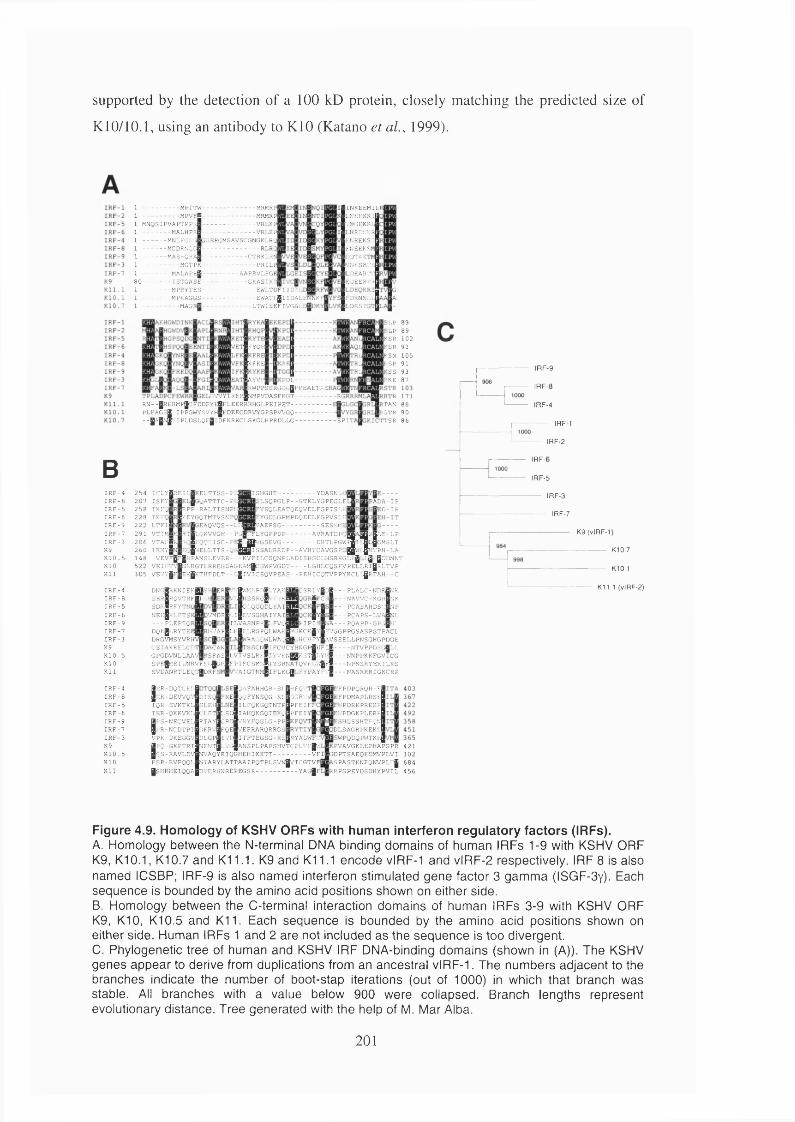
supported by the detection of a 100 kD protein, closely matching the predicted size of
K10/10.1, using an antibody to KIO (Katano et al, 1999).
-------------------- M P IT W ------------------------------- MRMRF---------------------MPVFffl------------------------------- MRMRFM N Q S IP V A P T P P rI -------------------------------VRLKF----------------M A LH PrI ------------------------------- VRLKF
m n l e g g - J g g e f g m s a v s c g n g k l r c
------------- MCDRKGGH---------------------------------- RLRQ m a s - g r a J --------------------------c t r k l r f J---------------------M G TPK --------------------------------P R I L pJ
----------------MA LA P î-jJ ----------------------AA PRV LFGE0 -----------------I S T G A S E - - G K ASTKI.j
----------------M P R Y T E S--------------------------------- E W L T D F IID A ; ___----------------M PK A G G S--------------------------------EWAT [ g 11D A LE N N K 1-
-MAG
I N K E E M I L tlLN K E K K I VNGEKKL .HRIJRKR
E N E E K S I KMEEKSM d d t a : -/N K SR T R
.D E A R 'ICED EERTR
E'DRNNEE .D R S 'i'L T W IS E F IV G A E I
;L P 8 93E P 8 9KSR 102KSR 91KYOEE SN 1 0 5
KFKE K S P 91S S 9 3
P D L -------------- - -R W P P S S R G G G jP P E A E T A h
G W Y IR E R M N M P V D A S FK G T ------------------------R(
AYVP RKE 8 7
R 1 7 1TAN 8 8
KGTR 9 0S P I T r r s R 8 6
r n - - | r e r m p J g f d d f y e B f l e e r r r h g l p e i p e t
p l p a g s J - i p p g w y s v y h J f d e e c d r v y g p s p w g o
- -g A jN ^ /IP L D S L Q F jlD F K R E C L S K G L H P R D L L G
BI R F - 4I R F - 8I R F - 5I R F - 6I R F - 9I R F - 7
I R F - 3K9K I O . 5K IOK l l
I R F - 4I R F - 8I R F - 5I R F - 6I R F - 9I R F - 7I R F - 3K9K I O . 5K IOK l l
I R F - 4I R F - 8I R F - 5I R F - 6I R F - 9I R F - 7I R F - 3K9K I O . 5K IO
K l l
2 5 4 I C L Y g R E I E j 2 0 7 I S F y B 2 5 8 IK F V B 2 2 8 I K F j j 2 2 2 L T F l l2 9 1 V T T M fc :B P T jE ':> K W G H - - P .F |T F L Y G P P D P -------------- A V R A T D Pv® .*-vŒ e B .A E -L P2 0 6 VTA.'-'Br r J f '. v T T S C - P i g E g J - 'G S E V G ------------------- D R T L P G W ^ ^ n J i M S L T2 6 0 l F Y v R J [ F ^ - |H E L L T T S 'O E ^ g i S S A L R R D P - - A V H Y C A V G S F ', |ÿ ^ : ^ : V P N - L A1 4 8 V E V F j0 |R P A M S L E V E R K V F IL C S Q N P L A D IS H S C L H S R K G L K g lig K g U D N N T5 2 2 V E IF v ^ .'E R G T L R R E G D A G E A M g C S W P V G D T --------- L G H L C Q S F V P E L L R Ig R L T V P3 0 5 V E ’. 'V H F |F K g K T H F D L T - - ' ; | lV I C S O V P E A S - - P E H I C Q T V P P Y K C L lg R T A H - -C
E L T T S S - P E j O A T T T C -P f J
r p p - r a l t i s n p h [ k e y g q t m t v s n f
e a q v q s - - l : jJ■O K V VG H --P.':. v T I S C - P ! E L L T T S -Q F
I IS H G H T -------------------- YD ASN T.:S L S Q P G L P --G T K L Y G P E G L E FY S Q LE A T Q E Q V E L FG P IS E E-:!f y g d l g p m p d o e e l f g p v s l f I
| . 'A E P S G ----------------------S E S S MEP F L Y G P P D P -------------- AV RA TDP
f-'G S E V G ----------------- D RTLPG W P3 IS S A L R R D P --A V H Y C A V G S F
P A D A -I PE D - I P
D N G gPK N I E K g s h B E R SERgROVTRKgFGHls d k I r f y t n o n e k J k e f t s k
- - - P L E P T Q D Q K gG R Y T E Fd r g v m s y v r h
C E IA K R E L C D 'g p g d v n l l a a v J r s f a s
S P F,gM E IL N R V F EG J g Hs v d a n r t l e q t J d r f s
DVMDR
HVAFACAK
A ^ 'M A P n f f l : .Y A ? :g H G S R I V g D g - - - p l a l c - n d r H i ; k v’L |U S S R C '§ '- T \ 'K ™ | - Œ " C J - - - n a w c - k g r B t j k
J o l q g o d l y a i ^ H | i H - p c a s a h d s c B t j p f i | e v s g h a i y a t M I I - - p c a p s - l v a M t j l r L V A S N P R g L F V C ^ g P I P I S g N A P Q A P P -G P G g M I.l h | e l r g p q l w a k ^ g k c k | y | e v g g p p g s a s p s t p a c l
■/RA GO V -JLW A C& GH CH TV -fA V SEELLPN SG H G PD G E;p B h
L V IV S L R .q llY V K rjf l t lK S T g I .Y H B N N P P K K F G V IC GS S C N f l lF C V C Y H N G P jH F l l N T V P PD .S G gL LS L R .q l lY V K I ' j g K S T g l .Y H l N N P P K K F G V IC G
F P I F C S M s l lY S R N A T Q V E t;V .g l f l - - - N P N S R Y E R I L R S V A IG T N M jlF L K G |L E Y P A Y F v |- - - N A S R R R I G K C R P
1E R -D Q T C K I. E R - D E W Q ’v IQ R -E V K T K I
lE R -Q K K V K l
1P S -N E C V E L P R -N C D T P I V PK -D K E G G V
tP v - G K P T R I 5 S -R A V L D F S P -R V P Q Q L
B S H R H E IQ Q A
F R ED T SQ SL E K C L E T L S D
Q A F A H H G R -S L O g F Y N S Q G -R I. IL F Q K G Ç T N T P lA H Q K G Q IE K O
R T A 'l J C R D lV R Y FQG LG - P P D FRV FQ E V E FRA R Q R RG S D L G P IV D I T F T E G S G -R S N PN T LVG A N S P L P A P S H V T C P L '.'K g A
iV fflW Y A Q Y RIO G H EH IK K TT----------------------V FN T A R Y L A T T A A IP Q T P L S V N gV T C G T V F
D V E R H N R E P E G S R ------------------------ Y A SgP
RFQV'DGRV’P F E I F FP F E I
RYALWFC
iK F P D P Q R Q R -r: E FPD M A PL R SK FW PD R KPREK K EW PD GK PLERK E S H G S S H T P O N D L SA G R P K E K S
:WPQDQPWTKR PV A V G K L E P H A P SP R 4 2 1
iD P T S A E Q F D M V P L V I 3 0 2 A .q P A S T E N F Q N V P L T g 6 8 4
IR R P S P E Y D S D H Y P V IL 4 5 6
IRF-9
IRF-I
IRF-4
IRF-1
IRF-2
lRF-(
IRF-5
IRF-3
IRF-7
K9 (vlRF-1
K10.7
K10.1
K11.1 (vlRF-2)
Figure 4.9. Homology of KSHV ORFs with human interferon regulatory factors (IRFs).A. Homology between the N-terminal DNA binding domains of human IRFs 1-9 with KSHV ORF K9, K10.1, K10.7 and K11.1. K9 and K11.1 encode vlRF-1 and vlRF-2 respectively. IRF 8 is also named ICSBP; IRF-9 is also named interferon stimulated gene factor 3 gamma (ISGF-Sy). Each sequence is bounded by the amino acid positions shown on either side.B. Homology between the C-terminal interaction domains of human IRFs 3-9 with KSHV ORF K9, KIO, K10.5 and K l l . Each sequence is bounded by the amino acid positions shown on either side. Human IRFs 1 and 2 are not included as the sequence is too divergent.0. Phylogenetic tree of human and KSHV IRF DNA-binding domains (shown in (A)). The KSHV genes appear to derive from duplications from an ancestral vlRF-1. The numbers adjacent to the branches indicate the number of boot-stap iterations (out of 1000) in which that branch was stable. All branches with a value below 900 were collapsed. Branch lengths represent evolutionary distance. Tree generated with the help of M. Mar Alba.
201
Figure 4.10. Splicing creates three long ORFs with homology to full-length IRFs (opposite).A. RT-PCR products showing transcripts encoding vlRF-1 and the putative ORFs K10/10.1, K10.5/10.7 and K11/vlRF-2. The primers used were complementary to either end of the long ORFs (primer numbers 31a and 145, 33a and 125b, 146 and 147, 37 and 148 respectively, see Table 2.3). RNA was extracted from BC-3 cells 24 hours after the addition of TPA. RT negative controls and positive controls from KSHV genomic DNA are included for each RT-PCR. The spliced RT-PCR products are predicted to be 1350bp (K9), 2736bp (K10/10.1), 1701 bp (K10.5/10.7) and 2043bp (K11/vlRF-2).B. The position and organisation of the IRF related genes of KSHV. The positions (bp) are relative to genomic sequence U75698. The location of the novel ORF K10.7 is shown. Secondary lytic genes are shaded in black. KIO is a class II latent gene, K10.5 was not analysed. The region of each ORF whose translated sequence is shown in Figure 4.9A is indicated by the grey bars above, and those shown in Figure 4.9B by the white bars. Sequenced transcripts shown in (A) are drawn below the corresponding ORFs. Each transcript encodes a predicted protein with full-length homology to known IRFs. The predicted size of the encoded protein is indicated below each transcript. Introns are located between 88343 and 88443 (K10/10.1), 90846 and 90939 (K10.5/10.7), and 93519 and 93639 (K11/vlRF-2).C. Donor, acceptor, branch point and polypyrimidine tract (Poly pyr.) sequences that follow the mammalian consensus can be identified within the intron of each spliced vIRF. Nucleotides in bold adhere to the consensus sequence. Spaces indicate the sequence is continuous, dashes indicate the presence of intervening sequence. Y represents a pyrimidine (U or C), R and purine (A or G) and N and nucleotide.
202
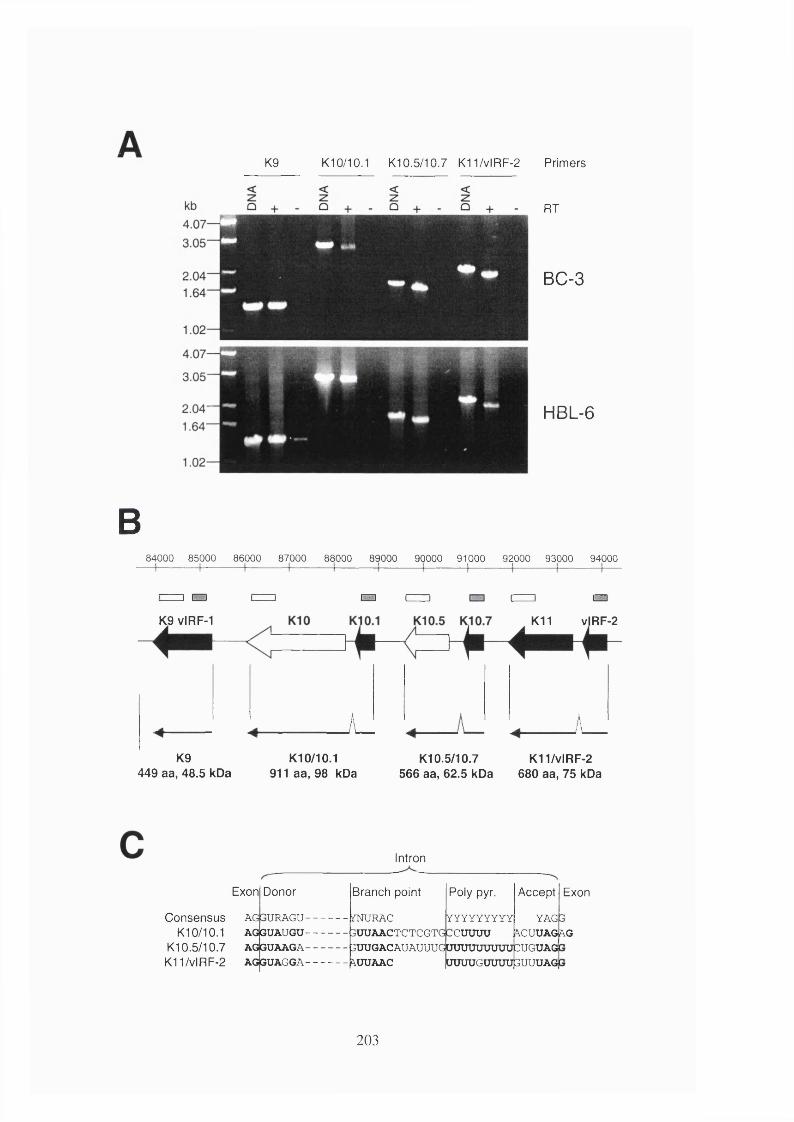
K9 K10/10.1 K10 . 5 / 1 0 . 7 K I I / v l R F - 2 Primers
RT
BC-3
HBL-6
B84000 85000 86000 87000 88000 89000 90000 91000 92000 93000 94000
] ÜÜ1 nn EZ3
K9 vlRF-1 K11 vlRF-2
K9449 aa, 48.5 kDa
K10/10.1 911 aa, 98 kDa
A _ A _
K10.5/10.7 KII/vlRF-2566 aa, 62.5 kDa 680 aa, 75 kDa
Exon
Consensus K10/10.1
K10.5/10.7 KII/vlRF-2
AGA(AA(
Donor
G G G G G G
Intron
U R A G U
lUAUGUfUAAGAUAGGA
Branch point
mURAC 3ÜUAACTCTCGTG 3UUGACAUAUUU' z^UUAAC
Poly pyr.
Y Y Y Y Y Y Y Y Y
cuuuuGUJUUUUUUUUC
ÜUÜUGUUUU3
Accept
YAG zCUUA 3UGUAG
UUUAG
Exon
GA.G
203
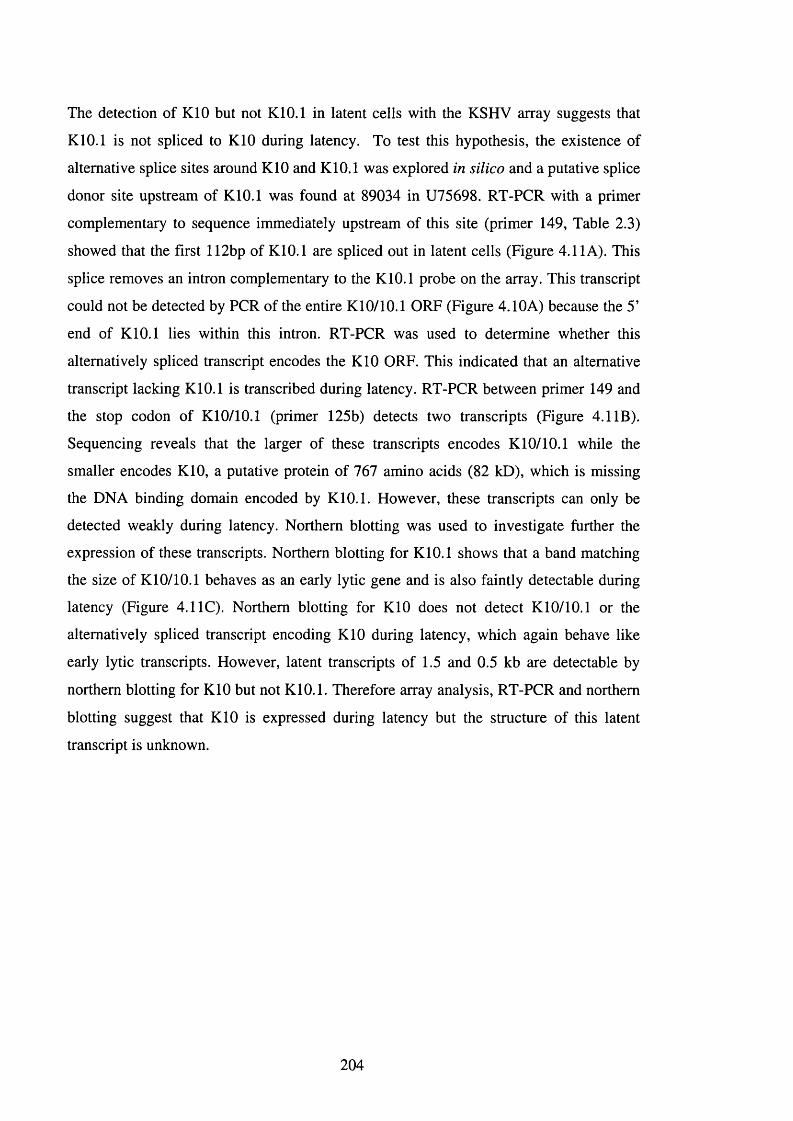
The detection of KIO but not KlO.l in latent cells with the KSHV array suggests that
KlO.l is not spliced to KIO during latency. To test this hypothesis, the existence of
alternative splice sites around KIO and KlO.l was explored in silico and a putative splice
donor site upstream of KlO.l was found at 89034 in U75698. RT-PCR with a primer
complementary to sequence immediately upstream of this site (primer 149, Table 2.3)
showed that the first 112bp of KlO.l are spliced out in latent cells (Figure 4.11 A). This
splice removes an intron complementary to the KlO.l probe on the array. This transcript
could not be detected by PGR of the entire KlO/10.1 ORF (Figure 4.10A) because the 5’
end of KlO.l lies within this intron. RT-PCR was used to determine whether this
alternatively spliced transcript encodes the KIO ORF. This indicated that an alternative
transcript lacking KlO.l is transcribed during latency. RT-PCR between primer 149 and
the stop codon of KlO/10.1 (primer 125b) detects two transcripts (Figure 4.1 IB).
Sequencing reveals that the larger of these transcripts encodes KlO/10.1 while the
smaller encodes KIO, a putative protein of 767 amino acids (82 kD), which is missing
the DNA binding domain encoded by KlO.l. However, these transcripts can only be
detected weakly during latency. Northern blotting was used to investigate further the
expression of these transcripts. Northern blotting for KlO.l shows that a band matching
the size of KlO/10.1 behaves as an early lytic gene and is also faintly detectable during
latency (Figure 4.11C). Northern blotting for KIO does not detect KlO/10.1 or the
alternatively spliced transcript encoding KIO during latency, which again behave like
early lytic transcripts. However, latent transcripts of 1.5 and 0.5 kb are detectable by
northern blotting for KIO but not KlO.l. Therefore array analysis, RT-PCR and northern
blotting suggest that KIO is expressed during latency but the structure of this latent
transcript is unknown.
204
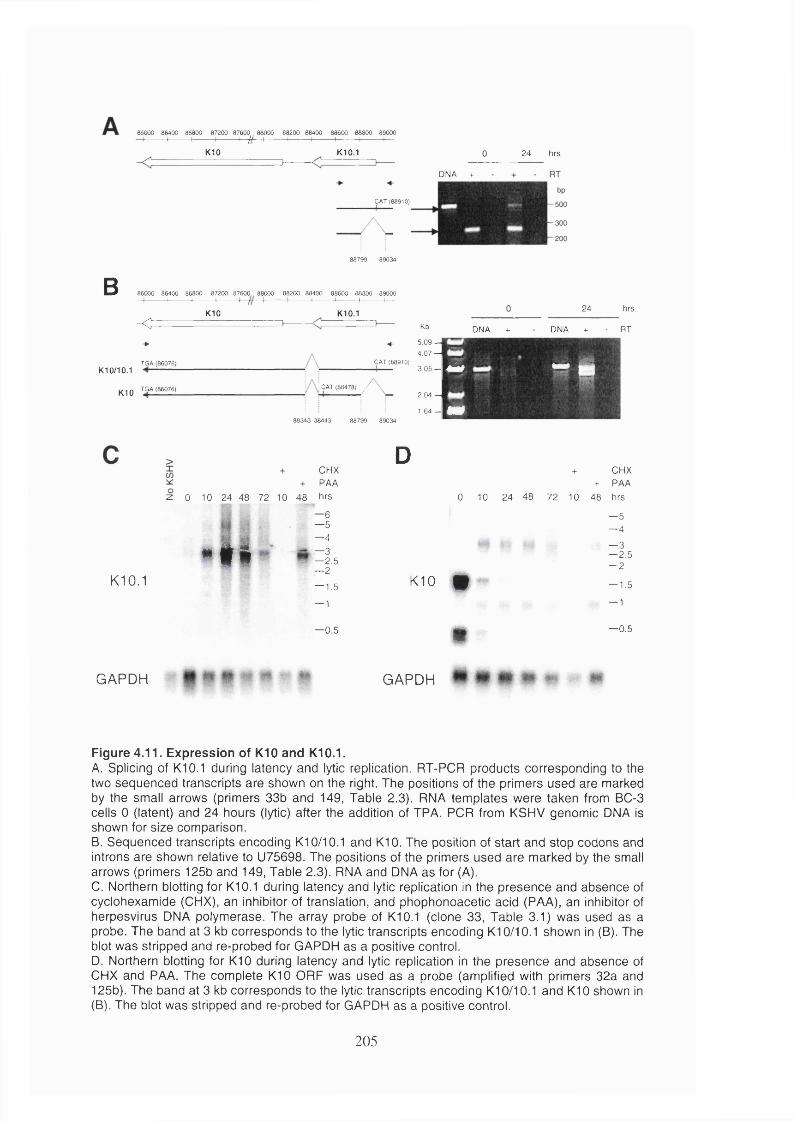
86000 86400 86800 87200 87600 88000 88200 88400 88600 88800 89000— t------------1-------------- h— ------- 1 1 / / -----I------------- 1------------- 1-------------1------------- 1------------- 1—
KIO K10.1 24 hrs
DNA +
CAT (88910)
B88799 89034
86000 86400 86800 87200 87600 88000 88200 88400 88600 88800 89000 1 ' 1 ' 1 1 +-
-<cKIO K10.1 24
K10/10.1
KIO
TGA (86076)
TGA (86076) i CAT (88478) .
88343 88443 88799 89034
Kb
4- 5 .0 9 -4.07 —
CAT (88910)3.05 —Q2.04 -
890341.64 - Q
DNA +
hrs
DNA + - RT
- i
ISK10.1
CHXPAA
z 0 10 24 48 72 10 48 hrs
m
—6—5—4—3- 2 . 5—2- 1 . 5
— 1
—0.5
D
K10 #
m
+ CHX+ PAA
0 10 24 48 72 10 48 hrs
— 5— 4
— 3— 2.5- 2
— 1.5
— 1
— 0.5
GAPDH GAPDH
Figure 4.11. Expression of KIO and K10.1.A. Splicing of K10.1 during latency and lytic replication. RT-PCR products corresponding to the two sequenced transcripts are shown on the right. The positions of the primers used are marked by the small arrows (primers 33b and 149, Table 2.3). RNA templates were taken from BC-3 cells 0 (latent) and 24 hours (lytic) after the addition of TPA. PCR from KSHV genomic DNA is shown for size comparison.B. Sequenced transcripts encoding K10/10.1 and KIO. The position of start and stop codons and introns are shown relative to U75698. The positions of the primers used are marked by the small arrows (primers 125b and 149, Table 2.3). RNA and DNA as for (A).C. Northern blotting for K10.1 during latency and lytic replication in the presence and absence of cyclohexamide (CHX), an inhibitor of translation, and phophonoacetic acid (PAA), an inhibitor of herpesvirus DNA polymerase. The array probe of K10.1 (clone 33, Table 3.1) was used as a probe. The band at 3 kb corresponds to the lytic transcripts encoding K10/10.1 shown in (B). The blot was stripped and re-probed for GAPDH as a positive control.D. Northern blotting for KIO during latency and lytic replication in the presence and absence of CHX and PAA. The complete KIO ORF was used as a probe (amplified with primers 32a and 125b). The band at 3 kb corresponds to the lytic transcripts encoding K10/10.1 and KIO shown in (B). The blot was stripped and re-probed for GAPDH as a positive control.
205
4.2.6 KSHV gene expression in different PEL samples
Analysis of KSHV gene expression during latency in the PEL cell line BC-3 suggests
that LNA-1, v-cyclin and v-FLIP constitute class I latent genes while kaposin, KIO, and
perhaps vOX-2, constitute class II latent genes. The KSHV-human microarray was used
to investigate whether these expression patterns are common to all PEL samples. Gene
expression was measured in the cell lines BC-3, BCBL-1, BCP-1, HBL-6 and JSC-1 and
in PEL-SY, a clinical sample (section 5.2.3). Technical replicates were performed for
BC-3, BCBL-I, HBL-6 and JSC-1 and biological replicates for BC-3 and BCBL-I
(section 3.2.2.4). In addition, HBL-6 was analysed 24, 48 and 72 hrs after the induction
of lytic replication with TPA. The virus gene expression data were collated, and grouped
by hierarchical clustering (Figure 4.12A). In this analysis, shades of red and green
represent expression above and below the median level respectively. Cluster analysis
separates the KSHV genes into three main groups. The mean expression profile of each
of these groups is shown in Figure 4.12B. One of these, consisting of LNA-I, v-cyclin,
v-FLIP and K15, corresponds to class I latent genes. The KI5 probes are for the M form
and detect KI5 expression in HBL-6, which is known to contain M form virus (Nicholas
et al, 1998). This transcript is not up-regulated upon TPA induction of KSHV in HBL-6.
This cluster also contains probe H and probe I (Figure 4.8). Probe I does not cross-react
with cellular RNA on the KSHV-human microarray (Figure 4.I2A). This provides
further evidence that a novel class I latent mRNA is transcribed from this region. The
majority of these class I transcripts are expressed in all PEL samples and are not up-
regulated by the induction of lytic replication in HBL-6. However, strongest expression
is observed in BC-3 and BCP-1.
The largest group of genes in Figure 4.12A consists of those previously classified as lytic
in BC-3 (Figure 4.3). Consistent with this classification, these genes are also up-
regulated after treatment of HBL-6 with TPA. Array analysis shows that lytic genes are
expressed in varying proportions in different PEL samples. The highest level of
expression is observed in the cell line BCP-1. The low viability of this cell line
(measured at 41%, Table 5.1) demonstrates that many of these cells enter lytic
replication spontaneously. This is consistent with the documented expression of vIL-6 in
40% of BCP-1 cells (Moore et al, 1996a) but only 2-3% of other PEL samples (Ascherl
et al, 1999, Katano et al, 2000a, Parravicini et al, 2000).
206
A distinct gene cluster is formed by four KSHV genes, KIO, T0.7 RNA (encoding
kaposin), vOX-2 (K14) and vBcl-2 (ORF 16), As for class I latent genes, these are most
strongly expressed in BC-3 cells, but unlike class I genes, these are also up-regulated
during lytic replication. Their detection in latent BC-3 cells is not due to the presence of
a small number of spontaneously lytic cells because unlike some other PEL cell lines,
lytic transcripts are not detectable. Also, JSC-1 and BCBL-1 express higher levels of
lytic genes than BC-3 but lower levels of KIO, kaposin, vOX-2 and vBcl-2. These are
therefore class II latent genes in BC-3.
In addition to the original probes for the 5’ end of KIO and for KIO.I, the KSHV human
microarray contains an additional probe for KIO/IO.I, corresponding to the 3’ end of
KIO (KIO (2), Table 3.2). This is classified as a lytic gene along with KIO.I (Figure
4.I2A). Therefore, the latent transcript across KIO does not include the 3’ end of the
ORF.
This comparative analysis shows that KSHV gene expression does not correlate with
EBV co-infection; HBL-6, JSC-1 (Table 2.2) and PEL-SY (Figure 5.4) are EBV positive
but do not share an expression pattern. The Ig genes have been sequenced for 3 of the
PEL cases analysed; BC-3, BCBL-I and HBL-6 (Matolcsy et al, 1998, Fais et al,
1999). Of these, BCBL-I and HBL-6 are clonally mutated, suggesting an origin from
post-GC B-cells, whereas BC-3 is germline, suggesting a pre-GC derivation. Therefore,
different KSHV gene expression patterns could reflect differences in the stage of
development of the host B-cell.
Figure 4.12. Expression of KSHV genes across muitipie PEL sampies.(Over page).A. Hierarchical clustering of KSHV genes across a number of PEL cells lines and clinical material (PEL-SY). Two B-cell lines not infected with KSHV are included as negative controls (Karpas-422 and RPMI-8226). Three main clusters of virus genes are apparent. These correspond to class I latent genes, class II latent genes and lytic genes. Gene expression is shown as a pseudocoloured representation of log(2) expression ratio with red being above and green below the row median level of expression (set to 0) as shown by the scale. Grey indicates array elements flagged as not present.B. Mean expression profiles for each class of KSHV gene as defined in (A). All three classes of KSHV genes are detected in PEL samples at levels above the negative controls.
207
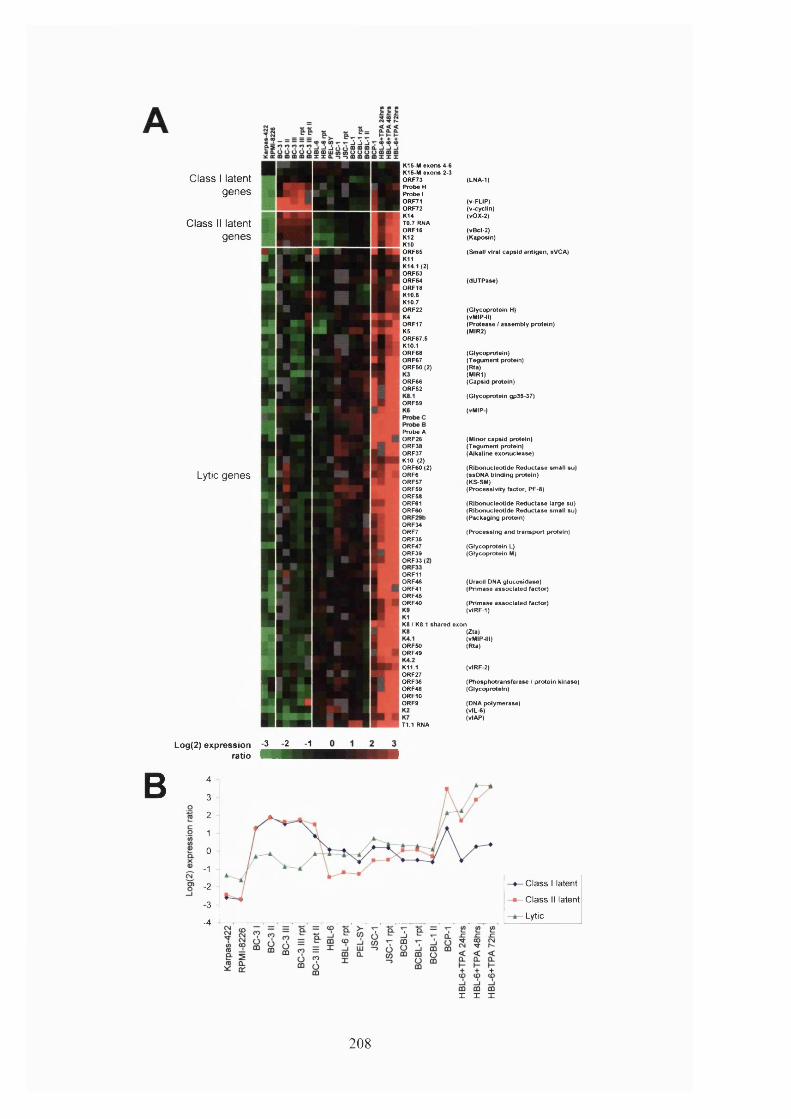
Class I latent genes
Class II latent genes
K16-M exons 4-6 K16-M exons 2-3 ORF73 Probe H Probe I ORF71 ORF72 K14T0.7 RNAORF16K12K10ORF6SK11K14.1 (2)ORF53ORFS4ORF18K10.SK10.7ORF22K4ORF17KSORF67.5 K10.1 ORF68 ORF67 ORFSO (2)
Lytic genes
ORF66ORF52
ORFS9
Probe AORF26ORF38ORF37K10 (2)ORF60 (2)ORF6ORF57ORF59ORF59ORFS1ORF60
ORF34ORF7ORF36ORF47ORF39ORF33 (2
0RF11ORF46ORF41ORF43ORF40
ORFSOORF49
K11.1ORF27ORF3SORF48ORF10ORF9
T1.1 RNA
(LNA-1)
(v-FUP)(v-cyclln)(vOX-2)
(vBcl-2)(Kaposin)
(Small viral capsid antigen, sVCA)
(dUTPase)
(Glycoprotein H)(vMIP-ll)(Protease / assembly protein) (MIR2)
(Glycoprotein) (Tegument protein) (Rta)(MIR1)(Capsid protein)
(Glycoprotein gp35 37)
(vMIP)
(Minor capsid protein)(Tegument protein)(Alkaline exonuclease)
(RItionucleotlde Reductase small su) (ssDNA binding protein)(KS-SM)(Processlvlty factor, PF-8)
(Rltxmucleotide Reductase large su) (Ribonucleotide Reductase small su) (Packaging protein)
(Processing and transport protein)
(Glycoprotein L)(Glycoprotein M)
(Uracil DNA glucosldase) (Pit ma se associated factor)
(Primase associated factor) (vlRF-1)
K8 1 K8.1 shared exon(Zta)(vMIP-lll)(Rta)
(vlRF-2)
(Phosphotransferase I protein kinase) (Glycoprotein)
(DNA polymerase)(vlL-8)(vlAP)
Log(2) expression ratio
-3 -2 -1
B 4
3
2
1
0
1
■2
3
-4
I I I
Class I latent
Class II latent
Lytic
208
4.3 Discussion
The KSHV arrays were used to analyse KSHV gene expression during latency and lytic
replication. The arrays are able to detect the small number of transcripts that have
previously been shown to be expressed during latency. Cluster analysis reveals that latent
genes comprise two differentially regulated groups; class I latent genes and class II latent
genes. BC-3 and BCP-1 express higher levels of latent genes than other PEL cell lines.
Cluster analysis further separates KSHV lytic genes into three main classes (primary,
secondary and tertiary) and generates a temporal programme of lytic gene expression.
This provides a simple means of assessing when the expression of these genes becomes
detectable.
4.3.1 KSHV p o ss e s se s c la ss I and c la ss II latent genes
The array results confirm previous northern blot analyses demonstrating that v-FLIP, v-
cyclin and LNA-1 are class I latent genes (Dittmer et al, 1998, S arid et al, 1998, S arid
et al, 1999, Talbot et al, 1999). The KSHV array was unable to detect expression of
K15 in latent BC-3 cells. This may be because the arrays were not sensitive enough to
detect the extremely low levels of expression in PEL (Glenn et al, 1999, Choi et al,
2000). The KSHV-human microarray is able to detect expression of the M form in
latently infected HBL-6 cells and this is not up-regulated during lytic replication (Figure
4.12). K15 therefore constitutes a class I latent gene. Both the KSHV array and the
KSHV-human microarray also detect novel class I transcripts upstream of v-FLIP.
Analysis of gene expression during lytic replication suggests that the majority of genes
described as class II by Sarid et al are lytic genes and not expressed during latency
(class III). However, four genes, KIO, kaposin, vOX-2 and vBcl-2, do behave as genuine
class II latent genes in this analysis. The classification of T0.7/kaposin as a class II latent
gene is supported by previous data. The T0.7 transcript is present in the majority of KS
spindle cells (Blasig et al, 1997, Staskus et al, 1997, Sturzl et al, 1997, Sturzl et al,
1999b) and PEL cells (Kliche et al, 2001) but is also up-regulated during lytic
replication (Sadler et al, 1999, Sun et al, 1999). The clustering of KIO, vOX-2 and
vBcl-2 with kaposin therefore suggests that these too are class II latent genes. Transcripts
containing the KIO ORF are present during latency according to RT-PCR and northern
209
analysis. Transcripts overlapping this locus were also detected during latency by Sarid et
al and found to increase during lytic replication (Sarid et al, 1998). However, the
structure of these transcripts requires further clarification. OX-2 also behaves as a class
II latent gene (Sarid et al, 1998, Chung et al, 2002). vBcl-2 transcripts increase in PEL
during lytic replication, consistent with a lytic gene (Sarid et al, 1997), but vBcl-2
protein is detectable in all spindle cells in nodular KS lesions, consistent with a latent
gene (Widmer et al, 2002). Transcription of the EBV ORF BHRFl, encoding a Bcl-2
homologue, can also be detected during latency in some cells (Sample et al, 1986,
Austin et al, 1988, and Figure 5.4A). Further work is needed to confirm the expression
of KIO, vOX-2 and vBcl-2 during latency and to investigate whether these genes are
differentially expressed in different PEL samples.
4.3.2 The transcription program m e of KSHV lytic replication
The expression of many KSHV genes has not been analysed before. For those genes
whose transcription has been studied, it is unclear how their expression relates to the
ordered series of events that constitute lytic replication. Simultaneous analysis of all
KSHV genes using DNA arrays illustrates that the relative time expression of different
genes is detected correlates well with the stage of the virus life cycle in which that gene
is thought to act. For example, genes which encode proteins thought to be involved in
virus gene regulation are all expressed early and precede those that form the virus
particle or which are involved in its assembly (Figures 4.3 and 4.4). The one exception to
this is ORF 67, which is already detectable by 4 hours post-induction. This gene is
thought to encode a tegument protein due to its homology to the Epstein-Barr virus gene
BFRFl (Russo et al, 1996), which is also expressed early in lytic replication (Farina et
al, 2000). The expression of ORF 67 as a primary lytic gene suggests that this protein
may have functions consistent with the other genes expressed at this time, namely cell
regulation, signal transduction and virus gene regulation.
Analysis of functional annotation in the context of gene expression also shows different
temporal expression of certain functional classes. Genes involved in DNA replication
such as DNA polymerase (ORF 9), PF-8 processivity factor (ORF 59), ssDNA binding
protein (ORF 6) and the viral primase (ORF 56) are detected early and share similar
patterns of expression (Figure 4.3, pink text). ORFs 40, 41 and 44 are also thought to be
involved in DNA replication but are not detected until later during the life cycle (Figure
210
4.3, pink text). It is possible that these proteins are not required for DNA replication
from latent episomes but are packaged by the virus and act to replicate viral DNA after
infection. Similarly, genes involved in DNA repair and nucleotide metabolism are also
split into two groups (Figure 4.3, blue text); ORFs 2, 46, 61 and 70 are expressed quite
early with genes such as primase and processivity factor while ORFs 21, 36, 37 and 54
are expressed later with structural genes. Therefore, the requirement for genes with
functions in this class may be split between initial DNA replication and subsequent DNA
maturation and packaging. Such data are consistent with the alkaline exonuclease of
HSV-1, which is dispensable for DNA replication but is required for DNA maturation
(Martinez et al, 1996).
Viral homologues of cellular regulatory or signal transduction proteins are primary or
secondary lytic genes (Figure 4.3, orange text). Of these, the secondary lytic genes
(vMlP-111, vlRFs and complement binding protein) are all thought to interact with the
host immune system. Of particular interest is the relationship between the expression of
the three macrophage inflammatory protein homologues vMlP-1, 11 and 111. vMlP-1 and
11 are closely related and are thought to have evolved by gene duplication within the
virus genome (Boshoff et al, 1997). vMlP-111 is more distantly related and is probably
derived independently from another member of the CC chemokine family (Russo et al,
1996, Neipel et al, 1997). vMlP-1 and 11 are both primary lytic genes whereas vMlP-111
is separated from the other two in the secondary lytic gene cluster. Thus the array data
suggest that these genes are also differentially regulated at the level of transcription and
may have distinct functions in the virus life cycle.
The expression patterns of the lytic genes correlate well with previously published
northern blot analyses. The primary lytic genes ssDBP, vlL-6, K5, T l.l, ORF 45, Zta,
ORF 57 and vMlP-11 have previously been shown to be expressed between 4 and 13
hours after induction (Nicholas et al, 1997a, Lukac et al, 1999, Sun et al, 1999, Zhu et
al, 1999a, Wang et al, 2002). Of the 13 hitherto identified early genes (Table 4.1), 9 are
primary lytic genes and 3 secondary lytic genes. Protease/assembly protein (ORF 17)
(Unal et al, 1997), packaging protein (ORFs 29 a and b) (Renne et al, 1996b) and
sVCA (ORF 65) (Lin et al, 1997a, Sun et al, 1999), all late genes, are all classified as
secondary or tertiary lytic genes by the array. Similarly, most of the secondary lytic
genes and all of the tertiary lytic genes have been classified as being class 111 transcripts
(Sarid et al, 1998).
211
A decrease in the abundance of early gene transcripts 48 hours after induction has also
been reported (Sun et al., 1999). However, the array results indicate that these transcripts
remain constant or continue to accumulate during lytic replication. In the study of Sun et
al. (1999), RNA loading controls suggest that the apparent decrease in the expression of
KSHV genes may be due to a progressive reduction in the total amount of RNA present
after induction. Consistent with this, late time points after induction showed a decrease in
the amount of total RNA extracted from equal amounts of cells and an additional
decrease in the absolute amount of all cellular mRNAs hybridising to the arrays. This is
most likely due to the induction of apoptosis during lytic replication (Table 5.1) and
virus-induced shut down of cellular genes (Sarid et al, 1997). To maintain similar levels
of hybridisation on the arrays, greater amounts of total RNA were used in the cDNA
synthesis reaction and data were discarded from any array where the housekeeping gene
signal was more than 3-fold different from the mean level across all arrays.
4.3.3 A com parison with the KSHV array study of Pauiose-M urphy etal.After this study was completed, a microarray analysis of KSHV gene expression was
published (Paulose-Murphy et al, 2001). Similar to the KSHV array presented in this
thesis, this microarray contained PCR-amplified probes for all KSHV ORFs. Gene
expression was measured at a number of timepoints after induction of lytic replication in
the PEL cell line BCBL-1 with TPA. The results of the two studies agree in a number of
different areas. Both studies find that Zta, ORF 45 and ORF 57 are all expressed early,
consistent with their presumed roles in regulating gene expression. ORFs 10, 11, 58 and
67, are all expressed by 10 hours post-induction in both analyses, suggesting that their
products also act during the earliest stages of viral replication. Paulose-Murphy et al,
(2001) also find that all the DNA replication genes are expressed early except for ORFs
40, 41 and 44, and that thymidine kinase (ORF 21) and deoxyuridine triphosphatase
(dUTPase, ORF 54) are expressed later than other nucleotide metabolism genes. Both
also reveal that the vIRFs and complement binding protein (ORF 4) are expressed later
than other host gene homologues, suggesting roles during the latter stages of virus
replication. The main difference between the two studies is the absence of a clear
division of lytic genes into three classes from the expression patterns of Paulose-Murphy
et al, (2001). This may be a result of the methodology of the Paulose-Murphy study. The
reference sample for the microarray hybridisations was derived from uninduced BCBL-1
212
cells. As KSHV does not express lytic genes in the majority of these cells, the low signal
to background ratio of the denominator could generate expression ratios that are prone to
error.
4.3.4 vIRFs have complex expression patterns
The discovery of K10.7, a novel ORF that is spliced to K10.5, revealed that KSHV
encodes four genes with homology to cellular IRFs. Concurrently with this work,
KlO.5/10.7 was also discovered by two other groups and named vIRF-3 (Lubyova and
Pitha, 2000) and LANA2 (Rivas et al, 2001). Similar to vIRF-1 and vIRF-2 (section
1.2.9.2), vIRF-3 inhibits host IRF-mediated transcriptional activation (Lubyova and
Pitha, 2000). vIRF-3 also blocks p53-mediated apoptosis (Rivas et al, 2001), a property
shared with vIRF-1 (Nakamura et al, 2001). These functional studies therefore support
the sequence-based annotation of this gene as a vIRF (Figure 4.9). However, these
studies disagree on the expression pattern of vIRF-3. Although Lubyova and Pitha,
(2000) and Paulose-Murphy et al, (2001) concur with the data presented here that vIRF-
3 is induced upon lytic replication in PEL, Rivas et al provide data showing that it is a
class I latent gene and that vIRF-3 protein is present in all PEL cells in vitro and in vivo
and in MCD plasmablasts. The authors could not detect vIRF-3 in KS suggesting it
forms a part of an alternative KSHV latency programme. vIRF-3 has also been classified
as a class I transcript using real-time PCR (Fakhari and Dittmer, 2002).
A further inconsistency exists for vIRF-2. Burysek and Pitha, (2001) were unable to
confirm splicing to K ll and found that vIRF-2 protein is expressed during latency in the
PEL cell line BCBL-1. An explanation for these discrepancies may be that KSHV is able
to select from a library of vIRFs during latency depending on the cell type or the
particular anti-viral response of the cell. Although the expression of vIRF-3 is induced
during lytic replication in BC-3 cells, it appears to remain fairly constant in HBL-6
(Figure 4.12). The gene structure of the spliced vIRFs is striking; the 5’ exon encodes the
N-terminal DNA binding domain and the 3’ exon the C-terminal interaction domain
(Figure 4.9). It seems likely that the separation of these two functional domains into
different exons allows the virus to alter protein function through alternative splicing.
This would explain the alternative splicing of KIO to remove the KlO.l-encoded DNA
binding domain (Figure 4.11) and vIRF-2 lacking the Kll-encoded interaction domain
(Burysek and Pitha, 2001).
213
4.3.5 Transcript mapping using DNA arrays
Many array probes that are from adjacent genes on the genome also appear to be
clustered in the vicinity of one another on the array. This may represent the detection of
overlapping transcriptional units where one ORF overlaps with the 3’ untranslated region
of the transcript from a neighbouring ORF. An example of such an event is the extension
of K15 transcripts through K14.1 and ORF75 (Glenn et al, 1999). In order to minimise
detection of such presumably non-coding transcripts, cDNA synthesis was primed with
sense-strand specific primers (section 2.5.5). The correlation between genomic location
and expression could also be due to probes detecting spliced or polycistronic transcripts
or due to co-regulation of genes by common or related promoters. An example of a
polycistronic transcript whose component genes cluster in terms of expression are the
latent genes LNA-1, v-cyclin and v-FLIP. Probe H, located next to these genes, shares
the same expression pattern suggesting that it may be transcribed from the same
promoter. Examples of spliced ORFs sharing expression profiles are the different exons
of KI5, ORFs 29a and 29b and, as shown here, K ll and vIRF-2. Figure 4.13 presents a
summary showing the location of genes belonging to each expression class. This map
indicates other areas of the KSHV genome where more detailed transcript mapping
would help discriminate between non-coding transcriptional read-through events,
polycistronic transcripts, splicing and shared promoters.
214
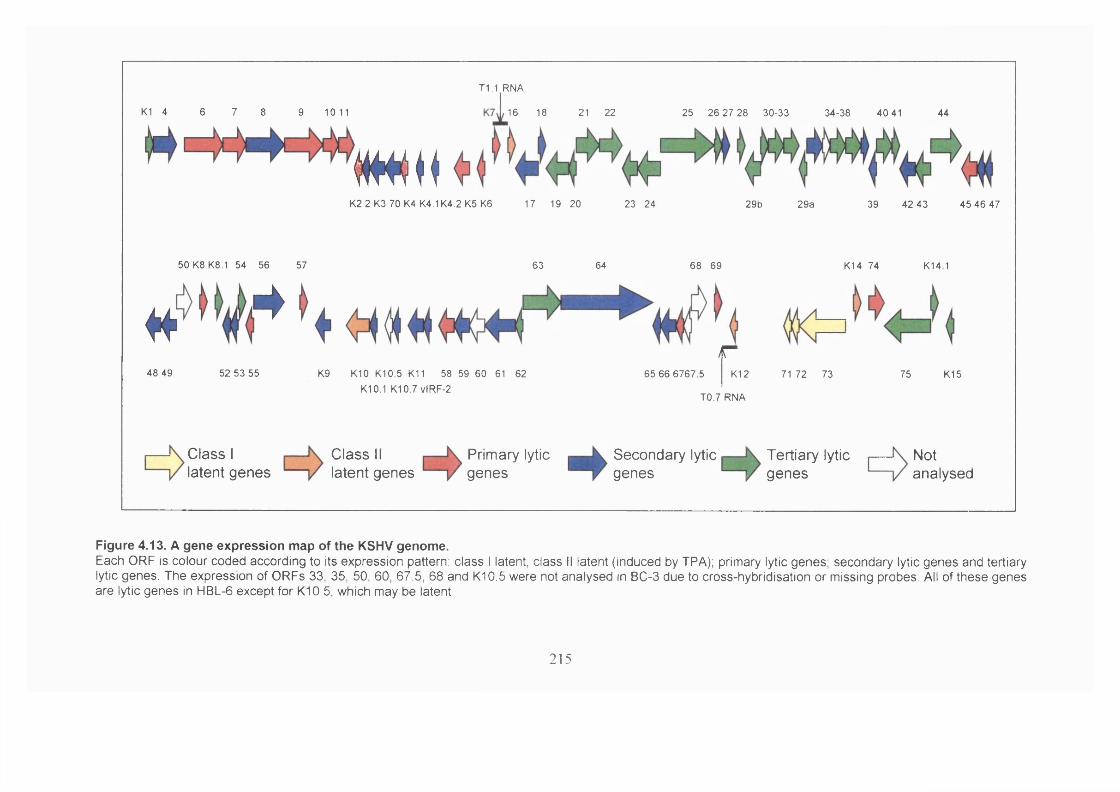
T1.1 RNA
K1 4 6 7 8 9 10 11 16 18 21 22 25 26 27 28 30-33 34-38 40 41 44
M M
50K 8K 8.1 54 56 57
K2 2K 3 70 K 4K 4.1K 4.2K 5 K6 17 19 20 23 24
63 64
4.4
48 49 52 53 55 K9 KIO K10.5 K ll 58 59 60 61 62
K10.1 K10.7 vlRF-2
Class I latent genes
Class II latent genes
Primary lytic genes
68 69
29b 29a 39 42 43 45 46 47
K14 74 K14.1
r ,65 66 6767.5 K12 71 72 73
T0.7 RNA
Secondary lytic Tertiary lyticgenes genes
75 K15
Notanalysed
Figure 4.13. A gene expression map of the KSHV genome.Each ORF is colour coded according to its expression pattern: class I latent, class II latent (induced by TPA); primary lytic genes; secondary lytic genes and tertiary lytic genes. The expression of ORFs 33, 35, 50, 60, 67.5, 68 and K10.5 were not analysed in BC-3 due to cross-hybridisation or missing probes. All of these genes are lytic genes in HBL-6 except for K10.5, which may be latent.
215
4 . 4 S u m m a r y o f C h a p t e r 4
1. DNA arrays are highly suited to the analysis of herpesvirus gene expression.
2. A small number of genes are expressed during latency in the PEL cell line BC-3.
These include the class II genes T0.7/kaposin, KIO and vOX-2.
3. Different PEL samples contain different proportions of spontaneously lytic cells.
4. KSHV lytic replication proceeds through a highly regulated programme of lytic gene
expression, with genes of similar function being co-ordinately expressed.
5. DNA arrays can predict the organisation and function of virus genes, revealing that
KSHV encodes four genes with homology to full-length IRFs.
6. KIO is alternatively spliced during latency and lytic replication.
7. K3 and K5 are homologues of human genes.
8. The KSHV genome contains blocks of co-regulated genes.
216
Chapter 5
Host gene expression in PEL
5.1 1 n t r o d u c t i o n
PEL is an unusual and rare B-cell malignancy most often observed in individuals with
AIDS (section 1.2.5.2). The tumour normally manifests as malignant effusions in the
pleural, pericardial or peritoneal cavities in the absence of a significant tumour mass.
PEL cells are able to grow in soft agar and form lymphomatous effusions in SCID mice
(Boshoff et al, 1998) demonstrating the cells are transformed. All cases of PEL contain
KSHV and around 70% of cases are also infected with EBV. The lack of any common
chromosomal abnormality in PEL suggests KSHV is directly responsible for
pathogenesis, with EBV behaving as a co-factor. The presence of clonal Ig
rearrangements in PEL is indicative of an origin from B-cells (Knowles et al, 1989).
KSHV is associated with an additional B-cell disorder, plasmablastic MCD (section
1.2.5.3).
The majority of the EBV life cycle occurs in B-cells (section 1.1.2). EBV-associated B-
cell lymphomas are presumed to arise as a consequence of EBV-activation of memory B-
cell development. Therefore, although rare compared with KS, the presence of KSHV in
B-cell lymphomas is highly significant, suggesting that KSHV may also employ B-cells
to complete its life cycle. This is supported by the detection of KSHV in peripheral blood
B-cells of individuals with KS (section 1.2.6). However, how KSHV interacts with B-
cell development, and how this relates to lymphomagenesis, are largely unknown. The
presentation of PEL as an effusion in the body cavities is also poorly understood. PEL
cells express epithelial membrane antigen (EMA, also known as mucin 1 (MUC-1))
(Cesarman et al, 1995b, Carbone et al, 1997, Boshoff et al, 1998, Carbone et al,
1998a), which may be involved in metastasis (Makiguchi et al, 1996). PEL cells do not
express adhesion and lymphoid tissue homing molecules observed on other B-cell
tumours (Boshoff et al, 1998).
B-cell tumours retain many of the characteristics of the stage of B-cell development from
which they derive (section 1.1.3). In addition, transformation often occurs through
mechanisms of normal B-cell development. Therefore the stage of B-cell development
217
represented by PEL has implications for both disease pathogenesis and the KSHV life
cycle. In the majority of instances, PEL is thought to represent transformation of a post-
GC B-cell (reviewed in Cesarman and Knowles, 1999). In most cases, PEL cells express
CD38 (Nador et al, 1996, Carbone et al, 1997, Boshoff et al, 1998), CD7I (Ansari et
al, 1996, Nador et al, 1996), CD138 (syndecan-1) (Carbone et al, 1997, Gaidano et al,
1997, Carbone et al, 1998a) and 1RF4 (multiple myeloma oncogene 1 (MUMl))
(Carbone et al, 2000b), which are all associated with late stages of B-cell differentiation.
However, CD 138 is also expressed on GC and pre-B-cell derived cell lines (Drexler,
2001). PEL does not express the B-cell markers CD 10, CD 19, CD20 and CD22
(Cesarman et al, 1995a, Cesarman et al, 1995b, Arvanitakis et al, 1996, Carbone et al,
1997, Boshoff et al, 1998). Most cases exhibit mutated Vh and Vl genes whose
sequences show evidence for selection by antigen (Matolcsy et al, 1998, Fais et al,
1999). However some cases, such as the PEL cell line BC-3, have germline Vh
sequences indicating that it has a pre-GC origin. PEL may therefore represent
transformation of B-cells at different stages of ontogeny (Matolcsy et al, 1998). While
most cases of PEL have functional Ig gene rearrangements and express Ig mRNA
(Matolcsy et al, 1998, Fais et al, 1999) most do not express Ig protein (Cesarman and
Knowles, 1999). Therefore, the exact stage of B-cell development at which PEL is
arrested is uncertain.
DNA array analysis of B-cell lymphoma gene expression has revealed the stages of B-
cell development from which they derive and suggested mechanisms responsible for
their pathogenesis (sections 1.1.3 and 1.3.5). The aims of this chapter are to use the
KSHV-human microarray (section 3.2.2) to find the stage of B-cell development from
which PEL is derived and to investigate whether PEL gene expression can explain the
unusual pathology of this tumour.
218
5.2 Results
5.2.1 Sam ple preparation
Gene expression of 5 PEL cell lines was compared to 19 other B-cell tumour-derived cell
lines. These were chosen to encompass a wide range of malignancies and stages of B-cell
development. The cell lines include those derived from EBV-infected BL and those
established by in vitro infection by EBV. The cell lines used are listed along with their
derivation in Table 2.2 (section 2.2). In addition, cells taken from lymphomatous
effusions presented by two AIDS patients with KS were analysed. To minimise
experimental variation, all cells were grown under the same conditions (with two
exceptions; section 2.2). Cell density and viability at the time of sampling was recorded
(Table 5.1). The cell lines BC-3 and BCBL-1 were grown from frozen stocks on a
number of separate occasions (indicated by roman numerals). These acted as controls to
determine the variations in gene expression due to inherent biological variability (section
B.2.2.4). Total RNA was purified from all samples and the quality assessed by agarose
gel electrophoresis (Figure 5.1). From this, mRNA was purified and labelled with Cy5
by RT-PCR. Labelled cDNA was mixed with Cy3-labelled reference RNA and
hybridised to the KSHV-human microarray. A common reference RNA mixture was
used to enable comparison across the whole sample set (section 3.2.2.3).
219
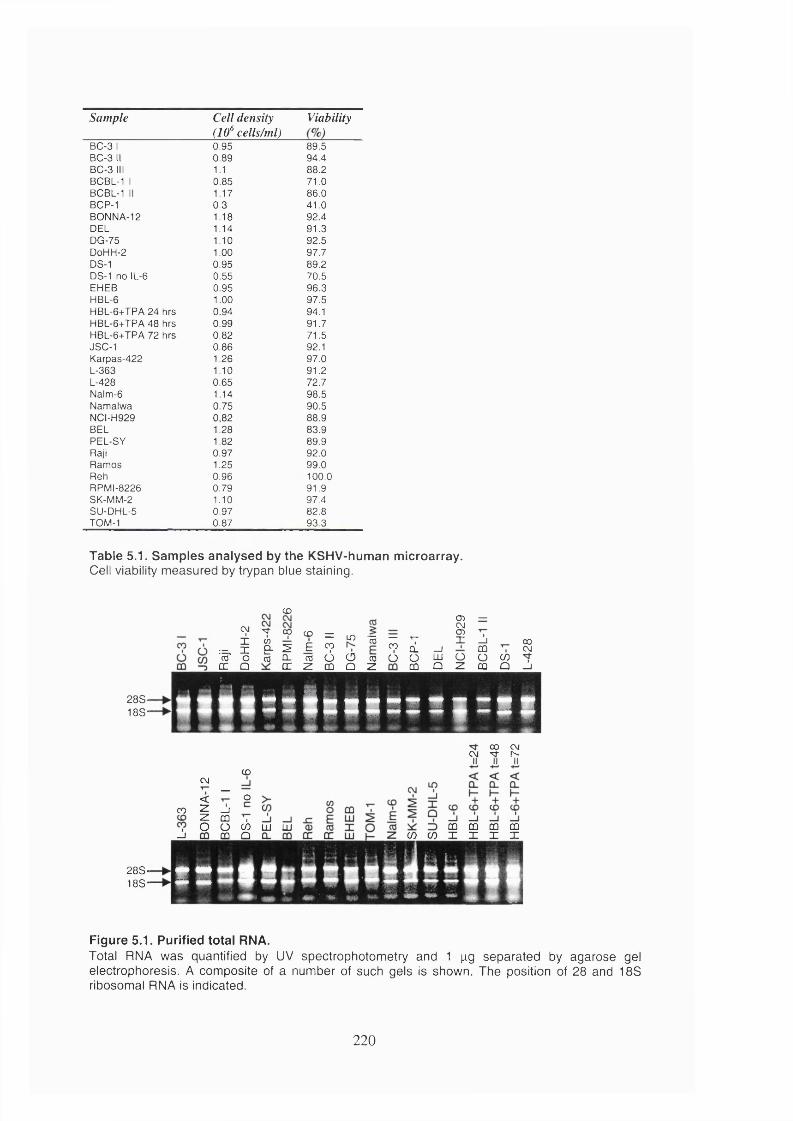
Sample Cell density (10^ cells/ml)
Viability
BC-3 1 0.95 89.5BC-3 11 0.89 94.4BC-3 III 1.1 88.2BCBL-1 1 0.85 71.0BCBL-1 II 1.17 86.0BCP-1 0.3 41.0BONNA-12 1.18 92.4DEL 1.14 91.3DG-75 1.10 92.5DoHH-2 1.00 97.7DS-1 0.95 89.2DS-1 no IL-6 0.55 70.5EHEB 0.95 96.3HBL-6 1.00 97.5HBL-6+TPA 24 hrs 0.94 94.1HBL-6+TPA 48 hrs 0.99 91.7HBL-6+TPA 72 hrs 0.82 71.5JSC-1 0.86 92.1Karpas-422 1.26 97.0L-363 1.10 91.2L-428 0.65 72.7Nalm-6 1.14 98.5Namaiwa 0.75 90.5NCI-H929 0,82 88.9BEL 1.28 83.9PEL-SY 1.82 89.9Raji 0.97 92.0Ramos 1.25 99.0Reh 0.96 100.0RPMI-8226 0.79 91.9SK-MM-2 1.10 97.4SU-DHL-5 0.97 82.8TOM-1 0.87 93.3
Table 5.1. Samples analysed by the KSHV-human microarray.Cell viability measured by trypan blue staining.
CD
2 8 S -18S-
CÇJ1
Î CO• — I 2 -'cc ' o cODC Û
? CO =
^ E 90 - TO Ü O CO Ü ÜÛC Z CO o z
ID 15 — T-co
G) —CMœ
^7 I —I CDCL —I CO CMÜ LU Ü Ü C/DCO Q Z CO Q _ j
s f | R i a = z s | = B f
00 c \jc \j T f rs.
CM
<—
CD
O
CO z _ jz COo Ü (h
_ i CO Q
2 8 S -18S- I S
CO DO CO CD I I I I
LU UJW C/5
Figure 5.1. Purified total RNA.Total RNA was quantified by UV spectrophotometry and 1 pg separated by agarose gel electrophoresis. A composite of a number of such gels is shown. The position of 28 and IBS ribosomal RNA is indicated.
220
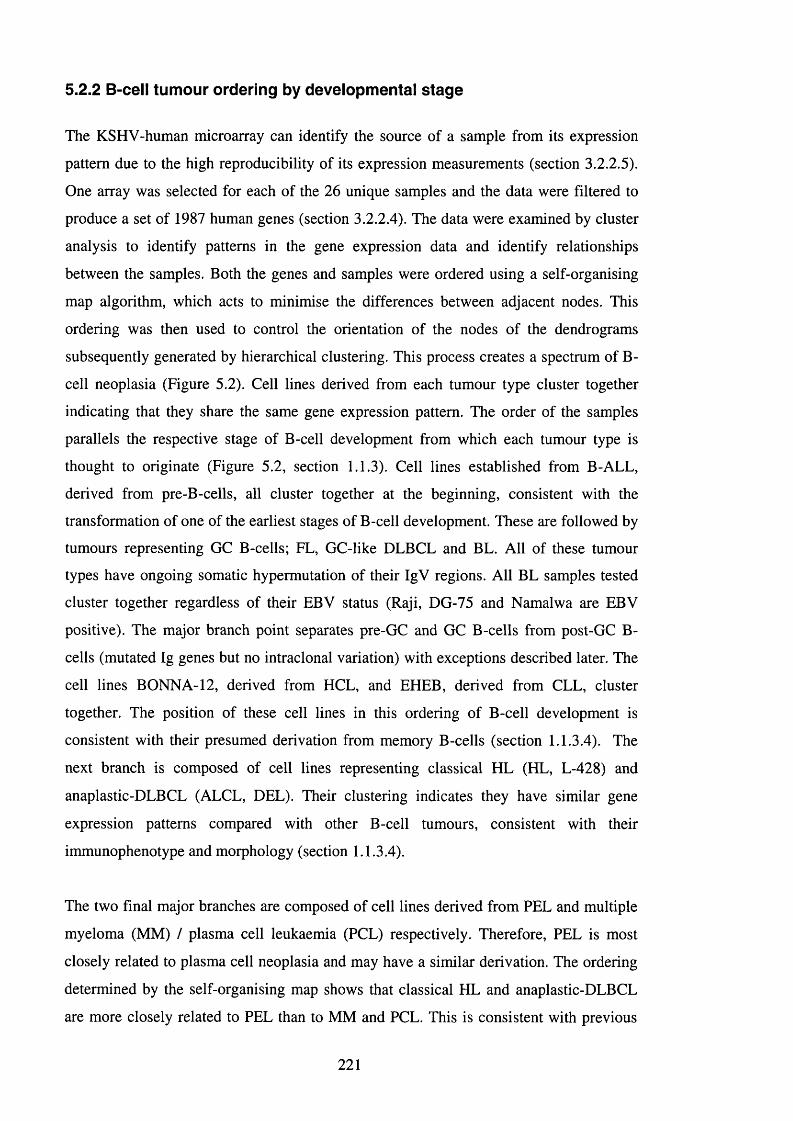
5.2.2 B-cell tumour ordering by developmental stage
The KSHV-human microarray can identify the source of a sample from its expression
pattern due to the high reproducibility of its expression measurements (section 3.2.2.5).
One array was selected for each of the 26 unique samples and the data were filtered to
produce a set of 1987 human genes (section 3.2.2.4). The data were examined by cluster
analysis to identify patterns in the gene expression data and identify relationships
between the samples. Both the genes and samples were ordered using a self-organising
map algorithm, which acts to minimise the differences between adjacent nodes. This
ordering was then used to control the orientation of the nodes of the dendrograms
subsequently generated by hierarchical clustering. This process creates a spectrum of B-
cell neoplasia (Figure 5.2). Cell lines derived from each tumour type cluster together
indicating that they share the same gene expression pattern. The order of the samples
parallels the respective stage of B-cell development from which each tumour type is
thought to originate (Figure 5.2, section 1.1.3). Cell lines established from B-ALL,
derived from pre-B-cells, all cluster together at the beginning, consistent with the
transformation of one of the earliest stages of B-cell development. These are followed by
tumours representing GC B-cells; FL, GC-like DLBCL and BL. All of these tumour
types have ongoing somatic hypermutation of their IgV regions. All BL samples tested
cluster together regardless of their EBV status (Raji, DG-75 and Namaiwa are EBV
positive). The major branch point separates pre-GC and GC B-cells from post-GC B-
cells (mutated Ig genes but no intraclonal variation) with exceptions described later. The
cell lines BONNA-12, derived from HCL, and EHEB, derived from CLL, cluster
together. The position of these cell lines in this ordering of B-cell development is
consistent with their presumed derivation from memory B-cells (section 1.1.3.4). The
next branch is composed of cell lines representing classical HL (HL, L-428) and
anaplastic-DLBCL (ALCL, DEL). Their clustering indicates they have similar gene
expression patterns compared with other B-cell tumours, consistent with their
immunophenotype and morphology (section 1.1.3.4).
The two final major branches are composed of cell lines derived from PEL and multiple
myeloma (MM) / plasma cell leukaemia (PCL) respectively. Therefore, PEL is most
closely related to plasma cell neoplasia and may have a similar derivation. The ordering
determined by the self-organising map shows that classical HL and anaplastic-DLBCL
are more closely related to PEL than to MM and PCL. This is consistent with previous
221
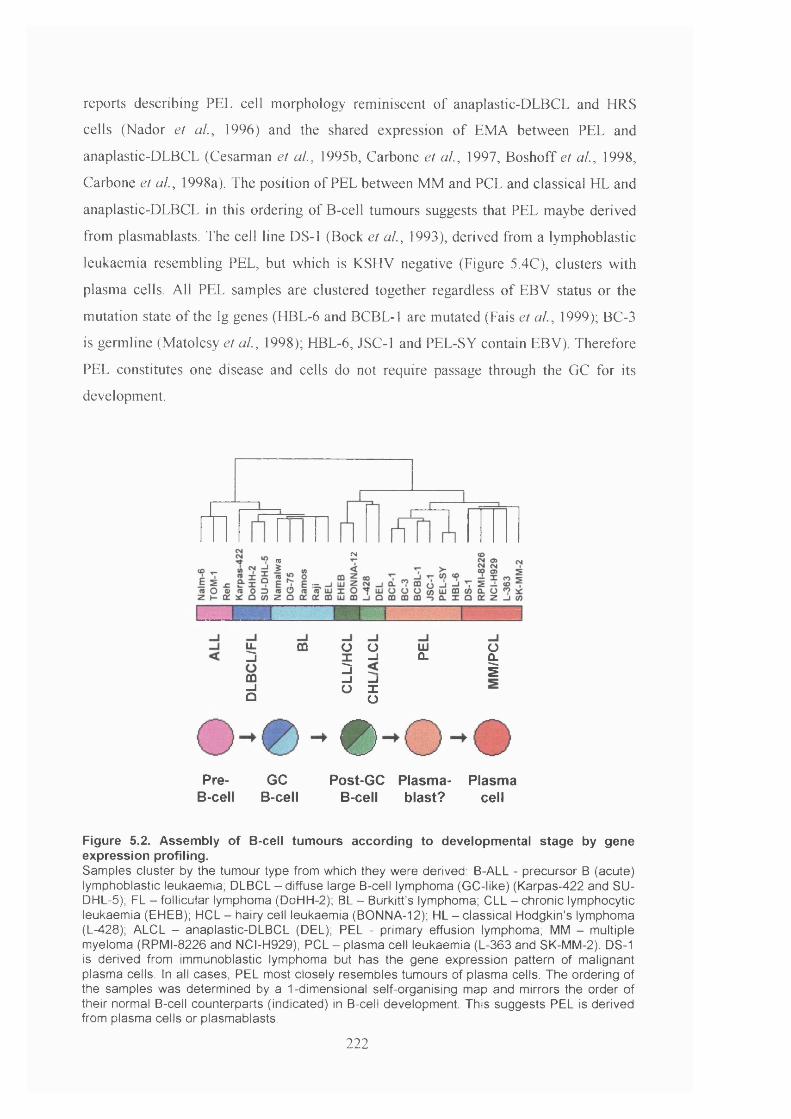
reports describing PEL cell morphology reminiscent of anaplastic-DLBCL and HRS cells (Nador et al, 1996) and the shared expression of EMA between PEL and
anaplastic-DLBCL (Cesarman et al., 1995b, Carbone et ai, 1997, Boshoff et al, 1998,
Carbone et ai, 1998a). The position of PEL between MM and PCL and classical HL and
anaplastic-DLBCL in this ordering of B-cell tumours suggests that PEL maybe derived
from plasmablasts. The cell line DS-1 (Bock et al., 1993), derived from a lymphoblastic
leukaemia resembling PEL, but which is KSHV negative (Figure 5.4C), clusters with
plasma cells. All PEL samples are clustered together regardless of EBV status or the
mutation state of the Ig genes (HBL-6 and BCBL-1 are mutated (Fais et al., 1999); BC-3
is germline (Matolcsy et al., 1998); HBL-6, JSC-1 and PEL-SY contain EBV). Therefore
PEL constitutes one disease and cells do not require passage through the GC for its development.
CMCO
W: m o o UJZj X j q.m 3 Zj
" 3
01
0Pre- GC Post-GC Plasma- Plasma
B-cell B-cell B-cell blast? cell
Figure 5.2. Assembly of B-cell tumours according to developmental stage by gene expression profiling.Samples cluster by the tumour type from which they were derived: B-ALL - precursor B (acute) lymphoblastic leukaemia; DLBCL - diffuse large B-cell lymphoma (GC-like) (Karpas-422 and SU- DHL-5); FL - follicular lymphoma (DoHH-2), BL - Burkitfs lymphoma; CLL - chronic lymphocytic leukaemia (EHEB); HCL - hairy cell leukaemia (BONNA-12); HL - classical Hodgkin’s lymphoma (L-428); ALCL - anaplastic-DLBCL (DEL); PEL - primary effusion lymphoma; MM - multiple myeloma (RPMI-8226 and NCI-H929); PCL - plasma cell leukaemia (L-363 and SK-MM-2). DS-1 is derived from immunoblastic lymphoma but has the gene expression pattern of malignant plasma cells. In all cases, PEL most closely resembles tumours of plasma cells. The ordering of the samples was determined by a 1-dimensional self-organising map and mirrors the order of their normal B-cell counterparts (indicated) in B-cell development. This suggests PEL is derived from plasma cells or plasmablasts.
222
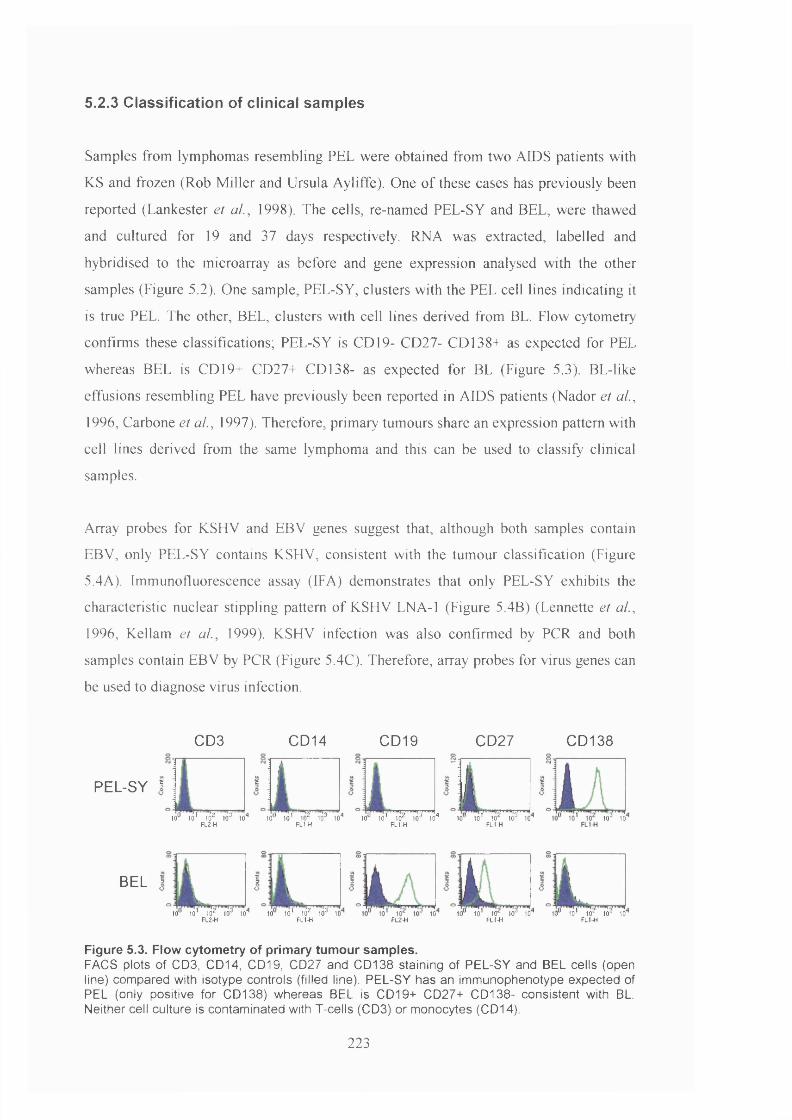
5.2.3 Classification of clinical samples
Samples from lymphomas resembling PEL were obtained from two AIDS patients with
KS and frozen (Rob Miller and Ursula Ayliffe). One of these cases has previously been
reported (Lankester et ai, 1998). The cells, re-named PEL-SY and BEL, were thawed
and cultured for 19 and 37 days respectively. RNA was extracted, labelled and
hybridised to the microarray as before and gene expression analysed with the other
samples (Figure 5.2). One sample, PEL-SY, clusters with the PEL cell lines indicating it
is true PEL. The other, BEL, clusters with cell lines derived from BL. Flow cytometry
confirms these classifications; PEL-SY is CD 19- CD27- CD 138+ as expected for PEL
whereas BEL is CD 19+ CD27+ CD!38- as expected for BL (Figure 5.3). BL-like
effusions resembling PEL have previously been reported in AIDS patients (Nador et al.,
1996, Carbone et ai, 1997). Therefore, primary tumours share an expression pattern with
cell lines derived from the same lymphoma and this can be used to classify clinical
samples.
Array probes for KSHV and EBV genes suggest that, although both samples contain
EBV, only PEL-SY contains KSHV, consistent with the tumour classification (Figure
5.4A). Immunofluorescence assay (IFA) demonstrates that only PEL-SY exhibits the characteristic nuclear stippling pattern of KSHV LNA-1 (Figure 5.4B) (Lennette et a!.,
1996, Kellam et ai, 1999). KSHV infection was also confirmed by PCR and both
samples contain EBV by PCR (Figure 5.4C). Therefore, array probes for virus genes can
be used to diagnose virus infection.
CDS CD14 CD19 CD27 CD138
PEL-SY 1
10° t o ' 10^ 10° lo '* 10° 1 o ’ 10° 10° 10^ 10° l o ' 1 0 ° 10° 10“* 1 0 ° 1 o ' 10° 10° 10FL2-H FL1-H FLI-H FLI-H
10-' 10
BEL
10 10 10° 10 10 10 10' 10° 10° 10 FL2-H FLI-H
10 10 10 10 10" 10 10 10 10" 10" 10FL2-H FLI-H FL -H
Figure 5.3. Flow cytometry of primary tumour samples.FACS plots of CDS, CD14, CD19, CD27 and CD138 staining of PEL-SY and BEL cells (open line) compared with isotype controls (filled line). PEL-SY has an immunophenotype expected of PEL (only positive for CD138) whereas BEL is CD19+ CD27+ CD138- consistent with BL. Neither cell culture is contaminated with T-cells (CD3) or monocytes (CD14).
223
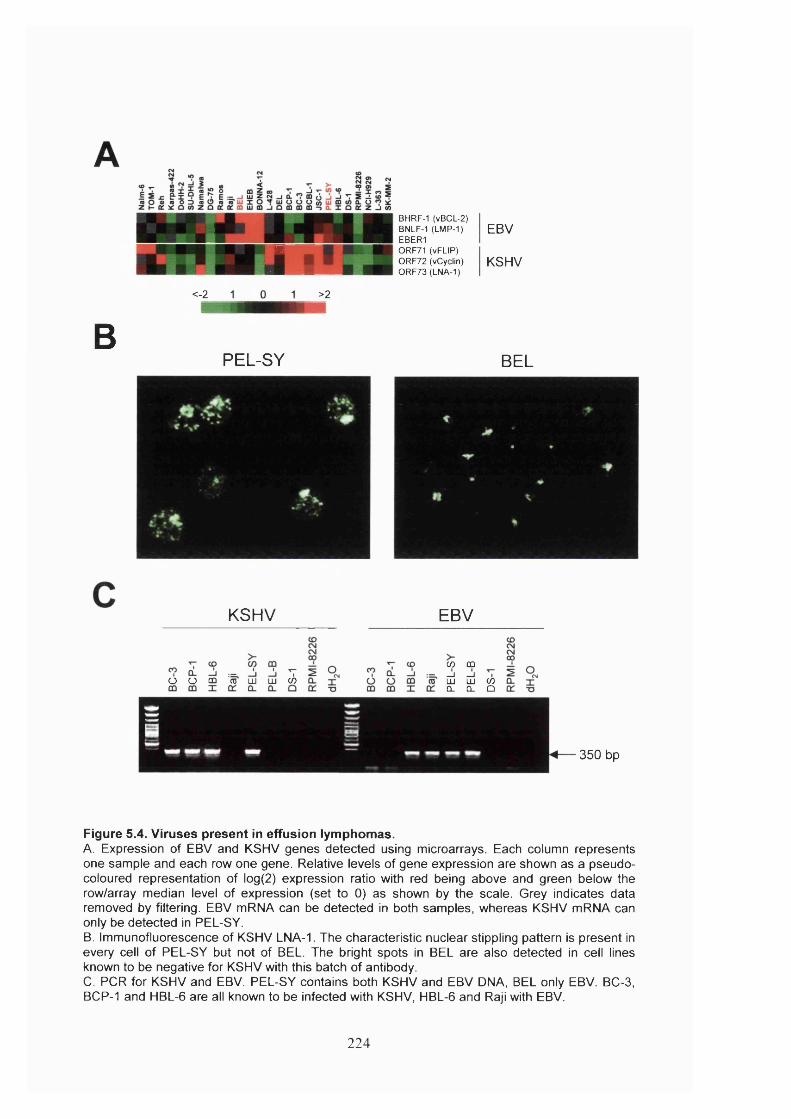
rj
BHRF-1 (vBCL-2) BNLF-1 (LMP-1) EBER1ORF71 (vFLIP) O RF72 (vCyclin) O RF73 (LNA-1)
EBV
KSHV
<-2 >2
BPEL-SY BEL
KSHV EBV
(/) 00o o Oû ro LU LU co LU LU CO
CL CL Q
350 bp
Figure 5.4. Viruses present in effusion lymphomas.A. Expression of EBV and KSHV genes detected using microarrays. Each column represents one sample and each row one gene. Relative levels of gene expression are shown as a pseudocoloured representation of log(2) expression ratio with red being above and green below the row/array median level of expression (set to 0) as shown by the scale. Grey indicates data removed by filtering. EBV mRNA can be detected in both samples, whereas KSHV mRNA can only be detected in PEL-SY.B. Immunofluorescence of KSHV LNA-1. The characteristic nuclear stippling pattern is present in every cell of PEL-SY but not of BEL. The bright spots in BEL are also detected in cell lines known to be negative for KSHV with this batch of antibody.C. PCR for KSHV and EBV. PEL-SY contains both KSHV and EBV DNA. BEL only EBV. BC-3, BCP-1 and HBL-6 are all known to be infected with KSHV, HBL-6 and Raji with EBV.
224
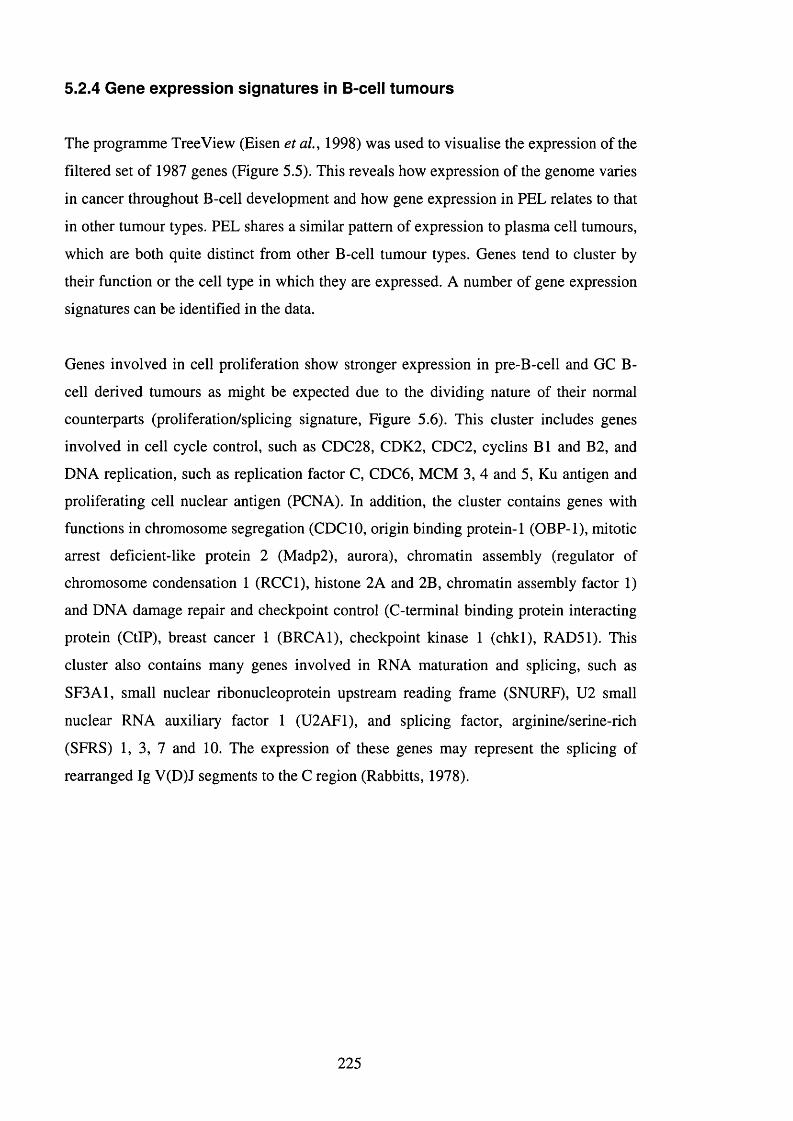
5.2.4 Gene expression signatures In B-cell tumours
The programme Tree View (Eisen et al, 1998) was used to visualise the expression of the
filtered set of 1987 genes (Figure 5.5). This reveals how expression of the genome varies
in cancer throughout B-cell development and how gene expression in PEL relates to that
in other tumour types. PEL shares a similar pattern of expression to plasma cell tumours,
which are both quite distinct from other B-cell tumour types. Genes tend to cluster by
their function or the cell type in which they are expressed. A number of gene expression
signatures can be identified in the data.
Genes involved in cell proliferation show stronger expression in pre-B-cell and GC B-
cell derived tumours as might be expected due to the dividing nature of their normal
counterparts (proliferation/splicing signature, Figure 5.6). This cluster includes genes
involved in cell cycle control, such as CDC28, CDK2, CDC2, cyclins B1 and B2, and
DNA replication, such as replication factor C, CDC6, MCM 3, 4 and 5, Ku antigen and
proliferating cell nuclear antigen (PCNA). In addition, the cluster contains genes with
functions in chromosome segregation (CDCIO, origin binding protein-1 (OBP-1), mitotic
arrest deficient-like protein 2 (Madp2), aurora), chromatin assembly (regulator of
chromosome condensation 1 (RCCl), hi stone 2A and 2B, chromatin assembly factor 1)
and DNA damage repair and checkpoint control (C-terminal binding protein interacting
protein (CtIP), breast cancer 1 (BRCAl), checkpoint kinase 1 (chkl), RAD51). This
cluster also contains many genes involved in RNA maturation and splicing, such as
SF3A1, small nuclear ribonucleoprotein upstream reading frame (SNURF), U2 small
nuclear RNA auxiliary factor 1 (U2AF1), and splicing factor, arginine/serine-rich
(SFRS) 1 , 3 , 7 and 10. The expression of these genes may represent the splicing of
rearranged Ig V(D)J segments to the C region (Rabbitts, 1978),
225
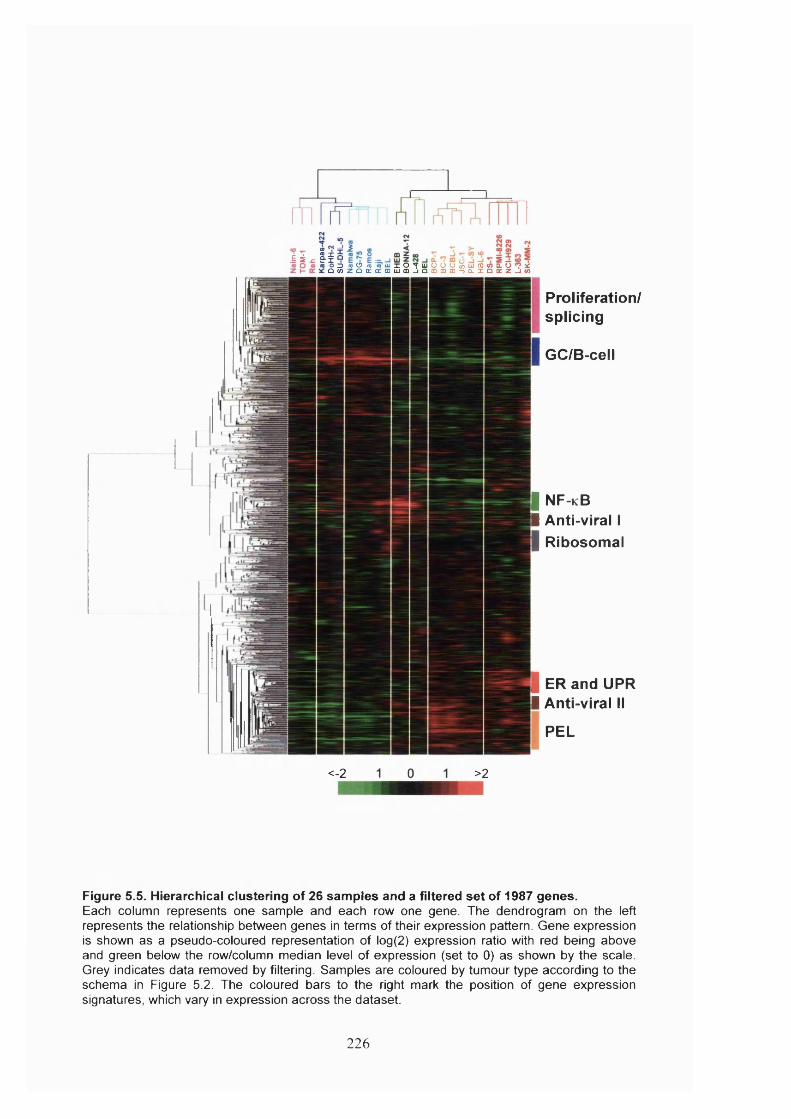
à à A■ -I i
5O Z) ( o O (Q « t Ü X O ^ U i O U U ^ U J C D ( 0 Q . U * ? ^ O(AZOù:û:mwm_iommm-)a.%OQ:z_i(0
Proliferation/splicing
GC/B-cell
I N F-k BII Anti-viral I I Ribosomal
| | ER and UPR I Anti-viral II
PEL
<-2 >2
Figure 5.5. Hierarchical clustering of 26 samples and a filtered set of 1987 genes.Each column represents one sample and each row one gene. The dendrogram on the left represents the relationship between genes in terms of their expression pattern. Gene expression is shown as a pseudo-coloured representation of log(2) expression ratio with red being above and green below the row/column median level of expression (set to 0) as shown by the scale. Grey indicates data removed by filtering. Samples are coloured by tumour type according to the schema in Figure 5.2. The coloured bars to the right mark the position of gene expression signatures, which vary in expression across the dataset.
226
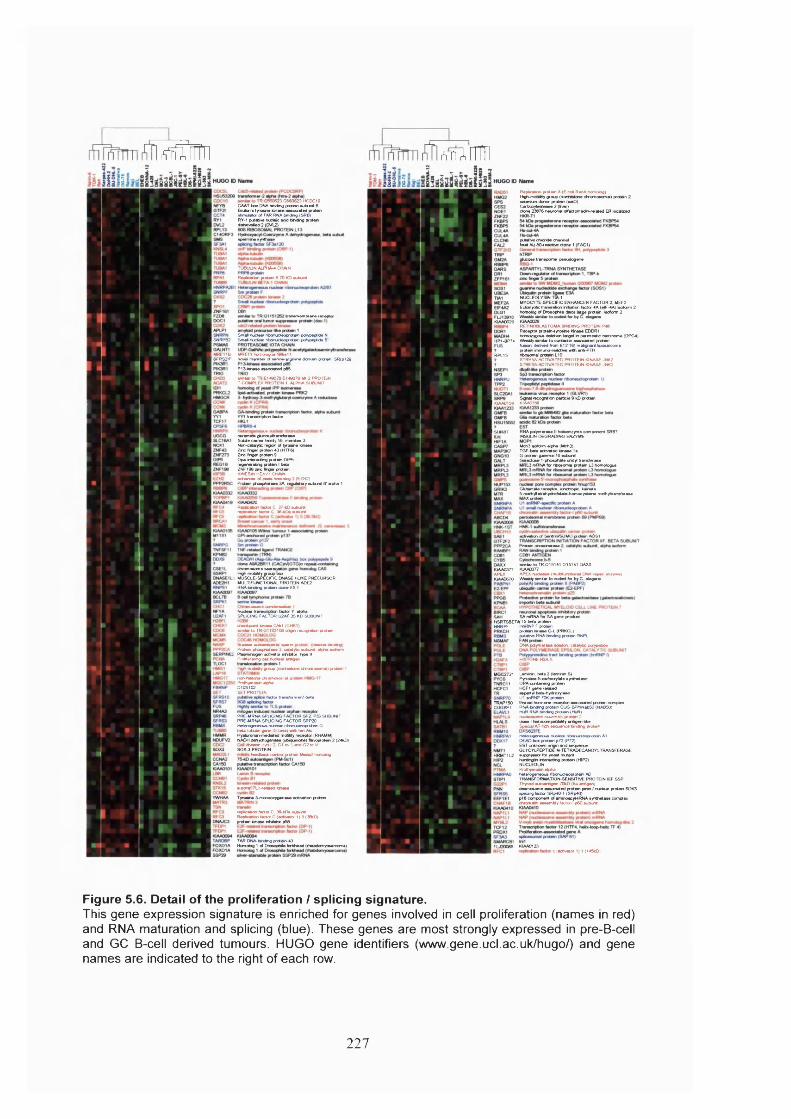
i^nïTfÏÏl
R GS60623 G560623 HCDC10 CAAT-box DNA bmdmg protem euburü B Bfulon'» tynwne tonwee a—onMed proian ibmuMof or TAR RNA Wndng (SR0)RY-1 putabve nudàc aàd bvKing prolan (JahevefcKl 2 (DVL2)
aparmmo syniha»
fiiTïiïïïi
R*plK#on prolan A (E col RocA homolog) High-motally group (nonhalono chromooomW) prolan 2 solomm dona prolan (mIO)CaboxylesiMM 2 (Iva)dora 23876 narrorW dfactomedrvrdaad ER tocdized
puWna cNoTKto channd fold AU-50^ea«i» don# 1 (FAC1)
TUBUUN A tP f ^ CHAIN
RapÉcdan prolmi A 70 KD «ubw#
gkicoM trwapcrtw p#«udogaa
Sm#l nudeor nbonudooprolan pdypspide f.I SNRP62 Sm«« nud«a nbonud#oprolan pdypepide B'
1MRE11B MRE11 nomoiogOisl^ll S F ^ tP novd manba of eam e-ayaie dommr prdaa. SRrp129
Pta^onM# BMOdded pas
am te le TR E1A8079 6148079 MI-2 PROTEIN T-COMPLËX PROTBN 1. ALPHA SUBUMT
I K1AAÛ029 KIAA0Ô29
NUCLEOLYSIN TIA-I MYOCYTE-SPECIFIC ENHANCER FACTOR 2. MEF2 EiAayobc traafobon nb«bon faSa 4A («IF-4A) aoform 2homdog of DmoopM# dma lag# prdein. aoform 2
RETINOBLASTOMA BINDING PROTEIN P4B Rocepta prdoin-lyromme Idnaae EDOR1 homozygou* (Mebon tagel m panaeobc cacmoma (0PC4)
MPI -BP74 W##Wy anËa to cortatoi ##»ocml#d prdanfuaon. dorrvod (ran 1(12.16) miÉgnat lipourcama protom anmurKwamcdv# wih anb-PTH
. RPL15 dwêanal proMn L10STRESS-AC rrVATED PROTEIN MNASE JNK2 STRESS-ACTTVATED PROTEIN WNASE JNK2
S%pal recop ier paW# 9 kO prolanI KWWM59 KIAA01S8
1 tranaaipbon tecta
caratedaÿ^yUranataraM Sou# carrra famiy 16. m«mba 3 Norvoalalyte ra%^ of tyraam# tanaae Zrc finga prdàn 43 (HTF6)Zinc finga prdam 9 Opa-ffiteracbng prdan OIP6 regaraabng prdan I bota ZNF198anc#ngaprdam KWESIN HEAVY CHAIN artvnoa of xaate (MMMèog 2 (EZK2)Prdan phoaphdaa# 2A, ragiiday auburd B" dpha-1
2 # c # 2 ,te c la C . 37-kO«tead mptezmonfaaaC. 384(0# mteun#
Hgh mobitey group box I MUSCLE-SPECIFIC DNASE I-LIKE PRECURSOR
MULTIFUNCTIONAL PROTEIN ADE2 RNA4awftng prolan don# ES 1
Nuctea Iranacnptwn fada Y. alpha SPLICING FACTOR U2AF 36 KD SUBUNIT
chaApoM laMM 0*1 (CW1)amter to TRG1163108 o n ^ racognAai d^am
Prdaà phoaphda## Z caWybc aA ad dpha aoform : Pteeninogen adivwairhibâa, type II
ProNwdxrg oa# nuctea artegan
H^wnotelty group (nonhatane chromo#anal) protem 1
rtorvNaian# cteanoaand p ) Prdhymoeer aiph#
D10S102 SET PROTEIN
lada lrarmform#r24)#te
PrSÜ r NASPUCING factor SFZ P33 SUBUNIT PRE-MRNA SPLICING FACTOR SRP20 Hdaoganaoua nuctea nbonucteoprdan G bcla-tubdri gare (5 beta) «dh tan Alu HyduronarMrradaled molSty racepla (RHAMM)NADH tlehydogenaee (ütaqunona) flavoprdaà 2 (24kD)
daaon cyde Z G1 to S ard G2 to M SOX-3 PROTEIN
c teadba* oorad prot«>n Iitedp2 homdog
auroraflPLI -r«Éd#d Nnm#
Tyrodna 3-morx>oxygan#M acbvabon prdam
m pk^onteda C. 38-kDa auturd Rapteahon fada C (acavMa 1) 3 (38kD) prdein kmasarhddapSS
TAR DNA-btodng prdan-43Homdog 1 d Droaopfate forkhead (rhabdomyoearcoma)
I SURB7 RNA pdymaraae II hdoenryma component SRB7- - INSUUN-DÉGRADING ENZYME
Mch3 aoform alpha (Mch3)TGF-tMia adrveled lonae# la G prdam gamma-IO auburd Galadoa#-1-phoaphata undyl tranafaaaa
■ 3 mRNA fw nboaomal preAan L3 hotrtdogua
Glutemate receptor. wndiopK. kanda 5-n^ytalrdiydrofdale4iarnocydoma melhyltrarefaraae
adrvabon of SardiWSUMO protein AOS1
K am#atoTR01S141 015141 DAXXI K1AAÛ377 K1A )377I APEX APEX ttocteeae (mdUfadtemai DMA tepetr awyme)I KIAAÛ670 W eddyanilalocottedfabyC ategara
, _ _ SA mRNA fa SA gena produdI HSRTSBETATTS baU prdan ] MNRPF HnRNP F prdan
protem Idnaae C-L (PRKCL) piAalive RNA dndng prdan RNPL
DNA pdymaaae epeton. eaafybc pdypdate
HISTONE H2AX
I MGC2721 Lamawi. bda 2 (lamnri S)Pyrrotera-S-caboxylde sydhdaae OPA-contaring prdein HCF1 gene reiaed aapatyl bda rydroxylaee U1 enRNP 70K prdan
I TRAP150 thyroid hormone recapta aaaoeidad prolan complex ICUGBPI RNA-bmtfcrg pndan CUG-BPfhNabSO (NAaSO)
HuR RNA bmdng prdan (teiR) rMCteawme awemdy prdem 2 daaa I halocampabbibty anbgen4*a Sp ^ A T -nch aequence tenctng prdan
Hdaogeneaua nuctea nbonudeofadan Al DEAD-box prolan p72 (P72)EST irtnown ongm and aequence GLYCYLPEPTIDE N-TETRADECANOYLTRANSFERASE
I HRMT1L2 auppreaad for yead mutanthunting ntwadmg prdam (HIP2)NUCLEOUN Prdhymoan alpha hdaogeneoua nbonudeoprdam Aû TRANSFORMATION-SENSmVE PROTEIN lEF SSP Thyrote autoadigan TQkD (Ku anbgan) deemcaome aaaodded prdem péâi / nuctea pro*«<n SOK3 epkcmg te da SRp40-1 (SRp40) pie componerk of adnoecyl-tRNA aynthdeae complex dworrtdn aeeemdy lad ex i p60 eubwd
FUI200B5 K1AA0123c(aandor1)1(145kO|
Figure 5.6. Détail of the proliferation / splicing signature.This gene expression signature is enriched for genes involved in cell proliferation (names in red) and RNA maturation and splicing (blue). These genes are most strongly expressed in pre-B-cell and GC B-cell derived tumours. HUGO gene identifiers (www.gene.ucl.ac.uk/hugo/) and gene names are indicated to the right of each row.
227
The cluster of genes strongly expressed by GC B-cell derived cell lines (GC / B-cell
signature, Figure 5.7) contains genes known to be expressed by this cell type including
GC kinase, jawl and BCL-6. BCL-6 is necessary for GC formation and inhibits plasma
cell development (section 1.1.1.3). This cluster also contains a number of genes that act
in B-cell signalling pathways. Genes include those encoding cell surface proteins, for
example CD79a, CD22, CD45 and CD72, and those which act in downstream signalling
pathways, such as protein kinase A (PKA) and phospholipase C-gamma (PLC-y). Other
genes in this signature, such as CCAAT/enhancer binding protein (C/EBP), E74-like
factor-1 (ELF-1), IL-4 receptor and STAT6 are involved in Ig class switching. Genes
with functions in DNA strand break repair (DNA ligases I and IV, xeroderma
pigmentosum complementation group C (XPCC) and excision repair cross
complementing 3 (ERCC3)) and somatic hypermutation (DNA polymerase eta) are also
in this cluster. These genes therefore represent the three mechanisms of Ig diversification
that occur in GC B-cells, each of which has been implicated in the pathogenesis of GC
B-cell-derived tumours (section 1.1.3.3).
Genes that form the NF-KB signature (Figure 5.8) act both upstream (CD40, S6 kinase,
PKC delta, MyDSS) and downstream (lymphotoxin alpha, A20, Bfl-1, Bcl-xL, cIAP-2,
MHC class II genes) of NF-KB during B-cell activation. This cluster of genes is over
expressed in CLL, HCL and classical HL derived cell lines. The high expression of this
cluster in the classical HL cell line L-428 is consistent with the documented constitutive
NF-KB activation due the presence of a mutant IkB allele (Emmerich et al, 1999).
Furthermore, constitutive activation of this pathway, leading to the expression of anti-
apoptotic A20, Bfl-1, Bcl-xL, and cIAP-2, has been implicated in the development of
classical HL (Bargou et al, 1997). The cell lines EHEB and BONNA-12 express EBV
LMP-1 (Figure 5.4A), which activates NF-KB by mimicking signalling from CD40
(section 1.1.2.1). LMP-1 has been shown to activate a number of genes contained within
this expression signature, such as A20 (Laherty et al, 1992), Bfl-1 (D'Souza et al,
2000), cIAP-2 (Hong et al, 2000) and EBV induced gene 3 (EBI3) (Devergne et al,
1998). This effect of LMP-1 has also been confirmed by DNA arrays (Carter et al,
2002). Therefore, LMP-1 activation of NF-KB results in an expression pattern similar to
that of HRS cells. This cluster also contains genes involved in reorganisation of the actin
cytoskeleton, an essential part of B-cell activation (Bauch et al, 2000). This may account
for the characteristic spiked morphology of HCL and HRS cells.
228
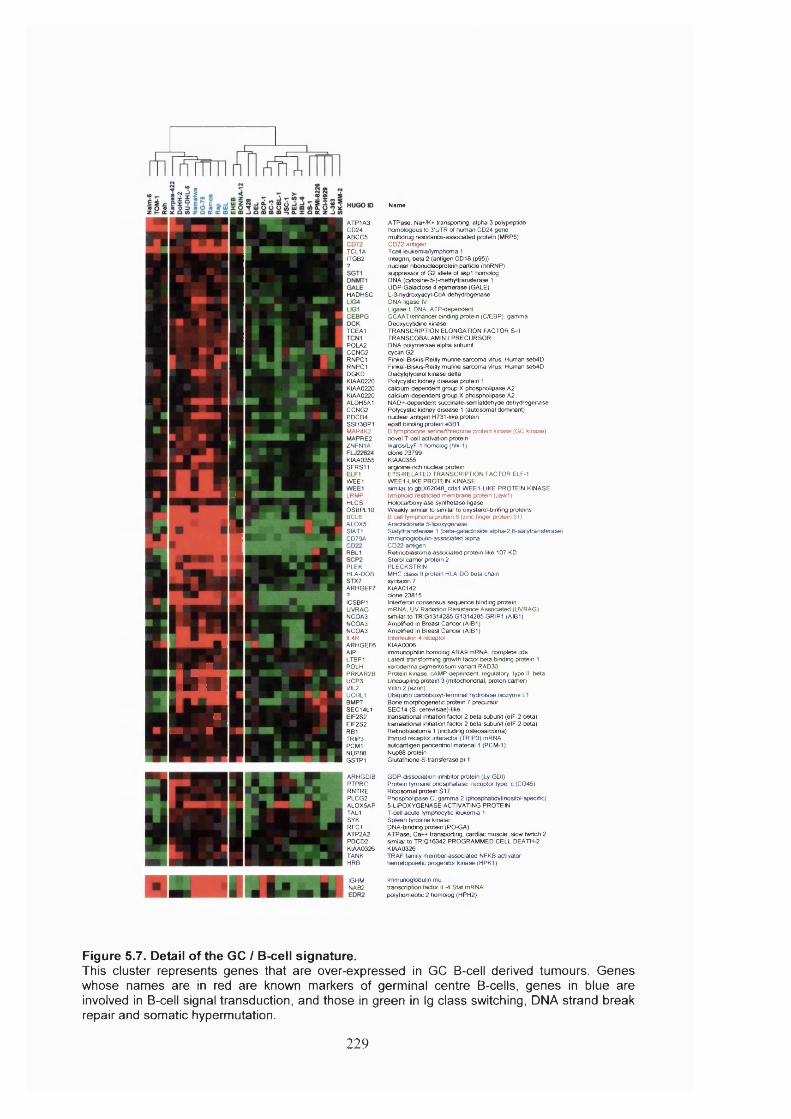
E =.
ATP1A3C024ABCC5
TCL1AFTGB2
HADHSC
TCEA1
POLA2CCNG2RNPC1RNPC1DGKDKIAA0220KIAA0220KUVA0220ALDH5A1CCNG2PDCD4SSH3BP1MAP4K2MAPRE2ZNFN1A
KIAA0355SFRS11
WEE1
LRMPHLCSOSBPL10BCL6ALOX5S1AT1CD79A
RBL1
PLEKHLA-DOB
ARHGEF7
ICSBP1 UVRAG NC0A3 NC0A3 NC0A3 H.4RARHGEF6 A IP LTBP1 POLH PRKAR2B UCP3 VIL2 UCHL1 BMP7 SEC14L1 EIF2S2 EIF2S2 RB1 TRIP3 PCM1 NUP88 GSTP1
Ü ï
MARHGDIB PTPRC RNTRE PLCG2 AL0X5AP TAL1 SYK RFC1 ATP2A2 PDCD2 K1AA0326 TANK HRB
IGHMNAB2
Name
ATPase, Na+/K+ transporting, alpha 3 polypeptide homologous to 3'UTR of human CD24 gene multidrug resistance-associated protein (MRP5)CD72 antigen Tcell ieukemia/tymptroma 1 Integrin, treta 2 (antigen CD18 (p95)) nuclear htxmudeoprotein particle (hnRNP) suppressor of G2 allele of skpl homolog DNA (cytosine-5-)-methyltransferase 1 UDP-Galactose 4 epim erase (GALE)L-3-hydroxyacyl-CoA dehydrogenase DNA ligase IVLigase I, DNA. ATP-dependent CCAAT/enhancer trinding protein (C/EBP), gamma Deoxycytidine kinaseTRANSCRIPTION ELONGATION FACTOR S-ll TRANSCOBALAMIN I PRECURSOR DNA polymerase alpha subunit cyclin G2Finkel-Biskis-Reilly murine sarcom a virus; Human setWD Finkel-Biskis-Reilly m ifine sarcom a virus; Human seb4D Diacylglycerol kinase delta Polycystic kidney disease protein 1 calcium-dependent group X phospholipase A2 cakaum-dependent group X phospholipase A2 NAD+-dependent sucdnate-sem ialdehyde dehydrogenase Polycystic kidney disease 1 (autosomal dominant) nuclear antigen H731-like protein eps8 binding protein e3B1B lymphocyte senna/threonine protein kinase (GC kinase)novel T-cell activation proteinlkaros/LyF-1 homolog (hlk-1)d o n e 23799K1AA0365arginine-rich nuclear proteinETS-RELATED TRANSCRIPTION FACTOR ELF-1WEE 1-LIKE PROTEIN KINASEsimilar to gb X62048_cds1 WEE 1-LIKE PROTEIN KINASE lympfx>id-restncted mem brane protein (Jaw l )Holocarboxylase synttietase ligaseWeakly similar to similar to oxysterol-binfing proteinsB call lymptwma protein 6 (zinc finger protein 51)Aractvdonate S-lipoxygenaseSialyttransferase 1 (beta-galactoside alpha-2,6-sialytransferase) Immmoglobulirvassociated alpha CD22 antigenRetinoblastoma-associated protein-like 107 KDSterol carrier protein 2PLECKSTRINMHC d a s s II protein HLA-DO treta chain synlaxin 7 KIAA0142 d o n e 23815Interferon consensus sequence binding protein mRNA, UV Radiation Resistance A ssociated (UVRAG) similar to TR G1314285 G 1314285 GRIP1 (AIB1)Amplified in Breast Cancer (AIB1)Amplified in Breast C ancer (AIB1)Inter1ei*in 4 receptor KIAA0006immunophilin homolog ARA9 mRNA, complete cds Latent transforming growth factor beta binding protein 1 xeroderma pigmentosum variant RAD30 Protein kinase, cAMP-dependent. regulatory, type II, beta Urxoupling protein 3 (mitoctwndrial, proton carrier)Villin 2 (ezhn)Utriquitin cart)t)boxyl-terminal hydrolase isozyme LI Bone morptxjgenetic protein 7 precursor SEC14 (S cerevisiae)-tiketranslational initiation factor 2 beta subunit (elF-2-beta) translational initiation factor 2 beta subunit (elF-2-beta) R etnoblastom a 1 (including osteosarcom a) thyroid receptor interador (TRIP3) mRNA autoantigen pericentriol material 1 (PCM-1)Nup88 proteinGlutathione-S-transferase pH
GDP-dissociatiori intiibitor protein (Ly-GDI)Protein tyrosine phosphatase, receptrx type, c (CD45) Ribosomal protein S I 7Ptiospholipase C, gam m a 2 (ptxjsphatidylinositol-specific)5-LIPOXYGENASE ACTIVATING PROTEINT-cell acu te lymphocytic leukemia 1Spleen tyrosine kinaseDNA-binding protein (PO-GA)ATPase. Ca-r+ transporting, cardiac muscle, slow twitch 2 similar to TR Q16342 PROGRAMMED CELL DEATH-2 KIAA0326TRAF family member-associated NFKB activator hematopcxelic progenitor k inase (HPK1)
Immuioglobulin mu transcnptxjn factor IL-4 Stat mRNA pdyhom eotic 2 homolog (HPH2)
Figure 5.7. Detail of the GC / B-cell signature.This cluster represents genes that are over-expressed in GC B-cell derived tumours. Genes whose names are in red are known markers of germinal centre B-cells, genes in blue are involved in B-cell signal transduction, and those in green in Ig class switching, DNA strand break repair and somatic hypermutation.
229
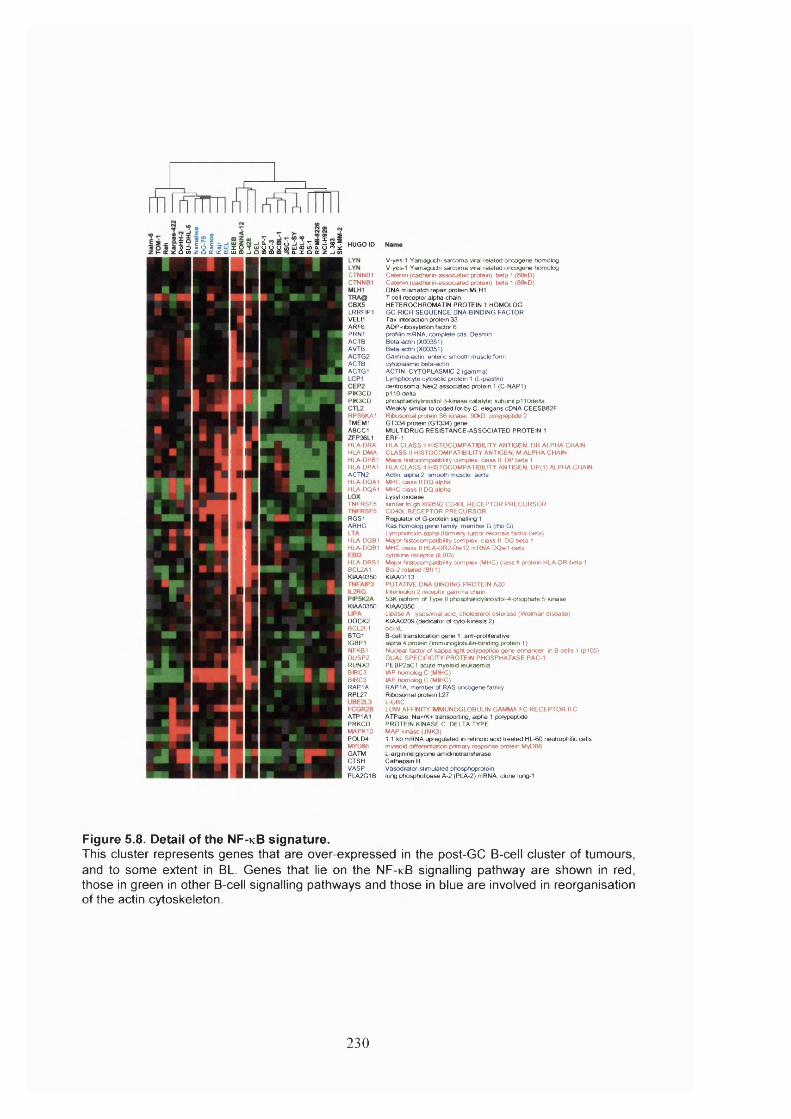
r i À A R Ü J j T z I g ? HUGO IDl5lgllïï5S2gaàa»SSSèi^SCTNNB1CTNNB1
LRRFIP1VELUARF6PRN1ACTBAVTB
ACTBACTG1
PIK3CDPIK3CD
RPS6KA1TMEM1ABCC1
HLA-DRAHLA-DMAHLA-DPB1HLA-DPA1ACTN2HLA-DQA1HLA-OQA1
TNFRSF5
RGS1ARHG
HLA-DQB1HLA-OQB1
HLA-0RB1BCL2A1K1AA0350
K1AA0350
D0CK2BCL2L1BTG1K3BP1NFKB1DUSP2RUNX3BIRC3BIRC3RAP1ARPL27
ATP1A1PRKCDMAPK10P0LD 4MYD88GATMCTSHVASPPLA2G1B
V-yes-1 Yamaguchi sarcom a viral related oncogene homolog V-yes-1 Yamaguchi sarcom a viral related oncogene homolog Catenin (cadherirvassociated protein), beta 1 (BBkD)Catenin (cadherin-associaled protein), beta 1 (BBkD)DNA mismatch repair protein MLH1 T cell receptor alpha-chain HETEROCHROMATIN PROTEIN 1 HOMOLOG GC-RICH SEQUENCE DNA-BINDING FACTOR Tax interaction protein 33 ADP-ribosylation factor 6 profHm mRNA. com plete cds, Desmin Beta-actin (X00351)Beta-actin (X00351)Gamma-actin, enteric sm ooth m uscle formcytoplasmic beta-actinACTIN, CYTOPLASMIC 2 (gam m a)Lymptwcyte cytosolic protein 1 (L-plastm) centrosom al N ek2-associated protein 1 (C-NAP1) p110-deltaphospLiatidylimsitol 3-kinase catalytic subunit p i lOdelta W eakly similar to coded for by C e lagans cDNA CEESBB2F R kosom al protein SB kinase, 90kD, polypeptide 2 GT334 protein (GT334) geneMULTIDRUG RESISTANCE-ASSOCIATED PROTEIN 1 ERF-1HLA CLASS II HISTOCOMPATBILITY ANTIGEN, DR ALPHA CHAINCLASS II HISTOCOMPATBILITY ANTIGEN M ALPHA CHAWMai or histocompatibility complex, c la ss II, DP be ta 1HLA CLASS II HISTOCOMPATBILITY ANTIGEN, DP(1) ALPHA CHAINActm. alpfia 2, sm ooth muscle, aortaMHC c lass II DO alphaMHC c lass II DO alphaLysyl oxidasesm ila r to gb X 60592 CD40L RECEPTOR PRECURSORCCMOL RECEPTOR PRECURSORRegulator of G-protein signalling 1R as homolog gene family, m em ber G (rho G)Lymphotoxin alpha (formally lu n o r n ecrosis factor beta)M ^or fistooompatibility complex, c la ss II, DO be ta 1 MHC d a s s II HLA-DR2-Osv12 mRNA CXlwl-beta cytokine receptor (EBB)Mafor histocompatibility complex (MHC) c lass II protein HLA-DR-tieta 1 B d-2 related (Bfl-1)KIAA0113PUTATIVE DNA BINDING PROTEIN A20 Irterte iiun 2 receptor g am m a chain53K isoform of Type II phosphatidylinositol-4-phophate 5-kinase KIAA0350L p a se A, lysosomal acid, cholesterol e s te ra se (W olman d isease)KIAA0209 (dedicator of cy tok inesis 2)bcFxLB-cell translocation g ene 1, anti-proliferative alptia 4 protein (immunoglobulin-binding protein 1 )Nuclear factor of kappa hght polypeptide gene en tiancer m B-cells 1 (p105)DUAL SPECIFICITY PROTEIN PHOSPHATASE PAC-1PEBP2aC1 acute myeloid ledraem ialAP homolog C (MMC)lAP homolog C (MIHC)RAP1A. m em ber of RAS oncogene familyRtoosomal protein L27L-UBCLOW AFFINITY WMUNOGLOBULIN GAMMA FC RECEPTOR II C ATPase, Na+/K+ transporting, alpha 1 polypeptide PROTEIN KINASE C, DELTA TYPE MAP kinase (JNK3)1 1 kb mRNA upregulated in retinoic acid treated HL-60 neutrophilic cells myleoid differerkiatxxi primary response protein MyDBB L-arginineglycine am kfinotransferase C athepsin HVasodilator-stimulated phospfxjproteinlung phospholipase A-2 (PLA-2) mRNA, clone lung-1
Figure 5.8. Detail of the NF-kB signature.This cluster represents genes that are over-expressed in the post-GC B-cell cluster of tumours, and to some extent in BL. Genes that lie on the NF-kB signalling pathway are shown in red, those in green in other B-cell signalling pathways and those in blue are involved in reorganisation of the actin cytoskeleton.
230
5.2.5 Low expression of B-cell s ignatu res In PEL correlates with the
expression of Bllmp-1
None of the gene expression signatures discussed above are highly expressed in PEL or
plasma cell tumours. This is consistent with the low expression of B-cell surface markers
(Hammerling et al, 1976) and MHC class II (Silacci et al, 1994) on plasma cells. The
Mann-Whitney U test, a non-parametric version of the t-Test, has been used in a number
of array studies to assess the stastical significance of differential gene expression
(Chambers et al, 1999, Hedenfalk et al, 2001, Notterman et al, 2001, Zhan et al,
2002). Using this technique, the under-expression of many B-cell genes in PEL was
found to be highly statistically significant (Figure 5.9A). 37 of the 100 genes most
significantly under-expressed in PEL are known to function in mature B-cells (red.
Figure 5.9A). Some of these 100 genes also form a discrete group in the original cluster
analysis (Figure 5.9B). This cluster of genes also includes Ig X light chain and J chain,
which are known to increase in expression during plasma cell development (Chen-
Bettecken et al, 1987, Turner et al, 1994), and hnRNP H, which is involved in mRNA
splicing to produce secreted Ig in plasma cells (Veraldi et al, 2001). Expression of this
cluster is also reduced in the classical HL cell line L-428 and the anaplastic-DLBCL cell
line DEL. The low expression of these B-cell and Ig-related genes may be related to the
lack of Ig protein in PEL (Cesarman and Knowles, 1999) and classical HL (Marafioti et
al, 2000).
231
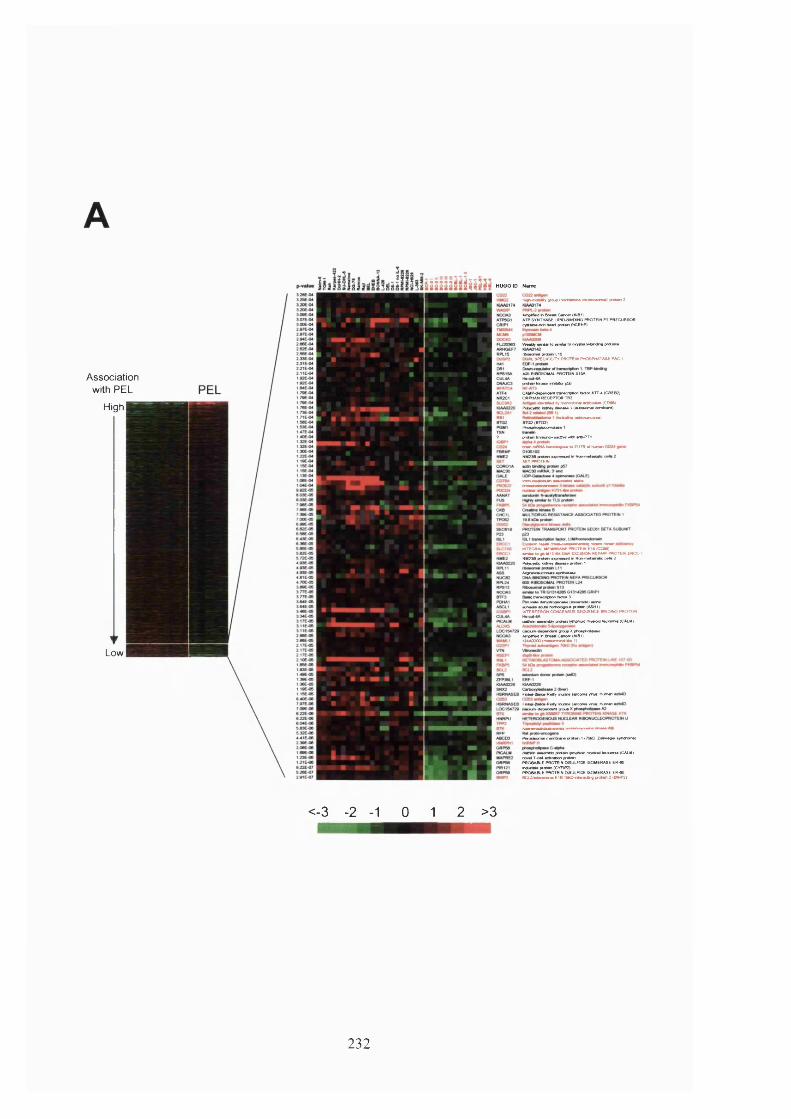
HUGO ID Name
Association with PEL
High
Migh iwMht grwjp (fwrtwfcw elwofiWMfntI) pn*» 2
AfnpMed m Brnit Canctr (AJ81)ATP SYNTHASE LIPID^NONG PROTEIN P cy««n*^tch hurt pral«n (hCRHP)
PRECURSOR
WflMy MTiiar to Mmte to o»y«two(-t*>*ia ptotair»
nboMrrMH proton L101 SPECIFICITY PROTEIN PHOSPKfcTASE PAC-1
4OSRI0ÔSOMAL PROTEIN S15A
proNtn Mnau vMbNor pSe
CAMP-dapando# IrwoertptWn todor ATF-4 (CREB2) ORPHAN RECEPTOR TR2
MorMtod br rnonodona *«bodM (COflS) Polycyrtc Mnay (Suau 1 (autowmal domhmt)
BTCS2{BTG2)
protom anmdKwuclN#w#har*-PTH
bru> mRNA homotopoua to TUTR of humari C
NM238 protom expruemi In NorwnotMttoic ct SET PROTEIN
Low
mfTEORAL UEIMRAME PROTEPt El* tCO«S)untar to # Mm»i DMA EXO8I0N REPAIR PROTEIN ERCC-1NM230 protton txpruud m NorwndutotK cato 2Polycytoic totttoy dtMua prolam I
ArgtomoMCCinN* syntoatau
K tmcription todor 3
achaate acuto homdoeoua protton (ASH1)INTERFERON CONSENSUS SEQUENCE SmOING PROTEIN
oMhrtn aaaamWy protem lymphaM myatoto toukarma (CALM)
caktdn-dapartoar# group Xphoaphoêpau AnvMtod to Braaal Cancar (AIB1) lOAItfaOO (matoarmmd Mw 1)
Fr*at-aWaa-Roay nutoa aarcoma rtrua. Human a
FWW matoa ha#y mmna sarcoma vtojs. Human »
Perodaomal mambrana prdem 1 fTOkO, ZeSwrager syndrome)
dathrtn aasamWy prdem lymphoto myetoto leukemia (CALM) novel T-ea« adNabon prdetoPROBABLE PROTEIN DtSULFlOE ISOMERASE ER-60 mdudda prdeto (CYFIP2)PROBABLE PROTEIN DISULFIDE ISOMERASE ER-«0 BCLZWartovmm E1B lOkOmtoracting protom 2 (BNtP2)
<-3 -2 -1 0 1 2 >3
232
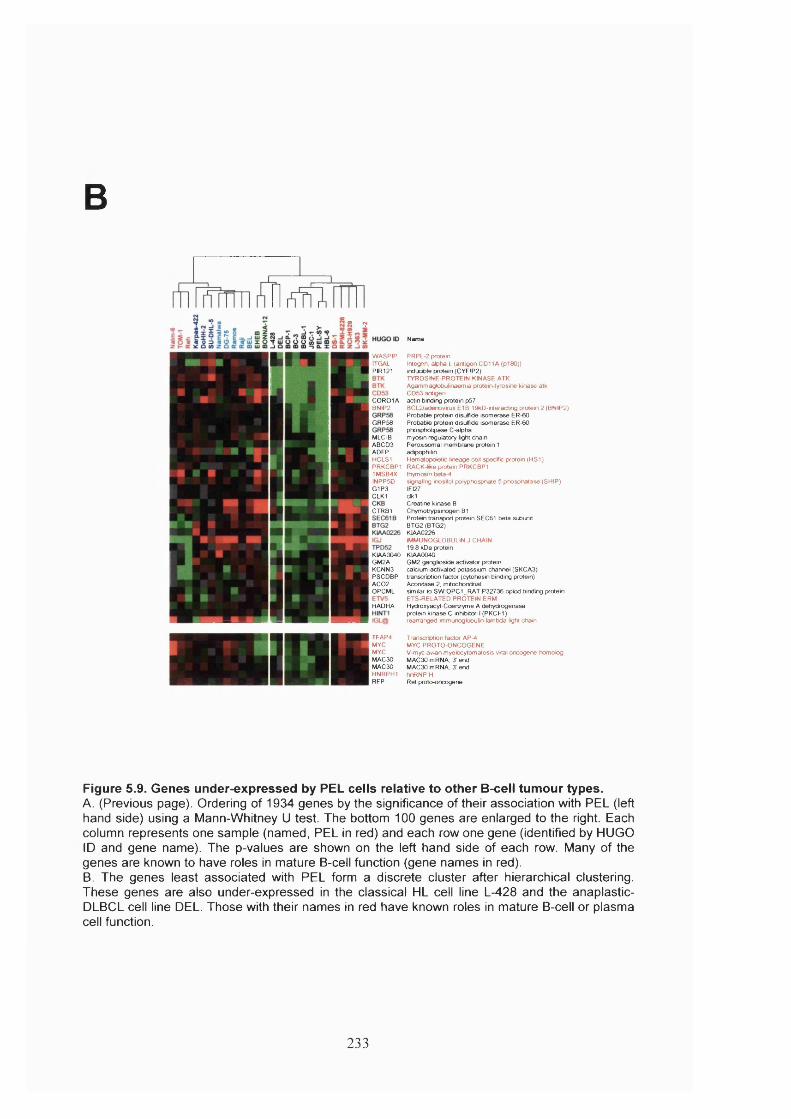
B
a ?
WASPIPUGALPIR121
C 0 R 0 1 ABNIP2
GRP58
MLC-BABCD3ADFPHCLS1PRKCBP1TMSB4XINPP50G1P3CLK1
CTRB1
KWA0040GM2AKCNN3PSCDBPA C 02OPCML
HADHA
TFAP4MYCMYCMAC30MAC30
Name
PRPL-2 pfrteinIntegrin, alpha L (antigen CD11A (p180)) inducble protein (CYFIP2)TYROSINE-PROTEIN KWASE ATK A gam m agkbulinaem ia protein-tyrosine km ase atk CD53 antigen actin binding protein p57B CL2/adenovrus E1B 19kD-interacting protem 2 (BNIP2)PfOtiatite protein disulfide isom erase ER-60Probable protein disulfide isom erase ER-60phospholipase C-alphamyosin regulatory light chainPeroxisomal m em brane protein 1adipophilinHematopoietic lineage call specific protein (MSI ) RACK-tfce protem PRKCBP1 ttiymosin beta-4signaling inosSol polyphospfiate 5 p hospfiatase (SHIP)IFI27dk1C reatine k inase B Chymotrypsinogen B1Protein transport protein SEC61 beta sibunit BTG2 (BTG2)K1AA0226IMMUNOGLOBULIN J CHAIN 19 8 kOa protein KIAA0040GM2 gangliosxle activator proteincalcitxn-activated potassium ctiannel (SKCA3)transcription factor (cytohesin binding protein)Aconitase 2. mitochondrialsimilar to SW 0PC1_R A T P32736 opiod binding protein ETS-RELATED PROTEIN ERM HydroxyacyFCoenzyme A dehydrogenase protein k inase C inhtoitor-l (PKCF1) rearranged immunoglotiulm lam bda light cfiain
T ranscrption factor AP-4 MYC PROTO-ONCOGENEV-myc avian m yelocytomatosis viral oncogene homolog MAC30 mRNA, 3 end MAC30 mRNA, 3 end
HNRPH1 hnRNP H RFP Ret proto-oncogene
Figure 5.9. Genes under-expressed by PEL cells relative to other B-cell tumour types.A. (Previous page). Ordering of 1934 genes by the significance of their association with PEL (left hand side) using a Mann-Whitney U test. The bottom 100 genes are enlarged to the right. Each column represents one sample (named, PEL in red) and each row one gene (identified by HUGO ID and gene name). The p-values are shown on the left hand side of each row. Many of the genes are known to have roles in mature B-cell function (gene names in red).B. The genes least associated with PEL form a discrete cluster after hierarchical clustering. These genes are also under-expressed in the classical HL cell line L-428 and the anaplastic- DLBCL cell line DEL. Those with their names in red have known roles in mature B-cell or plasma cell function.
233
The repression of B-cell signalling, GC B-cell, MHC class II and proliferation-associated
genes in plasma cells is controlled by the transcription factor Blimp-1 (Piskurich et al,
2000, Shaffer et al, 2002, and see section 1.1.3). Blimp-1 is up-regulated during plasma
cell development in the GC and in extrafollicular sites (Soro et al, 1999, Angelin-Duclos
et al, 2000) and is sufficient to induce plasma cell differentiation (Turner et al, 1994,
Schliephake and Schimpl, 1996, Messika et al, 1998, Piskurich et al, 2000). The
expression profile of PEL suggests that these lymphoma cells express Blimp-1. As a
probe for Blimp-1 is not present on the KSHV-human microarray, RT-PCR was used to
confirm its expression in PEL (Figure 5.10). This revealed that Blimp-1 is expressed in
all post-GC derived tumours but most strongly in PEL, MM and PCL. Blimp-1
expression correlates with the relative levels of 1RF4 expression measured using the
array (Figure 5.10). Like Blimp-1, 1RF4 is upregulated in GC B-cells committed to a
plasma cell fate (Angelin-Duclos et al, 2000, Falini et al, 2000) and is necessary for the
formation of Ig-secreting B-cells (Mittrucker et al, 1997). 1RF4 has previously been
shown to be expressed in PEL (Carbone et al, 2000b). In the GC, the expression of
Blimp-1 and BCL-6 is mutually exclusive, due to the direct inhibition of each other’s
promoters (section 1.1.3). This relationship is also apparent in B-cell tumours when
arranged by stage of B-cell development (Figure 5.10).
Blimp-1 represses c-myc transcription in plasma cells (Lin et al, 1997b), which may
explain how plasma cells leave the cell cycle to differentiate (Filers, 1999). Increased
expression of the c-myc gene, due to chromosomal translocations or mutations in the 5’
untranslated region, occurs frequently in multiple myeloma (section 1.1.3.5). PEL cells
express lower levels of myc than pre-B-cell, GC B-cell or plasma cell tumours (Figure
5.9B), consistent with transformation of a plasma cell without myc dysregulation. A low
level of myc expression in PEL supports previous data suggesting that PEL is not
associated with translocation of myc (Cesarman et al, 1995a, Karcher and Alkan, 1997).
The expression of Blimp-1 in post-GC B-cells is consistent with its expression in a
subset of B-cells leaving the GC. Cluster analysis of the microarray data identifies a
number of other genes that are over-expressed in all post-GC cells (Figure 5.11). Some
of these genes have previously been shown to be up-regulated in activated or late-stage
B-cells including CD48 (BLASTl), CD51 (integrin alpha V) CD70, CD71 (transferrin
receptor), jun B, vimentin, B7.3, 1RF4, cyclin-D2 and FLIP. Jun B is induced upon
234
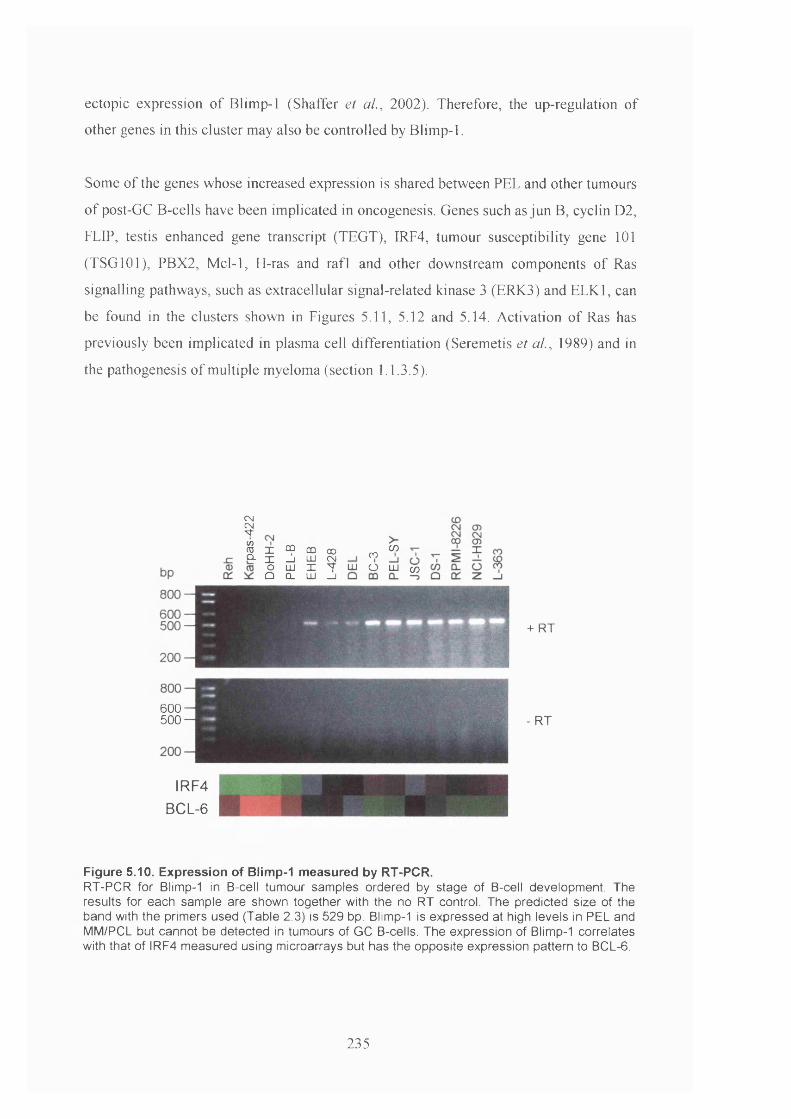
ectopic expression of Blimp-1 (Shaffer et ai, 2002). Therefore, the up-reguiation of other genes in this cluster may also be controlled by Blimp-1.
Some of the genes whose increased expression is shared between PEL and other tumours
of post-GC B-cells have been implicated in oncogenesis. Genes such as jun B, cyclin D2,
FLIP, testis enhanced gene transcript (TEGT), IRF4, tumour susceptibility gene 101
(TSGlOl), PBX2, Mcl-l, H-ras and rafl and other downstream components of Ras
signalling pathways, such as extracellular signal-related kinase 3 (ERK3) and ELKl, can
be found in the clusters shown in Figures 5.11, 5.12 and 5.14. Activation of Ras has
previously been implicated in plasma cell differentiation (Seremetis et al, 1989) and in
the pathogenesis of multiple myeloma (section 1.1.3.5).
C\J
?I X op CD CO
X -J UJ ÇNO LU X TÛ CL LU _l
oo (/)LU O LU OQ
600500
IRF4BCL-6
+ RT
-RT
Figure 5.10. Expression of Biimp-1 measured by RT-PCR.RT-PCR for Blimp-1 in B-cell tumour samples ordered by stage of B-cell development. The results for each sample are shown together with the no RT control. The predicted size of the band with the primers used (Table 2.3) is 529 bp. Blimp-1 is expressed at high levels in PEL and MM/PCL but cannot be detected in tumours of GC B-cells. The expression of Blimp-1 correlates with that of IRF4 measured using microarrays but has the opposite expression pattern to BCL-6.
235
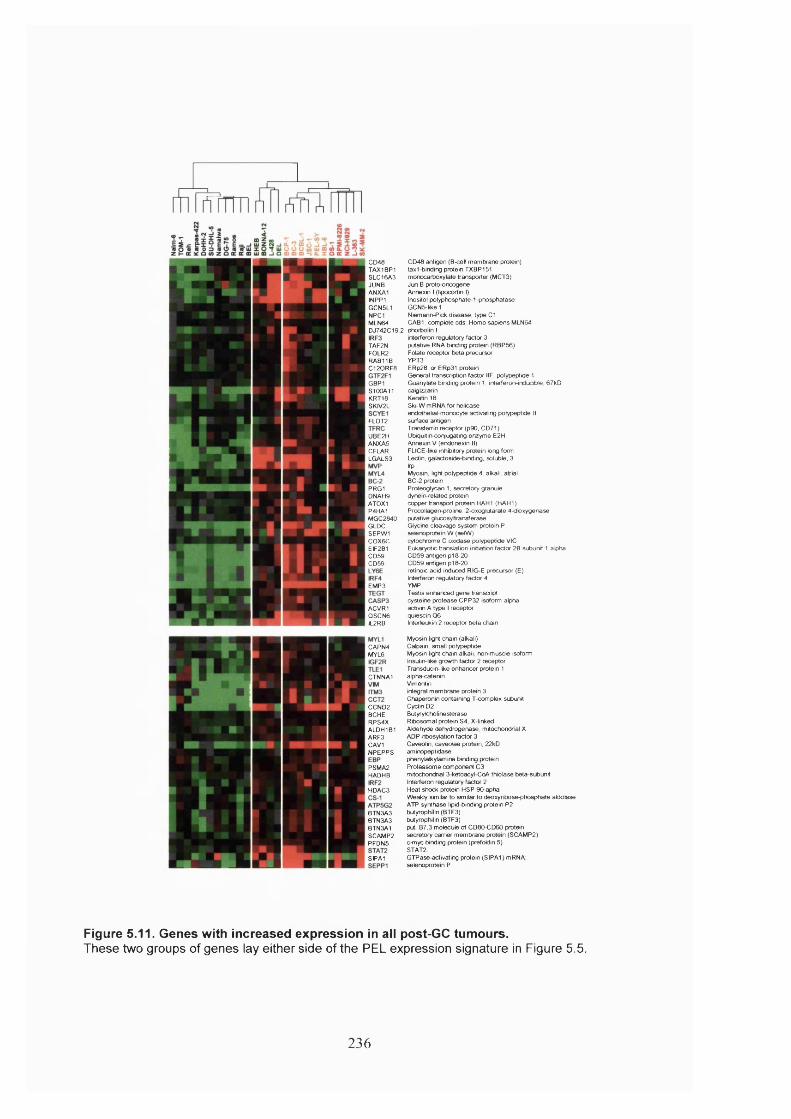
CD46TAX1BP1SLC16A3JUNBANXA1INPP1GCN5L1NPC1MLN64DJ742C19.2
TAF2NF0LR2RAB11BC 120R F8
GBP1S100A11KRT18SKIV2L
FL0T2
UBE2HANXA5CFLARLGALS3
PRG1DNAH9AT0X1P4HA1MGC2840GLDCSEPW1C0X6CEIF2B1CD59CD59
EMP3
ACVR1ÛSCN6IL2RB
CAPN4MYL6
CTNNA1
CCND2BCHERPS4XALDH1B1ARF3CAV1N PEPPS
PSMA2HADHB
HDAC3
BTN3A3BTN3A3BTN3A1SCAMP2PFDN5
SIPA1
CD48 antigen (B-cell m em brane protein) tax1-binding protein TXBP151 m orocart)oxylate transporter (MCT3)Jun B proto-oncogene Annexin I (lipocortin I)Inositol polyptx)sptiate-1-phosptiatase GCN5-like 1Niem ann-Pk* d isease, type C lCAB1, com plete cds; Flomo sap iens MLN64pbortX5lin Iinterferon regulatory factor 3 putative RNA binding protein (RBP56)Folate receptor Ijeta p rec trso r YPT3ERp28 or ERp31 proteinGeneral transcription factor I IF. polypeptide 1G uanylate binding protein 1, interferon-inducible, 67kDcalgizzarinKeratin 18SkFW mRNA for helicase endotheliaknonocyte activating polypeptide II surface antigenTransferrin receptor (p90, CD71 )U biquitin-conju^ing enzym e E2FI Annexin V (endonexin II)FLICE-like inhibitory protein long form Lectin, galactoskte-binding, soluble. 3 IrpMyosin, light polypeptide 4, a kali; atrial BC-2 proteinProteoglycan 1. secretory granuledyne in-related proteincopper transport protein FtAHt (F1AH1 )Procollagen-proline, 2-oxoglutarate 4-dioxygenaseputative glucosyltransferaseGlycine cleavage system protein Pselenoprotein W (selW)cytoctirome 0 oxidase polypeptide VICEukaryotic translation initiation factor 2B subunit 1 alphaCD59 antigen p i 8-20CD59 antigen p i 8-20retinoic acid induced RIG-E precursor (E)Interferon regulatory factor 4 YMPTestis enhanced gene transcript cysteine pro tease C PP32 isoform alptia activin A type I receptor quiescin 0 6Interleukin 2 receptor beta ctiain
Myosin light ctiain (alkali)Calpain, small polypeptideMyosin light ctiain alkali, non-m uscle isoformInsulin-like growth factor 2 receptorTransducirvlike en tiancer protein 1alpha-cateninVimentinintegral m em txene protein 3 Chaperonin containing T-complex s itu n it Cyclin 0 2Butyrylcholinesterase Ritxisomal protein S4, X-linked Aldehyde dehydrogenase, mitochondrial X ADP-ribosylation factor 3 Caveolin, caveolae protein, 22kD ammopeptkJasephenylalkylamine binding proteinPro teasom e com ponent C3mitoctiondrial 3Tretoacyl-CoA th n la se beta-subunitInterferon regulatory factor 2Heat stiock protein MSP 90-aphaWeakly similar to similar to deoxyrkxise-phosphate aldolase ATP synthase lipid-binding protein P2 butyrophilin (BTF3) butyrophilin (BTF3)put B7,3 molecule of CD80-CD60 protein secretory carrier m em brane protein (SCAMP2) c-myc binding protein (prefoldin 5)STAT2G TPase-activating protein (SIPA1 ) mRNA; selenoprotein P
Figure 5.11. Genes with increased expression in all post-GC tumours.These two groups of genes lay either side of the PEL expression signature in Figure 5.5.
236
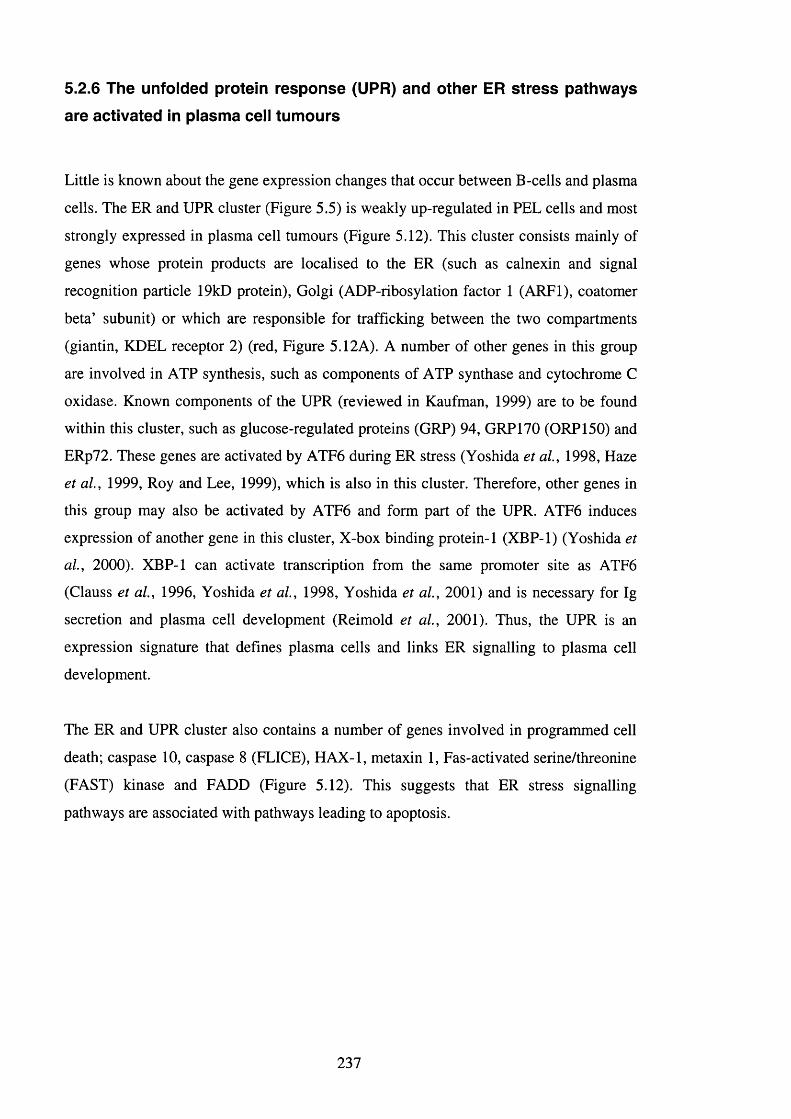
5.2.6 The unfolded protein resp o n se (UPR) and other ER s tre s s pathw ays
are activated in plasm a cell tum ours
Little is known about the gene expression changes that occur between B-cells and plasma
cells. The ER and UPR cluster (Figure 5.5) is weakly up-regulated in PEL cells and most
strongly expressed in plasma cell tumours (Figure 5.12). This cluster consists mainly of
genes whose protein products are localised to the ER (such as calnexin and signal
recognition particle 19kD protein), Golgi (ADP-ribosylation factor 1 (ARFl), coatomer
beta’ subunit) or which are responsible for trafficking between the two compartments
(giantin, KDEL receptor 2) (red, Figure 5.12A). A number of other genes in this group
are involved in ATP synthesis, such as components of ATP synthase and cytochrome C
oxidase. Known components of the UPR (reviewed in Kaufman, 1999) are to be found
within this cluster, such as glucose-regulated proteins (GRP) 94, GRP 170 (ORP150) and
ERp72. These genes are activated by ATF6 during ER stress (Yoshida et al, 1998, Haze
et al, 1999, Roy and Lee, 1999), which is also in this cluster. Therefore, other genes in
this group may also be activated by ATF6 and form part of the UPR. ATF6 induces
expression of another gene in this cluster, X-box binding protein-1 (XBP-1) (Yoshida et
al, 2000). XBP-1 can activate transcription from the same promoter site as ATF6
(Clauss et al, 1996, Yoshida et al, 1998, Yoshida et al, 2001) and is necessary for Ig
secretion and plasma cell development (Reimold et al, 2001). Thus, the UPR is an
expression signature that defines plasma cells and links ER signalling to plasma cell
development.
The ER and UPR cluster also contains a number of genes involved in programmed cell
death; caspase 10, caspase 8 (FLICE), HAX-1, metaxin 1, Fas-activated serine/threonine
(FAST) kinase and F ADD (Figure 5.12). This suggests that ER stress signalling
pathways are associated with pathways leading to apoptosis.
237
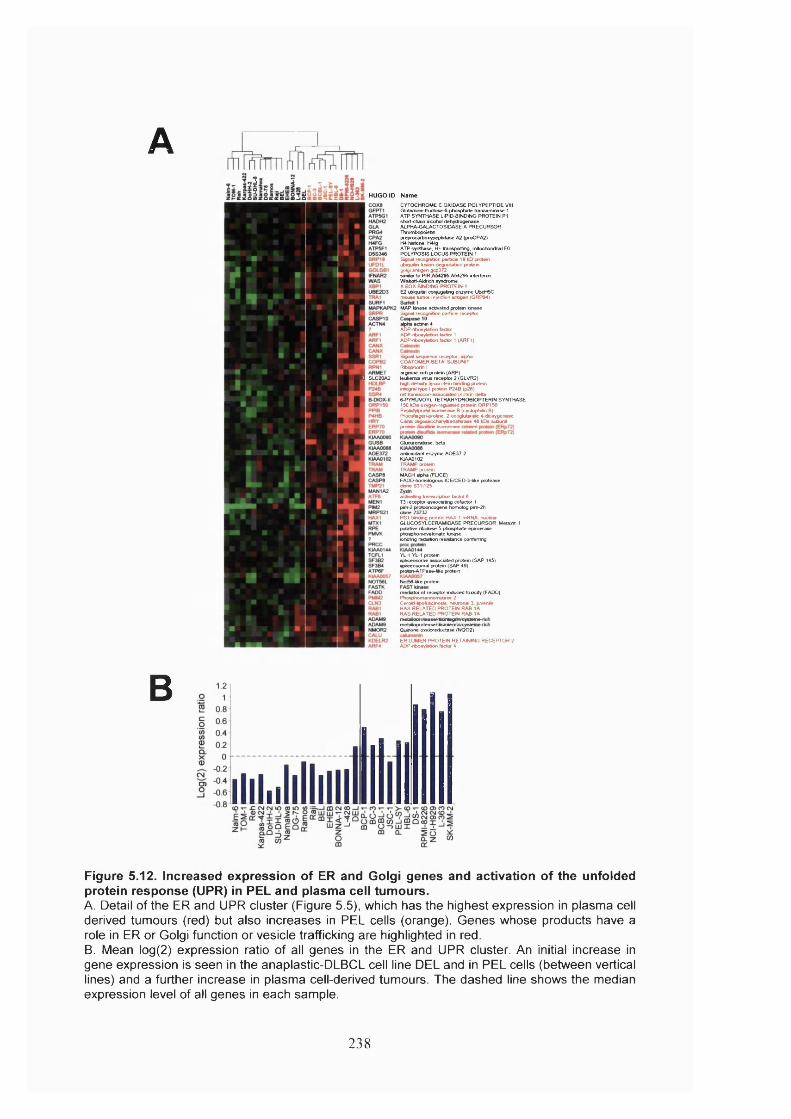
AHUGO ID Name
d SLC20A2
CYTOCHROME C OXIDASE POLYPEPTIDE VIII Glutamine'fructose-&-phosphate transaminase 1 ATP SYNTHASE LIPIOBINDING PROTEIN P1 short-chain alcohol dehydrogenase ALPHA-GALACTOSIDASE A PRECURSOR Thrombopoietinpreprocartraxypeptidase A2 (pfoCPA2)H4 histone, H4/gATP synrthase. H+ transporting. mitochon*ial FOPOLYPOSIS LOCUS PROTEIN 1Signal recognition parW e 19 kD proteinu b iq i^ fusion-deyadation proteinQoigi antigen gcp372siTTMlw to PIRA54295 A54295 interferonWiskott-Ahiich synAomeX BOX BINDING PROTElN-tE2 utwquitin conjugating enzyme Ut>cH5Cmouae tumor rejection antigen (GRP94)
MAP kinase activated protein kinase Signal recrgpibon particle receptor
a ^ a c t i n in 4 ADP-ribosylation factor AOP-rtmsytotnn factor 1 ADP-nbosytatton factor 1 (ARFl)
Signal sequence receptor, alpha COATOMER BETA" SUBUNIT Rtoophorin Iarg to ine^h protein (ARP) leukemia virus receptor 2 (GLVR2) high density Ifjoprotev» binding protein m te{^ type I protem P248 (p26) rat karwtocon-assoaatad protem deto 6-PYRUVOYL TETRAHYDROBIOPTERIN SYNTHASE 150 kOa oxygen-regutated protem ORP150 PepteMprofyi isorrwraae 8 (cyctophiin B) Procoftagervprofine. 2-oxoglularate 4-dmxygenaae Caras oMgoeaccharyteansfeme 40 kOa s i t o ^
Glucuronidase, beta
antioxidant enzyme AOE37-2KIAA0102TRAMP protemTRAMP protemMACH a#)ha (FLICE)FADD-homotogous ICE/CED-3-lfte protease ctoneS31l12S
acavating kanscrsjtion factor 6 T3 receptor-associating cofactor-1 g ^ g o ^ n c o g e n e homolog pmi-2h
MSI bmdmg protem HAX-1 mRNA, nuclear GLUCOSYLCERAMtOASE PRECURSOR; Metaxm 1 putative nbutose-S-phosphate-epimerase phosphomevatonate kinase iontzing radiation resistance conferring
YL-1 YL 1 proteinspliceosome associated protein (SAP 145) spkceosomal protem (SAP 49) proton-ATPase-like protein
Not56-»e protein
medtetor of receptor-induced toxicity (FADD) Phosptiomannomutase 2 Ceroi(F%*otoscmoste. netaonal 3. juvente RAS-RELATED PROTEIN RAB-1A RAS-RELATEO PROTEIN RAB-1A
Quinone oxidoreductasë (NQ02)
ER LUMEN PfWTEIN RETAJNIfW RECEPTOR 2 ADP-rt)osylBtion factor 4
B
l l
Figure 5.12. Increased expression of ER and Golgi genes and activation of the unfolded protein response (UPR) in PEL and plasma cell tumours.A. Detail of the ER and UPR cluster (Figure 5.5), which has the highest expression in plasma cell derived tumours (red) but also increases in PEL cells (orange). Genes whose products have a role in ER or Golgi function or vesicle trafficking are highlighted in red.B. Mean log(2) expression ratio of all genes in the ER and UPR cluster. An initial increase in gene expression is seen in the anaplastic-DLBCL cell line DEL and in PEL cells (between vertical lines) and a further increase in plasma cell-derived tumours. The dashed line shows the median expression level of all genes in each sample.
238
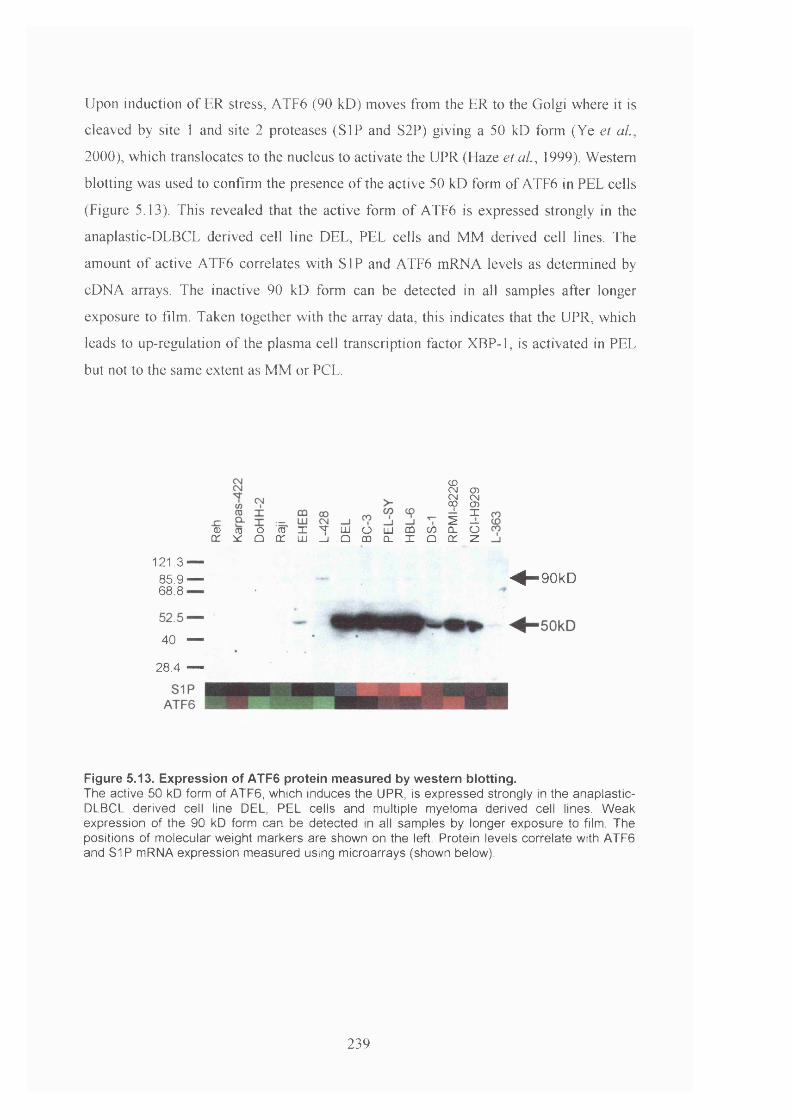
Upon induction of ER stress, ATF6 (90 kD) moves from the ER to the Golgi where it is
cleaved by site 1 and site 2 proteases (SIP and S2P) giving a 50 kD form (Ye et ai,
2000), which translocates to the nucleus to activate the UPR (Haze et ai, 1999). Western
blotting was used to confirm the presence of the active 50 kD form of ATF6 in PEL cells
(Figure 5.13). This revealed that the active form of ATF6 is expressed strongly in the
anaplastic-DLBCL derived cell line DEL, PEL cells and MM derived cell lines. The
amount of active ATF6 correlates with SIP and ATF6 mRNA levels as determined by
cDNA arrays. The inactive 90 kD form can be detected in all samples after longer
exposure to film. Taken together with the array data, this indicates that the UPR, which
leads to up-regulation of the plasma cell transcription factor XBP-1, is activated in PEL
but not to the same extent as MM or PCL.
CDCN CDCM CN00 CR
XiCL ÔQC z
CD CD O C D X ’T L U O L U Û Q C / 5Q ^ ^ û o r u j J j Q c r i c L X û 121.3 —85.9— ^ ^ - 9 0 k D68 8
40 — * *
28.4 —
Figure 5.13. Expression of ATF6 protein measured by western blotting.The active 50 kD form of ATF6, which induces the UPR, is expressed strongly in the anaplastic- DLBCL derived cell line DEL, PEL cells and multiple myeloma derived cell lines. Weak expression of the 90 kD form can be detected in all samples by longer exposure to film. The positions of molecular weight markers are shown on the left. Protein levels correlate with ATF6 and SIP mRNA expression measured using microarrays (shown below).
239
The PEL expression signature contains genes that are over-expressed in PEL cells or in
both PEL and plasma cell tumours (Figure 5.14). In addition, a number of genes are
over-expressed in PEL are shared with all tumours of post-GC B-cells (Figure 5.11).
Many of these genes form part of pathways other than the UPR that are also triggered by
ER stress (red in Figure 5.14). Sterol regulatory genes such as SIP, sterol regulatory
element binding protein (SREBP) cleavage-activating protein (SCAP), Niemann-Pick
disease, type Cl (NPCl) and downstream genes (phosphatidylserine synthase, low
density lipoprotein (LDL) receptor, lipoprotein lipase and caveolin) are all to be found in
the PEL cluster. Genes involved in ER-associated degradation (ERAD) of misfolded
proteins (reviewed in Brodsky and McCracken, 1999), such as components of the ER
translocon (signal sequence receptor (SSR) 1 and 4), ubiquitination machinery and the
26S proteasome, also show increased expression in PEL, MM and PCL cells. The PEL
cluster also contains genes involved in inhibition of translation, such as eukaryotic
initiation factor 2B (eIF-2B) and general control of amino-acid synthesis 1 (GCNl), and
calpain and caspase 3 which are involved in the induction of apoptosis in cells with
chronic ER stress (Nakagawa and Yuan, 2000, Siman et al, 2001). Both transformed
plasma cells and PEL cells also over-express a number of other stress-associated genes.
These include endothelial monocyte-activating protein 2 (EMAP2), antioxidant protein 1
(ATXl), N-myc downstream regulated gene 1 (NDRGl), voltage-dependent anion
channel 3 (VDAC3), selenoproteins P and W and HIF-ip.
240
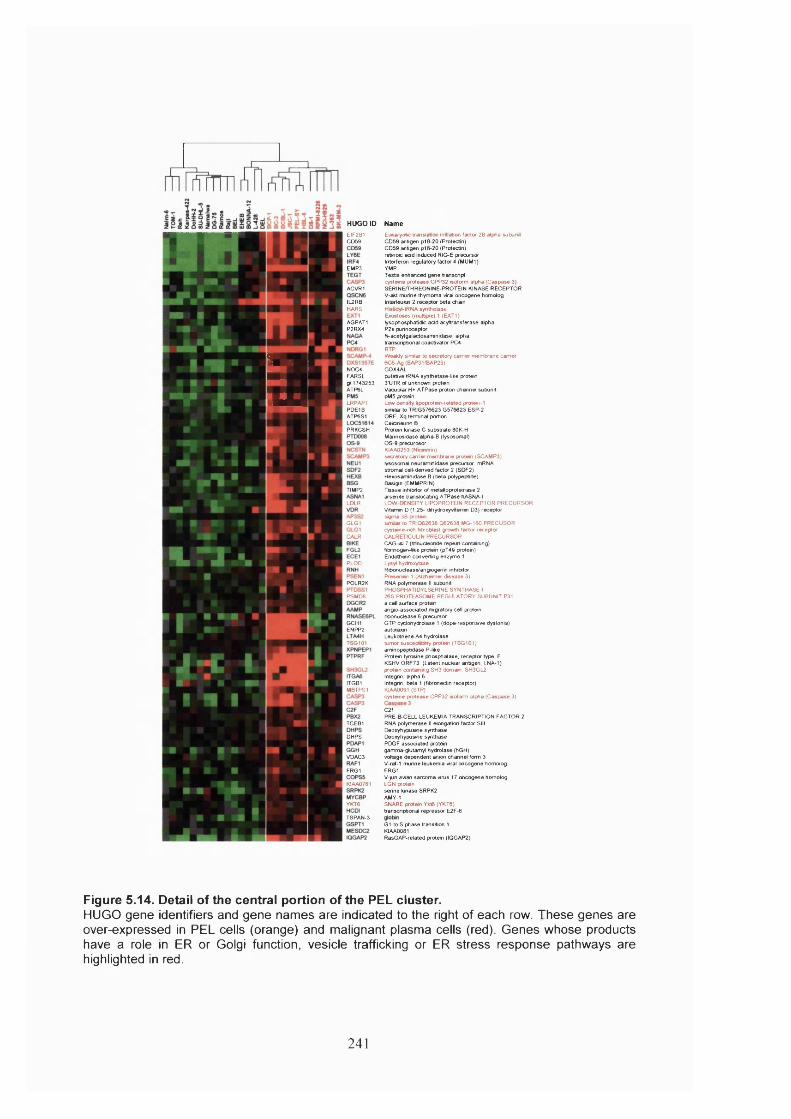
EIF2B1CD59
EMP3
ACVR1
IL2RBMARS
AGPAT1P2RX4
1 NOC4FARSLgi: 1743253ATP6L
LRPAPiPDE1BATP6S1
PRKCSH
TIMP2
LDLR
GLG1
CALR
PLOD
POLR2K
PSMD8
GCH1ENPP2
TSG101
rTGBIMBTPS1
TCEB1
DHPS
VDAC3
FRG1
K1AA0761
YKT6
TSPAN-3
HUGO ID NameE ukaryote translation initiation factor 28 alpha subunit CD59 antigen p i 8-20 (Protectin)CD69 antigen p i 8-20 (Protectin) retinoic a d d induced RIG-E precursor Interferon regulatory factor 4 (MUM1 )YMPTestis enhanced gene transcriptcysteine p ro tease CPP32 isoform alpha (C aspase 3)SERINETTHREONINE-PROTEIN KINASE RECEPTORV-akt murine thymoma viral oncogene homologInterleukin 2 receptor be ta chainHistidyt-tRNA synthetaseE xostoses (multiple) 1 (EXT1)lysophosphatidic a d d acyttransferase-alphaP2x purinoceptorN-acetylgalactosaminidase. alphatranscriptional coactivator PC4RTPWeakly similar to secretory carrier m em brane carrier 6C6-Ag (B ^ 1 /B A P 2 9 )COX4ALputative tRNA synthetase-like protein 3'UTR of unknowvn protein V acuolar H+ A T Pase proton channel subunit pM5 proteinLow density iipoprotem-related protein-1 similar to TR G576623 G 576623 ESP-2 ORF. Xq terminal portion C aldneurin BProtein kinase C substra te 80K-H M annosidase alpha-B (lysosomal)O S-9 precurosor KIAA0253 (Nicastnn)secretory earner m em brane protem (SCAMP3) lysosomal neuram inidase precursor. mRNA stromal cell-derived factor 2 (SDF2)H exosam inidase B (beta polypeptide)Basigin (EMMPRIN)T issue inhibitor of metaNoproteinase 2 arsen ile translocating A TPase hASNA-l LOW-DENSfTY LIPOPROTEIN RECEPTOR PRECURSOR Vitamin D (1.25- dihyd-oxyvrtamin D3) receptor sigm a 38 proteinsen d tf to TR 0 6 2638 0 6 2638 MG-160 PRECUSOR cysteme-rich fibroblast growth factor receptor CALRETICULIN PRECURSOR CAG-isI 7 (trmucteotide repeat-containing} fibrinogen-lke protem (pT49 protem)Endothelin converting enzym e 1 Lysyl hydoxytase R ibonudease/angiogenin inhibitor P resen Win 1 (Alzhesner d isease 3)RNA polym erase II subunit PHOSPHATIDYLSERINE SYNTHASE I 26S PROTEASOME REGULATORY SUBUNIT P31 a cell surface protein ang io -assoda ted m iyatory cell protein rb o n u d e a se 6 precursorGTP cydohydrolase 1 (dopa-responsive dystonia) autotaxinLeukotriene A4 hydrolasetumor suscepbbkty protem (T SG lO l)am inopeptidase P-likeProtein tyrosine phosphatase, receptor type, F KSHVORF73 (Latent n u d e a r antigen. LNA-1) protem containm g SH3 domain, SH3GL2 Integrin. a lp h a sIntegrin, beta 1 (fibronectin receptor)KIAA0091 (S IP )cysteine p ro tease CPP32 isoform alpha (C aspase 3)
C2fPRE-B-CELL LEUKEMIA TRANSCRIPTION FACTOR 2RNA polym erase II elongation factor SillDeoxyhypusine synthaseDeoxyhypusine synthasePDGF a sso d a ted proteingamma-glutamyl hydrolase (hGH)voltage dependent anion channel form 3V-raf-1 murine leukemia viral oncogene homologFRG1V-jun avian sarcom a vims 17 oncogene homologLGN protemserine kinase SRPK2AMY-1SNARE protem Y k« (YKT6) transcription^ repressor E2F-6
G1 to S phase transition 1 KIAA0081RasG A P-related protein (IQGAP2)
Figure 5.14. Detail of the central portion of the PEL cluster.HUGO gene identifiers and gene names are indicated to the right of each row. These genes are over-expressed in PEL cells (orange) and malignant plasma cells (red). Genes whose productshave a role in ER or Golgi function, highlighted in red.
vesicle trafficking or ER stress response pathways are
241
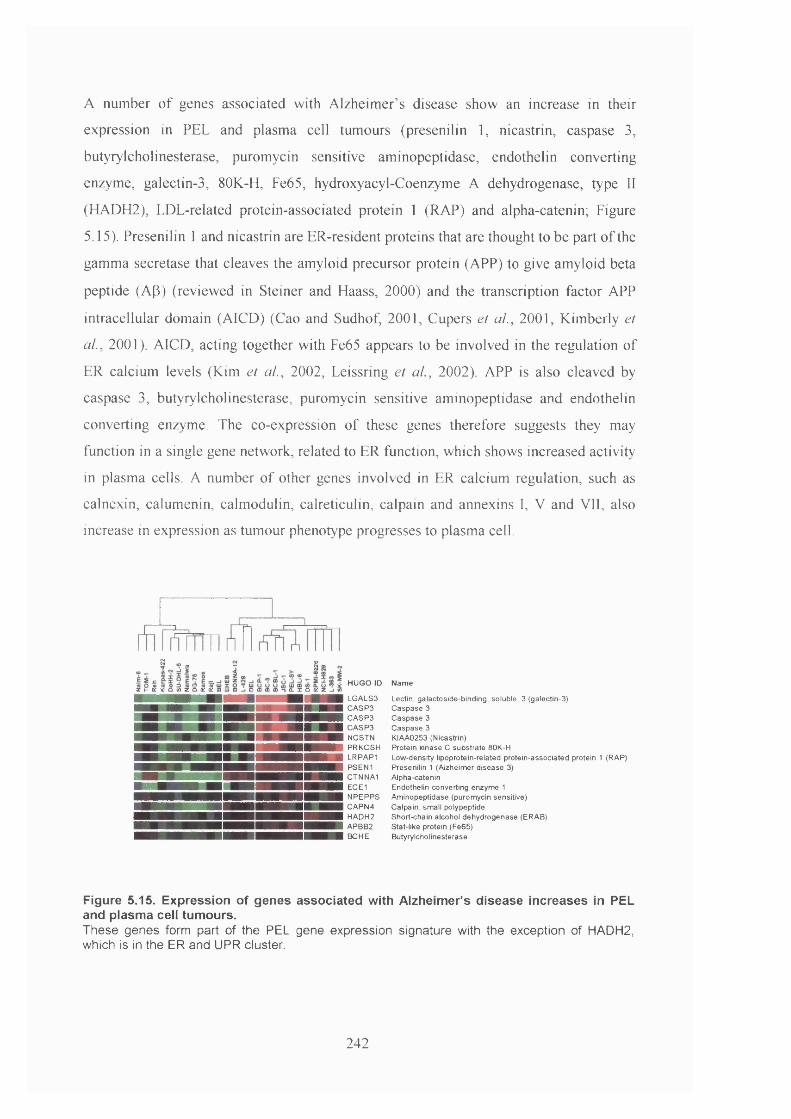
A number of genes associated with Alzheimer’s disease show an increase in their
expression in PEL and plasma cell tumours (presenilin 1, nicastrin, caspase 3,
butyrylcholinesterase, puromycin sensitive aminopeptidase, endothelin converting
enzyme, galectin-3, 80K-H, Fe65, hydroxyacyl-Coenzyme A dehydrogenase, type II
(HADH2), LDL-related protein-associated protein 1 (RAP) and alpha-catenin; Figure
5.15). Presenilin 1 and nicastrin are ER-resident proteins that are thought to be part of the
gamma secretase that cleaves the amyloid precursor protein (APP) to give amyloid beta
peptide (Ap) (reviewed in Steiner and Haass, 2000) and the transcription factor APP
intracellular domain (AICD) (Cao and Sudhof, 2001, Cupers et al, 2001, Kimberly et
al., 2001). AICD, acting together with Fe65 appears to be involved in the regulation of
ER calcium levels (Kim et al, 2002, Leissring et al, 2002). APP is also cleaved by
caspase 3, butyrylcholinesterase, puromycin sensitive aminopeptidase and endothelin
converting enzyme. The co-expression of these genes therefore suggests they may
function in a single gene network, related to ER function, which shows increased activity
in plasma cells. A number of other genes involved in ER calcium regulation, such as calnexin, calumenin, calmodulin, calreticulin, calpain and annexins I, V and VII, also
increase in expression as tumour phenotype progresses to plasma cell.
« - â ® ,
HUGO id N am eZ ) - i E ^ Q ( a z 0 a : a : m u j m J i o a i a ) a i ” a . T o a : z J i i a
LGALS3 Lectin, galactoslde-binding, soluble, 3 (galectin-3)CASP3 Caspase 3CASP3 C aspase 3CASP3 C aspase 3NCSTN KIAA0253 (Nicastrin)PRKCSH Protein kinase C substrate 80K-HLRPAPI Low-density lipoprotein-related protein-associated protein 1 (RAP)PSEN1 Presenilin 1 (Alzheimer disease 3)CTNNA1 Alpha-cateninECE1 Endothelin converting enzyme 1NPEPPS Aminopeptidase (puromycin sensitive)CAPN4 Calpain, small polypeptideHADH2 Short-chain alcohol dehydrogenase (ERAS)APBB2 Stat-like protein (Fe65)BCHE Butyrylcholinesterase
Figure 5.15. Expression of genes associated with Alzheimer’s disease Increases In PEL and plasma cell tumours.These genes form part of the PEL gene expression signature with the exception of HADH2, which is in the ER and UPR cluster.
242
5.2.7 Anti-viral response against KSHV and EBV type III latency
Two clusters of genes are enriched for those with known anti-viral properties or that are
induced by interferon (Figure 5.16A and labelled Anti-viral I and II in Figure 5.5). The
anti-viral clusters contain genes that act within cells to inhibit virus replication, such as
myxovirus resistance protein A (MxA), PKR, double-stranded adenosine deaminase,
IRF-3, IRF-8 , STATl (reviewed in Samuel, 2001), beclin 1 (Liang et ai, 1998), Bax
(Balachandran et al, 1998, Cuconati et al, 2002) and interferon-inducible protein 9-27
(Constantoulakis et al, 1993, Alber and Staeheli, 1996). The anti-viral cluster also
contains the cytokines interferon-induced 17 kD protein (interferon stimulated gene
(ISG) 15) and small inducible cytokine A3, which are released upon virus infection
(Cook et al, 1995, D'Cunha et al, 1996, Domachowske et al, 2000). Genes responsible
for antigen presentation are also contained within the anti-viral clusters. The interferon-
induced components of the proteasome, PSME2 (PA28 beta), PSMB8 (large
multifunctional protease 7 (LMP7)), PSMBIO (multicatalytic endopeptidase complex-1
(MECl-1)), cluster together as do the MHC class I genes HLA-A, B and C, also induced
by interferon.
All these genes show strong expression in EHEB and BONNA-12, two cell lines
established by in vitro infection with EBV. Upon infection, EBV establishes type III
latency (section 1.1.2.1), and the transcription of EBV type III latency genes in these cell
lines is confirmed by the array (Figure 5.4A). The EBV infected BL cell lines Raji, DG-
75 and Namalwa and the primary BL tumour sample BEL do not activate these anti-viral
and interferon-inducible genes. Therefore, the restricted gene expression of type I latency
avoids the induction of an anti-viral response in the host cell. Similar to EBV type III
latency, KSHV infected PEL cells also show activation of anti-viral genes. The degree to
which these genes are activated varies slightly between different PEL samples, with the
lowest expression in HBL- 6 and the highest in BCP-1 (Figure 5.16B). In latent PEL cell
cultures the expression of anti-viral genes follows the total activity of the KSHV genome
but not one particular gene class (classes shown in Figure 4.12). The limited increase in
the level of anti-viral gene expression observed after the induction of lytic replication in
HBL- 6 suggests that the anti-viral response observed in latent PEL cultures is not from a
minority of spontaneously lytic cells.
243
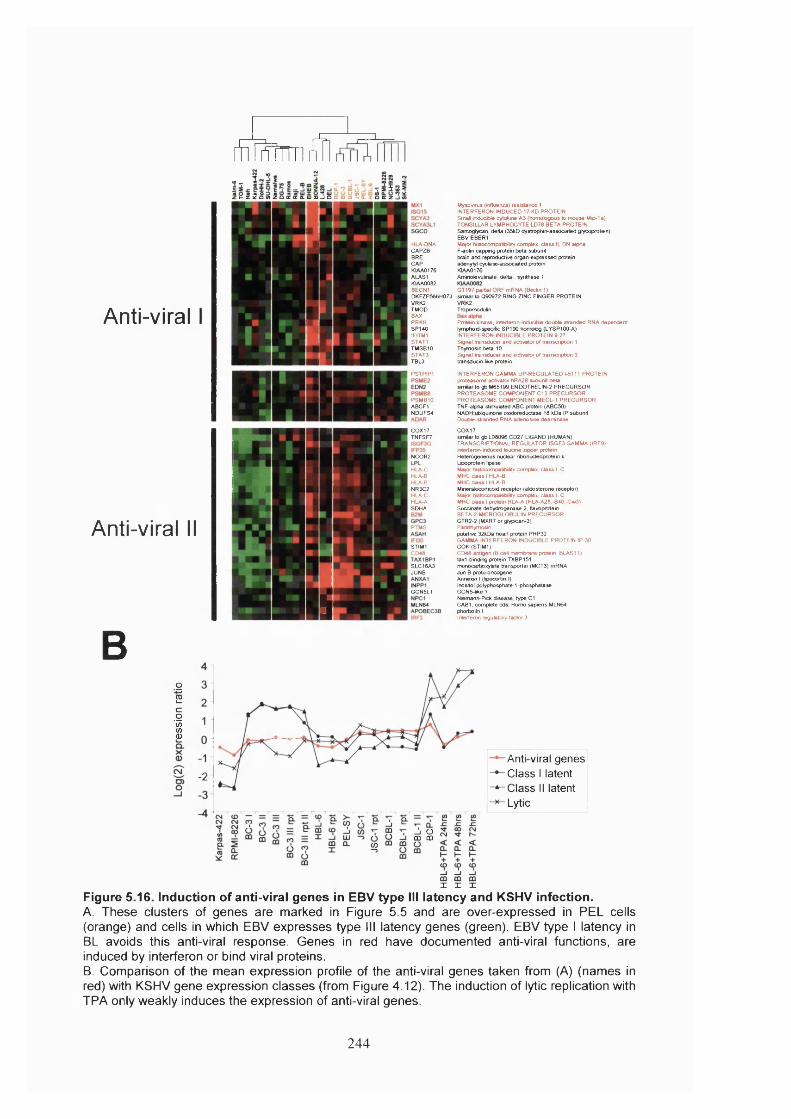
rfïmTTTTl fVri
Anti-viral
Anti-viral II
B
HLA-ONACAPZBBRECAPKIAA0176ALAS1KIAA0082BECN1DKFZP566H073VRK2TMOOBAXPRKRSP140IFfTMlSTATlTMSB10STAT3TBL3
- K K 2 a c o z û £ £ a t u o D J i Q G D f f i f l Q ^ a L Z û a : z
PSTPIP1
PSM 810ABCF1NDUFS4
COX17TNFSF7
NCOR2
HLA-CHLA-8HLA-8NR3C2HLA-CHLA^SDHA
PTMS
STIM1CD48
SLC1ÔA3JUNB
S GCN5L1
Myxovifu» (mfluenzj) resistance 1 INTERFERON-INDUCED 17 KD PROTEIN S n ta l tnducjble cytokine A3 (homologous to m ouse Mip-1 a) TONSILLAR LYMPHOCYTE LD78 BETA PROTEIN Sartoglycan. delta (35kD dystrophin-associated glycoprotein)EBV EBER1Major histocompatibtllty complex, c la ss II. DN alphaF-actin capping protein beta subunitbrain and reproductive organ-expressed proteinadenytyt cyclase-associated proteinK1AA0176Amirratevulinate. delta-, synthase 1
GT197 partial ORF mRNA (Beclin 1 )similar to 090972 RING ZINC FINGER PROTEINVRK2Tropomoduhn
Protem kinase, mterferon-inductole double stranded RNA d e p en d e d lymphoid-specific SP 100 homolog (LYSP100-A) INTERFERON-INDUCIBLE PROTEIN 9-27 Signal transducer and activator of transcription 1 Thymosin beta-10Signal transducer and activator of transcription 3 Iransducin-like protein
INTERFERON GAMMA UP-REGULATED 1-5111 PROTEIN proteasom e activator hPA28 subunit beta similar to gb:M66199 ENDOTHELIN-2 PRECURSOR PROTEASOME COMPONENT C l 3 PRECURSOR PROTEASOME COMPONENT MECL-1 PRECURSOR TNF-alpha stimulated ABC protein (ABC50)NADH ubiquinone oxidoreductase 18 kDa IP subunit Double-stranded RNA adenosine deam inase
COX17similar to gb:L08096 CD27 LIGAND (HUMAN)TRANSCRIPTIONAL REGULATOR ISGF3 GAMMA (IRF9) trterferon-induced leucme zipper protem Heterogeneous nuclear ribonucleoprotein k Lipoprotein lipaseM a ^ IwtocompatAikty complex, c lass I. C MHC d a s s IHLA-B MHC d a s s I HLA-BMineralocoriicoid receptor (aldosterone receptor)Major histocompatibility complex, c lass I. C MHC d a s s I protem HLA-A (HLA-A28.-B40.-Cw3)Succinate dehydrogenase 2. ftavoprotein BETA-2-MICROGLOeULIN PRECURSOR GTR2-2 (MXR7 or glypican-3)Parathymosmputative 32kOa heart protein PHP32 GAMMA4NTERFERON-INDUCIBLE PROTEIN IP-30 GOK (STIM1)CD48 ant g e n (B-ceM mem brane protem. BLAST 1 ) tax1-binding protein TXBP151 monocartxixytate transporter (MCT3) mRNA Jun B proto-oncogene Annexin I (lipocortin I)Inositol polyphosphate-1 -phosphatase G CNSJike 1Niemann-Pick d isease type C lCAB1. complete cds, Homo sap iens MLN64phorbolin IInterferon regulatory factor 3
o2c01
-2
Jj Ü CÛ CDW
I X I
-Anti viral genes
C lass I latent C lass II latent Lytic
Figure 5.16. Induction of anti-viral genes in EBV type III latency and KSHV infection.A. These clusters of genes are marked in Figure 5.5 and are over-expressed in PEL cells (orange) and cells in which EBV expresses type III latency genes (green). EBV type I latency in BL avoids this anti-viral response. Genes in red have documented anti-viral functions, are induced by interferon or bind viral proteins.B. Comparison of the mean expression profile of the anti-viral genes taken from (A) (names in red) with KSHV gene expression classes (from Figure 4.12). The induction of lytic replication with TPA only weakly induces the expression of anti-viral genes.
244
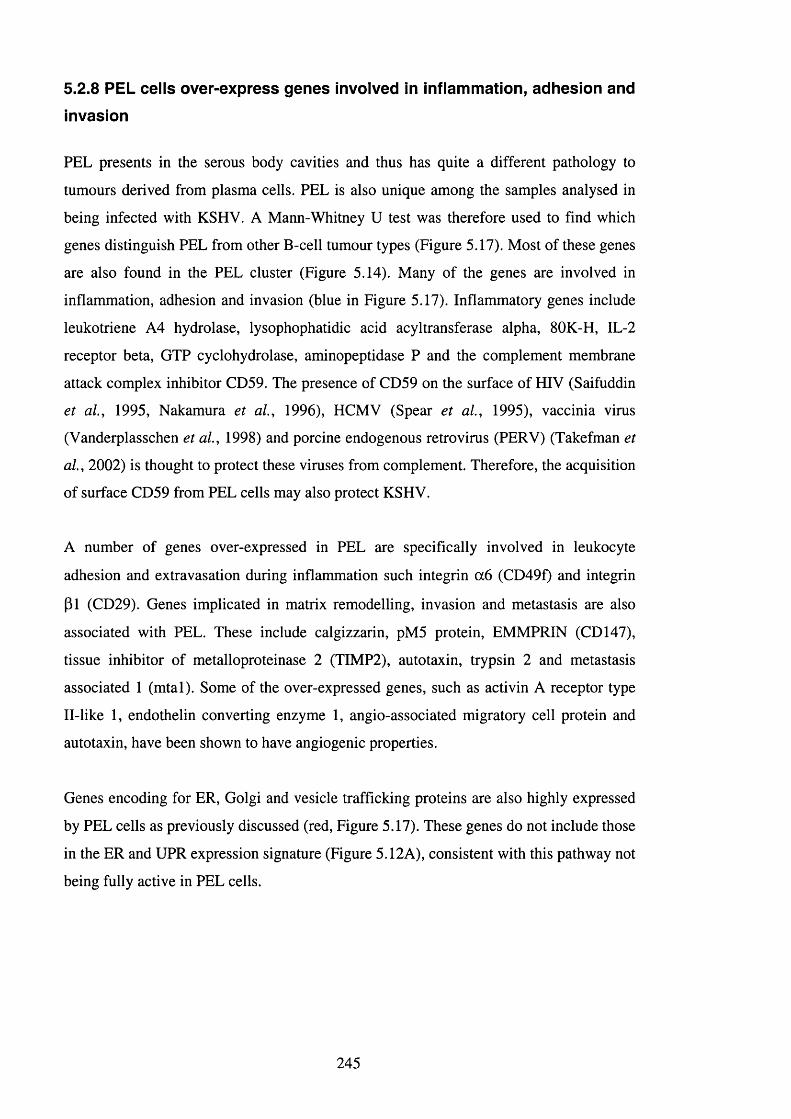
5.2.8 PEL cells over-express genes involved in inflammation, adhesion and
invasion
PEL presents in the serous body cavities and thus has quite a different pathology to
tumours derived from plasma cells. PEL is also unique among the samples analysed in
being infected with KSHV. A Mann-Whitney U test was therefore used to find which
genes distinguish PEL from other B-cell tumour types (Figure 5.17). Most of these genes
are also found in the PEL cluster (Figure 5.14). Many of the genes are involved in
inflammation, adhesion and invasion (blue in Figure 5.17). Inflammatory genes include
leukotriene A4 hydrolase, lysophophatidic acid acyltransferase alpha, 80K-H, IL-2
receptor beta, GTP cydohydrolase, aminopeptidase P and the complement membrane
attack complex inhibitor CD59. The presence of CD59 on the surface of HIV (Saifuddin
et al, 1995, Nakamura et al, 1996), HCMV (Spear et al, 1995), vaccinia virus
(Vanderplasschen et al, 1998) and porcine endogenous retrovirus (PERV) (Takefman et
al, 2002) is thought to protect these viruses from complement. Therefore, the acquisition
of surface CD59 from PEL cells may also protect KSHV.
A number of genes over-expressed in PEL are specifically involved in leukocyte
adhesion and extravasation during inflammation such integrin a 6 (CD49f) and integrin
(31 (CD29). Genes implicated in matrix remodelling, invasion and metastasis are also
associated with PEL. These include calgizzarin, pM5 protein, EMMPRIN (CD 147),
tissue inhibitor of metalloproteinase 2 (TIMP2), autotaxin, trypsin 2 and metastasis
associated 1 (mtal). Some of the over-expressed genes, such as activin A receptor type
Il-like 1 , endothelin converting enzyme 1 , angio-associated migratory cell protein and
autotaxin, have been shown to have angiogenic properties.
Genes encoding for ER, Golgi and vesicle trafficking proteins are also highly expressed
by PEL cells as previously discussed (red. Figure 5.17). These genes do not include those
in the ER and UPR expression signature (Figure 5.12A), consistent with this pathway not
being fully active in PEL cells.
245
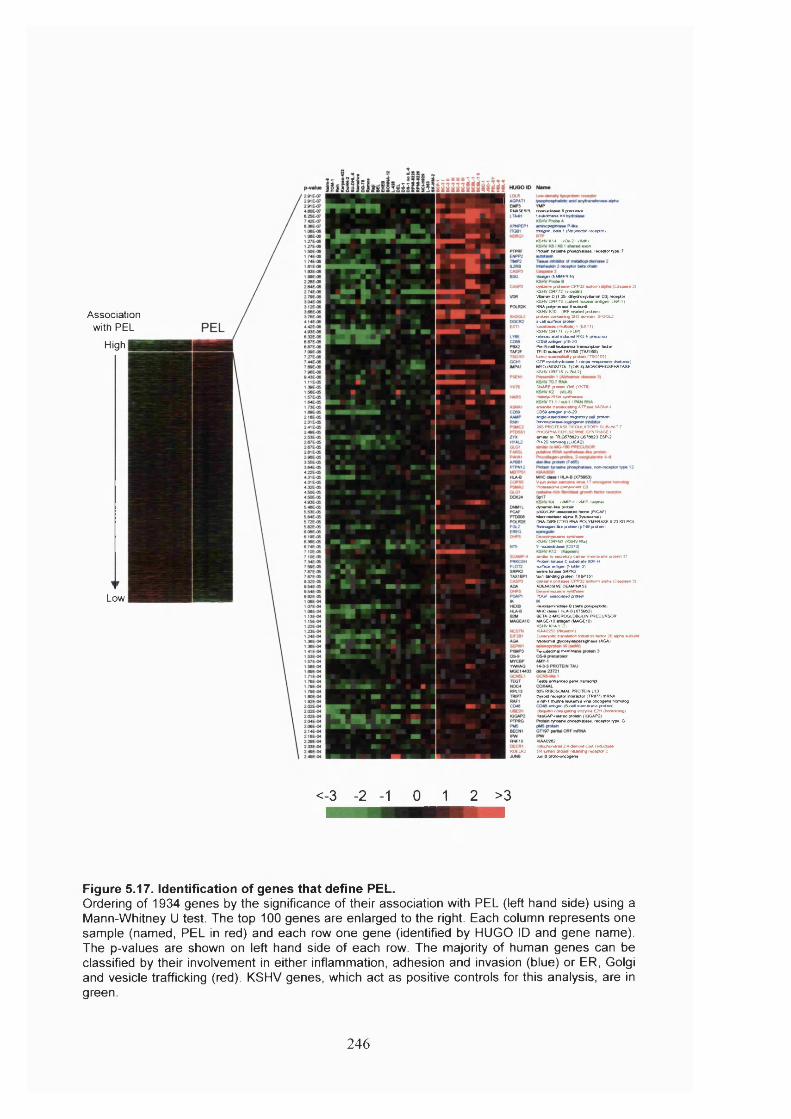
Association with PEL
High
Low
RNASE6PL rtbonuct««M 6 pracursor LMAotnm A4
WeanTbLa 1 (ftoonectwi racaptor)
KSHVKU {vO«-2 ' vA<*i)
Proton tyroatrw phoaphatoae, racaptor typa. t
Basgn (EMMPRIN)
oytone prolaaea CPP32 ■oform (Ciipaaa 3) KSHV ORF72 (v-cyc#n)Vtamn 0 (1.25- dhydroxyvtartHn 03) renptor KSHV ORF73 (LManI nuctaar anbgcn. LNA-1 )RNA potymeraaa H aubun#KSHV K10 (IRF ratotad prolan) proton oontonns SH3 domvi. SH30L2 • cal aurtoca protan Ewatoaaadrnumpto) 1 (EXT1)KSHVORF71 (v-FLIP)ralnoK actd nducad RIG-E pracuraorC050 anbgan P18-20Pra-B-cal teukaamia Iranacnptkn tod orTFIID aubunN TAFIIK (TAFII55)ttfTMX «uacapaMy prolan (TSG101)GTP cyciohyitolasa 1 (dopa-raapcn«va dyatoraa) MYO4NOSrr0L.1(0R 4)-MONOPHOSPHATASE KSMVORF18 (r-Bct-2)
SNARE prolan YW6 (YKTB)
HIMidvMRNAavnthataa*
ataania barWocaing ATPmaa HASNA-lC059 anOgan P18-20■ngw aaaogalad nayatory prolan
2*S PROTEASE REGULATORY SUBUNIT 7 PHOSPMA-nOVLSERIME SYNTHASE I am#ar lo TR 0676623 <3676623 ESP-2 PH.20hon*Qtog (LUCA2)
(vMIP-P/vMIP-la^) dyrwTin-tka yotan pSavCBP-aaaocMtod todor (P/CAF)Mamoartaae al#%#-8 (hraoagrrtal)DNA-OIRECTEO RNA POLYMERASE H 23 KD POL Ittnrwgnvka prdan (pT48 prdani
KSHVORFSO (KSHVRti)S nuctoobdtaa (C073)
tonAv lo aaeralory carnar mambrana proton 37Proton knaaa C aubabala 60K-Hmjttoca artogan (FtalBn 2)aemeWnaaeSRPKZlaxl-tndng prolan TXBP151qto ine protoaaa CPP32 •oterm alpha (Caapaaa 3)ADENOSINE DEAMINASE
PDGF aaaocolad prolan
Hamaamlndaaa 8 (bata potypapbda)MHC daaa I HLA-B (X7S853) BETA-2-MICROGLOeULIN PRECURSOR MAGE-10 mbgan (MAGE 10)KSHV K14 1 (2)KLAA02S3 (NM m)EUwyohc banatabm nRabon toctor 28 topha aubunt lyaoaomal yycoaytoaparagnaaa (AGA)
Taaba enharKad gana tranacPpI
80S RIBOSOMAL PROTEIN L13 Biyrold racaplor nterador (TF1P7) mRNA V-ral-1 murtna laukamia viral oncogarw homolog
anbgan (B-caH mambrana proton) UbKMbrvconiugatng arwryma E2H (homololog) RaaGAP-ralatad protein (IQGAP2)
tyroane phoaphalaae, racaplof lypa, G
RNF10 K1AA0283mHochondnal 2,4-<lenoyFCoA reAxlaee
KDELR2 ER toman prolan rdamng racaplor 2An B prolo-oocogaoa
<-3 -2 -1 0 1 2 >3
Figure 5.17. Identification of genes that define PEL.Ordering of 1934 genes by the significance of their association with PEL (left hand side) using a Mann-Whitney U test. The top 100 genes are enlarged to the right. Each column represents one sample (named, PEL in red) and each row one gene (identified by HUGO ID and gene name). The p-values are shown on left hand side of each row. The majority of human genes can be classified by their involvement in either inflammation, adhesion and invasion (blue) or ER, Golgi and vesicle trafficking (red). KSHV genes, which act as positive controls for this analysis, are in green.
246
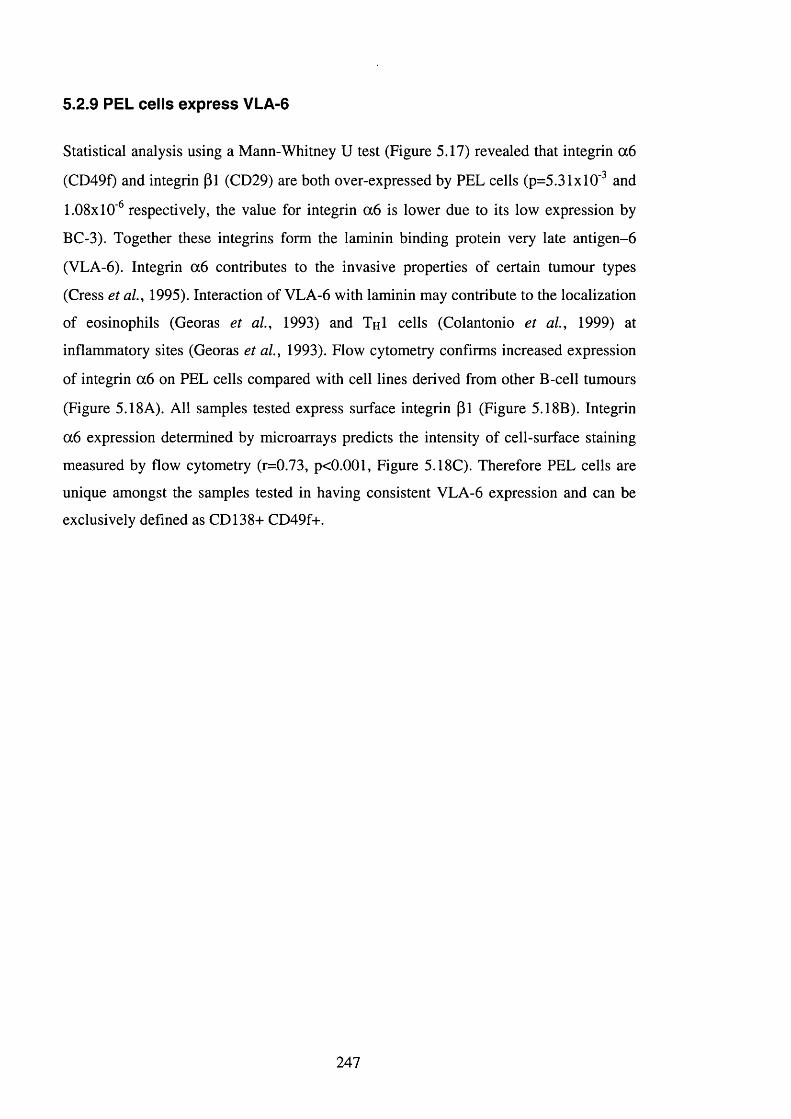
5.2.9 PEL cells express VLA-6
Statistical analysis using a Mann-Whitney U test (Figure 5.17) revealed that integrin a 6
(CD49f) and integrin (31 (CD29) are both over-expressed by PEL cells (p=5.31xl0‘ and
1,08x10'^ respectively, the value for integrin a 6 is lower due to its low expression by
BC-3). Together these integrins form the laminin binding protein very late antigen- 6
(VLA-6 ). Integrin a 6 contributes to the invasive properties of certain tumour types
(Cress et al., 1995). Interaction of VLA- 6 with laminin may contribute to the localization
of eosinophils (Georas et al, 1993) and ThI cells (Colantonio et al, 1999) at
inflammatory sites (Georas et al, 1993). Flow cytometry confirms increased expression
of integrin a 6 on PEL cells compared with cell lines derived from other B-cell tumours
(Figure 5.ISA). All samples tested express surface integrin pi (Figure 5.18B). Integrin
a 6 expression determined by microarrays predicts the intensity of cell-surface staining
measured by flow cytometry (r=0.73, p<0.001, Figure 5.18C). Therefore PEL cells are
unique amongst the samples tested in having consistent VLA- 6 expression and can be
exclusively defined as CD138-f- CD49f+.
247
Integrin a6B
integrin p i
250
200•t;wc 40BÇ 30-cca 20(U2 10-
0 1 - 1 ■ ■_ _ € M m - j en CO - J
■2 o E LU - I
(D 0) CO' ' % zu =6 LU % z ±u
: i
w 5 0
S 4 0
m m œ
R = 0 .73 , p<0.0G1
Q .
OS8
0.1♦ ♦ 100
■2
1000
FA C s m ean intensity
Figure 5.18. High expression of VLA-6 on PEL celis.A. Cell surface integrin aS (CD49f) expression measured by flow cytometry as isotype control subtracted mean intensity (in arbitrary units). PEL cells (indicated by tfie fiorizontal black bar) express high levels of integrin aS relative to other B-cell lines tested (except Raji). Cells are ordered by B-cell stage as defined by gene expression profiling.B. Cell surface expression of integrin pi (CD29), the partner of integrin a6 in VLA-6, measured by flow cytometry as isotype control subtracted mean intensity. All cell lines tested express integrin pi at varying levels.C. Integrin a6 mRNA level determined by microarray analysis correlates with cell surface expression of integrin aS measured by flow cytometry (r=0.73, p<0.001).
248
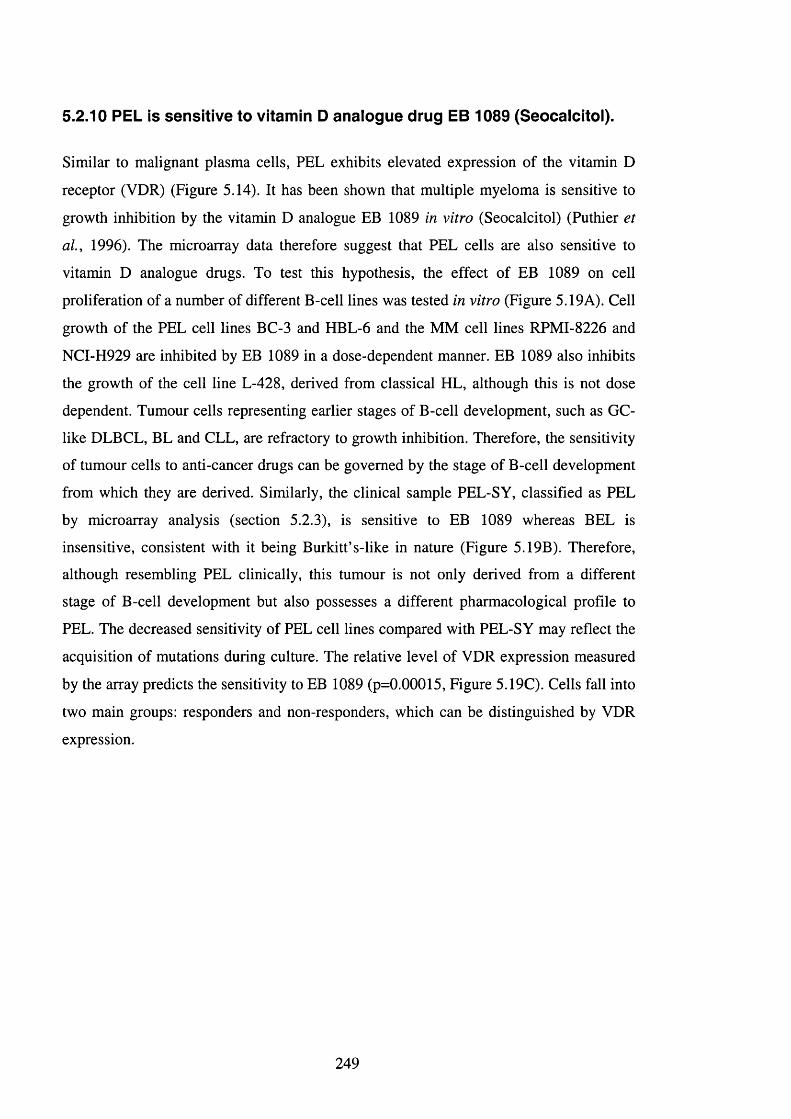
5.2.10 PEL is sensitive to vitamin D anaiogue drug EB 1089 (Seocalcitoi).
Similar to malignant plasma cells, PEL exhibits elevated expression of the vitamin D
receptor (VDR) (Figure 5.14). It has been shown that multiple myeloma is sensitive to
growth inhibition by the vitamin D analogue EB 1089 in vitro (Seocalcitoi) (Puthier et
al., 1996). The microarray data therefore suggest that PEL cells are also sensitive to
vitamin D analogue drugs. To test this hypothesis, the effect of EB 1089 on cell
proliferation of a number of different B-cell lines was tested in vitro (Figure 5.19A). Cell
growth of the PEL cell lines BC-3 and HBL- 6 and the MM cell lines RPMl-8226 and
NC1-H929 are inhibited by EB 1089 in a dose-dependent manner. EB 1089 also inhibits
the growth of the cell line L-428, derived from classical HL, although this is not dose
dependent. Tumour cells representing earlier stages of B-cell development, such as GC-
like DLBCL, BL and CLL, are refractory to growth inhibition. Therefore, the sensitivity
of tumour cells to anti-cancer drugs can be governed by the stage of B-cell development
from which they are derived. Similarly, the clinical sample PEL-SY, classified as PEL
by microarray analysis (section 5.2.3), is sensitive to EB 1089 whereas BEL is
insensitive, consistent with it being Burkitt’s-like in nature (Figure 5.19B). Therefore,
although resembling PEL clinically, this tumour is not only derived from a different
stage of B-cell development but also possesses a different pharmacological profile to
PEL. The decreased sensitivity of PEL cell lines compared with PEL-SY may reflect the
acquisition of mutations during culture. The relative level of VDR expression measured
by the array predicts the sensitivity to EB 1089 (p=0.00015. Figure 5.19C). Cells fall into
two main groups: responders and non-responders, which can be distinguished by VDR
expression.
249
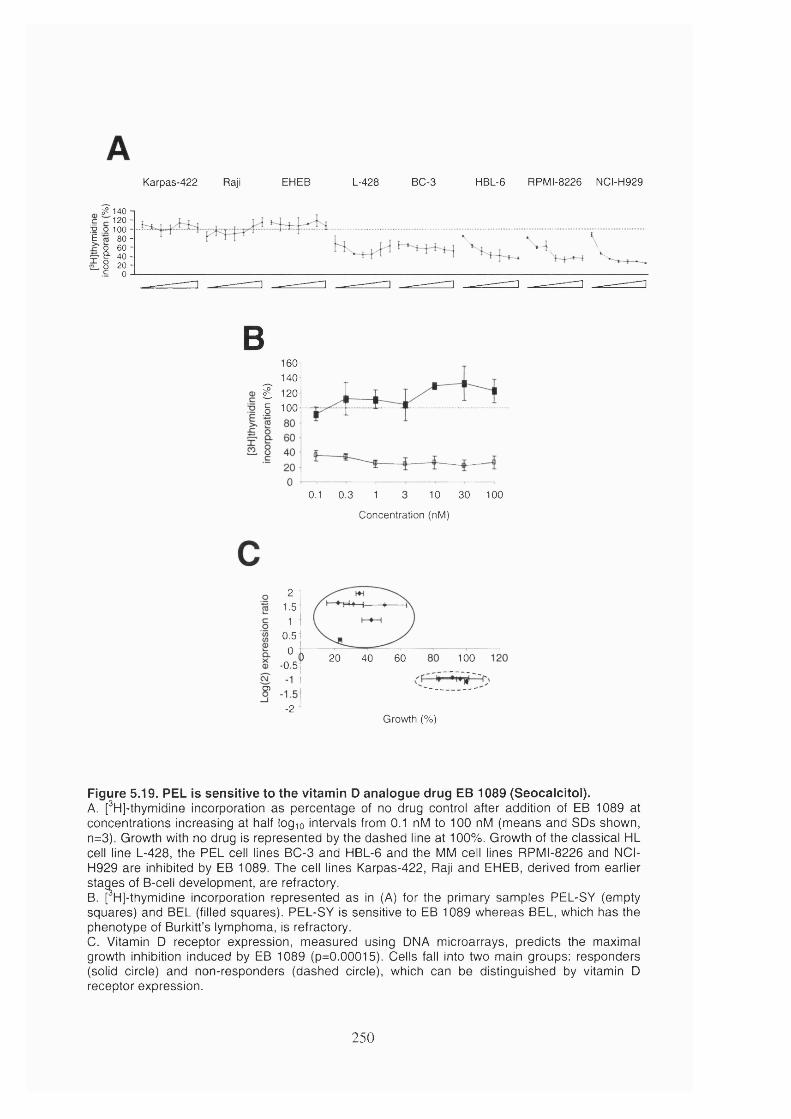
Karpas-422 Raji EHEB L-428 BC-3 HBL-6 RPMI-8226 NCI-H929
^ 140 -1c 120 -y o 100 -E 80 -
o 60 -9- 40 -8 20 -c 0 -1
»-4. V
B160
_ 140
£ 120 g 1004
0.1 0.3 1 10 30 100
Concentration (nM)
-2
21.5
10.5
-J’i 20 40 60 100
O)
Growth (% )
Figure 5.19. PEL is sensitive to the vitamin D anaiogue drug EB 1089 (Seocaicitoi).A. [^H]-thymidine incorporation as percentage of no drug control after addition of EB 1089 at concentrations increasing at half logio intervals from 0.1 nM to 100 nM (means and SDs shown, n=3). Growth with no drug is represented by the dashed line at 100%. Growth of the classical HL cell line L-428, the PEL cell lines BC-3 and HBL-6 and the MM cell lines RPMI-8226 and NCI- H929 are inhibited by EB 1089. The cell lines Karpas-422, Raji and EHEB, derived from earlier staæs of B-cell development, are refractory.B. pH]-thymidine incorporation represented as in (A) for the primary samples PEL-SY (empty squares) and BEL (filled squares). PEL-SY is sensitive to EB 1089 whereas BEL, which has the phenotype of Burkitt’s lymphoma, is refractory.C. Vitamin D receptor expression, measured using DMA microarrays, predicts the maximal growth inhibition induced by EB 1089 (p=0.00015). Cells fall into two main groups: responders (solid circle) and non-responders (dashed circle), which can be distinguished by vitamin D receptor expression.
250
5 . 3 D i s c u s s i o n
Gene expression profiling assembles a spectrum of B-cell neoplasia in which tumours
are ordered by stage of B-cell development, from pre-B-cell to plasma cell. This ordering
is inherent in, and solely dependent on, the gene expression pattern of the samples. The
developmental stage from which a tumour is derived governs its pathogenesis and
clinical presentation (section 1.1,3). DNA microarrays demonstrate that the global gene
expression pattern of tumours matches the B-cell stage from which they derive (Alizadeh
et ai, 2000, Klein et al, 2001, section 1.3.5). This is consistent with the model that
malignant B-cells are frozen at discrete developmental stages (Greaves, 1986). This
dataset reassembles these stages to reveal how differences in gene expression pattern
may explain PEL pathology and reveal the processes behind plasma cell development.
The clustering of cell lines derived from CLL and HCL suggests these two diseases are
related, consistent with previous data. Both are predominantly disseminated, chronic
slow growing diseases in vivo whose tumour cells display an activated phenotype
(reviewed in Pettitt et al, 1999, Jaffe et al, 2001). The microarray data suggest the
characteristics of these diseases are caused by low expression of proliferation-associated
genes and high expression of B-cell activation genes. Both CLL and HCL are suggested
to be derived from memory B-cells (Kuppers et al, 1999, Klein et al, 2001) and the data
show that both cell lines express genes involved in CD40 signalling, necessary for
memory B-cell development (Gray et al, 1994). However, the gene expression pattern of
these cell lines is influenced by the expression of EBV LMP-1 (Figure 5.4). EBV LMP-1
mimics signalling from CD40 to activate NF-kB (section 1.1.2.1). The similarity
between gene expression in LMP-1 expressing cells and the classical HL cell line L-428
(EBV negative), supports a role for LMP-1 in classical HL pathogenesis. Similarly, the
clustering of the cell lines L-428 and DEL (anaplastic-DLBCL), both reference cell lines
for their respective diseases, is consistent with the recognised overlap between these two
cancer types (section 1.1.3.4).
251
5.3.1 KSHV may promote plasma cell development
Microarray analysis of gene expression shows that PEL has a gene expression profile
similar to transformed plasma cells. This is consistent with the expression of CD138 and
IRF4 in the absence of B-cell markers. It has been suggested that PEL constitutes two
diseases (Matolcsy et al, 1998), as some cases have mutated Ig genes whereas others are
germline. Also, although PEL cells share CD 138 expression with plasma cells, this
antigen is also expressed on some pre-B-cell and GC B-cell derived cell lines (Drexler,
2001). The data presented in this chapter show that PEL is actually one disease, which
has a gene expression profile similar to transformed plasma cells. All cases examined
share an expression profile regardless of whether the cells have passed through the GC.
Similarly, CLL cases also share a common general expression pattern that is independent
of Ig hypermutation (Klein et al, 2001, Rosenwald et al, 2001). Taken together, these
studies suggest that B-cells activated by antigen in extrafollicular sites pass along the
same pathway of B-cell differentiation as B-cells leaving the GC, and due to this, give
rise to the same tumour types.
EBV is thought to control the development of its B-cell host by mimicking cellular
signalling pathways and guiding it towards a memory B-cell in which latent virus can
persist (section 1.1.2). EBV infected tumours can arise when virus induced B-cell
activation is not controlled (section 1.1.3). KSHV associated tumours may therefore arise
in an analogous manner. However, the low expression of the NF-KB signature in PEL
cells compared with EBV LMP-1 expressing cells suggests that KSHV is not driving
PEL cell growth though this mechanism. The expression pattern of PEL cells suggests
that KSHV may act to direct B-cells towards a plasma cell fate. The expression of
unmutated IgM by KSHV infected B-cells in MCD has lead to the suggestion that these
cells are naïve (Dupin et al, 2000, Du et al, 2001). However, the morphology of these
cells suggests they could instead be derived from extrafollicular plasmablasts. Both
KSHV-associated B-cell tumours may therefore be blocked at stages along the plasma
cell developmental pathway. This may point to long-lived plasma cells (Miller, 1964,
Manz et al, 1997, Slifka et al, 1998) being the reservoir of latent KSHV infection.
These cells have been shown to survive for over 1 year in mice (Slifka et al, 1998), a
large proportion of this animals’ lifespan. The array data in this chapter show that a
number of cellular homologues of KSHV genes are increased in post-GC cells (v-cyclin -
cyclin D2, vFLlP - FLIP, vlRF3 - 1RF4, vBcl-2 - Mcll and vCBP - CD59). KSHV also
252
encodes an IL- 6 homologue (vIL-6 ) that can prevent plasmacytoma cell apoptosis
(Moore et al, 1996a, Nicholas et al, 1997b) and promote proliferation of myeloma cells
(Burger et al, 1998) and plasma cells (Aoki et al, 1999). Therefore, KSHV may have
pirated some host genes in order to help the virus direct B-cell development towards
plasma cells. That KSHV may promote plasma cell development is supported by the
induction of IRF4, a transcription factor necessary for the formation of Ig-secreting B-
cells (Mittrucker et al, 1997), after KSHV-infection of haematopoietic stem cells
(Mikovits et al, 2001).
5.3.2 Anti-viral gene activity relates to pa tterns of virus gene expression
The expression pattern of anti-viral and other interferon-inducible genes suggests that
EBV type I latency does not trigger an anti-viral response. This could be due to the direct
inhibition of PKR by EBER-1 (Sharp et al, 1993). Also, EBV growth promoting genes
are not expressed in type I latency and so the infected cell holds no inunediate risk for
the organism. Type III latency, characterised by expression of LMPs and EBNAs 2 and
3, is associated with an anti-viral response. This has also been observed by microarray
analysis of LCLs (Carter et al, 2002). Type III latency genes induce cell proliferation
and are therefore pathogenic. This relationship between virus pathogenesis and
expression of interferon-inducible genes is also apparent when comparing gene
expression profiles from a number of virus infections (section 1.3.7.1).
The proximity of the anti-viral cluster and the NF-kB cluster in the ordering of genes
(Figure 5.5) suggests that the induction of an anti-viral response may be related to the
activation of NF-kB by LMP-1. Activation of NF-kB is observed upon infection of many
viruses (reviewed in Baeuerle and Henkel, 1994). NF-kB is activated by PKR (Kumar et
al, 1994, Yang et al, 1995) and induces the transcription of IFN-P (Lenardo et al, 1989,
Visvanathan and Goodboum, 1989, Kirchhoff et al, 1999) and ISO 15 (Li et al, 2001)
Therefore, activation of anti-viral pathways may be an unavoidable consequence of NF-
kB activation and thus may constitute a cellular protection mechanism.
Transcription of anti-viral genes is also activated in KSHV-infected PEL cells. This
suggests that the KSHV latency programme observed in PEL may be equivalent to EBV
type III latency. LNA-1 up-regulates the expression of a small number of interferon-
inducible genes when expressed in isolation (Renne et al, 2001), suggesting it may be
253

contribute to the induction of the anti-viral response observed in this study. The
induction of lytic replication in HBL- 6 leads to increased expression of anti-viral genes,
an observation that has also been made in KSHV-infected DMVECs (Poole et al, 2002).
This is consistent with the increase in viral gene expression during lytic replication.
However, this induction is weak relative to the level of lytic gene expression (Figure
5.16B) suggesting that the anti-viral response observed during latency is not due to the
spontaneous induction of lytic replication in a proportion of cells.
The clustering of genes of unknown function with those that inhibit virus replication
suggests that these too have anti-viral functions (Figure 5.16A). The increase in cyclic
adenosine monophosphate (cAMP) levels that precedes the establishment of the anti
viral state (Meldolesi et al, 1977, Hubbell et al, 1991) may be mediated by adenylyl
cyclase-associated protein (CAP). The lymphoid-specific SPlOO homologue A
(LYSPIOO-A) co-localises with PML protein in the nucleus. PML protein is induced by
interferon and contributes to interferon-induced apoptosis (Quignon et al, 1998).
Phorbolin 1 is a homologue of CFM15, a protein that inhibits the replication of HIV-1 in
the absence of virion infectivity factor (Vif) (Sheehy et al, 2002).
5.3.3 PEL gene expression helps explain Its pathology
Genes that are most able to define PFL by their over-expression are involved in
inflammation, adhesion and invasion. The expression of genes encoding inflammatory
mediators correlates with data showing that PFL cells constitutively produce cytokines
(Drexler et al, 1999). The over-expression of a number of FR stress associated pathways
in PFL cells instead of a complete UPR may be related to the co-expression of
inflammatory genes as FR stress can lead to the activation of pro-inflammatory genes via
the FR overload response (FOR) (reviewed in Pahl, 1999).
It has previously been shown that PFL does not express B-cell adhesion molecules,
possibly explaining why cells do not aggregate and therefore present as effusions
(Boshoff et al, 1998). Array data confirm that PFL expresses low levels of integrin P2
(CD 18) and integrin aL (CD 11a), consistent with a plasma cell phenotype. However,
PFL expresses high levels of other adhesion molecules, such as VLA-6 , galectin-3 and
FMMPRIN (CD 147). Flow cytometry confirms the high expression of VLA- 6 on PFL
cells relative to other tumour types. VLA- 6 expression has also been documented in
254
other PEL cases (Carbone et al, 1998a, Carbone et al, 2000a). Integrin a 6 contributes to
the invasive properties of certain tumour types (Cress et al, 1995). Interaction of VLA-6
with laminin may contribute to the localization of eosinophils (Georas et al, 1993) and
ThI cells (Colantonio et al, 1999) to inflammatory sites. Galectin-3 is involved in
neutrophil extravasation (Sato et al, 2002) and may be a positive regulator of
inflammatory responses in the peritoneal cavity as knockout mice consistently develop
fewer inflammatory cell infiltrations in the peritoneal cavities (Hsu et al, 2000).
Therefore, the genes over-expressed by PEL help explain their unusual site of
presentation. The data suggest a model where PEL cells home to sites of inflammation
where they extravasate and migrate to the body cavities. If PEL cells posses a normal
cellular counterpart it may be a type of plasma cell or plasmablast that is targeted to sites
of inflammation and defined by CD 138 and VLA- 6 expression.
This suggests a model to describe how KS may develop. KSHV-infected plasma cells
home to sites of inflammation, such as precursor KS lesions, where they extravasate.
Contact-dependent transfer of KSHV from PEL cells to endothelial cells has been
demonstrated in vitro (Sakurada et al, 2001). Therefore, extravasation is a possible
means by which the KSHV-positive endothelial cells observed in KS become infected.
The expression of inflammatory mediators by KSHV-infected plasma cells may be
responsible for the high concentration of cytokines and inflammatory cells observed in
KS (section 1.2.5.1). These factors would attract more KSHV-infected plasma cells to
the developing lesion, thus increasing KSHV infection of the endothelium in a paracrine
manner.
5.3.4 The p ro cesses underlying plasm a cell differentiation and their s ta tu s
in PEL
Comparing tumours from all stages of B-cell development has revealed the changes in
expression pattern that govern a plasma cell phenotype. All post-GC tumours express
Blimp-1 mRNA, consistent with the documented expression of the protein in B-cells
leaving the GC (Angelin-Duclos et al, 2000). However, Blimp-1 is only expressed at
high levels in PEL, MM and PCL. Blimp-1 promotes plasma cell development through
the repression of genes involved in mature B-cell function (Shaffer et al, 2002). The
microarray data presented in this chapter shows that PEL cells share the low expression
255
of these genes with plasma cells. Therefore, the B-cell type from which PEL is derived
has completed this stage of B-cell development.
Plasma cell tumours express high levels of ER and Golgi genes, consistent with the
expansion of these organelles observed during differentiation of B-cells in vitro (Wiest et
al, 1990). The genes of the ER & UPR signature may connect ER stress to plasma cell
differentiation and Ig secretion through XBP-1. The clustering of numerous ER, Golgi
and trafficking genes with those known to be induced by the UPR indicates that the UPR
affects the whole secretory pathway in plasma cells, as has found to be the case for yeast
(Travers et al, 2000). The co-expression of genes involved in ATP synthesis is
consistent with the increased amounts of energy required for secretory protein
biogenesis.
XBP-1, induced by the UPR, acts downstream of Blimp-1 to activate plasma cell
development (Reimold et al, 2001, Shaffer et al, 2002). Therefore, the activation of the
UPR in PEL cells, due to the expression of SIP and the active nuclear form of ATF6 ,
suggests that PEL cells have begun plasma cell differentiation. However, the limited up-
regulation of the ER and UPR cluster in PEL compared with MM and PCL could signify
a block in this final stage of B-cell development.
Under conditions of ER stress, XBP-1 mRNA is alternatively spliced by high inositol-
requiring protein 1 (IREl) to produce a more highly active transcription factor (Yoshida
et al, 2001, Calfon et al, 2002, Lee et al, 2002). The limited up-regulation of the ER
and UPR cluster in PEL compared with MM and PCL suggests that this has not occurred
in PEL. The UPR may be triggered in plasma cells due to the production of secreted Ig.
Therefore, the limited activation of the UPR in PEL cells may be related to the lack of Ig
protein (Cesarman and Knowles, 1999) and the low expression of Ig X light chain and J
chain (Figure 5.9B). However, the production of the active form of ATF6 is not
dependent on extensive Ig synthesis (Figure 5.13).
The co-expression of genes involved in Alzheimer’s disease suggests they may function
in a single gene network in plasma cells. The expression pattern indicates this may be
related to ER homeostasis. It is not clear whether wild-type presenilin 1 has a role in
induction of the UPR (Katayama et al, 1999, Niwa et al, 1999, Sato et al, 2000,
Katayama et al, 2001, Siman et al, 2001) and its expression pattern in the PEL cluster
256
would suggest otherwise. Alzheimer’s associated genes may be involved in regulation of
ER calcium levels via AICD and Fe65 (Cao and Sudhof, 2001, Kimberly et al, 2001,
Kim et al, 2002, Leissring et al, 2002). This study shows that a number of other genes
involved in ER calcium regulation, such as calnexin, calumenin, calmodulin, calreticulin,
calpain and annexins I, V and VII, also increase in expression as tumour phenotype
progresses to plasma cell. A function for Alzheimer’s genes in B-cell calcium regulation
is also supported by the description of perturbed calcium homeostasis in peripheral
lymphocytes from Alzheimer’s patients (Eckert et al, 1997). Dysregulation of these
genes in malignant plasma cells could account for the amyloidosis that develops in a
subset of multiple myeloma patients (reviewed in Jaffe et al, 2001).
5.3.5 The plasm a cell phenotype of PEL su g g e s ts novel therap ies
The results in this chapter demonstrate that expression data can be used to predict drug
efficacy. For all samples tested, gene expression profiling is able to correctly predict
responsiveness to the vitamin D analogue EB 1089 from the expression level of VDR.
This suggests that microarrays could be used for high-throughput pharmacological
profiling of samples and to reveal which known drug targets are available for therapy.
The high expression of VDR in PEL and its sensitivity to growth inhibition by EB 1089
are consistent with a plasma cell derivation. The mechanism responsible for the
reduction in cell growth may be the inhibition of the production of IL- 6 (Muller et al,
1991, Masood et al, 2000), a growth factor for PEL (Asou et al, 1998). The ability to
predict drug sensitivity from expression data in this way suggests that the high
expression of lung resistance protein (Irp) and CD59 in PEL (Figure 5.11) could render
the tumour resistant to melphalan (Filipits et al, 1999) and rituximab (Treon et al, 2001)
respectively.
KS-derived cell lines and primary KS also express high levels of VDR and are sensitive
to the active form of vitamin D, la25 dihydroxy vitamin D3 (Masood et al, 2000).
Therefore vitamin D analogue drugs may be a promising therapy for all KSHV-
associated diseases.
257
5.4 Summary of Chapter 5
1. Gene expression profiling assembles B-cell lines by tumour type and stage of B-
cell development.
2. This allows the classification of clinical samples.
3. All cases of PEL share an expression profile regardless of Ig mutation status.
4. The PEL-like, but KSHV negative, cell line DS-1 is derived from a plasma cell.
5. The gene expression profile of PEL is most similar to tumours of plasma cells.
6. Blimp-1 is activated, and BCL-6 repressed, in PEL cells.
7. Plasma cells are characterised by high expression of ER and Golgi genes and
activation of the UPR.
8. Genes associated with Alzheimer’s disease are over-expressed in PEL and
plasma cell tumours.
9. EBV type III latency and KSHV infection are associated with an anti-viral
response.
10. Genes involved in inflammation, adhesion and invasion show elevated expression
in PEL.
11. PEL expresses high levels of integrin a6.
12. PEL is sensitive to vitamin D analogue drugs due to the high expression of VDR.
258
Chapter 6
Summary and directions for future research
In this thesis I have described the creation two DNA arrays and their use in the analysis
of KSHV and host gene expression in PEL. Both arrays are sensitive and provide
reproducible measurements of expression. I have demonstrated that array analysis
reveals the ordered series of transcriptional changes that govern KSHV replication and
the relationship between PEL and other B-cell tumour types.
PEL is a plasmacytoid tumour in which KSHV expresses three regulatory classes of
genes; class I latent, class II latent and lytic. Lytic genes can be further divided into
primary, secondary and tertiary lytic genes depending on the initial time of expression.
This classification was made by measuring expression in PEL with minimal intervention.
Although it would be a useful adjunct to monitor expression with inhibitors of translation
and herpesvirus DNA polymerase, these disturb the system and, in the case of the
inhibition of translation, have wide-ranging effects on the host cell. The expression
pattern of almost 2000 human genes indicates that PEL is arrested at the final stage of
plasma cell development. PEL shares with plasma cell tumours the low expression of
genes involved in proliferation, B-cell signalling, GC B-cell development and NF-kB
activation due to Blimp-1, but exhibits incomplete activation of the UPR, including
XBP-1. It is the interaction between KSHV genes and this plasma cell environment that
is likely to be responsible for PEL.
KSHV and EBV are both gammaherpesviruses and both infect B-cells. However, the
differences between their genomes suggest they interact with their host cell in different
ways. EBV-associated B-cell lymphomas are derived from stages along the memory B-
cell development pathway (section 1.1.2). Memory B-cells are non-dividing, long-lived
cells that EBV uses as a reservoir of latent infection. By analogy with EBV, KSHV may
drive B-cells to differentiate into plasma cells. Like memory B-cells, plasma cells are
non-dividing and can be long-lived (Miller, 1964, Manz et aL, 1997, Slifka et ai, 1998).
KSHV could therefore use long-lived plasma cells as a reservoir of latent infection. This
may be analogous to the use of neurons, also long-lived terminally differentiated cells, as
latent reservoirs by HSV-1, HSV-2 and VZV.
259
Some cases of PEL contain germline Ig genes (Matolcsy et al, 1998, Fais et al, 1999).
All KSHV-infected plasmablasts observed in MCD also have germline Ig genes (Du et
al, 2001). Therefore, KSHV may be able to activate plasma cell development from naïve
B-cells independently of the GC. However, some cases of PEL have hypermutated Ig
genes, indicating the precursor cells have passed through the GC. EBV is present in 80%
of all incidences of PEL (Cesarman and Knowles, 1999) and, as for other EBV-
associated B-cell lymphomas, these PEL cases all possess hypermutated Ig. This presents
a dichotomy; if KSHV drives pre-GC B-cells to become plasma cells by the
extrafollicular route, how do most cases of PEL become infected by EBV, which drives
the normally mutually exclusive development of memory B-cells via the GC? There are
two possible explanations for this. Firstly, both viruses infect the same pre-GC B-cells
and the cell is driven to enter the GC. In the GC, KSHV-activation of plasma cell
development overrides EBV activation of memory B-cell development and the cell
leaves as a plasmablast. A second possibility is that KSHV is able to infect memory B-
cells, including those already infected with EBV. KSHV then drives plasma cell
differentiation resulting in a somatically hypermutated plasma cell. These can give rise to
somatically hypermutated PEL that can be co-infected with EBV. The second hypothesis
is the most probable for two reasons. Firstly, it is more likely that KSHV infects post-GC
memory B-cells chronically infected with EBV than naïve B-cells acutely infected by
EBV. Secondly, KSHV is never present in BL or classical HL suggesting these are
derived from stages of B-cell development prior to KSHV infection. This second
hypothesis suggests that co-infection of PEL with EBV is observed more often in AIDS
patients because a higher proportion of the individuals memory B-cells are infected with
EBV (Babcock eta l, 1999).
The data available suggest a model for the KSHV control of B-cell development (Figure
6.1). This makes many assumptions and is highly speculative. However, the model is
useful in acting as a guide for future research.
260
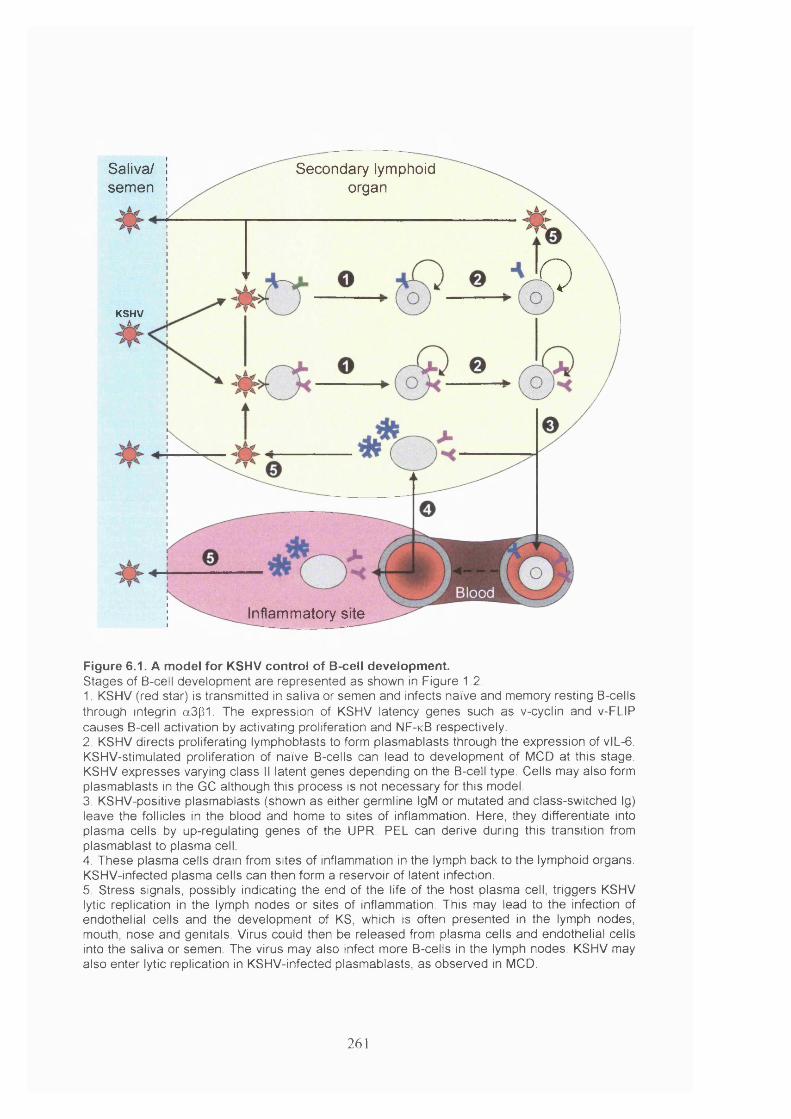
Saliva/semen
Secondary lymphoid organ
oKSHV
A
Inflammatory site
Figure 6.1. A model for KSHV control of B-cell development.Stages of B-cell development are represented as shown In Figure 1.2.1. KSHV (red star) is transmitted in saliva or semen and infects naïve and memory resting B-cells through integrin a3p1. The expression of KSHV latency genes such as v-cyclin and v-FLIP causes B-cell activation by activating proliferation and NF-kB respectively.2. KSHV directs proliferating lymphoblasts to form plasmablasts through the expression of vlL-6. KSHV-stimulated proliferation of naïve B-cells can lead to development of MCD at this stage. KSHV expresses varying class II latent genes depending on the B-cell type. Cells may also form plasmablasts in the GC although this process is not necessary for this model.3. KSHV-positive plasmablasts (shown as either germline IgM or mutated and class-switched Ig) leave the follicles in the blood and home to sites of inflammation. Here, they differentiate into plasma cells by up-regulating genes of the UPR. PEL can derive during this transition from plasmablast to plasma cell.4. These plasma cells drain from sites of inflammation in the lymph back to the lymphoid organs. KSHV-infected plasma cells can then form a reservoir of latent infection.5. Stress signals, possibly indicating the end of the life of the host plasma cell, triggers KSHV lytic replication in the lymph nodes or sites of inflammation. This may lead to the infection of endothelial cells and the development of KS, which is often presented in the lymph nodes, mouth, nose and genitals. Virus could then be released from plasma cells and endothelial cells into the saliva or semen. The virus may also infect more B-cells in the lymph nodes. KSHV may also enter lytic replication in KSHV-infected plasmablasts, as observed in MCD.
261
The stage of B-cell development represented by PEL could be analysed further by
comparing its expression profile to that of normal B-cell subsets. The identity of KSHV-
infected plasmablasts observed in MCD could also be elucidated by gene expression
profiling, although their distribution in the tissue will dictate the use of laser-capture
microdissection (Emmert-Buck et al, 1996) and RNA amplification (Van Gelder et al,
1990, Baugh et al, 2001). Different B-cell subsets could be purified from the peripheral
blood of individuals chronically infected with KSHV and tested for the presence of
KSHV by PCR. The model predicts that KSHV will be detectable in GDI38+ VLA-6+
plasma cells. The number of these cells should also increase in immunodeficient patients,
as is the case for EBV-infected memory B-cells (Babcock et al, 1999). Cells could also
be sorted from tonsils to confirm that KSHV is able to infect naïve B-cells and memory
B-cells. The model also predicts that KSHV-infected plasma cells home to sites of
inflammation and will be present in KS tissue. EBV-infected memory B-cells home back
to the tonsils where progeny virus is produced (Laichalk et al, 2002). As KS is often
present in the mouth, nose or genitalia (reviewed in Boshoff and Weiss, 2002), this
suggests that KSHV-infected B-cells may specifically home to these sites in order to
transmit the virus. The importance of VLA-6 for PEL homing could be tested in mice or
in vitro by examining binding to laminin.
Both array data and previous gene expression analyses suggest that like EBV, KSHV has
different latency progranunes. KSHV class I latent genes appear to be expressed during
latency in all KSHV-infected dividing cells. These genes, which include LNA-1, v-
cyclin, v-FLIP and possibly K15, are thus analogous to EBV EBNAl, BARTs and
EBERs. Class II genes include kaposin, KIO and vOX-2. These genes are expressed
during latency in the cell line BC-3 and up-regulated during lytic replication in BC-3 and
other PEL samples. The class II genes expressed in different KSHV infected cells may
be variable. For example, KlO.5/10.7 is a lytic gene in BC-3 but may be latent in other
PEL cell lines and in MCD (Rivas et al, 2001). Similarly, KIO may only be expressed in
BC-3. vIL-6 behaves like a lytic gene in PEL but is expressed in a larger proportion of
KSHV-infected plasmablasts in MCD (Staskus et al, 1999, Parravicini et al, 2000,
Brousset et al, 2001, Du et al, 2001). Expression of these genes in individual latent PEL
cells needs to be confirmed by other techniques such as in situ hybridisation and
immunohistochemistry. The variation in KSHV expression patterns suggests the virus
adopts different latency programmes in infected cells by varying the class II genes it
262
expresses. Class II genes may therefore be analogous to EBNA2, 3A, 3B and 3C and
LMP-1, 2A and 2B.
The KSHV array could be used to screen for latent genes in more PEL samples, KS and
MCD and in endothelial cells infected in vitro. The identification of groups of co
regulated genes by cluster analysis will reveal both the number of latency programmes
and the genes that they comprise. Once the arrays had identified a set of candidate genes,
other techniques could then be used to verify expression of these genes in each disease.
The analysis of the promoter sequences of each group of genes would provide
information as to how expression of the KSHV genome is regulated.
The plasma cell phenotype of PEL has implications for the function of KSHV genes
because this is the environment in which they have to operate, both during latency and
during lytic replication. Also, EBV genes such as LMP-1 and LMP-2A mimic normal B-
cell signalling pathways to activate memory B-cell development (section 1.1.2).
Therefore, KSHV genes may act in a similar manner to activate plasma cell
development. By analogy with EBV, the mimicry of host plasma cell signalling
pathways by KSHV latent genes may promote lymphomagenesis. This provides a
context for the future analysis of the functions of KSHV genes. The prime candidates for
driving plasma cell development are those expressed during latency in PEL and MCD.
One such candidate is vIL-6, which is expressed by plasmablasts in MCD (Staskus et al.,
1999, Parravicini et al., 2000, Brousset et al, 2001, Du et al, 2001). This gene could be
tested to see whether it is able to induce expression of XBP-1, as it the case for its
cellular counterpart (Wen et al, 1999). In addition, the expression of cyclin D2 and FLIP
suggest these genes have important functions in late stages of B-cell development,
providing a rationale for the piracy of these genes by KSHV and their expression during
latency. Similarly, the function of IRF4 in plasma cell development suggests that one or
more of the four KSHV-encoded IRFs may function in an analogous manner. The class I
latent protein K15 may interact with plasma cell ER signalling pathways through
interaction with ER localised HAX-1 (Sharp et al, 2002), which is in the ER and UPR
cluster. EBV may express LMP-2A in memory B-cells to provide survival signals.
Finally, the closest human homologue to vBcl-2 is the plasma cell survival factor Mcl-l
(Puthier et al, 1999). Therefore, this class II latent KSHV gene could have a similar role
to LMP-2A in KSHV-infected plasma cells. The plasma cell phenotype of PEL also has
implications for KSHV lytic replication. KSHV latent proteins could promote plasma
263
cell development so the virus can then utilise the well developed ER and Golgi apparatus
for the rapid synthesis of large amounts of lytic viral proteins.
To understand how KSHV interacts with the host B-cell, it will be important to find
which KSHV genes are expressed in normal B-cells subsets in vivo in addition to KSHV-
infected tumours. This would also reveal whether KSHV expresses different sets of
latent genes according to the stage of B-cell development and how this relates to the
various tumour types. Expressed genes could be detected by RT-PCR or DNA array
analysis of amplified RNA. For example, BC-3 expresses higher levels of class II latent
genes than other PEL cases. It will be important to investigate whether this expression
pattern is common to incidences of PEL with unmutated Ig genes and if KSHV adopts
different latency programmes depending on whether the virus has infected naïve or
memory B-cells. KSHV may not have to express as many genes in memory B-cells as in
naïve B-cells because these differentiate into plasma cells more readily (Arpin et aL,
1997). The assembly of in vivo infected B-cell subsets by stage of B-cell development
will show how KSHV temporally regulates expression of its genome to control B-cell
development. This could also be followed after infection of B-cells in vitro. The
simultaneous analysis of host gene expression during KSHV infection will provide
information on how the two genomes interact to control the fate of the host cell.
264
References
Ablashi, D., Chatlynne, L., Cooper, H., Thomas, D., Yadav, M., Norhanom, A. W., Chandana, A. K., Churdboonchart, V., Kulpradist, S. A., Patnaik, M., et al. (1999). Seroprevalence of human herpesvirus-8 (HHV-8) in countries of Southeast Asia compared to the USA, the Caribbean and Africa. Br J Cancer 81, 893-897.
Abney, E. R., Cooper, M. D., Kearney, J. F., Lawton, A. R., and Parkhouse, R. M. (1978). Sequential expression of immunoglobulin on developing mouse B lymphocytes: a systematic survey that suggests a model for the generation of immunoglobulin isotype diversity. J Immunol 120, 2041-2049.
Adams, P. D. (2001). Regulation of the retinoblastoma tumor suppressor protein by cyclin/cdks. Biochim Biophys Acta 1471, M123-133.
Ahn, J. W., Powell, K. L., Kellam, P., and Alber, D. G. (2002). Gammaherpesvirus lytic gene expression as characterized by DNA array. J Virol 76, 6244-6256.
Akula, S. M., Pramod, N. P., Wang, F. Z., and Chandran, B. (2001a). Human herpesvirus 8 envelope- associated glycoprotein B interacts with heparan sulfate-like moieties. Virology 284, 235-249.
Akula, S. M., Wang, F. Z., Vieira, J., and Chandran, B. (2001b). Human herpesvirus 8 interaction with target cells involves heparan sulfate. Virology 282, 245-255.
Akula, S. M., Pramod, N. P., Wang, F. Z., and Chandran, B. (2002). Integrin alpha3betal (CD 49c/29) is a cellular receptor for Kaposi's sarcoma-associated herpesvirus (KSHV/HHV-8) entry into the target cells. Cell 108, 407-419.
Alba, M. M., Das, R., Orengo, C. A., and Kellam, P. (2001a). Genomewide function conservation and phylogeny in the Herpesviridae. Genome Res 11, 43-54.
Alba, M. M., Lee, D., Pearl, F. M., Shepherd, A. J., Martin, N., Orengo, C. A., and Kellam, P. (2001b). VIDA: a virus database system for the organization of animal virus genome open reading frames. Nucleic Acids Res 29, 133-136.
Alber, D., and Staeheli, P. (1996). Partial inhibition of vesicular stomatitis virus by the interferon-induced human 9-27 protein. J Interferon Cytokine Res 16, 375-380.
Alcami, A., and Koszinowski, U. H. (2000). Viral mechanisms of immune evasion. Trends Microbiol 8, 410-418.
Alizadeh, A. A., Eisen, M. B., Davis, R. E., Ma, C., Lossos, I. S., Rosenwald, A., Boldrick, J. C., Sabet,H., Tran, T., Yu, X., et al. (2000). Distinct types of diffuse large B-cell lymphoma identified by gene expression profiling. Nature 403, 503-511.
Allday, M. J., Crawford, D. H., and Griffin, B. E. (1989). Epstein-Barr virus latent gene expression during the initiation of B cell immortalization. J Gen Virol 70 ( Pt 7), 1755-1764.
Altschul, S. F., Gish, W., Miller, W., Myers, E. W., and Lipman, D. J. (1990). Basic local alignment search tool. J Mol Biol 215, 403-410.
Aman, P., Ehlin-Henriksson, B., and Klein, G. (1984). Epstein-Barr virus susceptibility of normal human B lymphocyte populations. J Exp Med 159, 208-220.
Ambinder, R. F., Browning, P. J., Lorenzana, I., Leventhal, B. G., Cosenza, H., Mann, R. B., MacMahon, E. M., Medina, R., Cardona, V., Grufferman, S., and et al. (1993). Epstein-Barr virus and childhood Hodgkin's disease in Honduras and the United States. Blood 81, 462-467.
Ambroziak, J. A., Blackboum, D. J., Hemdier, B. G., Glogau, R. G., Gullett, J. H., McDonald, A. R., Lennette, E. T., and Levy, J. A. (1995). Herpes-like sequences in HIV-infected and uninfected Kaposi's sarcoma patients. Science 268, 582-583.
265
Anagnostopoulos, I., Herbst, H., Niedobitek, G., and Stein, H. (1989). Demonstration of monoclonal EBV genomes in Hodgkin's disease and Ki-1-positive anaplastic large cell lymphoma by combined Southern blot and in situ hybridization. Blood 74, 810-816.
Anagnostopoulos, I., Hummel, M., Kreschel, C., and Stein, H. (1995). Morphology, immunophenotype, and distribution of latently and/or productively Epstein-Barr virus-infected cells in acute infectious mononucleosis: implications for the interindividual infection route of Epstein-Barr virus. Blood 85, 744- 750.
Anderson, S. M., and Mladenovic, J. (1996). The BCR-ABL oncogene requires both kinase activity and src-homology 2 domain to induce cytokine secretion. Blood 87, 238-244.
Andreoni, M., El-Sawaf, G., Rezza, G., Ensoli, B., Nicastri, E., Ventura, L., Ercoli, L., Sarmati, L., and Rocchi, G. (1999). High seroprevalence of antibodies to human herpesvirus-8 in Egyptian children: evidence of nonsexual transmission. J Natl Cancer Inst 91, 465-469.
Angelin-Duclos, C., Cattoretti, G., Lin, K. I., and Calame, K. (2000). Commitment of B lymphocytes to a plasma cell fate is associated with Blimp-1 expression in vivo. J Immunol 165, 5462-5471.
Ansari, M. Q., Dawson, D. B., Nador, R., Rutherford, C., Schneider, N. R., Latimer, M. J., Picker, L., Knowles, D. M., and McKenna, R. W. (1996). Primary body cavity-based AIDS-related lymphomas. Am J Clin Pathol 105, 221-229.
Aoki, Y., Jaffe, E. S., Chang, Y., Jones, K., Teruya-Feldstein, J., Moore, P. S., and Tosato, G. (1999). Angiogenesis and hematopoiesis induced by Kaposi's sarcoma-associated herpesvirus-encoded interleukin-6. Blood 93, 4034-4043.
Aoki, Y., and Tosato, G. (1999). Role of vascular endothelial growth factor/vascular permeability factor in the pathogenesis of Kaposi's sarcoma-associated herpesvirus-infected primary effusion lymphomas. Blood 94, 4247-4254.
Arakawa, H., Shimizu, T., and Takeda, S. (1996). Re-evaluation of the probabilities for productive arrangements on the kappa and lambda loci. Int Immunol 8, 91-99.
Armstrong, J. A., Pereira, H. G., and Andrewes, C. H. (1961). Observations of the virus of infectious bovine rhinotracheitis and its affinity with the herpesvirus group. Virology 14, 276-285.
Armstrong, S. A., Staunton, J. E., Silverman, L. B., Pieters, R., den Boer, M. L., Minden, M. D., Sallan, S. E., Lander, E. S., Golub, T. R., and Korsmeyer, S. J. (2002). MLL translocations specify a distinct gene expression profile that distinguishes a unique leukemia. Nat Genet 30, 41-47.
Arpin, C., Banchereau, J., and Liu, Y. J. (1997). Memory B cells are biased towards terminal differentiation: a strategy that may prevent repertoire freezing. J Exp Med 186, 931-940.
Arpin, C., Dechanet, J., Van Kooten, C., Merville, P., Grouard, G., Briere, P., Banchereau, J., and Liu, Y.J. (1995). Generation of memory B cells and plasma cells in vitro. Science 268, 720-722.
Artavanis-Tsakonas, S., Matsuno, K., and Fortini, M. E. (1995). Notch signaling. Science 268, 225-232.
Arvanitakis, L., Geras-Raaka, E., Varma, A., Gershengom, M. C., and Cesarman, E. (1997). Human herpesvirus KSHV encodes a constitutively active G-protein-coupled receptor linked to cell proliferation. Nature 385, 347-350.
Arvanitakis, L., Mesri, E. A., Nador, R. G., Said, J. W., Asch, A. S., Knowles, D. M., and Cesarman, E. (1996). Establishment and characterization of a primary effusion (body cavity-based) lymphoma cell line (BC-3) harboring kaposi's sarcoma-associated herpesvirus (KSHV/HHV-8) in the absence of Epstein-Barr virus. Blood 88, 2648-2654.
Arvanitakis, L., Yaseen, N., and Sharma, S. (1995). Latent membrane protein-1 induces cyclin D2 expression, pRb hyperphosphorylation, and loss of TGF-beta 1-mediated growth inhibition in EBV- positive B cells. J Immunol 155, 1047-1056.
266

Ascherl, G., Hohenadl, C., Monini, P., Zietz, C., Browning, P. J., Ensoli, B., and Sturzl, M. (1999). Expression of human herpesvirus-8 (HHV-8) encoded pathogenic genes in Kaposi's sarcoma (KS) primary lesions. Adv Enzyme Regul 39, 331-339.
Asosingh, K., Gunthert, U., Bakkus, M. H., De Raeve, H., Goes, E., Van Riet, I., Van Camp, B., and Vanderkerken, K. (2000). In vivo induction of insulin-like growth factor-I receptor and CD44v6 confers homing and adhesion to murine multiple myeloma cells. Cancer Res 60, 3096-3104.
Asou, H., Said, J. W., Yang, R., Munker, R., Park, D. J., Kamada, N., and Koeffler, H. P. (1998). Mechanisms of growth control of Kaposi's sarcoma-associated herpes virus-associated primary effusion lymphoma cells. Blood 91, 2475-2481.
AuCoin, D. P., Colletti, K. S., Xu, Y., Cei, S. A., and Pari, G. S. (2002). Kaposi's sarcoma-associated herpesvirus (human herpesvirus 8) contains two functional lytic origins of DNA replication. J Virol 76, 7890-7896.
Austin, P. J., Flemington, E., Yandava, C. N., Strominger, J. L., and Speck, S. H. (1988). Complex transcription of the Epstein-Barr virus BamHl fragment H rightward open reading frame 1 (BHRFl) in latently and lytically infected B lymphocytes. Proc Natl Acad Sci U S A 85, 3678-3682.
Babcock, G. J., Decker, L. L., Freeman, R. B., and Thorley-Lawson, D. A. (1999). Epstein-barr virus- infected resting memory B cells, not proliferating lymphoblasts, accumulate in the peripheral blood of immunosuppressed patients. J Exp Med 190, 567-576.
Babcock, G. J., Decker, L. L., Volk, M., and Thorley-Lawson, D. A. (1998). EBV persistence in memory B cells in vivo. Immunity 9, 395-404.
Babcock, G. J., Hochberg, D., and Thorley-Lawson, A. D. (2000). The expression pattern of Epstein-Barr virus latent genes in vivo is dependent upon the differentiation stage of the infected B cell. Immunity 13, 497-506.
Babcock, G. J., and Thorley-Lawson, D. A. (2000). Tonsillar memory B cells, latently infected with Epstein-Barr virus, express the restricted pattern of latent genes previously found only in Epstein-Barr virus-associated tumors. Proc Natl Acad Sci U S A 97, 12250-12255.
Baeuerle, P. A., and Henkel, T. (1994). Function and activation of NF-kappa B in the immune system. Annu Rev Immunol 12, 141-179.
Baghian, A., Luftig, M., Black, J. B., Meng, Y. X., Pau, C. P., Voss, T., Pellett, P. E., and Kousoulas, K.G. (2000). Glycoprotein B of Human Herpesvirus 8 Is a Component of the Virion in a Cleaved Form Composed of Amino- and Carboxyl-Terminal Fragments. Virology 269, 18-25.
Babler, D. W., Pindzola, J. A., and Swerdlow, S. H. (2002). Splenic marginal zone lymphomas appear to originate from different B cell types. Am J Pathol 161, 81-88.
Bain, G., Maandag, E. C., Izon, D. J., Amsen, D., Kruisbeek, A. M., Weintraub, B. C., Krop, L, Schlissel, M. S., Feeney, A. J., van Roon, M., and et al. (1994). E2A proteins are required for proper B cell development and initiation of immunoglobulin gene rearrangements. Cell 79, 885-892.
Bais, C., Santomasso, B., Coso, O., Arvanitakis, L., Raaka, E. G., Gutkind, J. S., Asch, A. S., Cesarman,E., Gershengom, M. C., Mesri, E. A., and Gerhengom, M. C. (1998). G-protein-coupled receptor of Kaposi's sarcoma-associated herpesvirus is a viral oncogene and angiogenesis activator. Nature 391, 86-89.
Bakkus, M. H., Heirman, C., Van Riet, 1., Van Camp, B., and Thielemans, K. (1992). Evidence that multiple myeloma Ig heavy chain VDJ genes contain somatic mutations but show no intraclonal variation. Blood 80, 2326-2335.
Balachandran, S., Kim, C. N., Yeh, W. C., Mak, T. W., Bhalla, K., and Barber, G. N. (1998). Activation of the dsRNA-dependent protein kinase, PKR, induces apoptosis through FADD-mediated death signaling. Embo J77, 6888-6902.
Ballestas, M. E., Chatis, P. A., and Kaye, K. M. (1999). Efficient persistence of extrachromosomal KSHV DNA mediated by latency-associated nuclear antigen. Science 284, 641-644.
267

Ballestas, M. E., and Kaye, K. M. (2001). Kaposi's sarcoma-associated herpesvirus latency-associated nuclear antigen 1 mediates episome persistence through cis-acting terminal repeat (TR) sequence and specifically binds TR DNA. J Virol 75, 3250-3258.
Barbey, S., Gogusev, J., Mouly, H., Le Pelletier, O., Smith, W., Richard, S., Soulie, J., and Nezelof, C. (1990). DEL cell line: a "malignant histiocytosis" CD30+ t(5;6)(q35;p21) cell line. Int J Cancer 45, 546- 553.
Bargou, R. C., Emmerich, P., Krappmann, D., Bommert, K., Mapara, M. Y., Arnold, W., Royer, H. D., Grinstein, E., Greiner, A., Scheidereit, C., and Dorken, B. (1997). Constitutive nuclear factor-kappaB- RelA activation is required for proliferation and survival of Hodgkin's disease tumor cells. J Clin Invest 100, 2961-2969.
Bargou, R. C., Leng, C., Krappmann, D., Emmerich, P., Mapara, M. Y., Bommert, K., Royer, H. D., Scheidereit, C., and Dorken, B. (1996). High-level nuclear NF-kappa B and Oct-2 is a common feature of cultured Hodgkin/Reed-Stemberg cells. Blood 87, 4340-4347.
Batterson, W., and Roizman, B. (1983). Characterization of the herpes simplex virion-associated factor responsible for the induction of alpha genes. J Virol 46, 371-377.
Bauch, A., Alt, F. W., Crabtree, G. R., and Snapper, S. B. (2000). The cytoskeleton in lymphocyte signaling. Adv Immunol 75, 89-114.
Baugh, L. R., Hill, A. A., Brown, E. L., and Hunter, C. P. (2001). Quantitative analysis of mRNA amplification by in vitro transcription. Nucleic Acids Res 29, E29.
Bayley, A. C. (1984). Aggressive Kaposi's sarcoma in Zambia, 1983. Lancet 1, 1318-1320.
Bello, L. J., Davison, A. J., Glenn, M. A., Whitehouse, A., Rethmeier, N., Schulz, T. P., and Barklie Clements, J. (1999). The human herpesvirus-8 ORE 57 gene and its properties. J Gen Virol 80, 3207-3215.
Bellows, D. S., Chau, B. N., Lee, P., Lazebnik, Y., Bums, W. H., and Hardwick, J. M. (2000). Antiapoptotic herpesvirus Bcl-2 homologs escape caspase-mediated conversion to proapoptotic proteins. J Virol 74, 5024-5031.
Ben-Bassat, H., Goldblum, N., Mitrani, S., Goldblum, T., Yoffey, J. M., Cohen, M. M., Bentwich, Z., Ramot, B., Klein, E., and Klein, G. (1977). Establishment in continuous culture of a new type of lymphocyte from a "Burkitt like" malignant lymphoma (line D.G.-75). Int J Cancer 19, 27-33.
Benner, R., Hijmans, W., and Haaijman, J. J. (1981). The bone marrow: the major source of serum immunoglobulins, but still a neglected site of antibody formation. Clin Exp Immunol 46, 1-8.
Beral, V., Peterman, T., Berkelman, R., and Jaffe, H. (1991). AIDS-associated non-Hodgkin lymphoma. Lancet 337, 805-809.
Beral, V., Peterman, T. A., Berkelman, R. L., and Jaffe, H. W. (1990). Kaposi's sarcoma among persons with AIDS: a sexually transmitted infection? Lancet 335, 123-128.
Berberich, L, Shu, G. L., and Clark, E. A. (1994). Cross-linking CD40 on B cells rapidly activates nuclear factor-kappa B. J Immunol 153, 4357-4366.
Berek, C., Berger, A., and Apel, M. (1991). Maturation of the immune response in germinal centers. Cell 67, 1121-1129.
Berek, C., Jarvis, J. M., and Milstein, C. (1987). Activation of memory and virgin B cell clones in hyperimmune animals. Eur J Immunol 17, 1121-1129.
Bergsagel, P. L., Chesi, M., Nardini, E., Brents, L. A., Kirby, S. L., and Kuehl, W. M. (1996).Promiscuous translocations into immunoglobulin heavy chain switch regions in multiple myeloma. Proc Natl Acad Sci U S A 93, 13931-13936.
268
Bergsagel, P. L., and Kuehl, W. M. (2001). Chromosome translocations in multiple myeloma. Oncogene 20, 5611-5622.
Berland, R., and Wortis, H. H. (2002). Origins and functions of B-1 cells with notes on the role of CD5. Annu Rev Immunol 20, 253-300.
Bertin, J., Armstrong, R. C., Ottilie, S., Martin, D. A., Wang, Y., Banks, S., Wang, G. H., Senkevich, T.G., Alnemri, E. S., Moss, B., et a l (1997). Death effector domain-containing herpesvirus and poxvirus proteins inhibit both Fas- and TNFRl-induced apoptosis. Proc Natl Acad Sci U S A 94, 1172-1176.
Bhatia, K., Spangler, G., Hamdy, N., Neri, A., Brubaker, G., Levin, A., and Magrath, I. (1995). Mutations in the coding region of c-myc occur independently of mutations in the regulatory regions and are predominantly associated with myc/Ig translocation. Curr Top Microbiol Immunol 194, 389-398.
Bieleski, L., and Talbot, S. J, (2001). Kaposi's Sarcoma-Associated Herpesvirus vCyclin Open Reading Frame Contains an Internal Ribosome Entry Site. J Virol 75, 1864-1869.
Bigger, C. B., Brasky, K. M., and Lanford, R. F. (2001). DNA microarray analysis of chimpanzee liver during acute resolving hepatitis C virus infection. J Virol 75, 7059-7066.
Bimboim, H. C., and Doly, J. (1979). A rapid alkaline extraction procedure for screening recombinant plasmid DNA. Nucleic Acids Res 7, 1513-1523.
Blasig, C., Zietz, C., Haar, B., Neipel, F., Fsser, S., Brockmeyer, N. H., Tschachler, F., Colombini, S., Ensoli, B., and Sturzl, M. (1997). Monocytes in Kaposi's sarcoma lesions are productively infected by human herpesvirus 8. J Virol 71, 7963-7968.
Bock, G. H., Long, C. A., Riley, M. L., White, J. D., Kurman, C. C., Fleisher, T. A., Tsokos, M., Brown, M., Serbousek, D., Schwietermann, W. D., and et al. (1993). Characterization of a new IL-6-dependent human B-lymphoma cell line in long term culture. Cytokine 5, 480-489.
Boehmer, P. F., and Lehman, I. R. (1997). Herpes simplex virus DNA replication. Annu Rev Biochem 66, 347-384.
Boiocchi, M., Dolcetti, R., De Re, V., Gloghini, A., and Carbone, A. (1993). Demonstration of a unique Fpstein-Barr virus-positive cellular clone in metachronous multiple localizations of Hodgkin's disease. Am J Pathol 142, 33-38.
Boldrick, J. C., Alizadeh, A. A., Diehn, M., Dudoit, S., Liu, C. L., Belcher, C. F., Botstein, D., Staudt, L. M., Brown, P. O., and Reiman, D. A. (2002). Stereotyped and specific gene expression programs in human innate immune responses to bacteria. Proc Natl Acad Sci U S A 99, 972-977.
Bolt, G., Berg, K., and Blixenkrone-Moller, M. (2002). Measles virus-induced modulation of host-cell gene expression. J Gen Virol 83, 1157-1165.
Bonaldo, M. F., Lennon, G., and Soares, M. B. (1996). Normalization and subtraction: two approaches to facilitate gene discovery. Genome Res 6, 791-806.
Boshoff, C., Fndo, Y., Collins, P. D., Takeuchi, Y., Reeves, J. D., Schweickart, V. L., Siani, M. A., Sasaki, T., Williams, T. J., Gray, P. W., et a l (1997). Angiogenic and HIV-inhibitory functions of KSHV-encoded chemokines. Science 278, 290-294.
Boshoff, C., Gao, S. J., Healy, L. F., Matthews, S., Thomas, A. J., Coignet, L., Wamke, R. A., Strauchen, J. A., Matutes, F., Kamel, O. W., et a l (1998). Establishing a KSHV+ cell line (BCP-1) from peripheral blood and characterizing its growth in Nod/SCID mice. Blood 91, 1671-1679.
Boshoff, C., Schulz, T. F., Kennedy, M. M., Graham, A. K., Fisher, C., Thomas, A., McGee, J. O., Weiss, R. A., and O'Leary, J. J. (1995). Kaposi's sarcoma-associated herpesvirus infects endothelial and spindle cells. Nat Med 1, 1274-1278.
Boshoff, C., and Weiss, R. (2002). AIDS-related malignancies. Nature Rev Cancer 2, 373-382.
269
Boshoff, C., and Weiss, R. A. (2001). Epidemiology and pathogenesis of Kaposi's sarcoma-associated herpesvirus. Philos Trans R Soc Lond B Biol Sci 356, 517-534.
Bourboulia, D., Whitby, D., Boshoff, C., Newton, R., Beral, V., Carrara, H., Lane, A., and Sitas, F. (1998). Serologic evidence for mother-to-child transmission of Kaposi sarcoma-associated herpesvirus infection. Jama 280, 31-32.
Brack, A. R., Dijkstra, J. M., Granzow, H., Klupp, B. G., and Mettenleiter, T. C. (1999). Inhibition of virion maturation by simultaneous deletion of glycoproteins E, I, and M of pseudorabies virus. J Virol 73, 5364-5372.
Brack, A. R., Klupp, B. G., Granzow, H., Tirabassi, R., Enquist, L. W., and Mettenleiter, T. C. (2000). Role of the cytoplasmic tail of pseudorabies virus glycoprotein E in virion formation. J Virol 74, 4004- 4016.
Braeuninger, A., Kuppers, R., Strickier, J. G., Wacker, H. H., Rajewsky, K., and Hansmann, M. L. (1997). Hodgkin and Reed-Stemberg cells in lymphocyte predominant Hodgkin disease represent clonal populations of germinal center-derived tumor B cells. Proc Natl Acad Sci U S A 94, 9337-9342.
Brander, C., Suscovich, T., Lee, Y., Nguyen, P. T., O'Connor, P., Seebach, J., Jones, N. G., van Gorder, M., Walker, B. D., and Scadden, D. T. (2000). Impaired CTL recognition of cells latently infected with Kaposi's sarcoma-associated herpes virus. J Immunol 165, 2077-2083.
Bresnahan, W. A., and Shenk, T. (2000). A subset of viral transcripts packaged within human cytomegalovirus particles. Science 288, 2373-2376.
Brodsky, J. L., and McCracken, A. A. (1999). ER protein quality control and proteasome-mediated protein degradation. Semin Cell Dev Biol 10, 507-513.
Brooks, J. J. (1986). Kaposi's sarcoma: a reversible hyperplasia. Lancet 2, 1309-1311.
Brousset, P., Cesarman, E., Meggetto, P., Lamant, L., and Delsol, G. (2001). Colocalization of the viral interleukin-6 with latent nuclear antigen-1 of human herpesvirus-8 in endothelial spindle cells of Kaposi's sarcoma and lymphoid cells of multicentric Castleman's disease. Hum Pathol 32, 95-100.
Brown, A. J., Planta, R. J., Restuhadi, P., Bailey, D. A., Butler, P. R., Cadahia, J. L., Cerdan, M. E., De Jonge, M., Gardner, D. C., Gent, M. E., et a l (2001). Transcript analysis of 1003 novel yeast genes using high-throughput northern hybridizations. Embo J 20, 3177-3186.
Brown, M. P., Grundy, W. N., Lin, D., Cristianini, N., Sugnet, C. W., Purey, T. S., Ares, M., Jr., and Haussier, D. (2000). Knowledge-based analysis of microarray gene expression data by using support vector machines. Proc Natl Acad Sci U S A 97, 262-267.
Browne, E. P., Wing, B., Coleman, D., and Shenk, T. (2001). Altered cellular mRNA levels in human cytomegalovirus-infected fibroblasts: viral block to the accumulation of antiviral mRNAs. J Virol 75, 12319-12330.
Burger, R., Neipel, P., Pleckenstein, B., Savino, R., Ciliberto, G., Kalden, J. R., and Gramatzki, M. (1998). Human herpesvirus type 8 interleukin-6 homologue is functionally active on human myeloma cells. Blood 91, 1858-1863.
Burkhardt, A. L., Bolen, J. B., Kieff, E., and Longnecker, R. (1992). An Epstein-Barr virus transformation- associated membrane protein interacts with src family tyrosine kinases. J Virol 66, 5161-5167.
Burysek, L., and Pitha, P. M. (2001). Latently Expressed Human Herpesvirus 8-Encoded Interferon Regulatory Factor 2 Inhibits Double-Stranded RNA-Activated Protein Kinase. J Virol 75, 2345-2352.
Burysek, L., Yeow, W. S., Lubyova, B., Kellum, M., Schafer, S. L., Huang, Y. Q., and Pitha, P. M. (1999a). Functional analysis of human herpesvirus 8-encoded viral interferon regulatory factor 1 and its association with cellular interferon regulatory factors and p300. J Virol 73, 7334-7342.
Burysek, L., Yeow, W. S., and Pitha, P. M. (1999b). Unique properties of a second human herpesvirus 8- encoded interferon regulatory factor (vlRP-2). J Hum Virol 2, 19-32.
270
Busch, L. K., and Bishop, G. A. (1999). The EBV transforming protein, latent membrane protein 1, mimics and cooperates with CD40 signaling in B lymphocytes. J Immunol 162, 2555-2561.
Cabannes, E., Khan, G., Aillet, P., Jarrett, R. P., and Hay, R. T. (1999). Mutations in the IkBa gene in Hodgkin's disease suggest a tumour suppressor role for IkappaBalpha. Oncogene 18, 3063-3070.
Calabro, M. L., Sheldon, J., Pavero, A., Simpson, G. R., Piore, J. R., Gomes, E., Angarano, G., Chieco- Bianchi, L., and Schulz, T. P. (1998). Seroprevalence of Kaposi's sarcoma-associated herpesvirus/human herpesvirus 8 in several regions of Italy. J Hum Virol 1, 207-213.
Caldwell, R. G., Wilson, J. B., Anderson, S. J., and Longnecker, R. (1998). Epstein-Barr virus LMP2A drives B cell development and survival in the absence of normal B cell receptor signals. Immunity 9, 405- 411.
Calfon, M., Zeng, H., Urano, P., Till, J. H., Hubbard, S. R., Harding, H. P., Clark, S. G., and Ron, D. (2002). IREl couples endoplasmic reticulum load to secretory capacity by processing the XBP-1 mRNA. Nature 415, 92-96.
Callahan, J., Pai, S., Cotter, M., and Robertson, E. S. (1999). Distinct patterns of viral antigen expression in Epstein-Barr virus and Kaposi's sarcoma-associated herpesvirus coinfected body-cavity-based lymphoma cell lines: potential switches in latent gene expression due to coinfection. Virology 262, 18-30.
Callow, M. J., Dudoit, S., Gong, E. L., Speed, T. P., and Rubin, E. M. (2000). Microarray expression profiling identifies genes with altered expression in HDL-deficient mice. Genome Res 10, 2022-2029.
Campadelli-Piume, G., Arsenakis, M., Parabegoli, P., and Roizman, B. (1988). Entry of herpes simplex virus 1 in BJ cells that constitutively express viral glycoprotein D is by endocytosis and results in degradation of the virus. J Virol 62, 159-167.
Campbell, M. E., Palfreyman, J. W., and Preston, C. M. (1984). Identification of herpes simplex virus DNA sequences which encode a trans-acting polypeptide responsible for stimulation of immediate early transcription. J Mol Biol 180, 1-19.
Cannon, J. S., Ciufo, D., Hawkins, A. L., Griffin, C. A., Borowitz, M. J., Hayward, G. S., and Ambinder, R. P. (2000). A new primary effusion lymphoma-derived cell line yields a highly infectious Kaposi's sarcoma herpesvirus-containing supernatant. J Virol 74, 10187-10193.
Cannon, J. S., Hamzeh, P., Moore, S., Nicholas, J., and Ambinder, R. P. (1999a). Human herpesvirus 8- encoded thymidine kinase and phosphotransferase homologues confer sensitivity to ganciclovir. J Virol 73, 4786-4793.
Cannon, J. S., Nicholas, J., Orenstein, J. M., Mann, R. B., Murray, P. G., Browning, P. J., DiGiuseppe, J.A., Cesarman, E., Hayward, G. S., and Ambinder, R. P. (1999b). Heterogeneity of viral IL-6 expression in HHV-8-associated diseases. J Infect Dis 180, 824-828.
Cannon, M. J., Dollard, S. C., Smith, D. K., Klein, R. S., Schuman, P., Rich, J. D., Vlahov, D., and Pellett, P. E. (2001). Blood-borne and sexual transmission of human herpesvirus 8 in women with or at risk for human immunodeficiency virus infection. N Engl J Med 344, 637-643.
Cao, X., and Sudhof, T. C. (2001). A transcriptionally active complex of APP with Pe65 and histone acetyltransferase Tip60. Science 293, 115-120.
Carbone, A., Cilia, A. M., Gloghini, A., Canzonieri, V., Pastore, C., Todesco, M., Cozzi, M., Perin, T., Volpe, R., Pinto, A., and Gaidano, G. (1997). Establishment of HHV-8-positive and HHV-8-negative lymphoma cell lines from primary lymphomatous effusions. Int J Cancer 73, 562-569.
Carbone, A., Cilia, A. M., Gloghini, A., Capello, D., Passone, L., Perin, T., Rossi, D., Canzonieri, V., De Paoli, P., Vaccher, E., et al. (2000a). Characterization of a novel HHV-8-positive cell line reveals implications for the pathogenesis and cell cycle control of primary effusion lymphoma. Leukemia 14, 1301-1309.
271
Carbone, A., Cilia, A. M., Gloghini, A., Capello, D., Todesco, M., Quattrone, S., Volpe, R., and Gaidano, G. (1998a). Establishment and characterization of EBV-positive and EBV-negative primary effusion lymphoma cell lines harbouring human herpesvirus type-8. Br J Haematol 102, 1081-1089.
Carbone, A., and Gaidano, G. (1997). HHV-8-positive body-cavity-based lymphoma: a novel lymphoma entity. Br J Haematol 97, 515-522.
Carbone, A., Gloghini, A., Cozzi, M. R., Capello, D., Steffan, A., Monini, P., De Marco, L., and Gaidano,G. (2000b). Expression of MUM1/IRF4 selectively clusters with primary effusion lymphoma among lymphomatous effusions: implications for disease histogenesis and pathogenesis. Br J Haematol 111, 247- 257.
Carbone, A., Gloghini, A., Gaidano, G., Franceschi, S., Capello, D., Drexler, H. G., Falini, B., and Dalla- Favera, R. (1998b). Expression status of BCL-6 and syndecan-1 identifies distinct histogenetic subtypes of Hodgkin's disease. Blood 92, 2220-2228.
Carbone, A., Gloghini, A., Vaccher, E., Zagonel, V., Pastore, C., Dalla Palma, P., Branz, F., Saglio, G., Volpe, R., Tirelli, U., and Gaidano, G. (1996). Kaposi's sarcoma-associated herpesvirus DNA sequences in AIDS-related and AIDS-unrelated lymphomatous effusions. Br J Haematol 94, 533-543.
Cariappa, A., Tang, M., Pamg, C., Nebelitskiy, E., Carroll, M., Georgopoulos, K., and Pillai, S. (2001). The follicular versus marginal zone B lymphocyte cell fate decision is regulated by Aiolos, Btk, and CD21. Immunity 14, 603-615.
Carter, K. L., Cahir-McFarland, E., and Kieff, E. (2002). Epstein-barr virus-induced changes in B- lymphocyte gene expression. J Virol 76, 10427-10436.
Cattani, P., Capuano, M., Cerimele, F., La Parola, I. L., Santangelo, R., Masini, C., Cerimele, D., and Fadda, G. (1999). Human herpesvirus 8 seroprevalence and evaluation of nonsexual transmission routes by detection of DNA in clinical specimens from human immunodeficiency virus-seronegative patients from central and southern Italy, with and without Kaposi's sarcoma. J Clin Microbiol 37, 1150-1153.
Cerimele, F., Curreli, F., Ely, S., Friedman-Kien, A. E., Cesarman, E., and Flore, O. (2001). Kaposi's sarcoma-associated herpesvirus can productively infect primary human kératinocytes and alter their growth properties. J Virol 75, 2435-2443.
Cesarman, E., Chang, Y., Moore, P. S., Said, J. W., and Knowles, D. M. (1995a). Kaposi's sarcoma- associated herpesvirus-like DNA sequences in AIDS-related body-cavity-based lymphomas. N Engl J Med 332, 1186-1191.
Cesarman, E., and Knowles, D. M. (1999). The role of Kaposi's sarcoma-associated herpesvirus (KSHV/HHV-8) in lymphoproliferative diseases. Semin Cancer Biol 9, 165-174.
Cesarman, E., Moore, P. S., Rao, P. H., Inghirami, G., Knowles, D. M., and Chang, Y. (1995b). In vitro establishment and characterization of two acquired immunodeficiency syndrome-related lymphoma cell lines (BC-1 and BC-2) containing Kaposi's sarcoma-associated herpesvirus-like (KSHV) DNA sequences. Blood 86, 2708-2714.
Chadbum, A., Cesarman, E., Nador, R. G., Liu, Y. F., and Knowles, D. M. (1997). Kaposi's sarcoma- associated herpesvirus sequences in benign lymphoid proliferations not associated with human immunodeficiency virus. Cancer 80, 788-797.
Chambers, J., Angulo, A., Amaratunga, D., Guo, H., Jiang, Y., Wan, J. S., Bittner, A., Frueh, K., Jackson, M. R., Peterson, P. A., et a l (1999). DNA microarrays of the complex human cytomegalovirus genome: profiling kinetic class with drug sensitivity of viral gene expression. J Virol 73, 5757-5766.
Chan, S. R., Bloomer, C., and Chandran, B. (1998). Identification and characterization of human herpesvirus-8 lytic cycle-associated ORF 59 protein and the encoding cDNA by monoclonal antibody. Virology 240, 118-126.
Chang, J., Renne, R., Dittmer, D., and Ganem, D. (2000). Inflammatory cytokines and the reactivation of Kaposi's sarcoma-associated herpesvirus lytic replication. Virology 266, 17-25.
272
Chang, P. J,, Shedd, D., Gradoville, L., Cho, M. S., Chen, L. W., Chang, J., and Miller, G. (2002). Open reading frame 50 protein of Kaposi's sarcoma-associated herpesvirus directly activates the viral PAN and K12 genes by binding to related response elements. J Virol 76, 3168-3178.
Chang, Y., Cesarman, E., Pessin, M. S., Lee, F., Culpepper, J., Knowles, D. M., and Moore, P. S. (1994). Identification of herpesvirus-like DNA sequences in AIDS-associated Kaposi's sarcoma. Science 266, 1865-1869.
Chang, Y. E., and Laimins, L. A. (2000). Microarray analysis identifies interferon-inducible genes and stat-1 as major transcriptional targets of human papillomavirus type 31. J Virol 74, 4174-4182.
Chee, M. S., Bankier, A. T., Beck, S., Bohni, R., Brown, C. M., Cemy, R., Horsnell, T., Hutchison, C. A., 3rd, Kouzarides, T., Martignetti, J. A., and et al. (1990). Analysis of the protein-coding content of the sequence of human cytomegalovirus strain AD 169. Curr Top Microbiol Immunol 154, 125-169.
Chen, C., Nagy, Z., Radie, M. Z., Hardy, R. R., Huszar, D., Camper, S. A., and Weigert, M. (1995). The site and stage of anti-DNA B-cell deletion. Nature 373, 252-255.
Chen, H., Smith, P., Ambinder, R. F., and Hayward, S. D. (1999). Expression of Epstein-Barr virus BamHI-A rightward transcripts in latently infected B cells from peripheral blood. Blood 93, 3026-3032.
Chen, J., Ueda, K., Sakakibara, S., Okuno, T., Parravicini, C., Corbellino, M., and Yamanishi, K. (2001). Activation of latent Kaposi's sarcoma-associated herpesvirus by déméthylation of the promoter of the lytic transactivator. Proc Natl Acad Sci U S A 98, 4119-4124.
Chen, J. J., Wu, R., Yang, P. C., Huang, J. Y., Sher, Y. P., Han, M. H., Kao, W. C., Lee, P. J., Chiu, T. P., Chang, P., et al. (1998a). Profiling expression patterns and isolating differentially expressed genes by cDNA microarray system with colorimetry detection. Genomics 57, 313-324.
Chen, S., Bacon, K. B., Li, L., Garcia, G. E., Xia, Y., Lo, D., Thompson, D. A., Siani, M. A., Yamamoto, T., Harrison, J. K., and Peng, L. (1998b). In vivo inhibition of CC and CX3C chemokine-induced leukocyte infiltration and attenuation of glomerulonephritis in Wistar-Kyoto (WKY) rats by vMIP-II. J Exp Med 188, 193-198.
Chen-Bettecken, U., Wecker, E., and Schimpl, A. (1987). Transcriptional control of mu- and kappa-gene expression in resting and bacterial lipopolysaccharide-activated normal B cells. Immunobiology 174, 162- 176.
Cheng, E. H., Nicholas, J., Bellows, D. S., Hayward, G. S., Guo, H. G., Reitz, M. S., and Hardwick, J. M.(1997). A Bcl-2 homolog encoded by Kaposi sarcoma-associated virus, human herpesvirus 8, inhibits apoptosis but does not heterodimerize with Bax or Bak. Proc Natl Acad Sci U S A 94, 690-694.
Chesi, M., Bergsagel, P. L., Brents, L. A., Smith, C. M., Gerhard, D. S., and Kuehl, W. M. (1996). Dysregulation of cyclin D1 by translocation into an IgH gamma switch region in two multiple myeloma cell lines. Blood 88, 674-681.
Chesi, M., Bergsagel, P. L., Shonukan, O. O., Martelli, M. L., Brents, L. A., Chen, T., Schrock, E., Ried, T., and Kuehl, W. M. (1998). Frequent dysregulation of the c-maf proto-oncogene at 16q23 by translocation to an Ig locus in multiple myeloma. Blood 91, 4457-4463.
Chesi, M., Brents, L. A., Ely, S. A., Bais, C., Robbiani, D. P., Mesri, E. A., Kuehl, W. M., and Bergsagel, P. L. (2001). Activated fibroblast growth factor receptor 3 is an oncogene that contributes to tumor progression in multiple myeloma. Blood 97, 729-736.
Chesi, M., Nardini, E., Brents, L. A., Schrock, E., Ried, T., Kuehl, W. M., and Bergsagel, P. L. (1997). Frequent translocation t(4;14)(pl6.3;q32.3) in multiple myeloma is associated with increased expression and activating mutations of fibroblast growth factor receptor 3. Nat Genet 16, 260-264.
Chevallier-Greco, A., Manet, E., Chavrier, P., Mosnier, C., Daillie, J., and Sergeant, A. (1986). Both Epstein-Barr virus (EBV)-encoded trans-acting factors, EB 1 and EB2, are required to activate transcription from an EBV early promoter. Embo J 5, 3243-3249.
273
Chiou, C. J., Poole, L. J., Kim, P. S., Ciufo, D. M., Cannon, J. S., ap Rhys, C. M., Alcendor, D. J., Zong, J.C., Ambinder, R. F., and Hayward, G. S. (2002). Patterns of gene expression and a transactivation function exhibited by the vGCR (ORF74) chemokine receptor protein of Kaposi's sarcoma-associated herpesvirus. J Virol 76, 3421-3439.
Chirivi, R. G., Taraboletti, G., Bani, M. R., Barra, L., Piccinini, G., Giacca, M., Bussolino, P., and Giavazzi, R. (1999). Human immunodeficiency virus-1 (HIV-l)-Tat protein promotes migration of acquired immunodeficiency syndrome-related lymphoma cells and enhances their adhesion to endothelial cells. Blood 94, 1747-1754.
Cho, R. J., Campbell, M. J., Winzeler, E. A., Steinmetz, L., Conway, A., Wodicka, L., Wolfsberg, T. G., Gabrielian, A. E., Landsman, D., Lockhart, D. J., and Davis, R. W. (1998). A genome-wide transcriptional analysis of the mitotic cell cycle. Mol Cell 2, 65-73.
Choe, J., and Choi, Y. S. (1998). IL-10 interrupts memory B cell expansion in the germinal center by inducing differentiation into plasma cells. Eur J Immunol 28, 508-515.
Choi, J. K., Lee, B. S., Shim, S. N., Li, M., and Jung, J. U. (2000). Identification of the novel K15 gene at the rightmost end of the Kaposi's sarcoma-associated herpesvirus genome. J Virol 74, 436-446.
Choi, Y. S. (1997). Differentiation and apoptosis of human germinal center B-lymphocytes. Immunol Res 16, 161-174.
Chow, D., He, X., Snow, A. L., Rose-John, S., and Garcia, K. C. (2001). Structure of an extracellular gpl30 cytokine receptor signaling complex. Science 291, 2150-2155.
Chu, S., DeRisi, J., Eisen, M., Mulholland, J., Botstein, D., Brown, P. O., and Herskowitz, I. (1998). The transcriptional program of sporulation in budding yeast. Science 282, 699-705.
Chung, Y. H., Means, R. E., Choi, J. K., Lee, B. S., and Jung, J. U. (2002). Kaposi's sarcoma-associated herpesvirus 0X2 glycoprotein activates myeloid-lineage cells to induce inflammatory cytokine production. J Virol 76, 4688-4698.
Cinquina, C. C., Grogan, E., Sun, R., Lin, S. F., Beardsley, G. P., and Miller, G. (2000). Dihydrofolate reductase from Kaposi's sarcoma-associated herpesvirus. Virology 268, 201-217.
Ciufo, D. M., Cannon, J. S., Poole, L. J., Wu, F. Y., Murray, P., Ambinder, R. F., and Hayward, G. S. (2001). Spindle cell conversion by kaposi's sarcoma-associated herpesvirus: formation of colonies and plaques with mixed lytic and latent gene expression in infected primary dermal microvascular endothelial cell cultures. J Virol 75, 5614-5626.
Clark, E. A., Golub, T. R., Lander, E. S., and Hynes, R. O. (2000). Genomic analysis of metastasis reveals an essential role for RhoC. Nature 406, 532-535.
Clark, J., Edwards, S., John, M., Flohr, P., Gordon, T., Maillard, K., Giddings, L, Brown, C., Bagherzadeh,A., Campbell, C., et al. (2002). Identification of amplified and expressed genes in breast cancer by comparative hybridization onto microarrays of randomly selected cDNA clones. Genes Chromosomes Cancer 54, 104-114.
Clauss, I. M., Chu, M., Zhao, J. L., and Glimcher, L. H. (1996). The basic domain/leucine zipper protein hXBP-1 preferentially binds to and transactivates CRE-like sequences containing an ACGT core. Nucleic Acids Res 24, 1855-1864.
Cohen, P., Bouaboula, M., Beilis, M., Baron, V., Jbilo, O., Poinot-Chazel, C., Galiegue, S., Hadibi, E. H., and Casellas, P. (2000). Monitoring cellular responses to Listeria monocytogenes with oligonucleotide arrays. J Biol Chem 275, 11181-11190.
Colantonio, L., lellem. A., Clissi, B., Pardi, R., Rogge, L., Sinigaglia, F., and D'Ambrosio, D. (1999). Upregulation of integrin alpha6/betal and chemokine receptor CCRl by interleukin-12 promotes the migration of human type 1 helper T cells. Blood 94, 2981-2989.
274
Constantoulakis, P., Campbell, M., Felber, B. K., Nasioulas, G., Afonina, E., and Pavlakis, G. N. (1993). Inhibition of Rev-mediated HIV-1 expression by an RNA binding protein encoded by the interferon- inducible 9-27 gene. Science 259, 1314-1318.
Cook, D. N., Beck, M. A., Coffman, T. M., Kirby, S. L., Sheridan, J. P., Pragnell, I. B., and Smithies, O.(1995). Requirement of MIP-1 alpha for an inflammatory response to viral infection. Science 269, 1583- 1585.
Cook, P. M., Whitby, D., Calabro, M. L., Luppi, M., Kakoola, D. N., Hjalgrim, H., Ariyoshi, K., Ensoli,B., Davison, A. J., and Schulz, T. F. (1999). Variability and evolution of Kaposi's sarcoma-associated herpesvirus in Europe and Africa. International Collaborative Group. Aids 13, 1165-1176.
Corbeil, J., Sheeter, D., Genini, D., Rought, S., Leoni, L., Du, P., Ferguson, M., Masys, D. R., Welsh, J,B., Fink, J. L., et al. (2001). Temporal gene regulation during HIV-1 infection of human CD4-J- T cells. Genome Res 11, 1198-1204.
Corbellino, M., Poirel, L., Bestetti, G., Aubin, J. T., Capra, M., Berti, E., Galli, M., and Parravicini, C.(1996). Human herpesvirus-8 in AIDS-related and unrelated lymphomas. Aids 10, 545-546.
Cordier, M., Calender, A., Billaud, M., Zimber, U., Rousselet, G., Pavlish, O., Banchereau, J., Tursz, T., Bomkamm, G., and Lenoir, G. M. (1990). Stable transfection of Epstein-Barr virus (EBV) nuclear antigen 2 in lymphoma cells containing the EBV P3HR1 genome induces expression of B-cell activation molecules CD21 and CD23. J Virol 64, 1002-1013.
Comall, R. J., Goodnow, C. C., and Cyster, J. G. (1995). The regulation of self-reactive B cells. Curr Opin Immunol 7, 804-811.
Corral, J., Lavenir, I., Impey, H., Warren, A. J., Forster, A., Larson, T. A., Bell, S., McKenzie, A. N.,King, G., and Rabbitts, T. H. (1996). An M11-AF9 fusion gene made by homologous recombination causes acute leukemia in chimeric mice: a method to create fusion oncogenes. Cell 85, 853-861.
Coscoy, L., and Ganem, D. (2000). Kaposi's sarcoma-associated herpesvirus encodes two proteins that block cell surface display of MHC class I chains by enhancing their endocytosis. Proc Natl Acad Sci U S A 97, 8051-8056.
Coscoy, L., and Ganem, D. (2001). A viral protein that selectively downregulates ICAM-1 and B7-2 and modulates T cell costimulation. J Clin Invest 107, 1599-1606.
Coscoy, L., Sanchez, D. J., and Ganem, D. (2001). A novel class of herpesvirus-encoded membrane-bound E3 ubiquitin ligases regulates endocytosis of proteins involved in immune recognition. J Cell Biol 155, 1265-1273.
Cotter, M. A., 2nd, and Robertson, E. S. (1999). The latency-associated nuclear antigen tethers the Kaposi's sarcoma-associated herpesvirus genome to host chromosomes in body cavity-based lymphoma cells. Virology 264, 254-264.
Couty, J. P., Geras-Raaka, E., Weksler, B. B., and Gershengom, M. C. (2001). Kaposi's sarcoma- associated herpesvirus G protein-coupled receptor signals through multiple pathways in endothelial cells. J Biol Chem 276, 33805-33811.
Crawford, D. H., and Ando, I. (1986). EB virus induction is associated with B-cell maturation. Immunology 59, 405-409.
Cress, A. E., Rabinovitz, I., Zhu, W., and Nagle, R. B. (1995). The alpha 6 beta 1 and alpha 6 beta 4 integrins in human prostate cancer progression. Cancer Metastasis Rev 14, 219-228.
Cuadras, M. A., Feigelstock, D. A., An, S., and Greenberg, H. B. (2002). Gene expression pattern in Caco- 2 cells following rotavirus infection. J Virol 76, 4467-4482.
Cuconati, A., Degenhardt, K,, Sundararajan, R., Anschel, A., and White, E. (2002). Bak and Bax function to limit adenovirus replication through apoptosis induction. J Virol 76, 4547-4558.
275
Cummings, C. A., and Reiman, D. A. (2000). Using DNA microarrays to study host-microbe interactions. Emerg Infect Dis 6, 513-525.
Cupers, P., Orlans, I., Craessaerts, K., Annaert, W., and De Strooper, B. (2001). The amyloid precursor protein (APP)-cytoplasmic fragment generated by gamma-secretase is rapidly degraded but distributes partially in a nuclear fraction of neurones in culture. J Neurochem 78, 1168-1178.
Cyster, J. G., Hartley, S. B., and Goodnow, C. C. (1994). Competition for follicular niches excludes selfreactive cells from the recirculating B-cell repertoire. Nature 371, 389-395.
Cyster, J. G., Ngo, V. N., Bkland, E. H., Gunn, M. D., Sedgwick, J. D., and Ansel, K. M. (1999). Chemokines and B-cell homing to follicles. Curr Top Microbiol Immunol 246, 87-92; discussion 93.
Dairaghi, D. J., Fan, R. A., McMaster, B. E., Hanley, M. R., and Schall, T. J. (1999). HHV8-encoded vMIP-I selectively engages chemokine receptor CCR8. Agonist and antagonist profiles of viral chemokines. J Biol Chem 274, 21569-21574.
Dal Porto, J. M., Haberman, A. M., Shlomchik, M. J., and Kelsoe, G. (1998). Antigen drives very low affinity B cells to become plasmacytes and enter germinal centers. J Immunol 161, 5373-5381.
Davidovici, B., Karakis, I., Bourboulia, D., Ariad, S., Zong, J. C., Benharroch, D., Dupin, N., Weiss, R., Hayward, G., Sarov, B., and Boshoff, C. (2001). Seroepidemiology and Molecular Epidemiology of Kaposi's Sarcoma-Associated Herpesvirus Among Jewish Population Groups in Israel. J Natl Cancer Inst 93, 194-202.
Davis, M. A., Sturzl, M. A., Blasig, C., Schreier, A., Guo, H. G., Reitz, M., Opalenik, S. R., and Browning, P. J. (1997). Expression of human herpesvirus 8-encoded cyclin D in Kaposi's sarcoma spindle cells. J Natl Cancer Inst S9, 1868-1874.
D'Cunha, J., Knight, E., Jr., Haas, A. L., Truitt, R. L., and Borden, E. C. (1996). Immunoregulatory properties of ISG15, an interferon-induced cytokine. Proc Natl Acad Sci U S A 95, 211-215.
de Boer, C. J., Schuuring, E., Dreef, E., Peters, G., Bartek, J., Kluin, P. M., and van Krieken, J. H. (1995). Cyclin D1 protein analysis in the diagnosis of mantle cell lymphoma. Blood 86, 2715-2723.
de La Fuente, C., Deng, L., Santiago, F., Arce, L., Wang, L., and Kashanchi, F. (2000). Gene expression array of HTLV type 1-infected T cells: Up-regulation of transcription factors and cell cycle genes. AIDS Res Hum Retroviruses 16, 1695-1700.
De La Fuente, C., Santiago, F., Deng, L., Eadie, C., Zilberman, I., Kehn, K., Maddukuri, A., Baylor, S., Wu, K., Lee, C., et al. (2002). Gene expression profile of HIV-1 Tat expressing cells: a close interplay between proliferative and differentiation signals. BMC Biochem 5, 14.
de Saizieu, A., Gardes, C., Flint, N., Wagner, C., Kamber, M., Mitchell, T. J., Keck, W., Amrein, K. E., and Lange, R. (2000). Microarray-based identification of a novel Streptococcus pneumoniae regulon controlled by an autoinduced peptide. J Bacteriol 182, 4696-4703.
De Vos, J., Couderc, G., Tarte, K., Jourdan, M., Requirand, G., Delteil, M. C., Rossi, J. F., Mechti, N., and Klein, B. (2001). Identifying intercellular signaling genes expressed in malignant plasma cells by using complementary DNA arrays. Blood 98, 771-780.
Decker, L. L., Shankar, P., Khan, G., Freeman, R. B., Dezube, B. J., Lieberman, J., and Thorley-Lawson,D. A. (1996). The Kaposi sarcoma-associated herpesvirus (KSHV) is present as an intact latent genome in KS tissue but replicates in the peripheral blood mononuclear cells of KS patients. J Exp Med 184, 283-288.
Dedera, D. A., Waller, E. K., LeBrun, D. P., Sen-Majumdar, A., Stevens, M. E., Barsh, G. S., and Cleary, M. L. (1993). Chimeric homeobox gene E2A-PBX1 induces proliferation, apoptosis, and malignant lymphomas in transgenic mice. Cell 74, 833-843.
Del Prete, G. (1998). The concept of type-1 and type-2 helper T cells and their cytokines in humans. Int Rev Immunol 16, 427-455.
276
Delecluse, H. J., Hummel, M., Marafioti, T., Anagnostopoulos, I., and Stein, H. (1999). Common and HIV-related diffuse large B-cell lymphomas differ in their immunoglobulin gene mutation pattern. J Pathol 188, 133-138.
Denis, G. V., Vaziri, C., Guo, N., and Faller, D. V. (2000). RING3 kinase transactivates promoters of cell cycle regulatory genes through E2F. Cell Growth Differ 11, 417-424.
Dent, A. L., Shaffer, A. L., Yu, X., Allman, D., and Staudt, L. M. (1997). Control of inflammation, cytokine expression, and germinal center formation by BCL-6. Science 276, 589-592.
DeRisi, J., Penland, L., Brown, P. O., Bittner, M. L., Meltzer, P. S., Ray, M., Chen, Y., Su, Y. A., and Trent, J. M. (1996). Use of a cDNA microarray to analyse gene expression patterns in human cancer. Nat Genet 14, 457-460.
DeRisi, J. L., Iyer, V. R., and Brown, P. O. (1997). Exploring the metabolic and genetic control of gene expression on a genomic scale. Science 278, 680-686.
Desrosiers, R. C., Sasseville, V. G., Czajak, S. C., Zhang, X., Mansfield, K. G., Kaur, A., Johnson, R. P., Lackner, A. A., and Jung, J. U. (1997). A herpesvirus of rhesus monkeys related to the human Kaposi's sarcoma-associated herpesvirus. J Virol 71, 9764-9769.
Devergne, O., Cahir McFarland, E. D., Mosialos, G., Izumi, K. M., Ware, C. F., and Kieff, E. (1998). Role of the TRAF binding site and NF-kappaB activation in Epstein-Barr virus latent membrane protein 1- induced cell gene expression. J Virol 72, 7900-7908.
Dezube, B. J., Zambela, M., Sage, D. R., Wang, J. F., and Fingeroth, J. D. (2002). Characterization of Kaposi sarcoma-associated herpesvirus/human herpesvirus-8 infection of human vascular endothelial cells: early events. Blood 100, 888-896.
Diamond, C., Brodie, S. J., Krieger, J. N., Huang, M. L., Koelle, D. M., Diem, K., Muthui, D., and Corey, L. (1998). Human herpesvirus 8 in the prostate glands of men with Kaposi's sarcoma. J Virol 72, 6223- 6227.
Diaz, M., and Casali, P. (2002). Somatic immunoglobulin hypermutation. Curr Opin Immunol 14, 235- 240.
Diehl, V., Schaadt, M., Kirchner, H., Hellriegel, K. P., Gudat, F., Fonatsch, C., Laskewitz, E., and Guggenheim, R. (1978). Long-term cultivation of plasma cell leukemia cells and autologous lymphoblasts (LCL) in vitro: a comparative study. Blut 36, 331-338.
Diehn, M., Eisen, M. B., Botstein, D., and Brown, P. O. (2000). Large-scale identification of secreted and membrane-associated gene products using DNA microarrays. Nat Genet 25, 58-62.
Dighiero, G., Kipps, T., Schroeder, H. W., Chiorazzi, N., Stevenson, F., Silberstein, L. E., Caligaris- Cappio, F., and Ferrarini, M. (1996). What is the CLL B-lymphocyte? Leuk Lymphoma 22 Suppl 2, 13-39.
Dilosa, R. M., Maeda, K., Masuda, A., Szakal, A. K., and Tew, J. G. (1991). Germinal center B cells and antibody production in the bone marrow. J Immunol 146, 4071-4077.
Dittmer, D., Lagunoff, M., Renne, R., Staskus, K., Haase, A., and Ganem, D. (1998). A cluster of latently expressed genes in Kaposi's sarcoma-associated herpesvirus. J Virol 72, 8309-8315.
Dittmer, D., Stoddart, C., Renne, R., Linquist-Stepps, V., Moreno, M. E., Bare, C., McCune, J. M., and Ganem, D. (1999). Experimental transmission of Kaposi's sarcoma-associated herpesvirus (KSHV/HHV- 8) to SCID-hu Thy/Liv mice. J Exp Med 190, 1857-1868.
Djabali, M., Selleri, L., Parry, P., Bower, M., Young, B. D., and Evans, G. A. (1992). A trithorax-like gene is interrupted by chromosome 1 lq23 translocations in acute leukaemias. Nat Genet 2, 113-118.
Djerbi, M., Screpanti, V., Catrina, A. I., Bogen, B., Biberfeld, P., and Grandien, A. (1999). The inhibitor of death receptor signaling, FLICE-inhibitory protein defines a new class of tumor progression factors. J Exp Med 190, 1025-1032.
277
Dobson, C. L., Warren, A. J., Pannell, R., Forster, A., Lavenir, I., Corral, J., Smith, A. J., and Rabbitts, T. H, (1999). The mll-AF9 gene fusion in mice controls myéloprolifération and specifies acute myeloid leukaemogenesis. Embo J 18, 3564-3574.
Doi, T. S., Takahashi, T., Taguchi, O., Azuma, T., and Obata, Y. (1997). NF-kappa B RelA-deficient lymphocytes: normal development of T cells and B cells, impaired production of IgA and IgGl and reduced proliferative responses. J Exp Med 185, 953-961.
Domachowske, J. B., Bonville, C. A., Easton, A. J., and Rosenberg, H. F. (2002). Differential expression of proinflammatory cytokine genes in vivo in response to pathogenic and nonpathogenic pneumovirus infections. J Infect Dis 186, 8-14.
Domachowske, J. B., Bonville, C. A., Gao, J. L., Murphy, P. M., Easton, A. J., and Rosenberg, H. F.(2000). The chemokine macrophage-inflammatory protein-1 alpha and its receptor CCRl control pulmonary inflammation and antiviral host defense in paramyxovirus infection. J Immunol 165, 2677- 2682.
Dorrell, N., Mangan, J. A., Laing, K. G., Hinds, J., Linton, D., Al-Ghusein, H., Barrell, B. G., Parkhill, J., Stoker, N. G., Karlyshev, A. V., e ta l (2001). Whole genome comparison of Campylobacter jejuni human isolates using a low-cost microarray reveals extensive genetic diversity. Genome Res 11, 1706-1715.
Downing, R. G., Eglin, R. P., and Bayley, A. C. (1984). African Kaposi's sarcoma and AIDS. Lancet 1, 478-480.
Drexler, H. G. (2001). The Leukemia-Lymphoma Cell Line FactsBook, 1st edn (London, Academic Press).
Drexler, H. G., Meyer, C., Gaidano, G., and Carbone, A. (1999). Constitutive cytokine production by primary effusion (body cavity-based) lymphoma-derived cell lines. Leukemia 13, 634-640.
Drexler, H. G., Uphoff, C. C., Gaidano, G., and Carbone, A. (1998). Lymphoma cell lines: in vitro models for the study of HHV-8-h primary effusion lymphomas (body cavity-based lymphomas). Leukemia 12, 1507-1517.
D'Souza, B., Rowe, M., and Walls, D. (2000). The bfl-1 gene is transcriptionally upregulated by the Epstein-Barr virus LMPl, and its expression promotes the survival of a Burkitt's lymphoma cell line. J Virol 74, 6652-6658.
Du, M. Q., Liu, H., Diss, T. C., Ye, H., Hamoudi, R. A., Dupin, N., Meignin, V., Oksenhendler, E., Boshoff, C., and Isaacson, P. G. (2001). Kaposi sarcoma-associated herpesvirus infects monotypic (IgM lambda) but polyclonal naive B cells in Castleman disease and associated lymphoproliferative disorders. Blood 97, 2130-2136.
Duan, W., Wang, S., Liu, S., and Wood, C. (2001). Characterization of Kaposi's sarcoma-associated herpesvirus/human herpesvirus-8 ORF57 promoter. Arch Virol 146, 403-413.
Dudoit, S., Yang, Y. H., Callow, M. J., and Speed, T. P. (2001). Statistical methods for identifying genes with differential expression in replicated cDNA microarray experiments. Statist Sincia 12, 111-139.
Duggan, D. J., Bittner, M., Chen, Y., Meltzer, P., and Trent, J. M. (1999). Expression profiling using cDNA microarrays. Nat Genet 21, 10-14.
Dunn-Walters, D., Thiede, C., Alpen, B., and Spencer, J. (2001). Somatic hypermutation and B-cell lymphoma. Philos Trans R Soc Lond B Biol Sci 356, 73-82.
Dunn-Walters, D. K., Isaacson, P. G., and Spencer, J. (1995). Analysis of mutations in immunoglobulin heavy chain variable region genes of microdissected marginal zone (MGZ) B cells suggests that the MGZ of human spleen is a reservoir of memory B cells. J Exp Med 182, 559-566.
Dupin, N., Diss, T. L., Kellam, P., Tulliez, M., Du, M. Q., Sicard, D., Weiss, R. A., Isaacson, P. G., and Boshoff, C. (2000). HHV-8 is associated with a plasmablastic variant of Castleman disease that is linked to HHV-8-positive plasmablastic lymphoma. Blood 95, 1406-1412.
278

Dupin, N,, Fisher, C., Kellam, P., Ariad, S., Tulliez, M,, Franck, N., van Marck, E., Salmon, D., Gorin, L, Escande, J. P., et al. (1999). Distribution of human herpesvirus-8 latently infected cells in Kaposi's sarcoma, multicentric Castleman's disease, and primary effusion lymphoma. Proc Natl Acad Sci U S A 96, 4546-4551.
Durkop, H., Foss, H. D., Demel, G., Klotzbach, H., Hahn, C., and Stein, H. (1999). Tumor necrosis factor receptor-associated factor 1 is overexpressed in Reed-Stemberg cells of Hodgkin's disease and Epstein- Barr virus-transformed lymphoid cells. Blood 93, 617-623.
Duro, D., Schulze, A., Vogt, B., Bartek, J., Mittnacht, S., and Jansen-Durr, P. (1999). Activation of cyclin A gene expression by the cyclin encoded by human herpesvirus-8. J Gen Virol 80, 549-555.
Dyer, M. J., Fischer, P., Nacheva, E., Labastide, W., and Karpas, A. (1990). A new human B-cell non- Hodgkin's lymphoma cell line (Karpas 422) exhibiting both t (14;18) and t(4;l 1) chromosomal translocations. Blood 75, 709-714.
Dyson, N., Howley, P. M., Munger, K., and Harlow, E. (1989). The human papilloma virus-16 E7 oncoprotein is able to bind to the retinoblastoma gene product. Science 243, 934-937.
Early Breast Cancer Trialists' Collaborative Group (1998a). Polychemotherapy for early breast cancer: an overview of the randomised trials. Lancet 352, 930-942.
Early Breast Cancer Trialists' Collaborative Group (1998b). Tamoxifen for early breast cancer: an overview of the randomised trials. Early Breast Cancer Trialists' Collaborative Group. Lancet 351, 1451- 1467.
Early, P., Huang, H., Davis, M., Calame, K., and Hood, L. (1980). An immunoglobulin heavy chain variable region gene is generated from three segments of DNA: VH, D and JH. Cell 19, 981-992.
Eckert, A., Forstl, H., Zerfass, R., Hennerici, M., and Muller, W. E. (1997). Free intracellular calcium in peripheral cells in Alzheimer's disease. Neurobiol Aging 18, 281-284.
Eckmann, L., Smith, J. R., Housley, M. P., Dwinell, M. B., and Kagnoff, M. F. (2000). Analysis by high density cDNA arrays of altered gene expression in human intestinal epithelial cells in response to infection with the invasive enteric bacteria Salmonella. J Biol Chem 275, 14084-14094.
Ehlich, A., and Kuppers, R. (1995). Analysis of immunoglobulin gene rearrangements in single B cells. Curr Opin Immunol 7, 281-284.
Filers, M. (1999). Control of cell proliferation by Myc family genes. Mol Cells 9, 1-6.
Eisen, M. B., Spellman, P. T., Brown, P. O., and Botstein, D. (1998). Cluster analysis and display of genome-wide expression patterns. Proc Natl Acad Sci U S A 95, 14863-14868.
Eliopoulos, A. G., Gallagher, N. J., Blake, S. M., Dawson, C. W., and Young, L. S. (1999). Activation of the p38 mitogen-activated protein kinase pathway by Epstein-Barr virus-encoded latent membrane protein 1 coregulates interleukin-6 and interleukin-8 production. J Biol Chem 274, 16085-16096.
Eliopoulos, A. G., and Young, L. S. (1998). Activation of the cJun N-terminal kinase (JNK) pathway by the Epstein-Barr virus-encoded latent membrane protein 1 (LMPl). Oncogene 16, 1731-1742.
Ellis, M., Chew, Y. P., Fallis, L., Freddersdorf, S., Boshoff, C., Weiss, R. A., Lu, X., and Mittnacht, S. (1999). Degradation of p27(Kip) cdk inhibitor triggered by Kaposi's sarcoma virus cyclin-cdk6 complex. Embo J 18, 644-653.
Emmerich, F., Meiser, M., Hummel, M., Demel, G., Foss, H. D., Jundt, F., Mathas, S., Krappmann, D., Scheidereit, C., Stein, H., and Dorken, B. (1999). Overexpression of I kappa B alpha without inhibition of NF-kappaB activity and mutations in the I kappa B alpha gene in Reed-Stemberg cells. Blood 94, 3129- 3134.
Emmert-Buck, M. R., Bonner, R. F., Smith, P. D., Chuaqui, R. F., Zhuang, Z., Goldstein, S. R., Weiss, R. A., and Liotta, L. A. (1996). Laser capture microdissection. Science 274, 998-1001.
279
Endres, M. J., Garlisi, C. G., Xiao, H., Shan, L., and Hedrick, J. A. (1999). The Kaposi's sarcoma-related herpesvirus (KSHV)-encoded chemokine vMIP-I is a specific agonist for the CC chemokine receptor (CCR)8. J Exp Med 189, 1993-1998.
Ensoli, B., Barillari, G., Salahuddin, S. Z., Gallo, R. C., and Wong-Staal, F. (1990). Tat protein of HIV-1 stimulates growth of cells derived from Kaposi's sarcoma lesions of AIDS patients. Nature 345, 84-86.
Ensoli, B., Buonaguro, L., Barillari, G., Fiorelli, V., Gendelman, R., Morgan, R. A., Wingfield, P., and Gallo, R. C. (1993). Release, uptake, and effects of extracellular human immunodeficiency virus type 1 Tat protein on cell growth and viral transactivation. J Virol 67, 277-287.
Ensoli, B., Markham, P., Kao, V., Barillari, G., Fiorelli, V., Gendelman, R., Raffeld, M., Zon, G., and Gallo, R. C. (1994). Block of AIDS-Kaposi's sarcoma (KS) cell growth, angiogenesis, and lesion formation in nude mice by antisense oligonucleotide targeting basic fibroblast growth factor. A novel strategy for the therapy of KS. J Clin Invest 94, 1736-1746.
Ensoli, B., Nakamura, S., Salahuddin, S. Z., Biberfeld, P., Larsson, L., Beaver, B., Wong-Staal, P., and Gallo, R. C. (1989). AIDS-Kaposi's sarcoma-derived cells express cytokines with autocrine and paracrine growth effects. Science 243, 223-226.
Ensoli, B., and Sturzl, M. (1998). Kaposi's sarcoma: a result of the interplay among inflammatory cytokines, angiogenic factors and viral agents. Cytokine Growth Factor Rev 9, 63-83.
Epstein, A. L., Levy, R., Kim, H., Henle, W., Henle, G., and Kaplan, H. S. (1978). Biology of the human malignant lymphomas. IV. Functional characterization of ten diffuse histiocytic lymphoma cell lines. Cancer 42, 2379-2391.
Epstein, M. A., Barr, Y. M., and Achong, B. G. (1964). Virus particles in cultured lymphoblasts from Burkitt's lymphoma. Lancet 1, 702-703.
Eton, O., Scheinberg, D. A., and Houghton, A. N. (1989). Establishment and characterization of two human myeloma cell lines secreting kappa light chains. Leukemia 3, 729-735.
Fainstein, E., Marcelle, C., Rosner, A., Canaani, E., Gale, R. P., Dreazen, O., Smith, S. D., and Croce, C. M. (1987). A new fused transcript in Philadelphia chromosome positive acute lymphocytic leukaemia. Nature 330, 386-388.
Fais, P., Gaidano, G., Capello, D., Gloghini, A., Ghiotto, P., Roncella, S., Carbone, A., Chiorazzi, N., and Ferrarini, M. (1999). Immunoglobulin V region gene use and structure suggest antigen selection in AIDS- related primary effusion lymphomas. Leukemia 13, 1093-1099.
Pais, P., Ghiotto, P., Hashimoto, S., Sellars, B., Valetto, A., Allen, S. L., Schulman, P., Vinciguerra, V. P., Rai, K., Rassenti, L. Z., e ta l (1998). Chronic lymphocytic leukemia B cells express restricted sets of mutated and unmutated antigen receptors. J Clin Invest 102, 1515-1525.
Pakhari, P. D., and Dittmer, D. P. (2002). Charting latency transcripts in Kaposi's sarcoma-associated herpesvirus by whole-genome real-time quantitative PCR. J Virol 76, 6213-6223.
Palini, B., Bigema, B., Pasqualucci, L., Pizzotti, M., Martelli, M. P., Pileri, S., Pinto, A., Carbone, A., Venturi, S., Pacini, R., et a l (1996). Distinctive expression pattern of the BCL-6 protein in nodular lymphocyte predominance Hodgkin's disease. Blood 87, 465-471.
Palini, B., Pizzotti, M., Pucciarini, A., Bigema, B., Marafioti, T., Gambacorta, M., Pacini, R., Alunni, C., Natali-Tanci, L., Ugolini, B., et a l (2000). A monoclonal antibody (MUMIp) detects expression of the MUM1/IRP4 protein in a subset of germinal center B cells, plasma cells, and activated T cells. Blood 95, 2084-2092.
Palke, D,, Siegert, R., and Vogell, W. (1959). Elektronen-mikroskopische Befunde zur Prage der Doppelmembranbildung des Herpes-simplex-virus. Arch Gesamte Virusforsch 9, 484-496.
Farina, A., Santarelli, R., Gonnella, R., Bei, R., Muraro, R., Cardinali, G., Uccini, S., Ragona, G., Prati, L., Paggioni, A., and Angeloni, A. (2000). The BPRPl gene of Epstein-Barr virus encodes a novel protein. J Virol 74, 3235-3244.
280

Fawcett, T. W., Martindale, J. L., Guyton, K. Z., Hai, T., and Holbrook, N. J. (1999). Complexes containing activating transcription factor (ATF)/cAMP-responsive-element-binding protein (CREE) interact with the CCAAT/enhancer-binding protein (C/EBP)-ATF composite site to regulate Gaddi53 expression during the stress response. Biochem J 339, 135-141.
Felsenstein, J. (1993). PHYLIP (Phylogeny Interference Package) (Distributed by the author. Department of Genetics, University of Washington, Seattle, USA.).
Fenig, E., Brenner, B., Rakowsky, E., Lapidoth, M., Katz, A., and Sulkes, A. (1998). Classic Kaposi sarcoma: experience at Rabin Medical Center in Israel. Am J Clin Oncol 21, 498-500.
Ferlin, M., Noraz, N., Hertogh, C., Brochier, J., Taylor, N., and Klein, B. (2000). Insulin-like growth factor induces the survival and proliferation of myeloma cells through an interleukin-6-independent transduction pathway. Br J Haematol 111, 626-634.
Ferrando, A. A., Neuberg, D. S., Staunton, J., Loh, M. L., Huard, C., Raimondi, S. C., Behm, F. G., Pui, C.H., Downing, J. R., Gilliland, D. G., et al. (2002). Gene expression signatures define novel oncogenic pathways in T cell acute lymphoblastic leukemia. Cancer Cell 1, 75-87.
Fickenscher, H., and Fleckenstein, B. (2001). Herpesvirus saimiri. Philos Trans R Soc Lond B Biol Sci 356, 545-567.
Filipits, M., Drach, J., Pohl, G., Schuster, J., Stranzl, T., Ackermann, J., Konigsberg, R., Kaufmann, H., Gisslinger, H., Huber, H., et al. (1999). Expression of the lung resistance protein predicts poor outcome in patients with multiple myeloma. Clin Cancer Res 5, 2426-2430.
Fingeroth, J. D., Weis, J. J., Tedder, T. F., Strominger, J. L., Biro, P. A., and Fearon, D. T. (1984). Epstein- Barr virus receptor of human B lymphocytes is the C3d receptor CR2. Proc Natl Acad Sci U S A 81, 4510- 4514.
Fiorelli, V., Gendelman, R., Sirianni, M. C., Chang, H. K., Colombini, S., Markham, P. D., Monini, P., Sonnabend, J., Pintus, A., Gallo, R. C., and Ensoli, B. (1998). gamma-Interferon produced by CD8+ T cells infiltrating Kaposi's sarcoma induces spindle cells with angiogenic phenotype and synergy with human immunodeficiency virus-1 Tat protein: an immune response to human herpesvirus-8 infection? Blood 91, 956-967.
Fire, A., Xu, S., Montgomery, M. K., Kostas, S. A., Driver, S. E., and Mello, C. C. (1998). Potent and specific genetic interference by double-stranded RNA in Caenorhabditis elegans. Nature 391, 806-811.
Flemington, E. K. (2001). Herpesvirus lytic replication and the cell cycle: arresting new developments. J Virol 75, 4475-4481.
Flore, O., Rafii, S., Ely, S., O'Leary, J. J , Hyjek, E. M., and Cesarman, E. (1998). Transformation of primary human endothelial cells by Kaposi's sarcoma-associated herpesvirus. Nature 394, 588-592.
Flowers, C. C., Flowers, S. P., and Nabel, G. J. (1998). Kaposi's sarcoma-associated herpesvirus viral interferon regulatory factor confers resistance to the antiproliferative effect of interferon-alpha. Mol Med 4, 402-412.
Fodor, S. P., Rava, R. P., Huang, X. C., Pease, A. C., Holmes, C. P., and Adams, C. L. (1993). Multiplexed biochemical assays with biological chips. Nature 364, 555-556.
Fodor, S. P., Read, J. L., Pirrung, M. C., Stryer, L., Lu, A. T., and Solas, D. (1991). Light-directed, spatially addressable parallel chemical synthesis. Science 251, 767-773.
Foreman, K. E,, Friborg, J., Jr., Kong, W. P., Woffendin, C., Polverini, P. J,, Nickoloff, B. J., and Nabel,G. J. (1997). Propagation of a human herpesvirus from AIDS-associated Kaposi's sarcoma, N Engl J Med 336, 163-171.
Foss, H. D., Reusch, R., Demel, G., Lenz, G., Anagnostopoulos, I., Hummel, M., and Stein, H. (1999). Frequent expression of the B-cell-specific activator protein in Reed-Stemberg cells of classical Hodgkin's disease provides further evidence for its B-cell origin. Blood 94, 3108-3113.
281
Foumey, R., Palmer, M., Ng, A., Dietrich, K., Belch, A., Paterson, M., and Brox, L. (1990). Elevated c- myc messenger RNA in multiple myeloma cell lines. Dis Markers 8, 117-124.
Poussât, A., Wijdenes, J., Bouchet, L., Gaidano, G., Neipel, P., Balabanian, K., Galanaud, P., Couderc, J., and Emilie, D. (1999). Human interleukin-6 is in vivo an autocrine growth factor for human herpesvirus-8- infected malignant B lymphocytes. Eur Cytokine Netw 10, 501-508.
Pranceschi, S., and Geddes, M. (1995). Epidemiology of classic Kaposi's sarcoma, with special reference to mediterranean population. Tumori 81, 308-314.
Francis, D. A., Karras, J. G., Ke, X. Y., Sen, R., and Rothstein, T. L. (1995). Induction of the transcription factors NP-kappa B, AP-1 and NP-AT during B cell stimulation through the CD40 receptor. Int Immunol 7, 151-161.
Friborg, J., Jr., Kong, W., Hottiger, M. O., and Nabel, G. J. (1999). p53 inhibition by the LANA protein of KSHV protects against cell death. Nature 402, 889-894.
Friborg, J., Jr., Kong, W. P., Flowers, C. C., Flowers, S. L., Sun, Y., Foreman, K. E., Nickoloff, B. J., and Nabel, G. J. (1998). Distinct biology of Kaposi's sarcoma-associated herpesvirus from primary lesions and body cavity lymphomas. J Virol 72, 10073-10082.
Friedman-Kien, A. E., Laubenstein, L. J., Rubinstein, P., Buimovici-Klein, E., Marmor, M., Stahl, R., Spigland, I., Kim, K. S., and Zolla Pazner, S. (1982). Disseminated Kaposi's sarcoma in homosexual men. Ann Intern Med 96, 693-700.
Fukuda, T., Yoshida, T., Okada, S., Hatano, M., Miki, T., Ishibashi, K., Okabe, S., Koseki, H., Hirosawa,S., Taniguchi, M., et al. (1997). Disruption of the Bcl6 gene results in an impaired germinal center formation. J Exp Med 186, 439-448.
Fulcher, D. A., and Basten, A. (1994). Reduced life span of anergic self-reactive B cells in a double- transgenic model. J Exp Med 179, 125-134.
Furey, T. S., Cristianini, N., Duffy, N., Bednarski, D. W., Schummer, M., and Haussier, D. (2000).Support vector machine classification and validation of cancer tissue samples using microarray expression data. Bioinformatics 16, 906-914.
Furlong, D., Swift, H., and Roizman, B. (1972). Arrangement of herpesvirus deoxyribonucleic acid in the core. J Virol 10, 1071-1074.
Gaidano, G., Capello, D., Cilia, A. M., Gloghini, A., Perin, T., Quattrone, S., Migliazza, A., Lo Coco, P., Saglio, G., Ascoli, V., and Carbone, A. (1999). Genetic characterization of HHV-8/KSHV-positive primary effusion lymphoma reveals frequent mutations of BCL6: implications for disease pathogenesis and histogenesis. Genes Chromosomes Cancer 24, 16-23.
Gaidano, G., Carbone, A., and Dalla-Favera, R. (1998). Pathogenesis of AIDS-related lymphomas: molecular and histogenetic heterogeneity. Am J Pathol 152, 623-630.
Gaidano, G., Cechova, K., Chang, Y., Moore, P. S., Knowles, D. M., and Dalla-Favera, R. (1996), Establishment of AIDS-related lymphoma cell lines from lymphomatous effusions. Leukemia 10, 1237- 1240.
Gaidano, G., Gloghini, A., Gattei, V., Rossi, M. P., Cilia, A. M., Godeas, C., Degan, M., Perin, T., Canzonieri, V., Aldinucci, D., et al. (1997). Association of Kaposi's sarcoma-associated herpesvirus- positive primary effusion lymphoma with expression of the CD 138/syndecan-1 antigen. Blood 90, 4894- 4900.
Gallo, R. C. (1998). The enigmas of Kaposi's sarcoma. Science 282, 1837-1839.
Gao, S. J., Boshoff, C., Jayachandra, S., Weiss, R. A., Chang, Y., and Moore, P. S. (1997). KSHV ORF K9 (vIRF) is an oncogene which inhibits the interferon signaling pathway. Oncogene 15, 1979-1985.
282
Gao, S. J., Kingsley, L., Li, M., Zheng, W., Parravicini, C., Ziegler, J., Newton, R., Rinaldo, C. R., Saab, A., Phair, J., et al. (1996). KSHV antibodies among Americans, Italians and Ugandans with and without Kaposi's sarcoma. Nat Med 2, 925-928.
Garcia De Vinuesa, C., Gulbranson-Judge, A., Khan, M., O'Leary, P., Cascalho, M., Wabl, M., Klaus, G. G., Owen, M. J., and MacLennan, I. C. (1999). Dendritic cells associated with plasmablast survival. Eur J Immunol 29, 3712-3721.
Garside, P., Ingulli, E., Merica, R. R., Johnson, J. G., Noelle, R. J., and Jenkins, M. K. (1998). Visualization of specific B and T lymphocyte interactions in the lymph node. Science 281, 96-99.
Gasch, A. P., Spellman, P. T., Kao, C. M., Carmel-Harel, O., Eisen, M. B., Storz, G., Botstein, D., and Brown, P. O. (2000). Genomic expression programs in the response of yeast cells to environmental changes. Mol Biol Cell II, 4241-4257.
Gaspar, G., De Clercq, E., and Neyts, J. (2002). Human herpesvirus 8 gene encodes a functional thymidylate synthase. J Virol 76, 10530-10532.
Gazdar, A. F., Gie, H. K., Kirsch, I. R., and Hollis, G. F. (1986). Establishment and characterization of a human plasma cell myeloma culture having a rearranged cellular myc proto-oncogene. Blood 67, 1542- 1549.
Ge, N. L., and Rudikoff, S. (2000). Insulin-like growth factor 1 is a dual effector of multiple myeloma cell growth. Blood 96, 2856-2861.
Geddes, M., Franceschi, S., Balzi, D., Amiani, S., Gafa, L., and Zanetti, R. (1995). Birthplace and classic Kaposi's sarcoma in Italy. Associazione Italiana Registri Tumori. J Natl Cancer Inst 87, 1015-1017.
Geiss, G. K., An, M, C., Bumgarner, R. E., Hammersmark, E., Cunningham, D., and Katze, M. G. (2001). Global impact of influenza virus on cellular pathways is mediated by both replication-dependent and - independent events. J Virol 75,4321-4331.
Geiss, G. K., Bumgarner, R. E., An, M. C., Agy, M. B., van't Wout, A. B., Hammersmark, E., Carter, V.S., Upchurch, D., Mullins, J. 1., and Katze, M. G. (2000). Large-scale monitoring of host cell gene expression during HlV-1 infection using cDNA microarrays. Virology 266, 8-16.
Georas, S. N., McIntyre, B. W., Ebisawa, M., Bednarczyk, J. L., Sterbinsky, S. A., Schleimer, R. P., and Bochner, B. S. (1993). Expression of a functional laminin receptor (alpha 6 beta 1, very late activation antigen-6) on human eosinophils. Blood 82, 2872-2879.
Georgii-Hemming, P., Wiklund, H. J., Ljunggren, O., and Nilsson, K. (1996). Insulin-like growth factor 1 is a growth and survival factor in human multiple myeloma cell lines. Blood 88, 2250-2258.
Gerondakis, S., Grossmann, M., Nakamura, Y., Pohl, T., and Grumont, R. (1999). Genetic approaches in mice to understand Rel/NF-kappaB and IkappaB function: transgenics and knockouts. Oncogene 18, 6888- 6895.
Gershengom, M. C., Geras-Raaka, E., Varma, A., and Clark-Lewis, 1. (1998). Chemokines activate Kaposi's sarcoma-associated herpesvirus G protein-coupled receptor in mammalian cells in culture. J Clin Invest 102, 1469-1472.
Gertz, M. A., Fonseca, R., and Rajkumar, S. V. (2000). Waldenstrom's macroglobulinemia. Oncologist 5, 63-67.
Gessain, A., Briere, J., Angelin-Duclos, C., Valensi, F., Beral, H. M., Davi, F., Nicola, M. A., Sudaka, A., Fouchard, N., Gabarre, J., et al. (1997). Human herpes virus 8 (Kaposi's sarcoma herpes virus) and malignant lymphoproliferations in France: a molecular study of 250 cases including two AIDS-associated body cavity based lymphomas. Leukemia II, 266-272.
Gessain, A., Mauclere, P., van Beveren, M., Plancoulaine, S., Ayouba, A., Essame-Oyono, J. L., Martin, P. M., and de The, G. (1999). Human herpesvirus 8 primary infection occurs during childhood in Cameroon, Central Africa. Int J Cancer 81, 189-192.
283
Gessain, A., Sudaka, A., Briere, J., Fouchard, N., Nicola, M. A., Rio, B., Arborio, M., Troussard, X., Audouin, J., Diebold, J., and et al. (1996). Kaposi sarcoma-associated herpes-like virus (human herpesvirus type 8) DNA sequences in multicentric Castleman's disease: is there any relevant association in non-human immunodeficiency virus-infected patients? Blood 87, 414-416.
Gires, O., Kohlhuber, P., Kilger, E., Baumann, M., Kieser, A., Kaiser, C., Zeidler, R., Scheffer, B., Ueffing, M., and Hammerschmidt, W. (1999). Latent membrane protein 1 of Epstein-Barr virus interacts with JAK3 and activates ST AT proteins. Embo J 18, 3064-3073.
Glenn, M., Rainbow, L., Aurad, P., Davison, A., and Schulz, T. P. (1999). Identification of a spliced gene from Kaposi's sarcoma-associated herpesvirus encoding a protein with similarities to latent membrane proteins 1 and 2A of Epstein-Barr virus. J Virol 73, 6953-6963.
Glesby, M. J., Hoover, D. R., Weng, S., Graham, N. M., Phair, J. P., Detels, R., Ho, M., and Saah, A. J.(1996). Use of antiherpes drugs and the risk of Kaposi's sarcoma: data from the Multicenter AIDS Cohort Study. J Infect Dis 173, 1477-1480.
Godden-Kent, D., Talbot, S. J., Boshoff, C., Chang, Y., Moore, P., Weiss, R. A., and Mittnacht, S. (1997). The cyclin encoded by Kaposi's sarcoma-associated herpesvirus stimulates cdk6 to phosphorylate the retinoblastoma protein and histone HI. J Virol 71, 4193-4198.
Goebel, P., Janney, N., Valenzuela, J. R., Romanow, W. J., Murre, C., and Peeney, A. J. (2001). Localized gene-specific induction of accessibility to V(D)J recombination induced by E2A and early B cell factor in nonlymphoid cells. J Exp Med 194, 645-656.
Golub, T. R., Barker, G. P., Bohlander, S. K., Hiebert, S. W., Ward, D. C., Bray-Ward, P., Morgan, E., Raimondi, S. C., Rowley, J. D., and Gilliland, D. G. (1995). Fusion of the TEL gene on 12pl3 to the AMLl gene on 21q22 in acute lymphoblastic leukemia. Proc Natl Acad Sci U S A 92, 4917-4921.
Golub, T. R., Slonim, D. K., Tamayo, P., Huard, C., Gaasenbeek, M., Mesirov, J. P., Coller, H., Loh, M. L., Downing, J. R., Caligiuri, M. A., et al. (1999). Molecular classification of cancer: class discovery and class prediction by gene expression monitoring. Science 286, 531-537.
Goodboum, S., Didcock, L., and Randall, R. E. (2000). Interferons: cell signalling, immune modulation, antiviral response and virus countermeasures. J Gen Virol 81 Pt 10, 2341-2364.
Goodwin, D. J., Hall, K. T., Stevenson, A. J., Markham, A. P., and Whitehouse, A. (1999). The open reading frame 57 gene product of herpesvirus saimiri shuttles between the nucleus and cytoplasm and is involved in viral RNA nuclear export. J Virol 73, 10519-10524.
Goossens, T., Klein, U., and Kuppers, R. (1998). Frequent occurrence of deletions and duplications during somatic hypermutation: implications for oncogene translocations and heavy chain disease. Proc Natl Acad Sci U S A 95, 2463-2468.
Gordadze, A. V., Peng, R., Tan, J., Liu, G., Sutton, R., Kempkes, B., Bomkamm, G. W., and Ling, P. D.(2001). Notch l i e partially replaces EBNA2 function in B cells immortalized by Epstein-Barr virus. J Virol 75, 5899-5912.
Goudsmit, J., Renwick, N., Dukers, N. H., Coutinho, R. A., Heisterkamp, S., Bakker, M., Schulz, T. P., Comelissen, M., and Weverling, G. J. (2000). Human herpesvirus 8 infections in the Amsterdam Cohort Studies (1984-1997): analysis of séroconversions to ORP65 and ORP73. Proc Natl Acad Sci U S A 97, 4838-4843.
Gradi, A., Svitkin, Y. V., Imataka, H., and Sonenberg, N. (1998). Proteolysis of human eukaryotic translation initiation factor eIP4GII, but not eIP4GI, coincides with the shutoff of host protein synthesis after poliovirus infection. Proc Natl Acad Sci U S A 95, 11089-11094.
Gradoville, L., Gerlach, J., Grogan, E., Shedd, D., Nikiforow, S., Metroka, C., and Miller, G. (2000). Kaposi's sarcoma-associated herpesvirus open reading frame 50/Rta protein activates the entire viral lytic cycle in the HH-B2 primary effusion lymphoma cell line. J Virol 74, 6207-6212.
284
Grawunder, U., Leu, T. M., Schatz, D. G., Wemer, A., Rolink, A. G., Melchers, F., and Winkler, T. H. (1995). Down-regulation of RAGl and RAG2 gene expression in preB cells after functional immunoglobulin heavy chain rearrangement. Immunity 3, 601-608.
Gray, D., Dullforce, P., and Jainandunsing, S. (1994). Memory B cell development but not germinal center formation is impaired by in vivo blockade of CD40-CD40 ligand interaction. J Exp Med 180, 141-155.
Greaves, M. P. (1986). Differentiation-linked leukemogenesis in lymphocytes. Science 234, 697-704.
Greensill, J., Sheldon, J. A., Murthy, K. K., Bessonette, J. S., Beer, B. E., and Schulz, T. F. (2000). A chimpanzee rhadinovirus sequence related to Kaposi's sarcoma-associated herpesvirus/human herpesvirus 8: increased detection after HlV-1 infection in the absence of disease. Aids 14, F 129-135.
Greenspan, J. S., Greenspan, D., Lennette, E. T., Abrams, D. 1., Conant, M. A., Petersen, V., and Freese,U. K. (1985). Replication of Epstein-Barr virus within the epithelial cells of oral "hairy" leukoplakia, an AIDS-associated lesion. N Engl J Med 313, 1564-1571.
Greijer, A. E., Dekkers, C. A., and Middeldorp, J. M. (2000). Human cytomegalovirus virions differentially incorporate viral and host cell RNA during the assembly process. J Virol 74, 9078-9082.
Grever, M. R., Schepartz, S. A., and Chabner, B. A. (1992). The National Cancer Institute: cancer drug discovery and development program. Semin Oncol 19, 622-638.
Groffen, J., Stephenson, J. R., Heisterkamp, N., de Klein, A., Bartram, C. R., and Grosveld, G. (1984). Philadelphia chromosomal breakpoints are clustered within a limited region, her, on chromosome 22. Cell 36, 93-99.
Gruffat, H., Portes-Sentis, S., Sergeant, A., and Manet, E. (1999). Kaposi's sarcoma-associated herpesvirus (human herpesvirus-8) encodes a homologue of the Epstein-Barr virus bZip protein EBl. J Gen Virol 80, 557-561.
Grulich, A. E., Olsen, S. J., Luo, K., Hendry, O., Cunningham, P., Cooper, D. A., Gao, S. J., Chang, Y., Moore, P. S., and Kaldor, J. M. (1999). Kaposi's sarcoma-associated herpesvirus: a sexually transmissible infection? J Acquir Immune Defic Syndr Hum Retrovirol 20, 387-393.
Grundhoff, A., and Ganem, D. (2001). Mechanisms Governing Expression of the v-FLlP Gene of Kaposi's Sarcoma-Associated Herpesvirus. J Virol 75, 1857-1863.
Gu, Y., Nakamura, T., Alder, H., Prasad, R., Canaani, O., Cimino, G., Croce, C. M., and Canaani, E. (1992). The t(4 ;ll) chromosome translocation of human acute leukemias fuses the ALL-1 gene, related to Drosophila tri thorax, to the AF-4 gene. Cell 71, 701-708.
Gunn, M. D., Ngo, V. N., Ansel, K. M., Ekland, E. H., Cyster, J. G., and Williams, L. T. (1998). A B-cell- homing chemokine made in lymphoid follicles activates Burkitt's lymphoma receptor-1. Nature 391, 799- 803.
Gupta, A. K., Ruvolo, V., Patterson, C., and Swaminathan, S. (2000). The human herpesvirus 8 homolog of Epstein-Barr virus SM protein (KS-SM) is a posttranscriptional activator of gene expression. J Virol 74, 1038-1044.
Gussander, E., and Adams, A. (1984). Electron microscopic evidence for replication of circular Epstein- Barr virus genomes in latently infected Raji cells. J Virol 52, 549-556.
Gutensohn, N., and Cole, P. (1980). Epidemiology of Hodgkin's disease. Semin Oncol 7, 92-102.
Gwack, Y., Hwang, S., Lim, C., Won, Y. S., Lee, C. H., and Choe, J. (2002). Kaposi's Sarcoma-associated herpesvirus open reading frame 50 stimulates the transcriptional activity of STAT3. J Biol Chem 277, 6438-6442.
Haab, B. B., Dunham, M. J., and Brown, P. O. (2001). Protein microarrays for highly parallel detection and quantitation of specific proteins and antibodies in complex solutions. Genome Biol 2.
285
Halper, J., Fu, S. M., Wang, C. Y., Winchester, R., and Kunkel, H. G. (1978). Patterns of expression of human "la-like" antigens during the terminal stages of B cell development. J Immunol 120, 1480-1484.
Hamilton, J. K., Faquin, L. A., Sullivan, J. L., Maurer, H. S., Cruzi, F. G., Provisor, A. J., Steuber, C. P., Hawkins, E., Yawn, D., Comet, J. A., et al. (1980). X-linked lymphoproliferative syndrome registry report. J Pediatr 96, 669-673.
Hamilton-Dutoit, S. J., Pallesen, G., Franzmann, M. B., Karkov, J., Black, F., Skinhoj, P., and Pedersen, C.(1991). AIDS-related lymphoma. Histopathology, immunophenotype, and association with Epstein-Barr virus as demonstrated by in situ nucleic acid hybridization. Am J Pathol 138, 149-163.
Hamilton-Dutoit, S. J., Rea, D., Raphael, M., Sandvej, K., Delecluse, H. J., Gisselbrecht, C., Marelle, L., van Krieken, H. J., and Pallesen, G. (1993). Epstein-Barr virus-latent gene expression and tumor cell phenotype in acquired immunodeficiency syndrome-related non-Hodgkin's lymphoma. Correlation of lymphoma phenotype with three distinct patterns of viral latency. Am J Pathol 143, 1072-1085.
Hammarskjold, M. L., and Simurda, M. C. (1992). Epstein-Barr virus latent membrane protein transactivates the human immunodeficiency virus type 1 long terminal repeat through induction of NF- kappa B activity. J Virol 66, 6496-6501.
Hammerling, U., Chin, A. F., and Abbott, J. (1976). Ontogeny of murine B lymphocytes: sequence of B- cell differentiation from surface-immunoglobulin-negative precursors to plasma cells. Proc Natl Acad Sci U S A 75, 2008-2012.
Hampar, B., Tanaka, A., Nonoyama, M., and Derge, J. G. (1974). Replication of the resident repressed Epstein-Barr virus genome during the early S phase (S-1 period) of nonproducer Raji cells. Proc Natl Acad SciU S A 77, 631-633.
Han, J., Yoo, H. Y., Choi, B. H., and Rho, H. M. (2000). Selective transcriptional regulations in the human liver cell by hepatitis B viral X protein. Biochem Biophys Res Commun 272, 525-530.
Han, S., Dillon, S. R., Zheng, B., Shimoda, M., Schlissel, M. S., and Kelsoe, G. (1997a). V(D)J recombinase activity in a subset of germinal center B lymphocytes. Science 278, 301-305.
Han, S., Zheng, B., Takahashi, Y., and Kelsoe, G. (1997b). Distinctive characteristics of germinal center B cells. Semin Immunol 9, 255-260.
Hanamura, I., lida. S., Akano, Y., Hayami, Y., Kato, M., Miura, K., Harada, S., Banno, S., Wakita, A., Kiyoi, H., et al. (2001). Ectopic expression of MAFB gene in human myeloma cells carrying (14;20)(q32;ql 1) chromosomal translocations. Jpn J Cancer Res 92, 638-644.
Hanna, M. G. (1964). An autoradiographic study of the germinal centre in spleen white pulp during early intervals of the immune response. Lab Invest 13, 95-104.
Hannon, G. J., Sun, P., Camero, A., Xie, L. Y., Maestro, R., Conklin, D. S., and Beach, D. (1999). MaRX: an approach to genetics in mammalian cells. Science 283, 1129-1130.
Haque, M., Chen, J., Ueda, K., Mori, Y., Nakano, K., Hirata, Y., Kanamori, S., Uchiyama, Y., Inagi, R., Okuno, T., and Yamanishi, K. (2000). Identification and analysis of the K5 gene of Kaposi's sarcoma- associated herpesvirus. J Virol 74, 2867-2875.
Haque, M., Ueda, K., Nakano, K., Hirata, Y., Parravicini, C., Corbellino, M., and Yamanishi, K. (2001a). Major histocompatibility complex class I molecules are down-regulated at the cell surface by the K5 protein encoded by Kaposi's sarcoma-associated herpesvirus/human herpesvirus-8. J Gen Virol 82, 1175- 1180.
Haque, N. S., Fallon, J. T., Taubman, M. B., and Harpel, P. C. (2001b). The chemokine receptor CCR8 mediates human endothelial cell chemotaxis induced by 1-309 and Kaposi sarcoma herpesvirus-encoded vMIP-I and by lipoprotein(a)-stimulated endothelial cell conditioned medium. Blood 97, 39-45.
Haque, T., Thomas, J. A., Parratt, R., Hunt, B. J., Yacoub, M. H., and Crawford, D. H. (1997). A prospective study in heart and lung transplant recipients correlating persistent Epstein-Barr virus infection with clinical events. Transplantation 64, 1028-1034.
286
Harada, S., and Kieff, E. (1997). Epstein-Barr virus nuclear protein LP stimulates EBNA-2 acidic domain- mediated transcriptional activation. J Virol 77, 6611-6618.
Harbour, J. W., and Dean, D. C. (2000). Rb function in cell-cycle regulation and apoptosis. Nat Cell Biol 2, E65-67.
Hardy, R. R., Carmack, C. E., Shinton, S. A., Kemp, J. D., and Hayakawa, K. (1991). Resolution and characterization of pro-B and pre-pro-B cell stages in normal mouse bone marrow. J Exp Med 173, 1213- 1225.
Hardy, W. R., and Sandri-Goldin, R. M. (1994). Herpes simplex virus inhibits host cell splicing, and regulatory protein ICP27 is required for this effect. J Virol 68, 7790-7799.
Hargreaves, D. C., Hyman, P. L., Lu, T. T., Ngo, V. N., Bidgol, A., Suzuki, G., Zou, Y. R., Littman, D. R., and Cyster, J. G. (2001). A coordinated change in chemokine responsiveness guides plasma cell movements. J Exp Med 194, 45-56.
Harless, S. M., Lentz, V. M., Sah, A. P., Hsu, B. L., Clise-Dwyer, K., Hilbert, D. M., Hayes, C. E., and Cancro, M. P. (2001). Competition for BLyS-mediated signaling through Bcmd/BRB regulates peripheral B lymphocyte numbers. Curr Biol II, 1986-1989.
Harrington, W., Jr., Sieczkowski, L., Sosa, C., Chan-a-Sue, S., Cai, J. P., Cabral, L., and Wood, C. (1997). Activation of HHV-8 by HIV-1 tat. Lancet 349, 774-775.
Harrington, W. J., Jr., Bagasra, O., Sosa, C. E., Bobroski, L. E., Baum, M., Wen, X. L., Cabral, L., Byrne,G. E., Pomerantz, R. J., and Wood, C. (1996). Human herpesvirus type 8 DNA sequences in cell-free plasma and mononuclear cells of Kaposi's sarcoma patients. J Infect Dis 174, 1101-1105.
Hartigan, J. (1975). Clustering Algorithms (New York, Wiley).
Harwood, A. R., Osoba, D., Hofstader, S. L., Goldstein, M. B., Cardella, C. J., Holecek, M. J., Kunynetz, R., and Giammarco, R. A. (1979). Kaposi's sarcoma in recipients of renal transplants. Am J Med 67, 759- 765.
Hayashi, K., Chen, W. G., Chen, Y. Y., Bacchi, M. M., Bacchi, C. E., Alvarenga, M., Abreu, E. S., Chang, K. L., and Weiss, L. M. (1997). Deletion of Epstein-Barr virus latent membrane protein 1 gene in United States and Brazilian Hodgkin's disease and reactive lymphoid tissue: high frequency of a 30-bp deletion. Hum Pathol 2S, 1408-1414.
Hayward, G. S. (1999). KSHV strains: the origins and global spread of the virus. Semin Cancer Biol 9, 187-199.
Hayward, R. E., Derisi, J. L., Alfadhli, S., Kaslow, D. C., Brown, P. O., and Rathod, P. K. (2000). Shotgun DNA microarrays and stage-specific gene expression in Plasmodium falciparum malaria. Mol Microbiol 35, 6-14.
Haze, K., Yoshida, H., Yanagi, H., Yura, T., and Mori, K. (1999). Mammalian transcription factor ATF6 is synthesized as a transmembrane protein and activated by proteolysis in response to endoplasmic reticulum stress. Mol Biol Cell 10, 3787-3799.
He, J., Bhat, G., Kankasa, C., Chintu, C., Mitchell, C., Duan, W., and Wood, C. (1998). Seroprevalence of human herpesvirus 8 among Zambian women of childbearing age without Kaposi's sarcoma (KS) and mother-child pairs with KS. J Infect Dis 178, 1787-1790.
Hedenfalk, I., Duggan, D., Chen, Y., Radmacher, M., Bittner, M., Simon, R., Meltzer, P., Gusterson, B., Esteller, M., Kallioniemi, O. P., etal. (2001). Gene-expression profiles in hereditary breast cancer. N Engl J Med 344, 539-548.
Heisterkamp, N., Stephenson, J. R., Groffen, J., Hansen, P. P., de Klein, A., Bartram, C. R., and Grosveld,G. (1983). Localization of the c-abl oncogene adjacent to a translocation break point in chronic myelocytic leukaemia. Nature 306, 239-242.
287
Heller, R. A., Schena, M., Chai, A., Shalon, D., Bedilion, T., Gilmore, J., Woolley, D. E., and Davis, R. W.(1997). Discovery and analysis of inflammatory disease-related genes using cDNA microarrays. Proc Natl Acad Sci U S A 94, 2150-2155.
Heltemes, L. M., and Manser, T. (2002). Level of B cell antigen receptor surface expression influences both positive and negative selection of B cells during primary development. J Immunol 169, 1283-1292.
Henle, 0 ., Henle, W., Clifford, P., Diehl, V., Kafuko, G. W., Kirya, B. G., Klein, G., Morrow, R. H., Munube, G. M., Pike, P., et al. (1969). Antibodies to Epstein-Barr virus in Burkitt's lymphoma and control groups. J Natl Cancer Inst 43, 1147-1157.
Henle, W., Diehl, V., Kohn, G., Zur Hausen, H., and Henle, G. (1967). Herpes-type virus and chromosome marker in normal leukocytes after growth with irradiated Burkitt cells. Science 157, 1064-1065.
Henry, M., Uthman, A., Geusau, A., Rieger, A., Furci, L., Lazzarin, A., Lusso, P., and Tschachler, E. (1999). Infection of circulating CD34+ cells by HHV-8 in patients with Kaposi's sarcoma. J Invest Dermatol 113, 613-616.
Hewitt, E. W., Duncan, L., Mufti, D., Baker, J., Stevenson, P. G., and Lehner, P. J. (2002). Ubiquitylation of MHC class I by the K3 viral protein signals internalization and TSG101 -dependent degradation. Embo J 21, 2418-2429.
Hill, J. M., Lukiw, W. J., Gebhardt, B. M., Higaki, S., Loutsch, J. M., Myles, M. E., Thompson, H. W., Kwon, B. S., Bazan, N. G., and Kaufman, H. E. (2001). Gene expression analyzed by microarrays in HSV- 1 latent mouse trigeminal ganglion following heat stress. Virus Genes 23, 273-280.
Ho, P., Lortan, J. E., MacLennan, I. C., and Khan, M. (1986). Distinct short-lived and long-lived antibody- producing cell populations. Eur J Immunol 16, 1297-1301.
Hoang, A. T., Lutterbach, B., Lewis, B. C., Yano, T., Chou, T. Y., Barrett, J. P., Raffeld, M., Hann, S. R., and Dang, C. V. (1995). A link between increased transforming activity of lymphoma-derived MYC mutant alleles, their defective regulation by pl07, and altered phosphorylation of the c-Myc transactivation domain. Mol Cell Biol 75, 4031-4042.
Hobbs, W. E., 2nd, and DeLuca, N. A. (1999). Perturbation of cell cycle progression and cellular gene expression as a function of herpes simplex virus ICPO. J Virol 73, 8245-8255.
Hoek, R. M., Ruuls, S. R., Murphy, C. A., Wright, G. J., Goddard, R., Zurawski, S. M., Blom, B., Homola, M. E., Streit, W. J., Brown, M. H., et al. (2000). Down-regulation of the macrophage lineage through interaction with 0X 2 (CD200). Science 290, 1768-1771.
Honda, M., Kaneko, S., Kawai, H., Shirota, Y., and Kobayashi, K. (2001). Differential gene expression between chronic hepatitis B and C hepatic lesion. Gastroenterology 120, 955-966.
Hong, S. Y., Yoon, W. H., Park, J. H., Kang, S. G., Ahn, J. H., and Lee, T. H. (2000). Involvement of two NP-kappa B binding elements in tumor necrosis factor alpha -, CD40-, and epstein-barr virus latent membrane protein 1-mediated induction of the cellular inhibitor of apoptosis protein 2 gene. J Biol Chem 275, 18022-18028.
Horcher, M., Souabni, A., and Busslinger, M. (2001). Pax5/BSAP maintains the identity of B cells in late B lymphopoiesis. Immunity 14, 779-790.
Horenstein, M. G., Nador, R. G., Chadbum, A., Hyjek, E. M., Inghirami, G., Knowles, D. M., and Cesarman, E. (1997). Epstein-Barr virus latent gene expression in primary effusion lymphomas containing Kaposi's sarcoma-associated herpesvirus/human herpesvirus-8. Blood 90, 1186-1191.
Hozumi, N., and Tonegawa, S. (1976). Evidence for somatic rearrangement of inununoglobulin genes coding for variable and constant regions. Proc Natl Acad Sci U S A 75, 3628-3632.
Hsing, Y., and Bishop, G. A. (1999). Requirement for nuclear factor-kappaB activation by a distinct subset of CD40-mediated effector functions in B lymphocytes. J Immunol 162, 2804-2811.
288

Hsu, D. K., Yang, R. Y., Pan, Z,, Yu, L., Salomon, D. R., Fung-Leung, W. P., and Liu, F, T. (2000). Targeted disruption of the galectin-3 gene results in attenuated peritoneal inflammatory responses. Am J Pathol 156, 1073-1083.
Huang, E. S. (1975). Human cytomegalovirus. IV. Specific inhibition of virus-induced DNA polymerase activity and viral DNA replication by phosphonoacetic acid. J Virol 16, 1560-1565.
Huang, L. M., Chao, M. F., Chen, M. Y., Shih, H., Chiang, Y. P., Chuang, C. Y., and Lee, C. Y. (2001a). Reciprocal regulatory interaction between human herpesvirus 8 and human immunodeficiency virus type1. J Biol Chem 276, 13427-13432.
Huang, Q., Liu, D., Majewski, P., Schulte, L. C., Korn, J. M., Young, R. A., Lander, E. S., and Hacohen, N. (2001b). The plasticity of dendritic cell responses to pathogens and their components. Science 294, 870- 875.
Hubbell, H. R., Boyer, J. E., Roane, P., and Burch, R. M. (1991). Cyclic AMP mediates the direct antiproliferative action of mismatched double-stranded RNA. Proc Natl Acad Sci U S A 88, 906-910.
Hubmann, R., Schwarzmeier, J. D., Shehata, M., Hilgarth, M., Duechler, M., Dettke, M., and Berger, R.(2002). Notch2 is involved in the overexpression of CD23 in B-cell chronic lymphocytic leukemia. Blood 99, 3742-3747.
Hughes, T. R., Marton, M. J., Jones, A. R., Roberts, C. J., Stoughton, R., Armour, C. D., Bennett, H. A., Coffey, E., Dai, H., He, Y. D., et al. (2000). Functional discovery via a compendium of expression profiles. Cell 102, 109-126.
Hummel, M., Anagnostopoulos, I., Korbjuhn, P., and Stein, H. (1995). Epstein-Barr virus in B-cell non- Hodgkin’s lymphomas: unexpected infection patterns and different infection incidence in low- and high- grade types. J Pathol 175, 263-271.
Hummel, M., Tamaru, J., Kalvelage, B., and Stein, H. (1994). Mantle cell (previously centrocytic) lymphomas express VH genes with no or very little somatic mutations like the physiologic cells of the follicle mantle. Blood 84, 403-407.
Humphrey, J. H., Grennan, D., and Sundaram, V. (1984). The origin of follicular dendritic cells in the mouse and the mechanism of trapping of immune complexes on them. Eur J Immunol 14, 859-864.
Hunger, S. P., Galili, N., Carroll, A. J., Crist, W. M., Link, M. P., and Cleary, M. L. (1991). The t(l;19)(q23;pl3) results in consistent fusion of E2A and PBXl coding sequences in acute lymphoblastic leukemias. Blood 77, 687-693.
Hurwitz, R., Hozier, J., LeBien, T., Minowada, J., Gajl-Peczalska, K., Kubonishi, I., and Kersey, J. (1979). Characterization of a leukemic cell line of the pre-B phenotype. Int J Cancer 23, 174-180.
Husson, H., Carideo, E. G., Neuberg, D., Schultze, J., Munoz, O., Marks, P. W., Donovan, J. W., Chillemi, A. C., O'Connell, P., and Freedman, A. S. (2002). Gene expression profiling of follicular lymphoma and normal germinal center B cells using cDNA arrays. Blood 99, 282-289.
lARC (1997). Monographs on the evaluation of carcinogenic risks to humans, Epstein-Barr virus and Kaposi’s sarcoma herpesvirus/human herpesvirus, no. 8. (Lyon, lARC Press).
lida. S., Rao, P. H., Nallasivam, P., Hibshoosh, H., Butler, M., Louie, D. C., Dyomin, V., Ohno, H., Chaganti, R. S., and Dalla-Favera, R. (1996). The t(9;14)(pl3;q32) chromosomal translocation associated with lymphoplasmacytoid lymphoma involves the PAX-5 gene. Blood 88, 4110-4117.
lida. S., Rao, P. H., Ueda, R., Chaganti, R. S., and Dalla-Favera, R. (1999). Chromosomal rearrangement of the PAX-5 locus in lymphoplasmacytic lymphoma with t(9;14)(pl3;q32). Leuk Lymphoma 34, 25-33.
lizuka, N., Oka, M., Yamada-Okabe, H., Mori, N., Tamesa, T., Okada, T., Takemoto, N., Tangoku, A., Hamada, K., Nakayama, H., et al. (2002). Comparison of gene expression profiles between hepatitis B virus- and hepatitis C virus-infected hepatocellular carcinoma by oligonucleotide microarray data on the basis of a supervised learning method. Cancer Res 62, 3939-3944.
289
Inagi, R., Okuno, T., Ito, M., Chen, J., Mon, Y., Haque, M., Zou, P., Vagi, H., Kiniwa, S., S aida. T., et a l (1999). Identification and characterization of human herpesvirus 8 open reading frame K9 viral interferon regulatory factor by a monoclonal antibody. J Hum Virol 2, 63-71.
Inohara, N., Gourley, T. S., Carrio, R., Muniz, M., Merino, J., Garcia, I., Koseki, T., Hu, Y., Chen, S., and Nunez, G. (1998). Diva, a Bcl-2 homologue that binds directly to Apaf-1 and induces BH3-independent cell death. J Biol Chem 273, 32479-32486.
International Human Genome Sequencing Consortium (2001). Initial sequencing and analysis of the human genome. Nature 409, 860-921.
Irmler, M., Thome, M., Hahne, M., Schneider, P., Hofmann, K., Steiner, V., Bodmer, J. L., Schroter, M., Bums, K., Mattmann, C., et a l (1997). Inhibition of death receptor signals by cellular FLIP. Nature 388, 190-195.
Isaacs, A., and Lindenmann, J. (1957). Virus Interference: I. The interferon. Proc R Soc Lond [B] 147, 258-263.
Ishido, S., Choi, J. K., Lee, B. S., Wang, C., DeMaria, M., Johnson, R. P., Cohen, G. B., and Jung, J. U. (2000a). Inhibition of natural killer cell-mediated cytotoxicity by Kaposi's sarcoma-associated herpesvirus K5 protein. Immunity 13, 365-374.
Ishido, S., Wang, C., Lee, B. S., Cohen, G. B., and Jung, J. U. (2000b). Downregulation of major histocompatibility complex class I molecules by Kaposi's sarcoma-associated herpesvims K3 and K5 proteins. J Virol 74, 5300-5309.
Ishiyama, T., Nakamura, S., Akimoto, Y., Koike, M., Tomoyasu, S., Tsuruoka, N., Murata, Y., Sato, T., Wakabayashi, Y., and Chiba, S. (1994). Immunodeficiency and IL-6 production by peripheral blood monocytes in multicentric Castleman's disease. Br J Haematol 86, 483-489.
Ishov, A. M., and Maul, G. G. (1996). The periphery of nuclear domain 10 (NDIO) as site of DNA virus deposition. J Cell Biol 134, 815-826.
Ishov, A. M., Stenberg, R. M., and Maul, G. G. (1997). Human cytomegalovirus immediate early interaction with host nuclear structures: definition of an immediate transcript environment. J Cell Biol 138, 5-16.
Ito, T., Tashiro, K., Muta, S., Ozawa, R., Chiba, T., Nishizawa, M., Yamamoto, K., Kuhara, S., and Sakaki, Y. (2000). Toward a protein-protein interaction map of the budding yeast: A comprehensive system to examine two-hybrid interactions in all possible combinations between the yeast proteins. Proc Natl Acad Sci U S A 97, 1143-1147.
Iyer, V. R., Eisen, M. B., Ross, D. T., Schuler, G., Moore, T., Lee, J. C. P., Trent, J. M., Staudt, L. M., Hudson, J., Jr., Boguski, M. S., et a l (1999). The transcriptional program in the response of human fibroblasts to serum. Science 283, 83-87.
Iyer, V. R., Horak, C. E., Scafe, C. S., Botstein, D., Snyder, M., and Brown, P. O. (2001). Genomic binding sites of the yeast cell-cycle transcription factors SBF and MBF. Nature 409, 533-538.
Izumi, K. M., and Kieff, E. D. (1997). The Epstein-Barr virus oncogene product latent membrane protein 1 engages the tumor necrosis factor receptor-associated death domain protein to mediate B lymphocyte growth transformation and activate NF-kappaB. Proc Natl Acad Sci U S A 94, 12592-12597.
Jacob, J., Kassir, R., and Kelsoe, G. (1991a). In situ studies of the primary immune response to (4- hydroxy-3-nitrophenyl)acetyl. I. The architecture and dynamics of responding cell populations. J Exp Med 173, 1165-1175.
Jacob, J., Kelsoe, G., Rajewsky, K., and Weiss, U. (1991b). Intraclonal generation of antibody mutants in germinal centres. Nature 354, 389-392.
Jaffe, E. S., Harris, N. L., Stein, H., and Vardiman, J. W., eds. (2001). World Health Organization Classification of Tumours. Pathology and Genetics of Tumours of Haematopoietic and Lymphoid Tissues (Lyon, lARC Press).
290
Janeway, C, A., Jr., Travers, P., Walport, M., and Shlomchik, M. J. (2001). Immunobiology: The immune system in health and disease., 5th edn (New York, Garland Publishing).
Janier, M., Vignon, M. D., and Cottentot, F. (1985). Spontaneously healing Kaposi's sarcoma in AIDS. N Engl J Med 312, 1638-1639.
Jayachandra, S., Low, K. 0 ., Thlick, A. E., Yu, J., Ling, P. D., Chang, Y., and Moore, P. S. (1999). Three unrelated viral transforming proteins (vIRF, EBNA2, and E l A) induce the MYC oncogene through the interferon-responsive PRF element by using different transcription coadaptors. Proc Natl Acad Sci U S A 96, 11566-11571.
Jego, G., Bataille, R., and Pellat-Deceunynck, C. (2001). Interleukin-6 is a growth factor for nonmalignant human plasmablasts. Blood 97, 1817-1822.
Jenner, R. G., Alba, M. M., Boshoff, C., and Kellam, P. (2001). Kaposi's sarcoma-associated herpesvirus latent and lytic gene expression as revealed by DNA arrays. J Virol 75, 891-902.
Jeong, J., Papin, J., and Dittmer, D. (2001). Differential regulation of the overlapping Kaposi's sarcoma- associated herpesvirus vGCR (orf74) and LANA (orf73) promoters. J Virol 75, 1798-1807.
Jin, W., Riley, R. M., Wolfmger, R. D., White, K. P., Passador-Gurgel, G., and Gibson, G. (2001). The contributions of sex, genotype and age to transcriptional variance in Drosophila melanogaster. Nat Genet 29, 389-395.
Johannes, G., Carter, M. S., Eisen, M. B., Brown, P. O., and Samow, P. (1999). Identification of eukaryotic mRNAs that are translated at reduced cap binding complex eIF4F concentrations using a cDNA microarray. Proc Natl Acad Sci U S A 96, 13118-13123.
Johannsen, E., Koh, E., Mosialos, G., Tong, X., Kieff, E., and Grossman, S. R. (1995). Epstein-Barr virus nuclear protein 2 transactivation of the latent membrane protein 1 promoter is mediated by J kappa and PU.l. J Virol 69, 253-262.
Jones, J. L., Hanson, D. L., Chu, S. Y., Ward, J. W., and Jaffe, H. W. (1995). AIDS-associated Kaposi's sarcoma. Science 267, 1078-1079.
Joseph, A. M., Babcock, G. J., and Thorley-Lawson, D. A. (2000a). Cells expressing the Epstein-Barr virus growth program are present in and restricted to the naive B-cell subset of healthy tonsils. J Virol 74, 9964-9971.
Joseph, A. M., Babcock, G. J., and Thorley-Lawson, D. A. (2000b). EBV persistence involves strict selection of latently infected B cells. J Immunol 165, 2975-2981.
Jover, J. A., Chartash, E. K., Kushner, B., Friedman, S. M., and Crow, M. K. (1989). T helper cell-induced CD23 (BLAST-2) expression: an activation marker for the high density fraction of human B cells. Clin Immunol Immunopathol 53, 99-112.
Juang, Y., Lowther, W., Kellum, M., Au, W. C., Lin, R., Hiscott, J., and Pitha, P. M. (1998). Primary activation of interferon A and interferon B gene transcription by interferon regulatory factor 3. Proc Natl Acad Sci U S A 95, 9837-9842.
Judde, J. G., Lacoste, V., Briere, J., Kassa-Kelembho, E., Clyti, E., Couppie, P., Buchrieser, C., Tulliez, M., Morvan, J., and Gessain, A. (2000). Monoclonality or oligoclonality of human herpesvirus 8 terminal repeat sequences in Kaposi's sarcoma and other diseases. J Natl Cancer Inst 92, 729-736.
Jungnickel, B., Staratschek-Jox, A., Brauninger, A., Spieker, T., Wolf, J., Diehl, V., Hansmann, M. L., Rajewsky, K., and Kuppers, R. (2000). Clonal deleterious mutations in the IkappaB alpha gene in the malignant cells in Hodgkin's lymphoma. J Exp Med 191, 395-402.
Jussila, L., Valtola, R., Partanen, T. A., Salven, P., Heikkila, P., Matikainen, M. T., Renkonen, R., Kaipainen, A., Detmar, M., Tschachler, E., et al. (1998). Lymphatic endothelium and Kaposi's sarcoma spindle cells detected by antibodies against the vascular endothelial growth factor receptor-3. Cancer Res 58, 1599-1604.
291
Kaiser, C., Laux, G., Eick, D., Jochner, N., Bomkamm, G. W., and Kempkes, B. (1999). The proto- oncogene c-myc is a direct target gene of Epstein-Barr virus nuclear antigen 2. J Virol 73, 4481-4484.
Kanzler, H., Kuppers, R., Hansmann, M. L., and Rajewsky, K. (1996). Hodgkin and Reed-Stemberg cells in Hodgkin's disease represent the outgrowth of a dominant tumor clone derived from (crippled) germinal center B cells. J Exp Med 184, 1495-1505.
Kaposi, M. (1872). Idiopathic multiple pigmented sarcoma of the skin. Arch Dermatol Syphil 4, 256-273.
Karcher, D. S., and Alkan, S. (1997). Human herpesvirus-8-associated body cavity-based lymphoma in human immunodeficiency vims-infected patients: a unique B-cell neoplasm. Hum Pathol 28, 801-808.
Kasolo, P. C., Monze, M., Obel, N., Anderson, R. A., French, C., and Gompels, U. A. (1998). Sequence analyses of human herpesvims-8 strains from both African human immunodeficiency vims-negative and - positive childhood endemic Kaposi's sarcoma show a close relationship with strains identified in febrile children and high variation in the K1 glycoprotein. J Gen Virol 79, 3055-3065.
Katano, H., Hoshino, Y., Morishita, Y., Nakamura, T., Satoh, H., Iwamoto, A., Hemdier, B., and Mori, S. (1999). Establishing and characterizing a CD30-positive cell line harboring HHV-8 from a primary effusion lymphoma. J Med Virol 58, 394-401.
Katano, H., Iwasaki, T., Baba, N., Terai, M., Mori, S., Iwamoto, A., Kurata, T., and Sata, T. (2000a). Identification of antigenic proteins encoded by human herpesvirus 8 and seroprevalence in the general population and among patients with and without Kaposi's sarcoma. J Virol 74, 3478-3485.
Katano, H., Sato, Y., Kurata, T., Mori, S., and Sata, T. (2000b). Expression and localization of human herpesvirus 8-encoded proteins in primary effusion lymphoma, Kaposi's sarcoma, and multicentric Castleman's disease. Virology 269, 335-344.
Katayama, T., Imaizumi, K., Honda, A., Yoneda, T., Kudo, T., Takeda, M., Mori, K., Rozmahel, R., Fraser, P., George-Hyslop, P. S., and Tohyama, M. (2001). Disturbed activation of endoplasmic reticulum stress transducers by familial Alzheimer's disease-linked presenilin-1 mutations. J Biol Chem 276, 43446- 43454.
Katayama, T., Imaizumi, K., Sato, N., Miyoshi, K., Kudo, T., Hitomi, J., Morihara, T., Yoneda, T., Gomi, F., Mori, Y., et al. (1999). Presenilin-1 mutations downregulate the signalling pathway of the unfolded- protein response. Nat Cell Biol I, 479-485.
Kaufman, R. J. (1999). Stress signaling from the lumen of the endoplasmic reticulum: coordination of gene transcriptional and translational controls. Genes Dev 75,1211-1233.
Kawano, M., Hirano, T., Matsuda, T., Taga, T., Horii, Y., Iwato, K., Asaoku, H., Tang, B., Tanabe, O., Tanaka, H., and et al. (1988). Autocrine generation and requirement of BSF-2/IL-6 for human multiple myelomas. Nature 332, 83-85.
Kawano, M. M., Mihara, K., Huang, N., Tsujimoto, T., and Kuramoto, A. (1995). Differentiation of early plasma cells on bone marrow stromal cells requires interleukin-6 for escaping from apoptosis. Blood 85, 487-494.
Kaye, K. M., Izumi, K. M., and Kieff, E. (1993). Epstein-Barr virus latent membrane protein 1 is essential for B-lymphocyte growth transformation. Proc Natl Acad Sci U S A 90, 9150-9154.
Kedes, D. H., Ganem, D., Ameli, N., Bacchetti, P., and Greenblatt, R. (1997a). The prevalence of serum antibody to human herpesvirus 8 (Kaposi sarcoma-associated herpesvirus) among HIV-seropositive and high-risk HIV-seronegative women. Jama 277, 478-481.
Kedes, D. H., Lagunoff, M., Renne, R., and Ganem, D. (1997b). Identification of the gene encoding the major latency-associated nuclear antigen of the Kaposi's sarcoma-associated herpesvirus. J Clin Invest 100, 2606-2610.
292

Kedes, D, H,, Operskalski, E., Busch, M., Kohn, R., Flood, J., and Ganem, D. (1996). The seroepidemiology of human herpesvirus 8 (Kaposi's sarcoma-associated herpesvirus): distribution of infection in KS risk groups and evidence for sexual transmission. Nat Med 2, 918-924.
Kellam, P. (2000). Host-pathogen studies in the post-genomic era. GenomeBiologycom 1.
Kellam, P., Boshoff, C., Whitby, D., Matthews, S., Weiss, R. A., and Talbot, S. J. (1997). Identification of a major latent nuclear antigen, LNA-1, in the human herpesvirus 8 genome. J Hum Virol 7, 19-29.
Kellam, P., Bourboulia, D., Dupin, N., Shotton, C., Fisher, C., Talbot, S., Boshoff, C., and Weiss, R. A.(1999). Characterization of monoclonal antibodies raised against the latent nuclear antigen of human herpesvirus 8. J Virol 73, 5149-5155.
Keller, S. A., Schattner, E. J., and Cesarman, E. (2000). Inhibition of NF-kappaB induces apoptosis of KSHV-infected primary effusion lymphoma cells. Blood 96, 2537-2542.
Kelsoe, G. (1996). Life and death in germinal centers (redux). Immunity 4, 107-111.
Kerr, M. K., Martin, M., and Churchill, G. A. (2000). Analysis of variance for gene expression microarray data. J Comput Biol 7, 819-837.
Khan, J., Wei, J. S., Ringner, M., Saal, L. H., Ladanyi, M., Westermann, F., Berthold, F., Schwab, M., Antonescu, C. R., Peterson, C., and Meltzer, P. S. (2001). Classification and diagnostic prediction of cancers using gene expression profiling and artificial neural networks. Nat Med 7, 673-679.
Khodarev, N. N., Advani, S. J., Gupta, N., Roizman, B., and Weichselbaum, R. R. (1999). Accumulation of specific RNAs encoding transcriptional factors and stress response proteins against a background of severe depletion of cellular RNAs in cells infected with herpes simplex virus 1. Proc Natl Acad Sci U S A 96, 12062-12067.
Kieff, E., and Rickinson, A. B. (2001). Epstein-Barr Virus and Its Replication. In Fields' Virology, D. K. Knipe, and P. M. Howley, eds. (Philadelphia, Lippincott Williams & Wilkins), pp. 2511-2574.
Kilger, E., Kieser, A., Baumann, M., and Hammerschmidt, W. (1998). Epstein-Barr virus-mediated B-cell proliferation is dependent upon latent membrane protein 1, which simulates an activated CD40 receptor. Embo J 77, 1700-1709.
Kim, J. H., Rah, J. C., Fraser, S. P., Chang, K. A., Djamgoz, M. B., and Suh, Y. H. (2002). Carboxyl- terminal Peptide of beta -Amyloid Precursor Protein Blocks Inositol 1,4,5-Trisphosphate-sensitive Ca24- Release in Xenopus laevis Oocytes. J Biol Chem 277, 20256-20263.
Kim, O. J., and Yates, J. L. (1993). Mutants of Epstein-Barr virus with a selective marker disrupting the TP gene transform B cells and replicate normally in culture. J Virol 67, 7634-7640.
Kim, S. H., Choi, E. Y., Shin, Y. K., Kim, T. J., Chung, D. H., Chang, S. 1., Kim, N. K., and Park, S. H.(1998). Generation of cells with Hodgkin's and Reed-Stemberg phenotype through downregulation of CD99 (Mic2). Blood 92, 4287-4295.
Kim, S. H., Shin, Y. K., Lee, 1. S., Bae, Y. M., Sohn, H. W., Suh, Y. H., Ree, H. J., Rowe, M., and Park, S.H. (2000). Viral latent membrane protein 1 (LMP-l)-induced CD99 down-regulation in B cells leads to the generation of cells with Hodgkin's and Reed-Stemberg phenotype. Blood 95, 294-300.
Kimberly, W. T., Zheng, J. B., Guenette, S. Y., and Selkoe, D. J. (2001). The intracellular domain of the beta-amyloid precursor protein is stabilized by Fe65 and translocates to the nucleus in a notch-like manner. J Biol Chem 276,40288-40292.
Kirchhoff, S., Wilhelm, D., Angel, P., and Hauser, H. (1999). NFkappaB activation is required for interferon regulatory factor-1-mediated interferon beta induction. Eur J Biochem 261, 546-554.
Kirshner, J. R., Lukac, D. M., Chang, J., and Ganem, D. (2000). Kaposi's sarcoma-associated herpesvims open reading frame 57 encodes a posttranscriptional regulator with multiple distinct activities. J Virol 74, 3586-3597.
293
Kirshner, J. R., Staskus, K., Haase, A., Lagunoff, M., and Ganem, D. (1999). Expression of the open reading frame 74 (G-protein-coupled receptor) gene of Kaposi's sarcoma (KS)-associated herpesvirus: implications for KS pathogenesis. J Virol 73, 6006-6014.
Kitareewan, S., Pitha-Rowe, I., Sekula, D., Lowrey, C. H., Nemeth, M. J., Golub, T. R., Freemantle, S. J., and Dmitrovsky, E. (2002). UBEIL is a retinoid target that triggers PML/RARalpha degradation and apoptosis in acute promyelocytic leukemia. Proc Natl Acad Sci U S A 99, 3806-3811.
Kledal, T. N., Rosenkilde, M. M., Coulin, P., Simmons, G., Johnsen, A. H., Alouani, S., Power, C. A., Luttichau, H. R., Gerstoft, J., Clapham, P. R., et al. (1997). A broad-spectrum chemokine antagonist encoded by Kaposi's sarcoma-associated herpesvirus. Science 277, 1656-1659.
Klein, B., Zhang, X. G., Jourdan, M., Content, J., Houssiau, P., Aarden, L., Piechaczyk, M., and Bataille, R. (1989). Paracrine rather than autocrine regulation of myeloma-cell growth and differentiation by interleukin-6. Blood 73, 517-526.
Klein, G., Giovanella, B., Westman, A., Stehlin, J. S., and Mumford, D. (1975). An EBV-genome-negative cell line established from an American Burkitt lymphoma; receptor characteristics. EBV infectibility and permanent conversion into EBV-positive sublines by in vitro infection. Intervirology 5, 319-334.
Klein, U., Klein, G., Ehlin-Henriksson, B., Rajewsky, K., and Kuppers, R. (1995). Burkitt's lymphoma is a malignancy of mature B cells expressing somatically mutated V region genes. Mol Med 1, 495-505.
Klein, U., Rajewsky, K., and Kuppers, R. (1998). Human immunoglobulin (Ig)M+IgD4- peripheral blood B cells expressing the CD27 cell surface antigen carry somatically mutated variable region genes: CD27 as a general marker for somatically mutated (memory) B cells. J Exp Med 188, 1679-1689.
Klein, U., Tu, Y., Stolovitzky, G. A., Mattioli, M., Cattoretti, G., Husson, H., Preedman, A., Inghirami, G., Cro, L., Baldini, L., et al. (2001). Gene expression profiling of B cell chronic lymphocytic leukemia reveals a homogeneous phenotype related to memory B cells. J Exp Med 194, 1625-1638.
Kleines, M., Pinke, K., Ritter, K., and Schaade, L. (2000). Induction of growth rate and transcriptional modulation of growth promoters and growth inhibitors in epithelial cells by EBV-LMPl. Virus Res 68, 63- 69.
Kliche, S., Nagel, W., Kremmer, E., Atzler, C., Ege, A., Knorr, T., Koszinowski, U., Kolanus, W., and Haas, J. (2001). Signaling by human herpesvirus 8 kaposin A through direct membrane recruitment of cytohesin-1. Mol Cell 7, 833-843.
Kluin-Nelemans, H. C., Krouwels, M. M., Jansen, J. H., Dijkstra, K., van Toi, M. J., den Ottolander, G. J., Dreef, E. J., and Kluin, P. M. (1990). Hairy cell leukemia preferentially expresses the IgG3-subclass.Blood 75, 972-975.
Kluin-Nelemans, H. C., Limpens, J., Meerabux, J., Beverstock, G. C., Jansen, J. H., de Jong, D., and Kluin, P. M. (1991). A new non-Hodgkin's B-cell line (DoHH2) with a chromosomal translocation t(14;18)(q32;q21). Leukemia 5, 221-224.
Kluin-Nelemans, J. C., Wientjens, G. J., and Jansen, J. H. (1992). Establishment of a new human B-cell line (BONNA-12) with trisomy 9 and trisomy 12 chromosomal abnormality. Leukemia 6, 158.
Knight, J. S., Cotter, M. A., 2nd, and Robertson, E. S. (2001). The latency-associated nuclear antigen of Kaposi's Sarcoma-associated Herpesvirus transactivates the telomerase reverse transcriptase promoter. J Biol Chem 19, 19.
Knodel, M., Kuss, A. W., Berberich, I., and Schimpl, A. (2001). Blimp-1 over-expression abrogates IL-4- and CD40-mediated suppression of terminal B cell differentiation but arrests isotype switching. Eur J Immunol 31, 1972-1980.
Knowles, D. M., Cesarman, E., Chadbum, A., Prizzera, G., Chen, J., Rose, E. A., and Michler, R. E. (1995). Correlative morphologic and molecular genetic analysis demonstrates three distinct categories of posttransplantation lymphoproliferative disorders. Blood 85, 552-565.
294
Knowles, D. M., Inghirami, G., Ubriaco, A., and Dalla-Favera, R. (1989). Molecular genetic analysis of three AIDS-associated neoplasms of uncertain lineage demonstrates their B-cell derivation and the possible pathogenetic role of the Epstein-Barr virus. Blood 73, 792-799.
Knutson, J. C. (1990). The level of c-fgr RNA is increased by EBNA-2, an Epstein-Barr virus gene required for B-cell immortalization. J Virol 64, 2530-2536.
Koelle, D. M., Huang, M. L., Chandran, B., Vieira, J., Piepkom, M., and Corey, L. (1997). Frequent detection of Kaposi's sarcoma-associated herpesvirus (human herpesvirus 8) DNA in saliva of human immunodeficiency virus-infected men: clinical and immunologic correlates. J Infect Dis 176, 94-102.
Kohonen, T. (1991). Self-Organizing maps. Proc IEEE 78, 1464-1480.
Komanduri, K. V., Luce, J. A., McGrath, M. S., Hemdier, B. G., and Ng, V. L. (1996). The natural history and molecular heterogeneity of HIV-associated primary malignant lymphomatous effusions. J Acquir Immune Defic Syndr Hum Retrovirol IS, 215-226.
Komori, T., Okada, A., Stewart, V., and Alt, F. W. (1993). Lack of N regions in antigen receptor variable region genes of TdT-deficient lymphocytes. Science 261, 1171-1175.
Korsmeyer, S. J., Arnold, A., Bakhshi, A., Ravetch, J. V., Siebenlist, U., Hieter, P. A., Sharrow, S. O., LeBien, T. W., Kersey, J. H., Poplack, D. G., et al. (1983). Immunoglobulin gene rearrangement and cell surface antigen expression in acute lymphocytic leukemias of T cell and B cell precursor origins. J Clin Invest 71, 301-313.
Krappmann, D., Emmerich, F., Kordes, U., Scharschmidt, E., Dorken, B., and Scheidereit, C. (1999). Molecular mechanisms of constitutive NF-kappaB/Rel activation in Hodgkin/Reed-Stemberg cells. Oncogene 18, 943-953.
Krauer, K. G., Kienzle, N., Young, D. B., and Sculley, T. B. (1996). Epstein-Barr nuclear antigen-3 and -4 interact with RBP-2N, a major isoform of RBP-J kappa in B lymphocytes. Virology 226, 346-353.
Kremmer, E., Sommer, P., Holzer, D., Galetsky, S. A., Molochkov, V. A., Gurtsevitch, V., Winkelmann, C., Lisner, R., Niedobitek, G., and Grasser, F. A. (1999). Kaposi's sarcoma-associated herpesvirus (human herpesvirus-8) ORF54 encodes a functional dUTPase expressed in the lytic replication cycle. J Gen Virol 80, 1305-1310.
Krenacs, L., Himmelmann, A. W., Quintanilla-Martinez, L., Fest, T., Riva, A., Wellmann, A., Bagdi, E., Kehrl, J. H., Jaffe, E. S., and Raffeld, M. (1998). Transcription factor B-cell-specific activator protein (BSAP) is differentially expressed in B cells and in subsets of B-cell lymphomas. Blood 92, 1308-1316.
Krithivas, A., Young, D. B., Liao, G., Greene, D., and Hayward, S. D. (2000). Human herpesvirus 8 LANA interacts with proteins of the mSin3 corepressor complex and negatively regulates Epstein-Barr virus gene expression in dually infected PEL cells. J Virol 74, 9637-9645.
Krown, S. E. (1998). Interferon-alpha: evolving therapy for AIDS-associated Kaposi's sarcoma. J Interferon Cytokine Res 18, 209-214.
Kuehl, W. M., and Bergsagel, P. L. (2002). Multiple myeloma: evolving genetic events and host interactions. Nat Rev Cancer 2, 175-187.
Kumar, A., Haque, J., Lacoste, J., Hiscott, J., and Williams, B. R. (1994). Double-stranded RNA- dependent protein kinase activates transcription factor NF-kappa B by phosphorylating I kappa B. Proc Natl Acad Sci U S A 91, 6288-6292.
Kuppers, R., Klein, U., Hansmann, M. L., and Rajewsky, K. (1999). Cellular origin of human B-cell lymphomas. N Engl J Med 341, 1520-1529.
Kuppers, R., Rajewsky, K., Zhao, M., Simons, G., Laumann, R., Fischer, R., and Hansmann, M. L. (1994). Hodgkin disease: Hodgkin and Reed-Stemberg cells picked from histological sections show clonal immunoglobulin gene rearrangements and appear to be derived from B cells at various stages of development. Proc Natl Acad Sci U S A 97, 10962-10966.
295
Kurth, J., Spieker, T., Wustrow, J., Strickier, G. J., Hansmann, L. M., Rajewsky, K., and Kuppers, R.(2000). EBV-infected B cells in infectious mononucleosis: viral strategies for spreading in the B cell compartment and establishing latency. Immunity 13, 485-495.
Kusano, S., and Raab-Traub, N. (2001). An Epstein-Barr virus protein interacts with Notch. J Virol 75, 384-395.
Kuze, T., Nakamura, N., Hashimoto, Y., and Abe, M. (1998). Most of CD30+ anaplastic large cell lymphoma of B cell type show a somatic mutation in the IgH V region genes. Leukemia 12, 753-757.
Kuze, T., Nakamura, N., Hashimoto, Y., Abe, M., and Wakasa, H. (1996). Clinicopathological, immunological and genetic studies of CD30-I- anaplastic large cell lymphoma of B-cell type; association with Epstein-Barr virus in a Japanese population. J Pathol 180, 236-242.
Lacoste, V., Judde, J. G., Briere, J., Tulliez, M., Garin, B., Kassa-Kelembho, E., Morvan, J., Couppie, P., Clyti, E., Forteza Vila, J., et a l (2000a). Molecular epidemiology of human herpesvirus 8 in africa: both B and A5 K1 genotypes, as well as the M and P genotypes of K14.1/K15 loci, are frequent and widespread. Virology 278, 60-74.
Lacoste, V., Mauclere, P., Dubreuil, G., Lewis, J., Georges-Courbot, M. C., and Gessain, A. (2000b). KSHV-like herpesviruses in chimps and gorillas. Nature 407, 151-152.
Lacoste, V., Mauclere, P., Dubreuil, G., Lewis, J., Georges-Courbot, M. C., Rigoulet, J., Petit, T., and Gessain, A. (2000c). Simian homologues of human gamma-2 and betaherpesviruses in mandrill and drill monkeys. J Virol 74, 11993-11999.
Lagunoff, M., and Ganem, D. (1997). The structure and coding organization of the genomic termini of Kaposi's sarcoma-associated herpesvirus. Virology 236, 147-154.
Lagunoff, M., Lukac, D. M., and Ganem, D. (2001). Immunoreceptor tyrosine-based activation motif- dependent signaling by Kaposi's sarcoma-associated herpesvirus K1 protein: effects on lytic viral replication. J Virol 75, 5891-5898.
Lagunoff, M., Majeti, R., Weiss, A., and Ganem, D. (1999). Deregulated signal transduction by the K1 gene product of Kaposi's sarcoma-associated herpesvirus. Proc Natl Acad Sci U S A 96, 5704-5709.
Laherty, C. D., Hu, H. M., Opipari, A. W., Wang, P., and Dixit, V. M. (1992). The Epstein-Barr virus LMPl gene product induces A20 zinc finger protein expression by activating nuclear factor kappa B. J Biol Chem 267, 24157-24160.
Lai, A., Kennedy, B. K., Barbie, D. A., Bertos, N. R., Yang, X. J., Theberge, M. C., Tsai, S. C., Seto, E., Zhang, Y., Kuzmichev, A., et a l (2001). RBPl recruits the mSlN3-histone deacetylase complex to the pocket of retinoblastoma tumor suppressor family proteins found in limited discrete regions of the nucleus at growth arrest. Mol Cell Biol 21, 2918-2932.
Laichalk, L. L., Hochberg, D., Babcock, G. J., Freeman, R. B., and Thorley-Lawson, D. A. (2002). The dispersal of mucosal memory B cells: evidence from persistent EBV infection. Immunity 16, 745-754.
Lallemand, P., Desire, N., Rozenbaum, W., Nicolas, J. C., and Maréchal, V. (2000). Quantitative analysis of human herpesvirus 8 viral load using a real-time PCR assay. J Clin Microbiol 38, 1404-1408.
Lalmanach-Girard, A. C., Chiles, T. C., Parker, D. C., and Rothstein, T. L. (1993). T cell-dependent induction of NP-kappa B in B cells. J Exp Med 777, 1215-1219.
Lam, K. P., Kuhn, R., and Rajewsky, K. (1997). In vivo ablation of surface immunoglobulin on mature B cells by inducible gene targeting results in rapid cell death. Cell 90, 1073-1083.
Laman, H., Coverley, D., Krude, T., Laskey, R., and Jones, N. (2001). Viral cyclin-cyclin-dependent kinase 6 complexes initiate nuclear DNA replication. Mol Cell Biol 27, 624-635.
Lankester, K. J., Lishman, S., Ayliffe, U., Kocjan, G., Spittle, M. P., and Miller, R. P. (1998). Primary effusion lymphoma and Kaposi's sarcoma in an HIV-infected man. Int J STD AIDS 9, 616-618.
296
Lavau, C., Szilvassy, S. J., Slany, R., and Cleary, M. L. (1997). Immortalization and leukemic transformation of a myelomonocytic precursor by retrovirally transduced HRX-ENL. Embo J 76,4226- 4237.
Lazzi, S., Ferrari, P., Nyongo, A., Palummo, N., de Milito, A., Zazzi, M., Leoncini, L., Luzi, P., and Tosi, P. (1998). HIV-associated malignant lymphomas in Kenya (Equatorial Africa). Hum Pathol 29, 1285- 1289.
Le Roux, A., Kerdiles, B., Walls, D., Dedieu, J. P., and Perricaudet, M. (1994). The Epstein-Barr virus determined nuclear antigens EBNA-3A, -3B, and -3C repress EBNA-2-mediated transactivation of the viral terminal protein 1 gene promoter. Virology 205, 596-602.
Lebbe, C., Blum, L., Pellet, C., Blanchard, G., Verola, O., Morel, P., Danne, O., and Calvo, P. (1998). Clinical and biological impact of antiretroviral therapy with protease inhibitors on HIV-related Kaposi's sarcoma. Aids 72, P45-49.
Lee, B. S., Alvarez, X., Ishido, S., Lackner, A. A., and Jung, J. U. (2000a). Inhibition of intracellular transport of B cell antigen receptor complexes by Kaposi's sarcoma-associated herpesvirus K l. J Exp Med 192, 11-21.
Lee, G., Namen, A. E., Gillis, S., Ellingsworth, L. R., and Kincade, P. W. (1989). Normal B cell precursors responsive to recombinant murine lL-7 and inhibition of lL-7 activity by transforming growth factor-beta,J Immunol 142, 3875-3883.
Lee, H., Guo, J., Li, M., Choi, J. K., DeMaria, M., Rosenzweig, M., and Jung, J. U. (1998a). Identification of an immunoreceptor tyrosine-based activation motif of Kl transforming protein of Kaposi's sarcoma- associated herpesvirus. Mol Cell Biol 18, 5219-5228.
Lee, H., Veazey, R., Williams, K., Li, M., Guo, J., Neipel, P., Fleckenstein, B., Lackner, A., Desrosiers, R.C., and Jung, J. U. (1998b). Deregulation of cell growth by the Kl gene of Kaposi's sarcoma-associated herpesvirus. Nat Med 4, 435-440.
Lee, H. H., Dadgostar, H., Cheng, Q., Shu, J., and Cheng, G. (1999a). NP-kappaB-mediated up-regulation of Bcl-x and Bfl-l/A l is required for CD40 survival signaling in B lymphocytes. Proc Natl Acad Sci U S A 96, 9136-9141.
Lee, K., Tirasophon, W., Shen, X., Michalak, M., Prywes, R., Okada, T., Yoshida, H., Mori, K., and Kaufman, R. J. (2002). IRE 1-mediated unconventional mRNA splicing and S2P-mediated ATP6 cleavage merge to regulate XBPl in signaling the unfolded protein response. Genes Dev 76, 452-466.
Lee, M. A., Diamond, M. E., and Yates, J. L. (1999b). Genetic evidence that EBNA-1 is needed for efficient, stable latent infection by Epstein-Barr virus. J Virol 73, 2974-2982.
Lee, M, L,, Kuo, P. C,, Whitmore, G. A., and Sklar, J. (2000b). Importance of replication in microarray gene expression studies: statistical methods and evidence from repetitive cDNA hybridizations. Proc Natl Acad Sci U S A 97, 9834-9839.
Leissring, M. A., Murphy, M. P., Mead, T. R., Akbari, Y., Sugarman, M. C., Jannatipour, M., Anliker, B., Muller, U., Saftig, P., De Strooper, B., et al. (2002). A physiologic signaling role for the gamma - secretase-derived intracellular fragment of APP. Proc Natl Acad Sci U S A 99, 4697-4702.
Lenardo, M. J., Pan, C. M., Maniatis, T., and Baltimore, D. (1989). The involvement of NP-kappa B in beta-interferon gene regulation reveals its role as widely inducible mediator of signal transduction. Cell 57, 287-294.
Lennette, E. T., Blackboum, D. J., and Levy, J. A. (1996). Antibodies to human herpesvirus type 8 in the general population and in Kaposi's sarcoma patients. Lancet 348, 858-861.
Lennon, G. G., and Lehrach, H. (1991). Hybridization analyses of arrayed cDNA libraries. Trends Genet 7, 314-317.
297
Leo, R., Boeker, M,, Peest, D., Hein, R., Baitl, R., Gessner, J. E., Selbach, J,, Wacker, G., and Deicher, H.(1992). Multiparameter analyses of normal and malignant human plasma cells: CD38++, CD56+, CD54+, clg+ is the common phenotype of myeloma cells. Ann Hematol 64, 132-139.
Levine, M. H., Haberman, A. M., Sant'Angelo, D. B., Hannum, L. G., Cancro, M. P., Janeway, C. A., Jr., and Shlomchik, M. J. (2000). A B-cell receptor-specific selection step governs immature to mature B cell differentiation. Proc Natl Acad Sci U S A 97, 2743-2748.
Lewin, B. (1992).).
Li, J., Peet, G. W., Balzarano, D., Li, X., Massa, P., Barton, R. W., and Marcu, K. B. (2001). Novel NEMO/IkappaB kinase and NF-kappa B target genes at the pre-B to immature B cell transition. J Biol Chem 276, 18579-18590.
Li, J. J., Huang, Y. Q., Cockerell, C. J., and Friedman-Kien, A. E. (1996). Localization of human herpeslike virus type 8 in vascular endothelial cells and perivascular spindle-shaped cells of Kaposi's sarcoma lesions by in situ hybridization. Am J Pathol 148, 1741-1748.
Li, J. Y., Gaillard, F., Moreau, A., Harousseau, J. L., Laboisse, C., Milpied, N., Bataille, R., and Avet- Loiseau, H. (1999a). Detection of translocation t(l I;14)(ql3;q32) in mantle cell lymphoma by fluorescence in situ hybridization. Am J Pathol 154, 1449-1452.
Li, M., Damania, B., Alvarez, X., Ogryzko, V., Ozato, K., and Jung, J. U. (2000). Inhibition of p300 histone acetyltransferase by viral interferon regulatory factor. Mol Cell Biol 20, 8254-8263.
Li, M., Lee, H., Guo, J., Neipel, F., Fleckenstein, B., Ozato, K., and Jung, J. U. (1998). Kaposi's sarcoma- associated herpesvirus viral interferon regulatory factor. J Virol 72, 5433-5440.
Li, M., Lee, H., Yoon, D. W., Albrecht, J. C., Fleckenstein, B., Neipel, F., and Jung, J. U. (1997). Kaposi's sarcoma-associated herpesvirus encodes a functional cyclin. J Virol 71, 1984-1991.
Li, M., MacKey, J., Czajak, S. C., Desrosiers, R. C., Lackner, A. A., and Jung, J. U. (1999b). Identification and characterization of Kaposi's sarcoma-associated herpesvirus K8.1 virion glycoprotein. J Virol 73, 1341-1349.
Li, Y., Tang, R., Xu, H., Qiu, M., Chen, Q., Chen, J., Fu, Z., Ying, K., Xie, Y., and Mao, Y. (2002). Discovery and analysis of hepatocellular carcinoma genes using cDNA microarrays. J Cancer Res Clin Oncol 128, 369-379.
Liang, P., and Pardee, A. B. (1992). Differential display of eukaryotic messenger RNA by means of the polymerase chain reaction. Science 257, 967-971.
Liang, X. H., Kleeman, L. K., Jiang, H. H., Gordon, G., Goldman, J. E., Berry, G., Herman, B., and Levine, B. (1998). Protection against fatal Sindbis virus encephalitis by beclin, a novel Bcl-2-interacting protein. J Virol 72, 8586-8596.
Lieberman, P. M., Hardwick, J. M., Sample, J., Hayward, G. S., and Hayward, S. D. (1990). The zta transactivator involved in induction of lytic cycle gene expression in Epstein-Barr virus-infected lymphocytes binds to both AP-1 and ZRE sites in target promoter and enhancer regions. J Virol 64, 1143- 1155.
Lim, C., Sohn, H., Gwack, Y., and Choe, J. (2000). Latency-associated nuclear antigen of Kaposi's sarcoma-associated herpesvirus (human herpesvirus-8) binds ATF4/CREB2 and inhibits its transcriptional activation activity. J Gen Virol 81 Pt 11, 2645-2652.
Lin, H., and Grosschedl, R. (1995). Failure of B-cell differentiation in mice lacking the transcription factor EBF. Nature 376, 263-267.
Lin, K., Dai, C. Y., and Ricciardi, R. P. (1998). Cloning and functional analysis of Kaposi's sarcoma- associated herpesvirus DNA polymerase and its processivity factor. J Virol 72, 6228-6232.
298
Lin, K. L, Angelin-Duclos, C., Kuo, T. C., and Calame, K. (2002). Blimp-1-dependent repression of Pax-5 is required for differentiation of B cells to immunoglobulin M-secreting plasma cells. Mol Cell Biol 22, 4771-4780.
Lin, R., Genin, P., Mamane, Y., Sgarbanti, M., Battistini, A., Harrington, W. J., Barber, G. N., and Hiscott, J. (2001). HHV-8 encoded vIRF-1 represses the interferon antiviral response by blocking IRF-3 recruitment of the CBP/p300 coactivators. Oncogene 20, 800-811.
Lin, S. F., Robinson, D. R., Miller, G., and Kung, H. J. (1999). Kaposi's sarcoma-associated herpesvirus encodes a bZIP protein with homology to BZLFl of Epstein-Barr virus. J Virol 73, 1909-1917.
Lin, S. F., Sun, R., Heston, L., Gradoville, L., Shedd, D., Haglund, K., Rigsby, M., and Miller, G. (1997a). Identification, expression, and immunogenicity of Kaposi's sarcoma-associated herpesvirus-encoded small viral capsid antigen. J Virol 71, 3069-3076.
Lin, Y., Wong, K., and Calame, K. (1997b). Repression of c-myc transcription by Blimp-1, an inducer of terminal B cell differentiation. Science 276, 596-599.
Ling, P. D., Hsieh, J. J., Ruf, I. K., Rawlins, D. R., and Hayward, S. D. (1994). EBNA-2 upregulation of Epstein-Barr virus latency promoters and the cellular CD23 promoter utilizes a common targeting intermediate, CBFl. J Virol 68, 5375-5383.
Ling, Y. H., Tomos, C., and Perez-Soler, R. (1998). Phosphorylation of Bcl-2 is a marker of M phase events and not a determinant of apoptosis. J Biol Chem 273, 18984-18991.
Liu, L., Eby, M. T., Rathore, N., Sinha, S. K., Kumar, A., and Chaudhary, P. M. (2002). The human herpes virus 8-encoded viral FLICE inhibitory protein physically associates with and persistently activates the Ikappa B kinase complex. J Biol Chem 277, 13745-13751.
Liu, P., Leong, T., Quam, L., Billadeau, D., Kay, N. E., Greipp, P., Kyle, R. A., Oken, M. M., and Van Ness, B. (1996). Activating mutations of N- and K-ras in multiple myeloma show different clinical associations: analysis of the Eastern Cooperative Oncology Group Phase III Trial. Blood 88, 2699-2706.
Liu, Y. J., Joshua, D. E., Williams, G. T., Smith, C. A., Gordon, J., and MacLennan, I. C. (1989). Mechanism of antigen-driven selection in germinal centres. Nature 342, 929-931.
Liu, Y. J., Oldfield, S., and MacLennan, I. C. (1988). Memory B cells in T cell-dependent antibody responses colonize the splenic marginal zones. Eur J Immunol 18, 355-362.
Lockhart, D. J., Dong, H., Byrne, M. C., Follettie, M. T., Gallo, M. V., Chee, M. S., Mittmann, M., Wang,C., Kobayashi, M., Horton, H., and Brown, E, L. (1996). Expression monitoring by hybridization to high- density oligonucleotide arrays. Nat Biotechnol 14, 1675-1680.
Loffert, D., Ehlich, A., Muller, W., and Rajewsky, K. (1996). Surrogate light chain expression is required to establish immunoglobulin heavy chain allelic exclusion during early B cell development. Immunity 4, 133-144.
Longnecker, R., Miller, C. L., Miao, X. Q., Marchini, A., and Kieff, E. (1992). The only domain which distinguishes Epstein-Barr virus latent membrane protein 2A (LMP2A) from LMP2B is dispensable for lymphocyte infection and growth transformation in vitro; LMP2A is therefore nonessential. J Virol 66, 6461-6469.
Lossos, I. S., Alizadeh, A. A., Eisen, M. B., Chan, W. C., Brown, P. O., Botstein, D., Staudt, L. M., and Levy, R. (2000). Ongoing immunoglobulin somatic mutation in germinal center B cell-like but not in activated B cell-like diffuse large cell lymphomas. Proc Natl Acad Sci U S A 97, 10209-10213.
Low, W., Harries, M., Ye, H., Du, M. Q., Boshoff, C., and Collins, M. (2001). Internal Ribosome Entry Site Regulates Translation of Kaposi's Sarcoma-Associated Herpesvirus FLICE Inhibitory Protein. J Virol 75, 2938-2945.
Lu, T. T., and Cyster, J. G. (2002). Integrin-mediated long-term B cell retention in the splenic marginal zone. Science 297, 409-412.
299
Lubyova, B., and Pitha, P. M. (2000). Characterization of a novel human herpesvirus 8-encoded protein, vIRF-3, that shows homology to viral and cellular interferon regulatory factors. J Virol 74, 8194-8201.
Lucas, K. G., Pollok, K. E., and Emanuel, D. J. (1997). Post-transplant EBV induced lymphoproliferative disorders. Leuk Lymphoma 25, 1-8.
Lueking, A., Horn, M., Eickhoff, H., Bussow, K., Lehrach, H., and Walter, G. (1999). Protein microarrays for gene expression and antibody screening. Anal Biochem 270, 103-1II.
Lugo, T. G., Pendergast, A. M., Muller, A. J., and Witte, O. N. (1990). Tyrosine kinase activity and transformation potency of bcr-abl oncogene products. Science 247, 1079-1082.
Lukac, D. M., Kirshner, J. R., and Ganem, D. (1999). Transcriptional activation by the product of open reading frame 50 of Kaposi's sarcoma-associated herpesvirus is required for lytic viral reactivation in B cells. J Virol 73, 9348-9361.
Luppi, M., Barozzi, P., Maiorana, A., Artusi, T., Trovato, R., Marasca, R., Savarino, M., Ceccherini-Nelli, L., and Torelli, G. (1996). Human herpesvirus-8 DNA sequences in human immunodeficiency virus- negative angioimmunoblastic lymphadenopathy and benign lymphadenopathy with giant germinal center hyperplasia and increased vascularity. Blood 87, 3903-3909.
Luther, S. A., Gulbranson-Judge, A., Acha-Orbea, H., and MacLennan, I. C. (1997). Viral superantigen drives extrafollicular and follicular B cell differentiation leading to virus-specific antibody production. J Exp Med 185, 551-562.
MacLennan, I. C. (1994). Germinal centers. Annu Rev Immunol 12, 117-139.
Macpherson, A. J., Lamarre, A., McCoy, K., Harriman, G. R., Odermatt, B., Dougan, G., Hengartner, H., and Zinkemagel, R. M. (2001). IgA production without mu or delta chain expression in developing B cells. Nat Immunol 2, 625-631.
Magrath, I. (1990). The pathogenesis of Burkitt's lymphoma. Adv Cancer Res 55, 133-270.
Makiguchi, Y., Hinoda, Y., and Imai, K. (1996). Effect of MUCl mucin, an anti-adhesion molecule, on tumor cell growth. Jpn J Cancer Res 87, 505-511.
Maloum, K., Magnac, C., Azgui, Z., Cau, C., Charlotte, P., Binet, J. L., Merle-Beral, H., and Dighiero, G.(1998). VH gene expression in hairy cell leukaemia. Br J Haematol 101, 171-178.
Mandanas, R. A., Leibowitz, D. S., Gharehbaghi, K., Tauchi, T., Burgess, G. S., Miyazawa, K., Jayaram,H. N., and Boswell, H. S. (1993). Role of p21 RAS in p210 bcr-abl transformation of murine myeloid cells. Blood 82, 1838-1847.
Mann, D. J., Child, E. S., Swanton, C., Laman, H., and Jones, N. (1999). Modulation of p27(Kipl) levels by the cyclin encoded by Kaposi's sarcoma-associated herpesvirus. Embo J 18, 654-663.
Mannick, J. B., Cohen, J. I., Birkenbach, M., Marchini, A., and Kieff, E. (1991). The Epstein-Barr virus nuclear protein encoded by the leader of the EBNA RNAs is important in B-lymphocyte transformation. J Virol 65, 6826-6837.
Manz, R. A., Thiel, A,, and Radbruch, A. (1997), Lifetime of plasma cells in the bone marrow. Nature 388, 133-134.
Marafioti, T., Hummel, M., Anagnostopoulos, I., Foss, H. D., Falini, B., Delsol, G., Isaacson, P. G., Pileri,S., and Stein, H. (1997). Origin of nodular lymphocyte-predominant Hodgkin's disease from a clonal expansion of highly mutated germinal-center B cells. N Engl J Med 337, 453-458.
Marafioti, T., Hummel, M., Foss, H. D., Laumen, H., Korbjuhn, P., Anagnostopoulos, I., Lammert, H., Demel, G., Theil, J., Wirth, T., and Stein, H. (2000). Hodgkin and reed-stemberg cells represent an expansion of a single clone originating from a germinal center B-cell with functional immunoglobulin gene rearrangements but defective immunoglobulin transcription. Blood 95, 1443-1450.
300

Marshall, D., and Sample, C. (1995). Epstein-Barr virus nuclear antigen 3C is a transcriptional regulator. J Virol 69, 3624-3630.
Martin, F., and Keamey, J. F. (2000). B-cell subsets and the mature preimmune repertoire. Marginal zone and B1 B cells as part of a "natural immune memory". Immunol Rev 175, 70-79.
Martin, J. N., Ganem, D. E., Osmond, D. H., Page-Shafer, K. A., Macrae, D., and Kedes, D. H. (1998). Sexual transmission and the natural history of human herpesvirus 8 infection. N Engl J Med 338, 948-954.
Martinez, R., Sarisky, R. T., Weber, P. C., and Weller, S. K. (1996). Herpes simplex virus type 1 alkaline nuclease is required for efficient processing of viral DNA replication intermediates. J Virol 70, 2075-2085.
Marton, M. J., DeRisi, J. L., Bennett, H. A., Iyer, V. R., Meyer, M. R., Roberts, C. J., Stoughton, R., Burchard, J., Slade, D., Dai, H., et al. (1998). Drug target validation and identification of secondary drug target effects using DNA microarrays. Nat Med 4, 1293-1301.
Masood, R., Cai, J., Zheng, T., Smith, D. L., Naidu, Y., and Gill, P. S. (1997). Vascular endothelial growth factor/vascular permeability factor is an autocrine growth factor for AIDS-Kaposi sarcoma. Proc Natl Acad Sci U S A 94, 979-984.
Masood, R., Cesarman, E., Smith, D. L., Gill, P. S., and Flore, O. (2002). Human herpesvirus-8- transformed endothelial cells have functionally activated vascular endothelial growth factor/vascular endothelial growth factor receptor. Am J Pathol 160, 23-29.
Masood, R., Nagpal, S., Zheng, T., Cai, J., Tulpule, A., Smith, D. L., and Gill, P. S. (2000). Kaposi sarcoma is a therapeutic target for vitamin D(3) receptor agonist. Blood 96, 3188-3194.
Matolcsy, A., Nador, R. G., Cesarman, E., and Knowles, D. M. (1998). Immunoglobulin VH gene mutational analysis suggests that primary effusion lymphomas derive from different stages of B cell maturation. Am J Pathol 153, 1609-1614.
Matsumoto, A. K., Martin, D. R., Carter, R. H., Klickstein, L. B., Aheam, J. M., and Fearon, D. T. (1993). Functional dissection of the CD21/CD 19/TAPA-1/Leu-13 complex of B lymphocytes. J Exp Med 178, 1407-1417.
Matsuoka, Y., Moore, G. E., Yagi, Y., and Pressman, D. (1967). Production of free light chains of immunoglobulin by a hematopoietic cell line derived from a patient with multiple myeloma. Proc Soc Exp Biol Med 125, 1246-1250.
Mayama, S., Cuevas, L. E., Sheldon, J., Omar, O. H., Smith, D. H., Okong, P., Silvel, B., Hart, C. A., and Schulz, T. F. (1998). Prevalence and transmission of Kaposi's sarcoma-associated herpesvirus (human herpesvirus 8) in Ugandan children and adolescents. Int J Cancer 77, 817-820.
Mayne, M., Cheadle, C., Soldan, S. S., Cermelli, C., Yamano, Y., Akhyani, N., Nagel, J. E., Taub, D. D., Becker, K. G., and Jacobson, S. (2001). Gene expression profile of herpesvirus-infected T cells obtained using immunomicroarrays: induction of proinflammatory mechanisms. J Virol 75, 11641-11650.
McCabe, N. R., Burnett, R. C., Gill, H. J., Thirman, M. J., Mbangkollo, D., Kipiniak, M., van Melle, E., Ziemin-van der Poel, S., Rowley, J. D., and Diaz, M. O. (1992). Cloning of cDNAs of the MLL gene that detect DNA rearrangements and altered RNA transcripts in human leukemic cells with 1 lq23 translocations. Proc Natl Acad Sci U S A 89, 11794-11798.
McGeoch, D. J., and Davison, A. J. (1999). The descent of human herpesvirus 8. Semin Cancer Biol 9, 201-209.
McHeyzer-Williams, M. G., and Ahmed, R. (1999). B cell memory and the long-lived plasma cell. Curr Opin Immunol 11, 172-179.
McNabb, D. S., and Courtney, R. J. (1992). Characterization of the large tegument protein (ICPl/2) of herpes simplex virus type 1. Virology 190, 221-232.
McNiece, I. K., Langley, K. E., and Zsebo, K. M. (1991). The role of recombinant stem cell factor in early B cell development. Synergistic interaction with IL-7. J Immunol 146, 3785-3790.
301
Meldolesi, M, F,, Friedman, R, M., and Kohn, L, D. (1977). An interferon-induced increase in cyclic AMP levels precedes the establishment of the antiviral state, Biochem Biophys Res Commun 79, 239-246.
Meng, Y. X., Spira, T. J., Bhat, G. J., Birch, C. J., Druce, J. D., Edlin, B, R., Edwards, R., Gunthel, C., Newton, R., Stamey, F. R., et al. (1999). Individuals from North America, Australasia, and Africa are infected with four different genotypes of human herpesvirus 8. Virology 261, 106-119.
Mesri, E. A., Cesarman, E., Arvanitakis, L., Rafii, S., Moore, M. A., Posnett, D. N., Knowles, D. M., and Asch, A. S. (1996). Human herpesvirus-8/Kaposi's sarcoma-associated herpesvirus is a new transmissible virus that infects B cells. J Exp Med 183, 2385-2390.
Messika, E. J., Lu, P. S., Sung, Y. J., Yao, T., Chi, J. T., Chien, Y. H., and Davis, M. M. (1998). Differential effect of B lymphocyte-induced maturation protein (Blimp-1) expression on cell fate during B cell development. J Exp Med 785, 515-525.
Mettenleiter, T. C. (2002). Herpesvirus assembly and egress. J Virol 76, 1537-1547.
Meurs, E. F., Watanabe, Y., Kadereit, S., Barber, G. N., Katze, M. G., Chong, K., Williams, B. R., and Hovanessian, A. G. (1992). Constitutive expression of human double-stranded RNA-activated p68 kinase in murine cells mediates phosphorylation of eukaryotic initiation factor 2 and partial resistance to encephalomyocarditis virus growth. J Virol 66, 5804-5814.
Migliazza, A., Martinotti, S., Chen, W., Fusco, C., Ye, B. H., Knowles, D. M., Offit, K., Chaganti, R. S., and Dalla-Favera, R. (1995). Frequent somatic hypermutation of the 5' noncoding region of the BCL6 gene in B-cell lymphoma. Proc Natl Acad Sci U S A 92, 12520-12524.
Mikovits, J., Ruscetti, F., Zhu, W., Bagni, R., Dorjsuren, D., and Shoemaker, R. (2001). Potential cellular signatures of viral infections in human hematopoietic cells. Dis Markers 77, 173-178.
Miles, S. A., Rezai, A. R., Salazar-Gonzalez, J. F., Vander Meyden, M., Stevens, R. H., Logan, D. M., Mitsuyasu, R. T., Taga, T., Hirano, T., Kishimoto, T., and et al. (1990). AIDS Kaposi sarcoma-derived cells produce and respond to interleukin 6. Proc Natl Acad Sci U S A 57, 4068-4072.
Miller, C. L., Lee, J. H., Kieff, E., and Longnecker, R. (1994). An integral membrane protein (LMP2) blocks reactivation of Epstein-Barr virus from latency following surface immunoglobulin crosslinking. Proc Natl Acad Sci U S A 97, 772-776.
Miller, G., Heston, L., Grogan, E., Gradoville, L., Rigsby, M., Sun, R., Shedd, D., Kushnaryov, V. M., Grossberg, S., and Chang, Y. (1997). Selective switch between latency and lytic replication of Kaposi's sarcoma herpesvirus and Epstein-Barr virus in dually infected body cavity lymphoma cells. J Virol 77, 314-324.
Miller, J. J. (1964). An autoradiographic study of plasma cell and lymphocyte survival in rat popliteal lymph nodes. J Immunol 92, 673-681.
Mittrucker, H. W., Matsuyama, T., Grossman, A., Kundig, T. M., Potter, J., Shahinian, A., Wakeham, A., Patterson, B., Ohashi, P. S., and Mak, T. W. (1997). Requirement for the transcription factor LSIRF/IRF4 for mature B and T lymphocyte function. Science 275, 540-543.
Mocroft, A., Youle, M., Gazzard, B., Morcinek, J., Halai, R., and Phillips, A. N. (1996). Anti-herpesvirus treatment and risk of Kaposi's sarcoma in HIV infection. Royal Free/Chelsea and Westminster Hospitals Collaborative Group. Aids 10, 1101-1105.
Molden, J., Chang, Y., You, Y., Moore, P. S., and Goldsmith, M. A. (1997). A Kaposi's sarcoma- associated herpesvirus-encoded cytokine homolog (vIL-6) activates signaling through the shared gpl30 receptor subunit. J Biol Chem 272, 19625-19631.
Monini, P., Carlini, F., Sturzl, M., Rimessi, P., Superti, F., Franco, M., Melucci-Vigo, G., Cafaro, A., Goletti, D., Sgadari, C., et a l (1999a). Alpha interferon inhibits human herpesvirus 8 (HHV-8) reactivation in primary effusion lymphoma cells and reduces HHV-8 load in cultured peripheral blood mononuclear cells. J Virol 73, 4029-4041.
302
Monini, P., Colombini, S., Sturzl, M., Goletti, D., Cafaro, A., Sgadari, C., Butto, S., Franco, M., Leone, P., Fais, S., et a l (1999b). Reactivation and persistence of human herpesvirus-8 infection in B cells and monocytes by Th-1 cytokines increased in Kaposi's sarcoma. Blood 93, 4044-4058.
Monini, P., de Lellis, L., Fabris, M., Rigolin, F., and Cassai, E. (1996). Kaposi's sarcoma-associated herpesvirus DNA sequences in prostate tissue and human semen. N Engl J Med 334, 1168-1172.
Montague, M. G., and Hutchison, C. A., 3rd (2000). Gene content phylogeny of herpesviruses. Proc Natl Acad Sci U S A 97, 5334-5339.
Montaner, S., Sodhi, A., Pece, S., Mesri, E. A., and Gutkind, J. S. (2001). The Kaposi's sarcoma-associated herpesvirus G protein-coupled receptor promotes endothelial cell survival through the activation of Akt/protein kinase B. Cancer Res 61, 2641-2648.
Moore, P. S., Boshoff, C., Weiss, R. A., and Chang, Y. (1996a). Molecular mimicry of human cytokine and cytokine response pathway genes by KSHV. Science 274, 1739-1744.
Moore, P. S., and Chang, Y. (1998). Antiviral activity of tumor-suppressor pathways: clues from molecular piracy by KSHV. Trends Genet 14, 144-150.
Moore, P. S., Gao, S. J., Dominguez, G., Cesarman, E., Lungu, O., Knowles, D. M., Garber, R., Pellett, P. E., McGeoch, D. J., and Chang, Y. (1996b). Primary characterization of a herpesvirus agent associated with Kaposi's sarcomae. J Virol 70, 549-558.
Moore, P. S., Kingsley, L. A., Holmberg, S. D., Spira, T., Gupta, P., Hoover, D. R., Parry, J. P., Conley, L. J., Jaffe, H. W., and Chang, Y. (1996c). Kaposi's sarcoma-associated herpesvirus infection prior to onset of Kaposi's sarcoma. Aids 10, 175-180.
Morgan, C., Rose, H. M., and Mednis, B. (1968). Electron microscopy of herpes simplex virus. I. Entry. J Virol 2, 507-516.
Morgan, R. W., Sofer, L., Anderson, A. S., Bemberg, E. L., Cui, J., and Burnside, J. (2001). Induction of host gene expression following infection of chicken embryo fibroblasts with oncogenic Marek's disease virus. J Virol 75, 533-539.
Mori, S., Murakami-Mori, K., Jewett, A., Nakamura, S., and Bonavida, B. (1996). Resistance of AIDS- associated Kaposi's sarcoma cells to Fas-mediated apoptosis. Cancer Res 56, 1874-1879.
Morrow, M. A., Mayer, E. W., Perez, C. A., Adlam, M., and Siu, G. (1999). Overexpression of the Helix- Loop-Helix protein Id2 blocks T cell development at multiple stages. Mol Immunol 36, 491-503.
Moses, A. V., Fish, K. N., Ruhl, R., Smith, P. P., Strussenberg, J. G., Zhu, L., Chandran, B., and Nelson, J.A. (1999). Long-term infection and transformation of dermal microvascular endothelial cells by human herpesvirus 8. J Virol 73, 6892-6902.
Moses, A. V., Jarvis, M. A., Raggo, C., Bell, Y. C., Ruhl, R., Luukkonen, B. G., Griffith, D. J., Wait, C.L., Druker, B. J., Heinrich, M. C., et a l (2002). Kaposi's sarcoma-associated herpesvirus-induced upregulation of the c-kit proto-oncogene, as identified by gene expression profiling, is essential for the transformation of endothelial cells. J Virol 76, 8383-8399.
Mosialos, G., Birkenbach, M., Yalamanchili, R., VanArsdale, T., Ware, C., and Kieff, E. (1995). The Epstein-Barr virus transforming protein LMPl engages signaling proteins for the tumor necrosis factor receptor family. Cell 80, 389-399.
Mossman, K. L., Macgregor, P. F., Rozmus, J. J., Goryachev, A. B., Edwards, A. M., and Smiley, J. R.(2001). Herpes simplex virus triggers and then disarms a host antiviral response. J Virol 75, 750-758.
Mullberg, J., Geib, T., Jostock, T., Hoischen, S. H., Vollmer, P., Voltz, N., Heinz, D., Galle, P. R., Klouche, M., and Rose-John, S. (2000). IL-6 receptor independent stimulation of human gpl30 by viral IL-6. J Immunol 164, 4672-4677.
Muller, K., Diamant, M., and Bendtzen, K. (1991). Inhibition of production and function of interleukin-6 by 1,25-dihydroxyvitamin D3. Immunol Lett 25, 115-120.
303

Munger, K., Wemess, B. A,, Dyson, N., Phelps, W. C., Harlow, E., and Howley, P. M. (1989). Complex formation of human papillomavirus E7 proteins with the retinoblastoma tumor suppressor gene product, Embo J 8, 4099-4105.
Munshi, N., Ganju, R. K., Avraham, S., Mesri, E. A., and Groopman, J. E. (1999). Kaposi's sarcoma- associated herpesvirus-encoded G protein-coupled receptor activation of c-jun amino-terminal kinase/stress-activated protein kinase and lyn kinase is mediated by related adhesion focal tyrosine kinase/proline-rich tyrosine kinase 2. J Biol Chem 274, 31863-31867.
Muralidhar, S., Pumfery, A. M., Hassani, M., Sadaie, M. R., Kishishita, M., Brady, J. N., Doniger, J., Medveczky, P., and Rosenthal, L. J. (1998). Identification of kaposin (open reading frame K12) as a human herpesvirus 8 (Kaposi's sarcoma-associated herpesvirus) transforming gene. J Virol 72, 4980-4988.
Nador, R. G., Cesarman, E., Chadbum, A., Dawson, D. B., Ansari, M. Q., Said, J., and Knowles, D. M. (1996). Primary effusion lymphoma: a distinct clinicopathologic entity associated with the Kaposi's sarcoma-associated herpes virus. Blood 88, 645-656.
Nagasawa, T., Hirota, S., Tachibana, K., Takakura, N., Nishikawa, S., Kitamura, Y., Yoshida, N.,Kikutani, H., and Kishimoto, T. (1996). Defects of B-cell lymphopoiesis and bone-marrow myelopoiesis in mice lacking the CXC chemokine PBSF/SDF-1. Nature 382, 635-638.
Nakagawa, T., and Yuan, J. (2000). Cross-talk between two cysteine protease families. Activation of caspase-12 by calpain in apoptosis. J Cell Biol 150, 887-894.
Nakamura, H., Li, M., Zarycki, J., and Jung, J. U. (2001). Inhibition of p53 tumor suppressor by viral interferon regulatory factor. J Virol 75, 7572-7582.
Nakamura, M., Okada, H., Sasaki, H., Yoshida, K., Kamada, M., Okada, N., Terada, M., and Ohno, T. (1996). Quantification of the CD55 and CD59, membrane inhibitors of complement on HIV-1 particles as a function of complement-mediated virolysis. Microbiol Immunol 40, 561-567.
Nakamura, S., Murakami-Mori, K., Rao, N., Weich, H. A., and Rajeev, B. (1997). Vascular endothelial growth factor is a potent angiogenic factor in AIDS-associated Kaposi's sarcoma-derived spindle cells. J Immunol 158, 4992-5001.
Nau, G. J., Richmond, J. F., Schlesinger, A., Jennings, E. G., Lander, E. S., and Young, R. A. (2002). Human macrophage activation programs induced by bacterial pathogens. Proc Natl Acad Sci U S A 99, 1503-1508.
Nazerian, K. (1974). DNA configuration in the core of Marek's disease virus. J Virol 13, 1148-1150.
Nealon, K., Newcomb, W. W., Pray, T. R., Craik, C. S., Brown, J. C., and Kedes, D. H. (2001). Lytic replication of Kaposi's sarcoma-associated herpesvirus results in the formation of multiple capsid species: isolation and molecular characterization of A, B, and C capsids from a gammaherpesvirus. J Virol 75, 2866-2878.
Nees, M., Geoghegan, J. M., Munson, P., Prabhu, V., Liu, Y., Androphy, E., and Woodworth, C. D.(2000). Human papillomavirus type 16 E6 and E7 proteins inhibit differentiation-dependent expression of transforming growth factor-beta2 in cervical kératinocytes. Cancer Res 60, 4289-4298.
Neipel, F., Albrecht, J. C., and Fleckenstein, B. (1997). Cell-homologous genes in the Kaposi's sarcoma- associated rhadinovirus human herpesvirus 8: determinants of its pathogenicity? J Virol 71, 4187-4192.
Nemazee, D., Russell, D., Arnold, B., Haemmerling, G., Allison, J., Miller, J. F., Morahan, G., and Buerki, K. (1991). Clonal deletion of autospecific B lymphocytes. Immunol Rev 122, 117-132.
Nemerow, G. R., Wolfert, R., McNaughton, M. E., and Cooper, N. R. (1985). Identification and characterization of the Epstein-Barr virus receptor on human B lymphocytes and its relationship to the C3d complement receptor (CR2). J Virol 55, 347-351.
Nicholas, J., Ruvolo, V., Zong, J., Ciufo, D., Guo, H. G., Reitz, M. S., and Hayward, G. S. (1997a). A single 13-kilobase divergent locus in the Kaposi sarcoma-associated herpesvirus (human herpesvirus 8)
304
genome contains nine open reading frames that are homologous to or related to cellular proteins. J Virol 77, 1963-1974.
Nicholas, J., Ruvolo, V. R., Bums, W. H., Sandford, G., Wan, X., Ciufo, D., Hendrickson, S. B., Guo, H.G., Hayward, G. S., and Reitz, M. S. (1997b). Kaposi's sarcoma-associated human herpesvirus-8 encodes homologues of macrophage inflammatory protein-1 and interleukin-6. Nat Med 3, 287-292.
Nicholas, J., Zong, J. C., Alcendor, D. J., Ciufo, D. M., Poole, L. J., Sarisky, R. T., Chiou, C. J., Zhang, X., Wan, X., Guo, H. G., et al. (1998). Novel organizational features, captured cellular genes, and strain variability within the genome of KSHV/HHV8. J Natl Cancer Inst Monogr 23, 79-88.
Nickoloff, B. J., and Griffiths, C. E. (1989). The spindle-shaped cells in cutaneous Kaposi's sarcoma. Histologic simulators include factor X llla dermal dendrocytes. Am J Pathol 135, 793-800.
Niedobitek, G., Deacon, E. M., Young, L. S., Herbst, H., Hamilton-Dutoit, S. J., and Pallesen, G. (1991a). Epstein-Barr virus gene expression in Hodgkin's disease. Blood 78, 1628-1630.
Niedobitek, G., Young, L. S., Lau, R., Brooks, L., Greenspan, D., Greenspan, J. S., and Rickinson, A. B. (1991b). Epstein-Barr vims infection in oral hairy leukoplakia: vims replication in the absence of a detectable latent phase. J Gen Virol 72 ( Pt 12), 3035-3046.
Nilsson, K., Klein, G., Henle, W., and Henle, G. (1971). The establishment of lymphoblastoid lines from adult and fetal human lymphoid tissue and its dependence on EBV. Int J Cancer 8, 443-450.
Niwa, M., Sidrauski, C., Kaufman, R. J., and Walter, P. (1999). A role for presenilin-1 in nuclear accumulation of Ire 1 fragments and induction of the mammalian unfolded protein response. Cell 99, 691- 702.
Nobuyoshi, M., Kawano, M., Tanaka, H., Ishikawa, H., Tanabe, O., Iwato, K., Asaoku, H., Sakai, A., and Kuramoto, A. (1991). Increased expression of the c-myc gene may be related to the aggressive transformation of human myeloma cells. Br J Haematol 77, 523-528.
Noelle, R. J., Ledbetter, J. A., and Amffo, A. (1992). CD40 and its ligand, an essential ligand-receptor pair for thymus-dependent B-cell activation. Immunol Today 13, 431-433.
Nokta, M. A., Hassan, M. I., Loesch, K., and Pollard, R. B. (1996). Human cytomegalovims-induced immunosuppression. Relationship to tumor necrosis factor-dependent release of arachidonic acid and prostaglandin E2 in human monocytes. J Clin Invest 97, 2635-2641.
Notterman, D. A., Alon, U., Sierk, A. J., and Levine, A. J. (2001). Transcriptional gene expression profiles of colorectal adenoma, adenocarcinoma, and normal tissue examined by oligonucleotide arrays. Cancer Res 67,3124-3130.
Nourse, J., Mellentin, J. D., Galili, N., Wilkinson, J., Stanbridge, E., Smith, S. D., and Cleary, M. L.(1990). Chromosomal translocation t(l;19) results in synthesis of a homeobox fusion mRNA that codes for a potential chimeric transcription factor. Cell 60, 535-545.
Nunez, G., London, L., Hockenbery, D., Alexander, M., McKeam, J. P., and Korsmeyer, S. J. (1990). Deregulated Bcl-2 gene expression selectively prolongs survival of growth factor-deprived hemopoietic cell lines. J Immunol 144, 3602-3610.
Nutt, S. L., Heavey, B., Rolink, A. G., and Busslinger, M. (1999). Commitment to the B-lymphoid lineage depends on the transcription factor Pax5. Nature 401, 556-562.
Nutt, S. L., Morrison, A. M., Dorfler, P., Rolink, A., and Busslinger, M. (1998). Identification of BSAP (Pax-5) target genes in early B-cell development by loss- and gain-of-function experiments. Embo J 77, 2319-2333.
Nutt, S. L., Urbanek, P., Rolink, A., and Busslinger, M. (1997). Essential functions of Pax5 (BSAP) in pro- B cell development: difference between fetal and adult B lymphopoiesis and reduced V-to-DJ recombination at the IgH locus. Genes Dev 77,476-491.
305
Oettinger, M. A., Schatz, D. G., Gorka, C., and Baltimore, D. (1990). RAG-1 and RAG-2, adjacent genes that synergistically activate V(D)J recombination. Science 248, 1517-1523.
O'Farrell, P. H. (1975). High resolution two-dimensional electrophoresis of proteins. J Biol Chem 250, 4007-4021.
Ohno, T., Stribley, J. A., Wu, G., Hinrichs, S. H., Weisenburger, D. D., and Chan, W. C. (1997). Clonality in nodular lymphocyte-predominant Hodgkin's disease. N Engl J Med 337, 459-465.
Ojala, P. M., Tiainen, M., Salven, P., Veikkola, T., Castanos-Velez, E., Sarid, R., Biberfeld, P., and Makela, T. P. (1999). Kaposi's sarcoma-associated herpesvirus-encoded v-cyclin triggers apoptosis in cells with high levels of cyclin-dependent kinase 6. Cancer Res 59, 4984-4989.
Ojala, P. M., Yamamoto, K., Castanos-Velez, E., Biberfeld, P., Korsmeyer, S. J., and Makela, T. P. (2000). The apoptotic v-cyclin-CDK6 complex phosphorylates and inactivates Bcl-2. Nat Cell Biol 2, 819-825.
Oka, K., Ohno, T., Kita, K., Yamaguchi, M., Takakura, N., Nishii, K., Miwa, H., and Shirakawa, S.(1994). PRADl gene over-expression in mantle-cell lymphoma but not in other low-grade B-cell lymphomas, including extranodal lymphoma. Br J Haematol 86, 786-791.
Okabe, H., Satoh, S., Kato, T., Kitahara, O., Yanagawa, R., Yamaoka, Y., Tsunoda, T., Furukawa, Y., and Nakamura, Y. (2001). Genome-wide analysis of gene expression in human hepatocellular carcinomas using cDNA microarray: identification of genes involved in viral carcinogenesis and tumor progression. Cancer Res 61, 2129-2137.
Okabe, M., Matsushima, S., Morioka, M., Kobayashi, M., Abe, S., Sakurada, K., Kakinuma, M., and Miyazaki, T. (1987). Establishment and characterization of a cell line, TOM-1, derived from a patient with Philadelphia chromosome-positive acute lymphocytic leukemia. Blood 69, 990-998.
Okamoto, T., Suzuki, T., and Yamamoto, N. (2000). Microarray fabrication with covalent attachment of DNA using bubble jet technology. Nat Biotechnol 18, 438-441.
Oksenhendler, E., Boulanger, E., Galicier, L., Du, M. Q., Dupin, N., Diss, T. C., Hamoudi, R., Daniel, M. T., Agbalika, F., Boshoff, C., et al. (2002). High incidence of Kaposi sarcoma-associated herpesvirus- related non-Hodgkin lymphoma in patients with HIV infection and multicentric Castleman disease. Blood 99, 2331-2336.
Oliver, A. M., Martin, F., and Keamey, J. F. (1999). IgMhighCD21 high lymphocytes enriched in the splenic marginal zone generate effector cells more rapidly than the bulk of follicular B cells. J Immunol 162, 7198-7207.
Olsen, S. J., Chang, Y., Moore, P. S., Biggar, R. J., and Melbye, M. (1998). Increasing Kaposi's sarcoma- associated herpesvirus seroprevalence with age in a highly Kaposi's sarcoma endemic region, Zambia in 1985. Aids 12, 1921-1925.
O'Neill, E., Douglas, J. L., Chien, M. L., and Garcia, J. V. (1997). Open reading frame 26 of human herpesvirus 8 encodes a tetradecanoyl phorbol acetate- and butyrate-inducible 32-kilodalton protein expressed in a body cavity-based lymphoma cell line. J Virol 71, 4791-4797.
O'Riordan, M., and Grosschedl, R. (1999). Coordinate regulation of B cell differentiation by the transcription factors EBF and E2A. Immunity 77, 21-31.
Oscier, D. G., Thompsett, A., Zhu, D., and Stevenson, F. K. (1997). Differential rates of somatic hypermutation in V(H) genes among subsets of chronic lymphocytic leukemia defined by chromosomal abnormalities. Blood 59, 4153-4160.
Otsuki, T., Kumar, S., Ensoli, B., Kingma, D. W., Yano, T., Stetler-Stevenson, M., Jaffe, E. S., and Raffeld, M. (1996). Detection of HHV-8/KSHV DNA sequences in AIDS-associated extranodal lymphoid malignancies. Leukemia 10, 1358-1362.
Page, R. D. M. (1996). TREEVIEW: An application to display phylogenetic trees on personal computers. Comput Appl Biosci 72, 357-358.
306
Pahl, H. L. (1999). Signal transduction from the endoplasmic reticulum to the cell nucleus. Physiol Rev 79, 683-701.
Pallesen, G., Hamilton-Dutoit, S. J., Rowe, M., and Young, L. S. (1991). Expression of Epstein-Barr virus latent gene products in tumour cells of Hodgkin's disease. Lancet 337, 320-322.
Palmiter, R. D. (1998). The elusive function of metallothioneins. Proc Natl Acad Sci U S A 95, 8428-8430.
Papavasiliou, P., Casellas, R., Suh, H., Qin, X. P., Besmer, E., Pelanda, R., Nemazee, D., Rajewsky, K., and Nussenzweig, M. C. (1997). V(D)J recombination in mature B cells: a mechanism for altering antibody responses. Science 278, 298-301.
Parravicini, C., Chandran, B., Corbellino, M., Berti, E., Paulli, M., Moore, P. S., and Chang, Y. (2000). Differential viral protein expression in Kaposi's sarcoma-associated herpesvirus-infected diseases: Kaposi's sarcoma, primary effusion lymphoma, and multicentric Castleman's disease. Am J Pathol 156, 743-749.
Parravinci, C., Corbellino, M., Paulli, M., Magrini, U., Lazzarino, M., Moore, P. S., and Chang, Y. (1997). Expression of a virus-derived cytokine, KSHV vIL-6, in HIV-seronegative Castleman's disease. Am J Pathol 151, 1517-1522.
Pascual, V., Liu, Y. J., Magalski, A., de Bouteiller, O., Banchereau, J., and Capra, J. D. (1994). Analysis of somatic mutation in five B cell subsets of human tonsil. J Exp Med 180, 329-339.
Pasqualucci, L., Migliazza, A., Pracchiolla, N., William, C., Neri, A., Baldini, L., Chaganti, R. S., Klein, U., Kuppers, R., Rajewsky, K., and Dalla-Pavera, R. (1998). BCL-6 mutations in normal germinal center B cells: evidence of somatic hypermutation acting outside Ig loci. Proc Natl Acad Sci U S A 95, 11816- 11821.
Pasqualucci, L., Neumeister, P., Goossens, T., Nanjangud, G., Chaganti, R. S., Kuppers, R., and Dalla- Favera, R. (2001). Hypermutation of multiple proto-oncogenes in B-cell diffuse large-cell lymphomas. Nature 412, 341-346.
Pastore, C., Gloghini, A., Volpe, G., Nomdedeu, J., Leonardo, E., Mazza, U., Saglio, G., Carbone, A., and Gaidano, G. (1995). Distribution of Kaposi's sarcoma herpesvirus sequences among lymphoid malignancies in Italy and Spain. Br J Haematol 91, 918-920.
Pati, S., Cavrois, M., Guo, H. G., Foulke, J. S., Jr., Kim, J., Feldman, R. A., and Reitz, M. (2001). Activation of NF-kappaB by the human herpesvirus 8 chemokine receptor ORF74: evidence for a paracrine model of Kaposi's sarcoma pathogenesis. J Virol 75, 8660-8673.
Paulose-Murphy, M., Ha, N. K., Xiang, C., Chen, Y., Gillim, L., Yarchoan, R., Meltzer, P., Bittner, M., Trent, J., and Zeichner, S. (2001). Transcription program of human herpesvirus 8 (kaposi's sarcoma- associated herpesvirus). J Virol 75, 4843-4853.
Pease, A. C., Solas, D., Sullivan, E. J., Cronin, M. T., Holmes, C. P., and Fodor, S. P. (1994). Lightgenerated oligonucleotide arrays for rapid DNA sequence analysis. Proc Natl Acad Sci U S A 97, 5022- 5026.
Peifer, M., and Wieschaus, E. (1990). Mutations in the Drosophila gene extradenticle affect the way specific homeo domain proteins regulate segmental identity. Genes Dev 4, 1209-1223.
Pellett, P. E., Spira, T. J., Bagasra, O., Boshoff, C., Corey, L., de Lellis, L., Huang, M. L., Lin, J. C., Matthews, S., Monini, P., et al. (1999). Multicenter comparison of PCR assays for detection of human herpesvirus 8 DNA in semen. J Clin Microbiol 37, 1298-1301.
Perera, S. M., Thomas, J. A., Burke, M., and Crawford, D. H. (1998). Analysis of the T-cell microenvironment in Epstein-Barr virus-related post-transplantation B lymphoproliferative disease. J Pathol 184, 177-184.
Pérou, C. M., Jeffrey, S. S., van de Rijn, M., Rees, C. A., Eisen, M. B., Ross, D. T., Pergamenschikov, A., Williams, C. F., Zhu, S. X., Lee, J. C., et a l (1999). Distinctive gene expression patterns in human mammary epithelial cells and breast cancers. Proc Natl Acad Sci U S A 96, 9212-9217.
307
Pérou, C. M., Sorlie, T., Eisen, M. B., van de Rijn, M., Jeffrey, S. S., Rees, C. A., Pollack, J. R., Ross, D. T., Johnsen, H., Akslen, L. A., et al. (2000). Molecular portraits of human breast tumours. Nature 406, 747-752.
Perry, C., Eldor, A., and Soreq, H. (2002). Runxl/AMLl in leukemia: disrupted association with diverse protein partners. Leuk Res 26, 221-228.
Peterson, B. A., and Frizzera, G. (1993). Multicentric Castleman's disease. Semin Oncol 20, 636-647.
Pettitt, A. R., Zuzel, M., and Cawley, J. C. (1999). Hairy-cell leukaemia: biology and management. Br J Haematol 106, 2-8.
Pietiainen, V., Huttunen, P., and Hyypia, T. (2000). Effects of echovirus 1 infection on cellular gene expression. Virology 276, 243-250.
Piskurich, J. P., Lin, K. I., Lin, Y., Wang, Y., Ting, J. P., and Calame, K. (2000). BLIMP-I mediates extinction of major histocompatibility class II transactivator expression in plasma cells. Nat Immunol 1, 526-532.
Plancoulaine, S., Abel, L., van Beveren, M., Tregouet, D. A., Joubert, M., Tortevoye, P., de The, C., and Cessain, A. (2000). Human herpesvirus 8 transmission from mother to child and between siblings in an endemic population. Lancet 356, 1062-1065.
Platt, C. M., Cannell, E., Cuomo, M. E., Singh, S., and Mittnacht, S. (2000). Detection of the human herpesvirus 8-encoded cyclin protein in primary effusion lymphoma-derived cell lines. Virology 272, 257- 266.
Platt, C. M., Simpson, C. R., Mittnacht, S., and Schulz, T. P. (1999). Latent nuclear antigen of Kaposi's sarcoma-associated herpesvirus interacts with RINC3, a homolog of the Drosophila female sterile homeotic (fsh) gene. J Virol 73, 9789-9795.
Poggioli, C. J., DeBiasi, R. L., Bickel, R., Jotte, R., Spalding, A., Johnson, C. L., and Tyler, K. L. (2002). Reovirus-induced alterations in gene expression related to cell cycle regulation. J Virol 76, 2585-2594.
Polack, A., Hortnagel, K., Pajic, A., Christoph, B., Baier, B., Palk, M., Mautner, J., Celtinger, C., Bomkamm, C. W., and Kempkes, B. (1996). c-myc activation renders proliferation of Epstein-Barr virus (EBV)-transformed cells independent of EBV nuclear antigen 2 and latent membrane protein 1. Proc Natl Acad Sci U S A 93, 10411-10416.
Poison, A. C., Wang, D., DeRisi, J., and Canem, D. (2002). Modulation of host gene expression by the constitutively active C protein-coupled receptor of Kaposi's sarcoma-associated herpesvirus. Cancer Res 62, 4525-4530.
Pomeroy, S. L., Tamayo, P., Caasenbeek, M., Sturla, L. M., Angelo, M., McLaughlin, M. E., Kim, J. Y., Coumnerova, L. C., Black, P. M., Lau, C., et al. (2002). Prediction of central nervous system embryonal tumour outcome based on gene expression. Nature 415, 436-442.
Poole, L. J., Yu, Y., Kim, P. S., Zheng, Q, Z., Pevsner, J., and Hayward, C. S. (2002). Altered patterns of cellular gene expression in dermal microvascular endothelial cells infected with Kaposi's sarcoma- associated herpesvirus. J Virol 76, 3395-3420.
Poole, L. J., Zong, J. C., Ciufo, D. M., Alcendor, D. J., Cannon, J. S., Ambinder, R., Orenstein, J. M., Reitz, M. S., and Hayward, C. S. (1999). Comparison of genetic variability at multiple loci across the genomes of the major subtypes of Kaposi's sarcoma-associated herpesvirus reveals evidence for recombination and for two distinct types of open reading frame K15 alleles at the right-hand end. J Virol 73, 6646-6660.
Pope, J. H. (1967). Establishment of cell lines from peripheral leucocytes in infectious mononucleosis. Nature 216, 810-811.
Pope, J. H., Home, M. K., and Scott, W. (1968). Transformation of foetal human Leukocytes in vitro by filtrates of a human leukaemic cell line containing herpes-like virus. Int J Cancer 3, 857-866.
308
Post, L. E., Mackem, S., and Roizman, B. (1981). Regulation of alpha genes of herpes simplex virus: expression of chimeric genes produced by fusion of thymidine kinase with alpha gene promoters. Cell 24, 555-565.
Potter, V. R. (1978). Phenotypic diversity in experimental hepatomas: the concept of partially blocked ontogeny. The 10th Walter Hubert Lecture. Br J Cancer 38, 1-23.
Prak, E. L., and Weigert, M. (1995). Light chain replacement: a new model for antibody gene rearrangement. J Exp Med 182, 541-548.
Prakash, O., Tang, Z. Y., Peng, X., Coleman, R., Gill, J., Farr, G., and Samaniego, F. (2002). Tumorigenesis and aberrant signaling in transgenic mice expressing the human herpesvirus-8 K1 gene. J Natl Cancer Inst 94, 926-935.
Prakash, O., and Yunis, J. J. (1984). High resolution chromosomes of the t(9;22) positive leukemias. Cancer Genet Cytogenet 11, 361-367.
Pulendran, B., van Driel, R., and Nossal, G. J. (1997). Immunological tolerance in germinal centres. Immunol Today 18, 27-32.
Puls, A., Eliopoulos, A. G., Nobes, C. D., Bridges, T., Young, L. S., and Hall, A. (1999). Activation of the small GTPase Cdc42 by the inflammatory cytokines TNF(alpha) and IL-1, and by the Epstein-Barr virus transforming protein LMPL J Cell Sci 112 ( Pt 17), 2983-2992.
Pulvertaft, R. J. V. (1964). Cytology of Burkitt's tumor (African lymphoma). Lancet 7, 238-240.
Purtilo, D. T., Cassel, C. K., Yang, J. P., and Harper, R. (1975). X-linked recessive progressive combined variable immunodeficiency (Duncan's disease). Lancet 7, 935-940.
Puthier, D., Bataille, R., Barille, S., Mellerin, M. P., Harousseau, J. L., Ponzio, A., Robillard, N.,Wijdenes, J., and Amiot, M. (1996). Myeloma cell growth arrest, apoptosis, and interleukin-6 receptor modulation induced by EB1089, a vitamin D3 derivative, alone or in association with dexamethasone. Blood 88, 4659-4666.
Puthier, D., Derenne, S., Barille, S., Moreau, P., Harousseau, J. L., Bataille, R., and Amiot, M. (1999). Mcl-l and Bcl-xL are co-regulated by IL-6 in human myeloma cells. Br J Haematol 107, 392-395.
Qu, L., and Rowe, D. T. (1992). Epstein-Barr virus latent gene expression in uncultured peripheral blood lymphocytes. J Virol 66, 3715-3724.
Quackenbush, J. (2001). Computational analysis of microarray data. Nat Rev Genet 2, 418-427.
Quignon, F., De Bels, F., Koken, M., Feunteun, J., Ameisen, J. C., and de The, H. (1998). PML induces a novel caspase-independent death process. Nat Genet 20, 259-265.
Raab, M. S., Albrecht, J. C., Birkmann, A., Yaguboglu, S., Lang, D., Fleckenstein, B., and Neipel, F.(1998). The immunogenic glycoprotein gp35-37 of human herpesvirus 8 is encoded by open reading frame K8.1.J Virol 72, 6725-6731.
Rabbitts, T. H. (1978). Evidence for splicing of interrupted immunoglobulin variable and constant region sequences in nuclear RNA. Nature 275, 291-296.
Rabkin, C. S., Bedi, G., Musaba, E., Sunkutu, R., Mwansa, N., Sidransky, D., and Biggar, R. J. (1995). AIDS-related Kaposi's sarcoma is a clonal neoplasm. Clin Cancer Res 7, 257-260.
Radkov, S. A., Kellam, P., and Boshoff, C. (2000). The latent nuclear antigen of Kaposi sarcoma- associated herpesvirus targets the retinoblastoma-E2F pathway and with the oncogene Hras transforms primary rat cells. Nat Med 6, 1121-1127.
Rainbow, L., Platt, G. M., Simpson, G. R., Sarid, R., Gao, S. J., Stoiber, H., Herrington, C. S., Moore, P.S., and Schulz, T. F. (1997). The 222- to 234-kilodalton latent nuclear protein (LNA) of Kaposi's sarcoma- associated herpesvirus (human herpesvirus 8) is encoded by orf73 and is a component of the latency- associated nuclear antigen. J Virol 77, 5915-5921.
309
Ramaswamy, S., Tamayo, P., Rifkin, R,, Mukherjee, S., Yeang, C. H., Angelo, M., Ladd, C., Reich, M., Latulippe, E., Mesirov, J. P., et a l (2001). Multiclass cancer diagnosis using tumor gene expression signatures. Proc Natl Acad Sci U S A 98, 15149-15154.
Randall, T. D., Heath, A. W., Santos-Argumedo, L., Howard, M. C., Weissman, I. L., and Lund, F. E.(1998). Arrest of B lymphocyte terminal differentiation by CD40 signaling: mechanism for lack of antibody-secreting cells in germinal centers. Immunity 8, 733-742.
Raphael, M., Gentilhomme, O., Tulliez, M., Byron, P. A., and Diebold, J. (1991). Histopathologic features of high-grade non-Hodgkin's lymphomas in acquired immunodeficiency syndrome. The French Study Group of Pathology for Human Immunodeficiency Virus-Associated Tumors. Arch Pathol Lab Med 115, 15-20.
Rathod, P. K., Ganesan, K., Hayward, R. E., Bozdech, Z., and DeRisi, J. L. (2002). DNA microarrays for malaria. Trends Parasitol 18, 39-45.
Raychaudhuri, S., Stuart, J. M., and Altman, R. B. (2000). Principal components analysis to summarize microarray experiments: application to sporulation time series. Pac Symp Biocomput 2000, 455-466.
Reed, J. A., Nador, R. G., Spaulding, D., Tani, Y., Cesarman, E., and Knowles, D. M. (1998). Demonstration of Kaposi's sarcoma-associated herpes virus cyclin D homolog in cutaneous Kaposi's sarcoma by colorimetric in situ hybridization using a catalyzed signal amplification system. Blood 91, 3825-3832.
Reif, K., Ekland, E. H., Ohl, L., Nakano, H., Lipp, M., Forster, R., and Cyster, J. G. (2002). Balanced responsiveness to chemoattractants from adjacent zones determines B-cell position. Nature 416, 94-99.
Reimold, A. M., Iwakoshi, N. N., Manis, J., Vallabhajosyula, P., Szomolanyi-Tsuda, E., Gravallese, E. M., Friend, D., Grusby, M. J., Alt, F., and Glimcher, L. H. (2001). Plasma cell differentiation requires the transcription factor XBP-1. Nature 412, 300-307.
Reljic, R., Wagner, S. D., Peakman, L. J., and Fearon, D. T. (2000). Suppression of signal transducer and activator of transcription 3-dependent B lymphocyte terminal differentiation by BCL-6. J Exp Med 192, 1841-1848.
Ren, B., Robert, F., Wyrick, J. J., Aparicio, O., Jennings, E. G., Simon, I., Zeitlinger, J., Schreiber, J., Hannett, N., Kanin, E., e ta l (2000). Genome-wide location and function of DNA binding proteins. Science 290, 2306-2309.
Renne, R., Barry, C., Dittmer, D., Compitello, N., Brown, P. O., and Ganem, D. (2001). Modulation of cellular and viral gene expression by the latency-associated nuclear antigen of Kaposi's sarcoma-associated herpesvirus. J Virol 75, 458-468.
Renne, R., Blackboum, D., Whitby, D., Levy, J., and Ganem, D. (1998). Limited transmission of Kaposi's sarcoma-associated herpesvirus in cultured cells. J Virol 72, 5182-5188.
Renne, R., Lagunoff, M., Zhong, W., and Ganem, D. (1996a). The size and conformation of Kaposi's sarcoma-associated herpesvirus (human herpesvirus 8) DNA in infected cells and virions. J Virol 70, 8151- 8154.
Renne, R., Zhong, W., Hemdier, B., McGrath, M., Abbey, N., Kedes, D., and Ganem, D. (1996b). Lytic growth of Kaposi's sarcoma-associated herpesvirus (human herpesvirus 8) in culture. Nat Med 2, 342-346.
Rezza, G., Tchangmena, O. B., Andreoni, M., Bugarini, R., Toma, L., Bakary, D. K., Glikoutou, M., Sarmati, L., Monini, P., Pezzotti, P., and Ensoli, B. (2000). Prevalence and risk factors for human herpesvirus 8 infection in northern Cameroon. Sex Transm Dis 27, 159-164.
Rickinson, A. B., and Kieff, E. (2001). Epstein-Barr Virus. In Fields' Virology, D. K. Knipe, and P. M. Howley, eds. (Philadelphia, Lippincott Williams & Wilkins), pp. 2575-2628.
310

Rimessi, P., Bonaccorsi, A., Sturzl, M., Fabris, M., Brocca-Cofano, E., Caputo, A., Melucci-Vigo, G., Falchi, M., Cafaro, A., Cassai, E., et al. (2001). Transcription pattern of human herpesvirus 8 open reading frame K3 in primary effusion lymphoma and Kaposi's sarcoma. J Virol 75, 7161-7174.
Rimokh, R., Berger, F., Bastard, C., Klein, B., French, M., Archimbaud, E., Rouault, J. P., Santa Lucia, B., Duret, L., Vuillaume, M., and et al. (1994). Rearrangement of CCNDl (BCL 1/PRADl) 3' untranslated region in mantle-cell lymphomas and t(l lql3)-associated leukemias. Blood 83, 3689-3696.
Rivas, C., Thlick, A. E., Parravicini, C., Moore, P. S., and Chang, Y. (2001). Kaposi's sarcoma-associated herpesvirus LANA2 is a B-cell-specific latent viral protein that inhibits p53. J Virol 75, 429-438.
Roberts, S. G., Blute, M. L., Bergstralh, E. J., Slezak, J. M., and Zincke, H. (2001a). PSA doubling time as a predictor of clinical progression after biochemical failure following radical prostatectomy for prostate cancer. Mayo Clin Proc 76, 576-581.
Roberts, W. W., Bergstralh, E. J., Blute, M. L., Slezak, J. M., Carducci, M., Han, M., Epstein, J. I., Eisenberger, M. A., Walsh, P. C., and Partin, A. W. (2001b). Contemporary identification of patients at high risk of early prostate cancer recurrence after radical retropubic prostatectomy. Urology 57, 1033- 1037.
Robertson, E. S., Grossman, S., Johannsen, E., Miller, C., Lin, J., Tomkinson, B., and Kieff, E. (1995). Epstein-Barr virus nuclear protein 3C modulates transcription through interaction with the sequence- specific DNA-binding protein J kappa. J Virol 69, 3108-3116.
Robertson, E. S., Tomkinson, B., and Kieff, E. (1994). An Epstein-Barr virus with a 58-kilobase-pair deletion that includes BARFO transforms B lymphocytes in vitro. J Virol 68, 1449-1458.
Roizman, B., and Furlong, D. (1974). The replication of herpesviruses. In Comprehensive Virology, H. Fraenkel-Contrat, and R. R. Wagner eds. (New York, Plenum Press), pp. 229-403.
Roizman, B., Kozak, M., Honess, R. W., and Hayward, G. (1975). Regulation of herpesvirus macromolecular synthesis: evidence for multilevel regulation of herpes simplex 1 RNA and protein synthesis. Cold Spring Harb Symp Quant Biol 39 Pt 2, 687-701.
Roizman, B., and Pellett, P. E. (2001). The family Herpesviridae; A Brief Introduction. In Fields' Virology, D. K. Knipe, and P. M. Howley, eds. (Philadelphia, Lippincott-Raven Publishers), pp. 2381-2397.
Roizman, R., and Knipe, D. K. (2001). Herpes simplex viruses and their replication. In Fields' Virology, D. K. Knipe, and P. M. Howley, eds. (Philadelphia, Lippincott-Raven Publishers), pp. 2399-2460.
Romana, S. P., Poirel, H., Leconiat, M., Flexor, M. A., Mauchauffe, M., Jonveaux, P., MacIntyre, E. A., Berger, R., and Bernard, O. A. (1995). High frequency of t(12;21) in childhood B-lineage acute lymphoblastic leukemia. Blood 86, 4263-4269.
Rooney, C., Howe, J. G., Speck, S. H., and Miller, G. (1989). Influence of Burkitt's lymphoma and primary B cells on latent gene expression by the nonimmortalizing P3J-HR-1 strain of Epstein-Barr virus.J Virol 65, 1531-1539.
Rose, T. M., Strand, K. B., Schultz, E. R., Schaefer, G., Rankin, G. W., Jr., Thouless, M. E., Tsai, C. C., and Bosch, M. L. (1997). Identification of two homologs of the Kaposi's sarcoma-associated herpesvirus (human herpesvirus 8) in retroperitoneal fibromatosis of different macaque species. J Virol 71, 4138-4144.
Rosenberger, C. M., Scott, M. G., Gold, M. R., Hancock, R. E., and Finlay, B. B. (2000). Salmonella typhimurium infection and lipopolysaccharide stimulation induce similar changes in macrophage gene expression. J Immunol 164, 5894-5904.
Rosenfeld, C., Goutner, A., Choquet, C., Venuat, A. M., Kayibanda, B., Pico, J. L., and Greaves, M. F. (1977). Phenotypic characterisation of a unique non-T, non-B acute lymphoblastic leukaemia cell line. Nature 267, 841-843.
Rosenwald, A., Alizadeh, A. A., Widhopf, G., Simon, R., Davis, R. E., Yu, X., Yang, L., Pickeral, O. K., Rassenti, L. Z., Powell, J., et al. (2001). Relation of gene expression phenotype to immunoglobulin mutation genotype in B cell chronic lymphocytic leukemia. J Exp Med 194, 1639-1647.
311
Ross, D. T., Scherf, U., Eisen, M. B., Pérou, C. M., Rees, C., Spellman, P., lyer, V., Jeffrey, S. S., Van de Rijn, M., Waltham, M., et al. (2000). Systematic variation in gene expression patterns in human cancer cell lines. Nat Genet 24, 227-235.
Roy, B., and Lee, A. S. (1999). The mammalian endoplasmic reticulum stress response element ctonsists of an evolutionarily conserved tripartite structure and interacts with a novel stress-inducible complex. Nucleic Acids Res 27, 1437-1443.
Russell, D. M., Dembic, Z., Morahan, G., Miller, J. F., Burki, K., and Nemazee, D. (1991). Peripheral deletion of self-reactive B cells. Nature 354, 308-311.
Russo, J. J., Bohenzky, R. A., Chien, M. C., Chen, J., Yan, M., Maddalena, D., Parry, J. P., Peruzzi, D., Edelman, I. S., Chang, Y., and Moore, P. S. (1996). Nucleotide sequence of the Kaposi sarcoma-associated herpesvirus (HHV8). Proc Natl Acad Sci U S A 93, 14862-14867.
Sadler, R., Wu, L., Forghani, B., Renne, R., Zhong, W., Hemdier, B., and Ganem, D. (1999). A complex translational program generates multiple novel proteins from the latently expressed kaposin (K12) locus of Kaposi's sarcoma-associated herpesvims. J Virol 73, 5722-5730.
Said, J. W., Tasaka, T., Takeuchi, S., Asou, H., de Vos, S., Cesarman, E., Knowles, D. M., and Koeffler,H. P. (1996). Primary effusion lymphoma in women: report of two cases of Kaposi's sarcoma herpes virus- associated effusion-based lymphoma in human immunodeficiency vims-negative women. Blood 88, 3124- 3128.
Saifuddin, M., Parker, C. J., Peeples, M. E., Gomy, M. K., Zolla-Pazner, S., Ghassemi, M., Rooney, I. A., Atkinson, J. P., and Spear, G. T. (1995). Role of virion-associated glycosylphosphatidylinositol-linked proteins CD55 and CD59 in complement resistance of cell line-derived and primary isolates of HIV-1. J Exp Med 182, 501-509.
Sakurada, S., Katano, H., Sata, T., Ohkuni, H., Watanabe, T., and Mori, S. (2001). Effective human herpesvims 8 infection of human umbilical vein endothelial cells by cell-mediated transmission. J Virol 75, 7717-7722.
Salahuddin, S. Z., Nakamura, S., Biberfeld, P., Kaplan, M. H., Markham, P. D., Larsson, L., and Gallo, R. C. (1988). Angiogenic properties of Kaposi's sarcoma-derived cells after long-term culture in vitro.Science 242, 430-433.
Salcedo, R., Young, H. A., Ponce, M. L., Ward, J. M., Kleinman, H. K., Murphy, W. J., and Oppenheim, J. J. (2001). Eotaxin (CCLll) induces in vivo angiogenic responses by human CCR3+ endothelial cells. J Immunol 166, 7571-7578.
Saltman, D., Bansal, N. S., Ross, F. M., Ross, J. A., Tumer, G., and Guy, K. (1990). Establishment of a karyotypically normal B-chronic lymphocytic leukemia cell line; evidence of leukemic origin by immunoglobulin gene rearrangement. Leuk Res 14, 381-387.
Samaniego, F., Pati, S., Karp, J., Prakash, O., and Bose, D. (2001). Human herpesvims 8 kl-associated nuclear factor-kappa b-dependent promoter activity: role in kaposi's sarcoma inflammation? J Natl Cancer Inst Monogr 25, 15-23.
Sample, J., Lancz, G., and Nonoyama, M. (1986). Mapping of genes in BamHI fragment M of Epstein- Barr vims DNA that may determine the fate of viral infection. J Virol 57, 145-154.
Samuel, C. E. (2001). Antiviral actions of interferons. Clin Microbiol Rev 14, 778-809, table of contents.
Sanderson, R. D., Lalor, P., and Bemfield, M. (1989). B lymphocytes express and lose syndecan at specific stages of differentiation. Cell Regul 1, 27-35.
Sandri-Goldin, R. M. (1998). ICP27 mediates HSV RNA export by shuttling through a leucine-rich nuclear export signal and binding viral intronless RNAs through an RGG motif. Genes Dev 12, 868-879.
312
Sanger, F., Air, G. M., Barrell, B. G., Brown, N. L., Coulson, A. R., Fiddes, C. A., Hutchison, C. A., Slocombe, P. M., and Smith, M. (1977a). Nucliotide sequence of bacteriophage phi X174 DNA. Nature 265, 687-695.
Sanger, F., Nicklen, S., and Coulson, A. R. (1977b). DNA sequencing with chain-terminating inhibitors. Proc Natl Acad Sci U S A 74, 5463-5467.
Sarid, R., Flore, O., Bohenzky, R. A., Chang, Y., and Moore, P. S. (1998). Transcription mapping of the Kaposi's sarcoma-associated herpesvirus (human herpesvirus 8) genome in a body cavity-based lymphoma cell line (BC-1). J Virol 72, 1005-1012.
Sarid, R., Sato, T., Bohenzky, R. A., Russo, J. J., and Chang, Y. (1997). Kaposi's sarcoma-associated herpesvirus encodes a functional bcl-2 homologue. Nat Med 3, 293-298.
Sarid, R., Wiezorek, J. S., Moore, P. S., and Chang, Y. (1999). Characterization and cell cycle regulation of the major Kaposi's sarcoma-associated herpesvirus (human herpesvirus 8) latent genes and their promoter. J Virol 73, 1438-1446.
Sato, N., Urano, F., Yoon Leem, J., Kim, S. H., Li, M., Donoviel, D., Bernstein, A., Lee, A. S., Ron, D., Veselits, M. L., et al. (2000). Upregulation of BiP and CHOP by the unfolded-protein response is independent of presenilin expression. Nat Cell Biol 2, 863-870.
Sato, S., Ouellet, N., Pelletier, I., Simard, M., Rancourt, A., and Bergeron, M. G. (2002). Role of galectin- 3 as an adhesion molecule for neutrophil extravasation during streptococcal pneumonia. J Immunol 168, 1813-1822.
Sawyers, C. L., McLaughlin, J., and Witte, O. N. (1995). Genetic requirement for Ras in the transformation of fibroblasts and hematopoietic cells by the Bcr-Abl oncogene. J Exp Med 181, 307-313.
Schaadt, M., Fonatsch, C., Kirchner, H., and Diehl, V. (1979). Establishment of a malignant, Epstein-Barr- virus (EBV)-negative cell-line from the pleura effusion of a patient with Hodgkin's disease. Blut 38, 185- 190.
Schebesta, M., Heavey, B., and Busslinger, M. (2002). Transcriptional control of B-cell development. Curr Opin Immunol 14, 216-223.
Schena, M., Shalon, D., Davis, R. W., and Brown, P. O. (1995). Quantitative monitoring of gene expression patterns with a complementary DNA microarray. Science 270, 467-470.
Schena, M., Shalon, D., Heller, R., Chai, A., Brown, P. O., and Davis, R. W. (1996). Parallel human genome analysis: microarray-based expression monitoring of 1000 genes. Proc Natl Acad Sci U S A 93, 10614-10619.
Scherf, U., Ross, D. T., Waltham, M., Smith, L. H., Lee, J. K., Tanabe, L., Kohn, K. W., Reinhold, W. C., Myers, T. G., Andrews, D. T., et al. (2000). A gene expression database for the molecular pharmacology of cancer. Nat Genet 24, 236-244.
Schittek, B., and Rajewsky, K. (1990). Maintenance of B-cell memory by long-lived cells generated from proliferating precursors. Nature 346, 749-751.
Schliephake, D. E., and Schimpl, A. (1996). Blimp-1 overcomes the block in IgM secretion in lipopolysaccharide/anti-mu F(ab')2-co-stimulated B lymphocytes. Eur J Immunol 26, 268-271.
Schroeder, H. W., Jr., and Dighiero, G. (1994). The pathogenesis of chronic lymphocytic leukemia: analysis of the antibody repertoire. Immunol Today 15, 288-294.
Schulz, T. F. (1998). Kaposi's sarcoma-associated herpesvirus (human herpesvirus-8). J Gen Virol 79, 1573-1591.
Schulz, T. F. (2000). KSHV (HHV8) infection. J Infect 41, 125-129.
313
Schwam, D. R., Luciano, R. L., Mahajan, S. S., Wong, L., and Wilson, A, C. (2000). Carboxy terminus of human herpesvirus 8 latency-associated nuclear antigen mediates dimerization, transcriptional repression, and targeting to nuclear bodies. J Virol 74, 8532-8540.
Schwarz, M., and Murphy, P. M. (2001). Kaposi's sarcoma-associated herpesvirus G protein-coupled receptor constitutively activates NF-kappa B and induces proinflammatory cytokine and chemokine production via a C-terminal signaling determinant. J Immunol 167, 505-513.
Sciacca, P. L., Sturzl, M., Bussolino, P., Sironi, M., Brandstetter, H., Zietz, C., Zhou, D., Matteucci, C., Peri, G., Sozzani, S., and et al. (1994). Expression of adhesion molecules, platelet-activating factor, and chemokines by Kaposi's sarcoma cells. J Inununol 153, 4816-4825.
Seaman, W. T., Ye, D., Wang, R. X., Hale, E. E., Weisse, M., and Quinlivan, E. B. (1999). Gene expression from the ORP50/K8 region of Kaposi's sarcoma-associated herpesvirus. Virology 263, 436- 449.
Semmes, O. J., Chen, L., Sarisky, R. T., Gao, Z., Zhong, L., and Hayward, S. D. (1998). Mta has properties of an RNA export protein and increases cytoplasmic accumulation of Epstein-Barr virus replication gene mRNA. J Virol 72, 9526-9534.
Seo, T., Lee, D., Lee, B., Chung, J. H., and Choe, J. (2000). Viral Interferon Regulatory Factor 1 of Kaposi's Sarcoma-Associated Herpesvirus (Human Herpesvirus 8) Binds to, and Inhibits Transactivation of, CREB-Binding Protein. Biochem Biophys Res Commun 270, 23-27.
Seremetis, S., Inghirami, G., Perrero, D., Newcomb, E. W., Knowles, D. M., Dotto, G. P., and Dalla- Pavera, R. (1989). Transformation and plasmacytoid differentiation of EBV-infected human B lymphoblasts by ras oncogenes. Science 243, 660-663.
Shaffer, A. L., Lin, K. 1., Kuo, T. C., Yu, X., Hurt, E. M., Rosenwald, A., Giltnane, J. M., Yang, L., Zhao, H., Calame, K., and Staudt, L. M. (2002). Blimp-1 orchestrates plasma cell differentiation by extinguishing the mature B cell gene expression program. Immunity 17, 51-62.
Shaffer, A. L., Yu, X., He, Y., Boldrick, J., Chan, E. P., and Staudt, L. M. (2000). BCL-6 represses genes that function in lymphocyte differentiation, inflammation, and cell cycle control. Immunity 13, 199-212.
Shaheduzzaman, S., Krishnan, V., Petrovic, A., Bittner, M., Meltzer, P., Trent, J., Venkatesan, S., and Zeichner, S. (2002). Effects of HlV-1 Nef on Cellular Gene Expression Profiles. J Biomed Sci 9, 82-96.
Shan, L., Qiao, X., Oldham, E., Catron, D., Kaminski, H., Lundell, D., Zlotnik, A., Gustafson, E., and Hedrick, J. A. (2000). Identification of viral macrophage inflammatory protein (vMlP)-ll as a ligand for GPR5/XCR1. Biochem Biophys Res Commun 268, 938-941.
Shanebeck, K. D., Maliszewski, C. R., Kennedy, M. K., Picha, K. S., Smith, C. A., Goodwin, R. G., and Grabstein, K. H. (1995). Regulation of murine B cell growth and differentiation by CD30 ligand. Eur J Immunol 25, 2147-2153.
Sharp, T. V., Schwemmle, M., Jeffrey, 1., Laing, K., Mellor, H., Proud, C. G., Hilse, K., and Clemens, M.J. (1993). Comparative analysis of the regulation of the interferon-inducible protein kinase PKR by Epstein-Barr virus RNAs EBER-1 and EBER-2 and adenovirus VAl RNA. Nucleic Acids Res 21, 4483- 4490.
Sharp, T. V., Wang, H. W., Koumi, A., Hollyman, D., Endo, Y., Ye, H., Du, M. Q., and Boshoff, C.(2002). K15 protein of Kaposi's sarcoma-associated herpesvirus is latently expressed and binds to HAX-1, a protein with antiapoptotic function. J Virol 76, 802-816.
Shaughnessy, J., Jr., Gabrea, A., Qi, Y., Brents, L., Zhan, P., Tian, E., Sawyer, J., Barlogie, B., Bergsagel, P. L., and Kuehl, M. (2001). Cyclin D3 at 6p21 is dysregulated by recurrent chromosomal translocations to immunoglobulin loci in multiple myeloma. Blood 98, 217-223.
Sheehy, A. M., Gaddis, N. C., Choi, J. D., and Malim, M. H. (2002). Isolation of a human gene that inhibits HlV-1 infection and is suppressed by the viral Vif protein. Nature 418, 646-650.
314
Shipp, M. A., Ross, K. N., Tamayo, P., Weng, A, P., Kutok, J. L., Aguiar, R. C., Gaasenbeek, M., Angelo, M., Reich, M., Pinkus, G. S., et al. (2002). Diffuse large B-cell lymphoma outcome prediction by gene- expression profiling and supervised machine learning. Nat Med 8, 68-74.
Shoemaker, D. D., Schadt, E. E., Armour, C. D., He, Y. D., Garrett-Engele, P., McDonagh, P. D., Loerch, P. M., Leonardson, A., Lum, P. Y., Cavet, G., et al. (2001). Experimental annotation of the human genome using microarray technology. Nature 409, 922-927.
Shou, Y., Martelli, M, L., Gabrea, A., Qi, Y., Brents, L. A., Roschke, A., Dewald, G., Kirsch, I. R., Bergsagel, P. L., and Kuehl, W. M. (2000). Diverse karyotypic abnormalities of the c-myc locus associated with c-myc dysregulation and tumor progression in multiple myeloma. Proc Natl Acad Sci U S A 97, 228- 233.
Shtivelman, E., Lifshitz, B., Gale, R. P., and Canaani, E. (1985). Fused transcript of abl and her genes in chronic myelogenous leukaemia. Nature 315, 550-554.
Shurtleff, S. A., Buijs, A., Behm, F. G., Rubnitz, J. E., Raimondi, S. C., Hancock, M. L., Chan, G. C., Pui,C. H., Grosveld, G., and Downing, J. R. (1995). TEL/AMLl fusion resulting from a cryptic t(12;21) is the most common genetic lesion in pediatric ALL and defines a subgroup of patients with an excellent prognosis. Leukemia 9, 1985-1989.
Silacci, P., Mottet, A., Steimle, V., Reith, W., and Mach, B. (1994). Developmental extinction of major histocompatibility complex class II gene expression in plasmocytes is mediated by silencing of the transactivator gene CIITA. J Exp Med 180, 1329-1336.
Siman, R., Flood, D. G., Thinakaran, G., and Neumar, R. W. (2001). Endoplasmic reticulum stress- induced cysteine protease activation in cortical neurons: effect of an Alzheimer's disease-linked presenilin- 1 knock-in mutation. J Biol Chem 276, 44736-44743.
Siminoff, P., and Menefee, M. G. (1966). Normal and 5-bromodeoxyuridine-inhibited development of herpes simplex virus. An electron microscope study. Exp Cell Res 44, 241-255.
Simmen, K. A., Singh, J., Luukkonen, B. G., Lopper, M., Bittner, A., Miller, N. E., Jackson, M. R., Compton, T., and Fruh, K. (2001). Global modulation of cellular transcription by human cytomegalovirus is initiated by viral glycoprotein B. Proc Natl Acad Sci U S A 98, 7140-7145.
Simmons, A., Aluvihare, V., and McMichael, A. (2001). Nef triggers a transcriptional program in T cells imitating single-signal T cell activation and inducing HIV virulence mediators. Immunity 14, 763-777.
Simpson, G. R., Schulz, T. P., Whitby, D., Cook, P. M., Boshoff, C., Rainbow, L., Howard, M. R., Gao, S. J., Bohenzky, R. A., Simmonds, P., et al. (1996). Prevalence of Kaposi's sarcoma associated herpesvirus infection measured by antibodies to recombinant capsid protein and latent immunofluorescence antigen. Lancet 1133-1138.
Singh, D., Febbo, P. G., Ross, K., Jackson, D. G., Manola, J., Ladd, C., Tamayo, P., Renshaw, A. A., D'Amico, A. V., Richie, J. P., et al. (2002). Gene expression correlates of clinical prostate cancer behavior. Cancer Cell 1, 203-209.
Sirianni, M. C., Uccini, S., Angeloni, A., Faggioni, A., Cottoni, P., and Ensoli, B. (1997). Circulating spindle cells: correlation with human herpesvirus-8 (HHV-8) infection and Kaposi's sarcoma. Lancet 349, 255.
Sitas, P., Carrara, H., Beral, V., Newton, R., Reeves, G., Bull, D., Jentsch, U., Pacella-Norman, R., Bourboulia, D., Whitby, D., et al. (1999). Antibodies against human herpesvirus 8 in black South African patients with cancer. N Engl J Med 340, 1863-1871.
Sixbey, J. W. (2000). Epstein-Barr virus DNA loss from tumour cells and the geography of Burkitt's lymphoma. EBV Reports 7, 37-40.
Skare, J., Parley, J., Strominger, J. L., Presen, K. O., Cho, M. S., and zur Hausen, H. (1985). Transformation by Epstein-Barr virus requires DNA sequences in the region of BamHI fragments Y andH. J Virol 55, 286-297.
315
Slifka, M. K., Antia, R., Whitmire, J. K., and Ahmed, R. (1998). Humoral immunity due to long-lived plasma cells. Immunity 8, 363-372.
Smith, K. G., Hewitson, T. D., Nossal, G. J., and Tarlinton, D. M. (1996). The phenotype and fate of the antibody-forming cells of the splenic foci. Eur J Immunol 26, 444-448.
Smith, K. G., Light, A., Nossal, G. J., and Tarlinton, D. M. (1997). The extent of affinity maturation differs between the memory and antibody-forming cell compartments in the primary immune response. Embo J 16, 2996-3006.
Smith, P. R., de Jesus, O., Tumer, D., Hollyoake, M., Karstegl, C. E., Griffin, B. E., Karran, L., Wang, Y., Hayward, S. D., and Farrell, P. J. (2000). Structure and coding content of GST (BART) family RNAs of Epstein-Barr virus. J Virol 74, 3082-3092.
Smith, V., Botstein, D., and Brown, P. O. (1995). Genetic footprinting: a genomic strategy for determining a gene's function given its sequence. Proc Natl Acad Sci U S A 92, 6479-6483.
Snapper, C. M., Zelazowski, P., Rosas, P. R., Kehry, M. R., Tian, M., Baltimore, D., and Sha, W. C.(1996). B cells from p50/NF-kappa B knockout mice have selective defects in proliferation, differentiation, germ-line CH transcription, and Ig class switching. J Immunol 156, 183-191.
Sodhi, A., Montaner, S., Patel, V., Zohar, M., Bais, C., Mesri, E. A., and Gutkind, J. S. (2000). The Kaposi's sarcoma-associated herpes virus G protein-coupled receptor up-regulates vascular endothelial growth factor expression and secretion through mitogen-activated protein kinase and p38 pathways acting on hypoxia-inducible factor 1 alpha. Cancer Res 60, 4873-4880.
Song, M. J., Brown, H. J., Wu, T. T., and Sun, R. (2001). Transcription activation of polyadenylated nuclear ma by rta in human herpesvims 8/Kaposi's sarcoma-associated herpesvims. J Virol 75, 3129-3140.
Song, Y. J., and Stinski, M. F. (2002). Effect of the human cytomegalovims IE86 protein on expression of E2F-responsive genes: a DNA microarray analysis. Proc Natl Acad Sci U S A 99, 2836-2841.
Soro, P. G., Morales, A. P., Martinez, M. J., Morales, A. S., Copin, S. G., Marcos, M. A., and Gaspar, M. L. (1999). Differential involvement of the transcription factor Blimp-1 in T cell-independent and - dependent B cell differentiation to plasma cells. J Immunol 163, 611-617.
Soulier, J., Grollet, L., Oksenhendler, E., Cacoub, P., Cazals-Hatem, D., Babinet, P., d'Agay, M. F., Clauvel, J. P., Raphael, M., Degos, L., and et al. (1995). Kaposi's sarcoma-associated herpesvims-like DNA sequences in multicentric Castleman's disease. Blood 86, 1276-1280.
Southem, E., Mir, K., and Shchepinov, M. (1999). Molecular interactions on microarrays. Nat Genet 21, 5- 9.
Southem, E. M. (1975). Detection of specific sequences among DNA fragments separated by gel electrophoresis. J Mol Biol 98, 503-517.
Sozzani, S., Luini, W., Bianchi, G., Allavena, P., Wells, T. N., Napolitano, M., Bemardini, G., Vecchi, A., D'Ambrosio, D., Mazzeo, D., et al. (1998). The viral chemokine macrophage inflammatory protein-II is a selective Th2 chemoattractant. Blood 92, 4036-4039.
Spear, G. T., Lurain, N. S., Parker, C. J., Ghassemi, M., Payne, G. H., and Saifuddin, M. (1995). Host cell- derived complement control proteins CD55 and CD59 are incorporated into the virions of two unrelated enveloped vimses. Human T cell leukemia/lymphoma vims type I (HTLV-I) and human cytomegalovims (HCMV). J Immunol 155, 4376-4381.
Speir, E., Yu, Z. X., Ferrans, V. J., Huang, E. S., and Epstein, S. E. (1998). Aspirin attenuates cytomegalovims infectivity and gene expression mediated by cyclooxygenase-2 in coronary artery smooth muscle cells. Circ Res 83, 210-216.
Spellman, P. T., Sherlock, G., Zhang, M. Q., Iyer, V. R., Anders, K., Eisen, M. B., Brown, P. O., Botstein,D., and Futcher, B. (1998). Comprehensive identification of cell cycle-regulated genes of the yeast Saccharomyces cerevisiae by microarray hybridization. Mol Biol Cell 9, 3273-3297.
316
Spender, L. C., Cornish, G. H., Sullivan, A., and Farrell, P. J. (2002). Expression of transcription factor AML-2 (RUNX3, CBF(alpha)-3) is induced by Epstein-Barr virus EBNA-2 and correlates with the B-cell activation phenotype. J Virol 76, 4919-4927.
Spriggs, M. K. (1996). One step ahead of the game: viral immunomodulatory molecules. Annu Rev Immunol 14, 101-130.
Srinivas, S. K., and Sixbey, J. W. (1995). Epstein-Barr virus induction of recombinase-activating genes RAGl and RAG2. J Virol 69, 8155-8158.
Stackpole, C. W. (1969). Herpes-type virus of the frog renal adenocarcinoma. I. Virus development in tumor transplants maintained at low temperature. J Virol 4, 75-93.
Staskus, K, A., Sun, R., Miller, G., Racz, P., Jaslowski, A., Metroka, C., Brett-Smith, H., and Haase, A. T.(1999). Cellular tropism and viral interleukin-6 expression distinguish human herpesvirus 8 involvement in Kaposi's sarcoma, primary effusion lymphoma, and multicentric Castleman's disease. J Virol 73, 4181- 4187.
Staskus, K. A., Zhong, W., Gebhard, K., Hemdier, B., Wang, H., Renne, R., Beneke, J., Pudney, J., Anderson, D. J., Ganem, D., and Haase, A. T. (1997). Kaposi's sarcoma-associated herpesvirus gene expression in endothelial (spindle) tumor cells. J Virol 71, 715-719.
Staunton, J. E., Slonim, D. K., Coller, H. A., Tamayo, P., Angelo, M. J., Park, J., Scherf, U., Lee, J. K., Reinhold, W. O., Weinstein, J. N., et al. (2001). Chemosensitivity prediction by transcriptional profiling. Proc Natl Acad Sci U S A 98, 10787-10792.
Stavnezer, J. (1996). Immunoglobulin class switching. Curr Opin Immunol 8, 199-205.
Stein, H., Foss, H. D., Durkop, H., Marafioti, T., Delsol, G., Pulford, K., Pileri, S., and Falini, B. (2000). CD30(-h) anaplastic large cell lymphoma: a review of its histopathologic, genetic, and clinical features. Blood 96, 3681-3695.
Steiner, H., and Haass, C. (2000). Intramembrane proteolysis by presenilins. Nat Rev Mol Cell Biol 1, 217-224.
Steven, N. M. (1996). Infectious mononucleosis. EBV Reprts 7, 91-95.
Stevenson, P. G., Efstathiou, S., Doherty, P. C., and Lehner, P. J. (2000). Inhibition of MHC class I- restricted antigen presentation by gamma 2-herpesviruses. Proc Natl Acad Sci U S A 97, 8455-8460.
Stevenson, P. G., May, J. S., Smith, X. G., Marques, S., Adler, H., Koszinowski, U. H., Simas, J. P., and Efstathiou, S. (2002). K3-mediated evasion of CD8(+) T cells aids amplification of a latent gamma- herpesvims. Nat Immunol 3, 733-740.
Stine, J. T., Wood, C., Hill, M., Epp, A., Raport, C. J., Schweickart, V. L., Endo, Y., Sasaki, T., Simmons,G., Boshoff, C., et al. (2000). KSHV-encoded CC chemokine vMIP-III is a CCR4 agonist, stimulates angiogenesis, and selectively chemoattracts TH2 cells. Blood 95, 1151-1157.
Stingley, S. W., Ramirez, J. J., Aguilar, S. A., Simmen, K., Sandri-Goldin, R. M., Ghazal, P., and Wagner,E. K. (2000). Global analysis of herpes simplex virus type 1 transcription using an oligonucleotide-based DNA microarray. J Virol 74, 9916-9927.
Stuber, E., and Strober, W. (1996). The T cell-B cell interaction via OX40-OX40L is necessary for the T cell-dependent humoral immune response. J Exp Med 183, 979-989.
Sturzl, M., Blasig, C., Schreier, A., Neipel, F., Hohenadl, C., Comali, E., Ascherl, G., Esser, S., Brockmeyer, N. H., Ekman, M., et al. (1997). Expression of HHV-8 latency-associated T0.7 RNA in spindle cells and endothelial cells of AIDS-associated, classical and African Kaposi's sarcoma. Int J Cancer 72, 68-71.
Sturzl, M., Brandstetter, H., and Roth, W. K. (1992). Kaposi's sarcoma: a review of gene expression and ultrastructure of KS spindle cells in vivo. AIDS Res Hum Retroviruses 8, 1753-1763.
317

Sturzl, M., Hohenadl, C., Zietz, C., Castanos-Velez, E., Wunderlich, A., Ascherl, G., Biberfeld, P.,Monini, P., Browning, P. J., and Ensoli, B. (1999a). Expression of K13/v-FLIP gene of human herpesvirus 8 and apoptosis in Kaposi's sarcoma spindle cells. J Natl Cancer Inst 91, 1725-1733.
Sturzl, M., Wunderlich, A., Ascherl, G., Hohenadl, C., Monini, P., Zietz, C., Browning, P. J., Neipel, P., Biberfeld, P., and Ensoli, B. (1999b). Human herpesvirus-8 (HHV-8) gene expression in Kaposi's sarcoma (KS) primary lesions: an in situ hybridization study. Leukemia 13 Suppl 1, SI 10-112.
Su, A. 1., Welsh, J. B., Sapinoso, L. M., Kern, S. G., Dimitrov, P., Lapp, H., Schultz, P. G., Powell, S. M., Moskaluk, C. A., Frierson, H. P., Jr., and Hampton, G. M. (2001). Molecular classification of human carcinomas by use of gene expression signatures. Cancer Res 61, 7388-7393.
Sun, R., Lin, S. P., Staskus, K., Gradoville, L., Grogan, E., Haase, A., and Miller, G. (1999). Kinetics of Kaposi's sarcoma-associated herpesvirus gene expression. J Virol 73, 2232-2242.
Sun, X. H., Copeland, N. G., Jenkins, N. A., and Baltimore, D. (1991). Id proteins Idl and ld2 selectively inhibit DNA binding by one class of helix-loop-helix proteins. Mol Cell Biol 11, 5603-5611.
Swaminathan, S., Tomkinson, B., and Kieff, E. (1991). Recombinant Epstein-Barr virus with small RNA (EBER) genes deleted transforms lymphocytes and replicates in vitro. Proc Natl Acad Sci U S A 88, 1546- 1550.
Swanton, C., Mann, D. J., Fleckenstein, B., Neipel, P., Peters, G., and Jones, N. (1997). Herpes viral cyclin/Cdk6 complexes evade inhibition by CDK inhibitor proteins. Nature 390, 184-187.
Sylla, B. S., Hung, S. C., Davidson, D. M,, Hatzivassiliou, E., Malinin, N. L., Wallach, D., Gilmore, T. D., Kieff, E., and Mosialos, G. (1998). Epstein-Barr virus-transforming protein latent infection membrane protein 1 activates transcription factor NP-kappaB through a pathway that includes the NP-kappaB- inducing kinase and the IkappaB kinases IKKalpha and IKKbeta. Proc Natl Acad Sci U S A 95, 10106- 10111 .
Sze, D. M., Toellner, K. M., Garcia de Vinuesa, C., Taylor, D. R., and MacLennan, 1. C. (2000). Intrinsic constraint on plasmablast growth and extrinsic limits of plasma cell survival. J Exp Med 192, 813-821.
Szekely, L., Chen, P., Teramoto, N., Ehlin-Henriksson, B., Pokrovskaja, K., Szeles, A., Manneborg- Sandlund, A., Lowbeer, M., Lennette, E. T., and Klein, G. (1998). Restricted expression of Epstein-Barr virus (EBV)-encoded, growth transformation-associated antigens in an EBV- and human herpesvirus type 8-carrying body cavity lymphoma line. J Gen Virol 79, 1445-1452.
Takahashi, Y,, Dutta, P. R., Cerasoli, D. M., and Kelsoe, G. (1998). In situ studies of the primary immune response to (4-hydroxy-3-nitrophenyl)acetyl. V. Affinity maturation develops in two stages of clonal selection. J Exp Med 187, 885-895.
Takefman, D, M., Spear, G. T., Saifuddin, M., and Wilson, C. A. (2002). Human CD59 incorporation into porcine endogenous retrovirus particles: implications for the use of transgenic pigs for xenotransplantation. J Virol 76, 1999-2002.
Talbot, S. J., Weiss, R. A., Kellam, P., and Boshoff, C. (1999). Transcriptional analysis of human herpesvirus-8 open reading frames 71, 72, 73, K14, and 74 in a primary effusion lymphoma cell line. Virology 257, 84-94.
Tamaru, J., Hummel, M., Marafioti, T., Kalvelage, B., Leoncini, L., Minacci, C., Tosi, P., Wright, D., and Stein, H. (1995). Burkitt's lymphomas express VH genes with a moderate number of antigen-selected somatic mutations. Am J Pathol 147, 1398-1407.
Tamayo, P., Slonim, D., Mesirov, J., Zhu, Q., Kitareewan, S., Dmitrovsky, E., Lander, E. S., and Golub, T. R. (1999). Interpreting patterns of gene expression with self-organizing maps: methods and application to hematopoietic differentiation. Proc Natl Acad Sci U S A 96, 2907-2912.
Tan, L. C., Gudgeon, N., Annels, N. E., Hansasuta, P., O'Callaghan, C. A., Rowland-Jones, S.,McMichael, A. J., Rickinson, A. B., and Callan, M. P. (1999). A re-evaluation of the frequency of CD8+ T cells specific for EBV in healthy virus carriers. J Immunol 162, 1827-1835.
318
Tavazoie, S., Hughes, J. D., Campbell, M. J., Cho, R. J., and Church, G. M. (1999). Systematic determination of genetic network architecture. Nat Genet 22, 281-285.
Taylor, L. A., Carthy, C. M., Yang, D., Saad, K., Wong, D., Schreiner, G., Stanton, L. W., and McManus,B. M. (2000). Host gene regulation during coxsackievirus B3 infection in mice: assessment by microarrays. Circ Res 87, 328-334.
ten Boekel, E., Melchers, F., and Rolink, A. (1995). The status of Ig loci rearrangements in single cells from different stages of B cell development. Int Immunol 7, I0I3-I0I9.
Thomas, J. G., Olson, J. M., Tapscott, S. J., and Zhao, L. P. (2001). An efficient and robust statistical modeling approach to discover differentially expressed genes using genomic expression profiles. Genome Res 11, 1227-1236.
Thome, M., Schneider, P., Hofmann, K., Fickenscher, H., Meinl, E., Neipel, F., Mattmann, C., Bums, K., Bodmer, J. L., Schroter, M., et al. (1997). Viral FLICE-inhibitory proteins (FLIPs) prevent apoptosis induced by death receptors. Nature 386, 517-521.
Thompson, J. D., Higgins, D. G., and Gibson, T. J. (1994). CLUSTAL W: improving the sensitivity of progressive multiple sequence alignment through sequence weighting, position-specific gap penalties and weight matrix choice. Nucleic Acids Res 22, 4673-4680.
Thorley-Lawson, D. A. (2001). Epstein-Barr virus: exploiting the immune system. Nature Rev Immunol 1, 75-82.
Thorley-Lawson, D. A., and Babcock, G. J. (1999). A model for persistent infection with Epstein-Barr vims: the stealth vims of human B cells. Life Sci 65, I433-I453.
Thorley-Lawson, D. A., and Mann, K. P. (1985). Early events in Epstein-Barr vims infection provide a model for B cell activation. J Exp Med 162, 45-59.
Tian, B., Zhang, Y., Luxon, B. A., Garofalo, R. P., Casola, A., Sinha, M., and Brasier, A. R. (2002). Identification of NF-kappaB-dependent gene networks in respiratory syncytial vims-infected cells. J Virol 76, 6800-6814.
Tiegs, S. L., Russell, D. M., and Nemazee, D. (1993). Receptor editing in self-reactive bone marrow B cells. J Exp Med 177, 1009-1020.
Tierney, R., Kirby, H., Nagra, J., Rickinson, A., and Bell, A. (2000). The Epstein-Barr vims promoter initiating B-cell transformation is activated by RFX proteins and the B-cell-specific activator protein BSAP/Pax5. J Virol 74, 10458-10467.
Tierney, R. J., Steven, N., Young, L. S., and Rickinson, A. B. (1994). Epstein-Barr vims latency in blood mononuclear cells: analysis of viral gene transcription during primary infection and in the carrier state. J Virol 68, 7374-7385.
Tkachuk, D. C., Kohler, S., and Cleary, M. L. (1992). Involvement of a homolog of Drosophila trithorax by I Iq23 chromosomal translocations in acute leukemias. Cell 71, 691-700.
Toellner, K. M., Gulbranson-Judge, A., Taylor, D. R., Sze, D. M., and MacLennan, I. C. (1996). Immunoglobulin switch transcript production in vivo related to the site and time of antigen-specific B cell activation. J Exp Med 183, 2303-2312.
Tomkinson, B., and Kieff, E. (1992). Use of second-site homologous recombination to demonstrate that Epstein-Barr vims nuclear protein 3B is not important for lymphocyte infection or growth transformation in vitro. J Virol 66, 2893-2903.
Tomkinson, B., Robertson, E., and Kieff, E. (1993). Epstein-Barr vims nuclear proteins EBNA-3A and EBNA-3C are essential for B-lymphocyte growth transformation. J Virol 67, 2014-2025.
Toyama, H., Okada, S., Hatano, M., Takahashi, Y., Takeda, N., Ichii, H., Takemori, T., Kuroda, Y., and Tokuhisa, T. (2002). Memory B Cells without Somatic Hypermutation Are Generated from Bcl6-Deficient B Cells. Immunity 17, 329.
319
Travers, K. J., Patil, C. K., Wodicka, L., Lockhart, D. J., Weissman, J. S., and Walter, P. (2000). Functional and genomic analyses reveal an essential coordination between the unfolded protein response and ER-associated degradation. Cell 101, 249-258.
Treon, S. P., Mitsiades, C., Mitsiades, N., Young, G., Doss, D., Schlossman, R., and Anderson, K. C.(2001). Tumor Cell Expression of CD59 Is Associated With Resistance to CD20 Serotherapy in Patients With B-Cell Malignancies. J Immunother 24, 263-271.
Trus, B. L., Heymann, J. B., Nealon, K., Cheng, N., Newcomb, W. W., Brown, J. C., Kedes, D. H., and Steven, A. C. (2001). Capsid structure of Kaposi's sarcoma-associated herpesvirus, a gammaherpesvirus, compared to those of an alphaherpesvirus, herpes simplex virus type 1, and a betaherpesvirus, cytomegalovirus. J Virol 75, 2879-2890.
Tsavachidou, D., Podrzucki, W., Seykora, J., and Berger, S. L. (2001). Gene array analysis reveals changes in peripheral nervous system gene expression following stimuli that result in reactivation of latent herpes simplex virus type 1: induction of transcription factor Bcl-3. J Virol 75, 9909-9917.
Tseng, G. C., Oh, M. K., Rohlin, L., Liao, J. C., and Wong, W. H. (2001). Issues in cDNA microarray analysis: quality filtering, channel normalization, models of variations and assessment of gene effects. Nucleic Acids Res 29, 2549-2557.
Tsujimoto, Y., Cossman, J., Jaffe, E., and Croce, C. M. (1985). Involvement of the bcl-2 gene in human follicular lymphoma. Science 228, 1440-1443.
Tsujimoto, Y., Finger, L. R., Yunis, J., Nowell, P. C., and Croce, C. M. (1984). Cloning of the chromosome breakpoint of neoplastic B cells with the t(14;18) chromosome translocation. Science 226, 1097-1099.
Tumer, C. A., Jr., Mack, D. H., and Davis, M. M. (1994). Blimp-1, a novel zinc finger-containing protein that can drive the maturation of B lymphocytes into immunoglobulin-secreting cells. Cell 77, 297-306.
Tumer, M., Gulbranson-Judge, A., Quinn, M. E., Walters, A. E., MacLennan, 1. C., and Tybulewicz, V. L.(1997). Syk tyrosine kinase is required for the positive selection of immature B cells into the recirculating B cell pool. J Exp Med 186, 2013-2021.
Uccini, S., Ruco, L. P., Monardo, F., Stoppacciaro, A., Dejana, E., La Parola, 1. L., Cerimele, D., and Baroni, C. D. (1994). Co-expression of endothelial cell and macrophage antigens in Kaposi's sarcoma cells. J Pathol 173, 23-31.
Uccini, S., Sirianni, M. C., Vincenzi, L., Topino, S., Stoppacciaro, A., Lesnoni La Parola, 1., Capuano, M., Masini, C., Cerimele, D., Celia, M., et al. (1997). Kaposi's sarcoma cells express the macrophage- associated antigen mannose receptor and develop in peripheral blood cultures of Kaposi's sarcoma patients. Am J Pathol 150, 929-938.
Uchida, J., Yasui, T., Takaoka-Shichijo, Y., Muraoka, M., Kulwichit, W., Raab-Traub, N., and Kikutani,H. (1999). Mimicry of CD40 signals by Epstein-Barr vims LMPl in B lymphocyte responses. Science 286, 300-303.
Uchiyama, H., Bamt, B. A., Mohrbacher, A. F., Chauhan, D., and Anderson, K. C. (1993). Adhesion of human myeloma-derived cell lines to bone marrow stromal cells stimulates interleukin-6 secretion. Blood 82, 3712-3720.
Uetz, P., Giot, L., Cagney, G., Mansfield, T. A., Judson, R. S., Knight, J. R., Lockshon, D., Narayan, V., Srinivasan, M., Pochart, P., et al. (2000). A comprehensive analysis of protein-protein interactions in Saccharomyces cerevisiae. Nature 403, 623-627.
Unal, A., Pray, T. R., Lagunoff, M., Pennington, M. W., Ganem, D., and Craik, C. S. (1997). The protease and the assembly protein of Kaposi's sarcoma-associated herpesvims (human herpesvims 8). J Virol 71, 7030-7038.
320

Urbanek, P., Wang, Z, Q., Fetka, L, Wagner, E. P., and Busslinger, M. (1994). Complete block of early B cell differentiation and altered patterning of the posterior midbrain in mice lacking Pax5/BSAP. Cell 79, 901-912.
Usui, T., Wakatsuki, Y., Matsunaga, Y., Kaneko, S., Koseki, H., Kita, T., and Kosek, H. (1997). Overexpression of B cell-specific activator protein (BSAP/Pax-5) in a late B cell is sufficient to suppress differentiation to an Ig high producer cell with plasma cell phenotype. J Immunol 158, 3197-3204.
Valle, A., Zuber, C. E., Defrance, T., Djossou, O., De Rie, M., and Banchereau, J. (1989). Activation of human B lymphocytes through CD40 and interleukin 4. Eur J Immunol 19, 1463-1467.
Van Dijk, M. A., Voorhoeve, P. M., and Murre, C. (1993). Pbxl is converted into a transcriptional activator upon acquiring the N-terminal region of E2A in pre-B-cell acute lymphoblastoid leukemia. Proc Natl Acad Sci U S A 90, 6061-6065.
Van Gelder, R. N., von Zastrow, M. E., Yool, A., Dement, W. C., Barchas, J. D., and Eberwine, J. H.(1990). Amplified RNA synthesized from limited quantities of heterogeneous cDNA. Proc Natl Acad Sci U S A57, 1663-1667.
van't Veer, L. J., Dai, H., van de Vijver, M. J., He, Y. D., Hart, A. A., Mao, M., Peterse, H. L., van der Kooy, K., Marton, M. J., Witteveen, A. T., et al. (2002). Gene expression profiling predicts clinical outcome of breast cancer. Nature 415, 530-536.
Vanderplasschen, A., Mathew, E., Hollinshead, M., Sim, R. B., and Smith, G. L. (1998). Extracellular enveloped vaccinia virus is resistant to complement because of incorporation of host complement control proteins into its envelope. Proc Natl Acad Sci U S A 95, 7544-7549.
Velculescu, V. E., Zhang, L., Vogelstein, B., and Kinzler, K. W. (1995). Serial analysis of gene expression. Science 270, 484-487.
Venter, J. C., Adams, M. D., Myers, E. W., Li, P. W., Mural, R. J., Sutton, G. G., Smith, H. O., Yandell, M., Evans, C. A., Holt, R. A., et al. (2001). The sequence of the human genome. Science 291, 1304-1351.
Veraldi, K. L., Arhin, G. K., Martincic, K., Chung-Ganster, L. H., Wilusz, J., and Milcarek, C. (2001). hnRNP F influences binding of a 64-kilodalton subunit of cleavage stimulation factor to mRNA precursors in mouse B cells. Mol Cell Biol 21, 1228-1238.
Verschuren, E. W., Klefstrom, J., Evan, G. I., and Jones, N. (2002). The oncogenic potential of Kaposi's sarcoma-associated herpesvirus cyclin is exposed by p53 loss in vitro and in vivo. Cancer Cell 2, 229-241.
Vertegaal, A. C., Kuiperij, H. B., van Laar, T., Schamhorst, V., van der Eb, A. J., and Zantema, A. (2000). cDNA micro array identification of a gene differentially expressed in adenovirus type 5- versus type 12- transformed cells. FEBS Lett 487, 151-155.
Vescio, R. A., Cao, J., Hong, C. H., Lee, J. C., Wu, C. H., Der Danielian, M., Wu, V., Newman, R., Lichtenstein, A. K., and Berenson, J. R. (1995). Myeloma Ig heavy chain V region sequences reveal prior antigenic selection and marked somatic mutation but no intraclonal diversity. J Immunol 155, 2487-2497.
Visvanathan, K. V., and Goodboum, S. (1989). Double-stranded RNA activates binding of NF-kappa B to an inducible element in the human beta-interferon promoter. Embo J 8, 1129-1138.
Vogel, J., Hinrichs, S. H., Reynolds, R. K , Luciw, P. A., and Jay, G. (1988). The HIV tat gene induces dermal lesions resembling Kaposi's sarcoma in transgenic mice. Nature 335, 606-611.
Wagner, A., Doerks, A., Aboud, M., Alonso, A., Tokino, T., Flugel, R. M., and Lochelt, M. (2000). Induction of cellular genes is mediated by the Bell transactivator in foamy virus-infected human cells. J Virol 74, 4441-4447.
Wagner, E. K., Devi-Rao, G., Feldman, L. T., Dobson, A. T., Zhang, Y. F., Flanagan, W. M., and Stevens, J. G. (1988). Physical characterization of the herpes simplex virus latency-associated transcript in neurons. J Virol 62, 1194-1202.
321
Wagner, E. K., Swanstrom, R. L, and Stafford, M. G. (1972). Transcription of the herpes simplex virus genome in human cells. J Virol 10, 675-682.
Wan, X., Wang, H., and Nicholas, J. (1999). Human herpesvirus 8 interleukin-6 (vIL-6) signals through gpl30 but has structural and receptor-binding properties distinct from those of human IL-6. J Virol 73, 8268-8278.
Wang, E., Miller, L. D., Ohnmacht, G. A., Liu, E. T., and Marincola, F. M. (2000). High-fidelity mRNA amplification for gene profiling. Nat Biotechnol 18, 457-459.
Wang, P., Gregory, C., Sample, C., Rowe, M., Liebowitz, D., Murray, R., Rickinson, A., and Kieff, E. (1990a). Epstein-Barr virus latent membrane protein (LMPl) and nuclear proteins 2 and 3C are effectors of phenotypic changes in B lymphocytes: EBNA-2 and LMPl cooperatively induce CD23. J Virol 64, 2309-2318.
Wang, P., Gregory, C. D., Rowe, M., Rickinson, A. B., Wang, D., Birkenbach, M., Kikutani, H., Kishimoto, T., and Kieff, E. (1987). Epstein-Barr virus nuclear antigen 2 specifically induces expression of the B-cell activation antigen CD23. Proc Natl Acad Sci U S A 84, 3452-3456.
Wang, P., Tsang, S. P., Kurilla, M. G., Cohen, J. I., and Kieff, E. (1990b). Epstein-Barr virus nuclear antigen 2 transactivates latent membrane protein LMPl. J Virol 64, 3407-3416.
Wang, H. W., Sharp, T. V., Koumi, A., Koentges, G., and Boshoff, C. (2002). Characterization of an antiapoptotic glycoprotein encoded by Kaposi's sarcoma-associated herpesvirus which resembles a spliced variant of human survivin. Embo J 27, 2602-2615.
Wang, X. P., Zhang, Y. J., Deng, J. H., Pan, H. Y., Zhou, P. C., Montalvo, E. A., and Gao, S. J. (2001). Characterization of the promoter region of the viral interferon regulatory factor encoded by Kaposi's sarcoma-associated herpesvirus. Oncogene 20, 523-530.
Wang, X. W., Zhan, Q., Coursen, J. D., Khan, M. A., Kontny, H. U., Yu, L., Hollander, M. C., O'Connor, P. M., Pomace, A. J., Jr., and Harris, C. C. (1999). GADD45 induction of a G2/M cell cycle checkpoint. Proc Natl Acad Sci U S A 96, 3706-3711.
Weindel, K., Marme, D., and Weich, H. A. (1992). AIDS-associated Kaposi's sarcoma cells in culture express vascular endothelial growth factor. Biochem Biophys Res Conunun 183, 1167-1174.
Weinreb, M., Day, P. J., Niggli, P., Green, E. K., Nyong'o, A. O., Othieno-Abinya, N. A., Riyat, M. S., Raafat, P., and Mann, J. R. (1996). The consistent association between Epstein-Barr virus and Hodgkin's disease in children in Kenya. Blood 87, 3828-3836.
Weiss, L. M., and Movahed, L. A. (1989). In situ demonstration of Epstein-Barr viral genomes in viral- associated B cell lymphoproliferations. Am J Pathol 134, 651-659.
Weiss, L. M., Movahed, L. A., Wamke, R. A., and Sklar, J. (1989). Detection of Epstein-Barr viral genomes in Reed-Stemberg cells of Hodgkin's disease. N Engl J Med 320, 502-506.
Weiss, L. M., Strickier, J. G., Wamke, R. A., Purtilo, D. T., and Sklar, J. (1987). Epstein-Barr viral DNA in tissues of Hodgkin's disease. Am J Pathol 129, 86-91.
Wellmann, A., Thieblemont, C., Pittaluga, S., Sakai, A., Jaffe, E. S., Siebert, P., and Raffeld, M. (2000). Detection of differentially expressed genes in lymphomas using cDNA arrays: identification of clusterin as a new diagnostic marker for anaplastic large-cell lymphomas. Blood 96, 398-404.
Wen, X. Y., Stewart, A, K., Sooknanan, R. R., Henderson, G., Hawley, T. S., Reimold, A. M., Glimcher,L. H., Baumann, H., Malek, L, T., and Hawley, R. G. (1999). Identification of c-myc promoter-binding protein and X-box binding protein 1 as interleukin-6 target genes in human multiple myeloma cells. Int J Oncol 15, 173-178.
Weninger, W., Partanen, T. A., Breiteneder-Geleff, S., Mayer, C., Kowalski, H., Mildner, M., Pammer, J., Sturzl, M., Kerjaschki, D., Alitalo, K., and Tschachler, E. (1999). Expression of vascular endothelial growth factor receptor-3 and podoplanin suggests a lymphatic endothelial cell origin of Kaposi's sarcoma tumor cells. Lab Invest 79, 243-251.
322
Westendorf, J. J., and Hiebert, S. W. (1999). Mammalian runt-domain proteins and their roles in hematopoiesis, osteogenesis, and leukemia. J Cell Biochem Suppl 32-33, 51-58.
Whitby, D., Howard, M. R., Tenant-Flowers, M., Brink, N. S., Copas, A., Boshoff, C., Hatzioannou, T., Suggett, F. E., Aldam, D. M., Denton, A. S., and et al. (1995). Detection of Kaposi sarcoma associated herpesvirus in peripheral blood of HIV-infected individuals and progression to Kaposi's sarcoma. Lancet 346, 799-802.
Whitby, D., Luppi, M., Barozzi, P., Boshoff, C., Weiss, R. A., and Torelli, G. (1998). Human herpesvirus 8 seroprevalence in blood donors and lymphoma patients from different regions of Italy. J Natl Cancer Inst 90, 395-397.
Whitby, D., Luppi, M., Sabin, C., Barozzi, P., Di Biase, A. R., Balli, F., Cucci, F., Weiss, R. A., Boshoff,C., and Torelli, G. (2000). Detection of antibodies to human herpesvirus 8 in Italian children: evidence for horizontal transmission. Br J Cancer 82, 702-704.
Whitby, D., Smith, N. A., Matthews, S., O'Shea, S., Sabin, C. A., Kulasegaram, R., Boshoff, C., Weiss, R. A., de Ruiter, A., and Best, J. M. (1999). Human herpesvirus 8: seroepidemiology among women and detection in the genital tract of seropositive women. J Infect Dis 179, 234-236.
Widmer, I., Wemli, M., Bachmann, F., Gudat, F., Cathomas, G., and Erb, P. (2002). Differential expression of viral Bcl-2 encoded by Kaposi's sarcoma-associated herpesvirus and human Bcl-2 in primary effusion lymphoma cells and Kaposi's sarcoma lesions. J Virol 76, 2551-2556.
Wiest, D. L., Burkhardt, J. K., Hester, S., Hortsch, M., Meyer, D. I., and Argon, Y. (1990). Membrane biogenesis during B cell differentiation: most endoplasmic reticulum proteins are expressed coordinately. J Cell Biol n o , 1501-1511.
Wilson, M., DeRisi, J., Kristensen, H. H., Imboden, P., Rane, S., Brown, P. O., and Schoolnik, G. K.(1999). Exploring drug-induced alterations in gene expression in Mycobacterium tuberculosis by microarray hybridization. Proc Natl Acad Sci U S A 96, 12833-12838.
Wodicka, L., Dong, H., Mittmann, M., Ho, M. H., and Lockhart, D. J. (1997). Genome-wide expression monitoring in Saccharomyces cerevisiae. Nat Biotechnol 15, 1359-1367.
Woisetschlaeger, M., Jin, X. W., Yandava, C. N., Furmanski, L. A., Strominger, J. L., and Speck, S. H.(1991). Role for the Epstein-Barr virus nuclear antigen 2 in viral promoter switching during initial stages of infection. Proc Natl Acad Sci U S A 88, 3942-3946.
Wolfmger, R. D., Gibson, G., Wolfinger, E. D., Bennett, L., Hamadeh, H., Bushel, P., Afshari, C., and Paules, R. S. (2001). Assessing gene significance from cDNA microarray expression data via mixed models. J Comput Biol 8, 625-637.
Wu, C. G., Salvay, D. M., Forgues, M., Valerie, K., Farnsworth, J., Markin, R. S., and Wang, X. W. (2001a). Distinctive gene expression profiles associated with Hepatitis B virus x protein. Oncogene 20, 3674-3682.
Wu, F. Y., Ahn, J. H., Alcendor, D. J., Jang, W. J., Xiao, J., Hayward, S. D., and Hayward, G. S. (2001b). Origin-independent assembly of Kaposi's sarcoma-associated herpesvirus DNA replication compartments in transient cotransfection assays and association with the 0RF-K8 protein and cellular PML. J Virol 75, 1487-1506.
Wu, F. Y., Tang, Q. Q., Chen, H., ApRhys, C., Farrell, C., Chen, J., Fujimuro, M., Lane, M. D., and Hayward, G. S. (2002). Lytic replication-associated protein (RAP) encoded by Kaposi sarcoma-associated herpesvirus causes p21CIP-1 -mediated G1 cell cycle arrest through CCAAT/enhancer-binding protein- alpha. Proc Natl Acad Sci U S A 99, 10683-10688.
Wu, L., Lo, P., Yu, X., Stoops, J. K., Forghani, B., and Zhou, Z. H. (2000). Three-dimensional structure of the human herpesvirus 8 capsid. J Virol 74, 9646-9654.
323
Wu, T. C., Mann, R. B., Charache, P., Hayward, S. D., Staal, S., Lambe, B. C., and Ambinder, R. F. (1990). Detection of EBV gene expression in Reed-Stemberg cells of Hodgkin's disease. Int J Cancer 46, 801-804.
Xu, X. R., Huang, J., Xu, Z. G., Qian, B. Z., Zhu, Z. D., Yan, Q., Cai, T., Zhang, X., Xiao, H. S., Qu, J., et a l (2001). Insight into hepatocellular carcinogenesis at transcriptome level by comparing gene expression profiles of hepatocellular carcinoma with those of corresponding noncancerous liver. Proc Natl Acad Sci U S A 98, 15089-15094.
Yang, T. Y., Chen, S. C., Leach, M. W., Manfra, D., Homey, B., Wiekowski, M., Sullivan, L., Jenh, C. H., Narula, S. K., Chensue, S. W., and Lira, S. A. (2000). Transgenic expression of the chemokine receptor encoded by human herpesvirus 8 induces an angioproliferative disease resembling Kaposi's sarcoma. J Exp Med 191, 445-454.
Yang, Y. H., Dudoit, S., Luu, P., Lin, D. M., Peng, V., Ngai, J., and Speed, T. P. (2002). Normalization for cDNA microarray data: a robust composite method addressing single and multiple slide systematic variation. Nucleic Acids Res 30, el5.
Yang, Y. H., and Speed, T. (2002). Design issues for cDNA microarray experiments. Nat Rev Genet 3, 579-588.
Yang, Y. L., Reis, L. F., Pavlovic, J., Aguzzi, A., Schafer, R., Kumar, A., Williams, B. R., Aguet, M., and Weissmann, C. (1995). Deficient signaling in mice devoid of double-stranded RNA-dependent protein kinase. Embo J 14, 6095-6106.
Yano, T., Sander, C. A., Clark, H. M., Dolezal, M. V., Jaffe, E. S., and Raffeld, M. (1993). Clustered mutations in the second exon of the MYC gene in sporadic Burkitt's lymphoma. Oncogene 8, 2741-2748.
Yao, Q. Y., Ogan, P., Rowe, M., Wood, M., and Rickinson, A. B. (1989). The Epstein-Barr virusihost balance in acute infectious mononucleosis patients receiving acyclovir anti-viral therapy. Int J Cancer 43, 61-66.
Yao, Q. Y., Rickinson, A. B., and Epstein, M. A. (1985). A re-examination of the Epstein-Barr virus carrier state in healthy seropositive individuals. Int J Cancer 35, 35-42.
Yates, J. L., Warren, N., and Sugden, B. (1985). Stable replication of plasmids derived from Epstein-Barr virus in various mammalian cells. Nature 313, 812-815.
Ye, B. H., Cattoretti, G., Shen, Q., Zhang, J., Hawe, N., de Waard, R., Leung, C., Nouri-Shirazi, M., Orazi, A., Chaganti, R. S., et a l (1997). The BCL-6 proto-oncogene controls germinal-centre formation and Th2- type inflammation. Nat Genet 16, 161-170.
Ye, B. H., Chaganti, S., Chang, C. C., Niu, H., Corradini, P., Chaganti, R. S., and Dalla-Favera, R. (1995). Chromosomal translocations cause deregulated BCL6 expression by promoter substitution in B cell lymphoma. Embo 114, 6209-6217.
Ye, B. H., Rao, P. H., Chaganti, R. S., and Dalla-Favera, R. (1993). Cloning of bcl-6, the locus involved in chromosome translocations affecting band 3q27 in B-cell lymphoma. Cancer Res 53, 2732-2735.
Ye, J., Rawson, R. B., Komuro, R., Chen, X., Dave, U. P., Prywes, R., Brown, M. S., and Goldstein, J. L.(2000). ER stress induces cleavage of membrane-bound ATF6 by the same proteases that process SREBPs. Mol Cell 6, 1355-1364.
Yeoh, E. J., Ross, M. E., Shurtleff, S. A., Williams, W. K., Patel, D., Mahfouz, R., Behm, F. G., Raimondi, S. C., Relling, M. V., Patel, A., et a l (2002). Classification, subtype discovery, and prediction of outcome in pediatric acute lymphoblastic leukemia by gene expression profiling. Cancer Cell 1, 133-143.
Yoshida, H., Haze, K., Yanagi, H., Yura, T., and Mori, K. (1998). Identification of the cis-acting endoplasmic reticulum stress response element responsible for transcriptional induction of mammalian glucose-regulated proteins. Involvement of basic leucine zipper transcription factors. J Biol Chem 273, 33741-33749.
324
Yoshida, H., Matsui, T., Yamamoto, A., Okada, T., and Mori, K. (2001). XBPl mRNA is induced by ATF6 and spliced by IREl in response to ER stress to produce a highly active transcription factor. Cell 107, 881-891.
Yoshida, H., Okada, T., Haze, K., Yanagi, H., Yura, T., Negishi, M., and Mori, K. (2000). ATF6 activated by proteolysis binds in the presence of NF-Y (CBF) directly to the cis-acting element responsible for the mammalian unfolded protein response. Mol Cell Biol 20, 6755-6767.
Young, L., Alfieri, C., Hennessy, K., Evans, H., O'Hara, C., Anderson, K. C., Ritz, J., Shapiro, R. S., Rickinson, A., Kieff, E., and et al. (1989). Expression of Epstein-Barr virus transformation-associated genes in tissues of patients with EBV lymphoproliferative disease. N Engl J Med 321, 1080-1085.
Young, R. A. (2000). Biomedical discovery with DNA arrays. Cell 102, 9-15.
Yu, B. D., Hanson, R. D., Hess, J. L., Homing, S. E., and Korsmeyer, S. J. (1998). MLL, a mammalian trithorax-group gene, functions as a transcriptional maintenance factor in morphogenesis. Proc Natl Acad Sc i US A 95, 10632-10636.
Zahger, D., Lotan, C., Admon, D., Klapholz, L., Kaufman, B., Shimon, D., Woolfson, N., and Gotsman, M. S. (1993). Very early appearance of Kaposi's sarcoma after cardiac transplantation in Sephardic Jews. Am Heart J 726, 999-1000.
Zech, L., Haglund, U., Nilsson, K., and Klein, G. (1976). Characteristic chromosomal abnormalities in biopsies and lymphoid-cell lines from patients with Burkitt and non-Burkitt lymphomas. Int J Cancer 77, 47-56.
Zelenetz, A. D., Chen, T. T., and Levy, R. (1992). Clonal expansion in follicular lymphoma occurs subsequent to antigenic selection. J Exp Med 776, 1137-1148.
Zhan, F., Hardin, J., Kordsmeier, B., Bumm, K., Zheng, M., Tian, E., Sanderson, R., Yang, Y., Wilson, C., Zangari, M., et al. (2002). Global gene expression profiling of multiple myeloma, monoclonal gammopathy of undetermined significance, and normal bone marrow plasma cells. Blood 99, 1745-1757.
Zhang, L., Chiu, J., and Lin, J. C. (1998). Activation of human herpesvirus 8 (HHV-8) thymidine kinase (TK) TATAA-less promoter by HHV-8 ORF50 gene product is SPl dependent. DNA Cell Biol 77, 735- 742.
Zhang, L., Zhou, W., Velculescu, V. E., Kern, S. E., Hruban, R. H., Hamilton, S. R., Vogelstein, B., and Kinzler, K. W. (1997). Gene expression profiles in normal and cancer cells. Science 276, 1268-1272.
Zhang, X., Li, L., Jung, J., Xiang, S., Hollmann, C., and Choi, Y. S. (2001a). The distinct roles of T cell- derived cytokines and a novel follicular dendritic cell-signaling molecule 8D6 in germinal center-B cell differentiation. J Immunol 767, 49-56.
Zhang, Y., Luxon, B. A., Casola, A., Garofalo, R. P., Jamaluddin, M., and Brasier, A. R. (2001b). Expression of respiratory syncytial virus-induced chemokine gene networks in lower airway epithelial cells revealed by cDNA microarrays. J Virol 75, 9044-9058.
Zhao, B., and Sample, C. E. (2000). Epstein-barr virus nuclear antigen 3C activates the latent membrane protein 1 promoter in the presence of Epstein-Barr virus nuclear antigen 2 through sequences encompassing an spi-l/Spi-B binding site. J Virol 74, 5151-5160.
Zhong, W., and Ganem, D. (1997). Characterization of ribonucleoprotein complexes containing an abundant polyadenylated nuclear RNA encoded by Kaposi's sarcoma-associated herpesvirus (human herpesvirus 8). J Virol 77, 1207-1212.
Zhong, W., Wang, H., Hemdier, B., and Ganem, D. (1996). Restricted expression of Kaposi sarcoma- associated herpesvirus (human herpesvirus 8) genes in Kaposi sarcoma. Proc Natl Acad Sci U S A 93, 6641-6646.
Zhou, Z. H., Chen, D. H., Jakana, J., Rixon, F. J., and Chiu, W. (1999). Visualization of tegument-capsid interactions and DNA in intact herpes simplex virus type 1 virions. J Virol 73, 3210-3218.
325
Zhu, F. X., Cusano, T., and Yuan, Y. (1999a). Identification of the immediate-early transcripts of Kaposi's sarcoma-associated herpesvirus. J Virol 73, 5556-5567.
Zhu, F. X., King, S. M., Smith, E. J., Levy, D. E., and Yuan, Y. (2002a). A Kaposi's sarcoma-associated herpesviral protein inhibits virus-mediated induction of type I interferon by blocking IRF-7 phosphorylation and nuclear accumulation. Proc Natl Acad Sci U S A 99, 5573-5578.
Zhu, H., Cong, J. P., Mamtora, G., Gingeras, T., and Shenk, T. (1998). Cellular gene expression altered by human cytomegalovirus: global monitoring with oligonucleotide arrays. Proc Natl Acad Sci U S A 95, 14470-14475.
Zhu, H., Cong, J. P., Yu, D., Bresnahan, W. A., and Shenk, T. E. (2002b). Inhibition of cyclooxygenase 2 blocks human cytomegalovirus replication. Proc Natl Acad Sci U S A 99, 3932-3937.
Zhu, L., Puri, V., and Chandran, B. (1999b). Characterization of human herpesvirus-8 K8.1A/B glycoproteins by monoclonal antibodies. Virology 262, 237-249.
Zhuang, Y., Soriano, P., and Weintraub, H. (1994). The helix-loop-helix gene E2A is required for B cell formation. Cell 79, 875-884.
Ziegler, J. L., and Katongole-Mbidde, E. (1996). Kaposi's sarcoma in childhood: an analysis of 100 cases from Uganda and relationship to HIV infection. Int J Cancer 65, 200-203.
Zimber-Strobl, U., Kremmer, E., Grasser, F., Marschall, G., Laux, G., and Bomkamm, G. W. (1993). The Epstein-Barr virus nuclear antigen 2 interacts with an EBNA2 responsive cis-element of the terminal protein 1 gene promoter. Embo J 12, 167-175.
Zimring, J. C., Goodboum, S., and Offermann, M. K. (1998). Human herpesvirus 8 encodes an interferon regulatory factor (IRE) homolog that represses IRF-1-mediated transcription. J Virol 72, 701-707.
Zisbrod, Z., Haimov, M., Schanzer, H., Ambinder, E., and Burrows, L. (1980). Kaposi's sarcoma after kidney transplantation. Report of complete remission of cutaneous and visceral involvement. Transplantation 30, 383-384.
Zoeteweij, J. P., Eyes, S. T., Orenstein, J. M., Kawamura, T., Wu, L., Chandran, B., Forghani, B., and Blauvelt, A. (1999). Identification and rapid quantification of early- and late-lytic human herpesvirus 8 infection in single cells by flow cytometric analysis: characterization of antiherpesvirus agents. J Virol 73, 5894-5902.
Zong, J. C., Ciufo, D. M., Alcendor, D. J., Wan, X., Nicholas, J., Browning, P. J., Rady, P. L., Tyring, S. K., Orenstein, J. M., Rabkin, C. S., et al. (1999a). High-level variability in the ORF-Kl membrane protein gene at the left end of the Kaposi's sarcoma-associated herpesvirus genome defines four major virus subtypes and multiple variants or clades in different human populations. J Virol 73, 4156-4170.
Zong, Q., Schummer, M., Hood, L., and Morris, D. R. (1999b). Messenger RNA translation state: the second dimension of high-throughput expression screening. Proc Natl Acad Sci U S A 96, 10632-10636.
326


