Embed Size (px)
Citation preview
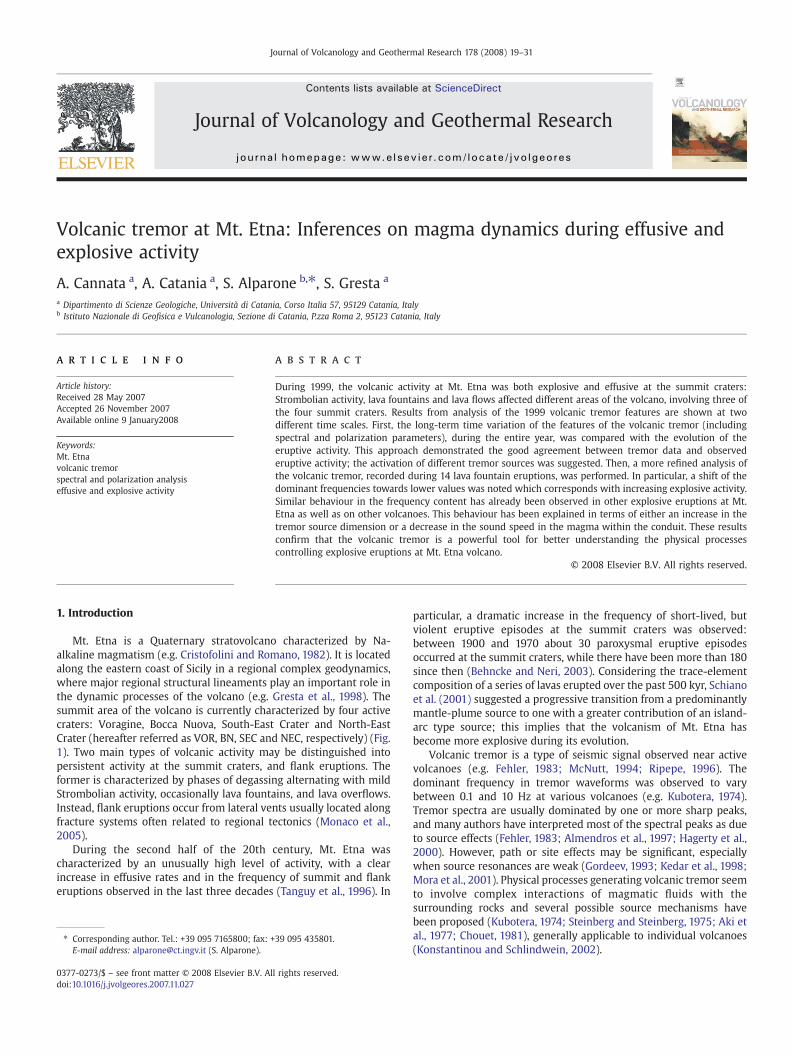
Journal of Volcanology and Geothermal Research 178 (2008) 19–31
Contents lists available at ScienceDirect
Journal of Volcanology and Geothermal Research
j ourna l homepage: www.e lsev ie r.com/ locate / jvo lgeores
Volcanic tremor at Mt. Etna: Inferences on magma dynamics during effusive andexplosive activity
A. Cannata a, A. Catania a, S. Alparone b,⁎, S. Gresta a
a Dipartimento di Scienze Geologiche, Università di Catania, Corso Italia 57, 95129 Catania, Italyb Istituto Nazionale di Geofisica e Vulcanologia, Sezione di Catania, P.zza Roma 2, 95123 Catania, Italy
⁎ Corresponding author. Tel.: +39 095 7165800; fax: +E-mail address: [email protected] (S. Alparone).
0377-0273/$ – see front matter © 2008 Elsevier B.V. Aldoi:10.1016/j.jvolgeores.2007.11.027
a b s t r a c t
a r t i c l e i n f oArticle history:
During 1999, the volcanic Received 28 May 2007Accepted 26 November 2007Available online 9 January2008Keywords:Mt. Etnavolcanic tremorspectral and polarization analysiseffusive and explosive activity
activity at Mt. Etna was both explosive and effusive at the summit craters:Strombolian activity, lava fountains and lava flows affected different areas of the volcano, involving three ofthe four summit craters. Results from analysis of the 1999 volcanic tremor features are shown at twodifferent time scales. First, the long-term time variation of the features of the volcanic tremor (includingspectral and polarization parameters), during the entire year, was compared with the evolution of theeruptive activity. This approach demonstrated the good agreement between tremor data and observederuptive activity; the activation of different tremor sources was suggested. Then, a more refined analysis ofthe volcanic tremor, recorded during 14 lava fountain eruptions, was performed. In particular, a shift of thedominant frequencies towards lower values was noted which corresponds with increasing explosive activity.Similar behaviour in the frequency content has already been observed in other explosive eruptions at Mt.Etna as well as on other volcanoes. This behaviour has been explained in terms of either an increase in thetremor source dimension or a decrease in the sound speed in the magma within the conduit. These resultsconfirm that the volcanic tremor is a powerful tool for better understanding the physical processescontrolling explosive eruptions at Mt. Etna volcano.
© 2008 Elsevier B.V. All rights reserved.
1. Introduction
Mt. Etna is a Quaternary stratovolcano characterized by Na-alkaline magmatism (e.g. Cristofolini and Romano, 1982). It is locatedalong the eastern coast of Sicily in a regional complex geodynamics,where major regional structural lineaments play an important role inthe dynamic processes of the volcano (e.g. Gresta et al., 1998). Thesummit area of the volcano is currently characterized by four activecraters: Voragine, Bocca Nuova, South-East Crater and North-EastCrater (hereafter referred as VOR, BN, SEC and NEC, respectively) (Fig.1). Two main types of volcanic activity may be distinguished intopersistent activity at the summit craters, and flank eruptions. Theformer is characterized by phases of degassing alternating with mildStrombolian activity, occasionally lava fountains, and lava overflows.Instead, flank eruptions occur from lateral vents usually located alongfracture systems often related to regional tectonics (Monaco et al.,2005).
During the second half of the 20th century, Mt. Etna wascharacterized by an unusually high level of activity, with a clearincrease in effusive rates and in the frequency of summit and flankeruptions observed in the last three decades (Tanguy et al., 1996). In
39 095 435801.
l rights reserved.
particular, a dramatic increase in the frequency of short-lived, butviolent eruptive episodes at the summit craters was observed:between 1900 and 1970 about 30 paroxysmal eruptive episodesoccurred at the summit craters, while there have been more than 180since then (Behncke and Neri, 2003). Considering the trace-elementcomposition of a series of lavas erupted over the past 500 kyr, Schianoet al. (2001) suggested a progressive transition from a predominantlymantle-plume source to one with a greater contribution of an island-arc type source; this implies that the volcanism of Mt. Etna hasbecome more explosive during its evolution.
Volcanic tremor is a type of seismic signal observed near activevolcanoes (e.g. Fehler, 1983; McNutt, 1994; Ripepe, 1996). Thedominant frequency in tremor waveforms was observed to varybetween 0.1 and 10 Hz at various volcanoes (e.g. Kubotera, 1974).Tremor spectra are usually dominated by one or more sharp peaks,and many authors have interpreted most of the spectral peaks as dueto source effects (Fehler, 1983; Almendros et al., 1997; Hagerty et al.,2000). However, path or site effects may be significant, especiallywhen source resonances are weak (Gordeev, 1993; Kedar et al., 1998;Mora et al., 2001). Physical processes generating volcanic tremor seemto involve complex interactions of magmatic fluids with thesurrounding rocks and several possible source mechanisms havebeen proposed (Kubotera, 1974; Steinberg and Steinberg, 1975; Aki etal., 1977; Chouet, 1981), generally applicable to individual volcanoes(Konstantinou and Schlindwein, 2002).
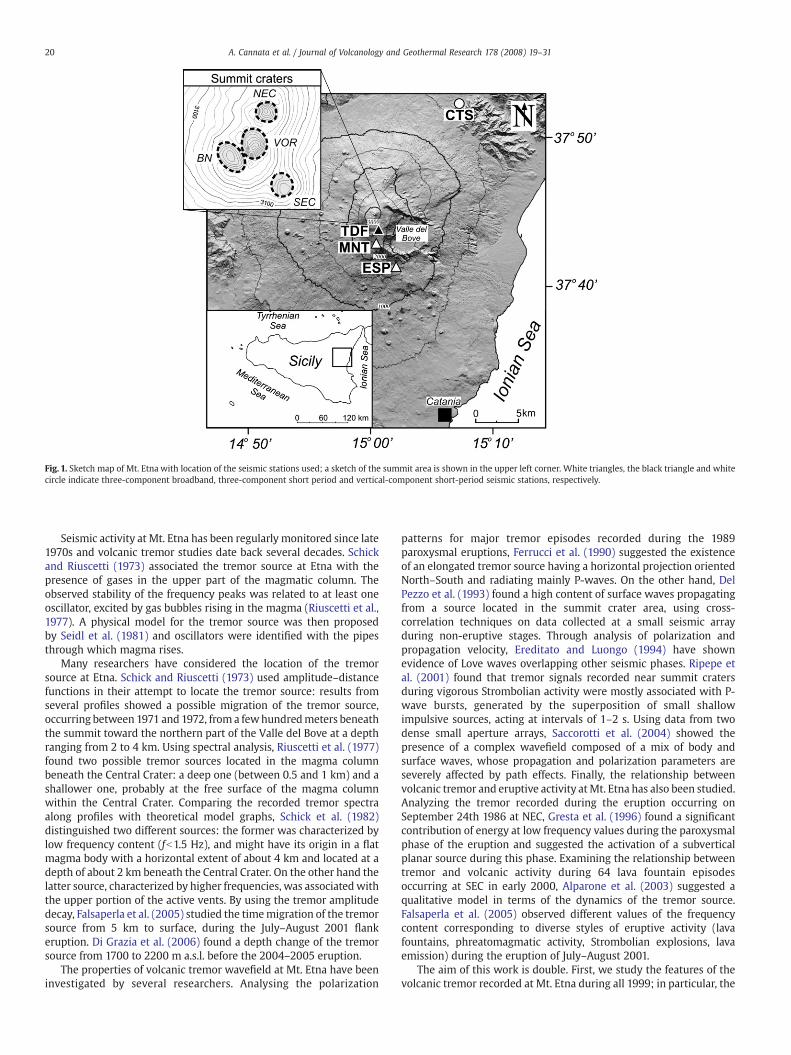
Fig. 1. Sketch map of Mt. Etna with location of the seismic stations used; a sketch of the summit area is shown in the upper left corner. White triangles, the black triangle and whitecircle indicate three-component broadband, three-component short period and vertical-component short-period seismic stations, respectively.
20 A. Cannata et al. / Journal of Volcanology and Geothermal Research 178 (2008) 19–31
Seismic activity at Mt. Etna has been regularly monitored since late1970s and volcanic tremor studies date back several decades. Schickand Riuscetti (1973) associated the tremor source at Etna with thepresence of gases in the upper part of the magmatic column. Theobserved stability of the frequency peaks was related to at least oneoscillator, excited by gas bubbles rising in the magma (Riuscetti et al.,1977). A physical model for the tremor source was then proposedby Seidl et al. (1981) and oscillators were identified with the pipesthrough which magma rises.
Many researchers have considered the location of the tremorsource at Etna. Schick and Riuscetti (1973) used amplitude–distancefunctions in their attempt to locate the tremor source: results fromseveral profiles showed a possible migration of the tremor source,occurring between 1971 and 1972, from a fewhundredmeters beneaththe summit toward the northern part of the Valle del Bove at a depthranging from 2 to 4 km. Using spectral analysis, Riuscetti et al. (1977)found two possible tremor sources located in the magma columnbeneath the Central Crater: a deep one (between 0.5 and 1 km) and ashallower one, probably at the free surface of the magma columnwithin the Central Crater. Comparing the recorded tremor spectraalong profiles with theoretical model graphs, Schick et al. (1982)distinguished two different sources: the former was characterized bylow frequency content (fb1.5 Hz), and might have its origin in a flatmagma body with a horizontal extent of about 4 km and located at adepth of about 2 km beneath the Central Crater. On the other hand thelatter source, characterized by higher frequencies, was associated withthe upper portion of the active vents. By using the tremor amplitudedecay, Falsaperla et al. (2005) studied the timemigration of the tremorsource from 5 km to surface, during the July–August 2001 flankeruption. Di Grazia et al. (2006) found a depth change of the tremorsource from 1700 to 2200 m a.s.l. before the 2004–2005 eruption.
The properties of volcanic tremor wavefield at Mt. Etna have beeninvestigated by several researchers. Analysing the polarization
patterns for major tremor episodes recorded during the 1989paroxysmal eruptions, Ferrucci et al. (1990) suggested the existenceof an elongated tremor source having a horizontal projection orientedNorth–South and radiating mainly P-waves. On the other hand, DelPezzo et al. (1993) found a high content of surface waves propagatingfrom a source located in the summit crater area, using cross-correlation techniques on data collected at a small seismic arrayduring non-eruptive stages. Through analysis of polarization andpropagation velocity, Ereditato and Luongo (1994) have shownevidence of Love waves overlapping other seismic phases. Ripepe etal. (2001) found that tremor signals recorded near summit cratersduring vigorous Strombolian activity were mostly associated with P-wave bursts, generated by the superposition of small shallowimpulsive sources, acting at intervals of 1–2 s. Using data from twodense small aperture arrays, Saccorotti et al. (2004) showed thepresence of a complex wavefield composed of a mix of body andsurface waves, whose propagation and polarization parameters areseverely affected by path effects. Finally, the relationship betweenvolcanic tremor and eruptive activity atMt. Etna has also been studied.Analyzing the tremor recorded during the eruption occurring onSeptember 24th 1986 at NEC, Gresta et al. (1996) found a significantcontribution of energy at low frequency values during the paroxysmalphase of the eruption and suggested the activation of a subverticalplanar source during this phase. Examining the relationship betweentremor and volcanic activity during 64 lava fountain episodesoccurring at SEC in early 2000, Alparone et al. (2003) suggested aqualitative model in terms of the dynamics of the tremor source.Falsaperla et al. (2005) observed different values of the frequencycontent corresponding to diverse styles of eruptive activity (lavafountains, phreatomagmatic activity, Strombolian explosions, lavaemission) during the eruption of July–August 2001.
The aim of this work is double. First, we study the features of thevolcanic tremor recorded at Mt. Etna during all 1999; in particular, the
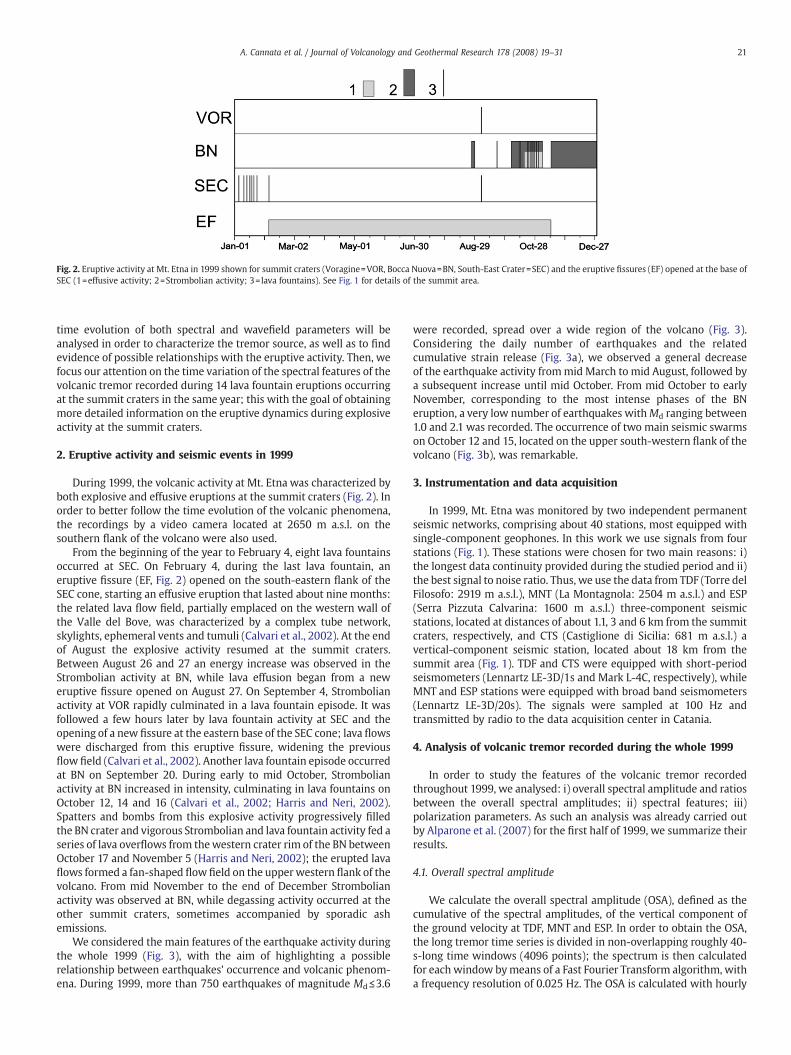
Fig. 2. Eruptive activity at Mt. Etna in 1999 shown for summit craters (Voragine=VOR, Bocca Nuova=BN, South-East Crater=SEC) and the eruptive fissures (EF) opened at the base ofSEC (1=effusive activity; 2=Strombolian activity; 3=lava fountains). See Fig. 1 for details of the summit area.
21A. Cannata et al. / Journal of Volcanology and Geothermal Research 178 (2008) 19–31
time evolution of both spectral and wavefield parameters will beanalysed in order to characterize the tremor source, as well as to findevidence of possible relationships with the eruptive activity. Then, wefocus our attention on the time variation of the spectral features of thevolcanic tremor recorded during 14 lava fountain eruptions occurringat the summit craters in the same year; this with the goal of obtainingmore detailed information on the eruptive dynamics during explosiveactivity at the summit craters.
2. Eruptive activity and seismic events in 1999
During 1999, the volcanic activity at Mt. Etna was characterized byboth explosive and effusive eruptions at the summit craters (Fig. 2). Inorder to better follow the time evolution of the volcanic phenomena,the recordings by a video camera located at 2650 m a.s.l. on thesouthern flank of the volcano were also used.
From the beginning of the year to February 4, eight lava fountainsoccurred at SEC. On February 4, during the last lava fountain, aneruptive fissure (EF, Fig. 2) opened on the south-eastern flank of theSEC cone, starting an effusive eruption that lasted about nine months:the related lava flow field, partially emplaced on the western wall ofthe Valle del Bove, was characterized by a complex tube network,skylights, ephemeral vents and tumuli (Calvari et al., 2002). At the endof August the explosive activity resumed at the summit craters.Between August 26 and 27 an energy increase was observed in theStrombolian activity at BN, while lava effusion began from a neweruptive fissure opened on August 27. On September 4, Strombolianactivity at VOR rapidly culminated in a lava fountain episode. It wasfollowed a few hours later by lava fountain activity at SEC and theopening of a new fissure at the eastern base of the SEC cone; lava flowswere discharged from this eruptive fissure, widening the previousflow field (Calvari et al., 2002). Another lava fountain episode occurredat BN on September 20. During early to mid October, Strombolianactivity at BN increased in intensity, culminating in lava fountains onOctober 12, 14 and 16 (Calvari et al., 2002; Harris and Neri, 2002).Spatters and bombs from this explosive activity progressively filledthe BN crater and vigorous Strombolian and lava fountain activity fed aseries of lava overflows from thewestern crater rim of the BN betweenOctober 17 and November 5 (Harris and Neri, 2002); the erupted lavaflows formed a fan-shaped flow field on the upperwestern flank of thevolcano. From mid November to the end of December Strombolianactivity was observed at BN, while degassing activity occurred at theother summit craters, sometimes accompanied by sporadic ashemissions.
We considered the main features of the earthquake activity duringthe whole 1999 (Fig. 3), with the aim of highlighting a possiblerelationship between earthquakes' occurrence and volcanic phenom-ena. During 1999, more than 750 earthquakes of magnitude Md≤3.6
were recorded, spread over a wide region of the volcano (Fig. 3).Considering the daily number of earthquakes and the relatedcumulative strain release (Fig. 3a), we observed a general decreaseof the earthquake activity frommid March to mid August, followed bya subsequent increase until mid October. From mid October to earlyNovember, corresponding to the most intense phases of the BNeruption, a very low number of earthquakes withMd ranging between1.0 and 2.1 was recorded. The occurrence of two main seismic swarmson October 12 and 15, located on the upper south-western flank of thevolcano (Fig. 3b), was remarkable.
3. Instrumentation and data acquisition
In 1999, Mt. Etna was monitored by two independent permanentseismic networks, comprising about 40 stations, most equipped withsingle-component geophones. In this work we use signals from fourstations (Fig. 1). These stations were chosen for two main reasons: i)the longest data continuity provided during the studied period and ii)the best signal to noise ratio. Thus, we use the data from TDF (Torre delFilosofo: 2919 m a.s.l.), MNT (La Montagnola: 2504 m a.s.l.) and ESP(Serra Pizzuta Calvarina: 1600 m a.s.l.) three-component seismicstations, located at distances of about 1.1, 3 and 6 km from the summitcraters, respectively, and CTS (Castiglione di Sicilia: 681 m a.s.l.) avertical-component seismic station, located about 18 km from thesummit area (Fig. 1). TDF and CTS were equipped with short-periodseismometers (Lennartz LE-3D/1s and Mark L-4C, respectively), whileMNT and ESP stations were equipped with broad band seismometers(Lennartz LE-3D/20s). The signals were sampled at 100 Hz andtransmitted by radio to the data acquisition center in Catania.
4. Analysis of volcanic tremor recorded during the whole 1999
In order to study the features of the volcanic tremor recordedthroughout 1999, we analysed: i) overall spectral amplitude and ratiosbetween the overall spectral amplitudes; ii) spectral features; iii)polarization parameters. As such an analysis was already carried outby Alparone et al. (2007) for the first half of 1999, we summarize theirresults.
4.1. Overall spectral amplitude
We calculate the overall spectral amplitude (OSA), defined as thecumulative of the spectral amplitudes, of the vertical component ofthe ground velocity at TDF, MNT and ESP. In order to obtain the OSA,the long tremor time series is divided in non-overlapping roughly 40-s-long time windows (4096 points); the spectrum is then calculatedfor each window bymeans of a Fast Fourier Transform algorithm, witha frequency resolution of 0.025 Hz. The OSA is calculated with hourly
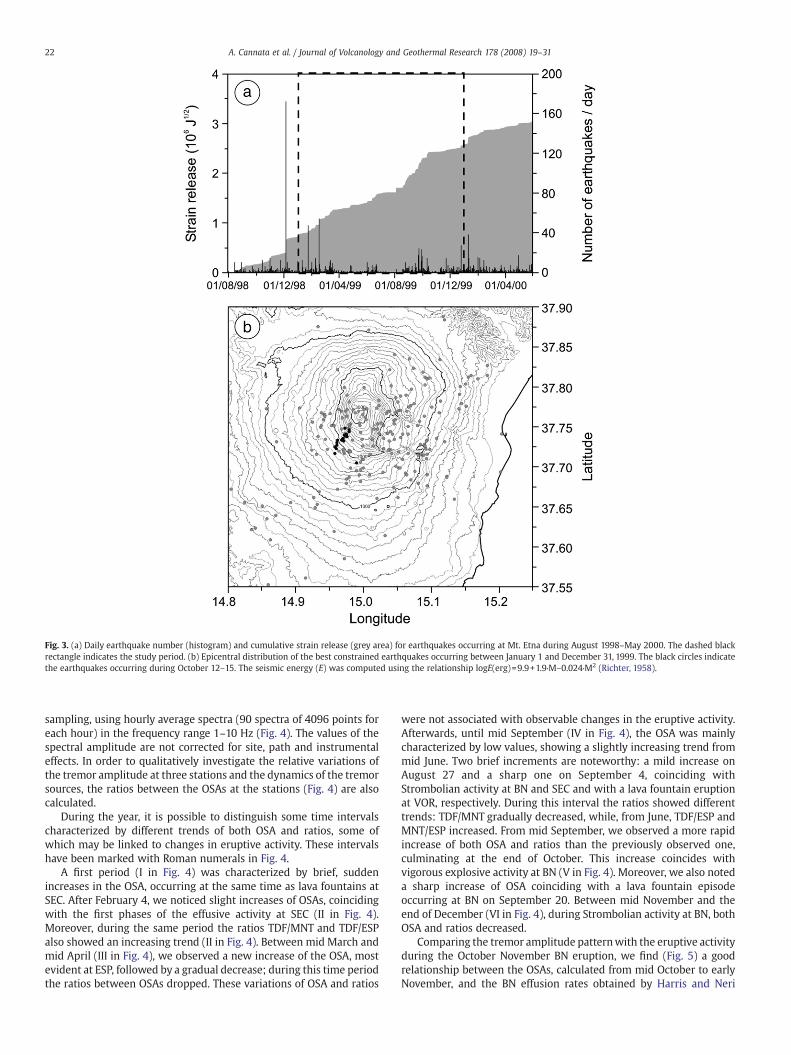
Fig. 3. (a) Daily earthquake number (histogram) and cumulative strain release (grey area) for earthquakes occurring at Mt. Etna during August 1998–May 2000. The dashed blackrectangle indicates the study period. (b) Epicentral distribution of the best constrained earthquakes occurring between January 1 and December 31, 1999. The black circles indicatethe earthquakes occurring during October 12–15. The seismic energy (E) was computed using the relationship logE(erg)=9.9+1.9·M–0.024·M2 (Richter, 1958).
22 A. Cannata et al. / Journal of Volcanology and Geothermal Research 178 (2008) 19–31
sampling, using hourly average spectra (90 spectra of 4096 points foreach hour) in the frequency range 1–10 Hz (Fig. 4). The values of thespectral amplitude are not corrected for site, path and instrumentaleffects. In order to qualitatively investigate the relative variations ofthe tremor amplitude at three stations and the dynamics of the tremorsources, the ratios between the OSAs at the stations (Fig. 4) are alsocalculated.
During the year, it is possible to distinguish some time intervalscharacterized by different trends of both OSA and ratios, some ofwhich may be linked to changes in eruptive activity. These intervalshave been marked with Roman numerals in Fig. 4.
A first period (I in Fig. 4) was characterized by brief, suddenincreases in the OSA, occurring at the same time as lava fountains atSEC. After February 4, we noticed slight increases of OSAs, coincidingwith the first phases of the effusive activity at SEC (II in Fig. 4).Moreover, during the same period the ratios TDF/MNT and TDF/ESPalso showed an increasing trend (II in Fig. 4). Between mid March andmid April (III in Fig. 4), we observed a new increase of the OSA, mostevident at ESP, followed by a gradual decrease; during this time periodthe ratios between OSAs dropped. These variations of OSA and ratios
were not associated with observable changes in the eruptive activity.Afterwards, until mid September (IV in Fig. 4), the OSA was mainlycharacterized by low values, showing a slightly increasing trend frommid June. Two brief increments are noteworthy: a mild increase onAugust 27 and a sharp one on September 4, coinciding withStrombolian activity at BN and SEC and with a lava fountain eruptionat VOR, respectively. During this interval the ratios showed differenttrends: TDF/MNT gradually decreased, while, from June, TDF/ESP andMNT/ESP increased. From mid September, we observed a more rapidincrease of both OSA and ratios than the previously observed one,culminating at the end of October. This increase coincides withvigorous explosive activity at BN (V in Fig. 4). Moreover, we also noteda sharp increase of OSA coinciding with a lava fountain episodeoccurring at BN on September 20. Between mid November and theend of December (VI in Fig. 4), during Strombolian activity at BN, bothOSA and ratios decreased.
Comparing the tremor amplitude patternwith the eruptive activityduring the October November BN eruption, we find (Fig. 5) a goodrelationship between the OSAs, calculated from mid October to earlyNovember, and the BN effusion rates obtained by Harris and Neri
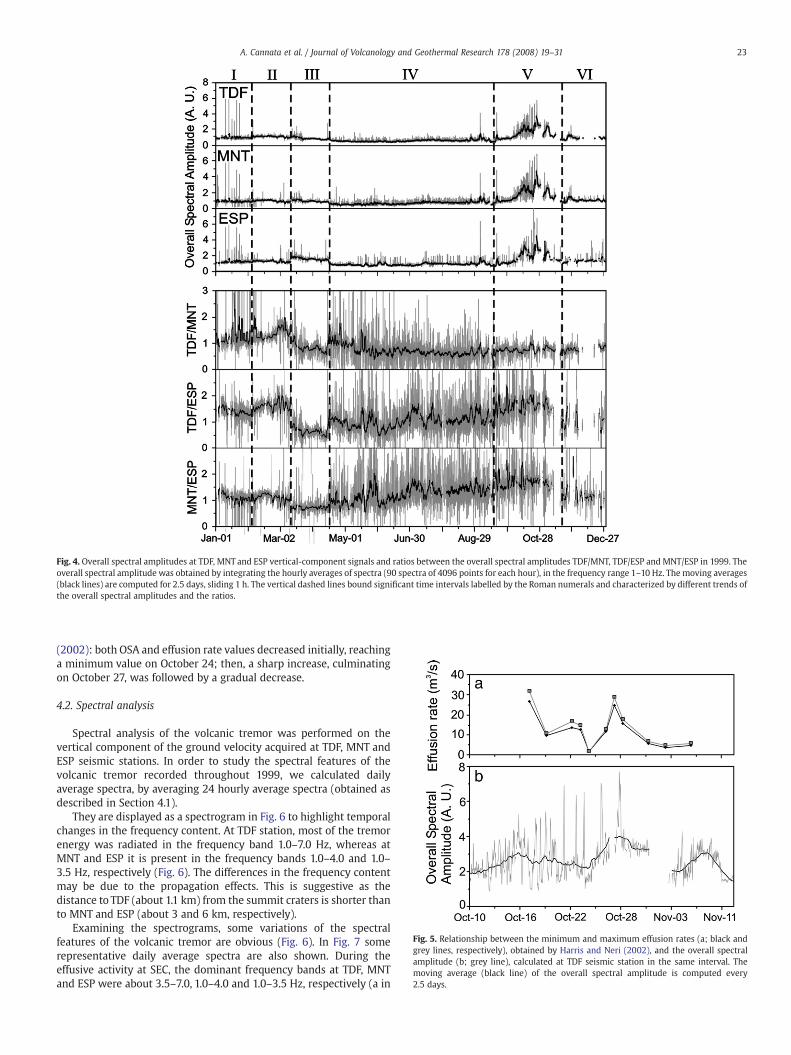
Fig. 5. Relationship between the minimum and maximum effusion rates (a; black andgrey lines, respectively), obtained by Harris and Neri (2002), and the overall spectralamplitude (b; grey line), calculated at TDF seismic station in the same interval. Themoving average (black line) of the overall spectral amplitude is computed every2.5 days.
Fig. 4. Overall spectral amplitudes at TDF, MNT and ESP vertical-component signals and ratios between the overall spectral amplitudes TDF/MNT, TDF/ESP and MNT/ESP in 1999. Theoverall spectral amplitude was obtained by integrating the hourly averages of spectra (90 spectra of 4096 points for each hour), in the frequency range 1–10 Hz. The moving averages(black lines) are computed for 2.5 days, sliding 1 h. The vertical dashed lines bound significant time intervals labelled by the Roman numerals and characterized by different trends ofthe overall spectral amplitudes and the ratios.
23A. Cannata et al. / Journal of Volcanology and Geothermal Research 178 (2008) 19–31
(2002): both OSA and effusion rate values decreased initially, reachinga minimum value on October 24; then, a sharp increase, culminatingon October 27, was followed by a gradual decrease.
4.2. Spectral analysis
Spectral analysis of the volcanic tremor was performed on thevertical component of the ground velocity acquired at TDF, MNT andESP seismic stations. In order to study the spectral features of thevolcanic tremor recorded throughout 1999, we calculated dailyaverage spectra, by averaging 24 hourly average spectra (obtained asdescribed in Section 4.1).
They are displayed as a spectrogram in Fig. 6 to highlight temporalchanges in the frequency content. At TDF station, most of the tremorenergy was radiated in the frequency band 1.0–7.0 Hz, whereas atMNT and ESP it is present in the frequency bands 1.0–4.0 and 1.0–3.5 Hz, respectively (Fig. 6). The differences in the frequency contentmay be due to the propagation effects. This is suggestive as thedistance to TDF (about 1.1 km) from the summit craters is shorter thanto MNT and ESP (about 3 and 6 km, respectively).
Examining the spectrograms, some variations of the spectralfeatures of the volcanic tremor are obvious (Fig. 6). In Fig. 7 somerepresentative daily average spectra are also shown. During theeffusive activity at SEC, the dominant frequency bands at TDF, MNTand ESP were about 3.5–7.0, 1.0–4.0 and 1.0–3.5 Hz, respectively (a in
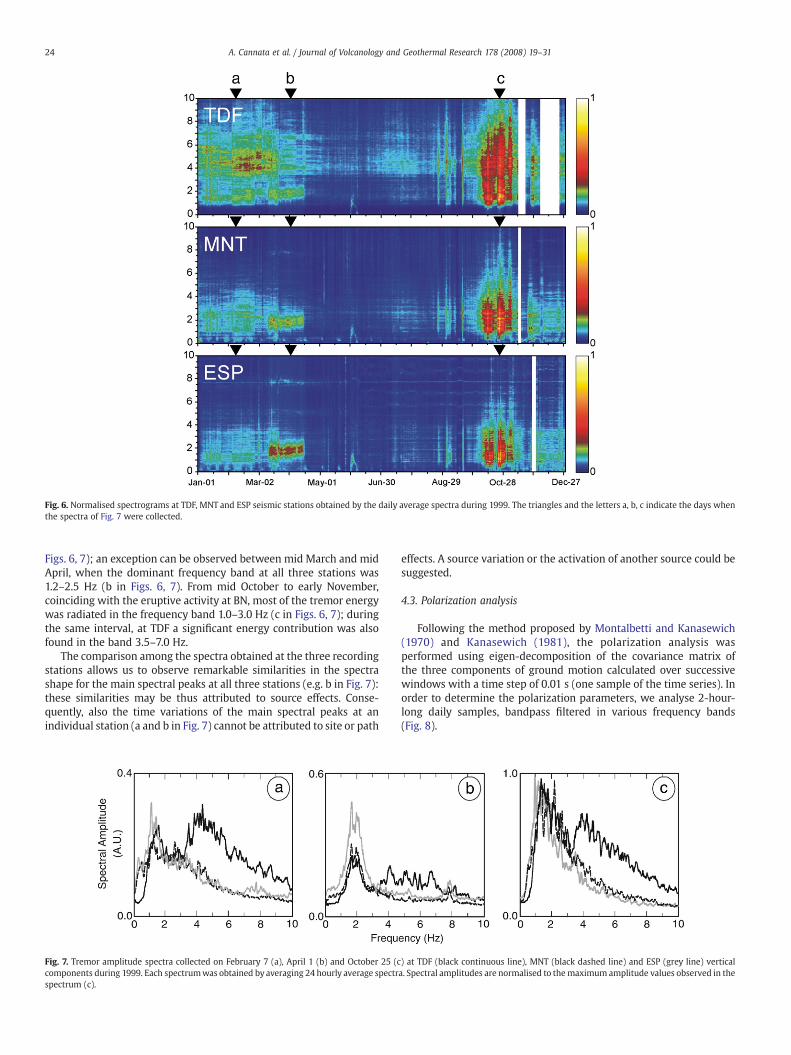
Fig. 6. Normalised spectrograms at TDF, MNT and ESP seismic stations obtained by the daily average spectra during 1999. The triangles and the letters a, b, c indicate the days whenthe spectra of Fig. 7 were collected.
24 A. Cannata et al. / Journal of Volcanology and Geothermal Research 178 (2008) 19–31
Figs. 6, 7); an exception can be observed between mid March and midApril, when the dominant frequency band at all three stations was1.2–2.5 Hz (b in Figs. 6, 7). From mid October to early November,coinciding with the eruptive activity at BN, most of the tremor energywas radiated in the frequency band 1.0–3.0 Hz (c in Figs. 6, 7); duringthe same interval, at TDF a significant energy contribution was alsofound in the band 3.5–7.0 Hz.
The comparison among the spectra obtained at the three recordingstations allows us to observe remarkable similarities in the spectrashape for the main spectral peaks at all three stations (e.g. b in Fig. 7):these similarities may be thus attributed to source effects. Conse-quently, also the time variations of the main spectral peaks at anindividual station (a and b in Fig. 7) cannot be attributed to site or path
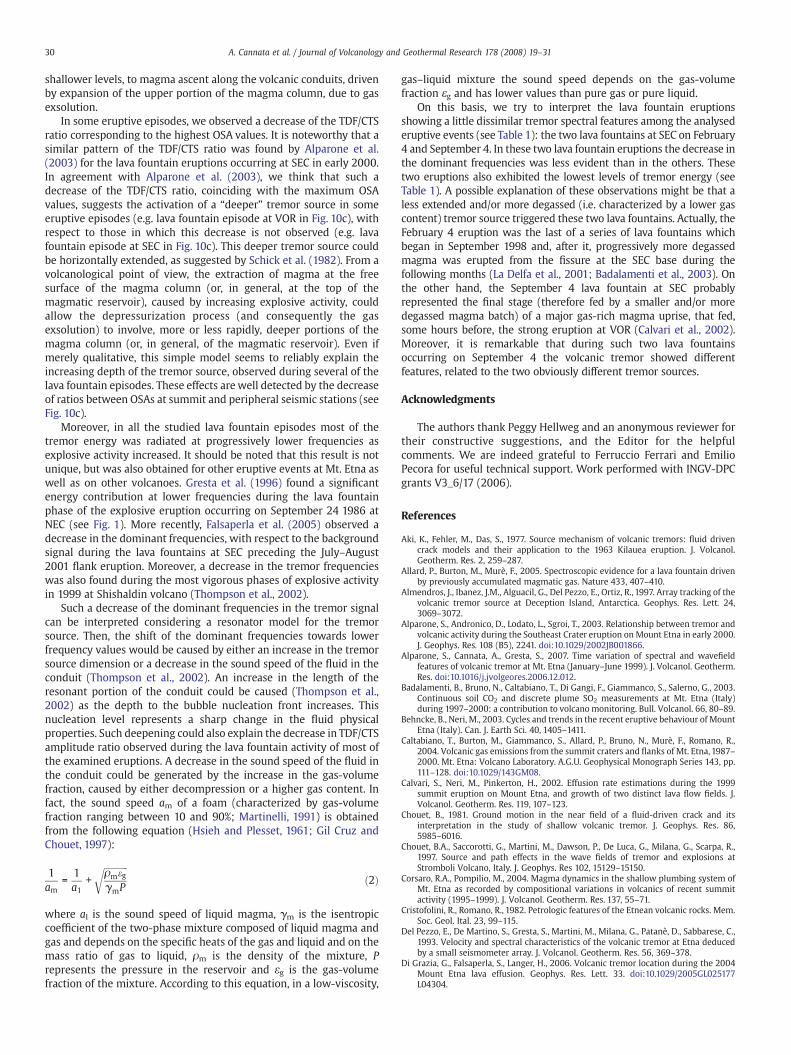
Fig. 7. Tremor amplitude spectra collected on February 7 (a), April 1 (b) and October 25 (ccomponents during 1999. Each spectrumwas obtained by averaging 24 hourly average spectrspectrum (c).
effects. A source variation or the activation of another source could besuggested.
4.3. Polarization analysis
Following the method proposed by Montalbetti and Kanasewich(1970) and Kanasewich (1981), the polarization analysis wasperformed using eigen-decomposition of the covariance matrix ofthe three components of ground motion calculated over successivewindows with a time step of 0.01 s (one sample of the time series). Inorder to determine the polarization parameters, we analyse 2-hour-long daily samples, bandpass filtered in various frequency bands(Fig. 8).
) at TDF (black continuous line), MNT (black dashed line) and ESP (grey line) verticala. Spectral amplitudes are normalised to themaximum amplitude values observed in the
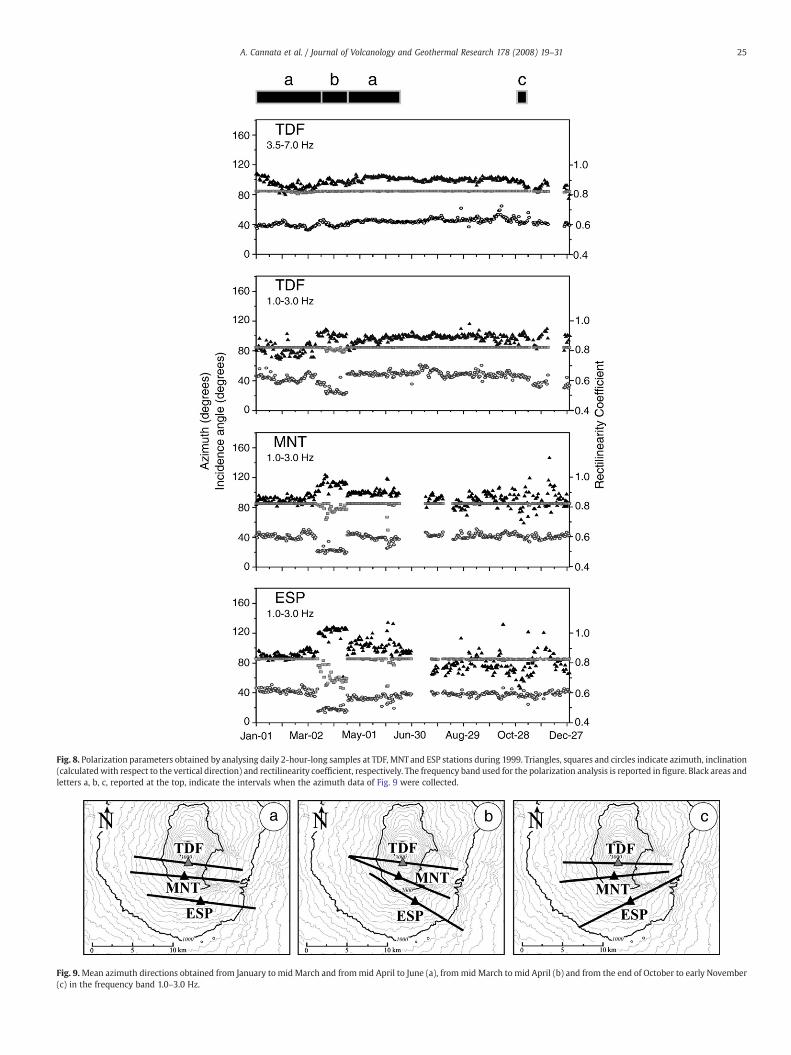
Fig. 8. Polarization parameters obtained by analysing daily 2-hour-long samples at TDF, MNTand ESP stations during 1999. Triangles, squares and circles indicate azimuth, inclination(calculatedwith respect to the vertical direction) and rectilinearity coefficient, respectively. The frequency band used for the polarization analysis is reported in figure. Black areas andletters a, b, c, reported at the top, indicate the intervals when the azimuth data of Fig. 9 were collected.
Fig. 9.Mean azimuth directions obtained from January to mid March and frommid April to June (a), frommid March to mid April (b) and from the end of October to early November(c) in the frequency band 1.0–3.0 Hz.
25A. Cannata et al. / Journal of Volcanology and Geothermal Research 178 (2008) 19–31
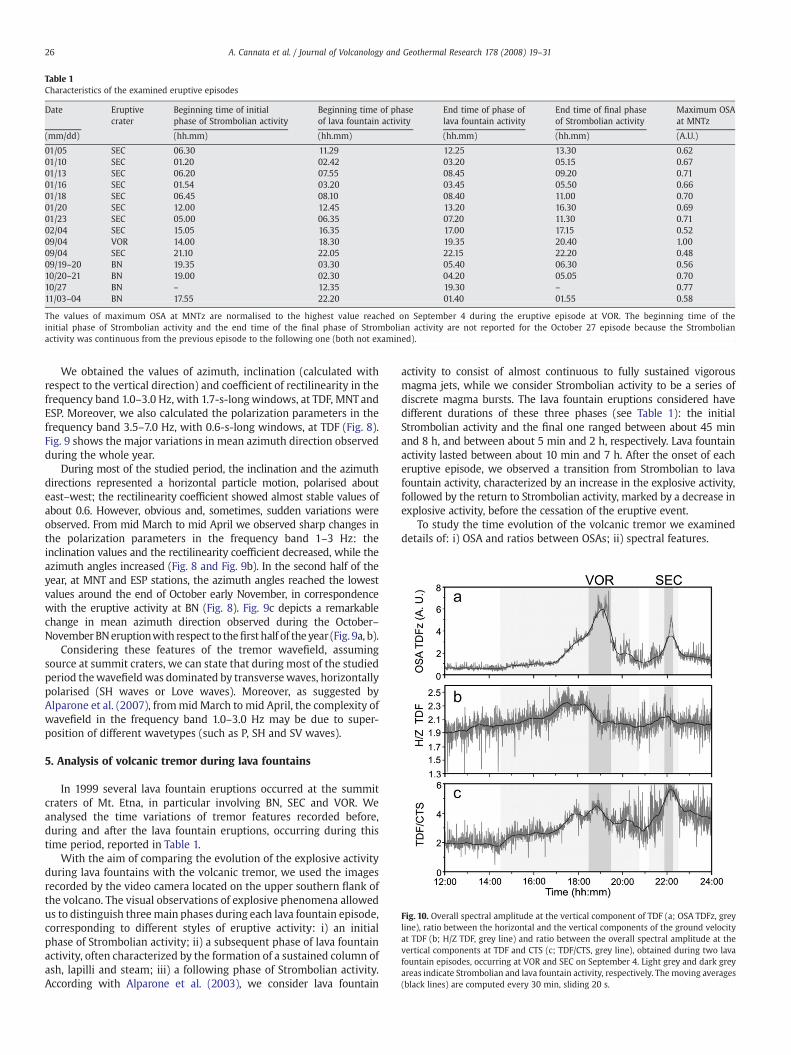
Table 1Characteristics of the examined eruptive episodes
Date Eruptivecrater
Beginning time of initialphase of Strombolian activity
Beginning time of phaseof lava fountain activity
End time of phase oflava fountain activity
End time of final phaseof Strombolian activity
Maximum OSAat MNTz
(mm/dd) (hh.mm) (hh.mm) (hh.mm) (hh.mm) (A.U.)
01/05 SEC 06.30 11.29 12.25 13.30 0.6201/10 SEC 01.20 02.42 03.20 05.15 0.6701/13 SEC 06.20 07.55 08.45 09.20 0.7101/16 SEC 01.54 03.20 03.45 05.50 0.6601/18 SEC 06.45 08.10 08.40 11.00 0.7001/20 SEC 12.00 12.45 13.20 16.30 0.6901/23 SEC 05.00 06.35 07.20 11.30 0.7102/04 SEC 15.05 16.35 17.00 17.15 0.5209/04 VOR 14.00 18.30 19.35 20.40 1.0009/04 SEC 21.10 22.05 22.15 22.20 0.4809/19–20 BN 19.35 03.30 05.40 06.30 0.5610/20–21 BN 19.00 02.30 04.20 05.05 0.7010/27 BN – 12.35 19.30 – 0.7711/03–04 BN 17.55 22.20 01.40 01.55 0.58
The values of maximum OSA at MNTz are normalised to the highest value reached on September 4 during the eruptive episode at VOR. The beginning time of theinitial phase of Strombolian activity and the end time of the final phase of Strombolian activity are not reported for the October 27 episode because the Strombolianactivity was continuous from the previous episode to the following one (both not examined).
Fig. 10. Overall spectral amplitude at the vertical component of TDF (a; OSA TDFz, greyline), ratio between the horizontal and the vertical components of the ground velocityat TDF (b; H/Z TDF, grey line) and ratio between the overall spectral amplitude at thevertical components at TDF and CTS (c; TDF/CTS, grey line), obtained during two lavafountain episodes, occurring at VOR and SEC on September 4. Light grey and dark greyareas indicate Strombolian and lava fountain activity, respectively. The moving averages(black lines) are computed every 30 min, sliding 20 s.
26 A. Cannata et al. / Journal of Volcanology and Geothermal Research 178 (2008) 19–31
We obtained the values of azimuth, inclination (calculated withrespect to the vertical direction) and coefficient of rectilinearity in thefrequency band 1.0–3.0 Hz, with 1.7-s-long windows, at TDF, MNT andESP. Moreover, we also calculated the polarization parameters in thefrequency band 3.5–7.0 Hz, with 0.6-s-long windows, at TDF (Fig. 8).Fig. 9 shows the major variations in mean azimuth direction observedduring the whole year.
During most of the studied period, the inclination and the azimuthdirections represented a horizontal particle motion, polarised abouteast–west; the rectilinearity coefficient showed almost stable values ofabout 0.6. However, obvious and, sometimes, sudden variations wereobserved. From mid March to mid April we observed sharp changes inthe polarization parameters in the frequency band 1–3 Hz: theinclination values and the rectilinearity coefficient decreased, while theazimuth angles increased (Fig. 8 and Fig. 9b). In the second half of theyear, at MNT and ESP stations, the azimuth angles reached the lowestvalues around the end of October early November, in correspondencewith the eruptive activity at BN (Fig. 8). Fig. 9c depicts a remarkablechange in mean azimuth direction observed during the October–NovemberBNeruptionwith respect to thefirst half of theyear (Fig. 9a, b).
Considering these features of the tremor wavefield, assumingsource at summit craters, we can state that during most of the studiedperiod thewavefield was dominated by transversewaves, horizontallypolarised (SH waves or Love waves). Moreover, as suggested byAlparone et al. (2007), frommid March to mid April, the complexity ofwavefield in the frequency band 1.0–3.0 Hz may be due to super-position of different wavetypes (such as P, SH and SV waves).
5. Analysis of volcanic tremor during lava fountains
In 1999 several lava fountain eruptions occurred at the summitcraters of Mt. Etna, in particular involving BN, SEC and VOR. Weanalysed the time variations of tremor features recorded before,during and after the lava fountain eruptions, occurring during thistime period, reported in Table 1.
With the aim of comparing the evolution of the explosive activityduring lava fountains with the volcanic tremor, we used the imagesrecorded by the video camera located on the upper southern flank ofthe volcano. The visual observations of explosive phenomena allowedus to distinguish threemain phases during each lava fountain episode,corresponding to different styles of eruptive activity: i) an initialphase of Strombolian activity; ii) a subsequent phase of lava fountainactivity, often characterized by the formation of a sustained column ofash, lapilli and steam; iii) a following phase of Strombolian activity.According with Alparone et al. (2003), we consider lava fountain
activity to consist of almost continuous to fully sustained vigorousmagma jets, while we consider Strombolian activity to be a series ofdiscrete magma bursts. The lava fountain eruptions considered havedifferent durations of these three phases (see Table 1): the initialStrombolian activity and the final one ranged between about 45 minand 8 h, and between about 5 min and 2 h, respectively. Lava fountainactivity lasted between about 10 min and 7 h. After the onset of eacheruptive episode, we observed a transition from Strombolian to lavafountain activity, characterized by an increase in the explosive activity,followed by the return to Strombolian activity, marked by a decrease inexplosive activity, before the cessation of the eruptive event.
To study the time evolution of the volcanic tremor we examineddetails of: i) OSA and ratios between OSAs; ii) spectral features.
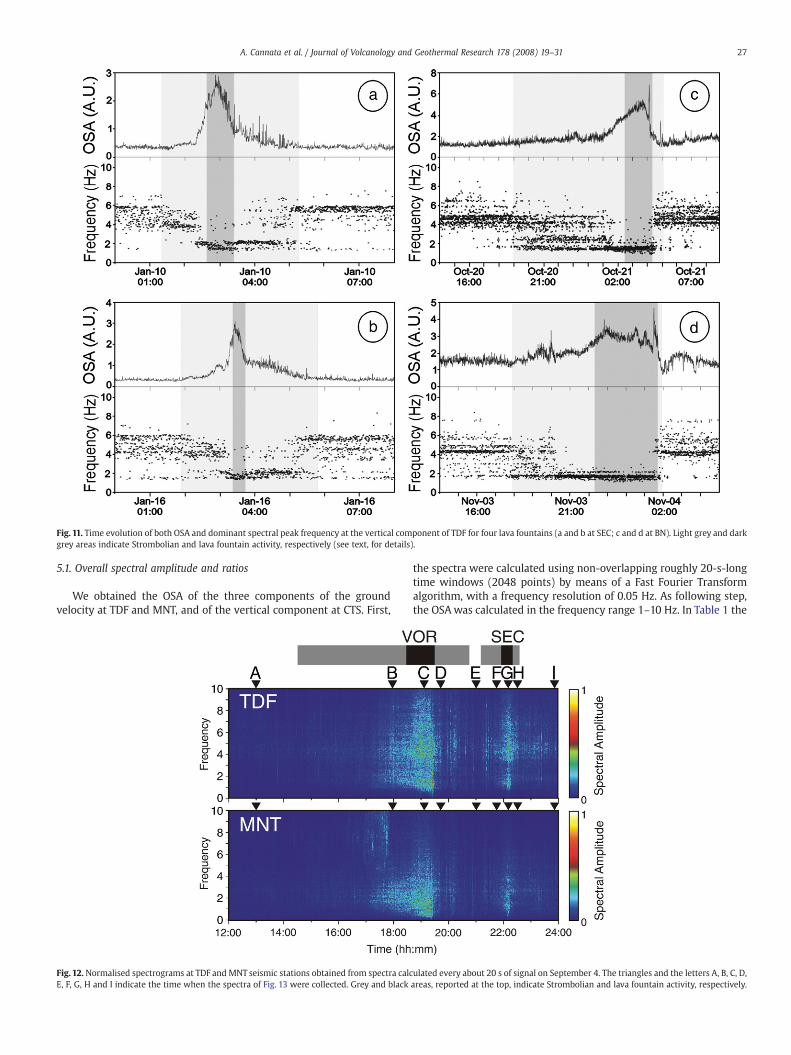
Fig. 11. Time evolution of both OSA and dominant spectral peak frequency at the vertical component of TDF for four lava fountains (a and b at SEC; c and d at BN). Light grey and darkgrey areas indicate Strombolian and lava fountain activity, respectively (see text, for details).
27A. Cannata et al. / Journal of Volcanology and Geothermal Research 178 (2008) 19–31
5.1. Overall spectral amplitude and ratios
We obtained the OSA of the three components of the groundvelocity at TDF and MNT, and of the vertical component at CTS. First,
Fig. 12. Normalised spectrograms at TDF and MNT seismic stations obtained from spectra calcE, F, G, H and I indicate the time when the spectra of Fig. 13 were collected. Grey and black
the spectra were calculated using non-overlapping roughly 20-s-longtime windows (2048 points) by means of a Fast Fourier Transformalgorithm, with a frequency resolution of 0.05 Hz. As following step,the OSAwas calculated in the frequency range 1–10 Hz. In Table 1 the
ulated every about 20 s of signal on September 4. The triangles and the letters A, B, C, D,areas, reported at the top, indicate Strombolian and lava fountain activity, respectively.
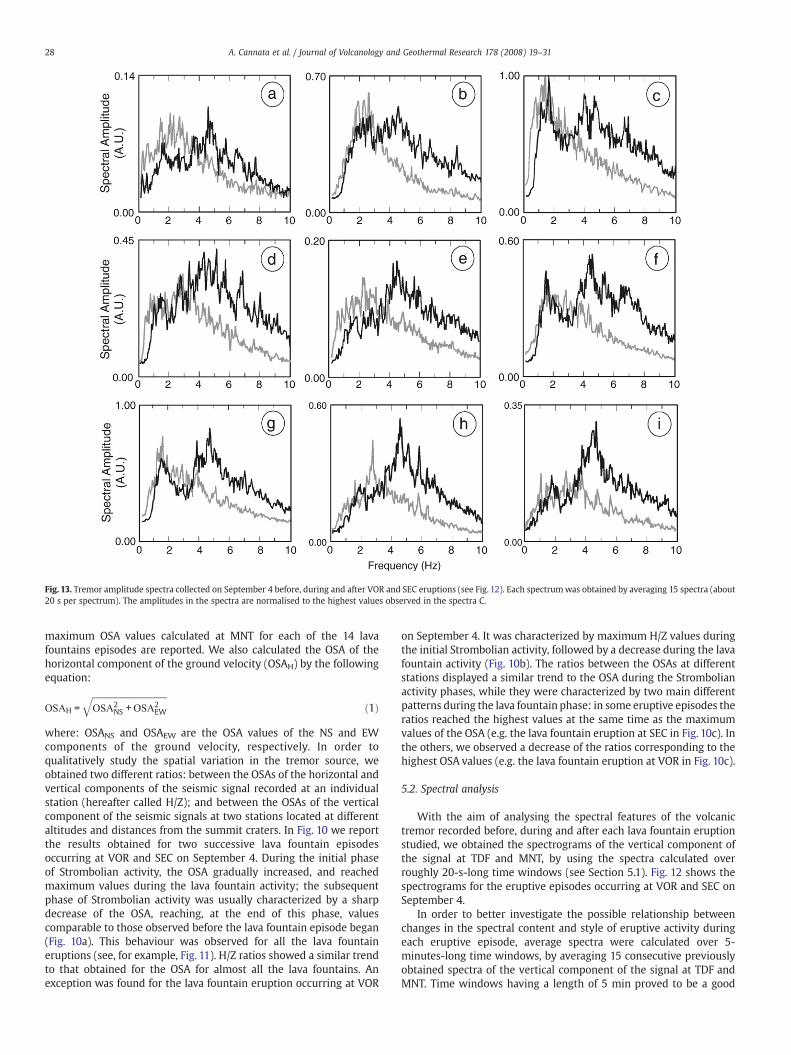
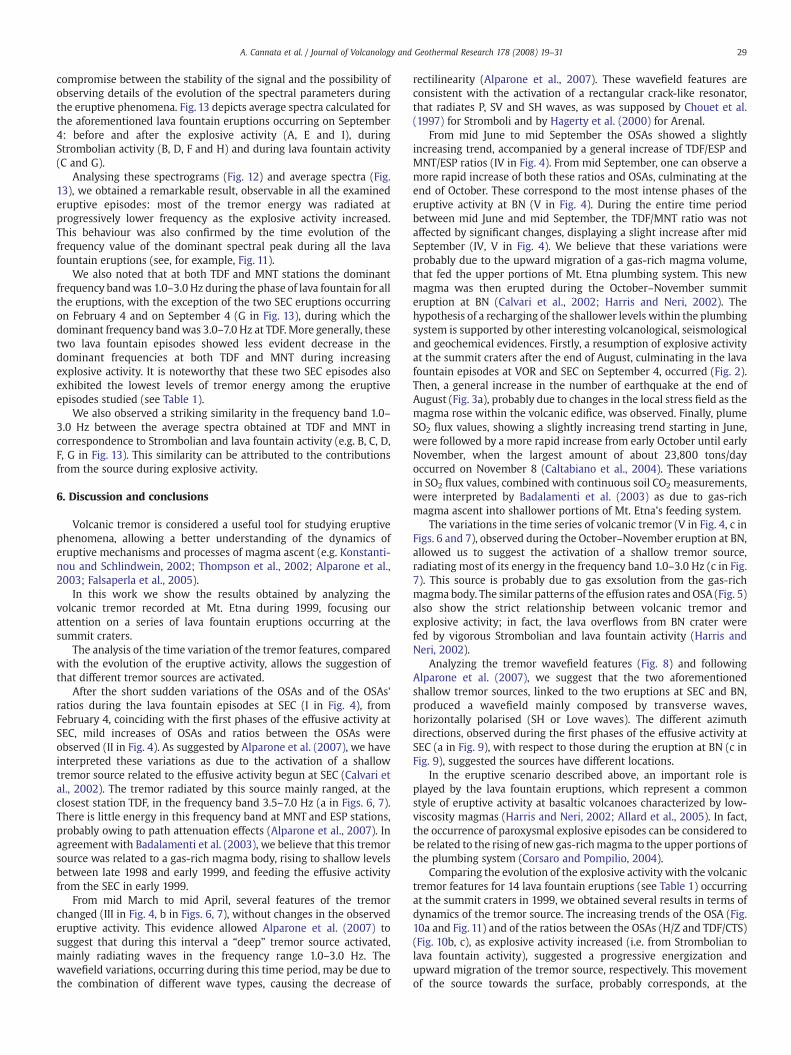
Fig. 13. Tremor amplitude spectra collected on September 4 before, during and after VOR and SEC eruptions (see Fig. 12). Each spectrumwas obtained by averaging 15 spectra (about20 s per spectrum). The amplitudes in the spectra are normalised to the highest values observed in the spectra C.
28 A. Cannata et al. / Journal of Volcanology and Geothermal Research 178 (2008) 19–31
maximum OSA values calculated at MNT for each of the 14 lavafountains episodes are reported. We also calculated the OSA of thehorizontal component of the ground velocity (OSAH) by the followingequation:
OSAH =ffiffiffiffiffiffiffiffiffiffiffiffiffiffiffiffiffiffiffiffiffiffiffiffiffiffiffiffiffiffiffiffiffiffiOSA2
NS +OSA2EW
qð1Þ
where: OSANS and OSAEW are the OSA values of the NS and EWcomponents of the ground velocity, respectively. In order toqualitatively study the spatial variation in the tremor source, weobtained two different ratios: between the OSAs of the horizontal andvertical components of the seismic signal recorded at an individualstation (hereafter called H/Z); and between the OSAs of the verticalcomponent of the seismic signals at two stations located at differentaltitudes and distances from the summit craters. In Fig. 10 we reportthe results obtained for two successive lava fountain episodesoccurring at VOR and SEC on September 4. During the initial phaseof Strombolian activity, the OSA gradually increased, and reachedmaximum values during the lava fountain activity; the subsequentphase of Strombolian activity was usually characterized by a sharpdecrease of the OSA, reaching, at the end of this phase, valuescomparable to those observed before the lava fountain episode began(Fig. 10a). This behaviour was observed for all the lava fountaineruptions (see, for example, Fig. 11). H/Z ratios showed a similar trendto that obtained for the OSA for almost all the lava fountains. Anexception was found for the lava fountain eruption occurring at VOR
on September 4. It was characterized by maximum H/Z values duringthe initial Strombolian activity, followed by a decrease during the lavafountain activity (Fig. 10b). The ratios between the OSAs at differentstations displayed a similar trend to the OSA during the Strombolianactivity phases, while they were characterized by two main differentpatterns during the lava fountain phase: in some eruptive episodes theratios reached the highest values at the same time as the maximumvalues of the OSA (e.g. the lava fountain eruption at SEC in Fig. 10c). Inthe others, we observed a decrease of the ratios corresponding to thehighest OSA values (e.g. the lava fountain eruption at VOR in Fig. 10c).
5.2. Spectral analysis
With the aim of analysing the spectral features of the volcanictremor recorded before, during and after each lava fountain eruptionstudied, we obtained the spectrograms of the vertical component ofthe signal at TDF and MNT, by using the spectra calculated overroughly 20-s-long time windows (see Section 5.1). Fig. 12 shows thespectrograms for the eruptive episodes occurring at VOR and SEC onSeptember 4.
In order to better investigate the possible relationship betweenchanges in the spectral content and style of eruptive activity duringeach eruptive episode, average spectra were calculated over 5-minutes-long time windows, by averaging 15 consecutive previouslyobtained spectra of the vertical component of the signal at TDF andMNT. Time windows having a length of 5 min proved to be a good
29A. Cannata et al. / Journal of Volcanology and Geothermal Research 178 (2008) 19–31
compromise between the stability of the signal and the possibility ofobserving details of the evolution of the spectral parameters duringthe eruptive phenomena. Fig. 13 depicts average spectra calculated forthe aforementioned lava fountain eruptions occurring on September4: before and after the explosive activity (A, E and I), duringStrombolian activity (B, D, F and H) and during lava fountain activity(C and G).
Analysing these spectrograms (Fig. 12) and average spectra (Fig.13), we obtained a remarkable result, observable in all the examinederuptive episodes: most of the tremor energy was radiated atprogressively lower frequency as the explosive activity increased.This behaviour was also confirmed by the time evolution of thefrequency value of the dominant spectral peak during all the lavafountain eruptions (see, for example, Fig. 11).
We also noted that at both TDF and MNT stations the dominantfrequency bandwas 1.0–3.0 Hz during the phase of lava fountain for allthe eruptions, with the exception of the two SEC eruptions occurringon February 4 and on September 4 (G in Fig. 13), during which thedominant frequency bandwas 3.0–7.0 Hz at TDF. More generally, thesetwo lava fountain episodes showed less evident decrease in thedominant frequencies at both TDF and MNT during increasingexplosive activity. It is noteworthy that these two SEC episodes alsoexhibited the lowest levels of tremor energy among the eruptiveepisodes studied (see Table 1).
We also observed a striking similarity in the frequency band 1.0–3.0 Hz between the average spectra obtained at TDF and MNT incorrespondence to Strombolian and lava fountain activity (e.g. B, C, D,F, G in Fig. 13). This similarity can be attributed to the contributionsfrom the source during explosive activity.
6. Discussion and conclusions
Volcanic tremor is considered a useful tool for studying eruptivephenomena, allowing a better understanding of the dynamics oferuptive mechanisms and processes of magma ascent (e.g. Konstanti-nou and Schlindwein, 2002; Thompson et al., 2002; Alparone et al.,2003; Falsaperla et al., 2005).
In this work we show the results obtained by analyzing thevolcanic tremor recorded at Mt. Etna during 1999, focusing ourattention on a series of lava fountain eruptions occurring at thesummit craters.
The analysis of the time variation of the tremor features, comparedwith the evolution of the eruptive activity, allows the suggestion ofthat different tremor sources are activated.
After the short sudden variations of the OSAs and of the OSAs'ratios during the lava fountain episodes at SEC (I in Fig. 4), fromFebruary 4, coinciding with the first phases of the effusive activity atSEC, mild increases of OSAs and ratios between the OSAs wereobserved (II in Fig. 4). As suggested by Alparone et al. (2007), we haveinterpreted these variations as due to the activation of a shallowtremor source related to the effusive activity begun at SEC (Calvari etal., 2002). The tremor radiated by this source mainly ranged, at theclosest station TDF, in the frequency band 3.5–7.0 Hz (a in Figs. 6, 7).There is little energy in this frequency band at MNT and ESP stations,probably owing to path attenuation effects (Alparone et al., 2007). Inagreement with Badalamenti et al. (2003), we believe that this tremorsource was related to a gas-rich magma body, rising to shallow levelsbetween late 1998 and early 1999, and feeding the effusive activityfrom the SEC in early 1999.
From mid March to mid April, several features of the tremorchanged (III in Fig. 4, b in Figs. 6, 7), without changes in the observederuptive activity. This evidence allowed Alparone et al. (2007) tosuggest that during this interval a “deep” tremor source activated,mainly radiating waves in the frequency range 1.0–3.0 Hz. Thewavefield variations, occurring during this time period, may be due tothe combination of different wave types, causing the decrease of
rectilinearity (Alparone et al., 2007). These wavefield features areconsistent with the activation of a rectangular crack-like resonator,that radiates P, SV and SH waves, as was supposed by Chouet et al.(1997) for Stromboli and by Hagerty et al. (2000) for Arenal.
From mid June to mid September the OSAs showed a slightlyincreasing trend, accompanied by a general increase of TDF/ESP andMNT/ESP ratios (IV in Fig. 4). From mid September, one can observe amore rapid increase of both these ratios and OSAs, culminating at theend of October. These correspond to the most intense phases of theeruptive activity at BN (V in Fig. 4). During the entire time periodbetween mid June and mid September, the TDF/MNT ratio was notaffected by significant changes, displaying a slight increase after midSeptember (IV, V in Fig. 4). We believe that these variations wereprobably due to the upward migration of a gas-rich magma volume,that fed the upper portions of Mt. Etna plumbing system. This newmagma was then erupted during the October–November summiteruption at BN (Calvari et al., 2002; Harris and Neri, 2002). Thehypothesis of a recharging of the shallower levels within the plumbingsystem is supported by other interesting volcanological, seismologicaland geochemical evidences. Firstly, a resumption of explosive activityat the summit craters after the end of August, culminating in the lavafountain episodes at VOR and SEC on September 4, occurred (Fig. 2).Then, a general increase in the number of earthquake at the end ofAugust (Fig. 3a), probably due to changes in the local stress field as themagma rose within the volcanic edifice, was observed. Finally, plumeSO2 flux values, showing a slightly increasing trend starting in June,were followed by a more rapid increase from early October until earlyNovember, when the largest amount of about 23,800 tons/dayoccurred on November 8 (Caltabiano et al., 2004). These variationsin SO2 flux values, combined with continuous soil CO2 measurements,were interpreted by Badalamenti et al. (2003) as due to gas-richmagma ascent into shallower portions of Mt. Etna's feeding system.
The variations in the time series of volcanic tremor (V in Fig. 4, c inFigs. 6 and 7), observed during the October–November eruption at BN,allowed us to suggest the activation of a shallow tremor source,radiating most of its energy in the frequency band 1.0–3.0 Hz (c in Fig.7). This source is probably due to gas exsolution from the gas-richmagma body. The similar patterns of the effusion rates and OSA (Fig. 5)also show the strict relationship between volcanic tremor andexplosive activity; in fact, the lava overflows from BN crater werefed by vigorous Strombolian and lava fountain activity (Harris andNeri, 2002).
Analyzing the tremor wavefield features (Fig. 8) and followingAlparone et al. (2007), we suggest that the two aforementionedshallow tremor sources, linked to the two eruptions at SEC and BN,produced a wavefield mainly composed by transverse waves,horizontally polarised (SH or Love waves). The different azimuthdirections, observed during the first phases of the effusive activity atSEC (a in Fig. 9), with respect to those during the eruption at BN (c inFig. 9), suggested the sources have different locations.
In the eruptive scenario described above, an important role isplayed by the lava fountain eruptions, which represent a commonstyle of eruptive activity at basaltic volcanoes characterized by low-viscosity magmas (Harris and Neri, 2002; Allard et al., 2005). In fact,the occurrence of paroxysmal explosive episodes can be considered tobe related to the rising of new gas-richmagma to the upper portions ofthe plumbing system (Corsaro and Pompilio, 2004).
Comparing the evolution of the explosive activity with the volcanictremor features for 14 lava fountain eruptions (see Table 1) occurringat the summit craters in 1999, we obtained several results in terms ofdynamics of the tremor source. The increasing trends of the OSA (Fig.10a and Fig. 11) and of the ratios between the OSAs (H/Z and TDF/CTS)(Fig. 10b, c), as explosive activity increased (i.e. from Strombolian tolava fountain activity), suggested a progressive energization andupward migration of the tremor source, respectively. This movementof the source towards the surface, probably corresponds, at the
30 A. Cannata et al. / Journal of Volcanology and Geothermal Research 178 (2008) 19–31
shallower levels, to magma ascent along the volcanic conduits, drivenby expansion of the upper portion of the magma column, due to gasexsolution.
In some eruptive episodes, we observed a decrease of the TDF/CTSratio corresponding to the highest OSA values. It is noteworthy that asimilar pattern of the TDF/CTS ratio was found by Alparone et al.(2003) for the lava fountain eruptions occurring at SEC in early 2000.In agreement with Alparone et al. (2003), we think that such adecrease of the TDF/CTS ratio, coinciding with the maximum OSAvalues, suggests the activation of a “deeper” tremor source in someeruptive episodes (e.g. lava fountain episode at VOR in Fig. 10c), withrespect to those in which this decrease is not observed (e.g. lavafountain episode at SEC in Fig. 10c). This deeper tremor source couldbe horizontally extended, as suggested by Schick et al. (1982). From avolcanological point of view, the extraction of magma at the freesurface of the magma column (or, in general, at the top of themagmatic reservoir), caused by increasing explosive activity, couldallow the depressurization process (and consequently the gasexsolution) to involve, more or less rapidly, deeper portions of themagma column (or, in general, of the magmatic reservoir). Even ifmerely qualitative, this simple model seems to reliably explain theincreasing depth of the tremor source, observed during several of thelava fountain episodes. These effects are well detected by the decreaseof ratios between OSAs at summit and peripheral seismic stations (seeFig. 10c).
Moreover, in all the studied lava fountain episodes most of thetremor energy was radiated at progressively lower frequencies asexplosive activity increased. It should be noted that this result is notunique, but was also obtained for other eruptive events at Mt. Etna aswell as on other volcanoes. Gresta et al. (1996) found a significantenergy contribution at lower frequencies during the lava fountainphase of the explosive eruption occurring on September 24 1986 atNEC (see Fig. 1). More recently, Falsaperla et al. (2005) observed adecrease in the dominant frequencies, with respect to the backgroundsignal during the lava fountains at SEC preceding the July–August2001 flank eruption. Moreover, a decrease in the tremor frequencieswas also found during the most vigorous phases of explosive activityin 1999 at Shishaldin volcano (Thompson et al., 2002).
Such a decrease of the dominant frequencies in the tremor signalcan be interpreted considering a resonator model for the tremorsource. Then, the shift of the dominant frequencies towards lowerfrequency values would be caused by either an increase in the tremorsource dimension or a decrease in the sound speed of the fluid in theconduit (Thompson et al., 2002). An increase in the length of theresonant portion of the conduit could be caused (Thompson et al.,2002) as the depth to the bubble nucleation front increases. Thisnucleation level represents a sharp change in the fluid physicalproperties. Such deepening could also explain the decrease in TDF/CTSamplitude ratio observed during the lava fountain activity of most ofthe examined eruptions. A decrease in the sound speed of the fluid inthe conduit could be generated by the increase in the gas-volumefraction, caused by either decompression or a higher gas content. Infact, the sound speed am of a foam (characterized by gas-volumefraction ranging between 10 and 90%; Martinelli, 1991) is obtainedfrom the following equation (Hsieh and Plesset, 1961; Gil Cruz andChouet, 1997):
1am
=1a1
+ffiffiffiffiffiffiffiffiffiffiffiρmegγmP
rð2Þ
where al is the sound speed of liquid magma, γm is the isentropiccoefficient of the two-phase mixture composed of liquid magma andgas and depends on the specific heats of the gas and liquid and on themass ratio of gas to liquid, ρm is the density of the mixture, Prepresents the pressure in the reservoir and εg is the gas-volumefraction of the mixture. According to this equation, in a low-viscosity,
gas–liquid mixture the sound speed depends on the gas-volumefraction εg and has lower values than pure gas or pure liquid.
On this basis, we try to interpret the lava fountain eruptionsshowing a little dissimilar tremor spectral features among the analysederuptive events (see Table 1): the two lava fountains at SEC on February4 and September 4. In these two lava fountain eruptions the decrease inthe dominant frequencies was less evident than in the others. Thesetwo eruptions also exhibited the lowest levels of tremor energy (seeTable 1). A possible explanation of these observations might be that aless extended and/or more degassed (i.e. characterized by a lower gascontent) tremor source triggered these two lava fountains. Actually, theFebruary 4 eruption was the last of a series of lava fountains whichbegan in September 1998 and, after it, progressively more degassedmagma was erupted from the fissure at the SEC base during thefollowing months (La Delfa et al., 2001; Badalamenti et al., 2003). Onthe other hand, the September 4 lava fountain at SEC probablyrepresented the final stage (therefore fed by a smaller and/or moredegassed magma batch) of a major gas-rich magma uprise, that fed,some hours before, the strong eruption at VOR (Calvari et al., 2002).Moreover, it is remarkable that during such two lava fountainsoccurring on September 4 the volcanic tremor showed differentfeatures, related to the two obviously different tremor sources.
Acknowledgments
The authors thank Peggy Hellweg and an anonymous reviewer fortheir constructive suggestions, and the Editor for the helpfulcomments. We are indeed grateful to Ferruccio Ferrari and EmilioPecora for useful technical support. Work performed with INGV-DPCgrants V3_6/17 (2006).
References
Aki, K., Fehler, M., Das, S., 1977. Source mechanism of volcanic tremors: fluid drivencrack models and their application to the 1963 Kilauea eruption. J. Volcanol.Geotherm. Res. 2, 259–287.
Allard, P., Burton, M., Murè, F., 2005. Spectroscopic evidence for a lava fountain drivenby previously accumulated magmatic gas. Nature 433, 407–410.
Almendros, J., Ibanez, J.M., Alguacil, G., Del Pezzo, E., Ortiz, R., 1997. Array tracking of thevolcanic tremor source at Deception Island, Antarctica. Geophys. Res. Lett. 24,3069–3072.
Alparone, S., Andronico, D., Lodato, L., Sgroi, T., 2003. Relationship between tremor andvolcanic activity during the Southeast Crater eruption on Mount Etna in early 2000.J. Geophys. Res. 108 (B5), 2241. doi:10.1029/2002JB001866.
Alparone, S., Cannata, A., Gresta, S., 2007. Time variation of spectral and wavefieldfeatures of volcanic tremor at Mt. Etna (January–June 1999). J. Volcanol. Geotherm.Res. doi:10.1016/j.jvolgeores.2006.12.012.
Badalamenti, B., Bruno, N., Caltabiano, T., Di Gangi, F., Giammanco, S., Salerno, G., 2003.Continuous soil CO2 and discrete plume SO2 measurements at Mt. Etna (Italy)during 1997–2000: a contribution to volcano monitoring. Bull. Volcanol. 66, 80–89.
Behncke, B., Neri, M., 2003. Cycles and trends in the recent eruptive behaviour of MountEtna (Italy). Can. J. Earth Sci. 40, 1405–1411.
Caltabiano, T., Burton, M., Giammanco, S., Allard, P., Bruno, N., Murè, F., Romano, R.,2004. Volcanic gas emissions from the summit craters and flanks of Mt. Etna, 1987–2000. Mt. Etna: Volcano Laboratory. A.G.U. Geophysical Monograph Series 143, pp.111–128. doi:10.1029/143GM08.
Calvari, S., Neri, M., Pinkerton, H., 2002. Effusion rate estimations during the 1999summit eruption on Mount Etna, and growth of two distinct lava flow fields. J.Volcanol. Geotherm. Res. 119, 107–123.
Chouet, B., 1981. Ground motion in the near field of a fluid-driven crack and itsinterpretation in the study of shallow volcanic tremor. J. Geophys. Res. 86,5985–6016.
Chouet, B.A., Saccorotti, G., Martini, M., Dawson, P., De Luca, G., Milana, G., Scarpa, R.,1997. Source and path effects in the wave fields of tremor and explosions atStromboli Volcano, Italy. J. Geophys. Res 102, 15129–15150.
Corsaro, R.A., Pompilio, M., 2004. Magma dynamics in the shallow plumbing system ofMt. Etna as recorded by compositional variations in volcanics of recent summitactivity (1995–1999). J. Volcanol. Geotherm. Res. 137, 55–71.
Cristofolini, R., Romano, R., 1982. Petrologic features of the Etnean volcanic rocks. Mem.Soc. Geol. Ital. 23, 99–115.
Del Pezzo, E., De Martino, S., Gresta, S., Martini, M., Milana, G., Patanè, D., Sabbarese, C.,1993. Velocity and spectral characteristics of the volcanic tremor at Etna deducedby a small seismometer array. J. Volcanol. Geotherm. Res. 56, 369–378.
Di Grazia, G., Falsaperla, S., Langer, H., 2006. Volcanic tremor location during the 2004Mount Etna lava effusion. Geophys. Res. Lett. 33. doi:10.1029/2005GL025177L04304.
31A. Cannata et al. / Journal of Volcanology and Geothermal Research 178 (2008) 19–31
Ereditato, D., Luongo, G., 1994. Volcanic tremor wave field during quiescent anderuptive activity at Mt. Etna (Sicily). J. Volcanol. Geotherm. Res. 61, 239–251.
Falsaperla, S., Alparone, S., D'Amico, S., Di Grazia, G., Ferrari, F., Langer, H., Sgroi, T.,Spampinato, S., 2005. Volcanic tremor at Mt. Etna, Italy, preceding andaccompanying the eruption of July–August, 2001. Pageoph 162, 1–22.
Fehler, M., 1983. Observations of volcanic tremor at Mount St. Helens volcano. J.Geophys. Res. 88, 3476–3484.
Ferrucci, F., Godano, C., Pino, N.A., 1990. Approach to the volcanic tremor by covarianceanalysis: application to the 1989 eruption of Mt. Etna (Sicily). Geophys. Res. Lett. 17,2425–2428.
Gil Cruz, F., Chouet, B., 1997. Long-period events, the most characteristic seismicityaccompanying the emplacement and extrusion of a lava dome in Galeras Volcano,Colombia, in 1991. J. Volcanol. Geotherm. Res. 77, 121–158.
Gordeev, E., 1993. Modeling of volcanic tremor as explosive point sources in a single-layered, elastic half-space. J. Geophys. Res. 98, 19687–19703.
Gresta, S., Lombardo, G., Cristofolini, R., 1996. Characteristics of volcanic tremoraccompanying the September 24th,1986 explosive eruption of Mt. Etna (Italy). Ann.Geofis. 39, 411–420.
Gresta, S., Peruzza, L., Slejko, D., Distefano, G., 1998. Inferences on the main volcano-tectonic structures atMt. Etna (Sicily) from a probabilistic seismological approach. J.Seismol. 2, 105–116.
Hagerty, M.T., Schwartz, S.Y., Garcés, M.A., Protti, M., 2000. Analysis of seismic andacoustic observations at Arenal Volcano, Costa Rica, 1995–1997. J. Volcanol.Geotherm. Res. 101, 27–65.
Harris, A.J.L., Neri, M., 2002. Volumetric observations during paroxysmal eruptions atMount Etna: pressurized drainage of a shallow chamber or pulsed supply? J.Volcanol. Geotherm. Res. 116, 79–95.
Hsieh, D.Y., Plesset, M.S., 1961. Theory of rectified diffusion of mass into gas bubbles. J.Acoust. Soc. Am. 33, 206–215.
Kanasewich, E.R., 1981. Time Sequence Analysis in Geophysics. University of AlbertaPress, Edmonton, pp. 1–532.
Kedar, S., Kanamori, H., Sturtevant, B., 1998. Bubble collapse as the source of tremor atOld Faithful Geyser. J. Geophys. Res. 103, 24283–24299.
Konstantinou, K.I., Schlindwein, V., 2002. Nature, wavefield properties and sourcemechanism of volcanic tremor: a review. J. Volcanol. Geotherm. Res. 119, 161–187.
Kubotera, A., 1974. Volcanic tremors at Aso volcano. In: Civetta, L., Gasparini, P., Luongo,G., Rapolla, A. (Eds.), Physical Volcanology. Elsevier, Amsterdam, pp. 29–47.
La Delfa, S., Patanè, G., Clocchiatti, R., Joron, J.L., Tanguy, J.C., 2001. Activity of Mount Etnapreceding the February 1999 fissure eruption: inferred mechanism from seismo-logical and geochemical data. J. Volcanol. Geotherm. Res. 105, 121–139.
Martinelli, B., 1991. Compressible flow and volcanic tremor. Swiss Seismol. Serv. Inst.Geophys. ETH Zurich. Contrib. 9376.
McNutt, S.R., 1994. Volcanic tremor from around the world: 1992 update. Acta Vulcanol.5, 197–200.
Monaco, C., Catalano, S., Cocina, O., De Guidi, G., Ferlito, C., Gresta, S., Musumeci, C.,Tortorici, L., 2005. Tectonic control on the eruptive dynamics at Mt. Etna Volcano(Sicily) during the 2001 and 2002–2003 eruptions. J. Volcanol. Geotherm. Res. 144,211–233.
Montalbetti, J.F., Kanasewich, E.R.,1970. Enhancement of teleseismic body phases with apolarization filter. Geophys. J. R. Astron. Soc. 21, 119–129.
Mora, M.M., Lesage, P., Dorel, J., Bard, P.Y., Metaxian, J.P., Alvarado, G.E., Leandro, C., 2001.Study of seismic site effects using H/V spectral ratios at Arenal Volcano, CostaRiabout Geophys. Res. Lett. 28, 2991–2994.
Richter, C.F., 1958. Elementary Seismology. Freeman and Company, San Francisco. 768pp.
Ripepe, M., 1996. Evidence for gas influence on volcanic seismic signals recorded atStromboli. J. Volcanol. Geotherm. Res. 70, 221–233.
Ripepe, M., Coltelli, M., Privitera, E., Gresta, S., Moretti, M., Piccinini, D., 2001. Seismicand infrasonic evidences for an impulsive source of the shallow volcanic tremor atMt. Etna, Italy. Geophys. Res. Lett. 28, 1071–1074.
Riuscetti, M., Schick, R., Seidl, D., 1977. Spectral parameters of volcanic tremors at Etna. J.Volcanol. Geotherm. Res. 2, 289–298.
Saccorotti, G., Zuccarello, L., Del Pezzo, E., Ibanez, J., Gresta, S., 2004. Quantitativeanalysis of the tremor wavefield at Etna Volcano, Italy. J. Volcanol. Geotherm. Res.136, 223–245.
Schiano, P., Clocchiatti, R., Ottolini, L., Busà, T., 2001. Transition of Mount Etna lavas froma mantle-plume to an island-arc magmatic source. Nature 412, 900–904.
Schick, R., Riuscetti, M., 1973. An analysis of volcanic tremors at South Italian volcanoes.Z. Geophys. 39, 247–262.
Schick, R., Cosentino, M., Lombardo, G., Patanè, G., 1982. Volcanic tremor at Mount Etna.A brief description. Mem. Soc. Geol. Ital. 23, 191–196.
Seidl, D., Schick, R., Riuscetti, M., 1981. Volcanic tremors at Etna: a model for hydraulicorigin. Bull. Volcanol. 44, 43–56.
Steinberg, G.S., Steinberg, A.S., 1975. On possible causes of volcanic tremor. J. Geophys.Res. 80, 1600–1604.
Tanguy, J.C., Kieffer, G., Patanè, G., 1996. Dynamics, lava volume and effusion rate duringthe 1991–1993 eruption of Mount Etna. J. Volcanol. Geotherm. Res. 71, 259–265.
Thompson, G., McNutt, S.R., Tytgat, G., 2002. Three distinct regimes of volcanic tremorassociated with eruptions of Shishaldin volcano, Alaska, April 1999. Bull. Volcanol.64, 535–547.


