Embed Size (px)
Citation preview
Sudan University of Science and Technology
College of Engineering
School of Electrical & Nuclear Engineering
Voltage Improvement by Using Static VAR
compensator (SVC)
القدرة غیر الفعالة الساكنھ الجھد بإستخدام معوضحسین ت
A Project Submitted In Partial Fulfillment For The Requirement Of The Degree of
B.Sc. (Honor) In Electrical Engineering
Prepared by:
1. Mohanna Abdallah Al-Haj Mohammed
2. Yassir Merghani Hassan Ahmed
3. Ahmed Salah Eldin Yassin
4. Mohamed Alfadil Esmail Abdallh
Supervised by:
Dr. Khamis Arbeesh Saadeldin Zedan
NOV, 2020

i
ةياآل
الرحيم الرحمن هللابسم
تعالى: الق
شيغأشيالل إن ﴿ توىعلىالأعرأ ضفيست ةأي امثم اسأ رأ ماواتوالأ لالن هاررب كمللا ال ذيخلقالس يأ
ر مأ رهأللهالأخلأقوالأ راتبأمأ قمروالنجوممسخ سوالأ مأ عالمينيطألبهحثيثاوالش الأ ﴾تباركللا رب
صدقهللاالعظيم
(54سورةالعرافاآلية)
ii
DEDICATION
Although it has six years studying in Sudan University, it is an experience that
will stay with us forever.
First of all, we would like to thanks our parent; they have inspired us throughout
the life and have taught us never to give up.
We would also like to thank our sisters and brothers for their support.
Finally, we would like to thank the Department of Electrical and nuclear
Engineering for supporting us during these years of study.
iii
ACKNOWLEDGEMENT
We would like to thank Dr. Khamis Arbeesh Saadeldin Zedan our Project
Supervisor, for his guidance, support, motivation and encouragement throughout
the period this work was carried out. His readiness for consultation at all times,
his educative comments, his concern and assistance have been invaluable.
iv
ABSTRACT
The expansion in the demand and loads growth on the stations led to problems in
voltage stability and system parameters are pushed below their permissible
limits. The purpose of this project is to compensate the reactive power to
improve the voltage in the stations (Al-Markhiyyat, Azirqab, Mahdia,
Omdurman, Pant, Al-Muqrin, Al-Shajarah). The static VAR compensator was
used and installed in the Mahdia substation to achieve the goal of the study and
was performed in three cases followed, Normal operation case, the case of
increasing the load to 30%, and the case of loss of generation in the Bant
substation.
The study which found that after the installing SVC, the voltage has improved in
all the substations, and the best improvement was in Mahdia substation because
SVC was installed in Mahdia substation.
v
مستخلصطات بصورة عامة ادى الى حدوث مشاكل في استقرار الجهود التوسع في الطلب الذي تواجهه المح
فعليه لتحسين قل من المسموح به. الغرض من هذا المشروع تعويض القدرة الردأوايصالها الي حدود معوضم وتم استخدا الشجرة( المقرن, بانت, مدرمان,أ المهدية, اب,قزير األ )المرخيات, حطاتمالفي الجهد حت تالقدرة للنظام النسيابعمل تحليل تم لتحقيق هدف الدراسة, في محطة المهدية االستاتيكي الجهد
لة فقد وفي حا%, 30الي في الحالة الطبيعية وفي حالة زيادة الحمولة يتابباستخدام برنامج اال الدراسةافضل نتيجة في والجهد قد تحسن في كل المحطات توصلت الدراسة الي اننت, التوليد في محطة با
. بسبب وضع معوض الجهد االستاتيكي بها محطة المهدية
vi
TABLE OF CONTENTS
Page
I اآلية
DEDICATION ii
ACKNOWLEDGEMENT iii
ABSTRACT iv
V مستخلص
TABLE OF CONTENTS vi
LIST OF FIGURES viii
LIST OF TABLES X
LIST OF SYMBOLS xi
LIST OF ABBREVIATIONS xii
CHAPTER ONE
INTRUDUCTION 1.1 Over View 1
1.2 Problem Statement 2
1.3 Objective 2
1.4 Methodology 3
1.5 Project Layout 3
CHAPTER TWO
GENERAL BACKGROUND
2.1 Introduction 4
2.2 Common disturbances in power systems 5
2.2.1 Voltage Imbalance 7
2.2.2 Harmonics 7
2.2.3 Power Frequency Variations 8
2.2.4 Voltage Fluctuations 8
2.3 Voltage Stability 9
2.4 Reactive Power and Voltage Control 10
2.5 Production and Absorption of Reactive Power 11
2.6 Traditional Method of Voltage Control 11
2.6.1 Shunt reactor 11
2.6.2 Shunt capacitor 13
2.6.3 Synchronous condensers 14
2.6.4 Use of tap changing transformer 15
2.7 Modern Method of Voltage Control (FACTS) 16
2.8 FACTS devices 16
vii
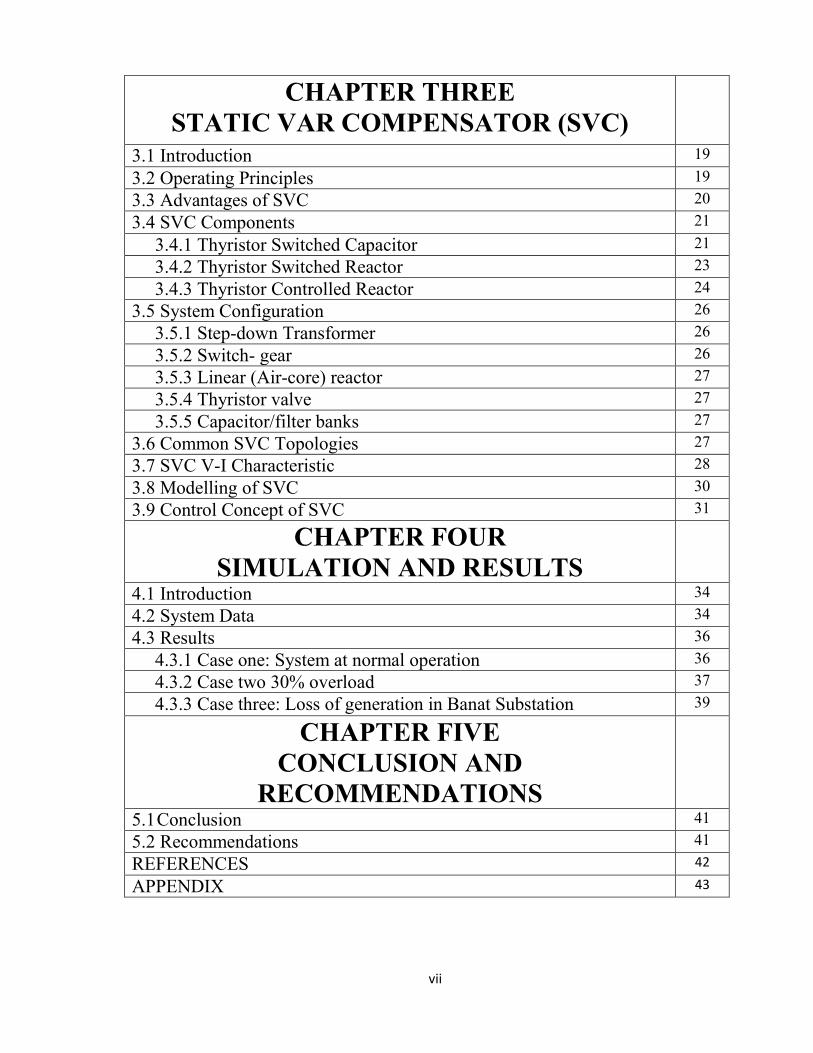
CHAPTER THREE
STATIC VAR COMPENSATOR (SVC)
3.1 Introduction 19
3.2 Operating Principles 19
3.3 Advantages of SVC 20
3.4 SVC Components 21
3.4.1 Thyristor Switched Capacitor 21
3.4.2 Thyristor Switched Reactor 23
3.4.3 Thyristor Controlled Reactor 24
3.5 System Configuration 26
3.5.1 Step-down Transformer 26
3.5.2 Switch- gear 26
3.5.3 Linear (Air-core) reactor 27
3.5.4 Thyristor valve 27
3.5.5 Capacitor/filter banks 27
3.6 Common SVC Topologies 27
3.7 SVC V-I Characteristic 28
3.8 Modelling of SVC 30
3.9 Control Concept of SVC 31
CHAPTER FOUR
SIMULATION AND RESULTS
4.1 Introduction 34
4.2 System Data 34
4.3 Results 36
4.3.1 Case one: System at normal operation 36
4.3.2 Case two 30% overload 37
4.3.3 Case three: Loss of generation in Banat Substation 39
CHAPTER FIVE
CONCLUSION AND
RECOMMENDATIONS
5.1 Conclusion 41
5.2 Recommendations 41
REFERENCES 42
APPENDIX 43
viii
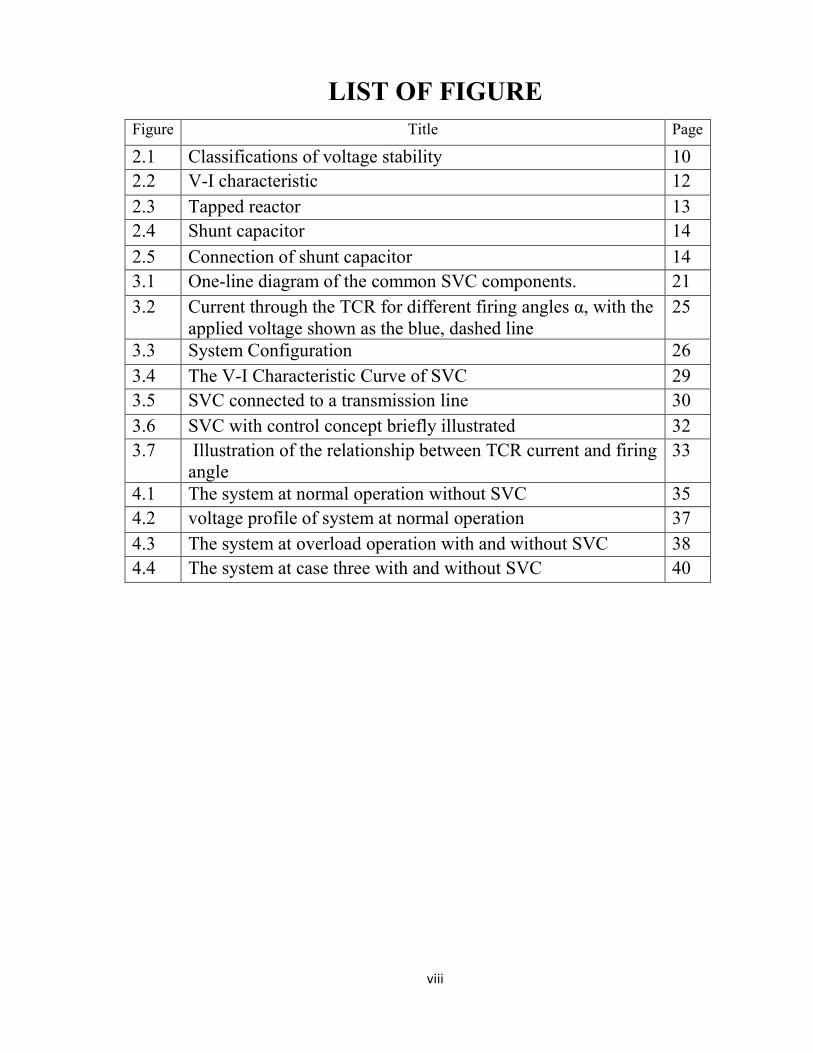
LIST OF FIGURE
Figure Title Page
2.1 Classifications of voltage stability 10
2.2 V-I characteristic 12
2.3 Tapped reactor 13
2.4 Shunt capacitor 14
2.5 Connection of shunt capacitor 14
3.1 One-line diagram of the common SVC components. 21
3.2 Current through the TCR for different firing angles α, with the
applied voltage shown as the blue, dashed line
25
3.3 System Configuration 26
3.4 The V-I Characteristic Curve of SVC 29
3.5 SVC connected to a transmission line 30
3.6 SVC with control concept briefly illustrated 32
3.7 Illustration of the relationship between TCR current and firing
angle
33
4.1 The system at normal operation without SVC 35
4.2 voltage profile of system at normal operation 37
4.3 The system at overload operation with and without SVC 38
4.4 The system at case three with and without SVC 40
ix
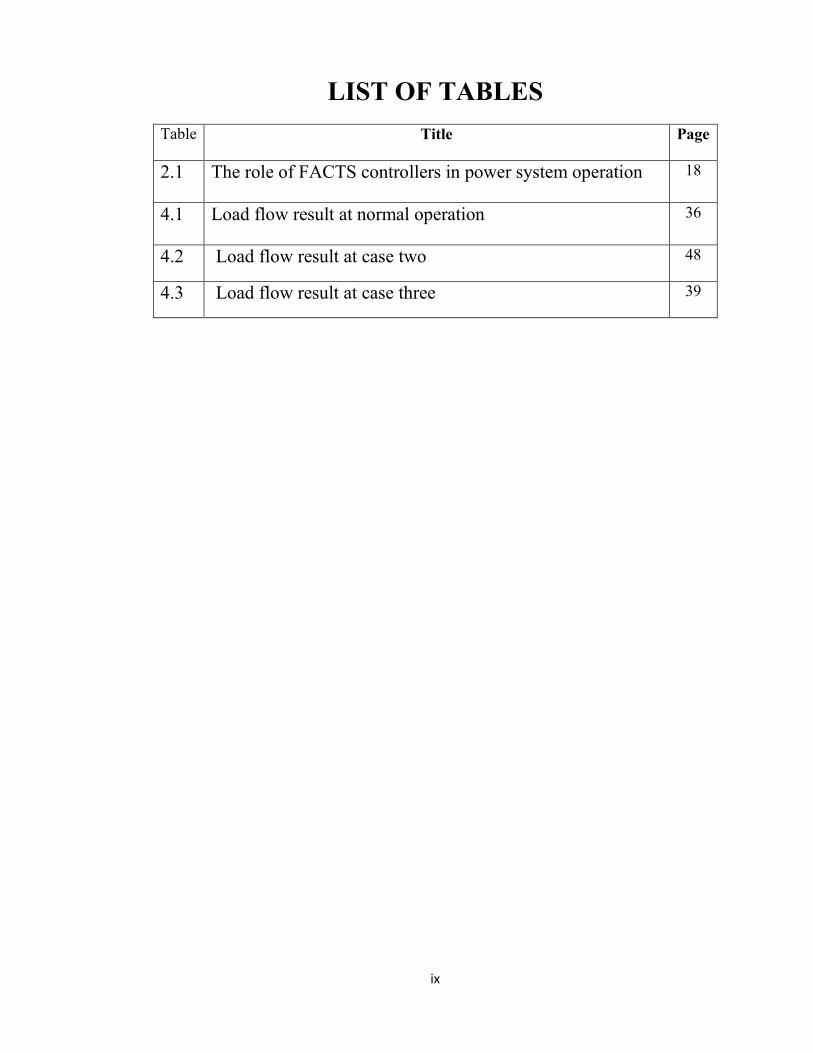
LIST OF TABLES
Table Title Page
2.1 The role of FACTS controllers in power system operation 18
4.1 Load flow result at normal operation 36
4.2 Load flow result at case two 48
4.3 Load flow result at case three 39
x
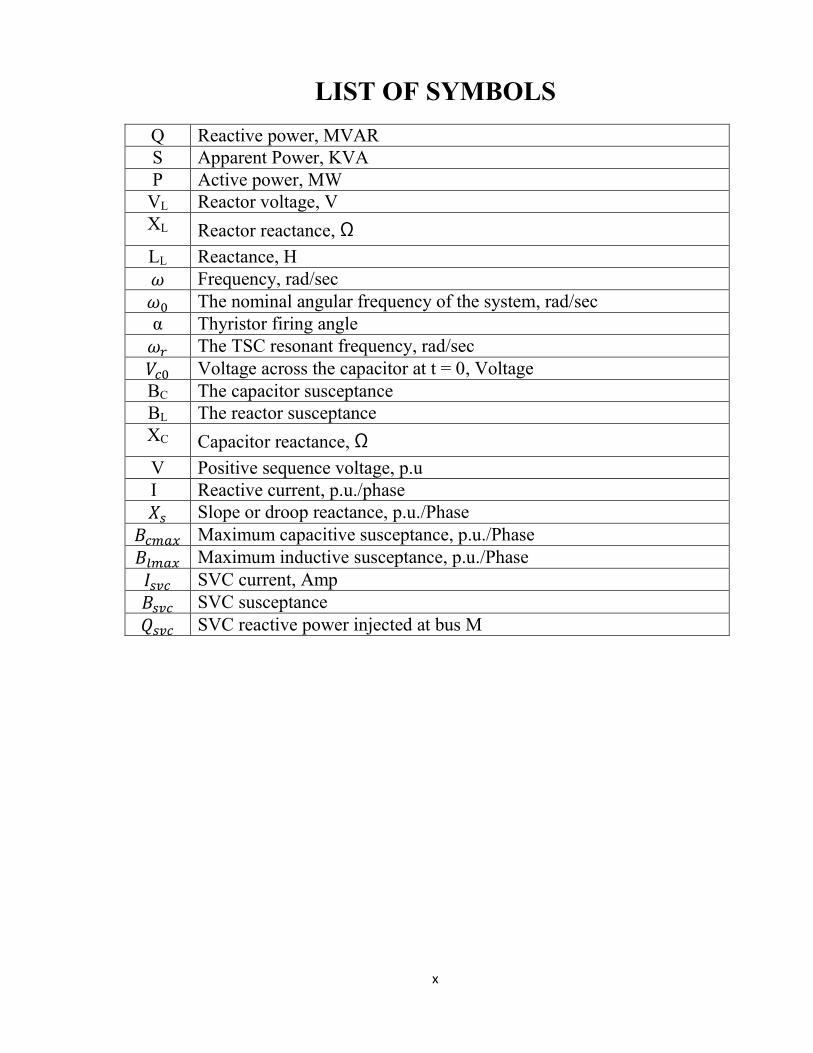
LIST OF SYMBOLS
Q Reactive power, MVAR
S Apparent Power, KVA
P Active power, MW
VL Reactor voltage, V
XL Reactor reactance, Ω
LL Reactance, H
𝜔 Frequency, rad/sec
𝜔0 The nominal angular frequency of the system, rad/sec
α Thyristor firing angle
𝜔𝑟 The TSC resonant frequency, rad/sec
𝑉𝑐0 Voltage across the capacitor at t = 0, Voltage
BC The capacitor susceptance
BL The reactor susceptance
XC Capacitor reactance, Ω
V Positive sequence voltage, p.u
I Reactive current, p.u./phase
𝑋𝑠 Slope or droop reactance, p.u./Phase
𝐵𝑐𝑚𝑎𝑥 Maximum capacitive susceptance, p.u./Phase
𝐵𝑙𝑚𝑎𝑥 Maximum inductive susceptance, p.u./Phase
𝐼𝑠𝑣𝑐 SVC current, Amp
𝐵𝑠𝑣𝑐 SVC susceptance
𝑄𝑠𝑣𝑐 SVC reactive power injected at bus M
xi
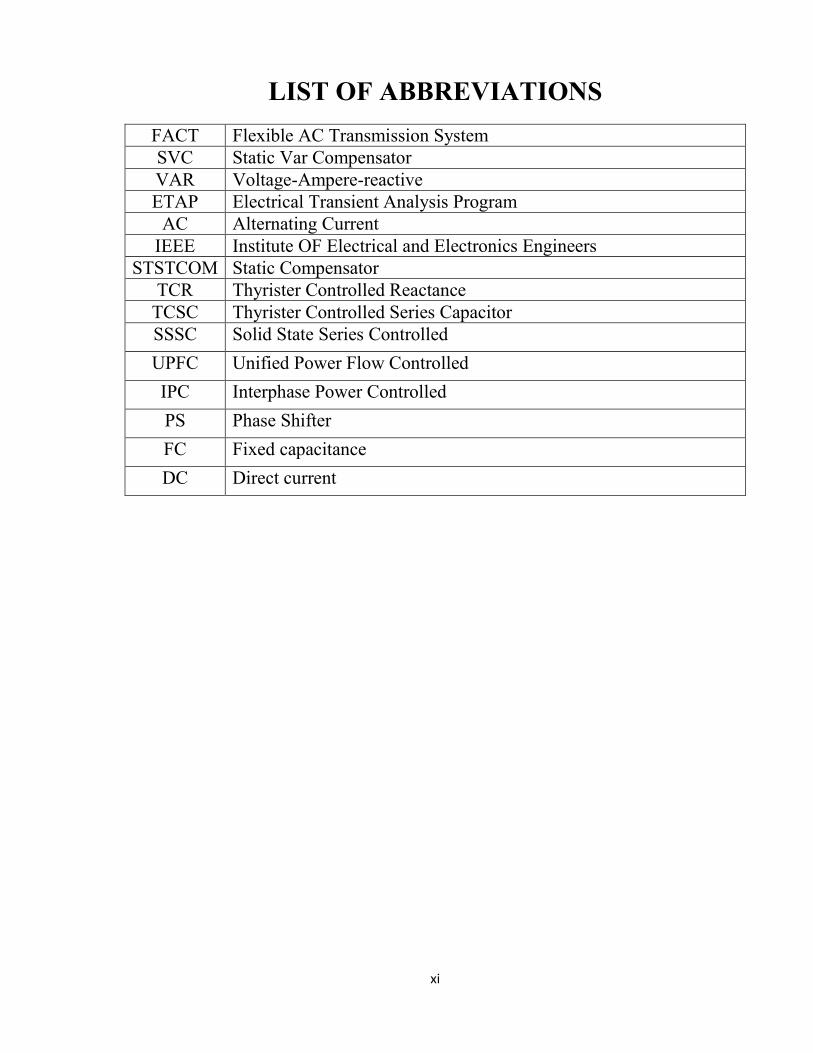
LIST OF ABBREVIATIONS
FACT Flexible AC Transmission System
SVC Static Var Compensator
VAR Voltage-Ampere-reactive
ETAP Electrical Transient Analysis Program
AC Alternating Current
IEEE Institute OF Electrical and Electronics Engineers
STSTCOM Static Compensator
TCR Thyrister Controlled Reactance
TCSC Thyrister Controlled Series Capacitor
SSSC Solid State Series Controlled
UPFC Unified Power Flow Controlled
IPC Interphase Power Controlled
PS Phase Shifter
FC Fixed capacitance
DC Direct current
1
Chapter One
INTRODUCTION
1.1 Over View:
In the last decade’s power systems have faced new challenges due to
deregulation, permanent increase in demand, the increased dependence of
modern society upon electricity has forced power systems to operate with
very high reliability and with almost 100% availability [1].
Electrical power transfer and delivery to consumers is
subjected to many problems in consequence of many issues. Among these
issues is the substantial power demand increase, due to the growth in
industrial and economic while expansion of power generation and
transmission is severely limited. Also, electrical power is transmitted for
long distances from generation stations to load centers. The demand
increase may cause excessive voltage drop, and transmission of power for
long distances causes voltage increase/decrease. On the other hand,
dynamically changing loads dynamically affect the quality power, The way to
counteract this problem is by reducing the reactive power Load in the system
or by adding new reactive generation systems in the weakest points in the
system, thereby, increasing the voltage at those points [2], so to overcome
such problem and keep the system voltage within specified
limits and regulate voltage that must be achieved by controlling
production, absorption and flow of reactive power through the network.
There are many methods to regulate voltage in any part in the network, in
generation, controlling of voltage terminal by controlling excitation of
generator by using AVR. In transmission line and distribution system many
voltage regulating equipment’s are used. These include shunt
capacitor, shunt reactor, synchronous condenser, and tap changing
2
transformer. Development in power electronic devices led to new
compensation devices such as FACTS devices to control reactive power
for many merits. One widely used FACTS device is the Static VAR
Compensator (SVC), a SVC can improve the voltage profiles in the
transient and steady state; therefore it can improve the quality and
performance of the electric services [3].
1.2 Statement of Problem:
The voltage level of the system changes when there is change in load and
the drop in the voltage leads to an increased demand for the reactive power. If
this drop is not met by the power system leads to a further decline in the bus
voltage. This decline eventually leads to a progressive rapid decline of voltage
at that location, which may have a cascading effect on neighboring regions
that causes voltage collapse. In this research Static VAR Compensator (SVC)
is used to maintain the voltage within the limits. SVC will either supply the
reactive power or absorb the reactive power.
1.3 Thesis Objectives:
The objectives of this project are summarized in following points:
1. To perform load flow analysis in parts of Khartoum substations
Network (Almarkhiat, Alizergab, Almahadia, Omdurman, Banat,
Almugran, Alshagara .(
2. To compensate reactive power by using SVC to improve voltage
profile in parts of Khartoum substations Network.
3
1.4 Research Methodology:
To study effect of SVC in voltage profile in parts of Khartoum substations
Network, and load flow analysis with and without SVC is performed by using
ETAP software.
1.5 Project layout:
This project contains five chapters. Chapter one consists of general
concept, problem statements, objective, methodology and project layout.
Chapter two represent literature review which consists of introduction,
common disturbances in power systems, Reactive Power, Voltage Stability,
and Voltage Control by traditional and modern method. Chapter three
contains of general information about static variable compensator such as
introduction, operation principle, Advantages of SVC, SVC Components and
Configuration, and Control Concept. Chapter four shows the simulation result
and discussion, finally, chapter five which consists of conclusion and
recommendation.
4
Chapter Two
Literature Review
2.1 Introduction:
Modern society has relied consistently on electrical power, requiring
higher demands of power stability and power quality.
Generation, Transmission, and Distribution systems are the main components
of an electric power system. The purpose of transmission network is to
transfer electric power from generating units at various locations to the
distribution system which ultimately supplies the load; normally transmission
lines imply the bulk transfer of power by high voltage links between main
load centers. On the other hand, distribution system is mainly responsible for
the conveyance of this power to the consumers by means of lower voltage
networks, so there will be need to sub-stations at the side of transmission and
the side of distribution. The components of sub-stations are transformers (step
up at generation side and step down at distribution side), reactive power
compensation devices such as capacitor banks, reactor banks, SVC…etc.
All transmission lines in a power system exhibit the electrical properties
of resistance, inductance, capacitance, and conductance. The inductance and
capacitance are due to the effects of magnetic and electric fields around the
conductor. The shunt conductance accounts for leakage currents flowing
across insulators and ionized path way in the air. The leakage currents are
negligible compared to the current flowing in the transmission lines and may
be neglected [4].
Before the widespread use of power electronic equipment,
microprocessors for Industrial control, and automation in factories and
offices, minor variations in power did not seriously affect the operation of
conventional equipment such as lights and induction motors. If the supply
5
voltage dipped because of a fault (i.e., a sag in voltage occurred), the lights
just dimmed, and the induction motor produced a lower output. These days
the effects of power interruptions are rather costly [5].
2.2 Common disturbances in power systems:
The common disturbances in a power system are:
a. Voltage sag.
b. Voltage swells.
c. Momentary interruptions.
d. Transients.
e. Voltage unbalance.
f. Harmonics.
g. Voltage fluctuations.
All these types of disturbances, such as voltage sags, voltage swells, and
interruptions, can be classified into three types, depending on their duration:
A. Short-duration voltage variation:
A voltage sag (dip) is defined as a decrease in the root-mean-square (rms)
voltage at the power frequency for periods ranging from a half cycle to a
minute.11 It is caused by voltage drops due to fault currents or starting of
large motors. Sags may trigger shutdown of process controllers or computer
system crashes.
A voltage swell is defined as an increase up to a level between 1.1 and 1.8 pu
in rms voltage at the power frequency for periods ranging from a half cycle to
a minute.
6
An interruption occurs when the supply voltage decreases to less than 0.1 pu
for a period of time not exceeding 1 min. Interruptions can be caused by
faults, control malfunctions, or equipment failures [6].
B. long-duration voltage variations:
An under voltage is a decrease in the rms ac voltage to less than 90% at
the power frequency for a duration longer than 1 min. These can be caused by
switching on a large load or switching off a large capacitor bank. 1.11 Under
voltages are sometimes due to a deliberate reduction of voltage by the utility
to lessen the load during periods of peak demand.
An under voltage will lower the output from capacitor banks that a utility or
customer will often install to help maintain voltage and reduce losses in the
system by compensating for the inductive nature of many conductors and
loads.
An overvoltage is an increase in the rms ac voltage to a level greater than
110% at the power frequency for duration longer than 1 min. These are
caused by switching off a large load or energizing a capacitor bank. Incorrect
tap settings on transformers can also cause under voltages and over voltages.
As these can last several minutes, they stress computers, electronic
controllers, and motors. An overvoltage may shorten the life of power system
equipment and motors [6].
C. Transients:
Transients can be classified into two categories, impulsive and oscillatory.
1. Impulsive transients:
An impulsive transient is a sudden no power frequency changes in the
steady-state condition of voltage or current, or both, which is unidirectional in
polarity (either positive or negative).
Impulsive transients are normally characterized by their rise and decay
times.
7
They can also be described by their spectral content. For example, a 1.2-/50-
ms 4000-V impulsive transient rises to its peak value of 4000 V in 1.2 ms, and
then decays to half its peak value in 50 ms. The most common cause of
impulsive transients is lightning.
2. Oscillatory Transients:
An oscillatory transient consists of a voltage or current whose instantaneous
value
changes polarity rapidly. It is described by its spectral content.
2.2.1 Voltage Imbalance:
Voltage imbalance (unbalance) is defined as the ratio of a negative- or
zero-sequence component to a positive-sequence component. The voltage
imbalance in a power system is due to single-phase loads. In particular,
single-phase traction loads connected across different phases produce
negative-phase-sequence voltages, which in many cases have to be reduced to
less than 2% with the help of SVCs.
Severe voltage imbalance can lead to derating of induction motors because of
excessive heating. Voltage imbalance can also occur from a blown fuse on
one phase of a three-phase bank. There are occasions when a severe voltage
imbalance greater than 5% can occur from single-phasing conditions.
Voltage or current imbalance is estimated sometimes (less commonly) using
the following definition: Maximum deviation from the average of the three-
phase voltages (or currents) divided by the average of the three-phase
voltages (or currents) [6].
2.2.2 Harmonics:
When a nonlinear load is supplied from a supply voltage of 60-Hz or 50-
Hz frequency, it draws currents at more than one frequency, resulting in a
distorted current waveform. Fourier analysis of this distorted current
waveform resolves it into its fundamental component and different harmonics.
Harmonics are sinusoidal voltages or currents having frequencies that are
8
integer multiples of the fundamental frequency (usually 60 Hz or 50 Hz in
power systems).
Harmonic distortion is a growing concern for many customers and the utilities
because of increasing application of power electronics equipment. The
nonlinear Harmonic-producing devices can be modeled as current sources that
inject harmonic currents into the power system.
2.2.3 Power Frequency Variations:
At any instant, the frequency depends on the balance between the load and
the capacity of the available generation, when dynamic balance changes,
small changes in frequency occur. In modern interconnected power systems,
frequency is controlled within a tight range as a result of good governor
action. Frequency variations beyond ±0.1 Hz are likely to occur under fault
conditions or from the loss of a major load or generating unit. However, in
isolated systems, governor response to abrupt load changes may not be
adequate to regulate them within the narrow bandwidth required by
frequency-sensitive equipment.
Voltage notching can sometimes cause frequency or timing errors on
power electronic machines that count zero crossings to derive frequency or
time. The voltage notch may produce additional zero crossings that can cause
frequency or timing errors and affect the performance of digital electric
clocks [6].
2.2.4 Voltage Fluctuations:
Loads that exhibit continuous, rapid variations in load current can cause
voltage Variations erroneously referred to as flicker. ANSI C84.1-1992
recommends that the system voltages should lie in the range 0.9–1.1 pu.
IEC 1000-3-3 (1994) defines various types of voltage fluctuations, the
IEC 1000-3-3 (1994), Type (d) is characterized as systematic variations of
voltage envelopes or a series of random voltages.
9
Arc furnaces are the most common cause of voltage fluctuations in the
transmission and distribution system. Voltage fluctuations are defined by their
rms magnitude expressed as a percentage of the fundamental magnitude. They
are the response of the power system to the varying load, and light flicker is
the response of the lighting system as observed by the human eye. Even
though flicker is caused by voltage fluctuations, some authors use the term
“voltage flicker” to represent either of these terms.
Voltage fluctuations generally appear as a modulation of the fundamental
frequency. Hence, the magnitude of voltage fluctuations can be obtained by
demodulating the waveform to remove the fundamental frequency and then
measuring the magnitude of the modulation components, typically,
magnitudes as low as 0.5% can result in perceptible light flicker if the
frequencies are in the range of 6–8 Hz.
2.3 Voltage Stability:
A major factor contributing to voltage instability is the voltage drop in the
line impedance when active and reactive powers flow through it. As a
consequence, the capability of the transmission network for power transfer
and voltage support reduces. Voltage stability of a system is endangered when
a disturbance increases the reactive power demand beyond the sustainable
capacity of available reactive power resources.
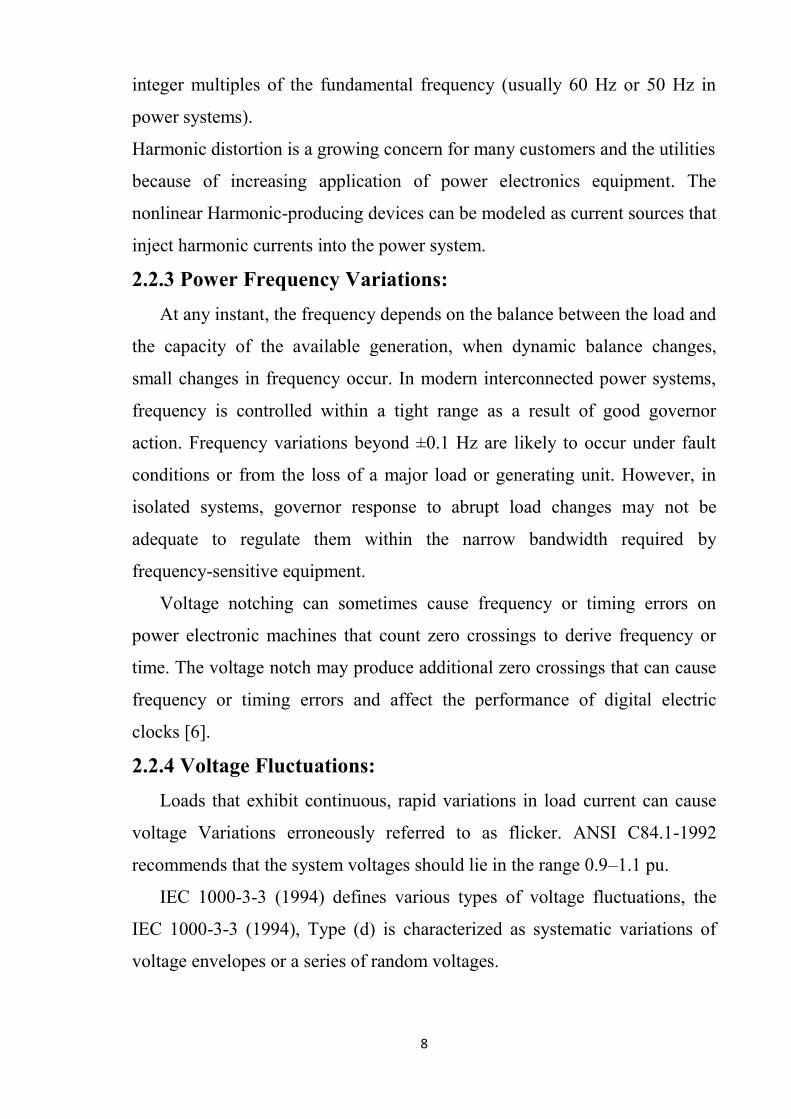
Voltage stability can be classified into: large disturbance voltage, small
disturbance, long term and short term voltage stability. The classifications are
illustrated in Figure 2.1.
10
Figure 2.1: classifications of voltage stability
2.4 Reactive Power and Voltage Control:
Reactive power (Q):
It is consequence of an AC system. Reactive power is used to build up
magnetic fields. It is measured in VAR, KVAR, MVAR& calculated as
Q=Ssin(𝜑) or Q=Ptan(𝜑) (2.1)
For efficient and reliable operation of power systems, the control of
voltage and reactive power should satisfy the following objectives: -
1. Voltages at the terminals of all equipment in the system are within
acceptable limits. Both utility equipment and customer equipment are
designed to operate at a certain voltage rating. Prolonged operation of the
equipment at voltages outside the allowable range could adversely affect their
performance and possibly cause the damage.
2. System stability is enhanced to maximize utilization of the transmission
system.
3. The reactive power flow is minimized so as to reduce R𝐼2 and X𝐼2 losses
to a practical minimum. This ensures that the transmission system operates
efficiently.
The problem of maintaining voltages within the required limits is
complicated by the fact that the power system supplies power to a vast
11
number of loads and is fed from many generating units. As loads vary the
reactive power requirements of the transmission system vary. Since reactive
power cannot be transmitted over long distances, voltage control has to be
effected by using special devices dispersed throughout the system. This is in
contrast to the control of frequency which depends on the overall system
active power balance. The proper selection and coordination of equipment for
controlling reactive power and voltage are among the major challenges of
power system engineering [7].
2.5 Production and Absorption of Reactive Power:
Synchronous generators can generate or absorb reactive power depending
on the excitation. When overexcited they supply reactive power, and when
under excited they absorb reactive power. The capability to continuously
supply or absorb reactive power is, however, limited by the field current,
armature current, and end-region heating limits.
Synchronous generators are normally equipped with automatic voltage
regulators which continually adjust the excitation so as to control the armature
voltage.
2.6 Traditional Method of Voltage Control:
There are many methods to control the voltage such as shunt reactor,
shunt capacitor, synchronous condenser and tap changer transformer.
2.6.1 Shunt reactor:
Shunt reactor are used to compensate line capacitance effects by limiting
voltage rise when a circuit is open or when operating under light loads. They
are used for EHV overhead lines longer than150-200km. Shunt reactor is
absorption the reactive power generation in line due to rise voltage. If the
shunt reactor were not employed the reactive power generator by capacitance
can cause high voltage at the receiving end of the line.
Shunt compensate reduce the maximum power limit of the line. In case
line shunt are switched out under heavy loads condition. The max power
12
transfer can be considerably increase, but voltage variation due to sudden load
throw off are likely to be unacceptably high. In actual practice some of shunt
reactors are kept connected permanently so as to avoid voltage increased due
sudden fall in load from heavy load condition [8].
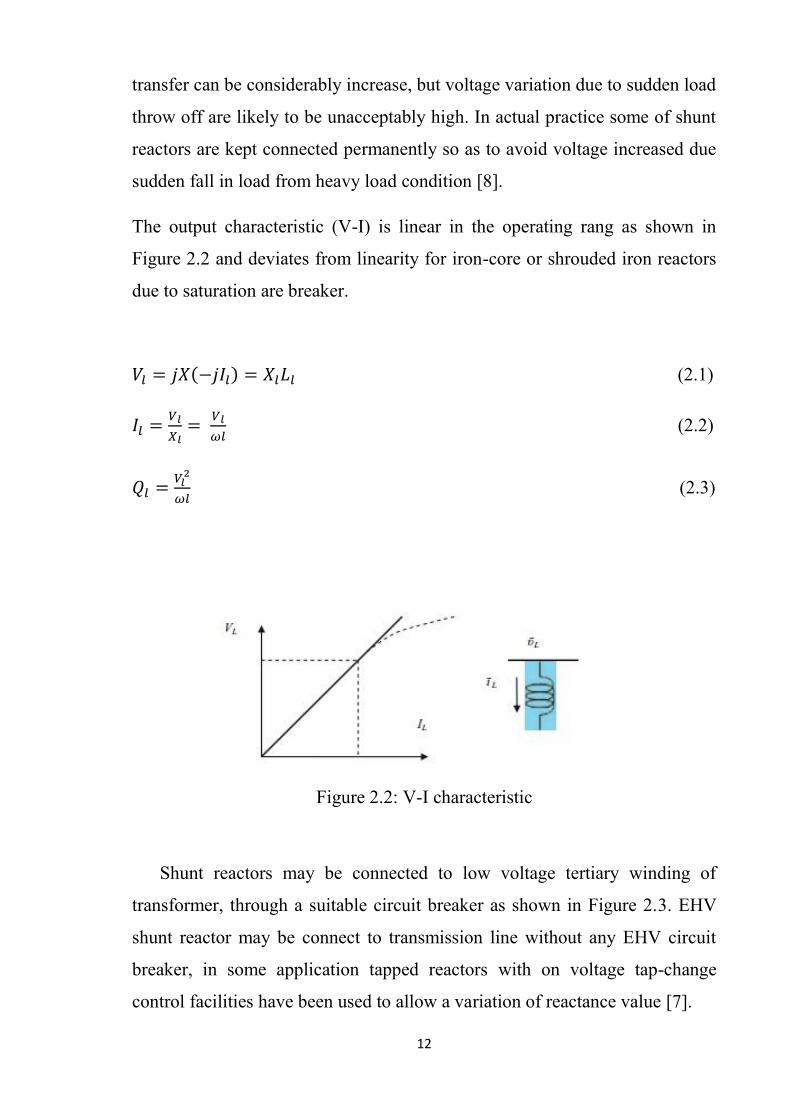
The output characteristic (V-I) is linear in the operating rang as shown in
Figure 2.2 and deviates from linearity for iron-core or shrouded iron reactors
due to saturation are breaker.
𝑉𝑙 = 𝑗𝑋(−𝑗𝐼𝑙) = 𝑋𝑙𝐿𝑙 (2.1)
𝐼𝑙 =𝑉𝑙
𝑋𝑙=
𝑉𝑙
𝜔𝑙 (2.2)
𝑄𝑙 =𝑉𝑙
2
𝜔𝑙 (2.3)
Figure 2.2: V-I characteristic
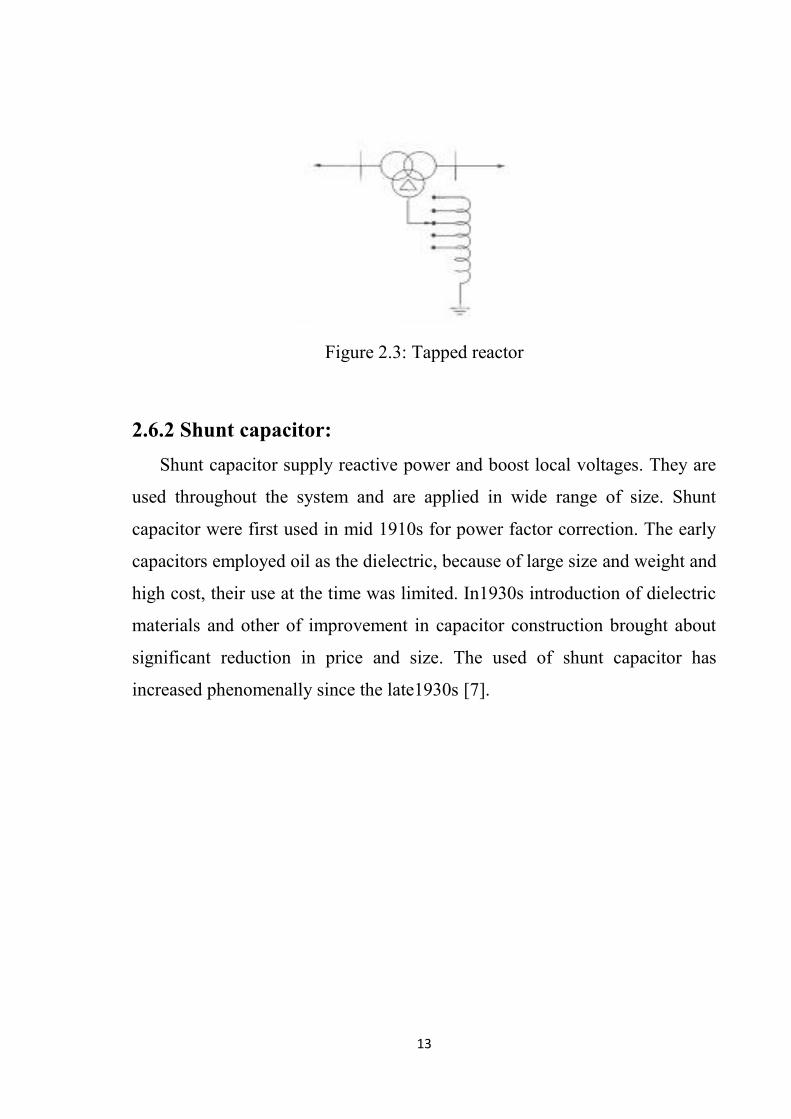
Shunt reactors may be connected to low voltage tertiary winding of
transformer, through a suitable circuit breaker as shown in Figure 2.3. EHV
shunt reactor may be connect to transmission line without any EHV circuit
breaker, in some application tapped reactors with on voltage tap-change
control facilities have been used to allow a variation of reactance value [7].
13
Figure 2.3: Tapped reactor
2.6.2 Shunt capacitor:
Shunt capacitor supply reactive power and boost local voltages. They are
used throughout the system and are applied in wide range of size. Shunt
capacitor were first used in mid 1910s for power factor correction. The early
capacitors employed oil as the dielectric, because of large size and weight and
high cost, their use at the time was limited. In1930s introduction of dielectric
materials and other of improvement in capacitor construction brought about
significant reduction in price and size. The used of shunt capacitor has
increased phenomenally since the late1930s [7].
14
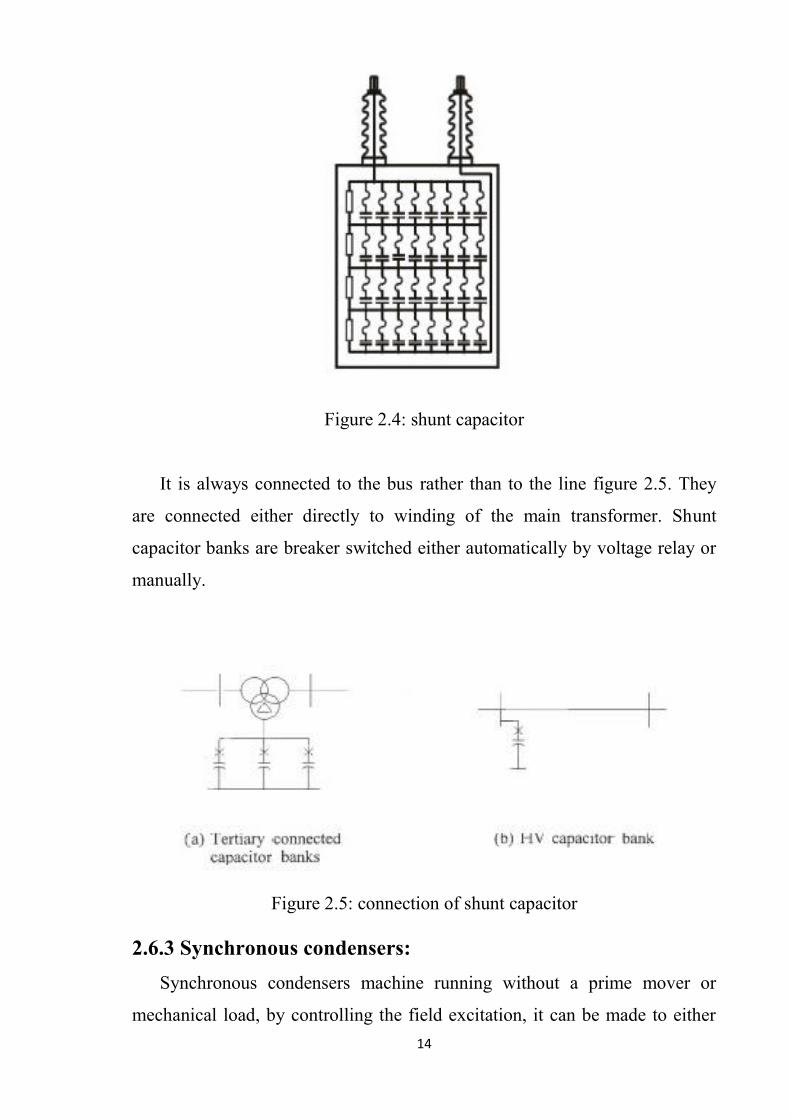
Figure 2.4: shunt capacitor
It is always connected to the bus rather than to the line figure 2.5. They
are connected either directly to winding of the main transformer. Shunt
capacitor banks are breaker switched either automatically by voltage relay or
manually.
Figure 2.5: connection of shunt capacitor
2.6.3 Synchronous condensers:
Synchronous condensers machine running without a prime mover or
mechanical load, by controlling the field excitation, it can be made to either
15
generate or absorb reactive power, with a voltage regulator, can automatically
adjust the reactive power output to maintain terminal voltage, it draws a small
amount of active power from power system to supply losses. The efficiency
of machines is very high because values of the losses are percentage of KVA
rating is very low (4-6present).
Synchronous condensers have used since the1930s for voltage and
reactive power control both transmission and sub-transmission levels, they are
often connected to tertiary winding transformer. Asynchronous condenser
provides a step-less automatic power factor correction with ability to produce
up 150%aditional MVARs. Condenser can be installed inside or outside and
are relatively small in size. The system produces no switching transient and is
not affected by system electrical harmonics; some harmonics can even be
absorbed by condenser.
It can provide voltage support even during a short power outage. Unlike
other form of shunt compensation, it has an internal voltage source and better
able to cope with low system voltage condition.
Recent applications of synchronous have been mostly at HVDC converter
station connected to weak system, they are used there to increase the network
strength by improving short circuit capacity and to improve commutation
voltage [9].
2.6.4 Use of tap changing transformer:
All power transformers and many distribution transformers has taps in one
or more windings for changing ratio that's for controlling voltage at all levels.
The principle of regulating the secondary voltage is based on changing the
number of turns on primary or secondary.
There is always a tapping on the HV winding which when connected to
the rated voltage gives rated voltage on the LV side.
16
2.7 Modern Method of Voltage Control (FACTS):
The rapid development of power electronics technology provides exciting
opportunities to develop new power system equipment for better utilization of
existing systems. Since 1990 a number of control devices under the term
FACTs technology have been proposed and implemented.
According to IEEE, FACTS, which is the abbreviation of Flexible AC
Transmission systems, is defined as follows:
Alternating current transmission systems is combination of power
electronics components and others static controllers, to enhance
controllability and increase power transfer capability of the network in power
system, one widely used FACTs device is the Static VAR Compensator
(SVC). A SVC can improve the voltage profiles in the transient and steady
state; therefore it can improve the quality and performance of the electric
services. It can be controlled externally by using different types of controller
switch can improve voltage stability of a large scale power system.
SVC application studies require appropriate power system models and
study methods to solve particular problems. There are several studies which
are required for an SVC application:
• Load flow studies.
• Harmonic studies.
• Transient stability studies, both small and large disturbances.
• Fault studies.
2.8 FACTS devices:
FACTS controllers intend for steady-state operation are as follows
(IEEE/CIGRE, 1995):
Thyristor-controlled phase shifter (PS): this controller is an electronic
phase-shifting transformer adjusted by thyristor switches to provide a
rapidly varying phase angle.
Load tap changer (LTC): this may be considered to be a FACTS
controller if tap changes controlled by thyristor switches.
17
Thyristor -controlled reactance (TCR): this is a shunt- controlled,
Thyristor-controlled reactance the effective reactance of which is
varied in a continuous manner by partial conduction control of the
Thyristor value.
Thyristor-controlled series capacitor (TCSC): this consists of a cerise
capacitor paralleled by a Thyristor-controlled reactor in order to
provide smooth variable series compensation.
Interphase power controller (IPC): this is a series-connected controller
comprising two parallel blanchers, one inductive and capacitive,
subject to separate phase-shifted voltage magnitudes. active power
control is set by independent or coordinated adjust-mint of the two
phase shifting sources and the two variable reactance’s. Reactive
power control is independent of active power.
Static compensator (STATCOM): this is a solid-state synchronous
connected in shunt with the ac system. The output current is adjusted
to control either the nodal voltage magnitude or the reactive power
injected at the bus.
Solid state series controller (SSSC): this controller is similar to the
STATCOM but it is connected in series with the AC system. The
output current is adjusted to control either the nodal voltage magnitude
or the reactive power injected at one of the terminal of the series
connected transformer.
Unified power flow controller (UPFC): this consists of a static
synchronous series compensator (SSSC) and a STATCOM, connected
in such a way that they share a common DC capacitor. The UPFC, by
means of an angularly, the transmission line impedance, the nodal
voltage magnitude, and the active and reactive power flow through it.
It may also provide independently controllable shunt reactive
compensation.
Static VAR compensator (SVC): This is a shunt-connected static
source or sinks reactive power.
High –voltage direct-current (HVDC) link: this is controller
comprising a rectifier station and an inverter station, joined either back
–to –back or through a DC cable.
18
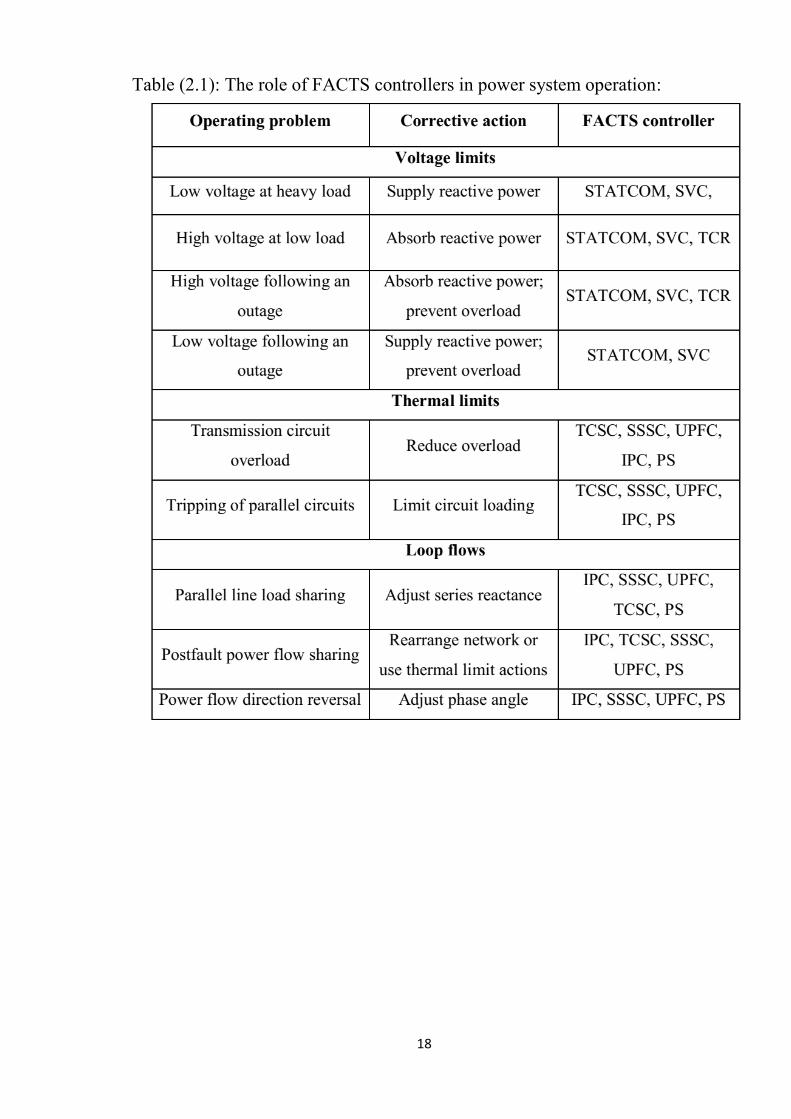
Table (2.1): The role of FACTS controllers in power system operation:
19
CHAPTER THREE
STATIC VAR COMPENSATOR (SVC)
3.1 Introduction:
The Static VAR Compensator (SVC) is today considered a very mature
technology. It has been used for reactive power compensation since the
1970s. An SVC is a shunt connected FACTS device whose output can be
adjusted to exchange either capacitive or inductive currents to the connected
system. This current is controlled to regulate specific parameters of the
electrical power system (typically bus voltage).
The Thyristor has been an integral part in realizing the SVC and to enable
control of its reactive power flow. It is used either as a switch or as a
continuously controlled valve by controlling the firing angle. It should be
noted that the SVC current will contain some harmonic content, something
that needs attention in the design process [10].
3.2 Operating Principles:
The Static VAR Compensator (SVC) is composed of the capacitor
banks/filter banks and air-core reactors connected in parallel. The air-core
reactors are series connected to Thyristor. The current of air-core reactors can
be controlled by adjusting the fire angle of Thyristors.
The SVC can be considered as a dynamic reactive power source. It can
supply capacitive reactive power to the grid or consume the spare inductive
reactive power from the grid. Normally, the system can absorb the reactive
power from a capacitor bank, and the spare part can be consumed by an air-
core shunt reactor.
As mentioned, the current in the air-core reactor is controlled by a
Thyristor valve. The valve controls the fundamental current by changing the
fire angle, ensuring the voltage can be limited to an acceptable range at the
20
injected node (for power system VAR compensation), or the sum of reactive
power at the injected node is zero which means the power factor is equal to 1
(for load VAR compensation).
Current harmonics are inevitable during the operation of Thyristor
controlled rectifiers, thus it is essential to have filters in a SVC system to
eliminate the harmonics. The filter banks can not only absorb the risk
harmonics, but also produce the capacitive reactive power.
The SVC uses closed loop control system to regulate bus bar voltage,
reactive power exchange, power factor and three phase voltage balance.
3.3 Advantages of SVC:
Advantages of SVCs over simple mechanically switched compensation
schemes are their near-instantaneous response to change in the system
voltage. For this reason, they are often operated at close to their zero-point in
order to maximize the reactive power correction. They are in general cheaper,
higher-capacity, faster, and more reliable than dynamic compensation
schemes such as synchronous compensators (condensers). In a word:
1. Improved system steady-state stability.
2. Improved system transient stability.
3. Better load division on parallel circuits.
4. Reduced voltage drops in load areas during severe disturbances.
5. Reduced transmission losses.
6. Better adjustment of line loadings.
3.4 SVC Components:
This section presents the different “building blocks” that are commonly
used when designing an SVC. The components are presented individually to
21
describe their influence on the grid. We will also briefly discuss some of the
problems associated with the components and how these could be handled.
This is done to give some insight into how an SVC operates [10].
The different building blocks presented in this section are illustrated in
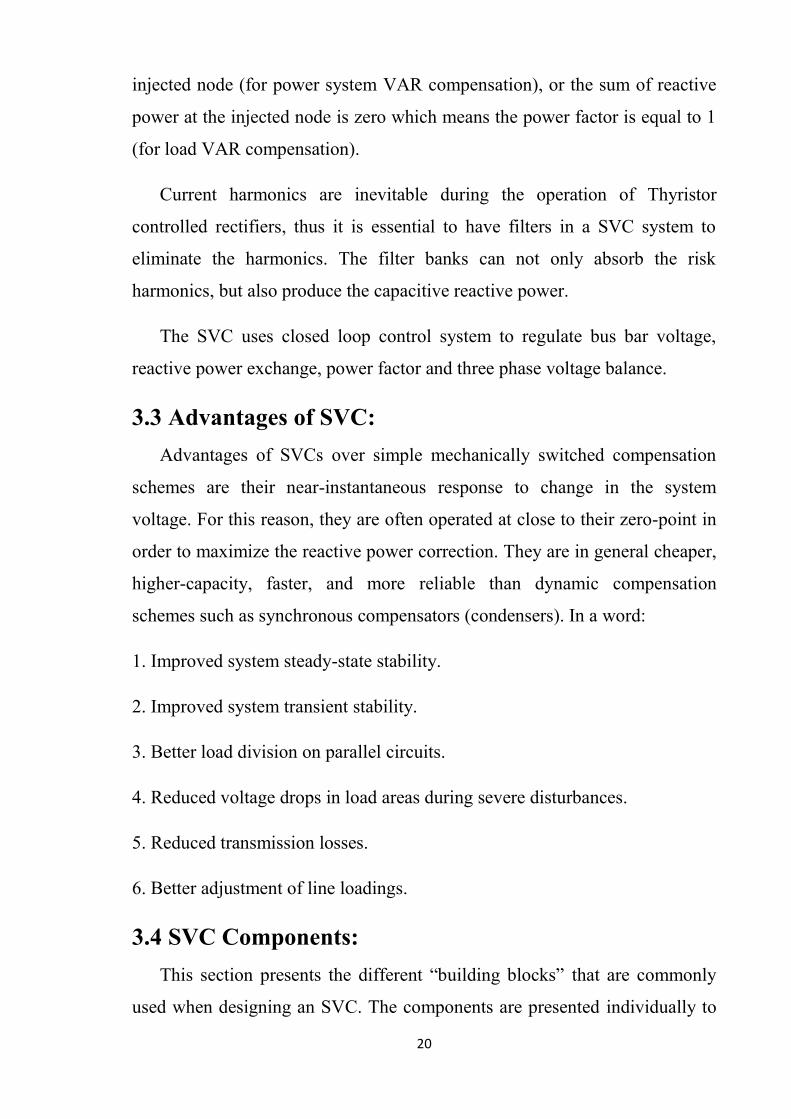
figure 3.1:
Figure 3.1: One-line diagram of the common SVC components.
3.4.1 Thyristor Switched Capacitor:
The Thyristor switched capacitor (TSC) is a shunt connected capacitor
that is switched ON or OFF using Thyristor valves [31]. Figure 3.1(b) shows
the one-line diagram of this component. The reactor connected in series with
the capacitor is a small inductance used to limit currents. This is done to limit
the effects of switching the capacitance at a non-ideal time [10].
We assume that the TSC in figure 3.1(b) comprises the capacitance C, the
inductance L and that a sinusoidal voltage is applied
v(t) = V sin(𝜔0t) (3.1)
22
Where 𝜔0 is the nominal angular frequency of the system, i.e. 𝜔0 = 2π𝑓0 =
2π50 rad/s in a 50 Hz system.
The current through the TSC branch at any given time is determined by: [10]
I(t) = I cos(𝜔0t + α) − I cos(α) cos(𝜔𝑟t) + nBc (𝑉𝑐0− 𝑛2
𝑛2−1 V sin(α)) sin(𝜔𝑟t)
(3.2)
Where α is the Thyristor firing angle, 𝜔𝑟 is the TSC resonant frequency, 𝑉𝑐0
is the voltage across the capacitor at t = 0. The current amplitude I is
determined by:
I = V𝐵𝑐𝐵𝑙
𝐵𝑐+𝐵𝑙 (3.3)
Where Bc is the capacitor susceptance and BL is the reactor susceptance and
n is given by:
n = 1
√𝜔2𝐿𝐶= √
𝑋𝑐
𝑋𝑙 (3.4)
𝑋𝑐 and 𝑋𝑙 above are the reactances of the capacitor and reactor. The TSC
resonant frequency, 𝜔𝑟, is defined by:
𝜔𝑟 = n𝜔0 = 1
√𝐿𝐶 (3.5)
We can alternatively express the magnitude of the TSC current (3.3):
I = V𝐵𝑐𝐵𝑙
𝐵𝑐+𝐵𝑙= 𝑉𝐵
𝑛2
𝑛2−1 (3.6)
If we consider the steady-state case without a series connected reactor and
note that the magnitude of the TSC current is determined by:
I = V𝐵𝑐 (3.7)
Comparing (3.6) and (3.7) we notice that adding the reactor L amplifies the
current by 𝑛2/(𝑛2 − 1). As n is determined by 𝑋𝑙 and 𝑋𝑐, shown in (3.4), the
23
Lc circuit have to be carefully designed to avoid resonance. This is normally
done by keeping the inductor reactance 𝑋𝑙 at 6% of 𝑋𝑐 .
Careful design of the TSC can thus avoid a resonance with the connected
grid. However, the oscillatory component of the current (3.2) is still
something that has to be taken care of. The following section provides some
insight into how these currents could be limited to a minimum [10].
3.4.2 Thyristor Switched Reactor:
The Thyristor switched reactor (TSR) is a shunt-connected reactor in
series with a Thyristor valve that is used to switch the reactor ON or OFF. A
one-line diagram of a TSR is shown in figure 3.1(a).
Basically, the TSR fulfills the same purpose as the shunt-connected
mechanically switched reactor which has been employed in the AC
transmission system since its early days. The only difference between these
two components is that the former uses a Thyristor to switch the reactor in
and out of operation, while the latter uses a mechanical switch. Compared to
the mechanical switch, the Thyristor allows the switching process to be a lot
faster another advantage is that it will not face the same limitations on wear
and tear as a mechanical switch, which is only capable of a finite number of
switches. The higher investment cost could possibly be earned by the
reduction in service and maintenance costs of the mechanical switches [10].
As the switched reactor is not a common component in SVC installations,
only this short description is provided for the sake of completeness. The
controllable reactor is a much more useful and common component and this
will be described in the following section [10].
24
3.4.3 Thyristor Controlled Reactor:
The Thyristor controlled reactor (TCR) can be represented by the same
one line diagram as for the previously mentioned TSR, shown in figure 3.1a.
By enforcing partial conduction of the Thyristor valve, the effective reactance
of the inductor may be varied in a continuous manner.
This is achieved by controlling the firing angle α of the Thyristor valve,
thus controlling the TCR susceptance and its ability to absorb reactive power.
As the firing angle can be varied continuously from zero to full conduction,
the field of operation of the TCR is much greater compared to the discretely
switched TSR.
The operation range of the firing angle lies between 90° and 180°, which
respectively corresponds to full conduction and no conduction.
Operating within the firing angle interval, 0° ≤ 𝛼 <90°, introduces a DC
offset to the reactor current which disturbs the Thyristor valve [11]. Thus, this
interval should be avoided.
We assume that a TCR branch with inductance L is connected to the AC
voltage given by:
𝑣(𝑡) = 𝑉 sin(𝜔) (3.7)
The voltage induces a current through the reactor described by the differential
equation:
v(t) = L𝑑𝑖
𝑑𝑡 (3.8)
which, via integration, provides the expression of the TCR current:
i(t) = 1
𝐿∫ 𝑣(𝑡)𝑑𝑡 =
1
𝐿∫ 𝑉 sin(𝜔0 𝑡)𝑑𝑡 = −
𝑉
𝜔𝑜𝐿cos(𝜔0 t ) + 𝐷
𝜔𝑜
𝛼
𝜔𝑡
𝛼 (3.9)
Where D is a constant of integration.
25
The two intervals of conduction for the Thyristor valve are:
α < 𝜔0 𝑡 < 2π – α (3.10a)
π + α< 𝜔0 𝑡 < 3π – α (3.10b)
Where (3.10a) is the positive half period and (3.10b) is the negative.
We calculate the TCR current (3.9) by determining the integration constant D
for the two intervals in (3.10), which gives us the following:
I(t) = 𝑉
𝜔0 𝐿(cos(𝛼) − cos(𝜔0 𝑡)) (3.14a)
I(t) = −𝑉
𝜔0 𝐿(cos(𝛼) − cos(𝜔0 𝑡)) (3.14b)
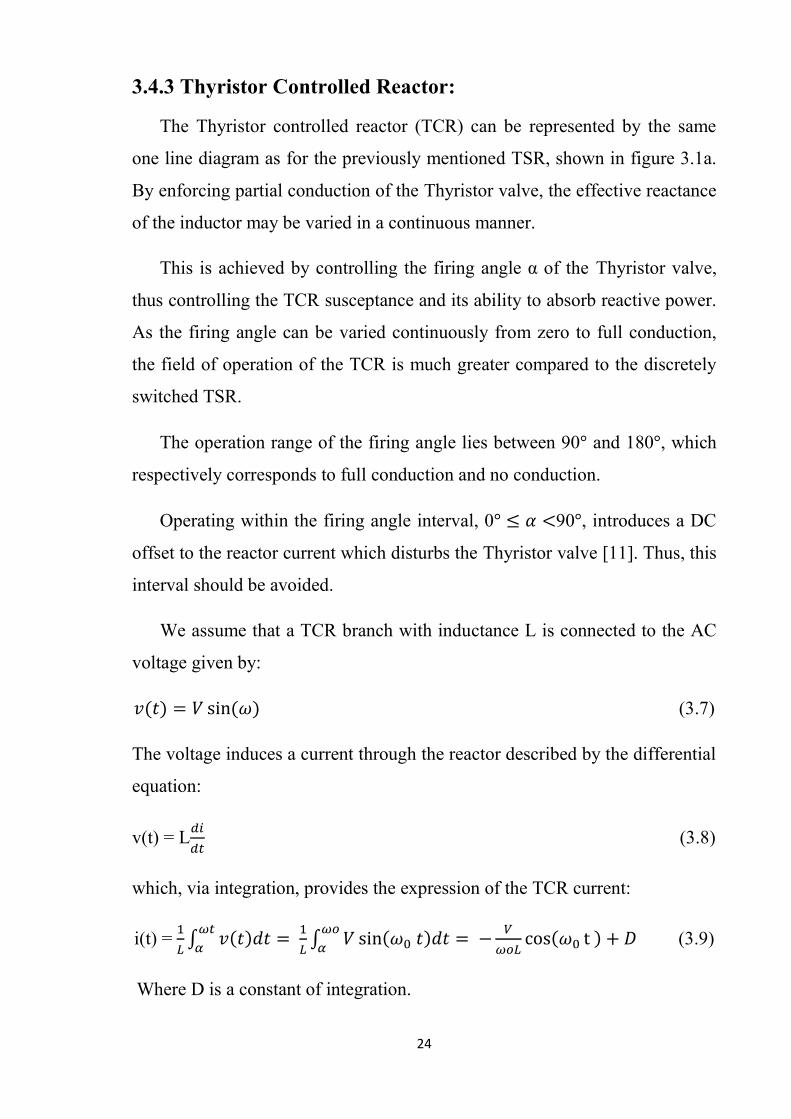
Figure 3.4 shows the reactor current for three different firing angles. Full
conduction is achieved at α = 90 and the reactor current decreases as α
increases. This can easily be seen as currents corresponding to α = 90, 120
and 150 are plotted together with the grid voltage v(t) [10].
Figure 3.2: Current through the TCR for different firing angles α, with the
applied voltage shown as the blue, dashed line.
26
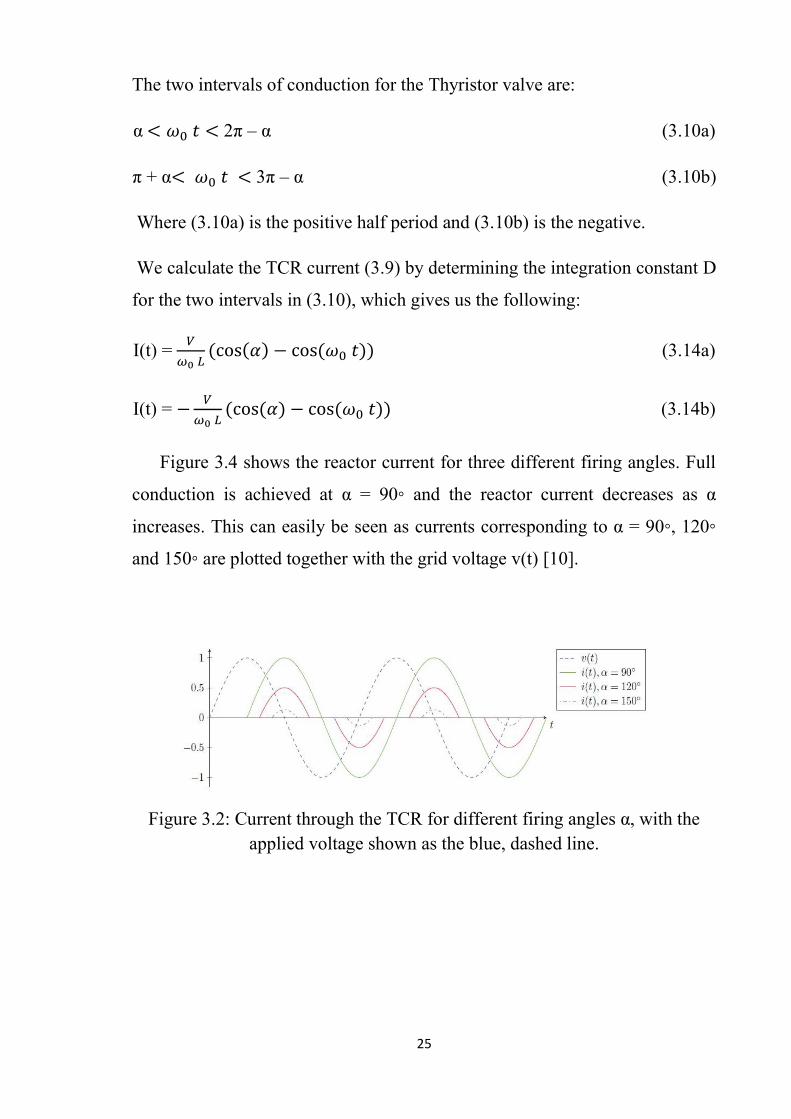
3.5 System Configuration:
The system configuration represented by figure (3.3)
Figure (3.3) System Configuration
3.5.1 Step-down Transformer:
The static VAR compensator is normally installed at low voltage side of
main transformer, otherwise a step-down transformer is needed to reduce the
voltage.
3.5.2 switch-gear:
The medium voltage switchgear typically includes isolating switches,
grounding switches and transformers. It can be installed indoor or outdoor.
27
3.5.3 Linear (Air-core) reactor:
The air-core reactor in static VAR compensator has high stability and high
linearity. It is used to absorb reactive power under the control of Thyristors.
Usually the air-core reactor is series connected to the Thyristor valve in delta-
connection and then connect the delta bridge to power grid.
3.5.4 Thyristor valve:
The Thyristor valve is the main control part in a SVC system. It is
composed of several series/paralleled connected Thyristors and its auxiliary
components. The Thyristors are triggered by electrical lighting system and it
adopts water cooling as the main cooling method.
3.5.5 Capacitor/filter banks:
The capacitor/filter banks can supply sufficient capacitive reactive power
to power grid and filter the harmful harmonics. The filter is composed of
capacitors, reactors and resistors, providing capacitive reactive power to the
entire system.
In practical, the capacitor/filter banks are divided into several sub-banks
which can be switched-in/switched-off by mechanical breakers or other
electrical switches according to the actual situation.
3.6 Common SVC Topologies:
The general SVC installation comprises two ranges of operation;
inductive and capacitive. When designing the SVC, we need to consider both
the required control performance and cost of the potential components.
As the SVC is usually designed to be continuously operated, we would
need a TCR in the installation. Adding a TCR will introduce harmonics to the
SVC current. To minimize the injection of harmonics caused by the TCR, a
filter network is usually included in the SVC installation.
In many SVC installations, a shunt connected fixed capacitance (FC) is
used to inject reactive power to the grid as this would provide a cheaper
28
solution. The fixed capacitance is usually partly or fully substituted by the
filters used to dampen the TCR induced harmonics. Using this FC-type
configuration would not need the expensive Thyristor valves and could thus
be equipped with simpler control equipment.
Considering the FC-TCR type SVC, it can be noted that losses will
increase as we increase the current through the TCR. Therefore, it is usually
installed where the output is mostly capacitive as in e.g. industrial
applications for power factor control. Combining the TSC and TCR to make
up the SVC would be a more advantageous approach for transmission system
applications. This configuration makes it possible to minimize the losses by
dividing the total capacitance into a number of Thyristor switched
capacitances. This allows us to minimize the current through the TCR and
will thus minimize the losses [10].
To summarize, the most common topologies when designing SVC systems
are:
• Fixed capacitors & Thyristor controlled reactor (FC-TCR).
• Thyristor switched capacitors & Thyristor controlled reactor (TSC-TCR).
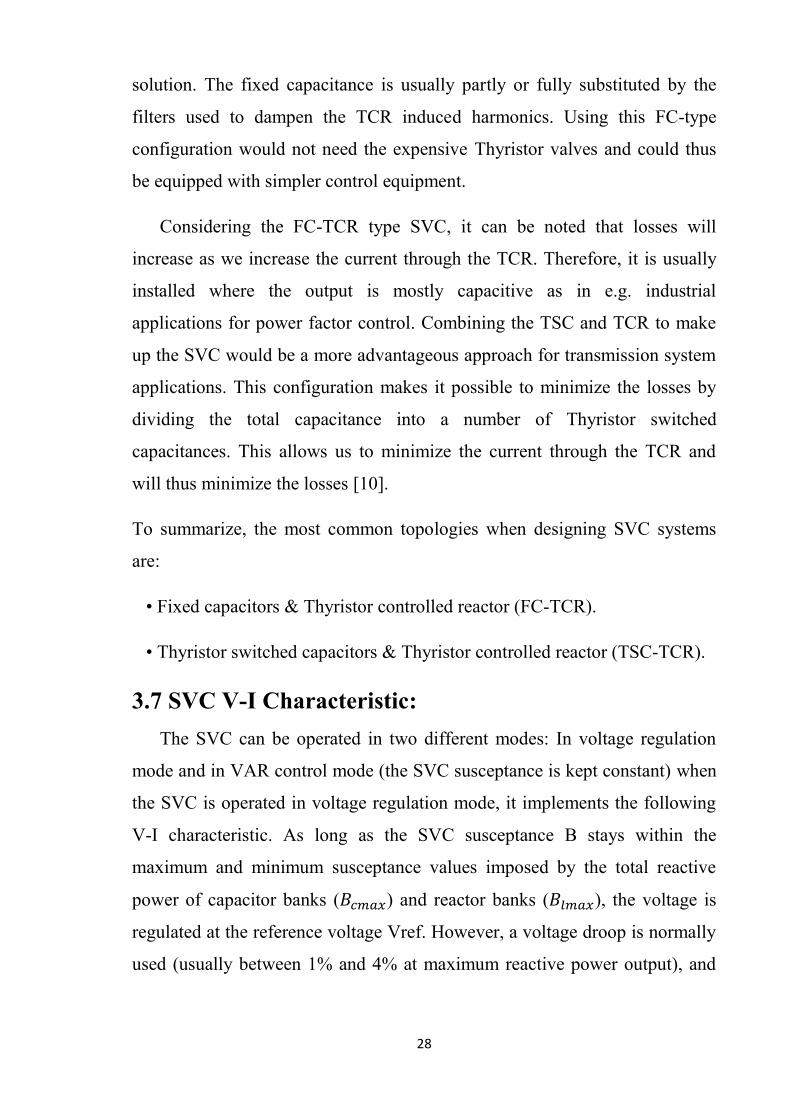
3.7 SVC V-I Characteristic:
The SVC can be operated in two different modes: In voltage regulation
mode and in VAR control mode (the SVC susceptance is kept constant) when
the SVC is operated in voltage regulation mode, it implements the following
V-I characteristic. As long as the SVC susceptance B stays within the
maximum and minimum susceptance values imposed by the total reactive
power of capacitor banks (𝐵𝑐𝑚𝑎𝑥) and reactor banks (𝐵𝑙𝑚𝑎𝑥), the voltage is
regulated at the reference voltage Vref. However, a voltage droop is normally
used (usually between 1% and 4% at maximum reactive power output), and
29
the V-I characteristic has the slope indicated in the Figure (3.4) The V-I
characteristic is described by the following three equations [12].
SVC is in regulation range (-𝐵𝑐𝑚𝑎𝑥< B <𝐵𝑙𝑚𝑎𝑥) (3.12)
V=1
𝐵𝑐𝑚𝑎𝑥 (3.13)
V = 𝑉𝑟𝑒𝑓 + 𝑋𝑠𝑖 (3.14)
SVC is fully inductive (B=𝐵𝑙𝑚𝑎𝑥)
Where,
V = Positive sequence voltage (p.u)
I = Reactive current (p.u./Phase) (I > 0 indicates an inductive current)
𝑋𝑠 = Slope or droop reactance (p.u./Phase)
𝐵𝑐𝑚𝑎𝑥 = Maximum capacitive susceptance (p.u./Phase) with all TSCs
in service, no TSR or TCR
𝐵𝑙𝑚𝑎𝑥 = Maximum inductive susceptance (p.u./Phase) with all TSRs in
service or TCRs at full conduction, no TSC
Phase = Three-phase base power
Figure 3.4: The V-I Characteristic Curve of SVC
30
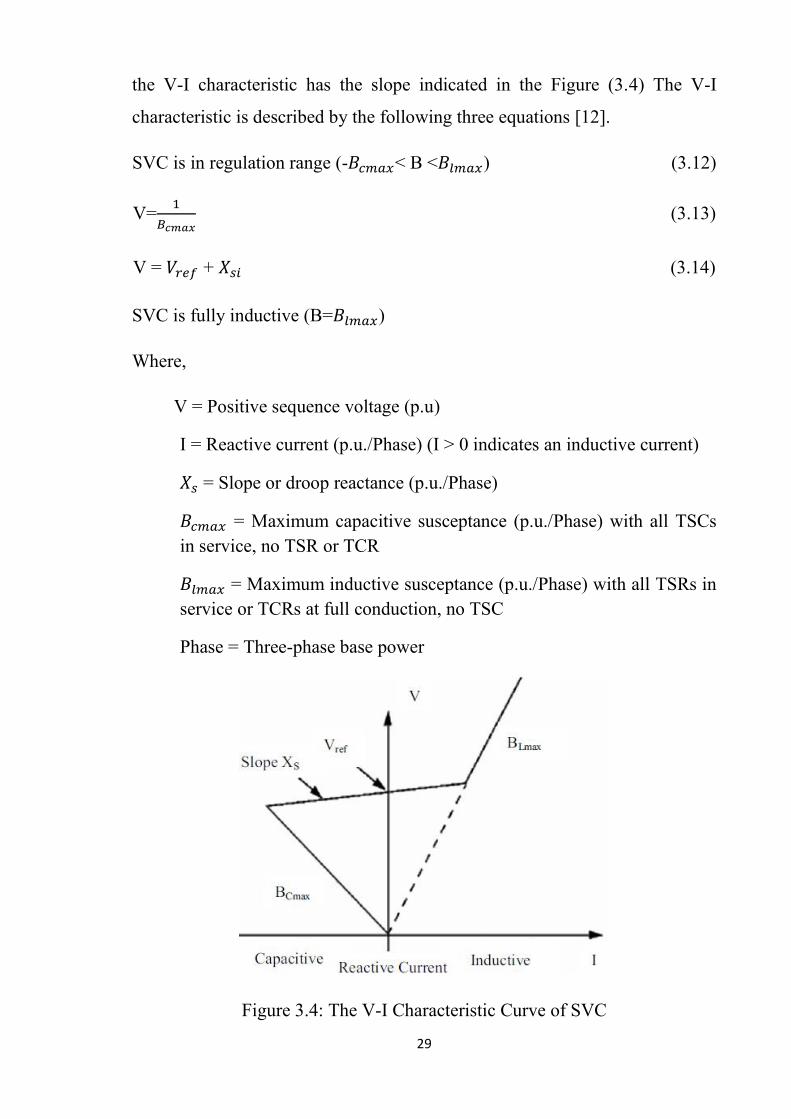
3.8 Modelling of SVC:
SVC is a Shunt FACTS device which is considered a variable impedance
type device. The SVC uses conventional Thyristors to achieve fast control of
shunt connected capacitors and reactors. The configuration of the SVC is
shown in Figure (3.5), which basically consists of a fixed Capacitor (C) and a
Thyristor controlled reactor (L). The firing angle control of the Thyristor
banks determines the equivalent shunt admittance presented to the power
system [13].
Figure 3.5: SVC connected to a transmission line
𝐼𝑠𝑣𝑐 = 𝑗 𝐵𝑠𝑣𝑐 𝑉𝑚 (15)
The reactive power injected at bus m is
𝑄𝑠𝑣𝑐 = 𝑄𝑚 =𝐼𝑠𝑣𝑐 𝑉𝑚 = - 𝑉𝑚2𝐵𝑠𝑣𝑐 (3.16)
Where
𝐵𝑠𝑣𝑐 =1
𝑋𝑐𝑋𝑙 𝑋𝑙−𝑋𝑐
𝜋[2(𝜋 − 𝛼𝑠𝑣𝑐) + sin 𝛼𝑠𝑣𝑐] (3.17)
31
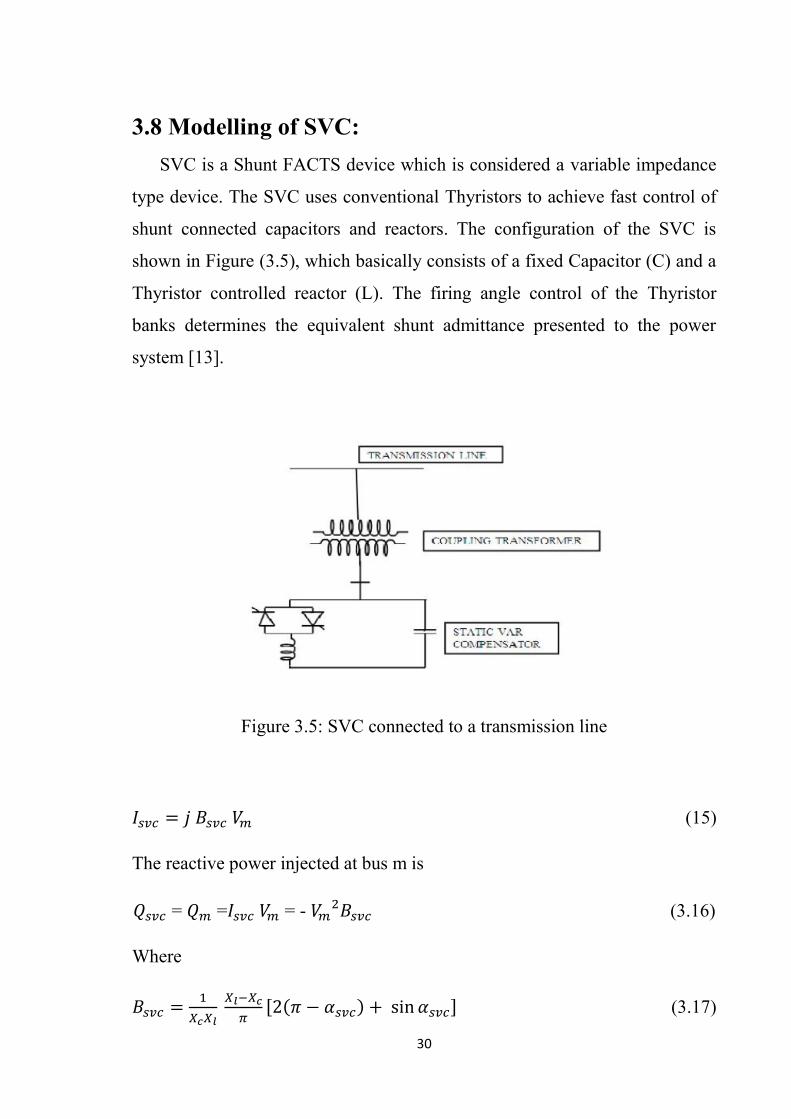
3.9 Control Concept of SVC:
An SVC is a controlled shunt susceptance (B) as defined by the SVC
control settings that injects reactive power (Q) into the system based on the
square of its terminal voltage. Figure (3.5) illustrates a TCR/FC SVC,
including the operational concept. The control objective of the SVC is to
maintain a desired voltage at the high-voltage bus. In the steady-state, the
SVC will provide some steady-state control of the voltage to maintain it the
high-voltage bus at a pre-defined level [14].
If the high-voltage bus begins to fall below its set point range, the SVC
will inject reactive power (𝑄𝑛𝑒𝑡) into the system (within its controlled limits),
thereby increasing the bus voltage back to its desired voltage level. If bus
voltage increases, the SVC will inject less (or TCR will absorb more) reactive
power (within its controlled limits), and the result will be to achieve the
desired bus voltage. From Figure (3.6), +𝑄𝑐𝑎𝑝 is a fixed capacitance value,
therefore the magnitude of reactive power injected into the system, 𝑄𝑛𝑒𝑡, is
controlled by the magnitude of -𝑄𝑖𝑛𝑑 reactive power absorbed by the TCR
[14].
32
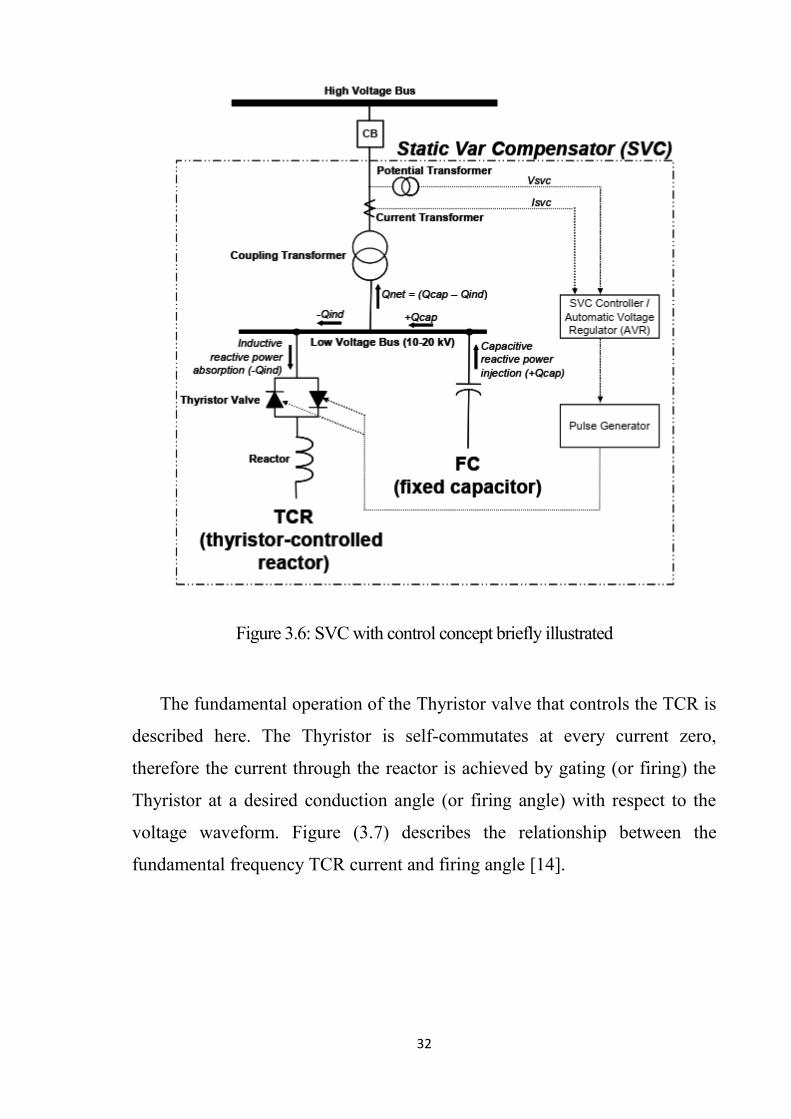
Figure 3.6: SVC with control concept briefly illustrated
The fundamental operation of the Thyristor valve that controls the TCR is
described here. The Thyristor is self-commutates at every current zero,
therefore the current through the reactor is achieved by gating (or firing) the
Thyristor at a desired conduction angle (or firing angle) with respect to the
voltage waveform. Figure (3.7) describes the relationship between the
fundamental frequency TCR current and firing angle [14].
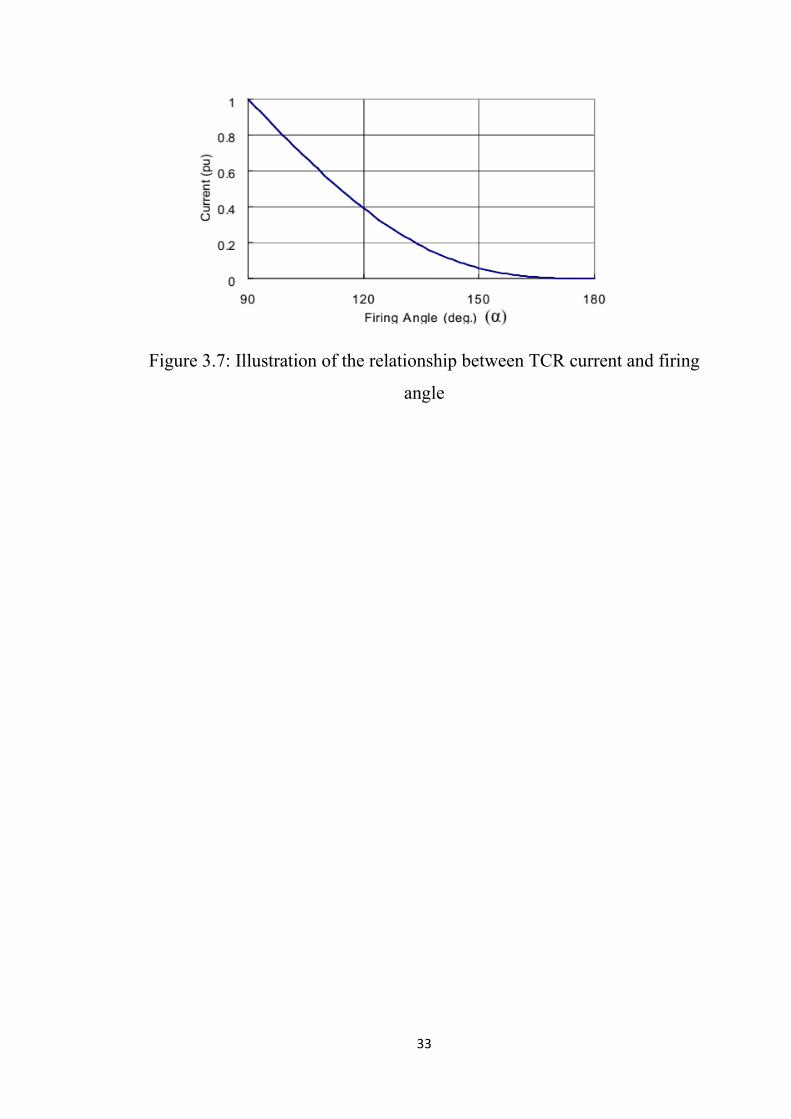
33
Figure 3.7: Illustration of the relationship between TCR current and firing
angle
34
CHAPTER FOUR
SIMULATION AND RESULT
4.1 Introduction:
In this chapter the voltage stability was studied for parts of Khartoum
substations Network which composed of (Almarkhiat, Alizergab, Almahadia,
Omdurman, Banat, Almugran and Alshagara with voltage levels of (500, 220,
110, 33)), the simulation was performed using ETAP software, the study was
carried out for three scenarios: Normal operation, 30% overload and
generation outages in Bant substation.
4.2 System Data:
The system data was obtained from the Sudanese Electrical Transmission
Company as in appendix A. The loads, capacitor, and generation were set to
compensator the parts which were not taken from National Sudanese
Network; Figure 4.1 shows the study case at normal operation.
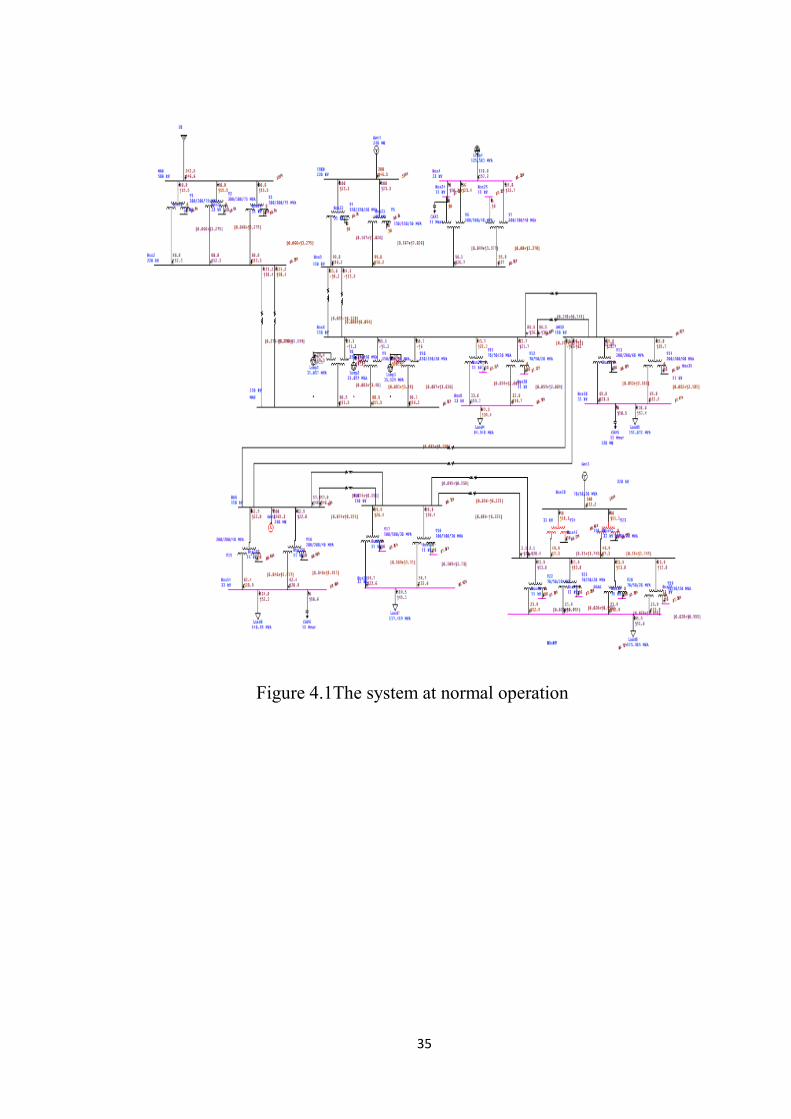
35
Figure 4.1The system at normal operation
36
4.3 Results:
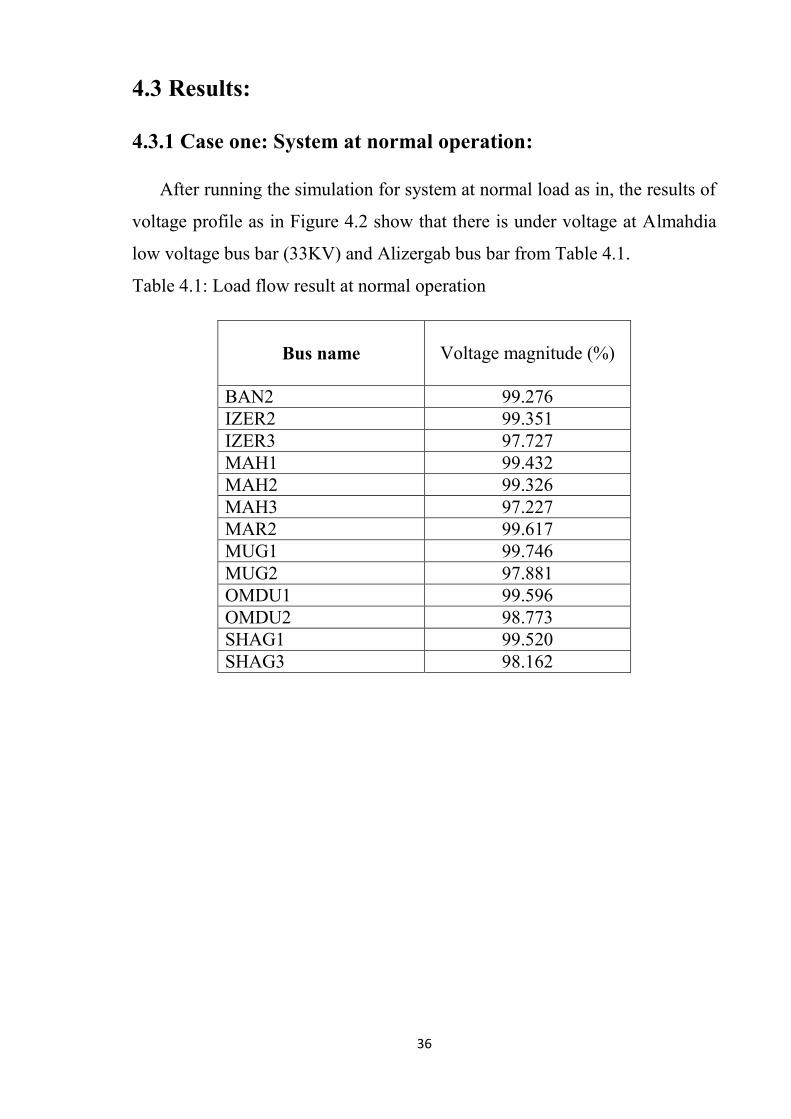
4.3.1 Case one: System at normal operation:
After running the simulation for system at normal load as in, the results of
voltage profile as in Figure 4.2 show that there is under voltage at Almahdia
low voltage bus bar (33KV) and Alizergab bus bar from Table 4.1.
Table 4.1: Load flow result at normal operation
Voltage magnitude (%)
Bus name
99.276 BAN2
99.351 IZER2
97.727 IZER3
99.432 MAH1
99.326 MAH2
97.227 MAH3
99.617 MAR2
99.746 MUG1
97.881 MUG2
99.596 OMDU1
98.773 OMDU2
99.520 SHAG1
98.162 SHAG3
37
Figure 4.2: voltage profile of system at normal operation.
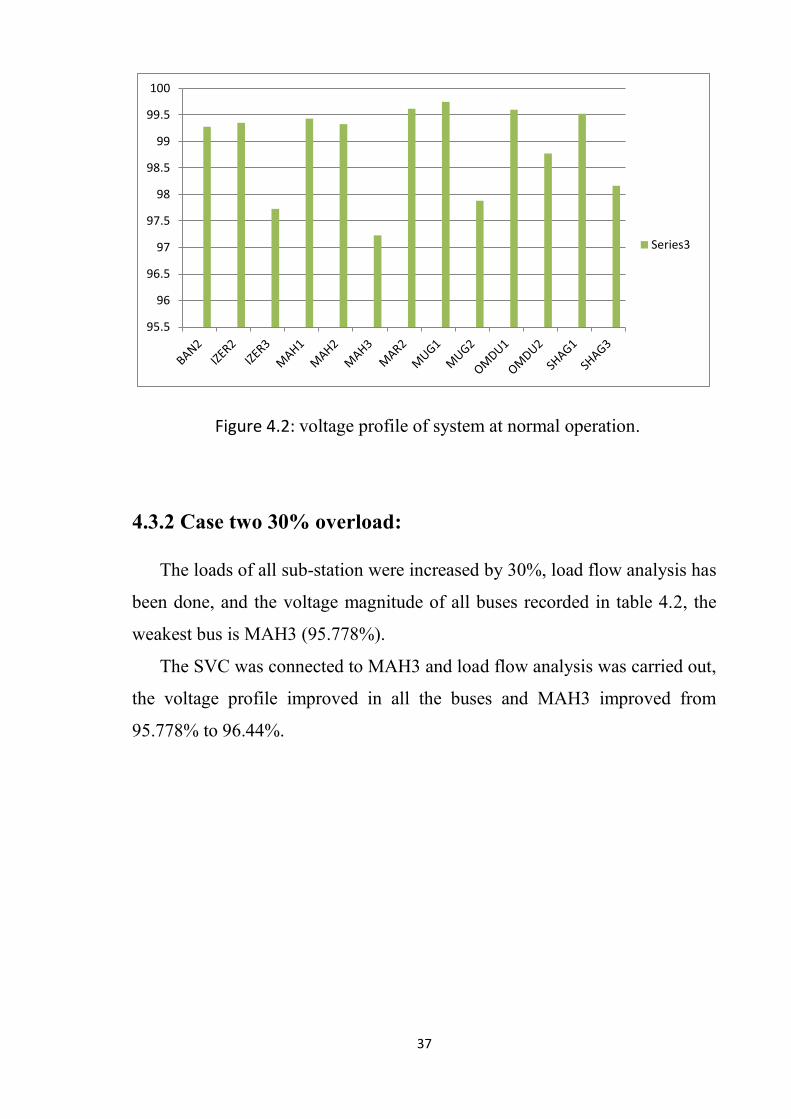
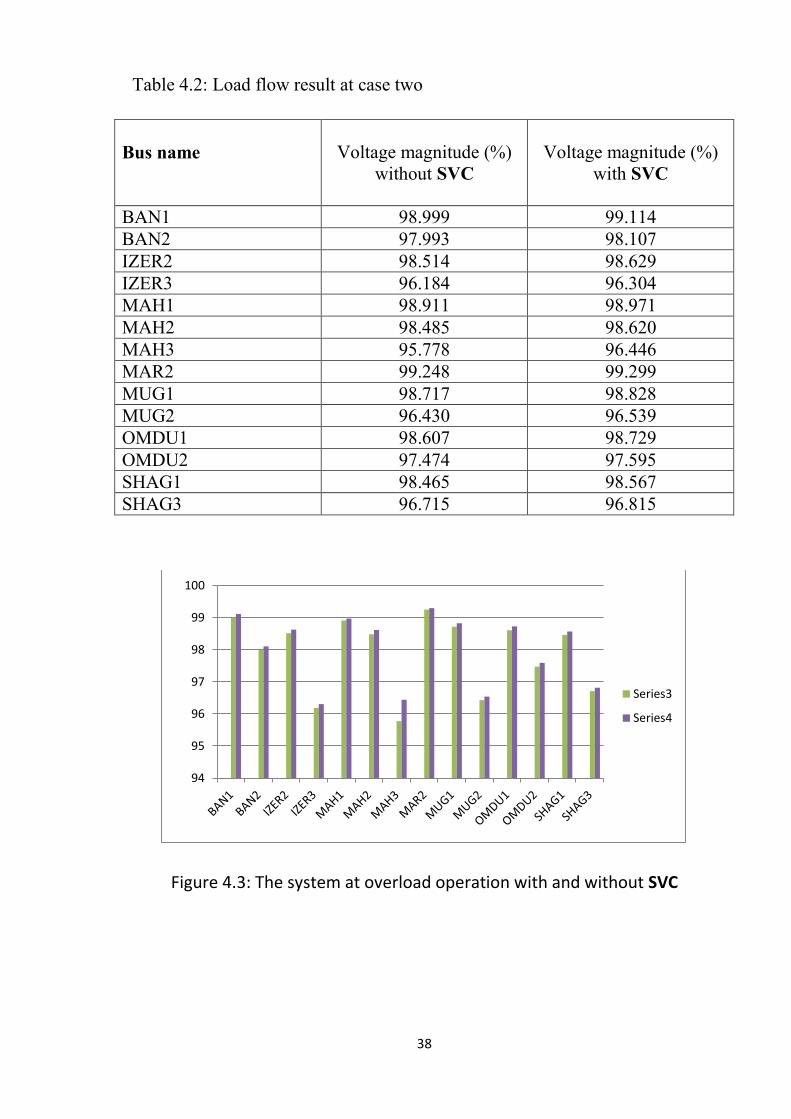
4.3.2 Case two 30% overload:
The loads of all sub-station were increased by 30%, load flow analysis has
been done, and the voltage magnitude of all buses recorded in table 4.2, the
weakest bus is MAH3 (95.778%).
The SVC was connected to MAH3 and load flow analysis was carried out,
the voltage profile improved in all the buses and MAH3 improved from
95.778% to 96.44%.
95.5
96
96.5
97
97.5
98
98.5
99
99.5
100
Series3
38
Table 4.2: Load flow result at case two
Voltage magnitude (%)
with SVC
Voltage magnitude (%)
without SVC
Bus name
99.114 98.999 BAN1
98.107 97.993 BAN2
98.629 98.514 IZER2
96.304 96.184 IZER3
98.971 98.911 MAH1
98.620 98.485 MAH2
96.446 95.778 MAH3
99.299 99.248 MAR2
98.828 98.717 MUG1
96.539 96.430 MUG2
98.729 98.607 OMDU1
97.595 97.474 OMDU2
98.567 98.465 SHAG1
96.815 96.715 SHAG3
Figure 4.3: The system at overload operation with and without SVC
94
95
96
97
98
99
100
Series3
Series4
39
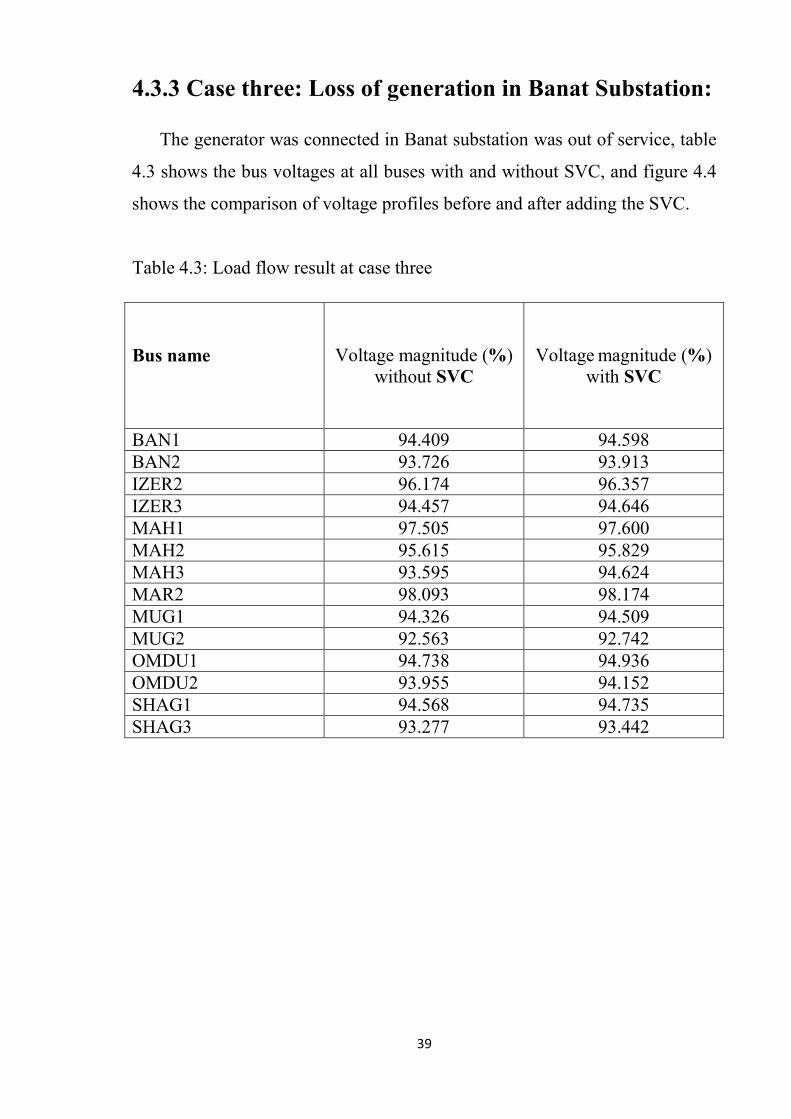
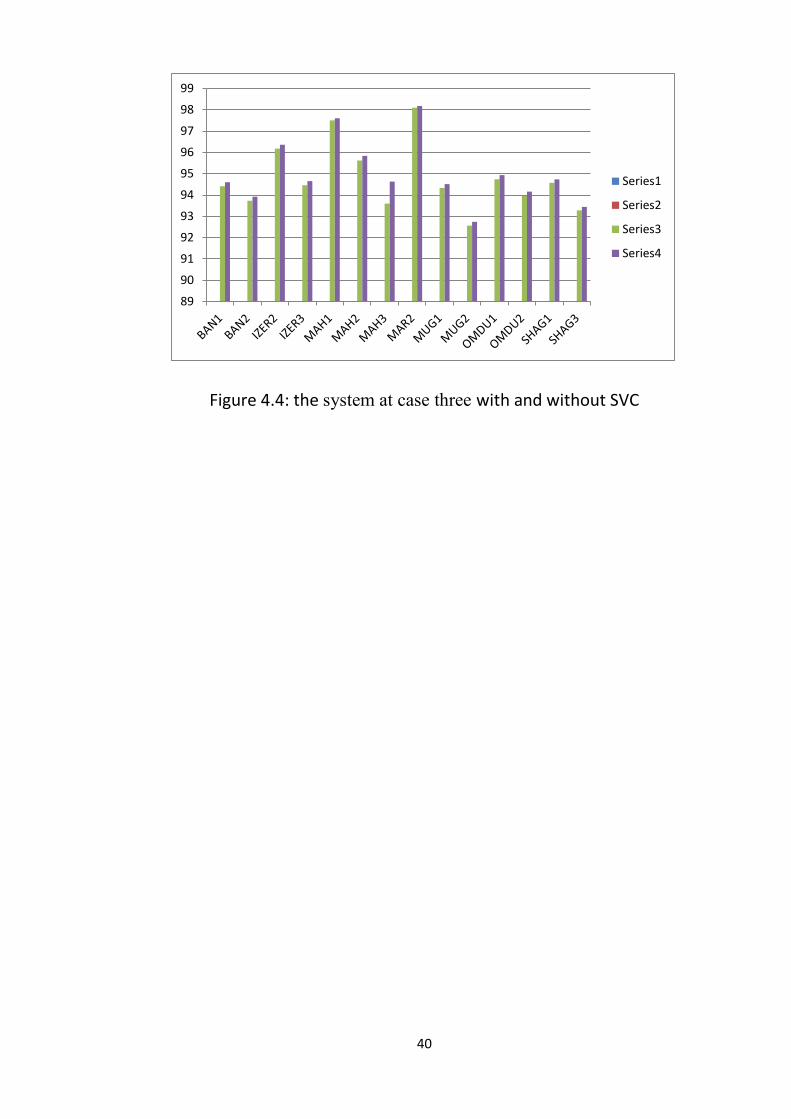
4.3.3 Case three: Loss of generation in Banat Substation:
The generator was connected in Banat substation was out of service, table
4.3 shows the bus voltages at all buses with and without SVC, and figure 4.4
shows the comparison of voltage profiles before and after adding the SVC.
Table 4.3: Load flow result at case three
Voltage magnitude (%)
with SVC
Voltage magnitude (%)
without SVC
Bus name
94.598 94.409 BAN1
93.913 93.726 BAN2
96.357 96.174 IZER2
94.646 94.457 IZER3
97.600 97.505 MAH1
95.829 95.615 MAH2
94.624 93.595 MAH3
98.174 98.093 MAR2
94.509 94.326 MUG1
92.742 92.563 MUG2
94.936 94.738 OMDU1
94.152 93.955 OMDU2
94.735 94.568 SHAG1
93.442 93.277 SHAG3
40
Figure 4.4: the system at case three with and without SVC
89
90
91
92
93
94
95
96
97
98
99
Series1
Series2
Series3
Series4
41
CHAPTER FIVE
CONCLUSION AND RECOMMENDATIONS
5.1 Conclusion:
Static VAR compensator (SVC) are easier to insert in the network sine they are
connected to the grid through a power transformer.
According to the results obtained from the simulation when using ETAP
software, the Static VAR compensator has proved it ability to improve the voltage
profile. In the case of 30% increase in load, the voltage increased after installing
SVC in all buses (in the weakest bus MAH3 from 95.778% to 96.44%). In case of
loss of generation also the results showed improvement in voltage profile.
5.2 Recommendations:
To study the optimum location for SVC which has been selected without
optimization.
Investigate the SVC effect in case of transient stability.
To study the effect of SVC on transmission losses and power transfer
capability.
Use another types of FACTs.
42
REFERENCES
[1] D.Das, “Electrical power system”, Kharagpur, Bengal, 2006.
[2] Shraavana Musunuri and Gholamreza Dehnavi, “Performance in Steady
State Voltage Stability Improvement, IEEE”, 2009.
[3]Mohammed Osman Hassan, “S. J. Cheng, Senior Member, IEEE, Zakaria
Anwar Zakaria, Steady-State Modeling of SVC and TCSC for Power Flow
Analysis Proceedings of the International Multi Conference of Engineers and
Computer Scientists”, 2009.
[4] HadiSaadat, “Power system analysis”, United States of America, 1990.
[5] Dennis Carlton, Jeffreymperloff, Klaas Tvon’t veld, “Modern industrial
organization”, 1990.
[6] R. Sastry Vadim, Mulukutla Sarma, “Power Quality, VAR compensation
in power systems”, 2009.
[7] PrahaKundur, “Power system stability and control”, the McGraw-Hill
Companies, Mexico City Milan.
[8] J.P.Gupta, “Switchgear and Protection”, S.K.KATARIA &SONS, Delhi,
2004.
[9] R. MohanMathur, Rajiv .Varma, “Thyristor based FACTs Controllers for
Electrical Transmission System”, United States of America, 2002.
[10] Skoglund, Oscar, “Dynamic Voltage Regulation Using SVCs, simulation
study on the Swedish national grid”, 2013.
[11] C. L.Wadhwa, “Electrical Power Systems”, Book, Fourth Edition.
[12] V. Ganesh, K. Vasu, K. Venkata Rami Reddy, M. Surendranath Reddy,
“Improvement of Transient Stability through SVC”, 2012.
[13] Nang Sabai, Hnin Nandar Maung, and Thida Win, “Voltage Control and
Dynamic Performance of Power Transmission System Using Static Var
Compensator”, 2008.43
[14] Sullivan, Daniel J, “Improvements In Voltage Control And Dynamic
Performance Of Power Transmission Systems Using Static Var Compensators
(SVC)”, 1995.
43
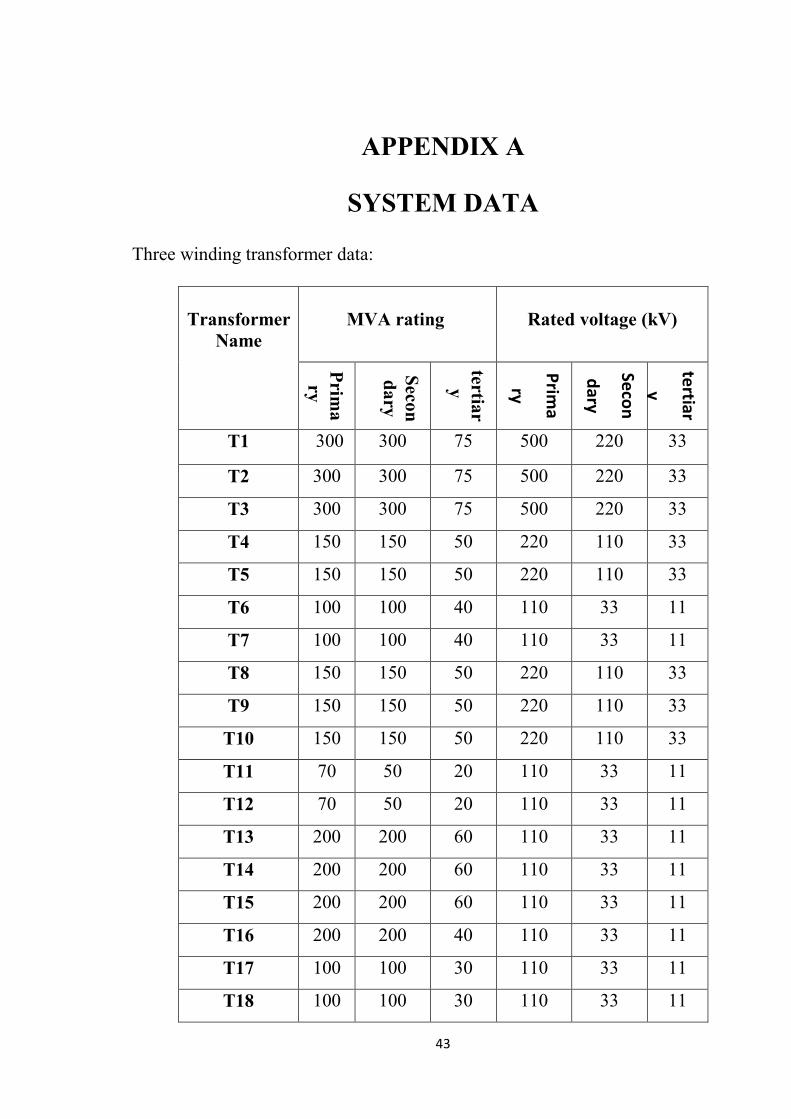
APPENDIX A
SYSTEM DATA
Three winding transformer data:
Rated voltage (kV)
MVA rating
Transformer
Name
tertiar
y
Seco
n
dary
P
rima
ry
tertiar
y
S
econ
da
ry
P
rima
ry
33 220 500 75 300 300
T1
33 220 500 75 300 300 T2
33 220 500 75 300 300 T3
33 110 220 50 150 150 T4
33 110 220 50 150 150 T5
11 33 110 40 100 100 T6
11 33 110 40 100 100 T7
33 110 220 50 150 150 T8
33 110 220 50 150 150 T9
33 110 220 50 150 150 T10
11 33 110 20 50 70 T11
11 33 110 20 50 70 T12
11 33 110 60 200 200 T13
11 33 110 60 200 200 T14
11 33 110 60 200 200 T15
11 33 110 40 200 200 T16
11 33 110 30 100 100 T17
11 33 110 30 100 100 T18
44
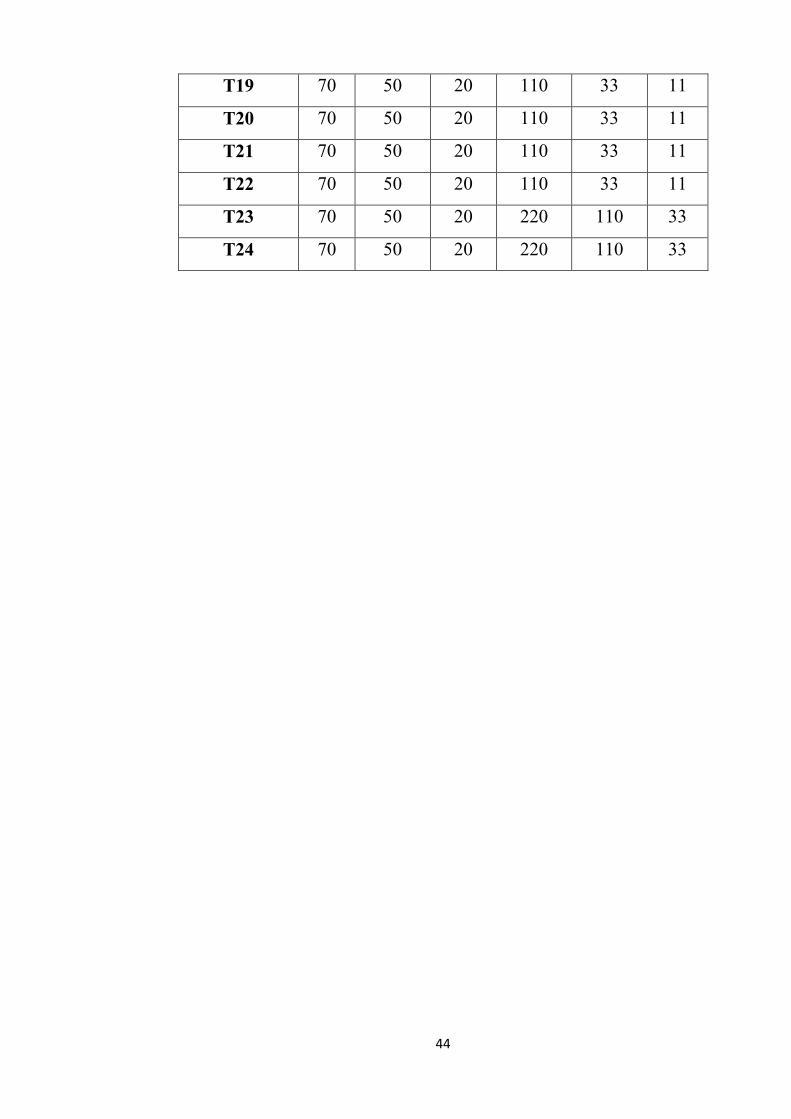
11 33 110 20 50 70 T19
11 33 110 20 50 70 T20
11 33 110 20 50 70 T21
11 33 110 20 50 70 T22
33 110 220 20 50 70 T23
33 110 220 20 50 70 T24
45
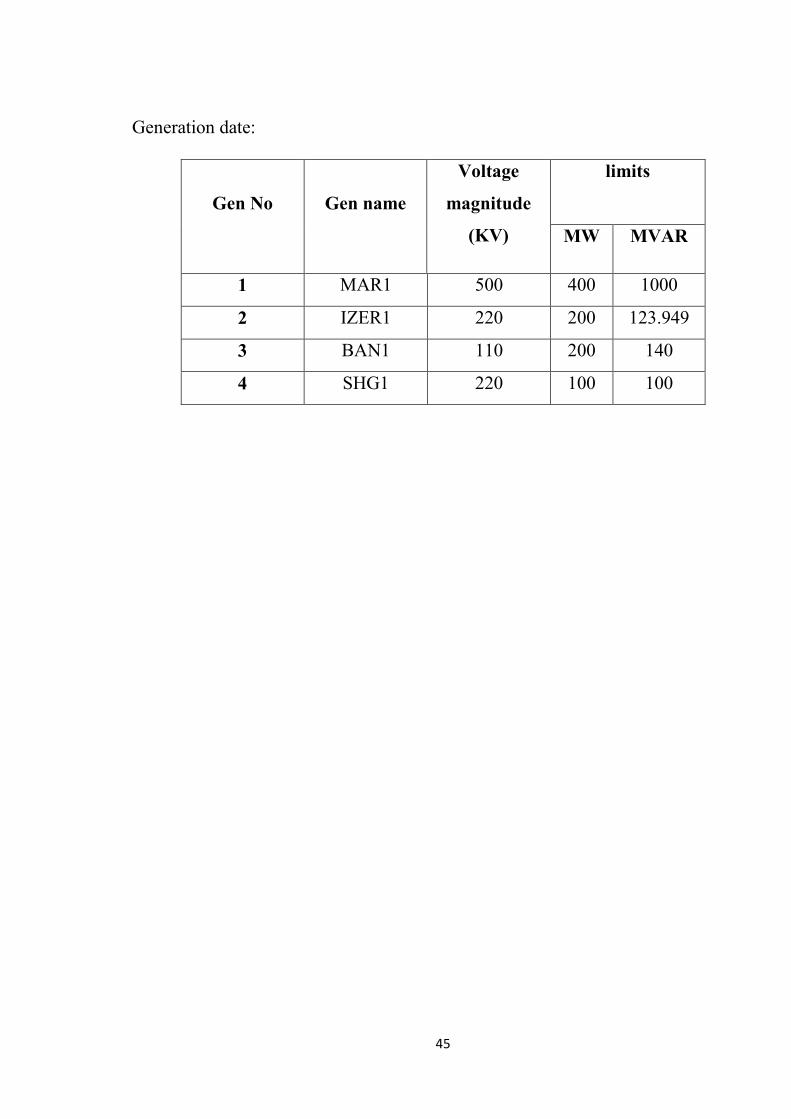
Generation date:
limits
Voltage
magnitude
(KV)
Gen name
Gen No
MVAR MW
0111 011 011 MAR1 1
049.101 411 441 IZER1 2
001 411 001 BAN1 3
011 011 441 SHG1 4
46
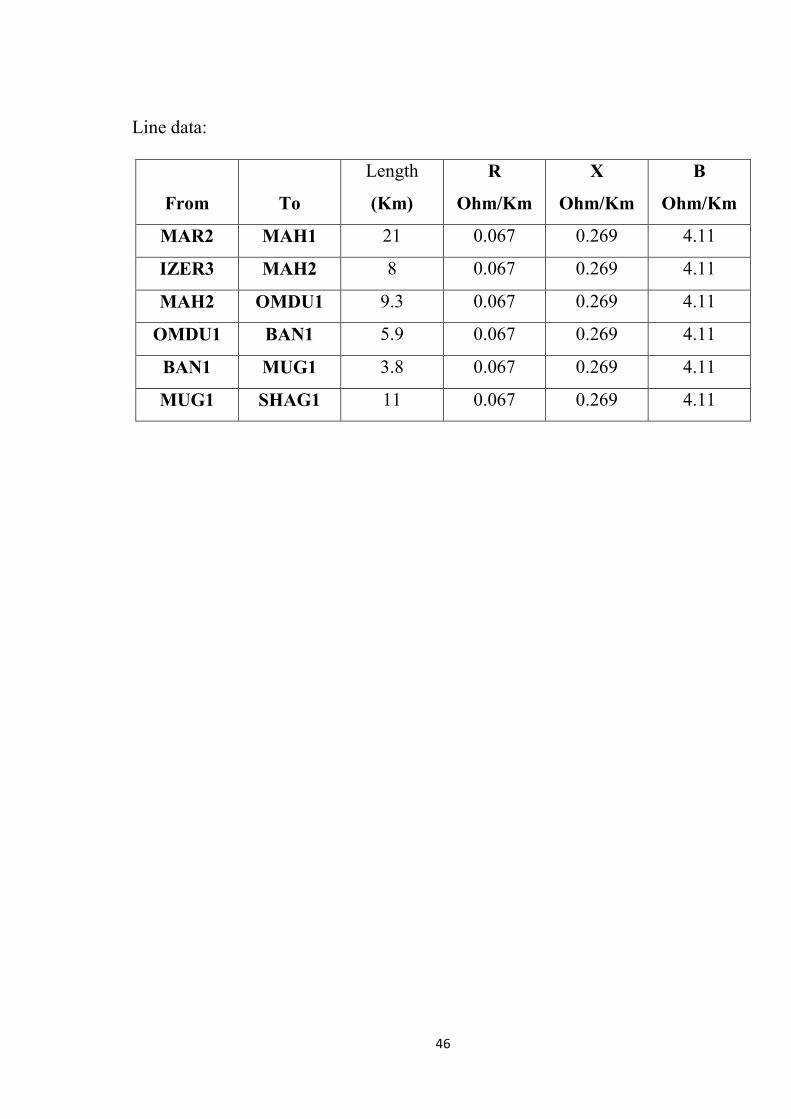
Line data:
B
Ohm/Km
X
Ohm/Km
R
Ohm/Km
Length
(Km)
To
From
4.11 0.269 0.067 21 MAH1 MAR2
4.11 0.269 0.067 8 MAH2 IZER3
4.11 0.269 0.067 9.3 OMDU1 MAH2
4.11 0.269 0.067 5.9 BAN1 OMDU1
4.11 0.269 0.067 3.8 MUG1 BAN1
4.11 0.269 0.067 11 SHAG1 MUG1
47
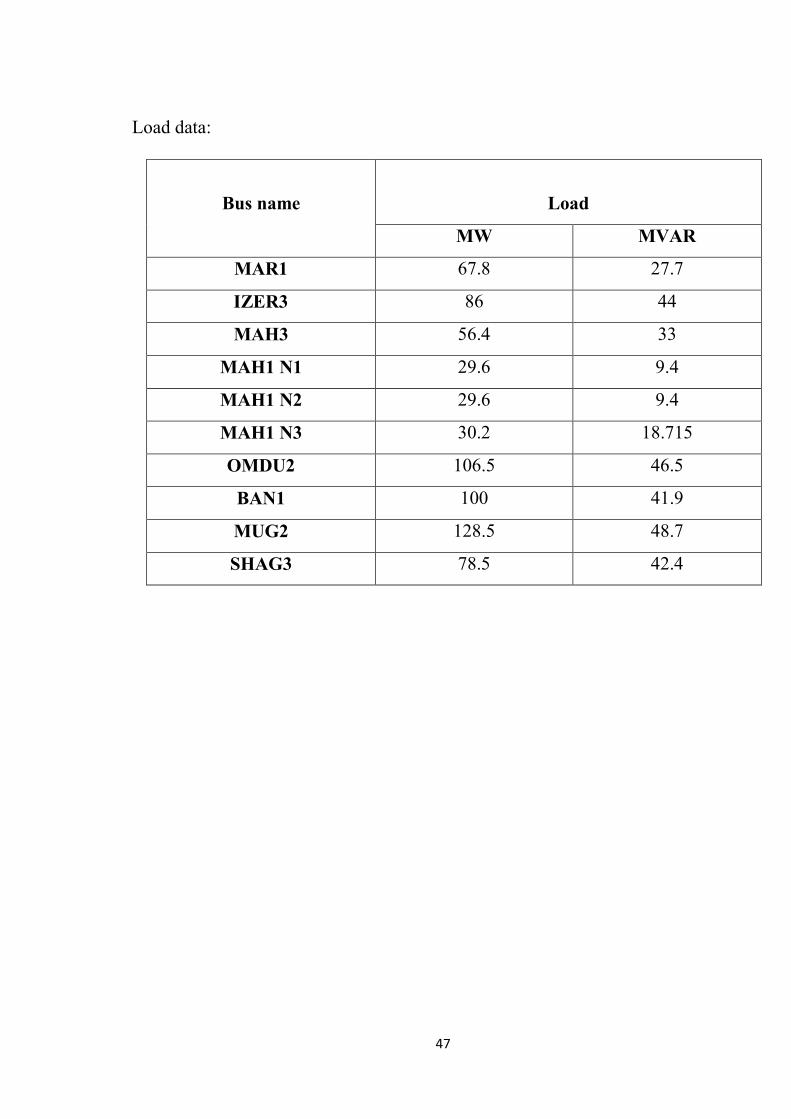
Load data:
Load
Bus name
MVAR MW
27.7 67.8 MAR1
44 86 IZER3
33 56.4 MAH3
9.4 29.6 MAH1 N1
9.4 29.6 MAH1 N2
18.715 30.2 MAH1 N3
46.5 106.5 OMDU2
41.9 100 BAN1
48.7 128.5 MUG2
42.4 78.5 SHAG3
48
APPENDIX B
The system figure