Embed Size (px)
Citation preview

© 2006 World Health Organization. Protecting Groundwater for Health: Managing the Quality of Drinking-water Sources. Edited by O. Schmoll, G. Howard, J. Chilton and I. Chorus. ISBN: 1843390795. Published by IWA Publishing, London, UK.
16 Water Safety Plans: Risk management approaches for the delivery of safe drinking-water from groundwater sources
G. Howard and O. Schmoll
The delivery of safe drinking-water requires actions to be taken throughout the water cycle from the catchment to the point of consumption. The focus of any programme designed to deliver safe drinking-water should therefore be the effective management and operation of water sources, treatment plants and distribution systems (whether piped or manual). This will demand action by water suppliers, environmental protection agencies and health bodies.
WHO (2004) outlines that the delivery of safe drinking-water is most effectively achieved a Water Safety Framework, that encompasses three elements:
1. Establishing health based targets for drinking-water based on evaluation of health concerns.
2. Developing a management system to meet these targets that is termed Water Safety Plan (WSP) and consists of

432 Protecting Groundwater for Health
• An assessment of the water supply system to determine whether the water supply chain (from source through treatment to the point of consumption) as a whole can deliver water that meets the health based targets.
• Identification and operational monitoring of the control measures in the drinking-water supply that are of particular importance in securing drinking-water safety.
• Preparation of management plans documenting the system assessment and monitoring plans and describing actions to be taken in normal operating and incident conditions, including upgrading documentation and communication.
3. A system of independent surveillance that verifies that the above are operating properly.
The establishment of health-based water quality targets would typically be led by the health sector taking into account local health burdens. These are not discussed in detail in this text, but would include many of the considerations highlighted in Section I and would be established in relation to a level of public health risk determined as being tolerable. This may use epidemiological and quantitative risk assessment procedures, which can be applied to both chemicals and microorganisms (Haas et al., 1999). More detail is available on establishment of water quality targets in the third edition of the WHO Guidelines for Drinking-water Quality (2004) and in Havelaar and Melse (2003).
The surveillance component would typically be undertaken by a regulatory agency, which in practice may be the health, environment or local government sector. This component would incorporate many of the issues identified in Sections II, IV and V of this monograph as means of monitoring of performance. Further descriptions of approaches to be used are available in a variety of texts linked to the WHO Guidelines for Drinking-water Quality (WHO, 1997; 2004; Howard, 2002).
The second activity of the Water Safety Framework is termed a Water Safety Plan (WSP) (WHO, 2004; Davison et al., 2005) which is typically the responsibility of the water supplier, with support from and collaboration with other sectors as discussed below. The focus of this chapter is the application of WSPs within groundwater supplies and catchments. This covers both supplies where the whole WSP will apply to the groundwater, where the point of delivery is at the abstraction point (e.g. tubewell with handpump) and those where groundwater forms only part of the overall WSP (e.g. borehole connected to a distribution system). The principles and methods used in WSPs draw on other risk management and quality assurance methods. In particular they are based on the Hazard Analysis and Critical Control Process (HACCP) approach applied in the food industry.
As described by the multiple barrier principle, source protection is the first stage in the production of safe drinking-water quality (WHO, 1993; 2004). When sources are managed effectively, subsequent treatment costs are minimized and the risks of exposures resulting from failures in treatment processes are reduced. Therefore, source and resource protection is vital for efficient risk management (WHO, 2004). Protection measures should be put in place that have been shown to be effective in improving water safety as the first stage of a plan for managing the safety of drinking-water.

Water Safety Plans 433
16.1 END-PRODUCT TESTING AND THE NEED FOR A RISK MANAGEMENT APPROACH
The traditional approach to water quality management placed a great emphasis on the routine monitoring of water quality. The results of analysis were compared against acceptable concentrations in order to evaluate performance of the water supply and to estimate public health risks (Helmer et al., 1999). The focus of attention was on end-product standards rather than ensuring that the water supply was managed properly from catchment to consumer. Although operation and maintenance of water supplies has been recognized as important in improving and maintaining water quality, the primary aim of water suppliers, regulators and public health professionals has been to ensure that the quality of water finally produced met these standards.
This reliance on end-product testing has been shown to be ineffective for microbial quality of water, as evidence has emerged of significant health impact from the consumption of water meeting national standards (Payment et al., 1991). In part this is because most national standards have been set using bacterial indicators that are very different from viral and protozoan pathogens.
The quality of the source protection measures is an important component in controlling whether pathogens may be present in the final drinking-water. For instance, one study concluded that the degradation of surface water catchments was an important factor in waterborne disease transmission (Hellard et al., 2001). The outbreak of E. coli O157:H7 and Campylobacter jejeuni from drinking-water in Walkerton, Ontario appears to have resulted from a combination of improper protection of the groundwater source and a failure to maintain adequate chlorination (O'Connor, 2002). The example from Walkerton particularly emphasizes the need for multiple barriers in water quality management.
End-product testing has a further weakness in that the number of samples taken is typically very small and not statistically representative of the water produced in a domestic supply. The focus on end-product testing has meant that action is only initiated in response to a failure in relation to the specified water quality standard. However, this typically means that the water has been supplied and may have been consumed before the results of the test are known and the increased risk to health identified. As a result, outbreaks occur and rates of endemic disease remain higher than when good practice in relation to water quality management is emphasized. The reliance on end-product testing is therefore not supportive of public health protection and whilst it retains a role in assessing water safety, it should not be the sole means by which risks are managed (WHO, 2004).
16.2 SCOPE OF WATER SAFETY PLANS Water quality management elements such as documented operational procedures,
monitoring process control measures and sanitary inspection have complemented end-product testing in many water supplies for a long time. Beyond these, the need for a comprehensive quality assurance approach based on sound scientific evidence and understanding the risks in a given supply system has been increasingly recognised.

434 Protecting Groundwater for Health
Quality assurance procedures are being applied more formally to water supplies, including the use of HACCP and approaches based on the generic ISO 9000 Quality Standard.
The use of HACCP for water quality management was proposed by Havelaar (1994), following international codification of the principles for the food industry (Codex Alimentarius Commission, 1996; NACMCF, 1992). Subsequent initiatives have addressed the application of these principles to the broader control of infectious disease from water and wastewater exposures (Fewtrell and Bartram, 2001). The application of HACCP principles have also been further described in relation to specific water supplies (Barry et al., 1998; Deere and Davison, 1998; Gray and Morain, 2000; Deere et al., 2001; Bosshart et al., 2003; Howard, 2003; Wülser and Trachsel, 2003). These experiences were used as basis for the Water Safety Plan approach in the third edition of the WHO Guidelines for Drinking-water Quality.
The development and implementation of a WSP would typically be the responsibility of a water supplier, although in many cases other stakeholders may have responsibilities that must be fulfilled. Such plans should address all aspects of the water supply under the direct control of the water supplier and focus on the control of water production, treatment and distribution to deliver drinking-water. In some situations, the water supplier will control the catchment and therefore will be able to identify and implement control measures within the catchment. In other situations, the water supplier may not control the catchment and therefore some aspects of control will require actions by other stakeholders. These may still be incorporated within the WSP provided that processes are set in place for communication of the findings of monitoring, and actions are identified in the case of non-compliance. In these situations, the implementation of a WSP provides a sound platform for the water supplier to take an active role in initiating and developing stakeholder involvement for the protection of drinking-water sources (Box 16.1).
WSPs can be defined for utility operated water supplies using mechanized boreholes, disinfection and piped distribution; or for simple point sources of water where water is collected by hand and transported back to the home manually (WHO, 2004). In the case of small water supplies, the WSP may be defined by an external agency and be applied either through a generic WSP for a technology type or be developed for an individual supply using very structured guidance (APSU, 2005; MOH NZ, 2001; SGWA, 2003; WHO, 2004). However, it will be expected that the activities required under the WSP will be the responsibility of the water supply operator.
Although this monograph deals with groundwater sources and their protection for public health, a key value of WSPs is that they address the full water supply chain from source to consumer. WSPs therefore demand action is taken in water sources and their catchments (whether groundwater or surface water), in treatment steps (if any are applied), subsequent distribution and household storage and treatment.
WHO (2004) identifies that the development of an effective WSP requires (Figure 16.1):
• assembling a team that understands the system and can undertake an initial assessment of the system with regard to its capability to supply water meeting the specified targets;

Water Safety Plans 435
• identifying where contamination can occur and what measures can be put in place to prevent, reduce or eliminate contaminants (control measures);
• validation of methods employed to control hazards; • putting in place a system for monitoring and corrective action to ensure that safe
water is consistently supplied; • periodic verification that the WSP is being implemented correctly and is
achieving the performance required to meet the water quality targets.
Assemble the team to prepare the water safety plan
Define monitoring of control measures –what limits define acceptable performance and how
these are monitored
Undertake a hazard assessment and risk characterization to identify and understand how
hazards can enter into the water supply
Assess the existing proposed system (including a description of the system and a flow diagram)
Identify control measures-the means by which risks may be controlled
Document and describe the system
Establish procedures to verify that the water safety plan is working effectively and will meet
the health-based targets
Develop supporting programmes(e.g., training, hygiene practices, standard operating
procedures, upgrade and improvement, research and development, etc.)
Prepare management procedures (including corrective actions) for normal
and incident conditions
Establish documentation and communicationprocedures
Figure 16.1. Steps in the development of Water Safety Plans (adapted from WHO, 2004)

436 Protecting Groundwater for Health
16.3 PRELIMINARY STEPS FOR DEVELOPING WATER SAFETY PLANS
16.3.1 Assembling the team The first stage of a WSP is to assemble a team of experts who will undertake the assessment of the water supply from catchment to consumer. This should be a multi-disciplinary team including managers, scientists (e.g. hydrogeologists, microbiologists, chemists) engineers (e.g. from operations, maintenance, design and capital investment) and technical staff involved in the day-to-day operation of the supply. The latter are essential as very often it is those members of staff who undertake work on the system every day who have the greatest knowledge about the problems that exist. A senior member of the team (usually the risk manager) should be appointed to help guide and direct the team in the study and this person should be able to either make decisions regarding investment or be able to influence others in the improvement of performance.
The development of the WSP and supporting programmes (which will typically involve actions by other stakeholders, such as environmental protection agencies) is generally most effectively implemented when the skills required are drawn from a range of stakeholders. For groundwater, this will include representatives of agencies responsible for assessing the impact of pollution and implementing controls on land-use. This may be particularly important when identifying control measures within catchments where the water supplier does not own the land. Thus the WSP team can act as catalyst for collaboration with different stakeholders and establish a sense of mutual ownership for controlling contaminants at their source.
16.3.2 Describing the water supply The next stage in developing a WSP is to describe the water supply. In the case of groundwater supplies, this means providing information on aspects such as the depth to the water table, nature of the lithology of the aquifer and unsaturated zone from drilling logs, technologies used to abstract water, pump type and depth and the draw-down on pumping. This stage should also clearly identify whether alternative water sources exist in the community should there be need to take the source off-line at any time to effect corrective action.
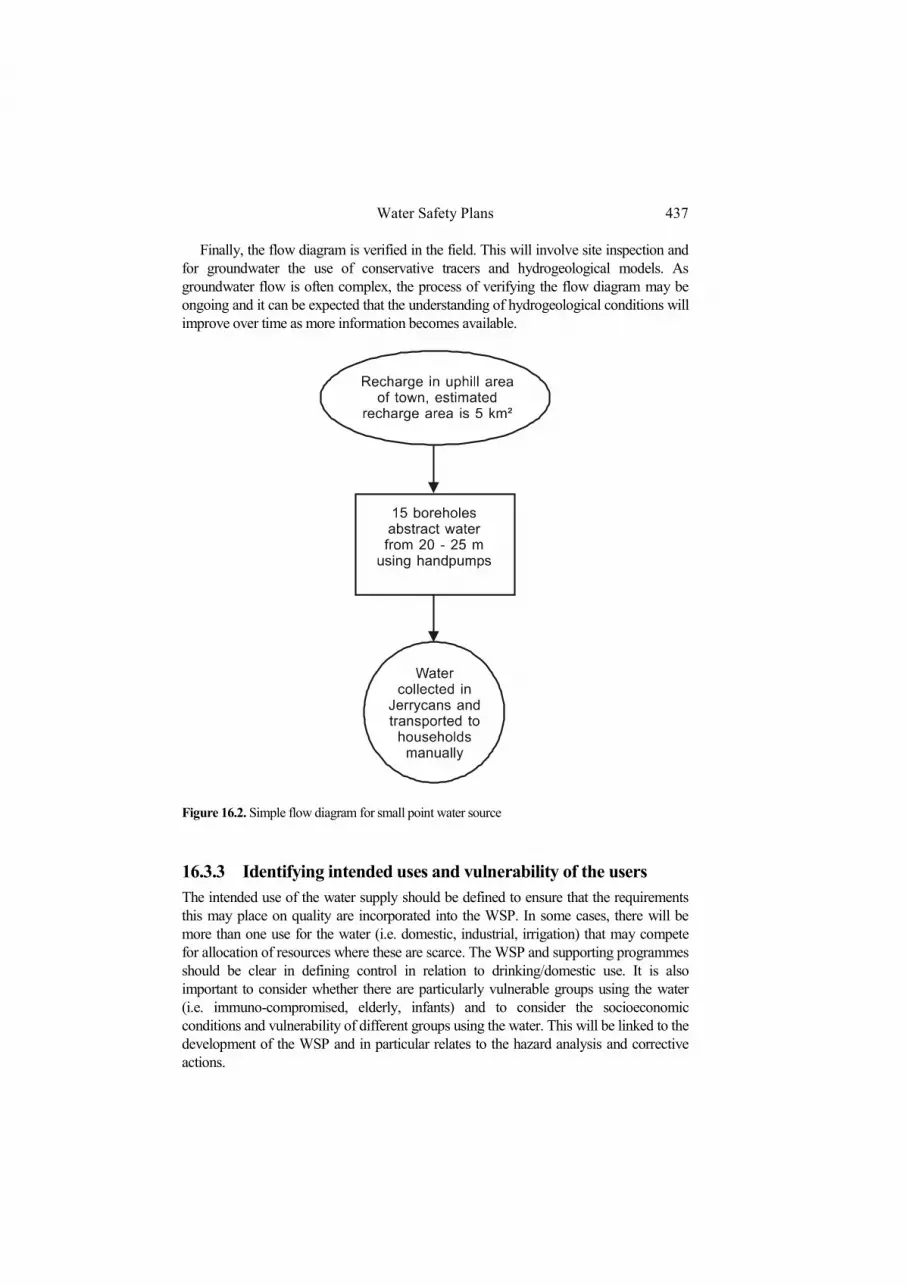
The next step is to prepare a detailed flow diagram. The purpose of this stage is to provide the basis of understanding the hydrological environment and the subsequent distribution of drinking-water. The flow diagram should indicate the flow of water from the recharge to the abstraction point, the nature of the aquifer and recharge areas, flow times and vulnerability maps where available (Chapters 2 and 8 provide more detailed information on how the hydrological environment can be characterized). This stage is concerned with defining the hydrogeological conditions in order to understand what natural processes may affect the quality of water. The distribution of final water (whether piped or manual) should also be indicated on the flow diagram.
Two examples of simple flow diagrams – one for a simple setting with a shallow borehole and one for a more complex setting including treatment and piped distribution – are shown below in Figures 16.2 and 16.3.
Water Safety Plans 437
Finally, the flow diagram is verified in the field. This will involve site inspection and for groundwater the use of conservative tracers and hydrogeological models. As groundwater flow is often complex, the process of verifying the flow diagram may be ongoing and it can be expected that the understanding of hydrogeological conditions will improve over time as more information becomes available.
Figure 16.2. Simple flow diagram for small point water source
16.3.3 Identifying intended uses and vulnerability of the users The intended use of the water supply should be defined to ensure that the requirements this may place on quality are incorporated into the WSP. In some cases, there will be more than one use for the water (i.e. domestic, industrial, irrigation) that may compete for allocation of resources where these are scarce. The WSP and supporting programmes should be clear in defining control in relation to drinking/domestic use. It is also important to consider whether there are particularly vulnerable groups using the water (i.e. immuno-compromised, elderly, infants) and to consider the socioeconomic conditions and vulnerability of different groups using the water. This will be linked to the development of the WSP and in particular relates to the hazard analysis and corrective actions.

438 Protecting Groundwater for Health
Figure 16.3. Simple flow diagram for large groundwater abstraction linked to piped distribution
16.4 HAZARD ANALYSIS Once the system has been described, a hazard analysis should be performed. A hazard is a biological, chemical, physical or radiological agent that has the potential to cause harm to health. The simplest method of undertaking a hazard analysis is to perform a sanitary survey or catchment assessment to identify all the sources of potential hazards. Chapters 9-13 of this book provide information on the likely hazards that will be derived from different polluting activities and sources of hazards as well as indicative checklists to help assess their relevance in a given setting. The sanitary survey or catchment assessment should lead to the preparation of a map that provides details on where water sources and sources of pollutants exist within the recharge area. An example of a map in a simple setting is shown in Figure 16.4.

Water Safety Plans 439
1
2
3
4
Groundwatersource
1. M2. S esidential building: seepage of sewage3. Stream: short-circuit with polluted surface water4. Cultivated land: leaching of agrochemicals5. Main street: contamination by chemicals after accidents
anure storage facility: seepage of manureoakaway in r
5
20 1
Kilometer
Figure 16.4. Simple map showing potential pollution sources to a small groundwater abstraction point (adapted from SGWA, 2003)
When undertaking a hazard analysis, it is often more effective to consider hazardous events rather than the specific hazards that affect the water supply. A hazardous event is an incident or situation that can lead to the presence of the hazard, and thus describes how a hazard could enter the water supply. For instance, a hazardous event could be that pathogens from human faeces enter groundwater from poorly constructed and sited septic tanks, or that hazardous chemicals leach into groundwater when spilled by accident at an industrial site. The advantage of using a hazardous event approach is that the probability of the event occurring can be considered, as the presence of a source of hazards within the drinking-water catchment area does not automatically mean that the hazards will be found at a groundwater abstraction point.
The probability with which hazards reach the aquifer depends on hydrogeological conditions as described in the concept of aquifer vulnerability in Chapter 8 and on their

440 Protecting Groundwater for Health
behaviour in the sub-surface as described in Chapters 3 and 4. By combining sanitary survey or catchment assessment data, vulnerability and pollutant behaviour the probability of occurrence of contaminants can be assessed (Chapter 14).
As discussed in Section 15.2, in groundwater the occurrence of hazards may not only be of an episodic (or event) nature but often is continuous and causes longer-term pollutant loading and attention should be paid to times scales. They may also be related to diffuse or multiple point sources rather than single point sources of hazards. Chemicals that are intentionally released to land over long periods of time that have the potential to accumulate in the aquifer, e.g. nitrate from fertilizers or manures and pesticides used in agriculture are examples of hazards that build up over time and from a diffuse area. In settings where the aquifer is moderately vulnerable to nitrate pollution, it is likely that controlled use of fertilizer in line with best management practices will not cause groundwater quality deterioration. In contrast, continuous over-fertilization in the same setting over years or even decades can cause heavy long-term nitrate pollution. For substances having the potential to accumulate in groundwater, the definition of hazardous events (e.g. over-fertilization) is always also related to the protection of future source water safety, as the present situation may not result in short term deterioration of water quality.
For natural chemical constituents affecting human health (e.g. arsenic and fluoride), the hazard analysis should include an assessment of the geological setting to evaluate whether it is likely that there will be any naturally occurring chemicals present at levels that will pose a risk to public health. The potential impact of land use on mobilization of chemicals should also be considered at this point. An initial comprehensive water quality assessment remains a further essential component of the hazard assessment for chemicals.
The hazard analysis will direct subsequent stages of Water Safety Plan development to ensure that control measures are managed, upgraded or put in place in such a way that they will effectively control identified hazards. Undertaking hazard analysis and assessing the risk posed by the hazards identified is essential: simply applying control measures without considering which hazards are the most important will mean that risks posed by some hazards are likely to remain high and resources will be wasted in controlling hazards that may be irrelevant for the specific water supply.
16.5 SYSTEM ASSESSMENT The system assessment stage of the WSP development uses the information gained in the system description and hazard analysis in order to assess the risk of hazards occurring in drinking-water, and the potential of the system to control them. It is a first step in determining whether the water supply is able to meet the health based targets or other water quality targets defined for the water supply and if not, what investment of human, technical and financial resources would be required to improve the supply.
System assessment is largely the subject of this book, with Section II introducing the hazards, Sections IV and V the control measures and Section III discussing how to combine information for assessing the risk of hazards occurring in groundwater. The following section revisits this in terms of using these to develop a Water Safety Plan.
Water Safety Plans 441
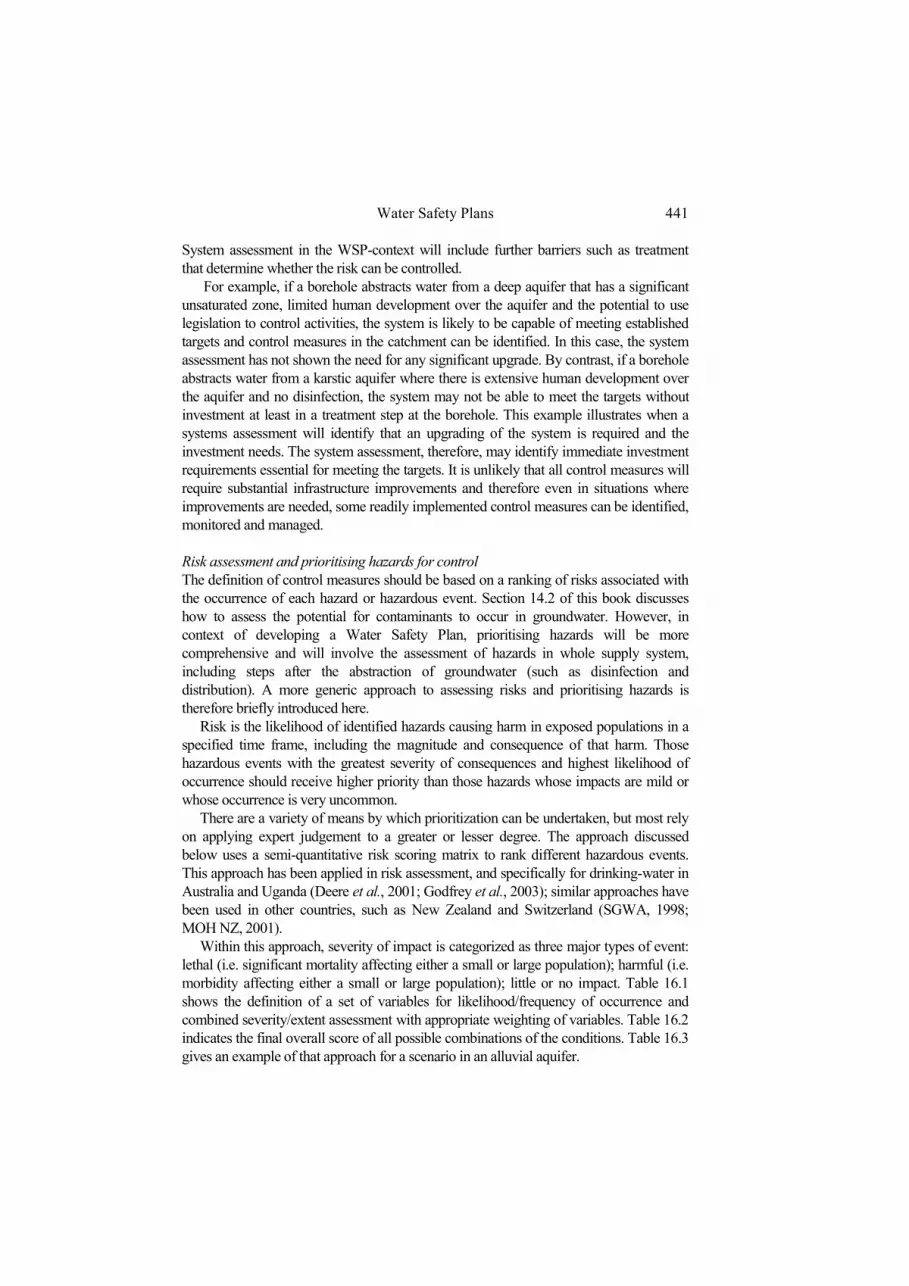
System assessment in the WSP-context will include further barriers such as treatment that determine whether the risk can be controlled.
For example, if a borehole abstracts water from a deep aquifer that has a significant unsaturated zone, limited human development over the aquifer and the potential to use legislation to control activities, the system is likely to be capable of meeting established targets and control measures in the catchment can be identified. In this case, the system assessment has not shown the need for any significant upgrade. By contrast, if a borehole abstracts water from a karstic aquifer where there is extensive human development over the aquifer and no disinfection, the system may not be able to meet the targets without investment at least in a treatment step at the borehole. This example illustrates when a systems assessment will identify that an upgrading of the system is required and the investment needs. The system assessment, therefore, may identify immediate investment requirements essential for meeting the targets. It is unlikely that all control measures will require substantial infrastructure improvements and therefore even in situations where improvements are needed, some readily implemented control measures can be identified, monitored and managed. Risk assessment and prioritising hazards for control The definition of control measures should be based on a ranking of risks associated with the occurrence of each hazard or hazardous event. Section 14.2 of this book discusses how to assess the potential for contaminants to occur in groundwater. However, in context of developing a Water Safety Plan, prioritising hazards will be more comprehensive and will involve the assessment of hazards in whole supply system, including steps after the abstraction of groundwater (such as disinfection and distribution). A more generic approach to assessing risks and prioritising hazards is therefore briefly introduced here.
Risk is the likelihood of identified hazards causing harm in exposed populations in a specified time frame, including the magnitude and consequence of that harm. Those hazardous events with the greatest severity of consequences and highest likelihood of occurrence should receive higher priority than those hazards whose impacts are mild or whose occurrence is very uncommon.
There are a variety of means by which prioritization can be undertaken, but most rely on applying expert judgement to a greater or lesser degree. The approach discussed below uses a semi-quantitative risk scoring matrix to rank different hazardous events. This approach has been applied in risk assessment, and specifically for drinking-water in Australia and Uganda (Deere et al., 2001; Godfrey et al., 2003); similar approaches have been used in other countries, such as New Zealand and Switzerland (SGWA, 1998; MOH NZ, 2001).
Within this approach, severity of impact is categorized as three major types of event: lethal (i.e. significant mortality affecting either a small or large population); harmful (i.e. morbidity affecting either a small or large population); little or no impact. Table 16.1 shows the definition of a set of variables for likelihood/frequency of occurrence and combined severity/extent assessment with appropriate weighting of variables. Table 16.2 indicates the final overall score of all possible combinations of the conditions. Table 16.3 gives an example of that approach for a scenario in an alluvial aquifer.

442 Protecting Groundwater for Health
Table 16.1. Examples of definitions of hazardous event terms that can be used for risk scoring (modified from WHO, 2004)
Description Definition Weighting
Likelihood or frequency of occurrence Almost certain Once per day 5 Likely Once per week 4 Moderate Once per month 3 Unlikely Once per year 2 Rare Once every 5 years 1
Severity of consequence or impact Catastrophic Potentially lethal to large population 5 Major Potentially lethal to small population 4 Moderate Potentially harmful to large population 3 Minor Potentially harmful to small population 2 Insignificant No impact or not detectable 1
Table 16.2. Example of a simple risk ranking matrix (modified from Deere et al., 2001 and WHO, 2004)
Likelihood or frequency of occurrence
Severity of consequence or impact
Insignificant Minor Moderate Major Catastrophic Almost certain 5 10 15 20 25 Likely 4 8 12 16 20 Moderate 3 6 9 12 15 Unlikely 2 4 6 8 10 Rare 1 2 3 4 5
While some approaches use a scoring method as indicated by the numbers in
Table 16.2 others prefer non-numerical classifications describing the risk (as indicated by the shading; see also Table 15.2 in Chapter 15). It should be stressed that when using the scoring approach it is the relative ranking based on the numerical categories rather than the numbers themselves that is important. Furthermore, in using such approaches common sense is important to prevent obvious discrepancies arising from applying the risk ranking, for instance events that occur very rarely but have catastrophic effects should also be a higher priority for control than those events that have limited impact on health, but occur very frequently.
The risk ranking approach allows the relative importance of different hazardous events to be systematically evaluated. This supports decision makers to define priorities for control within their water supply and can therefore maximize the cost-effectiveness of the WSP.
The outcome of system assessment is an identification of priorities for controlling risks, of existing control measures that have been found to be of importance for controlling risks, and of gaps in safety for which new control measures need to be identified or existing ones upgraded.

Water Safety Plans 443
Table 16.3. Example of hazardous events identified and assessed for an alluvial aquifer
Process step
Hazardous event Hazard type Likelihood Severity Risk score
Water pumped during a storm event results in contaminated surface water from catchment run-off being drawn into aquifer
Microbes and chemicals (nutrients and potential pesticides from agricultural practices)
Unlikely (2)
Catastrophic (5)
10
Cattle grazing near wellhead and rain events result in contaminated surface water entering the wellhead
Microbes and chemicals (mainly nutrients)
Moderate (3)
Catastrophic (5)
15
Alluvial aquifer
Draw down of aquifer causing naturally occurring chemicals to enter water
Chemicals Rare (1)
Major (4)
4
16.6 CONTROL MEASURES In the context of a Water Safety Plan, control measures are tightly defined as those steps in drinking-water supply that directly affect drinking-water quality and that collectively ensure that drinking-water consistently meets health-based targets. Therefore, they are the basis on which control is assured and therefore they should always function reliably. Control measures are activities and processes applied to prevent hazard occurrence within the water supply chain or at the pollutant source, which control the risk posed by the hazards or hazardous events identified on a continuous basis. Examples of control measures for groundwater protection are provided in Chapter 17, for the immediate protection at the abstraction point in Chapter 18, for hydrological management in Chapter 19 and for specific polluting activities in Chapters 21-25.
Control measures in groundwater sources can take one of two forms: • those that use natural attenuation processes to reduce or remove/inactivate
pollutants (e.g. adsorption, filtration, predation, microbial degradation, die-off); • those that prevent or reduce pollution of the aquifer’s recharge area or ingress of
pollutants into the water supply. Measures such as groundwater protection zones (Chapter 17) and hydrological
management (Chapter 19) combine both forms of control measure. In these cases, release of pollution within recharge areas is controlled (although often not entirely prohibited) within prescribed areas related to the time taken to travel to the water abstraction point, and rely on attenuation, die-off and hydrodynamic dispersion to achieve reductions in pollutant loads. When protection zones are used, there may be extensive control on specific activities such as restriction on traffic, settlements, agricultural activity and other human activity as discussed in Chapter 17.

444 Protecting Groundwater for Health
Measures such as wellhead and sanitary completion discussed in Chapter 18, and avoidance, reduction and treatment of pollutants at their source described in Chapters 21-25, represent the second type of control measure. These are all designed to prevent contamination from either entering the supply or being released into the environment rather than relying on natural processes to remove or reduce pollutants.
The control measures should be able to influence the quality of groundwater and to be amenable to control through action, preferably by the water supplier. For instance, rainfall often exerts a profound influence on shallow groundwater and numerous studies have shown that rainfall is a principal factor in water quality deterioration (Wright, 1986; Gelinas et al., 1996; Howard et al., 2003). Rainfall cannot be translated into a control measure because action cannot be taken directly to reduce rainfall. A series of control measures can be defined, however, that relate to the importance of rainfall in causing contamination. For example these would include providing diversion ditches to prevent inundation of the abstraction point by contaminated surface water, maintaining infra-structure integrity at the abstraction point and controlling pollutant releases through the use of protection zones. Details of required measures are outlined in Chapters 17 and 18.
WHO (2004) note that control measures included within the WSP should have the following basic characteristics:
• a monitoring system and operational limits can be defined that describe the performance of the control measure and which can be either directly or indirectly monitored;
• corrective actions can be identified as a response to deviations in control measure performance that are detected by monitoring;
• corrective action will protect water safety by ensuring that control is re-instated (this can be bringing the control measure back into compliance, enhancing the control measure or by implementing additional control measures);
• detection of deviations and implementing corrective actions can be completed sufficiently rapidly to prevent the supply of unsafe water.
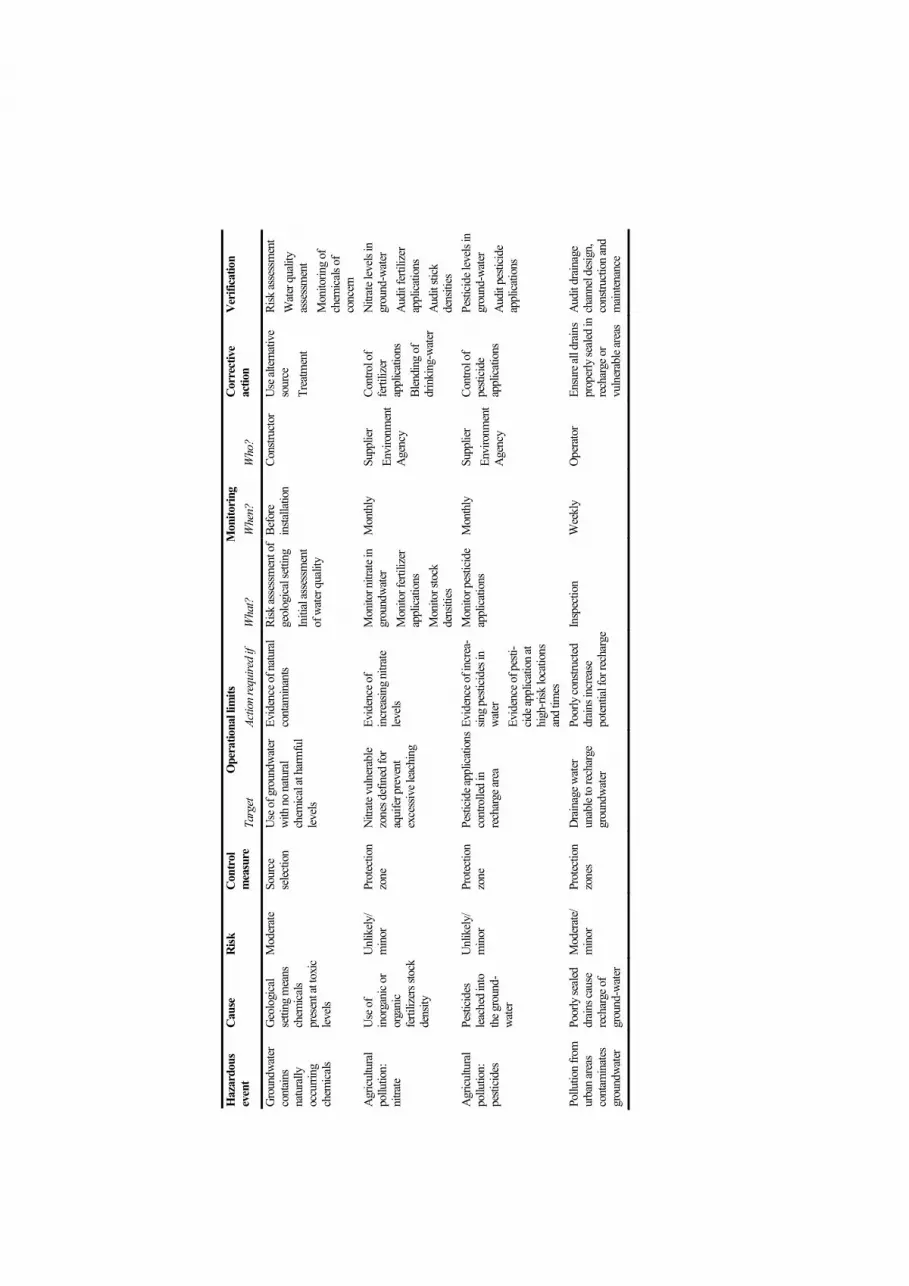
Control measures should not be vague or imprecise as otherwise the management action to be informed from the assessment of control status will be difficult to define. For instance, control of agricultural pollution in a catchment may be a general control measure, but would need to be translated into a set of specific actions, such as a seasonal restriction on the application of fertilizers and manure, and restriction on feedlots within a specified distance. An example for controlling nitrate pollution in groundwater from agriculture by means of integrating the water supplier’s WSP and the activities of a Regional Nitrate Committee in Switzerland is given in Box 16.1.
Individual control measures will usually be designed for a specific hazardous event(s) but it is unlikely a single control measure will provide assurance for all hazardous events and situations; rather a suite of different control measures may be necessary. Table 16.4 below provides examples of likely control measures appropriate to groundwater sources.
Many of the control measures for groundwater protection may have to be implemented through the relevant stakeholders rather than by the water supplier. The water supply agency, however, may take the lead as part of the WSPs supporting programmes (see Section 16.10) in initiating specific controls in order to protect the quality of the drinking-water source.

Water Safety Plans 445
Box 16.1. Measures for controlling nitrate pollution from agriculture in the Lenzburg water supply
The municipality of Lenzburg, Switzerland as well as the surrounding municipalities, draw drinking-water from the same groundwater recharge area. Each municipality operates its own abstraction wells. Part of the area upstream of the abstraction zone is used for agriculture, and the rest of the upstream area is covered by forest. Due to over-fertilization by agriculture, high nitrate concentrations were measured at all abstraction wells in the recharge area. These nitrate concentrations increased from 15 mg NO3/l in the early 1960s towards the Swiss drinking-water standard of 40 mg NO3/l by the early 1980s.
The Nitrate Committee: On the initiative of the Lenzburg water supply (LWS), all municipalities that were affected by increasing nitrate concentrations in drinking-water, or that encompassed large areas with agricultural use in the recharge area, collectively formed a Regional Nitrate Committee in 1987. Each municipality appointed one district council representative plus one local farmer as members of the Committee. In addition, a professional advisor from each of the Cantonal Water Authorities and the local Agricultural Advice Centres, plus a geologist, were co-opted to provide support to the Committee. The Nitrate Committee is chaired by the LWS. All costs that result from the committee’s activities are shared between all the municipalities involved according to a pre-established formula.
N-min measurements: The Committee as its first activity organized public advisory consultations for local farmers. In parallel, a nitrate regulation was elaborated that did not come into force in the municipalities involved but was set up as a target to be met by farmers on a voluntary basis. The regulation included detailed maps at the single plot scale showing the results of soil analyses and N-min measurements. N-min values represent the amount of plant-available nitrogen at the beginning of the vegetation period, and therefore provide the basis for defining an adequate amount of fertilizer to be applied. N-min measurements are repeated every year, and the results are made available to farmers, in conjunction with fertilization recommendations for individual crops, through the Agricultural Advice Centre. All samples, measurements and advisory consultations are funded through the Nitrate Committee and are therefore free of charge for the farmers.
Subsidies for intercropping: As nitrate leaching occurs mainly between seasons when fields lie fallow between two crops, the Committee recommended and supported intercropping with nitrogen binding cover crops. If farmers fulfil specific pre-conditions, such as prohibitions of tillage operations for a limited time period, minimum duration of intercropping depending on the rotation of crops, data recording by means of a field calendar, and use of recommended intercropping species, then the Committee supports those activities by paying intercropping subsidies per cultivated area unit, i.e. 400 Swiss Francs per ha in 2003. The plot-tailored fertilization together with intercropping has stopped the trend of increasing nitrate pollution of the aquifer, e.g. nitrate concentrations declined to 25-30 mg NO3/l in 2003.

446 Protecting Groundwater for Health
Municipality liaison: The role of farmer representatives in the Nitrate Committee is of great significance because they liaise between the farming community and the Committee, and thus with the LWS. On the one hand they represent the farmers’ interests to the Committee. On the other hand they have a duty to advise their farming colleagues in the municipality of the recommendations of the Committee. Furthermore, they have to check whether the statements made by farmers in their applications for intercropping subsidies are valid, and whether all pre-conditions have been fulfilled. If the liaison person approves each farmer’s application, then the Nitrate Committee will pay the subsidies for intercropping.
Lenzburg’s Water Safety Plan: The WSP of the LWS identifies long-term nitrate accumulation in the aquifer as a priority hazard. However, the LWS cannot exert direct control on polluting activities by farmers, as it does not own the farmland in the recharge area. Therefore the WSP explicitly refers to the activities of the Nitrate Committee, i.e. controlling nitrate pollution (through fertilization recommendations and granting subsidies for intercropping), monitoring compliance with those control measures, and imposing sanctions to farmers in case of non-compliance (corrective action). Additionally to the integration of the Committee’s activities into the WSP, LWS carries out six-monthly inspections of the recharge area as means of verification that control system works effectively.
Table 16.4. Examples of control measures to protect the quality of drinking-water
Element Control measure Wellhead completion
Sanitary seal (prevention of direct ingress) Fencing around area Surface water diversion ditches Quality of concrete works Wastewater drainage
Land use planning
Protection zones (designated and limited uses, protective requirements) Control of human activities within drinking-water catchment Set-back distances Minimum safe distance (latrine-source) Animal access control Grass cover maintained in immediate area
16.6.1 Validation of control measures Validation is an essential component of a WSP. Validation is an investigative activity to assess the effectiveness of individual and combinations of control measures in reducing the risk posed by hazards or hazardous events. It therefore obtains evidence on the performance of control measures and ensures that the information supporting the WSP is

Water Safety Plans 447
correct. In some cases, the performance of an individual control measure may depend in part on the performance of another previous control measure and this must be borne in mind when defining performance criteria. This reflects the multiple barrier principle that is advocated as part of effective risk management of drinking-water quality.
The efficacy of each control measure in reducing or eliminating the risk of exposure to pollutants should be measured directly against the hazard that it is designed to mitigate. This requires a research stage where the performance of the control measures, individually and in combination, is rigorously evaluated with regard to the hazards they are expected to control. This stage can be undertaken in a variety of ways and in many cases it is best to utilize all four. These are:
• evaluation of existing literature (including Chapters 3 and 4 of this book) to determine recorded survival, attenuation and dilution of pollutants in the type of groundwater to be utilized;
• rigorously designed field assessments of water quality and influences on quality; • laboratory experiments using model groundwater; • modelling of pollutant transport in groundwater.
In many cases, the existing literature (including this book) provides much of the information required to define control measures. However, as local conditions may vary significantly from those reported in the literature, the use of well-designed field assessments is often an effective way of gaining additional information to suit local conditions. Such assessments should be based on intensive assessment of a representative sample of water sources and evaluate data in order to define the importance of different factors in causing contamination (Howard et al., 2003). Where quality is poor, making improvements in the water sources or in reducing a pollutant source can also provide a useful way to measure efficacy.
The selection of parameters undertaken in such an assessment should relate to the principal pollutants of concern. For chemicals, this process is relatively straightforward as the substances of concern can be analysed and system performance in elimination therefore be validated. For microbial quality, it is preferable for validation to be based on assessments of control measures in relation to pathogens. It may be difficult to undertake analysis of a wide range of pathogens and therefore validation may focus on a small number of representative pathogens whose control would provide confidence that all pathogens of a similar nature would also be controlled. However, it may be necessary to undertake evaluations using indicator organisms as described in the example from Uganda in Chapter 18. Wherever possible, the range of microorganisms should reflect the range of likely pathogens. These may include E. coli and faecal streptococci as faecal indicator bacteria, bacteriophages as index organisms for viruses and spore forming bacteria as process indicators (Ashbolt et al., 2001). The primary purpose when using such organisms is to assess the impact of the control measures on the levels of the organisms and to use the resulting information on reductions as an indication of the likely impact of the control measures on pathogens. The criterion for their choice therefore is their similarity in retention by control measures as compared to groups of pathogensin order to indicate system performance in pathogen removal.
The outcome of validation is an assessment of how well the control measures in place or envisaged for introduction are likely to meet the heath based targets. This may include

448 Protecting Groundwater for Health
identifying the need for system upgrade as well as particular emphasis on monitoring and maintenance of control measures identified as being key to safety of a given supply system.
16.6.2 Establishing operational limits For each control measure, operational limits of performance should be defined. These are quantifiable levels of performance that provide an indication of whether the control measure is functioning correctly (in compliance) or is not providing effective control (out of compliance). The operational limits for each control measure should be identified during validation, and their definition should be based on sound science but also take into account practical considerations regarding limits of detection and ease of measurement. Of utmost importance is ensuring that the operational limit is related to an action that can be taken to bring the control measure back into compliance.
Operational limits may be upper limits, lower limits or an envelope of performance measures and are typically simple process indicators that can be interpreted at the time of monitoring and where action can be taken in response to a deviation (WHO, 2004). For instance, a groundwater protection zone may be defined as a control measure and within this zone the discharge of faecal material from sanitation facilities is strictly controlled. The operational limits in this case will be the absence of sources of faecal material (e.g. from septic tanks or pit latrines) within the protection zone. If a new on-site sanitation facility is constructed within the protection zone, the operational limit is exceeded and therefore corrective action should be taken to remove the facility or ensure that the design prevents contamination from occurring. The results of monitoring in relation to this operational limit (e.g. presence or absence of on-site sanitation facilities) can be interpreted immediately on observation and a clear line of action can be defined in response to the deviation.
Control measures may also be defined related to pumping rates if it has been shown that the draw-down would substantially alter the protection zone above a certain level of pumping. In this case, the operational limit will relate to the pumping regime (possibly both in terms of allowed discharge and in terms of duration of pumping). Other operational limits that can be defined would include stock density in relation to risks of increased nitrate (Chapter 21) and simple measures of wellhead or sanitary completion related to drainage (Chapter 18).
When defining operational limits, it is important to avoid situations where exceeding the operational limit will result in immediate health risks. It is better to establish operational limits that are more conservative and still allow preventative actions to be taken. If operational limits cannot be defined, it is likely that the measure identified should be considered as being part of a supporting programme. For some control measures, further limits may be established as ‘critical’ limits at which exceedance represents a confidence in water safety is lost and urgent action is required. Such limits tend to be related primarily to treatment processes, for instance disinfection, rather than source protection measures.

Water Safety Plans 449
16.7 OPERATIONAL MONITORING Operational monitoring assesses the performance of control measures at appropriate time intervals. It is essential within WSPs to ensure that the control measures employed remain in compliance with the operational limits. An emphasis is placed on simple techniques , which describe process controls that allow rapid, and easy measurement and whose findings can be interpreted at the time of monitoring with actions identified in response to non-compliance (WHO 2004; Davison et al., 2005). Examples of monitoring parameters include turbidity control to sanitary inspection (Howard et al., 2001; Payment and Hunter, 2001). This requirement for operational monitoring means that the analysis of indicator organisms would not be included as monitoring parameters, although they would be used in verification (see Chapter 16.12). By contrast, for chemical hazards it may be appropriate to test for the substance of concern if the results is available within sufficient time to allow for corrective action before hazard break-though, although the analytical method may be different from that used for verification.
Operational monitoring should be able to quantify changes in performance of the control measure in relation to the operational limits and is therefore linked directly to process control or management actions prior to an increase in the risk posed by a hazard. Selection of monitoring parameters should relate to their reliability and sensitivity in estimating performance of the control measure in relation to the operational limits. The frequency of monitoring will depend on the nature of the control means and may in some circumstances be continuous and on-line, whilst in others may be relatively infrequent. In the case of groundwater sources, much of the monitoring will be based on inspection of controlled activities in the catchment area (Box 16.1) and the integrity of sanitary completion measures, rather than routine water quality testing.
Monitoring may include testing for specific water quality parameters. This may be on the source water or within the catchment area or surrounding specific pollution activities, for instance around mine tailings or landfills. It will be important to define whether monitoring should be of the pollutants of direct concern or whether sentinel chemicals or other properties of water can be used as surrogates. This may in some cases include monitoring of water levels or redox conditions if this will provide good information about increases in contamination risks.
Where water quality parameters are included in monitoring (for instance nitrate in relation to agricultural pollution or inorganic chemicals derived from landfill leachate) it is unlikely to be continuous and will be determined in relation to their adequacy for monitoring the control measure in specific settings. In each setting, monitoring may become more targeted during times of known elevated risk (e.g. seasonal influences on nitrate release). In some settings however, monitoring of such parameters may be very frequent for instance where aquifers are highly vulnerable and have rapid transit times, thus allowing very short time periods for corrective actions.
In summary, the indicators used in operational monitoring systems should be: • specific – the indicator should relate to a particular control and not to a broad set
of interrelated factors; • measurable – it should be possible to translate the control status into some form
of quantifiable assessment, even if data collection is based on semi-quantitative or qualitative approaches;

450 Protecting Groundwater for Health
• accurate – the indicator must provide an accurate reflection of the control measure status in relation to the operational limits and be sensitive to changes that are of relevance and changes that may lead to exceeding the water quality targets;
• reliable – the indicator should give similar results each time it is measured; • transparent – the process of selection of the monitoring indicator, the method and
frequency of measurement and the interpretation of the results should be transparent and accepted by all stakeholders.
16.8 CORRECTIVE ACTIONS Effective management implies definition of actions to be taken in response to variations that occur during normal operational and incident conditions. Such corrective actions should be defined for each control measure and documented in the WSP. Corrective actions are those interventions that will be undertaken in immediate response to control measures moving outside the operational limits defined. It is important that when developing the WSP such corrective actions are identified from the outset. Identification of corrective actions should not wait until a failure has occurred as this defeats the objective of risk management. However, lessons learnt from incident conditions may lead to improvement of corrective actions and thus these will not be static. Equally, corrective actions may also be refined based on experiences from other water supplies.
Corrective actions may be simple operational interventions, for instance if an inspection identifies problems with the fence or deterioration in concrete protection works around a borehole, immediate action should be taken to effect repairs. It may also involve more complex enforcement processes, for instance if stock densities are seen to increase in the catchment area, then action should be initiated to ensure that farmers reduce these (for instance through legal notices). They may involve interventions that are not possible to implement immediately or that will take some time to take effect, for example when there has been an accidental spill of chemicals that has reached the aquifer and which will require remediation through pumping and treating.
Corrective actions may include longer-term action, for instance the redefinition of groundwater protection zones as more information becomes available regarding groundwater flow and pollutant movement. In some cases, the corrective action may be limited to an increase in monitoring of a specific contaminant. For instance, if leaching from mine tailings or landfills has increased but the consequences are as yet unknown, it may be appropriate to install a monitoring network to monitor movement and behaviour in the first instance to determine whether further action is required.
Corrective actions may also include closing down a particular abstraction point until the contamination has been effectively removed or has passed through the aquifer. However, this option should only be considered when there are alternative water supplies available. If the description of the water source concludes that there is no viable alternative to the groundwater source, then it is essential that other corrective actions (e.g. treatment) can be implemented immediately to prevent public health risks.
Where a public health risk from contamination occurs despite the presence of control measures, this implies that further control measures must be defined and implemented.

Water Safety Plans 451
This will involve investigating the cause of the contamination leading to the public health risk and from this data defining a set of new control measures to combat this risk. It should be noted that it is likely that new risks will be identified over time, and these should be assessed by periodic system validation (see Section 16.6.1). Furthermore, levels of tolerable risk and the health-based targets established may change.
16.9 VERIFICATION Verification is a separate process to operational monitoring. It provides a final check on the overall safety of the drinking-water supply chain. Verification is not designed to be a routine frequent assessment but a periodic evaluation of the performance of the WSP as a whole. For utility supplies, verification is undertaken by the water supplier as well as independently by the surveillance agency. For community-managed water supplies, verification is likely to only be undertaken by the surveillance agency. Verification will typically involve a number of actions including audit of the implementation of the WSP and water quality analysis.
Audits of WSPs are designed to assess whether these have been appropriately designed, documented and implemented. As part of a typical audit, the records of monitoring and actions taken to ensure control is maintained are reviewed by inspectors who also inspect the infrastructure and results of monitoring to ensure that the WSP is being adhered to. Such audits will also typically assess whether communication (both within the supply organization and to regulators and users of the water) have been undertaken in a timely and appropriate manner following guidelines set out in the WSP. Audits can be equally applied to utility supplies (when internal verification will also be assessed ) or community-managed supplies. In the latter case, the audit is likely to use different tools but still focus on whether the monitoring is being performed appropriately, whether control measures are functioning and whether this information is shared within the community. Water quality analysis is also likely to be included within verification programmes. Analysis of microbiological indicators is retained in such approaches, but would be undertaken less frequently than in systems relying largely on end-point testing. The range of microorganisms would be expected to increase to take account of the diversity of pathogens being controlled, yielding information of greater value in assessing performance of water quality management measures (Ashbolt et al., 2001).
Careful consideration should be given to the selection of the indicator organisms used for verification. E. coli remains the indicator organism of choice (WHO, 2004) and in many situation thermotolerant coliforms can be used as a surrogate. However, where possible other indicator organisms should also be considered used. Other indicators include faecal streptococci, and bacteriophages. It may also be of value to undertake tracer studies in order to verify whether the land use control measures will provide adequate protection. This could also be linked to hydrogeochemical models and contaminant propagation models where these are adequately calibrated and reliable.
Chemical testing may be included both in monitoring and verification, but the techniques used may vary depending on the objective of the testing. The parameters used in verification should be evaluated at the same time as validation in order that they can be calibrated against an acceptable risk of exposure. Verification is likely to include periodic

452 Protecting Groundwater for Health
analysis of the presence and concentration of substances in groundwater. This may be done at the source, within monitoring networks established around the abstraction point or monitoring around the sources of pollution. The design of appropriate sampling networks is critical and should provide sufficient detailed information to ensure that preventative actions can be deployed in a timely manner.
16.10 SUPPORTING PROGRAMMES In addition to process control measures put in place to assure safety, further activities are required in order to ensure that safe drinking-water can be assured, including activities which have to be undertaken by institutions and agencies other than the water supplier. These supporting programmes are as essential to the delivery of safe drinking-water as are the control measures and monitoring identified in the WSP.
There are a number of types of supporting programmes, some examples are: • a water supplier’s documented policy and commitment to provide high-quality
water supplies; • appointment of a senior member of staff as the risk or water safety manager who
is responsible for ensuring the safety of drinking-water produced; • establishment of internal allocation of roles and responsibilities for assessment
and management of risks; • established internal communication strategy within the utility to ensure
information from monitoring is acted upon promptly and appropriately; • training provided to community operators; • design and construction codes of practice as well as codes of good hygiene
practice established and enforced; • information exchange with regulators and other stakeholders; • a risk communication strategy to provide information to the public in times of
elevated risk; • customer complaint procedures; • implementation of Good Laboratory Practice, including calibration of monitoring
equipment; • staff training and awareness programmes; • securing stakeholder commitment to the protection of groundwater; • development of training and education programmes for communities whose
activities may influence source water quality; • establishment of collaboration contracts with farmers or farmers’ associations
(which may include financial incentives); • training of catchment inspectors; • mapping of catchment characteristics (e.g. land use; vulnerability; protection
zones). The proper implementation of supporting programmes is essential for effective
control of public health risks from water supplies and should be accorded adequate priority.
In situations where the water supplier does not own the land that forms the catchment, and thus has no direct control over activities in it, many control measures related to

Water Safety Plans 453
source protection may become part of the supporting programmes. Specific examples may include, but are not limited to:
• development and implementation of catchment management plans; • controlled density of stock in pastoral areas; • controlled application of fertilizers and pesticides in the catchment; • controlled access for the general public to pollution-sensitive areas in the
catchment; • development of groundwater quality models.
16.11 DOCUMENTATION The final part of the development of the WSP is to document the process, considerations and criteria leading to assessments, and to ensure that people responsible for implementing the WSP have a point of reference. Documentation is also important as part of monitoring the effective implementation of the WSP. Therefore record keeping of monitoring and actions taken is an essential component of the plan.
Tables 16.5 and 16.6 provide examples of WSPs, one for a mechanized borehole and one for a tubewell fitted with a handpump. These WSPs are generic and are designed to provide the reader with a view of the type of material that may be developed. They are not designed as finished plans for immediate implementation, but as a framework within which WSPs can be developed. More detailed descriptions of WSPs may be found both in Water Safety Plans: Managing drinking-water quality from catchment to consumer (Davison et al., 2005) and the Guidelines for Drinking-water Quality, third edition (WHO, 2004).

Tabl
e 16.
5. M
odel
Wat
er S
afet
y Pl
an fo
r mec
hani
zed
bore
hole
(bas
ed o
n D
aviso
n et
al., 2
005)
Ope
ratio
nal l
imits
M
onito
ring
Haz
ardo
us
even
t C
ause
R
isk
Con
trol
m
easu
re
Targ
et Ac
tion
requ
ired
if W
hat?
W
hen?
W
ho?
Cor
rect
ive
actio
n V
erifi
catio
n
Ingr
ess o
f co
ntam
inat
ed
surfa
ce w
ater
dire
ctly
into
bo
reho
le
Poor
well
-hea
d co
mpl
etion
U
nlik
ely/
majo
r Pr
oper
w
ellhe
ad
com
pleti
on
1 m
conc
rete
apro
n ar
ound
well
head
Li
ning
exten
ds 3
0 cm
abov
e the
apro
n D
rain
age d
itche
s in
plac
e
Lini
ng st
ops a
t gr
ound
leve
l Ap
ron
dam
aged
or
crac
ked
Ditc
hes f
ull,
faul
ty o
r ab
sent
Sani
tary i
nspe
ction
Mon
thly
O
pera
tor
Exten
d lin
ing
Repa
ir ap
ron
Clea
n an
d re
pair
drain
age d
itche
s
Sani
tary
insp
ectio
n
E. co
li Fa
ecal
strep
toco
cci
Bacte
rioph
ages
In
gres
s of
cont
amin
ants
due t
o poo
r co
nstru
ction
or
dam
age t
o th
e lin
ing
Poor
ly
main
taine
d w
ellhe
ad
com
pleti
on
Mod
erat
e/ m
ajor
Prop
er
well
head
co
mpl
etion
Top
5 m
of t
he
annu
lus s
ealed
Ri
sing
main
in g
ood
cond
ition
Annu
lus s
ealed
for
less t
han
3 m
Co
lour
chan
ges
Incr
ease
d pu
mpi
ng
requ
ired
to ra
ise
wate
r
Sani
tary i
nspe
ction
W
ater c
larity
CC
TV
Mon
thly
O
pera
tor
Inse
rt se
al ar
ound
an
nulu
s Re
plac
e wor
n an
d co
rrode
d ris
ing m
ains
Use
mate
rials
less
likely
to co
rrode
(e.g
. plas
tics)
Sani
tary
insp
ectio
n An
alysis
of
colo
ur, i
ron
and
turb
idity
CC
TV
Bore
hole
area
is
inun
dated
with
co
ntam
inat
ed
surfa
ce w
ater
Lack
of
dive
rsion
di
tches
Unl
ikely
/ m
ajor
Goo
d dr
ainag
e ar
ound
w
ellhe
ad
Div
ersio
n di
tches
of
adeq
uate
size,
in
good
cond
ition
and
clear
of r
ubbi
sh
Ditc
h ha
s rub
bish
or
show
s sig
ns o
f wea
r Sa
nitar
y ins
pecti
on W
eekl
y O
pera
tor
Repa
ir an
d cl
ean
ditch
In
crea
se si
ze o
f di
tch u
sing
Sani
tary
insp
ectio
n
Pum
ping
lead
s to
incr
ease
d lea
chin
g of
co
ntam
inan
ts
Pum
ping
in
duce
s in
crea
sed
leach
ing
of
chem
icals
Unl
ikely
/ m
oder
ate
Pum
ping
re
gim
e Le
achi
ng o
f co
ntam
inan
ts is
with
in p
redi
cted
ra
nge
Evid
ence
of
incr
ease
d lea
chin
g of
co
ntam
inan
ts
Mon
itorin
g of
key
co
ntam
inan
ts of
co
ncer
n H
ydro
chem
ical
mod
els
Mon
thly
O
pera
tor
Mod
ify p
umpi
ng
regi
me
Trea
tmen
t
Hyd
roch
emica
l m
odels
M
onito
ring
cont
amin
ants
of
conc
ern

Ope
ratio
nal l
imits
M
onito
ring
Haz
ardo
us
even
t C
ause
R
isk
Con
trol
m
easu
re
Targ
et Ac
tion
requ
ired
if W
hat?
W
hen?
W
ho?
Cor
rect
ive
actio
n V
erifi
catio
n
Cont
amin
ated
sh
allow
wate
r dr
awn
into
aq
uife
r
Hyd
raul
ic co
nnec
tion
exist
s betw
een
shall
ow an
d de
eper
aqui
fers
allow
ing
draw
-do
wn in
to
deep
er aq
uife
r
Alm
ost
certa
in/
mod
erate
Cont
rol
pum
ping
re
gim
es
Set i
ntak
e at
dept
h
No
evid
ence
on
indu
ced
leaka
ge
Evid
ence
of s
hallo
w
wate
r dra
wdo
wn
(e.g
. sha
llow
well
s sta
rt to
dry
up)
Colo
ur
(app
eara
nce)
Ta
ste
Odo
ur
Elec
tric
cond
uctiv
ity
Wee
kly
Ope
rato
r Se
t int
ake d
eepe
r (m
icrob
es)
Wate
r tre
atmen
t (m
icro
bial)
or
blen
ding
(c
hem
icals)
E. co
li Fa
ecal
strep
toco
cci
Bacte
rioph
ages
N
itrat
e Tr
acer
stud
ies
Hyd
rolo
gica
l m
odels
Ra
pid
rech
arge
by
rive
rs,
strea
ms a
nd
pond
s
Hyd
raul
ic co
nnec
tion
exist
s betw
een
surfa
ce w
ater
and
aqui
fers
Unl
ikely
/ m
ajor t
o ca
tastro
phic
Set i
ntak
e at
grea
ter
dept
h
Rapi
d re
char
ge d
oes
not o
ccur
or c
anno
t re
ach
intak
e
Evid
ence
of r
apid
re
char
ge fr
om
surfa
ce w
ater b
odies
Surfa
ce w
ater
levels
Co
lour
El
ectri
c co
nduc
tivity
Dail
y O
pera
tor
Set i
ntak
es at
gr
eater
dep
th o
r m
odify
pum
ping
re
gim
es
E. co
li Fa
ecal
strep
toco
cci
Bacte
rioph
ages
Pa
thog
en
asse
ssm
ents
Nitr
ate
Pum
ping
in
crea
ses s
afe
dista
nces
be
yond
curre
nt
prot
ectio
n zo
ne
boun
darie
s
Pum
ping
in
crea
ses c
one
of d
epre
ssio
n ex
tends
m
inim
um
trave
l tim
e di
stanc
e be
yond
pr
otec
tion
zone
Unl
ikely
/ m
oder
ate
Prot
ectio
n zo
nes
Prot
ectio
n zo
nes
inclu
de in
fluen
ce o
f dr
awdo
wn on
gr
ound
wat
er fl
ow
Dra
wdo
wn in
crea
ses
dista
nce e
quiv
alen
t to
trav
el tim
e set
Wat
er ta
ble l
evels
su
rroun
ding
bo
reho
le w
hen
pum
ping
Annu
al
Ope
rato
r Ex
tend
grou
nd-
wate
r pro
tectio
n zo
ne to
acco
unt
for t
he ch
ange
in
dista
nce
Trac
er te
sts
Hyd
roge
olog
ical
mod
ellin
g Tr
acer
tests
An
alysis
of k
ey
micr
obial
and
chem
ical
cont
amin
ants
cont
rolle
d in
pr
otec
tion
zone
s

Ope
ratio
nal l
imits
M
onito
ring
Haz
ardo
us
even
t C
ause
R
isk
Con
trol
m
easu
re
Targ
et Ac
tion
requ
ired
if W
hat?
W
hen?
W
ho?
Cor
rect
ive
actio
n V
erifi
catio
n
Back
sipho
nage
fro
m p
ipe i
nto
bore
hole
No
back
-flow
pr
even
ter
insta
lled
Like
ly/
min
or
Back
flow
prev
enter
on
main
s
Back
flow
prev
enter
in
stalle
d La
ck o
f bac
kflo
w pr
even
ter
Insp
ect p
umpi
ng
wor
ks
Insta
llatio
ns
Perio
dic
chec
ks
Cons
truct
or
Ope
rato
r Ba
ckflo
w pr
even
ter
insta
lled
Audi
t of w
ellhe
ad
and
pum
ping
w
orks
Failu
re in
di
sinfe
ction
pr
oces
s
Disi
nfec
tion
proc
ess f
ails
Unl
ikely
/ m
ajor t
o ca
tastro
phic
Effe
ctive
ch
lorin
ation
w
ith co
ntac
t tim
e
Ct va
lue a
dequ
ate
and
resid
ual
prod
uced
Lack
of r
esid
ual
Mon
itorin
g ch
lorin
e dos
ing
and
resid
ual
Dail
y/
hour
ly
Ope
rato
r Ta
ke p
ump
off-
line a
nd re
pair
disin
fecti
on u
nit
Audi
t of r
esul
ts E.
coli
Faec
al str
epto
cocc
i Ba
cterio
phag
es
Mob
ilisa
tion
of
toxi
c che
mica
ls an
d elu
tion
of
viru
ses
Chan
ges i
n lan
d us
e and
in
crea
sed
rech
arge
th
roug
h irr
igati
on le
ads
to m
obili
satio
n an
d elu
tion
Rare
/ min
or
to m
oder
ate
Land
use
co
ntro
l, in
pa
rticu
lar
man
agin
g irr
igati
on
Littl
e arti
ficial
re
char
ge th
roug
h irr
igati
on, p
H an
d Eh
of
wate
r stab
le
Sign
ifica
nt ch
ange
s in
land
use
In
crea
sed
use o
f irr
igati
on
Land
use
pH
of g
roun
dwat
er
Redo
x (Eh
)
Wee
kly
Ope
rato
r Re
duce
artif
icial
rech
arge
E.
coli
Faec
al str
epto
cocc
i Ba
cterio
phag
es
Chem
icals
of
conc
ern
Leac
hing
of
micr
obial
co
ntam
inan
ts in
to aq
uife
r
Leac
hing
of
faec
al m
ateria
l fro
m
sani
tatio
n,
solid
was
te,
drain
s
Mod
erat
e Pr
otec
tion
zone
s and
se
t-bac
k di
stanc
es
Later
al se
para
tion
defin
ed on
bas
is of
tra
vel t
imes
and
hydr
ogeo
logy
Latri
nes/s
ewer
s bui
lt or
solid
was
te d
umps
w
ithin
sepa
ratio
n di
stanc
e
Sani
tary
insp
ectio
n:
insp
ectio
n of
pr
otec
tion
zone
, ele
ctric
cond
uctiv
ity, s
ewer
lea
kage
Mon
thly
O
pera
tor
Rem
ove p
ollu
tant
sour
ces
Impr
ove
sani
tatio
n de
sign
Redu
ce se
wer
lea
kage
In
sert
cut-o
ff w
alls
arou
nd
sew
ers
Insp
ectio
n
E. co
li Fa
ecal
strep
toco
cci
Bacte
rioph
ages
N
itrat
e Ch
lorid
e Tr
acer
tests
Ope
ratio
nal l
imits
M
onito
ring
Haz
ardo
us
even
t C
ause
R
isk
Con
trol
m
easu
re
Targ
et Ac
tion
requ
ired
if W
hat?
W
hen?
W
ho?
Cor
rect
ive
actio
n V
erifi
catio
n
Gro
undw
ater
cont
ains
natu
rally
oc
curri
ng
chem
icals
Geo
logi
cal
setti
ng m
eans
ch
emic
als
pres
ent a
t tox
ic lev
els
Mod
erat
e So
urce
se
lectio
n U
se o
f gro
undw
ater
w
ith n
o na
tura
l ch
emica
l at h
arm
ful
levels
Evid
ence
of n
atura
l co
ntam
inan
ts
Risk
asse
ssm
ent o
f ge
olog
ical
setti
ng
Initi
al as
sess
men
t of
wate
r qua
lity
Befo
re
insta
llatio
n Co
nstru
ctor
Use
alter
nativ
e so
urce
Tr
eatm
ent
Risk
asse
ssm
ent
Wate
r qua
lity
asse
ssm
ent
Mon
itorin
g of
ch
emic
als o
f co
ncer
n A
gricu
ltura
l po
llutio
n:
nitra
te
Use
of
inor
gani
c or
orga
nic
ferti
lizer
s sto
ck
dens
ity
Unl
ikely
/ m
inor
Pr
otec
tion
zone
N
itrat
e vul
nera
ble
zone
s def
ined
for
aqui
fer p
reve
nt
exce
ssiv
e lea
chin
g
Evid
ence
of
incr
easin
g nitr
ate
levels
Mon
itor n
itrat
e in
grou
ndw
ater
Mon
itor f
ertil
izer
appl
icatio
ns
Mon
itor s
tock
de
nsiti
es
Mon
thly
Su
pplie
r En
viro
nmen
t A
genc
y
Cont
rol o
f fe
rtiliz
er
appl
icatio
ns
Blen
ding
of
drin
king
-wate
r
Nitr
ate l
evels
in
grou
nd-w
ater
Au
dit f
ertil
izer
appl
icatio
ns
Audi
t stic
k de
nsiti
es
Agr
icultu
ral
pollu
tion:
pe
sticid
es
Pesti
cides
lea
ched
into
th
e gro
und-
wate
r
Unl
ikely
/ m
inor
Pr
otec
tion
zone
Pe
sticid
e app
licati
ons
cont
rolle
d in
re
char
ge ar
ea
Evid
ence
of i
ncre
a-sin
g pes
ticid
es in
w
ater
Evid
ence
of p
esti-
cide a
pplic
ation
at
high
-risk
loca
tions
an
d tim
es
Mon
itor p
estic
ide
appl
icatio
ns
Mon
thly
Su
pplie
r En
viro
nmen
t A
genc
y
Cont
rol o
f pe
sticid
e ap
plica
tions
Pesti
cide l
evels
in
grou
nd-w
ater
Au
dit p
estic
ide
appl
icatio
ns
Pollu
tion
from
ur
ban
area
s co
ntam
inat
es
grou
ndw
ater
Poor
ly se
aled
drain
s cau
se
rech
arge
of
grou
nd-w
ater
Mod
erat
e/ m
inor
Pr
otec
tion
zone
s D
rain
age w
ater
unab
le to
rech
arge
gr
ound
wate
r
Poor
ly co
nstru
cted
dr
ains i
ncre
ase
poten
tial f
or re
char
ge
Insp
ectio
n W
eekl
y O
pera
tor
Ensu
re al
l dra
ins
prop
erly
seal
ed in
re
char
ge o
r vu
lner
able
area
s
Audi
t dra
inag
e ch
anne
l des
ign,
co
nstru
ction
and
main
tenan
ce

Ope
ratio
nal l
imits
M
onito
ring
Haz
ardo
us
even
t C
ause
R
isk
Con
trol
m
easu
re
Targ
et Ac
tion
requ
ired
if W
hat?
W
hen?
W
ho?
Cor
rect
ive
actio
n V
erifi
catio
n
Leac
hing
of
chem
icals
from
lan
dfill
sites
into
gr
ound
-wat
er
Leac
hing
of
chem
icals
fro
m la
ndfil
ls,
was
te du
mps
, in
dustr
ial
disc
harg
es to
gr
ound
Mod
erat
e/ m
inor
Pr
otec
tion
zone
La
ndfil
ls ar
e san
itary
an
d pr
oper
ly se
aled
Land
fill p
rese
nce
cont
rolle
d on
bas
is of
tra
vel t
imes
and
hydr
ogeo
logy
Mon
itorin
g aro
und
pollu
tant s
ourc
es
indi
cate
incr
easin
g po
llutio
n m
igra
tion
Mon
itor f
or k
ey
cont
amin
ants
arou
nd p
ollu
tant
sour
ces
Mon
itor b
ills o
f lad
ing
Wee
kly/
daily
W
aste
man
ager
s En
viro
nmen
t A
genc
y Su
pplie
r
Mov
e pol
lutan
t so
urce
s Im
prov
e po
llutio
n co
ntain
men
t M
onito
r netw
ork
arou
nd p
ollu
tant
sour
ces
Insp
ectio
n An
alysis
of
chem
ical
com
posit
ion
of
pollu
tion
Analy
sis o
f wate
r qu
ality
Au
dit b
ills o
f lad
ing
for c
ompo
-sit
ion
of w
aste
Path
ogen
s fro
m
hosp
ital w
astes
co
ntam
inat
e gr
ound
-wat
er
Poor
disp
osal
of h
ospi
tal
was
tes al
low
s di
rect
ingr
ess
of le
achi
ng
into
gro
und-
wate
r
Unl
ikely
/ ca
tastro
phic
Prop
er
hosp
ital
was
te di
spos
al
Hos
pital
was
tes w
ith
path
ogen
ic m
ateria
l in
ciner
ated
Hos
pital
was
te di
spos
al in
dum
ps o
r gr
ound
cont
ainer
s
Mon
itor h
ospi
tal
was
te di
spos
al m
ethod
s
Dail
y W
ater
supp
lier
Hea
lth
auth
oriti
es
Ensu
re al
l pa
thog
enic
m
ateria
l in
ciner
ated
or
steril
ized
Audi
t hos
pita
l w
aste
disp
osal
Indu
strial
di
scha
rges
co
ntam
inat
ed
grou
nd-w
ater
Poor
ly
disp
osed
of
indu
stria
l w
aste
can
inun
date
grou
ndw
ater
so
urce
or l
each
in
to aq
uife
r
Mod
erat
e/ m
inor
W
aste
cont
ainm
ent
and
treat
-m
ent
Effe
ctive
disp
osal
m
ethod
s pre
vent
sp
ills a
nd le
achi
ng
Was
te di
spos
al m
ethod
s do
not
prov
ide s
ecur
ity
again
st in
unda
tion
and
leach
ing
Mon
itor
cont
ainm
ent
meth
ods a
t in
dustr
ial s
ites
Mon
thly
Su
pplie
r En
viro
nmen
t A
genc
y
Ensu
re al
l in
dustr
ial w
aste
is pr
oper
ly
cont
ained
and
treate
d at
the s
ite
Audi
t ind
ustri
al
was
tewate
r tre
atmen
t plan
ts

Tabl
e 16.
6. 'M
odel'
Wat
er S
afet
y Pl
an fo
r bor
ehol
es fi
tted
with
han
dpum
ps (b
ased
on
Dav
ison
et al
., 200
5)
Ope
ratio
nal l
imits
M
onito
ring
Haz
ardo
us
even
t C
ause
R
isk
Con
trol
m
easu
re
Targ
et Ac
tion
Wha
t?
Whe
n?
Who
? C
orre
ctiv
e ac
tion
Ver
ifica
tion
Ingr
ess o
f co
ntam
inat
ed
surfa
ce w
ater
dire
ctly
into
bo
reho
le
Poor
well
head
co
mpl
etion
U
nlik
ely/
majo
r Pr
oper
w
ellhe
ad
com
pleti
on
mea
sure
s
1 m
conc
rete
apro
n ar
ound
well
head
Li
ning
exten
ds 3
0 cm
abov
e the
apro
n D
rain
age d
itche
s in
plac
e
Lini
ng st
ops a
t gr
ound
leve
l Ap
ron
dam
aged
or
crac
ked
Ditc
hes f
ull,
faul
ty o
r abs
ent
Sani
tary
insp
ectio
n M
onth
ly
Com
mun
ity
oper
ator
Exten
d lin
ing
Repa
ir ap
ron
Clea
n an
d re
pair
drain
age d
itche
s
Sani
tary
insp
ectio
n E.
coli
Faec
al str
epto
cocc
i Ba
cterio
phag
es
Ingr
ess o
f co
ntam
inan
ts du
e to p
oor
cons
tructi
on o
r da
mag
e to
the
linin
g
Poor
ly
main
taine
d w
ellhe
ad
com
pleti
on
Mod
erat
e/ m
ajor
Prop
er
well
head
co
mpl
etion
Top
5 m
of t
he
annu
lus s
ealed
Ri
sing
main
in g
ood
cond
ition
Annu
lus s
ealed
fo
r les
s tha
n 3
m
Colo
ur ch
ange
s In
crea
sed
pum
ping
re
quire
d to
raise
w
ater
Sani
tary
insp
ectio
n
Wate
r clar
ity
Annu
al/as
ne
ed ar
ises
Com
mun
ity
oper
ator
Inse
rt se
al ar
ound
an
nulu
s Re
plac
e wor
n an
d co
rrode
d ris
ing
main
s U
se m
ateria
ls les
s lik
ely to
corro
de
(e.g
. plas
tics)
Sani
tary
insp
ectio
n An
alys
is of
colo
ur
and
iron
Bore
hole
area
is
inun
dated
w
ith co
ntam
i-na
ted su
rface
w
ater
Lack
of
dive
rsion
di
tches
Unl
ikely
/ m
ajor
Goo
d dr
ainag
e ar
ound
w
ellhe
ad
Div
ersio
n di
tches
of
adeq
uate
size,
in
good
cond
ition
and
clear
of r
ubbi
sh
Ditc
h ha
s ru
bbish
or s
how
s sig
ns o
f wea
r
Sani
tary
insp
ectio
n M
onth
ly
Com
mun
ity
oper
ator
Repa
ir an
d cl
ean
ditch
In
crea
se si
ze o
f di
tch u
sing
Sani
tary
insp
ectio
n
Cont
amin
ation
in
trodu
ced
as
hand
pum
p re
quire
s pr
imin
g
Prim
ing
water
co
ntam
inat
ed
Alm
ost
certa
in/
min
or
Use
dire
ct ha
ndpu
mp
or
clean
wat
er fo
r pr
imin
g
Wat
er fo
r prim
ing
store
d in
secu
re
cont
ainer
Prim
ing
water
co
mes
from
co
ntam
inat
ed
sour
ce o
r is
store
d po
orly
Insp
ectio
n W
eekl
y Co
mm
unity
op
erato
r Se
lect h
andp
ump
that
does
not
re
quire
pum
ping
Test
prim
ing a
nd
bore
hole
wate
r for
E.
coli
and
faec
al str
epto
cocc
i

Ope
ratio
nal l
imits
M
onito
ring
Haz
ardo
us
even
t C
ause
R
isk
Con
trol
m
easu
re
Targ
et Ac
tion
Wha
t?
Whe
n?
Who
? C
orre
ctiv
e ac
tion
Ver
ifica
tion
Cont
amin
ated
sh
allow
wate
r dr
awn
into
aq
uife
r
Hyd
raul
ic co
nnec
tion
exist
s betw
een
shall
ow an
d de
eper
aqui
fers
allow
ing
draw
-do
wn in
to
deep
er aq
uife
r
Alm
ost
certa
in/
min
or
Pum
ping
re
gim
es d
o no
t in
duce
leac
hing
No
evid
ence
of
draw
down
of
shall
ow
grou
ndw
ater
Evid
ence
of
shall
ow w
ater
draw
down
(e.g
. sh
allow
well
s sta
rt to
dry
up)
Colo
ur
Taste
O
dour
In
spec
tion
Annu
al/as
ne
ed ar
ises
Com
mun
ity
oper
ator
Set i
ntak
e dee
per
(micr
obes
) W
ater t
reatm
ent
(mic
robi
al)
blen
ding
(c
hem
icals)
E. co
li Fa
ecal
strep
toco
cci
Bacte
rioph
ages
N
itrat
e Tr
acer
stud
ies
Hyd
rolo
gica
l m
odels
El
ectri
c co
nduc
tivity
Re
dox p
oten
tial
Leac
hing
of
micr
obial
co
ntam
inan
ts in
to aq
uife
r
Leac
hing
of
faec
al m
ateria
l fro
m sa
nitat
ion,
so
lid w
aste,
dr
ains
Mod
erate
Pr
ovid
e ad
equa
te se
t-ba
ck d
istan
ces
defin
ed on
tra
vel t
ime
No
sour
ces o
f fae
cal
mate
rial w
ithin
set-
back
dist
ance
Latri
nes/s
ewer
s bu
ilt o
r sol
id
was
te du
mps
w
ithin
sepa
ratio
n di
stanc
e
Insp
ectio
n by
co
mm
unity
M
onth
ly
Com
mun
ity
oper
ator
Mov
e pol
lutan
t so
urce
s Im
prov
e sa
nitat
ion
desig
n Re
duce
sew
er
leaka
ge
Insp
ectio
n
E. co
li Fa
ecal
strep
toco
cci
Bacte
rioph
ages
N
itrat
e Ch
lorid
e Tr
acer
stud
ies

Ope
ratio
nal l
imits
M
onito
ring
Haz
ardo
us
even
t C
ause
R
isk
Con
trol
m
easu
re
Targ
et Ac
tion
Wha
t?
Whe
n?
Who
? C
orre
ctiv
e ac
tion
Ver
ifica
tion
Gro
undw
ater
cont
ains
natu
rally
oc
curri
ng
chem
icals
Geo
logi
cal
setti
ng m
eans
ch
emic
als
pres
ent a
t tox
ic lev
els
Mod
erate
Se
lect g
roun
d-w
ater w
ith
acce
ptab
le lev
els o
f natu
ral
chem
icals
Wate
r qua
lity
asse
ssm
ents
indi
cate
wate
r qua
lity i
s ac
cept
able
Evid
ence
of
natu
ral
cont
amin
ants
Risk
asse
ssm
ent
of g
eolo
gica
l se
tting
W
ater q
ualit
y as
sess
men
t
Befo
re
cons
tructi
on
Perio
dic
evalu
ation
Wate
r de
velo
pmen
t ag
ency
Use
alter
nativ
e so
urce
Tr
eatm
ent o
f w
ater
Risk
asse
ssm
ent
Wate
r qua
lity
asse
ssm
ent
Mon
itorin
g of
ch
emic
als o
f co
ncer
n Le
achi
ng o
f ch
emic
als in
to
grou
ndw
ater
Leac
hing
of
chem
icals
fro
m la
ndfil
ls,
was
te du
mps
, di
scha
rges
to
grou
nd
Mod
erat
e/ m
inor
Pr
ovid
e ad
equa
te se
t-ba
ck d
istan
ces
defin
ed on
tra
vel t
ime
No
sour
ces o
f ch
emic
als w
ithin
se
t-bac
k di
stanc
e
Pollu
tant
disc
harg
es
with
in se
t-bac
k di
stanc
e
Insp
ectio
n by
co
mm
unity
M
onth
ly
Com
mun
ity
oper
ator
Mov
e pol
lutan
t so
urce
s Im
prov
e pol
lutio
n co
ntain
men
t
Insp
ectio
n An
alysis
of
chem
ical
com
posit
ion
of
pollu
tion
Analy
sis o
f wate
r qu
ality

462 Protecting Groundwater for Health
16.12 REFERENCES APSU (2005) Technology water safety plans for rural water supplies in Bangladesh (1st edition).
www.apsu-bd.org (accessed 2005). Ashbolt, N.J., Grabow, W.O.K. and Snozzi, M. (2001) Indicators of microbial water quality. In
Water quality: standards, guidelines and health, (eds. L. Fewtrell and J. Bartram), pp. 289-307, WHO, IWA Publishing, London.
Barry, S.J., Atwill, E.R., Tate, K.W., Koopman, T.S., Cullor, J. and Huff, T. (1998) Developing and implementing a haccp-based programme to control cryptosporidium and other waterborne pathogens in the alameda creek watershed: case study. In AWWA Annual Conference, Texas Water Resources vol. B, pp. 57-69, Dallas.
Bosshart, U., Kaiser, H-P. and Stettler, R. (2003) Hazard Analysis and Critical Control Points at the Zurich Water Supply. In: 2003: Water safety, (eds. O. Schmoll and I. Chorus), pp. 73-86, Conference Abstracts, Umweltbundesamt Texte 74/03, Berlin.
Codex Alimentarius Commission (FAO/WHO) (1996) Report of the Twenty-Ninth Session of the Codex Committee on Food Hygiene, Washington DC.
Davison, A., Howard, G., Stevens, M., Callan, P., Fewtrell, L., Deere, D. and Bartram, J. (2005) Water Safety Plans: Managing drinking-water quality from catchment to consumer. WHO, Geneva.
Deere, D., Stevens, M., Davison, A., Helm, G. and Dufour, A. (2001) Management Strategies. In Water Quality: Guidelines, standards and health – Assessment of risk and risk management for water-related infectious disease, (eds. J. Bartram and L. Fewtrell), pp. 257-288, WHO, IWA Publishing, London.
Deere, D. and Davison, A. (1998) Safe water – are food guidelines the answer? Water, 25, 21-24. Fewtrell, L. and Bartram, J. (eds.) (2001) Water Quality: Guidelines, standards and health –
Assessment of risk and risk management for water-related infectious disease. WHO, IWA Publishing, London.
Gelinas, Y., Randall, H., Robidoux, L. and Schmit, J-P. (1996) Well water survey in two Districts of Conakry (Republic of Guinea) and comparison with the piped city water. Water Resour., 30(9), 2017-2026.
Godfrey, S., Niwagaba, C., Howard, G. and Tibatemwa, S. (2003) Water Safety Plans for Utilities in Developing Countries - A case study from Kampala, Uganda. WEDC, Loughborough University, www.lboro.ac.uk/wedc/iram (accessed April 29, 2005).
Gray, R. and Morain, M. (2000) HACCP Application to Brisbane Water. Water, 27, 41-43. Haas, C.N., Rose, J.B. and Gerba, C.P. (1999) Quantitative Microbial Risk Assessment. John Wiley
and Sons, New York. Havelaar, A.H. (1994) The application of HACCP to drinking-water supply. Food Control, 5(3),
145-152. Havelaar, A.H. and Melse, J.M. (2003) Quantifying Public Health Risk in the WHO Guidelines for
Drinking-Water Quality: A burden of disease approach. RIVM report 734301022/2003, Bilthoven.
Hellard, M.E., Sinclair, M.I., Forbes, A.B. and Fairley, C.K. (2001) A randomised, blinded, controlled trial investigating the gastrointestinal health effects of drinking-water quality. EHP, 109(8), 773-778.
Helmer, R., Bartram, J. and Galal-Gorchev, H. (1999) Regulation of drinking-water standards. Water Supply, 17(3/4), 1-6.
Howard, G. (ed.) (2002) Water supply surveillance - a reference manual. WEDC, Loughborough University.
Howard, G. (2003) Water safety plans for small systems: Applying HACCP principles for cost-effective monitoring in developing countries. Water, Sci. Technol., 47(3), 215-220.

Water Safety Plans 463
Howard, G., Bartram, J., Schuab, S., Deere, D. and Waite, M. (2001) Regulation of microbiological quality in water cycle. In: Water Quality: Standards, guidelines and health, (eds. L. Fewtrell and J. Bartram), pp. 377-393, IWA Publishing, London.
Howard, G., Pedley, S., Barrett, M., Nalubega, M. and Johal, K. (2003) Risk factors contributing to microbiological contamination of shallow groundwater in Kampala, Uganda. Water Res., 37(14), 3421-3429.
MOH NZ (2001) How to Prepare and Develop Public Health Risk Management Plans for Drinking-water Supplies. Ministry of Health, Wellington.
NACMCF (1992) Hazard Analysis and Critical Control Point System. National Advisory Committee on Microbiological Criteria for Foods (NACMCF), Washington, DC.
O'Connor, D.R. (2002) Report of the Walkerton Enquiry: The events of May 2000 and related issues. Queen's Printer for Ontario, Toronto.
Payment, P. and Hunter, P. (2001) Endemic and epidemic infectious intestinal disease and its relationship to drinking water. In Water Quality: Standards, guidelines and health, (eds. L. Fewtrell and J. Bartram), pp. 61-88, IWA Publishing, London.
Payment, P., Richardson, L., Siemiatycki, J., Dewar, R., Edwardes, M. and Franco, E. (1991) A Randomised trial to evaluate the risk of Gastrointestinal disease due to consumption of drinking water meeting current microbiological standards. Am. J. Public Health, 81(6), 703-708.
SGWA (Swiss Gas and Water Industry Association) (1998) Branchenspezifisches Qualitätsmanagement für Versorgungsunternehmen. SVGW, Zurich.
SGWA (2003) Recommendations for a simple quality assurance system for water supplies (W 1002 e). SVGW, Zurich.
WHO (1993) Guidelines for Drinking-Water Quality: Recommendations, 2nd edn, vol. 1, WHO, Geneva.
WHO (1996) Guidelines for Drinking-Water Quality: Health and other supporting criteria, 2nd edn, vol. 2, WHO, Geneva.
WHO (1997) Guidelines for Drinking-Water Quality: Surveillance and control of community supplies, 2nd edn, vol. 3, WHO, Geneva.
WHO (2004) Guidelines for Drinking-Water Quality: Recommendations, 3rd edn, vol. 1, WHO, Geneva.
Wright, R.C. (1986) The seasonality of bacterial quality of water in a tropical developing country (Sierra Leone). J. Hygiene, 96(1), 75-82.
Wülser, R. and Trachsel, H. (2003) Safeguarding the drinking water quality: using the example of the Industriellen Werke Basle. In Water Safety, (eds. O. Schmoll and I. Chorus), pp. 59-72, Conference Abstracts, Umweltbundesamt Texte 74/03, Berlin.