Embed Size (px)
Citation preview
November 2015
Managing Water Mains Repairs for Safe Drinking Water

easy maintenance level sensor
industrial.electrical.
automation.for more information call 1800 557 705 or email [email protected]
LEVEL MEASUREMENT MADE EASY.
unplug sensorfrom cable60 cmH2O to100 mH2OHART communications
The LMK 358H with separable stainless steel housing and ceramic sensor from BD Sensors
has been designed for level measurement in waste water, waste and higher viscosity media.
With a quick and easy-to-change connector, the transmitter head is simply plugged
into the cable assembly.
Reduce downtime and save labour costs with the LMK 358H.
notnotnotafraidafraidafraidtoafraidafraidgetto getdirty
0.1% accuracy FSO
Editorial CommitteePeter Mosse, Editor [email protected]
George Wall [email protected]
Direct mail to:Peter Mosse WaterWorks Editor c/o WIOA, 22 Wyndham Street Shepparton, Vic 3630
Advertising & ProductionAustralian Water Association (AWA) Publications, Level 6, 655 Pacific Highway, PO Box 222, St Leonards, NSW 1590
WaterWorks is the publication of the Water Industry Operators Association of Australia (WIOA). It is published twice yearly and distributed with AWA Water Journal. Neither WIOA nor AWA assume responsibility for opinions or statements of facts expressed by contributors or advertisers.
Contributions WantedWaterWorks welcomes the submission of articles relating to any operations area associated with the water industry. Articles can include brief accounts of one-off experiences or longer articles describing detailed studies or events. Submissions may be emailed to [email protected] or [email protected]
WATERWORKS DECEMBER 2010 3
Over the past few years at WIOAConferences and Workshops, we have raisedthe issue of the often confusing way that theconcentration of aluminium-basedcoagulants such as alum (aluminiumsulphate) or aluminium chlorohydrate(ACH) is quoted.
For example the concentration of alumcan be expressed as mg/L alum, mg/L dryalum, ppm V, mg/L Al2O3. This makes itvery difficult for operators when they arediscussing doses to be sure the numbersbeing quoted are comparable.Unfortunately some newer operators are notreally aware that such differences even exist!
There is also a tendency to compare dosesof alum and ACH directly without anyappreciation of the differences in the natureof the chemicals. ACH containsapproximately 23% w/w aluminium(strictly Al2O3) while alum containsapproximately 8% w/w aluminium (strictlyAl2O3). Therefore since it is the aluminiumthat does the work in coagulation, there isclearly more aluminium in ACH than inalum. In other words the doses cannot be compared directly.
If we look back into the history of theproduction of alum we can start tounderstand where this confusing situationstarted. Alum was produced from bauxite oralumina under the direction ofmetallurgists, and the strength of liquidalum was expressed as “percent weightAl2O3” (aluminium oxide) rather than“percent weight aluminium” or “percentageweight aluminium sulphate”. The reason forthis was that the starting material in theproduction of alum was aluminium oxide.(i.e. bauxite or alumina)
Of course there are straight forwardfactors you can apply to convert from onemethod of reporting to another, e.g.multiply the concentration in percentageweight/weight Al2O3 by 0.53 to get
weight/weight aluminium. But that justadds to the confusion!
If we consider the chemical structure ofalum it gets even more interesting. Alum isa strange beast. In Australia, we understandalum to have the chemical formulaAl2(SO4)3.18H2O, i.e. it has eighteen watermolecules (water of hydration) attached toit. By the way, this results in the Aussieversion of alum having the molecularweight of around 666, which for those ofyou who are fans of Iron Maiden will recall,is the Sign of the Beast!
However, you’ll find American alumoften has 14- or even 14.3-H2O’s! In theUK, it can have 16- or even 21-H2O’s! Sowhat are we really dealing with? A mess!
We would like to propose to theAustralian Water Industry and, theAustralian manufacturers of aluminium-based coagulants in particular, that weadopt the convention of “percentweight/weight aluminium” as the preferredway of quoting chemical strength.
We would also like to suggest thatOperators and others working in watertreatment start quoting alum and other Al-based coagulant doses as “mg/Laluminium”. Once the suppliers come onboard it will be much easier to progressfrom the chemical supplier’s documents tothe actual dose in the plant.
The other important benefit of thisapproach is that it would be very easy tocompare doses of alum with say ACH. Allthe aluminium based coagulants would beon a “level playing field” as all doses wouldbe quoted using the same unit, mg/L Al.
This method has already been pretty-welladopted for ferric-based coagulants such asferric chloride, PFS® and others. So whynot do it for aluminium-based coagulants?
To progress this idea further, we wouldlike some feedback from Operators, theguys and gals who actually have to workwith and dose these chemicals in water andwastewater treatment facilities! Let us knowwhat you think.
In the mean time we will try to take thisup with the chemical manufacturers,possibly WSAA, and other stakeholders.
In the interim, cheers and happy jar-testing!!
Editorial CommitteePeter Mosse, Editor [email protected]
George Wall [email protected]
Direct mail to: Peter Mosse WaterWorks Editorc/-WIOA, 22 Wyndham StreetShepparton Vic 3630
Advertising & ProductionHallmark EditionsPO Box 84, Hampton, Vic 318899 Bay Street, Brighton, Vic 3186Tel (03) 8534 5000 Fax (03) 9530 8911Email: [email protected]
WaterWorks is the publication of the Water IndustryOperators Association of Australia (WIOA). It ispublished twice yearly and distributed with WaterJournal. Neither the WIOA nor the AWA assumeresponsibility for opinions or statements of factsexpressed by contributors or advertisers. All materialin WaterWorks is copyright and should not bepublished wholly or in part without the writtenpermission of the Editor.
Contributions WantedWaterWorks welcomes the submission of articlesrelating to any operations area associated with thewater industry. Articles can include brief accountsof one-off experiences or longer articles describingdetailed studies or events. These can be emailed toa member of the editorial committee or mailed tothe above address in handwritten, typed or printedform.
OFFICIAL JOURNAL OF THE WATER INDUSTRY OPERATORS ASSOCIATION OF AUSTRALIA
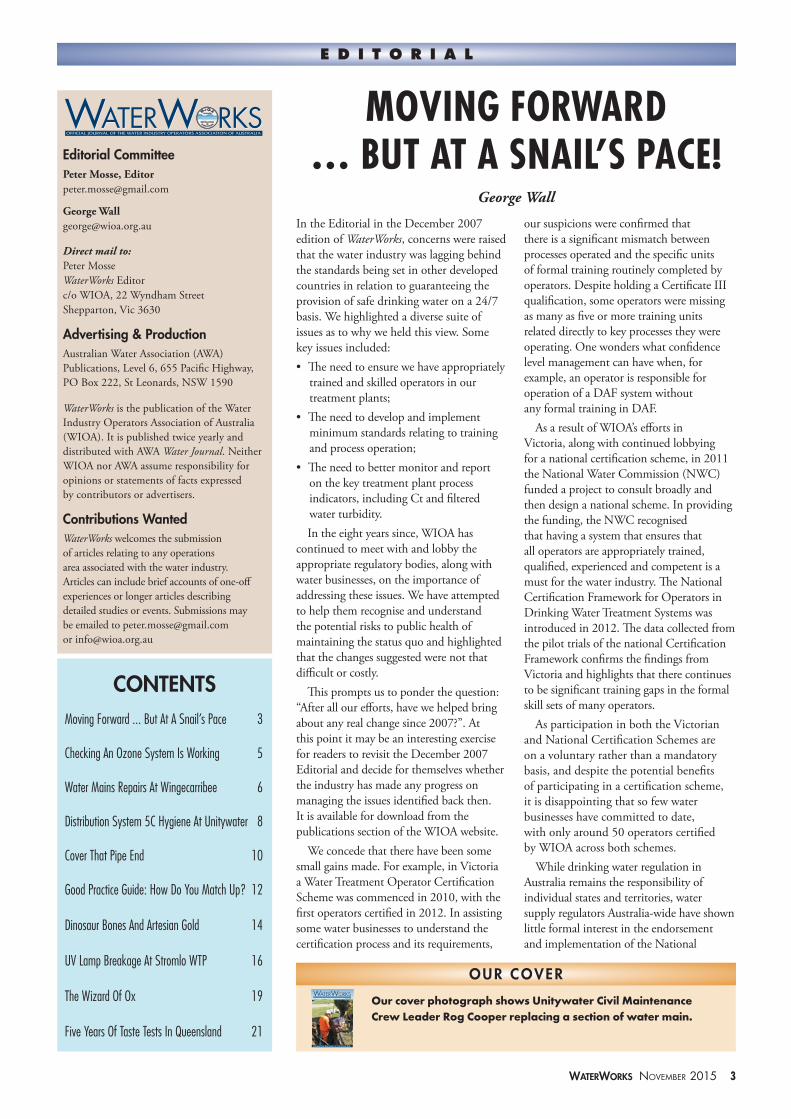
CONTENTSEditorial 3
Sewer Repairs Over Shoalhaven River 4
Lamella Clarifier Trials At Dinner Plain 6
The Switch 9
How’s Your Pipe? 11
Rehabilitation of Sewers for the Future 14
E D I T O R I A L
ALUMINIUM, YOUR TIME HAS COME!
Peter Mosse and Peter Gebbie
OUR COVERClockwise from top left: Winner of the 2010 “TopOpShot Award” submitted by Greg Whorlow – PlenumEntry, GWM Water – Greg wins a Coles Myer voucher for $200; Runner Up submitted by David Barry– Read the Sign! Aqualift P/L wins a set of WIOA practical guide books; Building Blocks (Editor’s Note– Apologies to the company that submitted these, I lost the email); Digester on the Move – Wannon Water.
Water Works December 2010a 25/11/10 8:39 AM Page 3
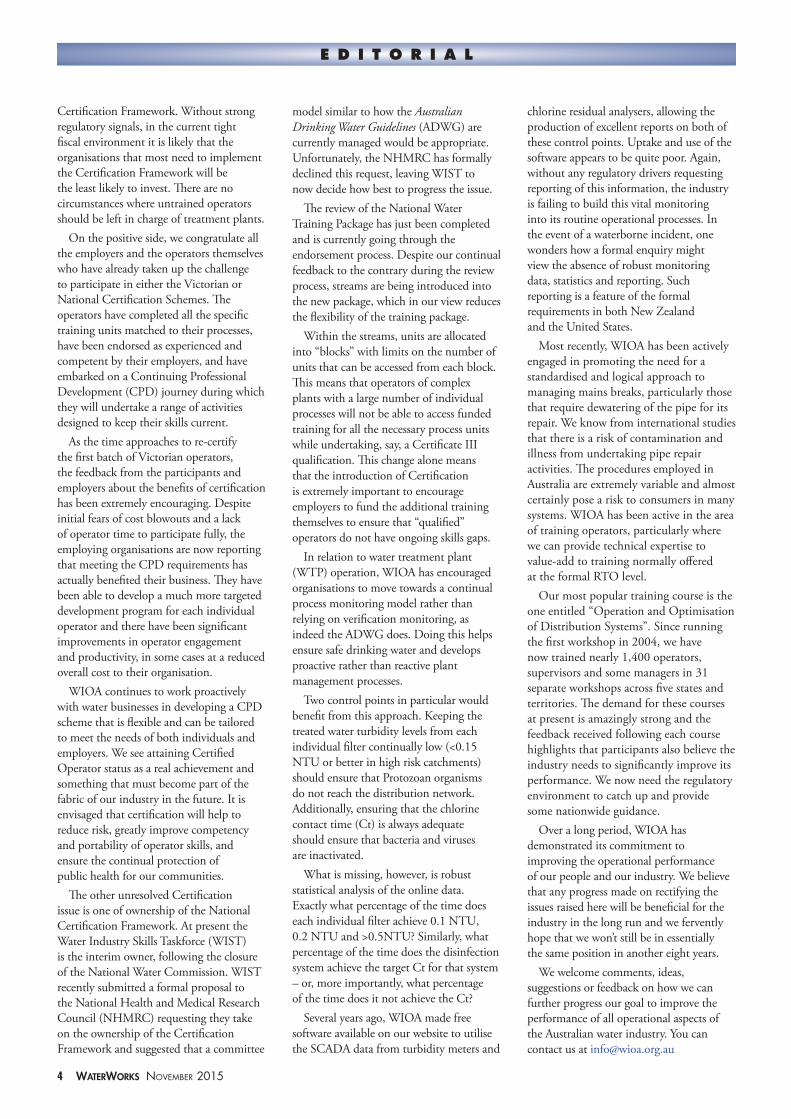
In the Editorial in the December 2007 edition of WaterWorks, concerns were raised that the water industry was lagging behind the standards being set in other developed countries in relation to guaranteeing the provision of safe drinking water on a 24/7 basis. We highlighted a diverse suite of issues as to why we held this view. Some key issues included: • The need to ensure we have appropriately
trained and skilled operators in our treatment plants;
• The need to develop and implement minimum standards relating to training and process operation;
• The need to better monitor and report on the key treatment plant process indicators, including Ct and filtered water turbidity. In the eight years since, WIOA has
continued to meet with and lobby the appropriate regulatory bodies, along with water businesses, on the importance of addressing these issues. We have attempted to help them recognise and understand the potential risks to public health of maintaining the status quo and highlighted that the changes suggested were not that difficult or costly.
This prompts us to ponder the question: “After all our efforts, have we helped bring about any real change since 2007?”. At this point it may be an interesting exercise for readers to revisit the December 2007 Editorial and decide for themselves whether the industry has made any progress on managing the issues identified back then. It is available for download from the publications section of the WIOA website.
We concede that there have been some small gains made. For example, in Victoria a Water Treatment Operator Certification Scheme was commenced in 2010, with the first operators certified in 2012. In assisting some water businesses to understand the certification process and its requirements,
our suspicions were confirmed that there is a significant mismatch between processes operated and the specific units of formal training routinely completed by operators. Despite holding a Certificate III qualification, some operators were missing as many as five or more training units related directly to key processes they were operating. One wonders what confidence level management can have when, for example, an operator is responsible for operation of a DAF system without any formal training in DAF.
As a result of WIOA’s efforts in Victoria, along with continued lobbying for a national certification scheme, in 2011 the National Water Commission (NWC) funded a project to consult broadly and then design a national scheme. In providing the funding, the NWC recognised that having a system that ensures that all operators are appropriately trained, qualified, experienced and competent is a must for the water industry. The National Certification Framework for Operators in Drinking Water Treatment Systems was introduced in 2012. The data collected from the pilot trials of the national Certification Framework confirms the findings from Victoria and highlights that there continues to be significant training gaps in the formal skill sets of many operators.
As participation in both the Victorian and National Certification Schemes are on a voluntary rather than a mandatory basis, and despite the potential benefits of participating in a certification scheme, it is disappointing that so few water businesses have committed to date, with only around 50 operators certified by WIOA across both schemes.
While drinking water regulation in Australia remains the responsibility of individual states and territories, water supply regulators Australia-wide have shown little formal interest in the endorsement and implementation of the National
CONTENTSMoving Forward ... But At A Snail’s Pace 3
Checking An Ozone System Is Working 5
Water Mains Repairs At Wingecarribee 6
Distribution System 5C Hygiene At Unitywater 8
Cover That Pipe End 10
Good Practice Guide: How Do You Match Up? 12
Dinosaur Bones And Artesian Gold 14
UV Lamp Breakage At Stromlo WTP 16
The Wizard Of Ox 19
Five Years Of Taste Tests In Queensland 21
WaterWorks November 2015 3
E D I T O R I A L
MOVING FORWARD … BUT AT A SNAIL’S PACE!
George Wall
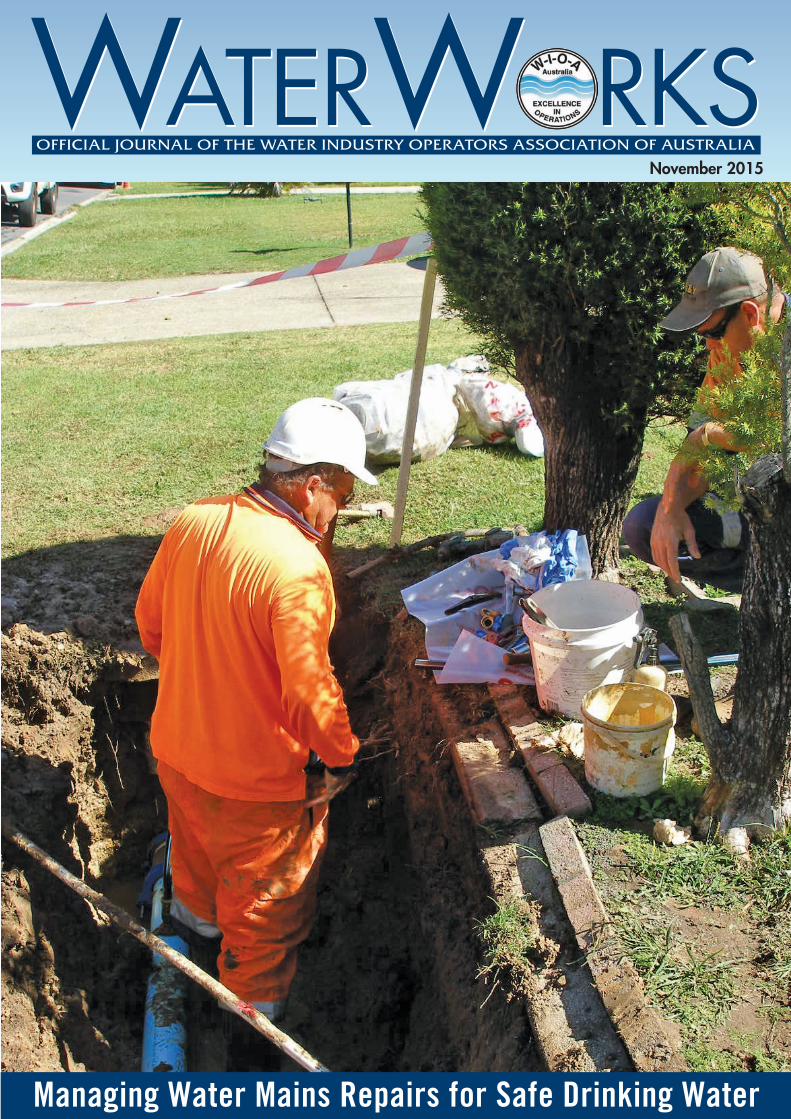
Our cover photograph shows Unitywater Civil Maintenance Crew Leader Rog Cooper replacing a section of water main.
OUR COVERNovember 2015
Managing Water Mains Repairs for Safe Drinking Water
4 WaterWorks November 2015
Certification Framework. Without strong regulatory signals, in the current tight fiscal environment it is likely that the organisations that most need to implement the Certification Framework will be the least likely to invest. There are no circumstances where untrained operators should be left in charge of treatment plants.
On the positive side, we congratulate all the employers and the operators themselves who have already taken up the challenge to participate in either the Victorian or National Certification Schemes. The operators have completed all the specific training units matched to their processes, have been endorsed as experienced and competent by their employers, and have embarked on a Continuing Professional Development (CPD) journey during which they will undertake a range of activities designed to keep their skills current.
As the time approaches to re-certify the first batch of Victorian operators, the feedback from the participants and employers about the benefits of certification has been extremely encouraging. Despite initial fears of cost blowouts and a lack of operator time to participate fully, the employing organisations are now reporting that meeting the CPD requirements has actually benefited their business. They have been able to develop a much more targeted development program for each individual operator and there have been significant improvements in operator engagement and productivity, in some cases at a reduced overall cost to their organisation.
WIOA continues to work proactively with water businesses in developing a CPD scheme that is flexible and can be tailored to meet the needs of both individuals and employers. We see attaining Certified Operator status as a real achievement and something that must become part of the fabric of our industry in the future. It is envisaged that certification will help to reduce risk, greatly improve competency and portability of operator skills, and ensure the continual protection of public health for our communities.
The other unresolved Certification issue is one of ownership of the National Certification Framework. At present the Water Industry Skills Taskforce (WIST) is the interim owner, following the closure of the National Water Commission. WIST recently submitted a formal proposal to the National Health and Medical Research Council (NHMRC) requesting they take on the ownership of the Certification Framework and suggested that a committee
model similar to how the Australian Drinking Water Guidelines (ADWG) are currently managed would be appropriate. Unfortunately, the NHMRC has formally declined this request, leaving WIST to now decide how best to progress the issue.
The review of the National Water Training Package has just been completed and is currently going through the endorsement process. Despite our continual feedback to the contrary during the review process, streams are being introduced into the new package, which in our view reduces the flexibility of the training package.
Within the streams, units are allocated into “blocks” with limits on the number of units that can be accessed from each block. This means that operators of complex plants with a large number of individual processes will not be able to access funded training for all the necessary process units while undertaking, say, a Certificate III qualification. This change alone means that the introduction of Certification is extremely important to encourage employers to fund the additional training themselves to ensure that “qualified” operators do not have ongoing skills gaps.
In relation to water treatment plant (WTP) operation, WIOA has encouraged organisations to move towards a continual process monitoring model rather than relying on verification monitoring, as indeed the ADWG does. Doing this helps ensure safe drinking water and develops proactive rather than reactive plant management processes.
Two control points in particular would benefit from this approach. Keeping the treated water turbidity levels from each individual filter continually low (<0.15 NTU or better in high risk catchments) should ensure that Protozoan organisms do not reach the distribution network. Additionally, ensuring that the chlorine contact time (Ct) is always adequate should ensure that bacteria and viruses are inactivated.
What is missing, however, is robust statistical analysis of the online data. Exactly what percentage of the time does each individual filter achieve 0.1 NTU, 0.2 NTU and >0.5NTU? Similarly, what percentage of the time does the disinfection system achieve the target Ct for that system – or, more importantly, what percentage of the time does it not achieve the Ct?
Several years ago, WIOA made free software available on our website to utilise the SCADA data from turbidity meters and
chlorine residual analysers, allowing the production of excellent reports on both of these control points. Uptake and use of the software appears to be quite poor. Again, without any regulatory drivers requesting reporting of this information, the industry is failing to build this vital monitoring into its routine operational processes. In the event of a waterborne incident, one wonders how a formal enquiry might view the absence of robust monitoring data, statistics and reporting. Such reporting is a feature of the formal requirements in both New Zealand and the United States.
Most recently, WIOA has been actively engaged in promoting the need for a standardised and logical approach to managing mains breaks, particularly those that require dewatering of the pipe for its repair. We know from international studies that there is a risk of contamination and illness from undertaking pipe repair activities. The procedures employed in Australia are extremely variable and almost certainly pose a risk to consumers in many systems. WIOA has been active in the area of training operators, particularly where we can provide technical expertise to value-add to training normally offered at the formal RTO level.
Our most popular training course is the one entitled “Operation and Optimisation of Distribution Systems”. Since running the first workshop in 2004, we have now trained nearly 1,400 operators, supervisors and some managers in 31 separate workshops across five states and territories. The demand for these courses at present is amazingly strong and the feedback received following each course highlights that participants also believe the industry needs to significantly improve its performance. We now need the regulatory environment to catch up and provide some nationwide guidance.
Over a long period, WIOA has demonstrated its commitment to improving the operational performance of our people and our industry. We believe that any progress made on rectifying the issues raised here will be beneficial for the industry in the long run and we fervently hope that we won’t still be in essentially the same position in another eight years.
We welcome comments, ideas, suggestions or feedback on how we can further progress our goal to improve the performance of all operational aspects of the Australian water industry. You can contact us at [email protected]
E D I T O R I A L
WATERWORKS NOVEMBER 2015 5
Dear Peter,
I was wondering if you have come across any ozone systems in WTPs lately. We did an inspection at the Bootawa WTP for MidCoast Water last week and found some interesting things.
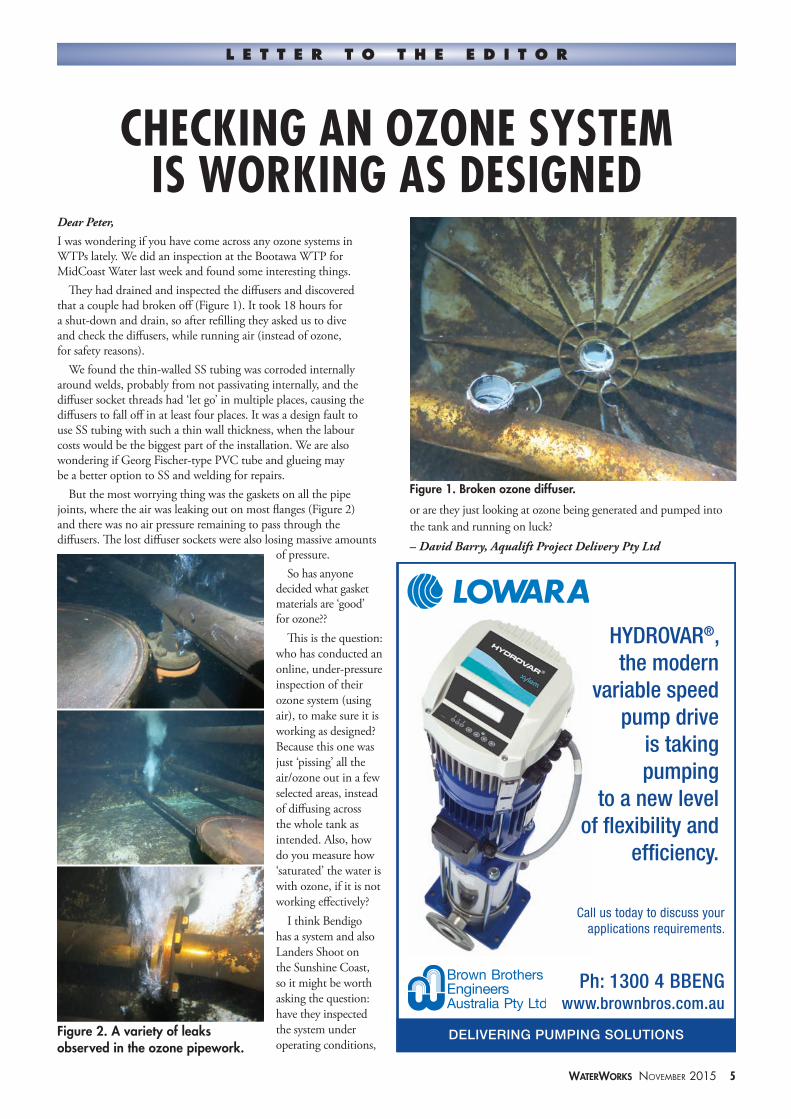
� ey had drained and inspected the di� users and discovered that a couple had broken o� (Figure 1). It took 18 hours for a shut-down and drain, so after re� lling they asked us to dive and check the di� users, while running air (instead of ozone, for safety reasons).
We found the thin-walled SS tubing was corroded internally around welds, probably from not passivating internally, and the di� user socket threads had ‘let go’ in multiple places, causing the di� users to fall o� in at least four places. It was a design fault to use SS tubing with such a thin wall thickness, when the labour costs would be the biggest part of the installation. We are also wondering if Georg Fischer-type PVC tube and glueing may be a better option to SS and welding for repairs.
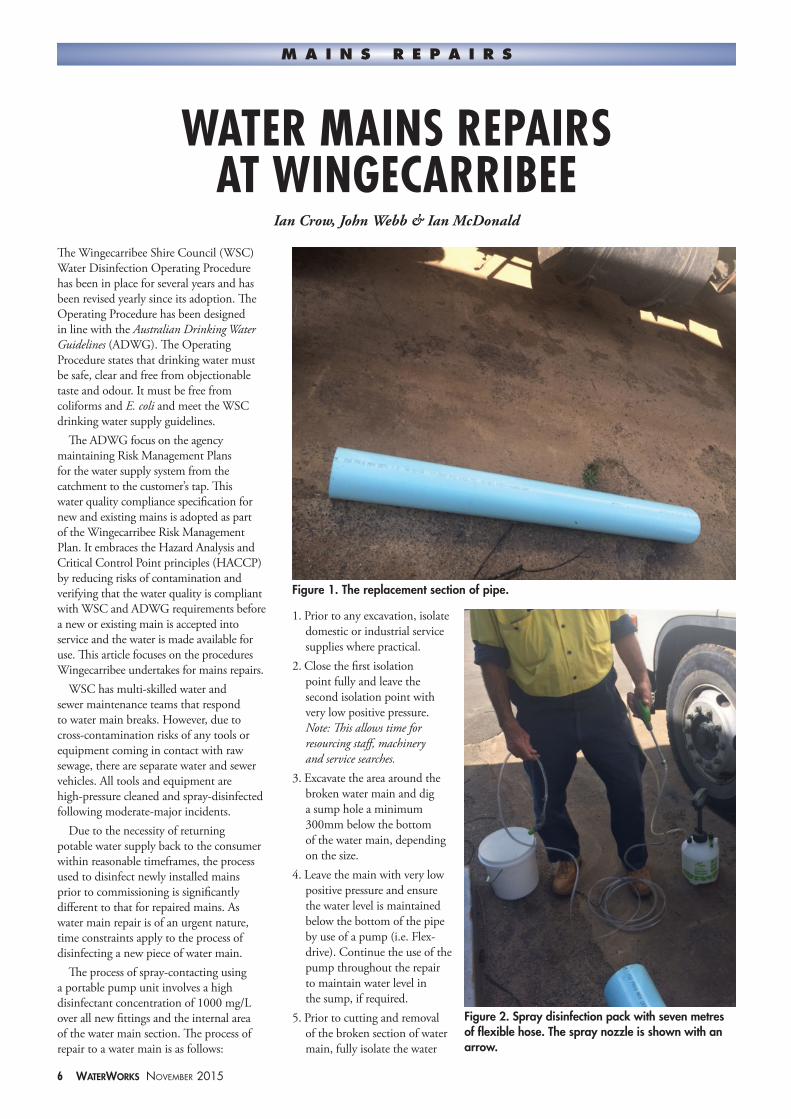
But the most worrying thing was the gaskets on all the pipejoints, where the air was leaking out on most � anges (Figure 2) and there was no air pressure remaining to pass through the di� users. � e lost di� user sockets were also losing massive amounts
of pressure. So has anyone
decided what gasket materials are ‘good’ for ozone??
� is is the question: who has conducted an online, under-pressure inspection of their ozone system (using air), to make sure it is working as designed? Because this one was just ‘pissing’ all the air/ozone out in a few selected areas, instead of di� using across the whole tank as intended. Also, how do you measure how ‘saturated’ the water is with ozone, if it is not working e� ectively?
I think Bendigo has a system and also Landers Shoot on the Sunshine Coast, so it might be worth asking the question: have they inspected the system under operating conditions,
or are they just looking at ozone being generated and pumped into the tank and running on luck?– David Barry, Aqualift Project Delivery Pty Ltd
CHECKING AN OZONE SYSTEM IS WORKING AS DESIGNED
L E T T E R T O T H E E D I T O R
Figure 1. Broken ozone diffuser.
Figure 2. A variety of leaks observed in the ozone pipework.
DELIVERING PUMPING SOLUTIONS
Call us today to discuss your applications requirements.
www.brownbros.com.auPh: 1300 4 BBENG
HYDROVAR®, the modern
variable speed pump drive
is taking pumping
to a new level of flexibility and
efficiency.
6 WaterWorks November 2015
WATER MAINS REPAIRS AT WINGECARRIBEE
Ian Crow, John Webb & Ian McDonald
The Wingecarribee Shire Council (WSC) Water Disinfection Operating Procedure has been in place for several years and has been revised yearly since its adoption. The Operating Procedure has been designed in line with the Australian Drinking Water Guidelines (ADWG). The Operating Procedure states that drinking water must be safe, clear and free from objectionable taste and odour. It must be free from coliforms and E. coli and meet the WSC drinking water supply guidelines.
The ADWG focus on the agency maintaining Risk Management Plans for the water supply system from the catchment to the customer’s tap. This water quality compliance specification for new and existing mains is adopted as part of the Wingecarribee Risk Management Plan. It embraces the Hazard Analysis and Critical Control Point principles (HACCP) by reducing risks of contamination and verifying that the water quality is compliant with WSC and ADWG requirements before a new or existing main is accepted into service and the water is made available for use. This article focuses on the procedures Wingecarribee undertakes for mains repairs.
WSC has multi-skilled water and sewer maintenance teams that respond to water main breaks. However, due to cross-contamination risks of any tools or equipment coming in contact with raw sewage, there are separate water and sewer vehicles. All tools and equipment are high-pressure cleaned and spray-disinfected following moderate-major incidents.
Due to the necessity of returning potable water supply back to the consumer within reasonable timeframes, the process used to disinfect newly installed mains prior to commissioning is significantly different to that for repaired mains. As water main repair is of an urgent nature, time constraints apply to the process of disinfecting a new piece of water main.
The process of spray-contacting using a portable pump unit involves a high disinfectant concentration of 1000 mg/L over all new fittings and the internal area of the water main section. The process of repair to a water main is as follows:
1. Prior to any excavation, isolate domestic or industrial service supplies where practical.
2. Close the first isolation point fully and leave the second isolation point with very low positive pressure.Note: This allows time for resourcing staff, machinery and service searches.
3. Excavate the area around the broken water main and dig a sump hole a minimum 300mm below the bottom of the water main, depending on the size.
4. Leave the main with very low positive pressure and ensure the water level is maintained below the bottom of the pipe by use of a pump (i.e. Flex-drive). Continue the use of the pump throughout the repair to maintain water level in the sump, if required.
5. Prior to cutting and removal of the broken section of water main, fully isolate the water
M a i n s r e p a i r s
Figure 1. The replacement section of pipe.
Figure 2. Spray disinfection pack with seven metres of flexible hose. The spray nozzle is shown with an arrow.
WaterWorks November 2015 7
main. Replace the broken main, collar-to-collar preferred, depending on other services present.
6. Excavate approximately 100mm of bed material under the pipe to be replaced. This allows for access for tightening fittings.
7. Before inserting the new section of main, the section is supported off the ground using wedges to minimise contamination
from the ground and is inspected to ensure that it is clean and free from contaminants. Spray contact the inside of the pipe using a portable pressure pack and wand with chlorine solution and spray all fittings (1000 mg/L). Ensure all parts are kept free from mud or other contaminants.
8. Align the new section of water main using the appropriate type of gibaults
and use the correct tension as per the manufacturer’s recommendations.
9. Insert a hydrant at the highest point in the water main and open the supply slowly to flush the line. Continue flushing until any discolouration and air is expelled and the main is fully charged.
10. Open the valve completely and conduct a turbidity test to ensure the turbidity level flowing to the repaired area is consistent with the water exiting the new section and according to standard.
NOTE: ADWG recommends > 5NTU; WSC strives to reach >1NTU.11. Conduct Free and Total Chlorine tests
on the water prior to removal of the standpipe. Free and Total Chlorine levels must be consistent with the parent main reading and the new section of main. All readings must be within guidelines as set by the water authority before supply can be returned to the customer.
NOTE: The WSC target is between >0.2mg/L and <1.0mg/L12. Once all tests have been conducted
and have proven satisfactory according to standards, slowly open the last isolation point and return the consumer’s domestic and industrial services prior to leaving site.
The Authors
Ian Crow ([email protected]) is an Operator/Team Leader, John Webb is an Assistant Operator Reticulation and Ian McDonald is an Assistant Operator Reticulation, all with Wingecarribee Shire Council NSW.
M a i n s r e p a i r s
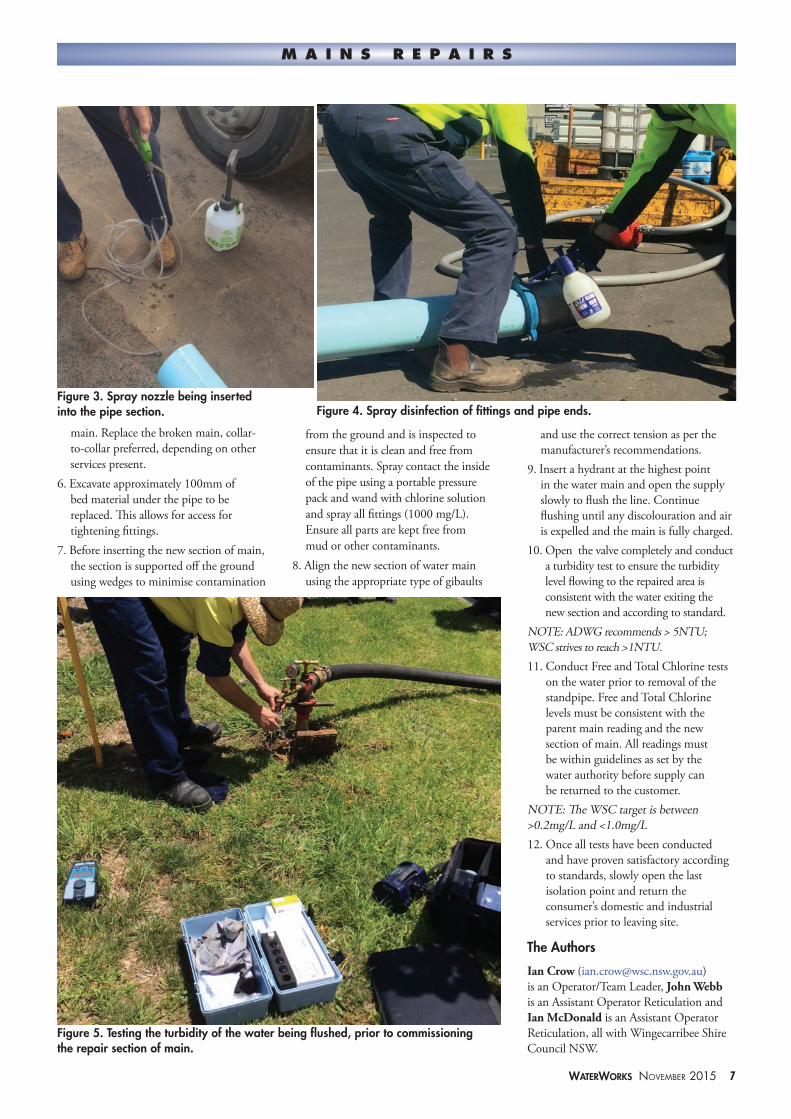
Figure 3. Spray nozzle being inserted into the pipe section. Figure 4. Spray disinfection of fittings and pipe ends.
Figure 5. Testing the turbidity of the water being flushed, prior to commissioning the repair section of main.
8 WaterWorks November 2015
DISTRIBUTION SYSTEM 5C HYGIENE AT UNITYWATER
Shannon McBride & Belinda Janke
Unitywater was formed in 2010 and supplies water and sewerage services to a population of approximately 750,000 residents from the northern suburbs of Brisbane north to Noosa, and inland to Woodford and Kenilworth. The area was previously serviced by six individual councils with quite different work practices. Also, it has been necessary to address the added complexity of combined water and sewer maintenance crews that are needed to cover the large geographical area and provide a 24-hour service to customers without adding to the cost of their bills.
Procedures that specify how work is to be undertaken in the distribution system to minimise contamination and protect public health are relatively common. However, they are often difficult to apply consistently and are too detailed to refer to when in the middle of a difficult repair job with mounting pressure to get the water back on. This is a major reason why hygienic work practices are often inconsistently applied or not at all. Additionally, it is important to know that even the simplest job – e.g. replacing water meters – is undertaken in a manner that is mindful of the contamination risk.
We decided to develop an approach that supports field staff to make decisions with confidence in often variable and difficult site conditions encountered during mains repairs, maintenance and recommissioning.
Three-and-a-half years on, Unitywater has developed a Water Hygiene program for its workforce and contractors, based on the Water Hygiene Blue Card system used in the UK. We engaged a Blue Card trainer from the UK and put all maintenance crews through a specialised Water Hygiene training program that has been incorporated into Unitywater’s learning and development program.
The Water Hygiene program revolves around an easily remembered slogan: the 5Cs (Figure 1).
The 5C program recognises five potential sources of contamination that might occur during a mains repair and puts in place measures to prevent that contamination occurring.
M A I N S R E P A I R S
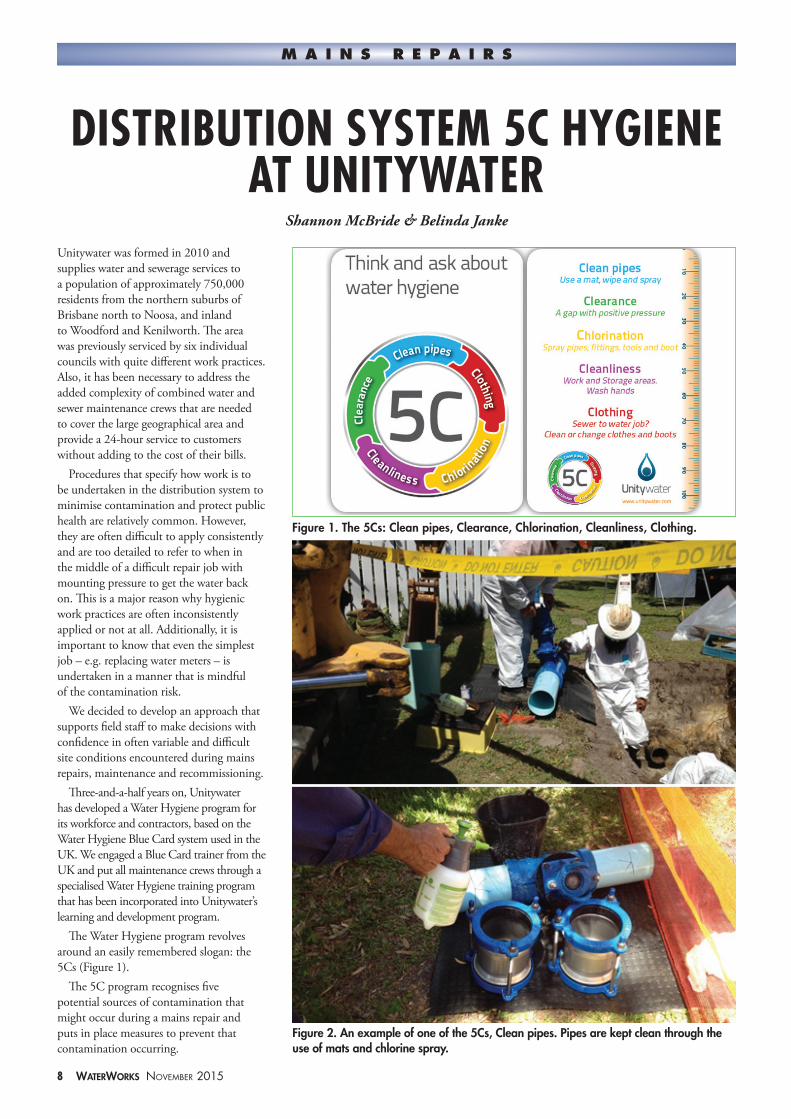
Figure 1. The 5Cs: Clean pipes, Clearance, Chlorination, Cleanliness, Clothing.
Figure 2. An example of one of the 5Cs, Clean pipes. Pipes are kept clean through the use of mats and chlorine spray.
WaterWorks November 2015 9
1. Clean pipes. Pipes, pipe fittings and the way they are handled have the potential to introduce contaminants. Placing pipe sections and fittings on a clean mat (Figure 2) and spraying the fittings and pipe ends with disinfectant reduces that risk.
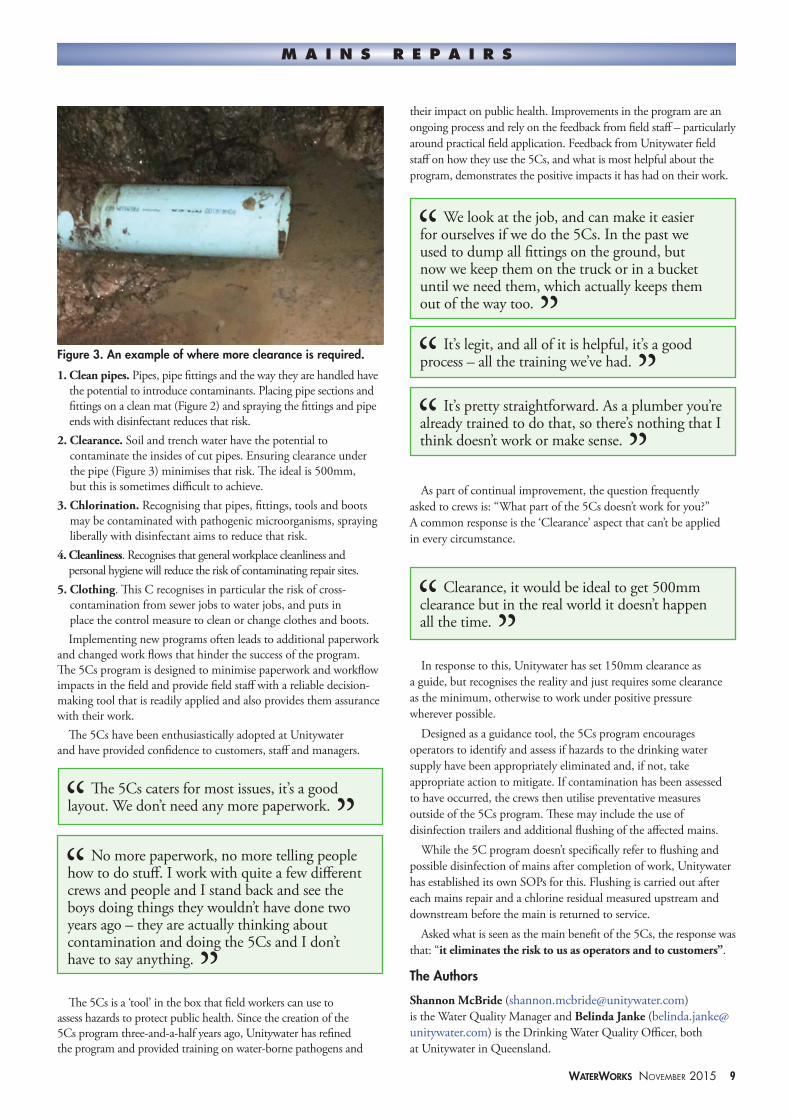
2. Clearance. Soil and trench water have the potential to contaminate the insides of cut pipes. Ensuring clearance under the pipe (Figure 3) minimises that risk. The ideal is 500mm, but this is sometimes difficult to achieve.
3. Chlorination. Recognising that pipes, fittings, tools and boots may be contaminated with pathogenic microorganisms, spraying liberally with disinfectant aims to reduce that risk.
4. Cleanliness. Recognises that general workplace cleanliness and personal hygiene will reduce the risk of contaminating repair sites.
5. Clothing. This C recognises in particular the risk of cross-contamination from sewer jobs to water jobs, and puts in place the control measure to clean or change clothes and boots.Implementing new programs often leads to additional paperwork
and changed work flows that hinder the success of the program. The 5Cs program is designed to minimise paperwork and workflow impacts in the field and provide field staff with a reliable decision-making tool that is readily applied and also provides them assurance with their work.
The 5Cs have been enthusiastically adopted at Unitywater and have provided confidence to customers, staff and managers.
The 5Cs caters for most issues, it’s a good layout. We don’t need any more paperwork.
No more paperwork, no more telling people how to do stuff. I work with quite a few different crews and people and I stand back and see the boys doing things they wouldn’t have done two years ago – they are actually thinking about contamination and doing the 5Cs and I don’t have to say anything.
The 5Cs is a ‘tool’ in the box that field workers can use to assess hazards to protect public health. Since the creation of the 5Cs program three-and-a-half years ago, Unitywater has refined the program and provided training on water-borne pathogens and
their impact on public health. Improvements in the program are an ongoing process and rely on the feedback from field staff – particularly around practical field application. Feedback from Unitywater field staff on how they use the 5Cs, and what is most helpful about the program, demonstrates the positive impacts it has had on their work.
We look at the job, and can make it easier for ourselves if we do the 5Cs. In the past we used to dump all fittings on the ground, but now we keep them on the truck or in a bucket until we need them, which actually keeps them out of the way too.
It’s pretty straightforward. As a plumber you’re already trained to do that, so there’s nothing that I think doesn’t work or make sense.
It’s legit, and all of it is helpful, it’s a good process – all the training we’ve had.
As part of continual improvement, the question frequently asked to crews is: “What part of the 5Cs doesn’t work for you?” A common response is the ‘Clearance’ aspect that can’t be applied in every circumstance.
In response to this, Unitywater has set 150mm clearance as a guide, but recognises the reality and just requires some clearance as the minimum, otherwise to work under positive pressure wherever possible.
Designed as a guidance tool, the 5Cs program encourages operators to identify and assess if hazards to the drinking water supply have been appropriately eliminated and, if not, take appropriate action to mitigate. If contamination has been assessed to have occurred, the crews then utilise preventative measures outside of the 5Cs program. These may include the use of disinfection trailers and additional flushing of the affected mains.
While the 5C program doesn’t specifically refer to flushing and possible disinfection of mains after completion of work, Unitywater has established its own SOPs for this. Flushing is carried out after each mains repair and a chlorine residual measured upstream and downstream before the main is returned to service.
Asked what is seen as the main benefit of the 5Cs, the response was that: “it eliminates the risk to us as operators and to customers”.
The Authors
Shannon McBride ([email protected]) is the Water Quality Manager and Belinda Janke ([email protected]) is the Drinking Water Quality Officer, both at Unitywater in Queensland.
M A I N S R E P A I R S
Clearance, it would be ideal to get 500mm clearance but in the real world it doesn’t happen all the time.
Figure 3. An example of where more clearance is required.
10 WaterWorks November 2015
Cover ThaT PiPe endPeter Mosse
There is increasing evidence from around the world that people are getting ill as a result of contamination that occurs within distribution systems. Much of the illness has been attributed to unhygienic maintenance activities in the distribution system.
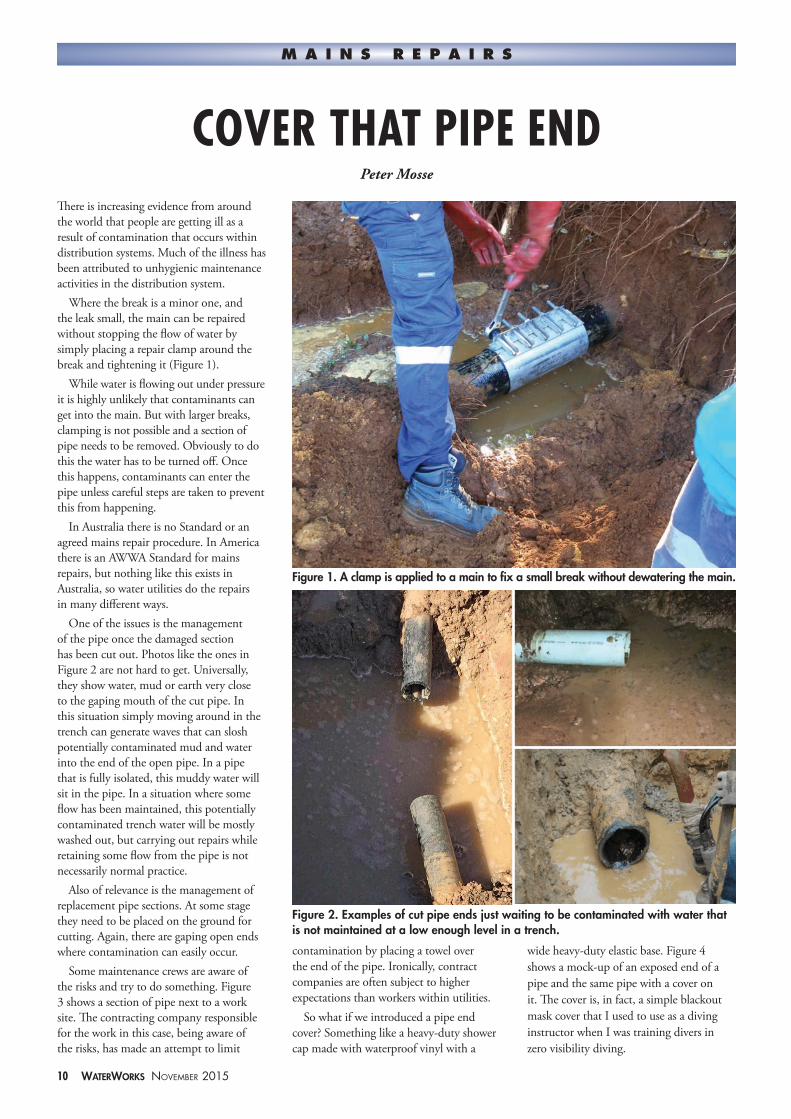
Where the break is a minor one, and the leak small, the main can be repaired without stopping the flow of water by simply placing a repair clamp around the break and tightening it (Figure 1).
While water is flowing out under pressure it is highly unlikely that contaminants can get into the main. But with larger breaks, clamping is not possible and a section of pipe needs to be removed. Obviously to do this the water has to be turned off. Once this happens, contaminants can enter the pipe unless careful steps are taken to prevent this from happening.
In Australia there is no Standard or an agreed mains repair procedure. In America there is an AWWA Standard for mains repairs, but nothing like this exists in Australia, so water utilities do the repairs in many different ways.
One of the issues is the management of the pipe once the damaged section has been cut out. Photos like the ones in Figure 2 are not hard to get. Universally, they show water, mud or earth very close to the gaping mouth of the cut pipe. In this situation simply moving around in the trench can generate waves that can slosh potentially contaminated mud and water into the end of the open pipe. In a pipe that is fully isolated, this muddy water will sit in the pipe. In a situation where some flow has been maintained, this potentially contaminated trench water will be mostly washed out, but carrying out repairs while retaining some flow from the pipe is not necessarily normal practice.
Also of relevance is the management of replacement pipe sections. At some stage they need to be placed on the ground for cutting. Again, there are gaping open ends where contamination can easily occur.
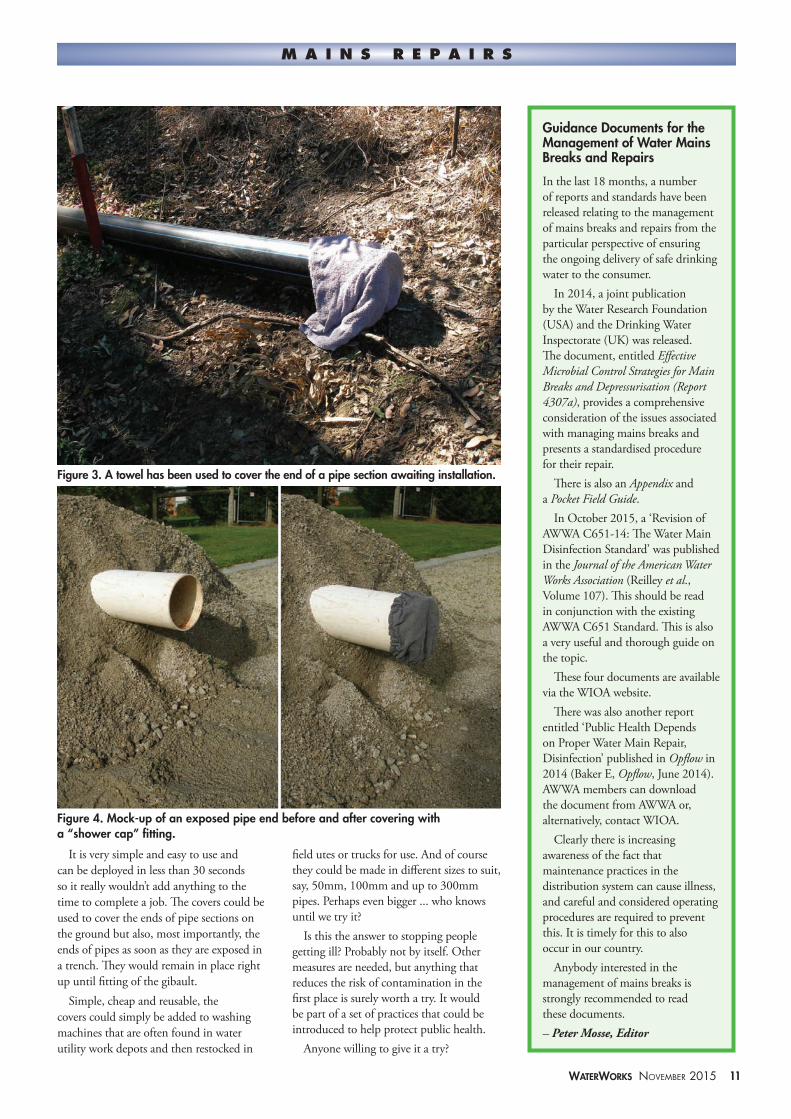
Some maintenance crews are aware of the risks and try to do something. Figure 3 shows a section of pipe next to a work site. The contracting company responsible for the work in this case, being aware of the risks, has made an attempt to limit
contamination by placing a towel over the end of the pipe. Ironically, contract companies are often subject to higher expectations than workers within utilities.
So what if we introduced a pipe end cover? Something like a heavy-duty shower cap made with waterproof vinyl with a
wide heavy-duty elastic base. Figure 4 shows a mock-up of an exposed end of a pipe and the same pipe with a cover on it. The cover is, in fact, a simple blackout mask cover that I used to use as a diving instructor when I was training divers in zero visibility diving.
M a i n S R E P a i R S
Figure 1. A clamp is applied to a main to fix a small break without dewatering the main.
Figure 2. Examples of cut pipe ends just waiting to be contaminated with water that is not maintained at a low enough level in a trench.
WaterWorks November 2015 11
It is very simple and easy to use and can be deployed in less than 30 seconds so it really wouldn’t add anything to the time to complete a job. The covers could be used to cover the ends of pipe sections on the ground but also, most importantly, the ends of pipes as soon as they are exposed in a trench. They would remain in place right up until fitting of the gibault.
Simple, cheap and reusable, the covers could simply be added to washing machines that are often found in water utility work depots and then restocked in
field utes or trucks for use. And of course they could be made in different sizes to suit, say, 50mm, 100mm and up to 300mm pipes. Perhaps even bigger ... who knows until we try it?
Is this the answer to stopping people getting ill? Probably not by itself. Other measures are needed, but anything that reduces the risk of contamination in the first place is surely worth a try. It would be part of a set of practices that could be introduced to help protect public health.
Anyone willing to give it a try?
M a i n S R E P a i R S
Guidance Documents for the Management of Water Mains Breaks and Repairs
In the last 18 months, a number of reports and standards have been released relating to the management of mains breaks and repairs from the particular perspective of ensuring the ongoing delivery of safe drinking water to the consumer.
In 2014, a joint publication by the Water Research Foundation (USA) and the Drinking Water Inspectorate (UK) was released. The document, entitled Effective Microbial Control Strategies for Main Breaks and Depressurisation (Report 4307a), provides a comprehensive consideration of the issues associated with managing mains breaks and presents a standardised procedure for their repair.
There is also an Appendix and a Pocket Field Guide.
In October 2015, a ‘Revision of AWWA C651-14: The Water Main Disinfection Standard’ was published in the Journal of the American Water Works Association (Reilley et al., Volume 107). This should be read in conjunction with the existing AWWA C651 Standard. This is also a very useful and thorough guide on the topic.
These four documents are available via the WIOA website.
There was also another report entitled ‘Public Health Depends on Proper Water Main Repair, Disinfection’ published in Opflow in 2014 (Baker E, Opflow, June 2014). AWWA members can download the document from AWWA or, alternatively, contact WIOA.
Clearly there is increasing awareness of the fact that maintenance practices in the distribution system can cause illness, and careful and considered operating procedures are required to prevent this. It is timely for this to also occur in our country.
Anybody interested in the management of mains breaks is strongly recommended to read these documents. – Peter Mosse, Editor
Figure 3. A towel has been used to cover the end of a pipe section awaiting installation.
Figure 4. Mock-up of an exposed pipe end before and after covering with a “shower cap” fitting.
12 WaterWorks November 2015
An ongoing challenge for the Australian water industry is converting the vast amount of knowledge we have gathered about the management of drinking water supplies over decades into improved operational practice.
There are many textbooks available on the operation of water treatment plants (WTPs) and water supply systems. We also have quite a few regulatory documents that define good practice in water treatment. Despite all this documentation and associated regulation there are many examples, some of them in Australia, where the poor operation and maintenance of water treatment and supply systems has resulted in outbreaks of waterborne disease, or near misses. Steve Hrudey highlighted some of these during his recent seminars in Australia.
Chapter 3 of the Australian Drinking Water Guidelines (2011) (ADWG) provides a framework for delivery of microbially safe drinking water. It requires water suppliers to use a risk-based approach to assess the hazards of the source water and implement
barriers to safeguard against each hazard to produce safe drinking water. The Water Services Association of Australia (WSAA) will shortly release the Manual for the Application of Health-Based Treatment Targets (HBT Manual), which describes the steps to be taken to achieve microbially safe drinking water.
But what if you already have an operational WTP? The risks have been assessed and the capital investment decisions made in terms of the required treatment processes. Neither the ADWG nor the HBT Manual cover the finer details of the requirements for optimising these existing processes. For example, where do you set the pH for effective coagulant dosing? The pH at the time of coagulant dosing has a major bearing on the water quality outcomes, but pH values are not uniformly monitored. Similarly, when should backwashes be triggered on media filters? Backwash triggers provide protection against the passage of pathogens through the filters.
The identified need here is a concise reference document for senior managers
and operational staff of drinking water utilities that states the targets, both numerical and observational, which if implemented will give assurance that the drinking water being produced will be microbially safe.
After identifying this key gap, Water Research Australia and WSAA engaged Peter Mosse and Bruce Murray to produce such a document. At 38 pages, plus an appendix and references, the result of Water Research Australia Project #1074 is the Good Practice Guide to the Operation of Drinking Water Supply Systems for the Management of Microbial Risk (‘the Guide’). The Guide was reviewed by a technical advisory group of water treatment specialists with demonstrated hands-on experience in managing water treatment processes both in Australia and New Zealand.
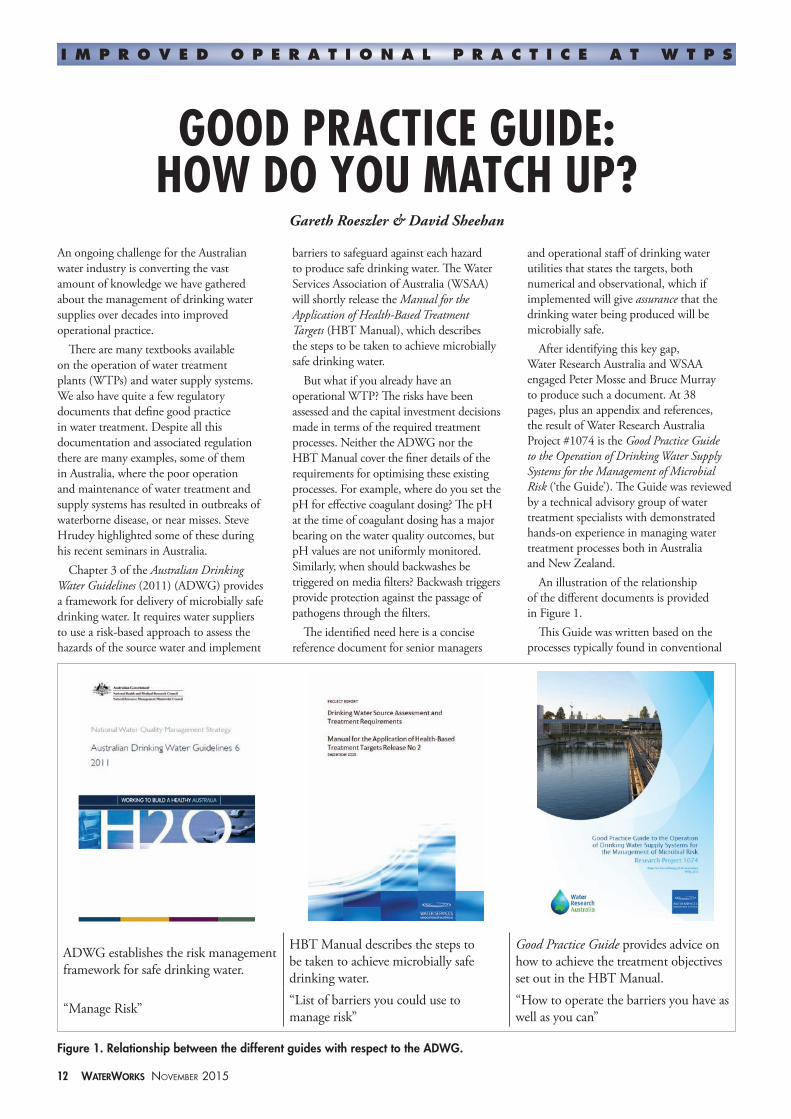
An illustration of the relationship of the different documents is provided in Figure 1.
This Guide was written based on the processes typically found in conventional
GOOD PRACTICE GUIDE: HOW DO YOU MATCH UP?
Gareth Roeszler & David Sheehan
I m p r o v e d o p e r a t I o n a l p r a c t I c e a t W t p s
ADWG establishes the risk management framework for safe drinking water.
HBT Manual describes the steps to be taken to achieve microbially safe drinking water.
Good Practice Guide provides advice on how to achieve the treatment objectives set out in the HBT Manual.
“Manage Risk” “List of barriers you could use to manage risk”
“How to operate the barriers you have as well as you can”
Figure 1. Relationship between the different guides with respect to the ADWG.
WaterWorks November 2015 13
WTPs including chemical pre-treatment, coagulation, flocculation, clarification, media or membrane filtration, and disinfection (chlorine-based chemicals and/or UV irradiation).
It provides advice on the “required”, “supporting” and “desirable” measures that operations teams can check are in place, or implement, depending on the configuration of their plant. These recommendations are colour coded and are presented in a table that lists the measure, its rationale, recommended frequency of measurement and assessment. and the required result. An example from the Guide is shown in Table 1.
The tables within the Guide are not limited to just general WTP operation, but cover a comprehensive range of systems found in conventional WTPs including:• Raw Water Extraction and Storage
Systems;• Raw Water Flow Management;
• Residuals Management; • Coagulation and Flocculation;• Clarification Media Filtration;• Chlorine-Based Primary Disinfection;• UV Disinfection;• Membrane Filtration;• Equipment and Instrumentation;• Distribution Systems; and • Water Quality Information
Management.The key outcome of the project and
the reason for the release of the Good Practice Guide, which is available free of charge, is to encourage managers and operational staff of drinking water utilities to adopt the measures in the Guide into their routine operations. The entries in the Guide represent the best available knowledge on WTP optimisation for the Australian industry. The hope is that when provided with plainly stated numerical and observational targets, managers and
operators will adopt them, and this in turn will drive more consistency in the operation of treatment plants and increase the assurance we have in the water produced by our utilities.
If you would like a copy of the Guide it is available for free download on the Water Research Australia website: www.waterra.com.au/project-details/167. Limited print copies are available through the authors of this paper. If your utility downloads a copy of the guide and finds it useful, we would love to hear about it too. [email protected]
The Authors
Gareth Roeszler ([email protected]) is Program Manager Research with Water Research Australia, and David Sheehan ([email protected]) is General Manager Water Quality Performance & Regulation with Coliban Water in Victoria.
I m p r o v e d o p e r a t I o n a l p r a c t I c e a t W t p s
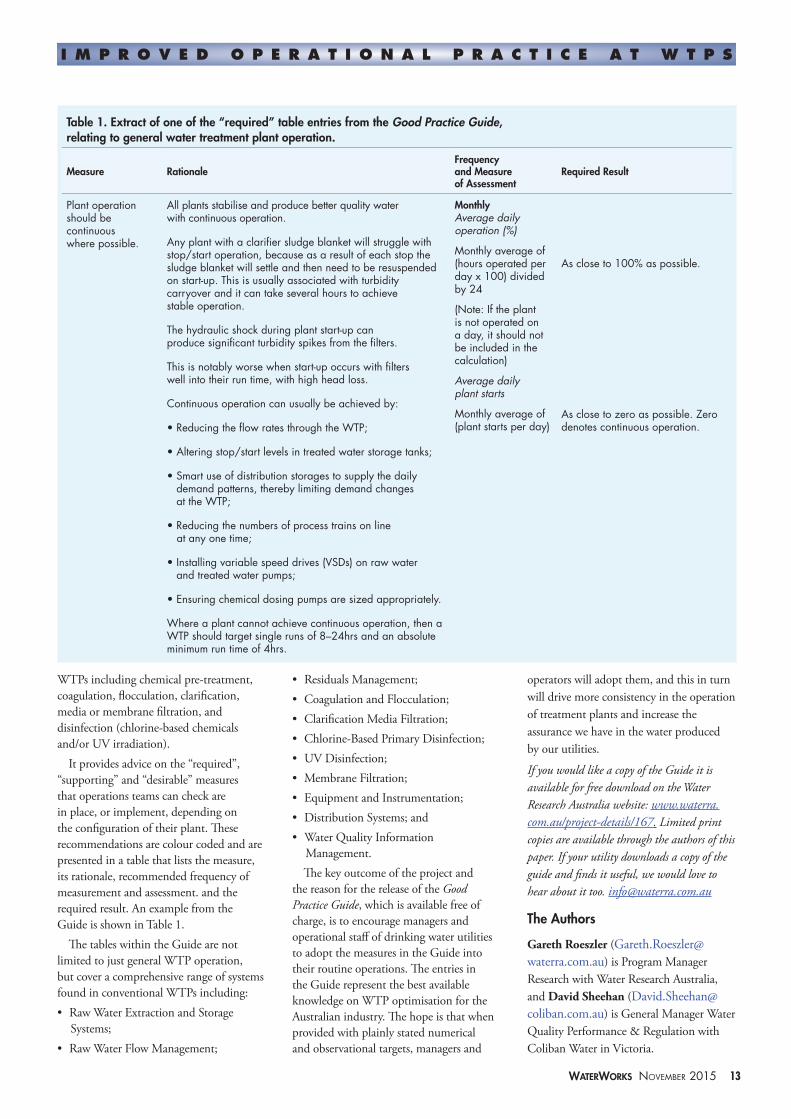
Table 1. Extract of one of the “required” table entries from the Good Practice Guide, relating to general water treatment plant operation.
Measure RationaleFrequency and Measure of Assessment
Required Result
Plant operation should be continuous where possible.
All plants stabilise and produce better quality water with continuous operation.
Any plant with a clarifier sludge blanket will struggle with stop/start operation, because as a result of each stop the sludge blanket will settle and then need to be resuspended on start-up. This is usually associated with turbidity carryover and it can take several hours to achieve stable operation.
The hydraulic shock during plant start-up can produce significant turbidity spikes from the filters.
This is notably worse when start-up occurs with filters well into their run time, with high head loss.
Continuous operation can usually be achieved by:
• Reducing the flow rates through the WTP;
• Altering stop/start levels in treated water storage tanks;
• Smart use of distribution storages to supply the daily demand patterns, thereby limiting demand changes at the WTP;
• Reducing the numbers of process trains on line at any one time;
• Installing variable speed drives (VSDs) on raw water and treated water pumps;
• Ensuring chemical dosing pumps are sized appropriately.
Where a plant cannot achieve continuous operation, then a WTP should target single runs of 8–24hrs and an absolute minimum run time of 4hrs.
MonthlyAverage daily operation (%)
Monthly average of (hours operated per day x 100) divided by 24
(Note: If the plant is not operated on a day, it should not be included in the calculation)
Average daily plant starts
Monthly average of (plant starts per day)
As close to 100% as possible.
As close to zero as possible. Zero denotes continuous operation.
14 WaterWorks November 2015
DINOSAUR BONES AND ARTESIAN GOLD
Geoffrey Johnson
Richmond lies in the outback Queensland dinosaur triangle, and is home to Australia’s most complete dinosaur skeleton and a noteworthy museum containing many dinosaur skeletons and fossils. A key attraction for tourists and paleontologists is the opportunity to go fossicking for fossils and dinosaur bones with the resident museum curator and visiting paleontologists from all over the world.
Like many towns in western Queensland, Richmond draws its water from the Great Artesian Basin. Although not as highly contaminated with iron and managanese as some Queensland water supplies, evidence of their presence is readily observed throughout town by the orange and brown staining on most buildings. The other key issue, which was more prevalent in one bore than the other, was the presence of sulfides, which for those new to town came as somewhat of a shock when they turned on a tap or had a shower. The poor quality of water was made more apparent to Council following the construction of the Ammonite Inn, which provided increased capacity for tourists who gave unpleasent feedback regarding the water quality.
Council decided that something had to be done to improve the water quality – not only to provide a reason for tourists to visit, but possibly more importantly not to give them a reason to leave prematurely.
On-site Assessment
A novel approach was developed based on an extensive on-site assessment of process options along with the aim to make maximum use of the assets Council had already purchased. A process utilising mechanical and chemical oxidation followed by coagulation and direct filtration via a dual media filter arrangement and sodium hypochlorite disinfection was selected.
Pilot plant testing of different filter media configurations was promising – so much so that water samples from the pilot plant entered into the Queensland Water Directorate–Orica Water Taste Test not only won the best water in the north-west, but also the best-tasting water in all of Queensland – an achievement that set the bar high for expectations when the full-scale plant was delivered.
Detailed design started in July 2014 and construction commenced in September. The project team consisted of Richmond Shire Council as Superintendent, Aeramix (civil, process, mechanical and hydraulic design construction and integration), Queensland Engineering and Electrical (electrical design and PLC programming), Golden Run Contracting (anything and everything!), EA Martin and Sons (electrical installation), Tank Industries and Richmond Shire plumbing staff and roads crew.
The second-hand skids that Council had purchased from Melbourne Water were demounted and all mechanical equipment assessed and tested to ensure the now five-year-old equipment was in working order and would be fit for re-use.
Having the opportunity to assist with the testing of equipment, demounting of skids and development of the process was an eye opener. For an outback plumber, soon-to-be WTP operator, this was highly advantageous when it came time to learn the operation of the plant. It was also a great learning experience understanding the challenges faced when coordinating such a project, which comprised political, community, logistic and contractor management issues.
Key Activities
Key activities that our Council team were involved in were as follows:• Assistance with set-up and running
of pilot tests assessing aeration nozzles and critical process components;
• Dismantling of skids;• Review of process layout and selection
of preferred options;
• Design review and participation in risk review workshops and identification of failure contingencies such as bypasses of various process;
• Pressure testing filter vessels (three failed!);
• Construction of a 2km pipeline from Bore 6 to Bore 5 where the WTP would be situated;
• Site preparation and earthworks for the construction of a 1.5ML clear water tank;
• Installation of pipework and valves;• Review of PLC/Citect interfaces (which
I didn’t really understand but am now quite confident in);
• Community liaison – public meetings and general promotion and awareness tasks;
• Commissioning;• Operation.
Procedures for testing of equipment were developed. This was time consuming, but in the end a worthwhile activity as multiple failures of equipment were identified along the way, which would have caused havoc in commissioning had they not been identified prior to installation.
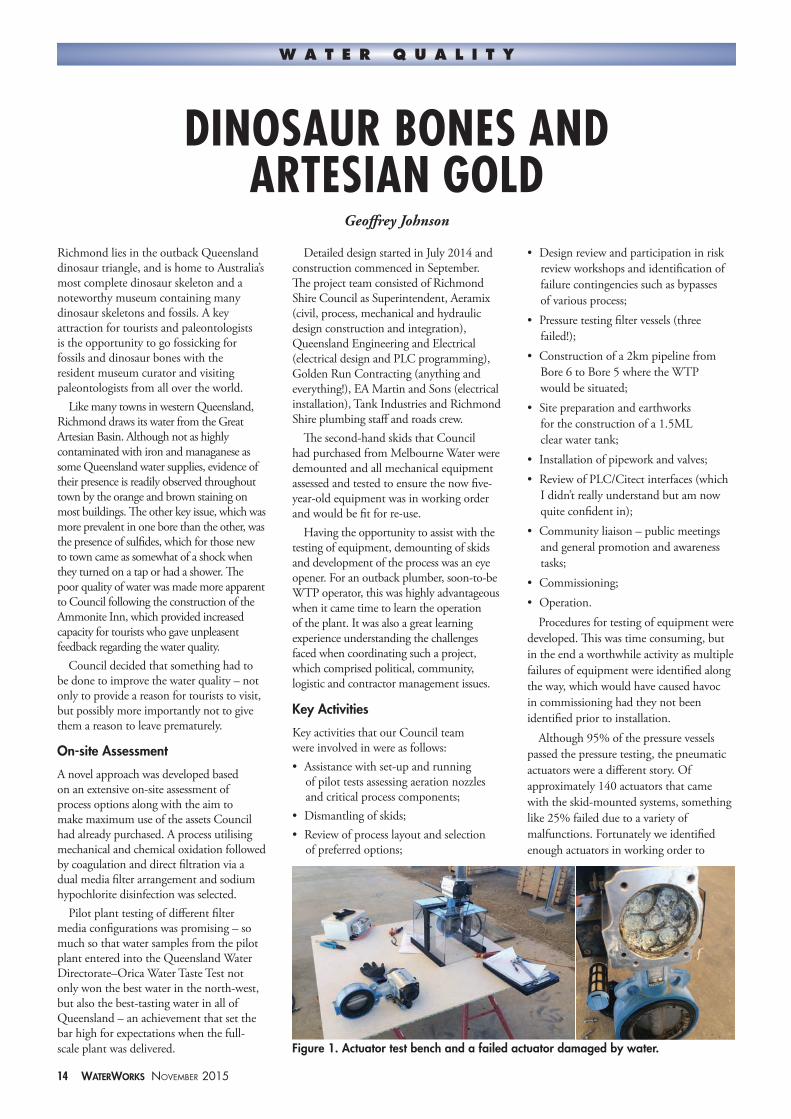
Although 95% of the pressure vessels passed the pressure testing, the pneumatic actuators were a different story. Of approximately 140 actuators that came with the skid-mounted systems, something like 25% failed due to a variety of malfunctions. Fortunately we identified enough actuators in working order to
W a t e r Q u a l i t y
Figure 1. Actuator test bench and a failed actuator damaged by water.
WaterWorks November 2015 15
satisfy the design requirements of the plant, and so far there have been no failures.
The detailed design and 3D drawings looked promising and the reconfigured components were arranged to fit an existing slab. Although the initial design only had two trains of six filters, Council had additional vessels they were keen to utilise, so a revision produced a design with three trains of five filters with three flocculation tanks each. This also provided redundancy and capacity to maintain supply during planned or corrective maintenance.
Construction proceeded well, with some short “outback” delays. Equipment was delivered to the wrong Richmond on a couple of occasions and any oversights in requirements were compounded by our remote location and some inconsistencies in transport company routine runs to Richmond. Sometimes items would arrive in Townsville, then sit there for a week or more awaiting the next run to Richmond. There were also delays with the upgrade to the power supply required to run the plant. With the initial aim to deliver the plant before Christmas, the new power supply was not installed until mid-December, postponing any early commissioning.
As with all new designs and installations we had some teething problems. Also our time on site was sometimes limited as we all had our ‘normal’ jobs to do, but we got there in the end.
Early data from the plant is shown in Table 1. The improvement in water quality has been so great that restaurants in town are now serving tap water at the table rather than bottled water, which was used previously.
Equipment Failures
Unfortunately things haven’t always gone to plan. The curse of second-hand componentry has led to some minor equipment failures, but although they are only minor components they had some significant impacts on process performance.
The separator feed pump has failed a number of times, ultimately requiring replacement. This led to filters backing up for backwash, but with capacity only available to backwash one filter train every 12 hours or so, we have had occasions where filters have been locked out of backwash and operation due to high-level alarms in the backwash holding tank. These physical failures also highlighted some need for change in the process control logic.
While we managed to maintain supply, we have had one incident where iron and manganese breakthrough was observed and subsequent turbidity to town reached as high as 0.6 NTU, the pure clean water the town was getting used to being replaced with the metallic taste of the past. It was amazing how quickly we adapted to the improved quality and, once we’d had it,
how noticable it became when it returned to similar quality to before.
Another issue has been an irregular power supply. Although the plant has a generator that will start within 30 seconds of a power failure and maintain operation of the plant, we have experienced regular alarms and, on a couple of occasions, failure of the town pressure pumps due to over-voltage/undervoltage power issues.
When the plant was connected to the town supply it was amazing. Within three days we were near crisis point, with town consumption going through the roof. Although the plant has capacity to produce an additional 50 per cent supply to historic demand, this historic demand was somewhat dictated by the way the previous system operated. When demand went up, pressure generally went down as the bores had a limited supply capacity.
However, once the town was being fed by a constant pressure pump set that was not limited in volume of supply due to the integration of the clear water storage tank, town flows exceeded all historic records, peaking at around 63 L/s. Historically, this flow rate could never be achieved because the bore’s supply systems max out at 39L/sec. A town meeting was organised to inform the residents that if they continued to use water in such a fashion they would ultimately run out. With the improved pressure, sprinklers that used to trickle a steady flow to water a lawn were now spraying twice as high and wide, so watering time either needed to be slashed or the taps throttled back to reduce flow.
Council also took the initiative to implement water restrictions. Once formalised these had an immediate impact, with average daytime flow rates of 20–30 L/s suddenly dropping to 8–12 L/s – a commendable community response that avoided the need for alternative controls.
The Author
Geoffrey Johnson ([email protected]) is head plumber and WTP operator with Richmond Shire Council in Queensland.
W a t e r Q u a l i t y
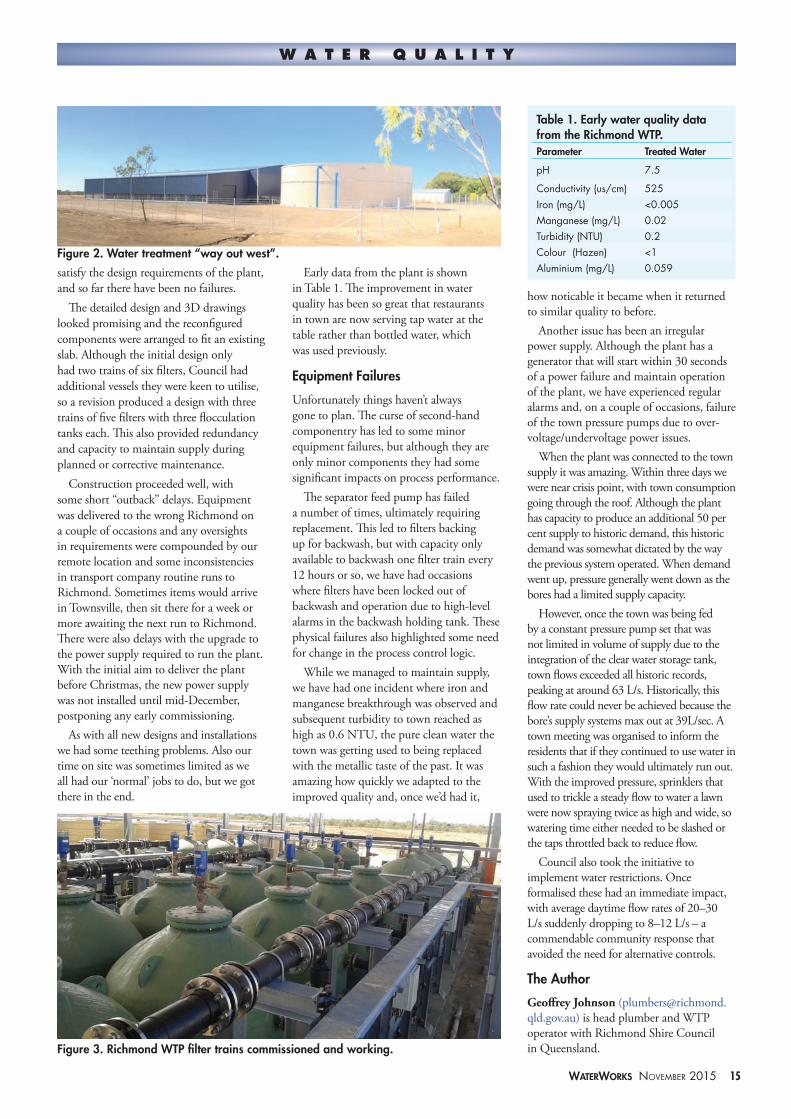
Figure 2. Water treatment “way out west”.
Table 1. Early water quality data from the Richmond WTP.Parameter Treated Water
pH 7.5
Conductivity (us/cm) 525Iron (mg/L) <0.005Manganese (mg/L) 0.02Turbidity (NTU) 0.2Colour (Hazen) <1Aluminium (mg/L) 0.059
Figure 3. Richmond WTP filter trains commissioned and working.
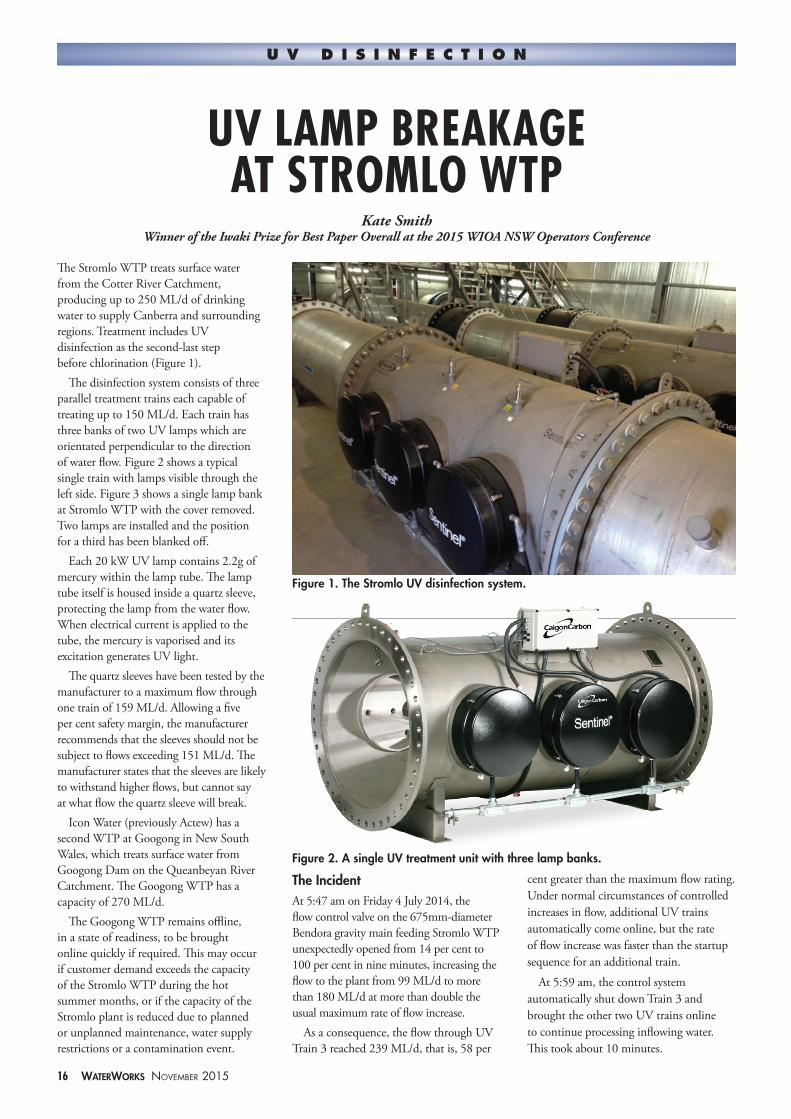
The Stromlo WTP treats surface water from the Cotter River Catchment, producing up to 250 ML/d of drinking water to supply Canberra and surrounding regions. Treatment includes UV disinfection as the second-last step before chlorination (Figure 1).
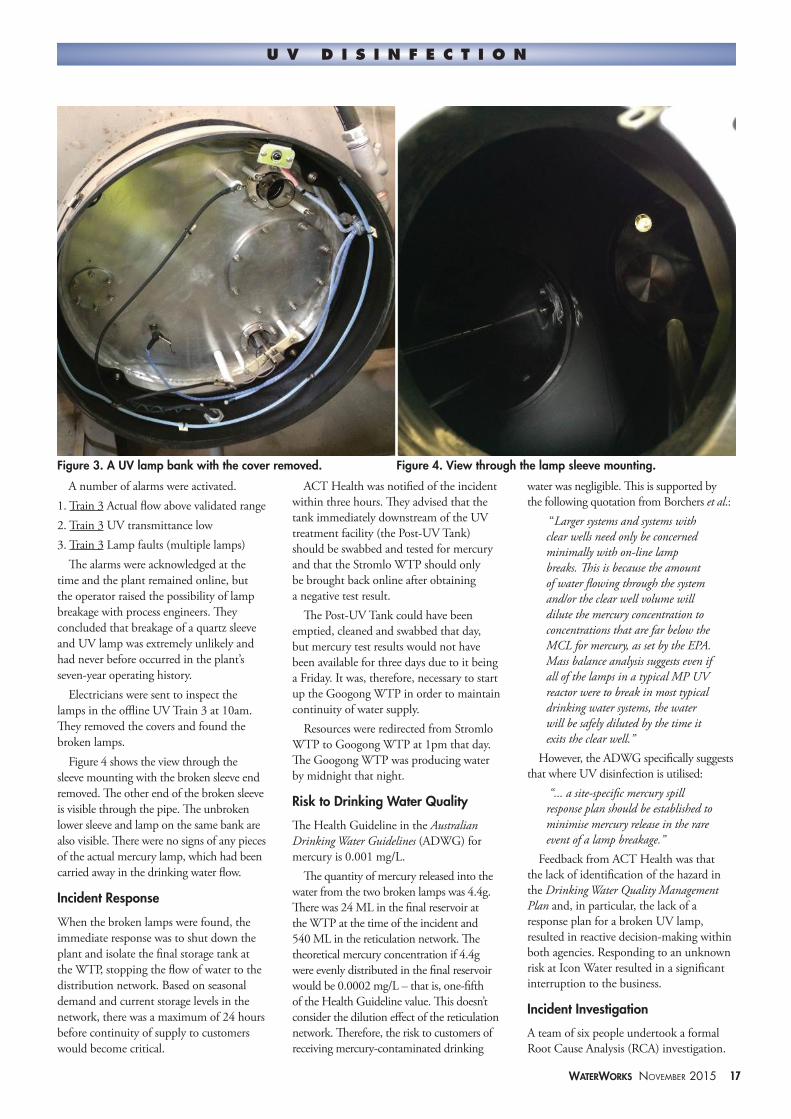
The disinfection system consists of three parallel treatment trains each capable of treating up to 150 ML/d. Each train has three banks of two UV lamps which are orientated perpendicular to the direction of water flow. Figure 2 shows a typical single train with lamps visible through the left side. Figure 3 shows a single lamp bank at Stromlo WTP with the cover removed. Two lamps are installed and the position for a third has been blanked off.
Each 20 kW UV lamp contains 2.2g of mercury within the lamp tube. The lamp tube itself is housed inside a quartz sleeve, protecting the lamp from the water flow. When electrical current is applied to the tube, the mercury is vaporised and its excitation generates UV light.
The quartz sleeves have been tested by the manufacturer to a maximum flow through one train of 159 ML/d. Allowing a five per cent safety margin, the manufacturer recommends that the sleeves should not be subject to flows exceeding 151 ML/d. The manufacturer states that the sleeves are likely to withstand higher flows, but cannot say at what flow the quartz sleeve will break.
Icon Water (previously Actew) has a second WTP at Googong in New South Wales, which treats surface water from Googong Dam on the Queanbeyan River Catchment. The Googong WTP has a capacity of 270 ML/d.
The Googong WTP remains offline, in a state of readiness, to be brought online quickly if required. This may occur if customer demand exceeds the capacity of the Stromlo WTP during the hot summer months, or if the capacity of the Stromlo plant is reduced due to planned or unplanned maintenance, water supply restrictions or a contamination event.
The IncidentAt 5:47 am on Friday 4 July 2014, the flow control valve on the 675mm-diameter Bendora gravity main feeding Stromlo WTP unexpectedly opened from 14 per cent to 100 per cent in nine minutes, increasing the flow to the plant from 99 ML/d to more than 180 ML/d at more than double the usual maximum rate of flow increase.
As a consequence, the flow through UV Train 3 reached 239 ML/d, that is, 58 per
cent greater than the maximum flow rating. Under normal circumstances of controlled increases in flow, additional UV trains automatically come online, but the rate of flow increase was faster than the startup sequence for an additional train.
At 5:59 am, the control system automatically shut down Train 3 and brought the other two UV trains online to continue processing inflowing water. This took about 10 minutes.
UV Lamp Breakage aT STromLo WTp
Kate Smith Winner of the Iwaki Prize for Best Paper Overall at the 2015 WIOA NSW Operators Conference
U V D i s i n f e c t i o n
Figure 1. The Stromlo UV disinfection system.
Figure 2. A single UV treatment unit with three lamp banks.
16 WaterWorks November 2015
WaterWorks November 2015 17
A number of alarms were activated.1. Train 3 Actual flow above validated range 2. Train 3 UV transmittance low3. Train 3 Lamp faults (multiple lamps)
The alarms were acknowledged at the time and the plant remained online, but the operator raised the possibility of lamp breakage with process engineers. They concluded that breakage of a quartz sleeve and UV lamp was extremely unlikely and had never before occurred in the plant’s seven-year operating history.
Electricians were sent to inspect the lamps in the offline UV Train 3 at 10am. They removed the covers and found the broken lamps.
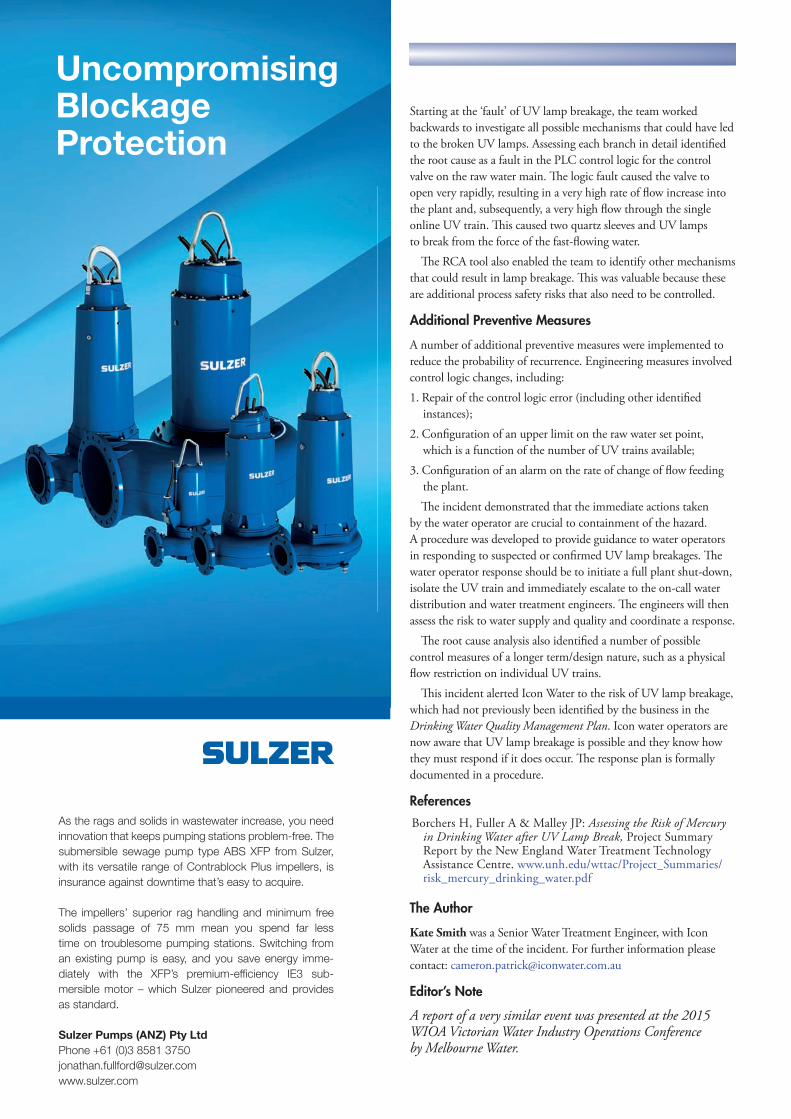
Figure 4 shows the view through the sleeve mounting with the broken sleeve end removed. The other end of the broken sleeve is visible through the pipe. The unbroken lower sleeve and lamp on the same bank are also visible. There were no signs of any pieces of the actual mercury lamp, which had been carried away in the drinking water flow.
Incident Response
When the broken lamps were found, the immediate response was to shut down the plant and isolate the final storage tank at the WTP, stopping the flow of water to the distribution network. Based on seasonal demand and current storage levels in the network, there was a maximum of 24 hours before continuity of supply to customers would become critical.
ACT Health was notified of the incident within three hours. They advised that the tank immediately downstream of the UV treatment facility (the Post-UV Tank) should be swabbed and tested for mercury and that the Stromlo WTP should only be brought back online after obtaining a negative test result.
The Post-UV Tank could have been emptied, cleaned and swabbed that day, but mercury test results would not have been available for three days due to it being a Friday. It was, therefore, necessary to start up the Googong WTP in order to maintain continuity of water supply.
Resources were redirected from Stromlo WTP to Googong WTP at 1pm that day. The Googong WTP was producing water by midnight that night.
Risk to Drinking Water Quality
The Health Guideline in the Australian Drinking Water Guidelines (ADWG) for mercury is 0.001 mg/L.
The quantity of mercury released into the water from the two broken lamps was 4.4g. There was 24 ML in the final reservoir at the WTP at the time of the incident and 540 ML in the reticulation network. The theoretical mercury concentration if 4.4g were evenly distributed in the final reservoir would be 0.0002 mg/L – that is, one-fifth of the Health Guideline value. This doesn’t consider the dilution effect of the reticulation network. Therefore, the risk to customers of receiving mercury-contaminated drinking
water was negligible. This is supported by the following quotation from Borchers et al.:
“Larger systems and systems with clear wells need only be concerned minimally with on-line lamp breaks. This is because the amount of water flowing through the system and/or the clear well volume will dilute the mercury concentration to concentrations that are far below the MCL for mercury, as set by the EPA. Mass balance analysis suggests even if all of the lamps in a typical MP UV reactor were to break in most typical drinking water systems, the water will be safely diluted by the time it exits the clear well.”
However, the ADWG specifically suggests that where UV disinfection is utilised:
“... a site-specific mercury spill response plan should be established to minimise mercury release in the rare event of a lamp breakage.”
Feedback from ACT Health was that the lack of identification of the hazard in the Drinking Water Quality Management Plan and, in particular, the lack of a response plan for a broken UV lamp, resulted in reactive decision-making within both agencies. Responding to an unknown risk at Icon Water resulted in a significant interruption to the business.
Incident Investigation
A team of six people undertook a formal Root Cause Analysis (RCA) investigation.
U V D i s i n f e c t i o n
Figure 3. A UV lamp bank with the cover removed. Figure 4. View through the lamp sleeve mounting.
18 WaterWorks mAY 2015
Starting at the ‘fault’ of UV lamp breakage, the team worked backwards to investigate all possible mechanisms that could have led to the broken UV lamps. Assessing each branch in detail identifi ed the root cause as a fault in the PLC control logic for the control valve on the raw water main. Th e logic fault caused the valve to open very rapidly, resulting in a very high rate of fl ow increase into the plant and, subsequently, a very high fl ow through the single online UV train. Th is caused two quartz sleeves and UV lamps to break from the force of the fast-fl owing water.
Th e RCA tool also enabled the team to identify other mechanisms that could result in lamp breakage. Th is was valuable because these are additional process safety risks that also need to be controlled.
Additional Preventive Measures
A number of additional preventive measures were implemented to reduce the probability of recurrence. Engineering measures involved control logic changes, including:1. Repair of the control logic error (including other identifi ed
instances);2. Confi guration of an upper limit on the raw water set point,
which is a function of the number of UV trains available;3. Confi guration of an alarm on the rate of change of fl ow feeding
the plant.Th e incident demonstrated that the immediate actions taken
by the water operator are crucial to containment of the hazard. A procedure was developed to provide guidance to water operators in responding to suspected or confi rmed UV lamp breakages. Th e water operator response should be to initiate a full plant shut-down, isolate the UV train and immediately escalate to the on-call water distribution and water treatment engineers. Th e engineers will then assess the risk to water supply and quality and coordinate a response.
Th e root cause analysis also identifi ed a number of possible control measures of a longer term/design nature, such as a physical fl ow restriction on individual UV trains.
Th is incident alerted Icon Water to the risk of UV lamp breakage, which had not previously been identifi ed by the business in the Drinking Water Quality Management Plan. Icon water operators are now aware that UV lamp breakage is possible and they know how they must respond if it does occur. Th e response plan is formally documented in a procedure.
ReferencesBorchers H, Fuller A & Malley JP: Assessing the Risk of Mercury
in Drinking Water after UV Lamp Break, Project Summary Report by the New England Water Treatment Technology Assistance Centre. www.unh.edu/wttac/Project_Summaries/risk_mercury_drinking_water.pdf
The Author
Kate Smith was a Senior Water Treatment Engineer, with Icon Water at the time of the incident. For further information please contact: [email protected]
Editor’s Note
A report of a very similar event was presented at the 2015 WIOA Victorian Water Industry Operations Conference by Melbourne Water.
Uncompromising Blockage Protection
As the rags and solids in wastewater increase, you need innovation that keeps pumping stations problem-free. The submersible sewage pump type ABS XFP from Sulzer, with its versatile range of Contrablock Plus impellers, is insurance against downtime that’s easy to acquire.
The impellers’ superior rag handling and minimum free solids passage of 75 mm mean you spend far less time on troublesome pumping stations. Switching from an existing pump is easy, and you save energy imme-diately with the XFP’s premium-efficiency IE3 sub-mersible motor – which Sulzer pioneered and provides as standard.
Sulzer Pumps (ANZ) Pty LtdPhone +61 (0)3 8581 3750 [email protected]
WaterWorks November 2015 19
The call came through in early September 2014 during a stop-off transit flight: “Fitzy, are you prepared for a challenge? There’s a community in the Gulf that needs our help”. I detected an element of excitement in my colleague’s voice, but would never have believed the challenges and learnings that were to develop from this one brief call.
Georgetown is a small community in Far North Queensland boasting a population of approximately 250 residents. The town’s main industries are cattle, tourism and, traditionally, gold. It is situated between Cairns and Normanton and is home to the Etheridge Shire Council.
In 2014, Georgetown had been experiencing unprecedented iron and manganese concentrations in its potable water supply, persisting longer than any previous event. Some believe this may have been a consequence of a string of failed consecutive wet seasons.
The town’s water supply is via three shallow wells in the riverbed of the Etheridge River. The river is characterised by a predominantly dry river bed, low turbidity and higher metal concentration in the dry season, then a flooded bank-to-bank river with high turbidity and low metal concentrations in the wet season. The water is pumped from the wells at a flow rate of between 4.0–14.0 L/s, depending on demand, and was traditionally just dosed with sodium hypochlorite for disinfection purposes. No other treatment was in place. The variation in the raw water is highlighted in Table 1.
Table 1. Georgetown raw water quality.
Parameter Range
Turbidity (NTU) 1.0 – >25
Mn (total) (mg/L) 0.01 - 1.5
Fe (total) (mg/L) <0.05 - >2.8
pH 6.5 - 7.1
Temperature (°C) 25 - 29
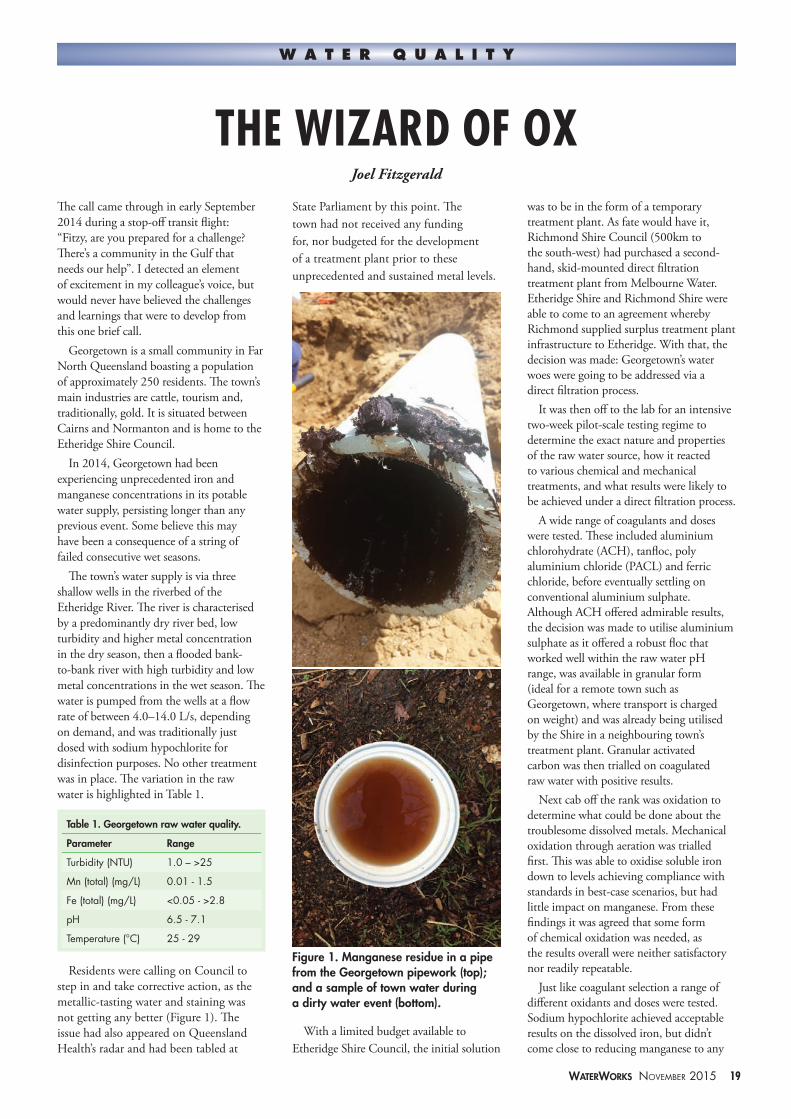
Residents were calling on Council to step in and take corrective action, as the metallic-tasting water and staining was not getting any better (Figure 1). The issue had also appeared on Queensland Health’s radar and had been tabled at
State Parliament by this point. The town had not received any funding for, nor budgeted for the development of a treatment plant prior to these unprecedented and sustained metal levels.
With a limited budget available to Etheridge Shire Council, the initial solution
was to be in the form of a temporary treatment plant. As fate would have it, Richmond Shire Council (500km to the south-west) had purchased a second-hand, skid-mounted direct filtration treatment plant from Melbourne Water. Etheridge Shire and Richmond Shire were able to come to an agreement whereby Richmond supplied surplus treatment plant infrastructure to Etheridge. With that, the decision was made: Georgetown’s water woes were going to be addressed via a direct filtration process.
It was then off to the lab for an intensive two-week pilot-scale testing regime to determine the exact nature and properties of the raw water source, how it reacted to various chemical and mechanical treatments, and what results were likely to be achieved under a direct filtration process.
A wide range of coagulants and doses were tested. These included aluminium chlorohydrate (ACH), tanfloc, poly aluminium chloride (PACL) and ferric chloride, before eventually settling on conventional aluminium sulphate. Although ACH offered admirable results, the decision was made to utilise aluminium sulphate as it offered a robust floc that worked well within the raw water pH range, was available in granular form (ideal for a remote town such as Georgetown, where transport is charged on weight) and was already being utilised by the Shire in a neighbouring town’s treatment plant. Granular activated carbon was then trialled on coagulated raw water with positive results.
Next cab off the rank was oxidation to determine what could be done about the troublesome dissolved metals. Mechanical oxidation through aeration was trialled first. This was able to oxidise soluble iron down to levels achieving compliance with standards in best-case scenarios, but had little impact on manganese. From these findings it was agreed that some form of chemical oxidation was needed, as the results overall were neither satisfactory nor readily repeatable.
Just like coagulant selection a range of different oxidants and doses were tested. Sodium hypochlorite achieved acceptable results on the dissolved iron, but didn’t come close to reducing manganese to any
THE WIZARD OF OXJoel Fitzgerald
W a t e r Q u a l i t y
Figure 1. Manganese residue in a pipe from the Georgetown pipework (top); and a sample of town water during a dirty water event (bottom).
20 WaterWorks November 2015
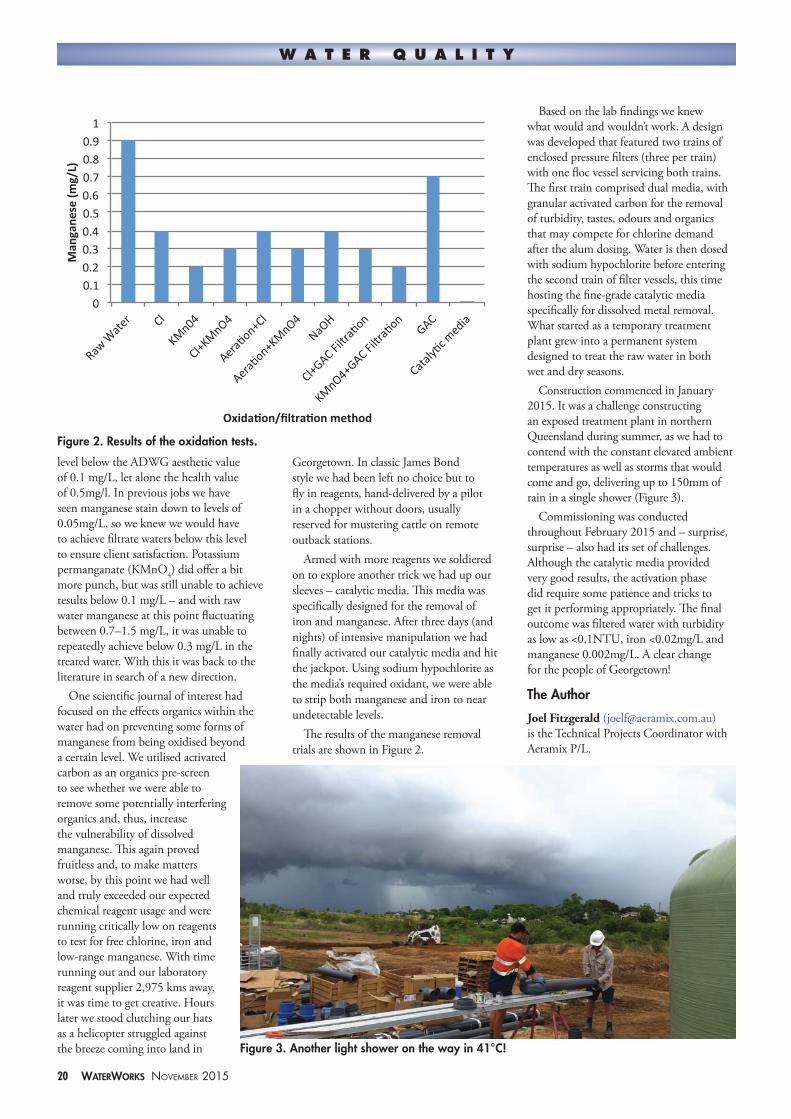
level below the ADWG aesthetic value of 0.1 mg/L, let alone the health value of 0.5mg/l. In previous jobs we have seen manganese stain down to levels of 0.05mg/L, so we knew we would have to achieve filtrate waters below this level to ensure client satisfaction. Potassium permanganate (KMnO4) did offer a bit more punch, but was still unable to achieve results below 0.1 mg/L – and with raw water manganese at this point fluctuating between 0.7–1.5 mg/L, it was unable to repeatedly achieve below 0.3 mg/L in the treated water. With this it was back to the literature in search of a new direction.
One scientific journal of interest had focused on the effects organics within the water had on preventing some forms of manganese from being oxidised beyond a certain level. We utilised activated carbon as an organics pre-screen to see whether we were able to remove some potentially interfering organics and, thus, increase the vulnerability of dissolved manganese. This again proved fruitless and, to make matters worse, by this point we had well and truly exceeded our expected chemical reagent usage and were running critically low on reagents to test for free chlorine, iron and low-range manganese. With time running out and our laboratory reagent supplier 2,975 kms away, it was time to get creative. Hours later we stood clutching our hats as a helicopter struggled against the breeze coming into land in
Georgetown. In classic James Bond style we had been left no choice but to fly in reagents, hand-delivered by a pilot in a chopper without doors, usually reserved for mustering cattle on remote outback stations.
Armed with more reagents we soldiered on to explore another trick we had up our sleeves – catalytic media. This media was specifically designed for the removal of iron and manganese. After three days (and nights) of intensive manipulation we had finally activated our catalytic media and hit the jackpot. Using sodium hypochlorite as the media’s required oxidant, we were able to strip both manganese and iron to near undetectable levels.
The results of the manganese removal trials are shown in Figure 2.
Based on the lab findings we knew what would and wouldn’t work. A design was developed that featured two trains of enclosed pressure filters (three per train) with one floc vessel servicing both trains. The first train comprised dual media, with granular activated carbon for the removal of turbidity, tastes, odours and organics that may compete for chlorine demand after the alum dosing. Water is then dosed with sodium hypochlorite before entering the second train of filter vessels, this time hosting the fine-grade catalytic media specifically for dissolved metal removal. What started as a temporary treatment plant grew into a permanent system designed to treat the raw water in both wet and dry seasons.
Construction commenced in January 2015. It was a challenge constructing an exposed treatment plant in northern Queensland during summer, as we had to contend with the constant elevated ambient temperatures as well as storms that would come and go, delivering up to 150mm of rain in a single shower (Figure 3).
Commissioning was conducted throughout February 2015 and – surprise, surprise – also had its set of challenges. Although the catalytic media provided very good results, the activation phase did require some patience and tricks to get it performing appropriately. The final outcome was filtered water with turbidity as low as <0.1NTU, iron <0.02mg/L and manganese 0.002mg/L. A clear change for the people of Georgetown!
The Author
Joel Fitzgerald ([email protected]) is the Technical Projects Coordinator with Aeramix P/L.
W a t e r Q u a l i t y
Figure 2. Results of the oxidation tests.
Figure 3. Another light shower on the way in 41°C!
WaterWorks November 2015 21
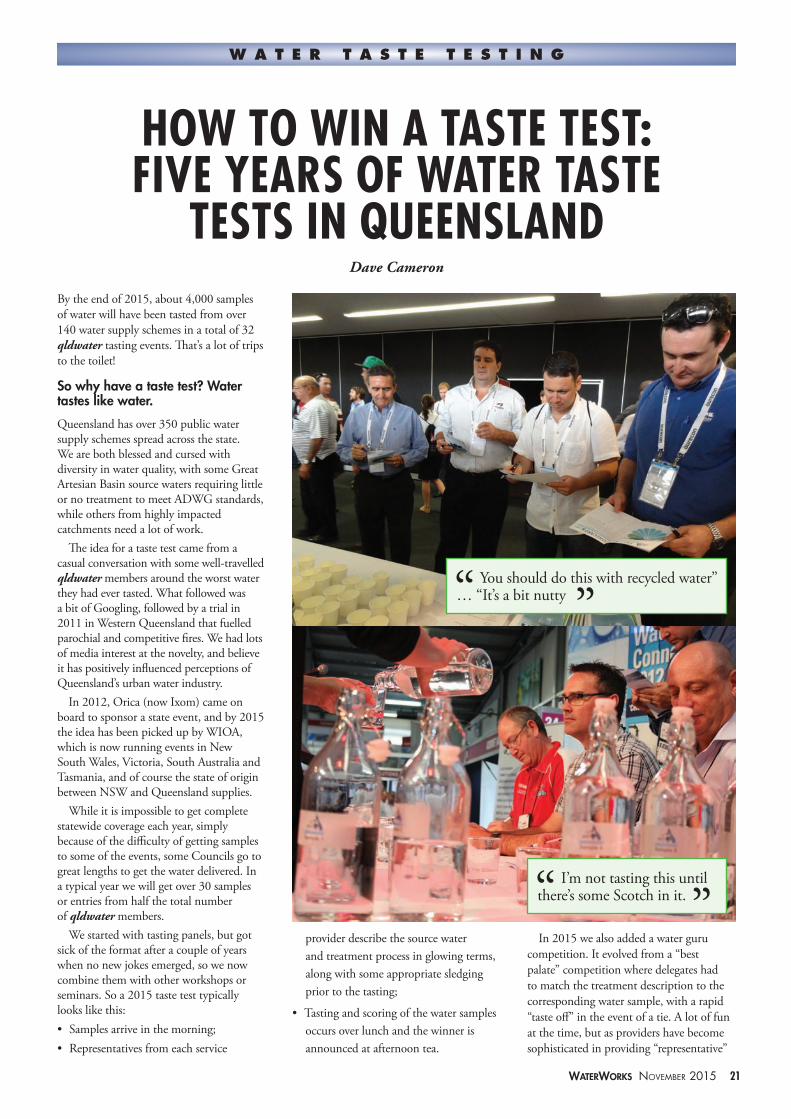
By the end of 2015, about 4,000 samples of water will have been tasted from over 140 water supply schemes in a total of 32 qldwater tasting events. That’s a lot of trips to the toilet!
So why have a taste test? Water tastes like water.
Queensland has over 350 public water supply schemes spread across the state. We are both blessed and cursed with diversity in water quality, with some Great Artesian Basin source waters requiring little or no treatment to meet ADWG standards, while others from highly impacted catchments need a lot of work.
The idea for a taste test came from a casual conversation with some well-travelled qldwater members around the worst water they had ever tasted. What followed was a bit of Googling, followed by a trial in 2011 in Western Queensland that fuelled parochial and competitive fires. We had lots of media interest at the novelty, and believe it has positively influenced perceptions of Queensland’s urban water industry.
In 2012, Orica (now Ixom) came on board to sponsor a state event, and by 2015 the idea has been picked up by WIOA, which is now running events in New South Wales, Victoria, South Australia and Tasmania, and of course the state of origin between NSW and Queensland supplies.
While it is impossible to get complete statewide coverage each year, simply because of the difficulty of getting samples to some of the events, some Councils go to great lengths to get the water delivered. In a typical year we will get over 30 samples or entries from half the total number of qldwater members.
We started with tasting panels, but got sick of the format after a couple of years when no new jokes emerged, so we now combine them with other workshops or seminars. So a 2015 taste test typically looks like this:• Samples arrive in the morning;• Representatives from each service
provider describe the source water and treatment process in glowing terms, along with some appropriate sledging prior to the tasting;
• Tasting and scoring of the water samples occurs over lunch and the winner is announced at afternoon tea.
In 2015 we also added a water guru competition. It evolved from a “best palate” competition where delegates had to match the treatment description to the corresponding water sample, with a rapid “taste off” in the event of a tie. A lot of fun at the time, but as providers have become sophisticated in providing “representative”
HOW TO WIN A TASTE TEST: FIVE YEARS OF WATER TASTE
TESTS IN QUEENSLANDDave Cameron
W a t e r t a s t e t e s t i n g
You should do this with recycled water” … “It’s a bit nutty
I’m not tasting this until there’s some Scotch in it.
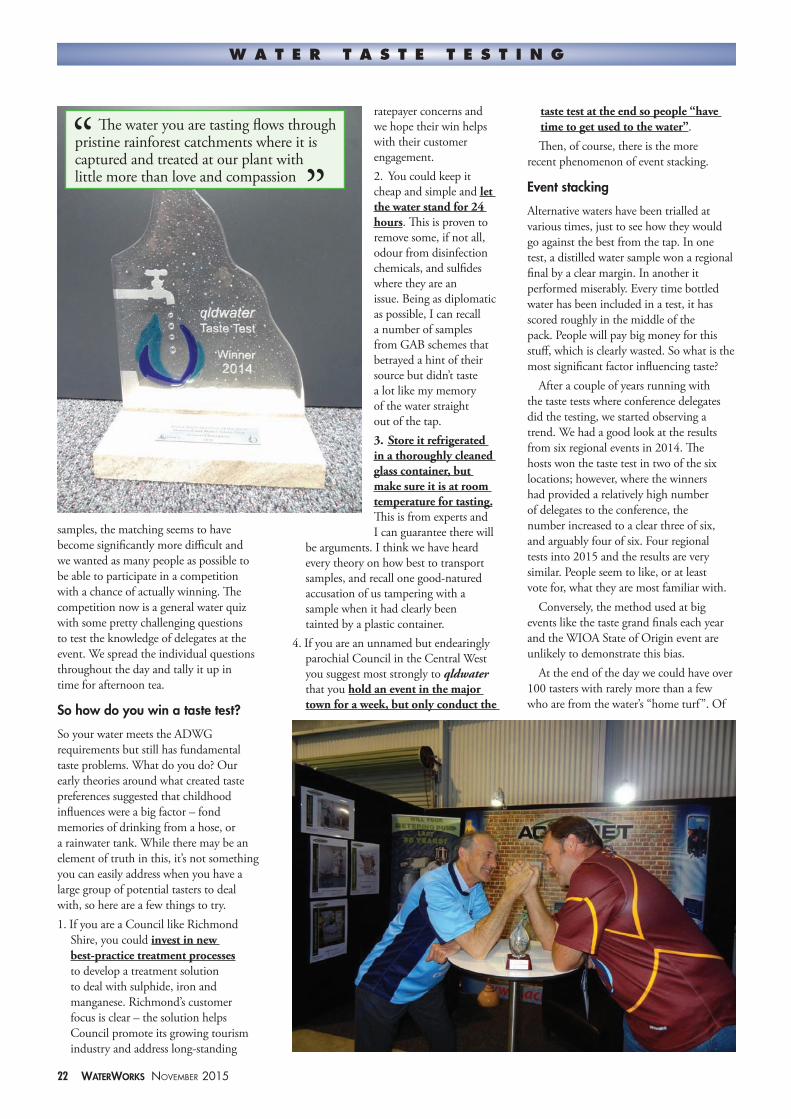
22 WaterWorks November 2015
samples, the matching seems to have become signifi cantly more diffi cult and we wanted as many people as possible to be able to participate in a competition with a chance of actually winning. Th e competition now is a general water quiz with some pretty challenging questions to test the knowledge of delegates at the event. We spread the individual questions throughout the day and tally it up in time for afternoon tea.
So how do you win a taste test?
So your water meets the ADWG requirements but still has fundamental taste problems. What do you do? Our early theories around what created taste preferences suggested that childhood infl uences were a big factor – fond memories of drinking from a hose, or a rainwater tank. While there may be an element of truth in this, it’s not something you can easily address when you have a large group of potential tasters to deal with, so here are a few things to try. 1. If you are a Council like Richmond
Shire, you could invest in new best-practice treatment processes to develop a treatment solution to deal with sulphide, iron and manganese. Richmond’s customer focus is clear – the solution helps Council promote its growing tourism industry and address long-standing
ratepayer concerns and we hope their win helps with their customer engagement.2. You could keep it cheap and simple and let the water stand for 24 hours. Th is is proven to remove some, if not all, odour from disinfection chemicals, and sulfi des where they are an issue. Being as diplomatic as possible, I can recall a number of samples from GAB schemes that betrayed a hint of their source but didn’t taste a lot like my memory of the water straight out of the tap.3. Store it refrigerated in a thoroughly cleaned glass container, but make sure it is at room temperature for tasting. Th is is from experts and I can guarantee there will
be arguments. I think we have heard every theory on how best to transport samples, and recall one good-natured accusation of us tampering with a sample when it had clearly been tainted by a plastic container.
4. If you are an unnamed but endearingly parochial Council in the Central West you suggest most strongly to qldwater that you hold an event in the major town for a week, but only conduct the
taste test at the end so people “have time to get used to the water”. Th en, of course, there is the more
recent phenomenon of event stacking.
Event stacking
Alternative waters have been trialled at various times, just to see how they would go against the best from the tap. In one test, a distilled water sample won a regional fi nal by a clear margin. In another it performed miserably. Every time bottled water has been included in a test, it has scored roughly in the middle of the pack. People will pay big money for this stuff , which is clearly wasted. So what is the most signifi cant factor infl uencing taste?
After a couple of years running with the taste tests where conference delegates did the testing, we started observing a trend. We had a good look at the results from six regional events in 2014. Th e hosts won the taste test in two of the six locations; however, where the winners had provided a relatively high number of delegates to the conference, the number increased to a clear three of six, and arguably four of six. Four regional tests into 2015 and the results are very similar. People seem to like, or at least vote for, what they are most familiar with.
Conversely, the method used at big events like the taste grand fi nals each year and the WIOA State of Origin event are unlikely to demonstrate this bias.
At the end of the day we could have over 100 tasters with rarely more than a few who are from the water’s “home turf”. Of
W a t e r t a s t e t e s t i n g
Th e water you are tasting fl ows through pristine rainforest catchments where it is captured and treated at our plant with little more than love and compassion
SELF CALIBRATING,SELF CLEANINGAND CONTINUOUS MONITORING
AluminiumManganeseBoronSodium
CuNH3NO2NO3PO4
NiCrCI2ZnF
FeSilicaSulphidePhenolCyanide
WaterWorks mAY 2015 23
course, if you believe our rhetoric to the conference delegates before the fi rst origin event at WIOA Gold Coast, there is another possibility. You have to imagine the ‘Roy and HG’ origin announcer: “It is your duty to not necessarily pick what you think tastes the best, but what tastes like Queensland.”
In short, we can’t claim a robust scientifi c method, but believe there is enough anecdotal evidence to suggest that sending as many people as you can to the event (especially qldwater regional events) is the most crucial success factor.
Conclusion
Th e most successful schemes in the history of the taste test include:• Richmond – regional, state and origin
wins;• Bundaberg (Lover’s Walk) – two regional
and one origin win;• Rockhampton (Glenmore) – two
regional fi nals and two statewide runners-up.Th ey diff er signifi cantly in source
water quality and treatment processes
and arguably refl ect extremes. While the Bundaberg scheme is blessed with high-quality source water that requires a simple and unique process, Rockhampton must be carefully treated due to variable seasonal source water quality. As detailed, Richmond’s Great Artesian Basin source water has major issues with both aesthetics and odour.
We can’t be sure whether the competition has driven any entrants to try to improve the taste of their water, but it is clear that many have gained professional pride and positive customer reactions from a strong result. We haven’t precisely mapped out the future of the competition but, as you can see, we’re prepared to give diff erent ideas a go. Drop us a line if you have a good one.
Having tasted all except a few of the samples across the fi ve years (and picking up those I’ve missed through other trips as part of the job), at the end of the day there seem to be a lot of subtle factors, infl uencing taste. Many champions have been beaten thanks to minor changes in treatment or seasonal source issues, and probably thanks to a few of the strategies outlined here.
However, when it comes to the crunch and you have 100 people at a major conference deciding on six of the best samples in the state, there is little you can do to beat the best.
The Author
Dave Cameron ([email protected]) is CEO of qldwater.
W a t e r t a s t e t e s t i n g
SELF CALIBRATING,SELF CLEANINGAND CONTINUOUS MONITORING
AluminiumManganeseBoronSodium
CuNH3NO2NO3PO4
NiCrCI2ZnF
FeSilicaSulphidePhenolCyanide
End of an Era
WaterWorks has been produced collaboratively between AWA and WIOA in the current format since 2001. Unfortunately, this is the last edition to be produced under the joint model. WIOA will continue to produce WaterWorks in the future, possibly in a modifi ed format. Any readers who would like to continue receiving the publication should consider joining WIOA as an individual member (currently $30 per year). Anyone interested in advertising or contributing articles for future editions should contact WIOA directly at [email protected].