Embed Size (px)
Citation preview
[Type here] [Type here] [Type here]
MALAYSIAN AVIATION COMMISSION ● JUNE 2020
KEY HIGHLIGHTS
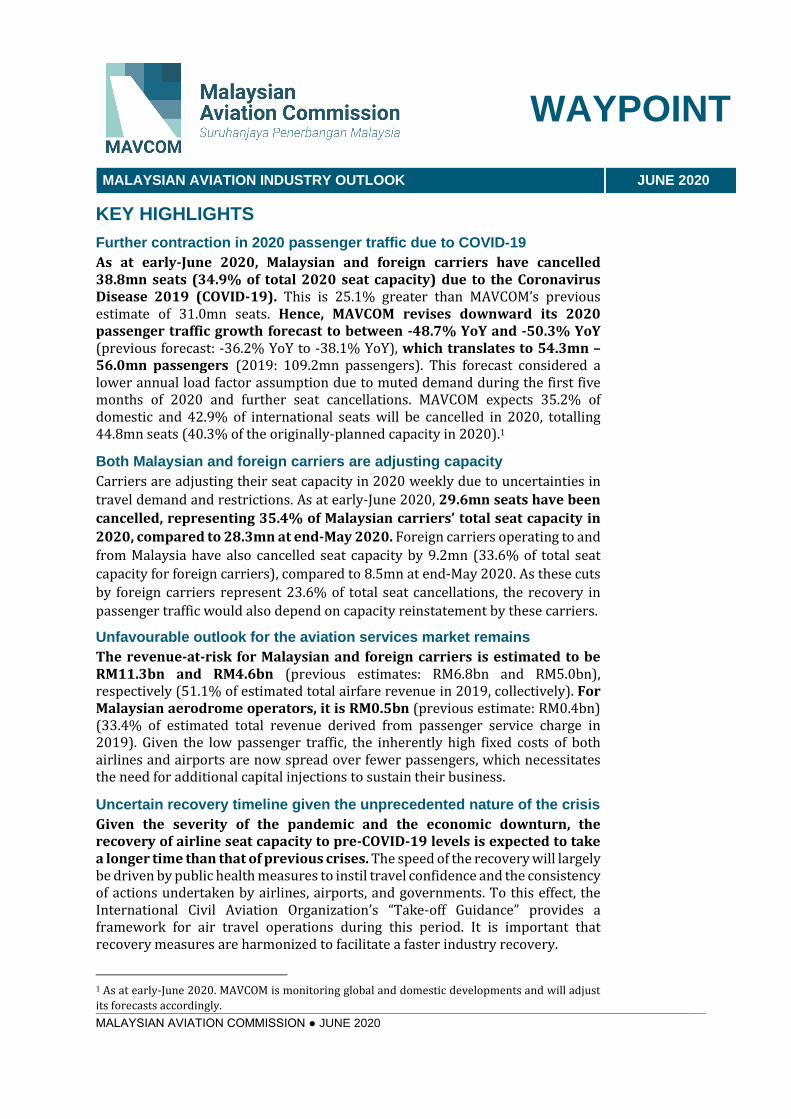
Further contraction in 2020 passenger traffic due to COVID-19
As at early-June 2020, Malaysian and foreign carriers have cancelled 38.8mn seats (34.9% of total 2020 seat capacity) due to the Coronavirus Disease 2019 (COVID-19). This is 25.1% greater than MAVCOM’s previous estimate of 31.0mn seats. Hence, MAVCOM revises downward its 2020 passenger traffic growth forecast to between -48.7% YoY and -50.3% YoY (previous forecast: -36.2% YoY to -38.1% YoY), which translates to 54.3mn – 56.0mn passengers (2019: 109.2mn passengers). This forecast considered a lower annual load factor assumption due to muted demand during the first five months of 2020 and further seat cancellations. MAVCOM expects 35.2% of domestic and 42.9% of international seats will be cancelled in 2020, totalling 44.8mn seats (40.3% of the originally-planned capacity in 2020).1
Both Malaysian and foreign carriers are adjusting capacity
Carriers are adjusting their seat capacity in 2020 weekly due to uncertainties in
travel demand and restrictions. As at early-June 2020, 29.6mn seats have been
cancelled, representing 35.4% of Malaysian carriers’ total seat capacity in
2020, compared to 28.3mn at end-May 2020. Foreign carriers operating to and
from Malaysia have also cancelled seat capacity by 9.2mn (33.6% of total seat
capacity for foreign carriers), compared to 8.5mn at end-May 2020. As these cuts
by foreign carriers represent 23.6% of total seat cancellations, the recovery in
passenger traffic would also depend on capacity reinstatement by these carriers.
Unfavourable outlook for the aviation services market remains
The revenue-at-risk for Malaysian and foreign carriers is estimated to be RM11.3bn and RM4.6bn (previous estimates: RM6.8bn and RM5.0bn), respectively (51.1% of estimated total airfare revenue in 2019, collectively). For Malaysian aerodrome operators, it is RM0.5bn (previous estimate: RM0.4bn) (33.4% of estimated total revenue derived from passenger service charge in 2019). Given the low passenger traffic, the inherently high fixed costs of both airlines and airports are now spread over fewer passengers, which necessitates the need for additional capital injections to sustain their business.
Uncertain recovery timeline given the unprecedented nature of the crisis
Given the severity of the pandemic and the economic downturn, the recovery of airline seat capacity to pre-COVID-19 levels is expected to take a longer time than that of previous crises. The speed of the recovery will largely be driven by public health measures to instil travel confidence and the consistency of actions undertaken by airlines, airports, and governments. To this effect, the International Civil Aviation Organization’s “Take-off Guidance” provides a framework for air travel operations during this period. It is important that recovery measures are harmonized to facilitate a faster industry recovery.
1 As at early-June 2020. MAVCOM is monitoring global and domestic developments and will adjust
its forecasts accordingly.
WAYPOINT
MALAYSIAN AVIATION INDUSTRY OUTLOOK JUNE 2020
WAYPOINT
MALAYSIAN AVIATION COMMISSION ● JUNE 2020 2
GLOSSARY OF SOURCES
Sources
AirportIS -
ASL Holders Licence holders of ASL issued by MAVCOM
AOL Holders Licence holders of AOL issued by MAVCOM
ASP Holders Licence holders of ASP issued by MAVCOM
Bloomberg -
BNM Bank Negara Malaysia
CargoIS -
DOS Department of Statistics, Malaysia
IATA International Air Transport Association
ICAO International Civil Aviation Organization
IMF International Monetary Fund
MAVCOM Malaysian Aviation Commission
MOF Ministry of Finance, Malaysia
MOTAC Ministry of Tourism, Arts and Culture, Malaysia
WAYPOINT
MALAYSIAN AVIATION COMMISSION ● JUNE 2020 3
TABLE OF ABBREVIATIONS
Abbreviations
Act 771 Malaysian Aviation Commission Act 2015
AOL Aerodrome Operating Licence
ASEAN Association of Southeast Asian Nations
ASA Air Services Agreement
ASK Available Seat Kilometres
ASL Air Service Licence
ASP Air Service Permit
ATR Air Traffic Rights
bbl barrel
bn billion
CAAM Civil Aviation Authority of Malaysia
CAAS Civil Aviation Authority of Singapore
CAGR Compound annual growth rate
COS Cargo-on-seat
COVID-19 Coronavirus Disease 2019
CTK Cargo Tonne Kilometre
EASA European Union Aviation Safety Agency
E&E Electrical and electronics
EIA US Energy Information Administration
EU European Union
FAA US Federal Aviation Administration
FDP Flight Duty Period
FTK Freight Tonne Kilometres
GDP Gross Domestic Product
GFC Global Financial Crisis
GHL Ground Handling Licence
GOM Government of Malaysia
H1N1 Influenza A H1N1
H5N1 Influenza A H5N1
H7N9 Influenza A H7N9
HHI Herfindahl-Hirschman Index
km kilometre
kg kilogram
lbs pound
MAG Malaysia Aviation Group
MAS Malaysia Airlines System
MCO Movement Control Order
MERS Middle East Respiratory Syndrome
mn million
OPEC Organization of the Petroleum Exporting Countries
WAYPOINT
MALAYSIAN AVIATION COMMISSION ● JUNE 2020 4
Abbreviations
P2C Passenger-to-cargo
ppt percentage point
PTK Passenger tonne kilometre
RHS right-hand side
RM Ringgit Malaysia
RPK Revenue Passenger Kilometre
SOP Standard Operating Procedure
UK United Kingdom of Great Britain and Northern Ireland
US United States of America
USD United States Dollar
YoY Year-on-Year
AIRPORT CODES
Airport Code
DPS Ngurah Rai International Airport, Indonesia (Bali)
KUL Kuala Lumpur International Airport
LHR London Heathrow, UK
PEN Penang International Airport
LICENCE AND PERMIT HOLDERS
Abbreviations AirAsia AirAsia Berhad
AirAsia X AirAsia X Berhad
Firefly FlyFirefly Sdn. Bhd.
MAB Malaysia Airlines Berhad
MABkargo MAB Kargo Sdn. Bhd.
Malindo Malindo Airways Sdn. Bhd.
MASwings MASwings Sdn. Bhd.
My Jet Xpress My Jet Xpress Airlines Sdn. Bhd.
Pos ACE Pos Asia Cargo Express Sdn. Bhd.
Raya Airways Raya Airways Sdn. Bhd.
WAYPOINT
MALAYSIAN AVIATION COMMISSION ● JUNE 2020 5
CONTENTS
KEY HIGHLIGHTS ................................................................................................................ 1
Glossary of Sources ............................................................................................................ 2
Table of Abbreviations ..................................................................................................... 3
Airport Codes ....................................................................................................................... 4
Licence and Permit Holders ............................................................................................ 4
List of Figures ....................................................................................................................... 7
List of Tables ........................................................................................................................ 8
SECTION 1: MACROECONOMIC OVERVIEW AND OUTLOOK ................................. 9
Slowdowns in the Global and Malaysian Economies in 2020 ........................ 9
SECTION 2: INDUSTRY OVERVIEW AND OUTLOOK ............................................. 10
Industry Overview ...................................................................................................... 10
Tourist Arrivals Grew Marginally in 2019 ................................................................. 10
Ringgit Expected to Depreciate and Oil Prices Will be Lower in 2020 .......... 11
Malaysia’s Passenger Traffic Contracted by 27.5% YoY in 1Q20 ..................... 12
Industry Outlook ......................................................................................................... 13
COVID-19 Will Inflict Severe Damage on the Aviation Industry ...................... 13
Passenger Traffic Growth in the Asia Pacific is Expected to Contract by 53.8%
YoY ............................................................................................................................................. 14
Malaysia’s Passenger Traffic to Contract by 48.7% YoY – 50.3% YoY in 2020
..................................................................................................................................................... 14
The Revenue-at-Risk for Malaysian Air Service Licence and Aerodrome
Operating Licence Holders is Estimated at RM11.8bn ......................................... 18
New Norms and Uncertainties for the Aviation Industry ................................... 18
Box 1: Restrictions on International Movement and Travel Bubbles ............ 19
A Slow Recovery to Pre-COVID-19 Levels ................................................................. 21
SECTION 3: INDUSTRY STRUCTURE AND PERFORMANCE ................................ 22
Scheduled Passenger Services Market ................................................................ 22
Reduction of Market Shares for Malindo, AirAsia X, and Firefly in 1Q20 ..... 22
Market Concentration Increased in 1Q20, Average Load Factor Dipped Below
70.0% ........................................................................................................................................ 23
Malaysian Carriers’ Average Load Factor Dipped Below 70.0% and Average
Fare Increased in 1Q20...................................................................................................... 24
Air Traffic Rights Awarded by MAVCOM as of 31 December 2019 ........... 25
Malaysian Carriers Utilize 26 out of 106 Air Service Agreements ............ 25
SECTION 4: AIR CARGO OPERATIONS AND COVID-19 ........................................ 27
WAYPOINT
MALAYSIAN AVIATION COMMISSION ● JUNE 2020 6
Air Cargo Operations in Malaysia ......................................................................... 27
Air Service Licence or Air Service Permit is Required for Cargo Operations in
Malaysia ................................................................................................................................... 27
Malaysia’s Air Cargo Market is Growing Despite Connected to Fewer
Destinations ........................................................................................................................... 27
Increased Importance of Air Cargo During COVID-19 Pandemic .............. 29
Increased Freighter Operations Amid Loss in Belly Cargo Capacity .............. 29
Reconfigured Passenger Aircraft are Used for Air Cargo Operations ............ 31
Various Risks are Present in the Operations of Reconfigured Aircraft ......... 32
Regulations Have Been Evolving to Cope with the Current Environment ... 32
Air Cargo Business May Act as a Hedge against Low Passenger Volume 33
APPENDIX A: DATA TABLES ......................................................................................... 34
APPENDIX B: LIST OF LICENCE AND PERMIT HOLDERS..................................... 46
WAYPOINT
MALAYSIAN AVIATION COMMISSION ● JUNE 2020 7
List of Figures
Figure 1: Global and Malaysia’s GDP Growth, 2010 – 2020F .......................................... 9
Figure 2: Quarterly Malaysia’s Tourist Arrivals, 2017 – 2019 ..................................... 10
Figure 3: Oil, Jet Fuel, and Exchange Rate Trends, 2018 – 2020 ................................. 11
Figure 4: Quarterly Passenger Traffic Trend, 2018 – 2020 .......................................... 12
Figure 5: Quarterly Passenger Traffic Growth by Regions, 2017 – 2019 ................ 13
Figure 6: Seat Capacity Growth in Malaysia, 2005 – 2020 ............................................ 13
Figure 7: Total Seat Capacity in Malaysia, 2020 ................................................................ 15
Figure 8: Passenger Traffic (Base Case Scenario), 2012 – 2020F .............................. 17
Figure 9: Index of Major Events’ Impact on Global Seat Capacity, 2005 – 2020 .. 21
Figure 10: Percentage of Airlines’ Market Share by Passengers, 2018 – 2020 ..... 22
Figure 11: Market Concentration Level and Load Factor, 2018 – 2020 .................. 23
Figure 12: Malaysian Carriers’ Average Load Factor Trend, 2014 – 2020 ............. 24
Figure 13: Malaysian Carriers’ Average Fare Trend, 2014 – 2020 ............................ 24
Figure 14: Utilization of ASAs as at 31 December 2019 ................................................. 26
Figure 15: Total FTK by Malaysian Air Cargo Players, 2015 – 2019 ......................... 28
Figure 16: Total Trade Value by Mode of Transport, 2015 – 2019............................ 28
Figure 17: Total Cargo and Trade Value at KUL and PEN, 2015 – 2019 .................. 29
Figure 18: Available FTK in the Asia Pacific, 2019 – 2020 ............................................ 30
Figure 19: Scheduled Passenger and Full-Freight Operations in Malaysia, 2020 30
Figure 20: Total Revenue Tonne Kilometres Performed, 2015 – 2019 ................... 31
Figure 21: Outbound Air Cargo Rate from the Asia Pacific, 2020 .............................. 31
WAYPOINT
MALAYSIAN AVIATION COMMISSION ● JUNE 2020 8
List of Tables
Table 1: Passenger and Cargo Traffic Forecasts by IATA .............................................. 14
Table 2: Passenger Traffic Growth Forecast, 2020 ........................................................... 16
Table 3: Travel Restrictions by Selected Countries, May 2020 ................................... 19
Table 4: Measures Undertaken in the Aviation Industry ............................................... 20
Table 5: Breakdown of ATRs Awarded, 2018 – 2019 ...................................................... 25
Table 6: Details on Cargo Operations, May 2020 .............................................................. 27
Table 7: Risks for COS and P2C Operations ......................................................................... 32
WAYPOINT
MALAYSIAN AVIATION COMMISSION ● JUNE 2020 9
SECTION 1: MACROECONOMIC OVERVIEW AND
OUTLOOK
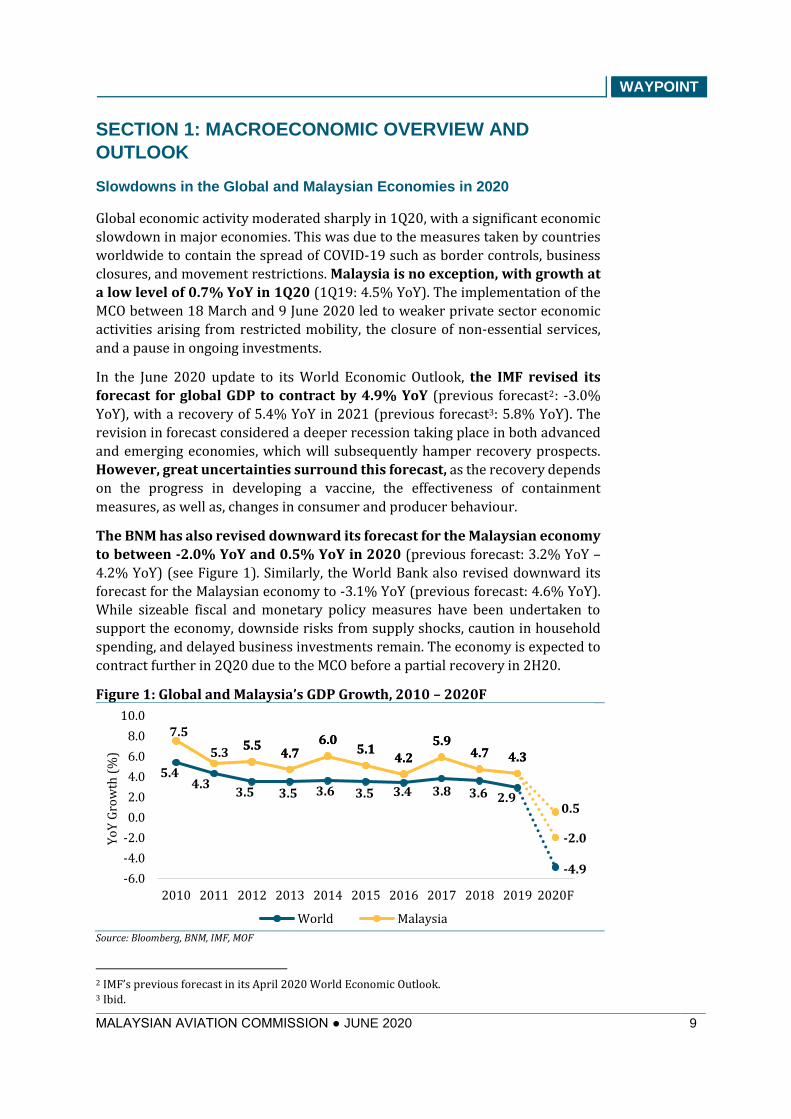
Slowdowns in the Global and Malaysian Economies in 2020
Global economic activity moderated sharply in 1Q20, with a significant economic
slowdown in major economies. This was due to the measures taken by countries
worldwide to contain the spread of COVID-19 such as border controls, business
closures, and movement restrictions. Malaysia is no exception, with growth at
a low level of 0.7% YoY in 1Q20 (1Q19: 4.5% YoY). The implementation of the
MCO between 18 March and 9 June 2020 led to weaker private sector economic
activities arising from restricted mobility, the closure of non-essential services,
and a pause in ongoing investments.
In the June 2020 update to its World Economic Outlook, the IMF revised its
forecast for global GDP to contract by 4.9% YoY (previous forecast2: -3.0%
YoY), with a recovery of 5.4% YoY in 2021 (previous forecast3: 5.8% YoY). The
revision in forecast considered a deeper recession taking place in both advanced
and emerging economies, which will subsequently hamper recovery prospects.
However, great uncertainties surround this forecast, as the recovery depends
on the progress in developing a vaccine, the effectiveness of containment
measures, as well as, changes in consumer and producer behaviour.
The BNM has also revised downward its forecast for the Malaysian economy
to between -2.0% YoY and 0.5% YoY in 2020 (previous forecast: 3.2% YoY –
4.2% YoY) (see Figure 1). Similarly, the World Bank also revised downward its
forecast for the Malaysian economy to -3.1% YoY (previous forecast: 4.6% YoY).
While sizeable fiscal and monetary policy measures have been undertaken to
support the economy, downside risks from supply shocks, caution in household
spending, and delayed business investments remain. The economy is expected to
contract further in 2Q20 due to the MCO before a partial recovery in 2H20.
Figure 1: Global and Malaysia’s GDP Growth, 2010 – 2020F
Source: Bloomberg, BNM, IMF, MOF
2 IMF’s previous forecast in its April 2020 World Economic Outlook. 3 Ibid.
5.44.3
3.5 3.5 3.6 3.5 3.4 3.8 3.6 2.9
-4.9
7.5
5.35.5
4.76.0
5.14.2
5.94.7 4.3
-2.0
5.54.7
6.05.1
4.2
5.94.7 4.3
0.5
-6.0
-4.0
-2.0
0.0
2.0
4.0
6.0
8.0
10.0
2010 2011 2012 2013 2014 2015 2016 2017 2018 2019 2020F
Yo
Y G
row
th (
%)
World Malaysia
WAYPOINT
MALAYSIAN AVIATION COMMISSION ● JUNE 2020 10
SECTION 2: INDUSTRY OVERVIEW AND OUTLOOK
Industry Overview
Tourist Arrivals Grew Marginally in 2019
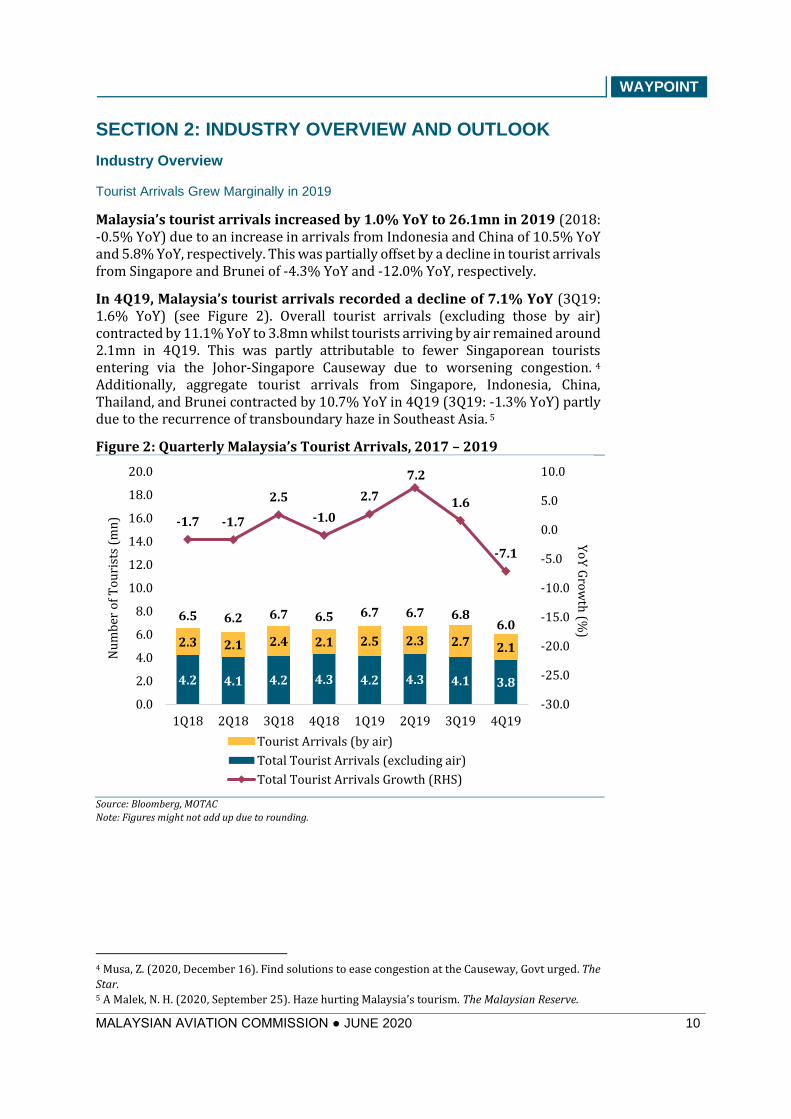
Malaysia’s tourist arrivals increased by 1.0% YoY to 26.1mn in 2019 (2018: -0.5% YoY) due to an increase in arrivals from Indonesia and China of 10.5% YoY and 5.8% YoY, respectively. This was partially offset by a decline in tourist arrivals from Singapore and Brunei of -4.3% YoY and -12.0% YoY, respectively.
In 4Q19, Malaysia’s tourist arrivals recorded a decline of 7.1% YoY (3Q19: 1.6% YoY) (see Figure 2). Overall tourist arrivals (excluding those by air) contracted by 11.1% YoY to 3.8mn whilst tourists arriving by air remained around 2.1mn in 4Q19. This was partly attributable to fewer Singaporean tourists entering via the Johor-Singapore Causeway due to worsening congestion. 4 Additionally, aggregate tourist arrivals from Singapore, Indonesia, China, Thailand, and Brunei contracted by 10.7% YoY in 4Q19 (3Q19: -1.3% YoY) partly due to the recurrence of transboundary haze in Southeast Asia. 5
Figure 2: Quarterly Malaysia’s Tourist Arrivals, 2017 – 2019
Source: Bloomberg, MOTAC
Note: Figures might not add up due to rounding.
4 Musa, Z. (2020, December 16). Find solutions to ease congestion at the Causeway, Govt urged. The
Star. 5 A Malek, N. H. (2020, September 25). Haze hurting Malaysia’s tourism. The Malaysian Reserve.
4.2 4.1 4.2 4.3 4.2 4.3 4.1 3.8
2.3 2.1 2.4 2.1 2.5 2.3 2.7 2.1
6.5 6.2 6.7 6.5 6.7 6.7 6.86.0
-1.7 -1.7
2.5
-1.0
2.7
7.2
1.6
-7.1
-30.0
-25.0
-20.0
-15.0
-10.0
-5.0
0.0
5.0
10.0
0.0
2.0
4.0
6.0
8.0
10.0
12.0
14.0
16.0
18.0
20.0
1Q18 2Q18 3Q18 4Q18 1Q19 2Q19 3Q19 4Q19
Yo
Y G
row
th (%
)
Nu
mb
er o
f T
ou
rist
s (m
n)
Tourist Arrivals (by air)
Total Tourist Arrivals (excluding air)
Total Tourist Arrivals Growth (RHS)
WAYPOINT
MALAYSIAN AVIATION COMMISSION ● JUNE 2020 11
As regards the mode of transport, the growth of tourist arrivals by air to
Malaysia increased by 7.2% YoY in 2019 (2018: 35.5% YoY), with a marginal
increase of 1.0% YoY in 4Q19 (3Q19: 9.5% YoY). However, COVID-19 is
expected to cause a sharp decline in tourist arrivals in 2020. Accordingly, the Visit
Malaysia Year 2020 campaign was cancelled. Nonetheless, to revive the tourism
sector, MOTAC is looking into pivoting its efforts towards promoting domestic
tourism instead. An online survey published by Tourism Malaysia6 showed that
73.1% of the 13,797 respondents preferred to travel domestically and 32.1%
intended to travel domestically within one month of the MCO being lifted.
Additionally, it was found that 43.1% of respondents were willing to travel by air.
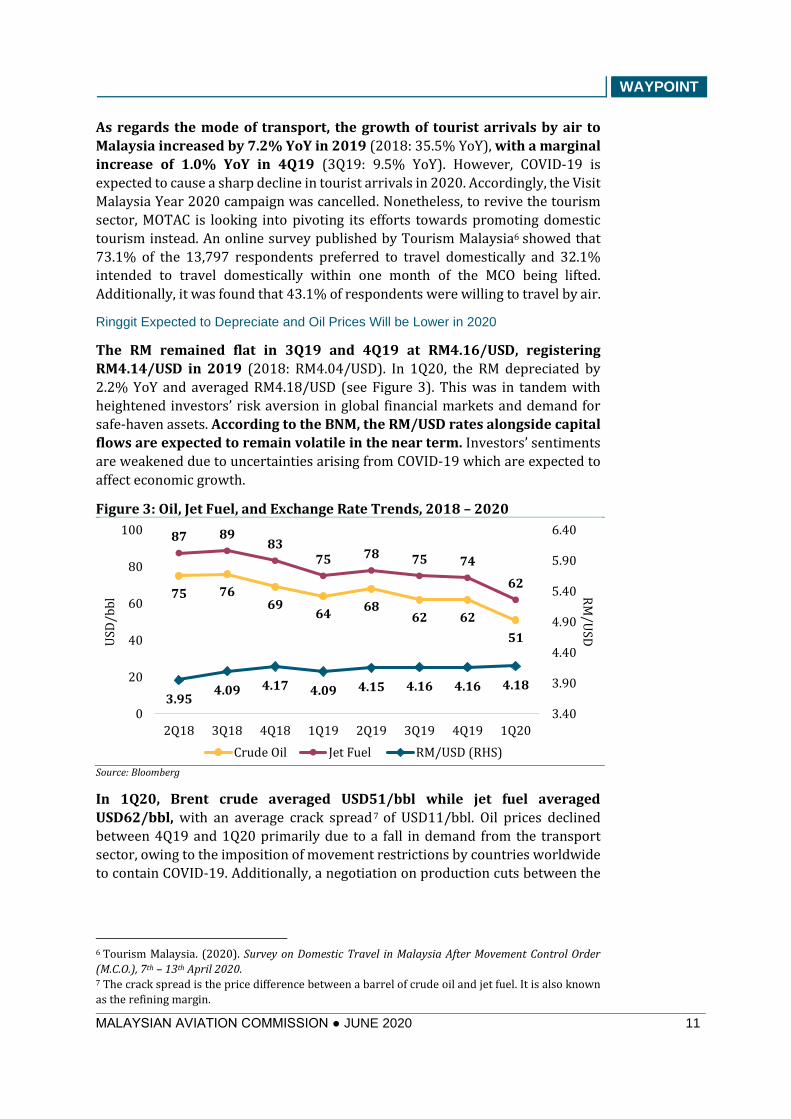
Ringgit Expected to Depreciate and Oil Prices Will be Lower in 2020
The RM remained flat in 3Q19 and 4Q19 at RM4.16/USD, registering
RM4.14/USD in 2019 (2018: RM4.04/USD). In 1Q20, the RM depreciated by
2.2% YoY and averaged RM4.18/USD (see Figure 3). This was in tandem with
heightened investors’ risk aversion in global financial markets and demand for
safe-haven assets. According to the BNM, the RM/USD rates alongside capital
flows are expected to remain volatile in the near term. Investors’ sentiments
are weakened due to uncertainties arising from COVID-19 which are expected to
affect economic growth.
Figure 3: Oil, Jet Fuel, and Exchange Rate Trends, 2018 – 2020
Source: Bloomberg
In 1Q20, Brent crude averaged USD51/bbl while jet fuel averaged
USD62/bbl, with an average crack spread7 of USD11/bbl. Oil prices declined
between 4Q19 and 1Q20 primarily due to a fall in demand from the transport
sector, owing to the imposition of movement restrictions by countries worldwide
to contain COVID-19. Additionally, a negotiation on production cuts between the
6 Tourism Malaysia. (2020). Survey on Domestic Travel in Malaysia After Movement Control Order
(M.C.O.), 7th – 13th April 2020. 7 The crack spread is the price difference between a barrel of crude oil and jet fuel. It is also known
as the refining margin.
75 7669
6468
62 62
51
87 8983
75 78 75 74
62
3.954.09 4.17 4.09 4.15 4.16 4.16 4.18
3.40
3.90
4.40
4.90
5.40
5.90
6.40
0
20
40
60
80
100
2Q18 3Q18 4Q18 1Q19 2Q19 3Q19 4Q19 1Q20
RM
/USD
USD
/bb
l
Crude Oil Jet Fuel RM/USD (RHS)
WAYPOINT
MALAYSIAN AVIATION COMMISSION ● JUNE 2020 12
Saudi Arabia-led OPEC delegation and Russia in March 2020 broke down, further
pushing oil prices down as oversupply concerns surfaced.
The combination of the demand shock and oversupply resulted in an oil price
crash in 1Q20, unlike the previous crash in 2016, which was primarily due to
oversupply from US shale oil production. On 12 April 2020, OPEC and non-OPEC
producers agreed on a production reduction of 9.7mn barrels per day in May
and June 2020 (approximately 18.0% of March 2020’s daily output) to support
global oil prices, with the reduction being phased out gradually until April 2022.
Despite the coordinated production cuts to support prices, the US EIA forecasted
in June 2020 that Brent crude oil prices will average USD38/bbl in 2020, down
from its earlier forecast of USD43/bbl (2019: USD64/bbl). A low oil price
environment will result in losses for airlines that are highly hedged, which
will be compounded by the revenue decline in the passenger traffic segment.
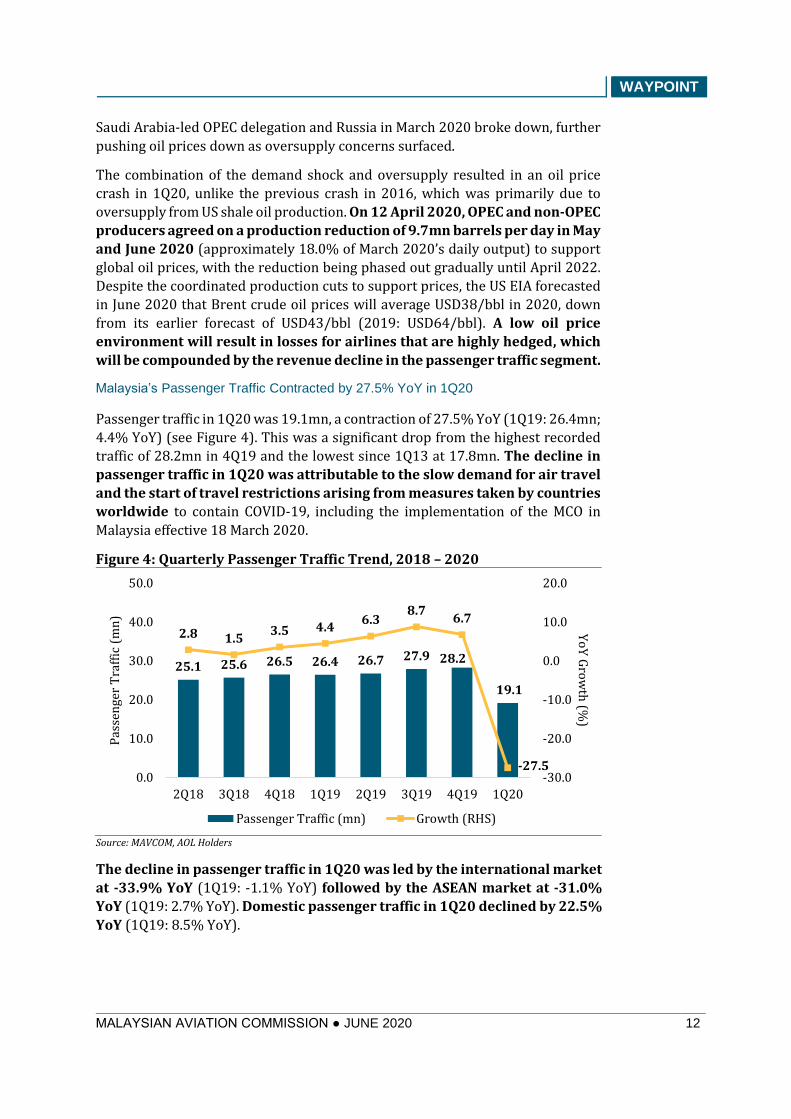
Malaysia’s Passenger Traffic Contracted by 27.5% YoY in 1Q20
Passenger traffic in 1Q20 was 19.1mn, a contraction of 27.5% YoY (1Q19: 26.4mn;
4.4% YoY) (see Figure 4). This was a significant drop from the highest recorded
traffic of 28.2mn in 4Q19 and the lowest since 1Q13 at 17.8mn. The decline in
passenger traffic in 1Q20 was attributable to the slow demand for air travel
and the start of travel restrictions arising from measures taken by countries
worldwide to contain COVID-19, including the implementation of the MCO in
Malaysia effective 18 March 2020.
Figure 4: Quarterly Passenger Traffic Trend, 2018 – 2020
Source: MAVCOM, AOL Holders
The decline in passenger traffic in 1Q20 was led by the international market
at -33.9% YoY (1Q19: -1.1% YoY) followed by the ASEAN market at -31.0%
YoY (1Q19: 2.7% YoY). Domestic passenger traffic in 1Q20 declined by 22.5%
YoY (1Q19: 8.5% YoY).
25.1 25.6 26.5 26.4 26.7 27.9 28.2
19.1
2.8 1.53.5 4.4
6.38.7
6.7
-27.5-30.0
-20.0
-10.0
0.0
10.0
20.0
0.0
10.0
20.0
30.0
40.0
50.0
2Q18 3Q18 4Q18 1Q19 2Q19 3Q19 4Q19 1Q20
Yo
Y G
row
th (%
)
Pas
sen
ger
Tra
ffic
(m
n)
Passenger Traffic (mn) Growth (RHS)
WAYPOINT
MALAYSIAN AVIATION COMMISSION ● JUNE 2020 13
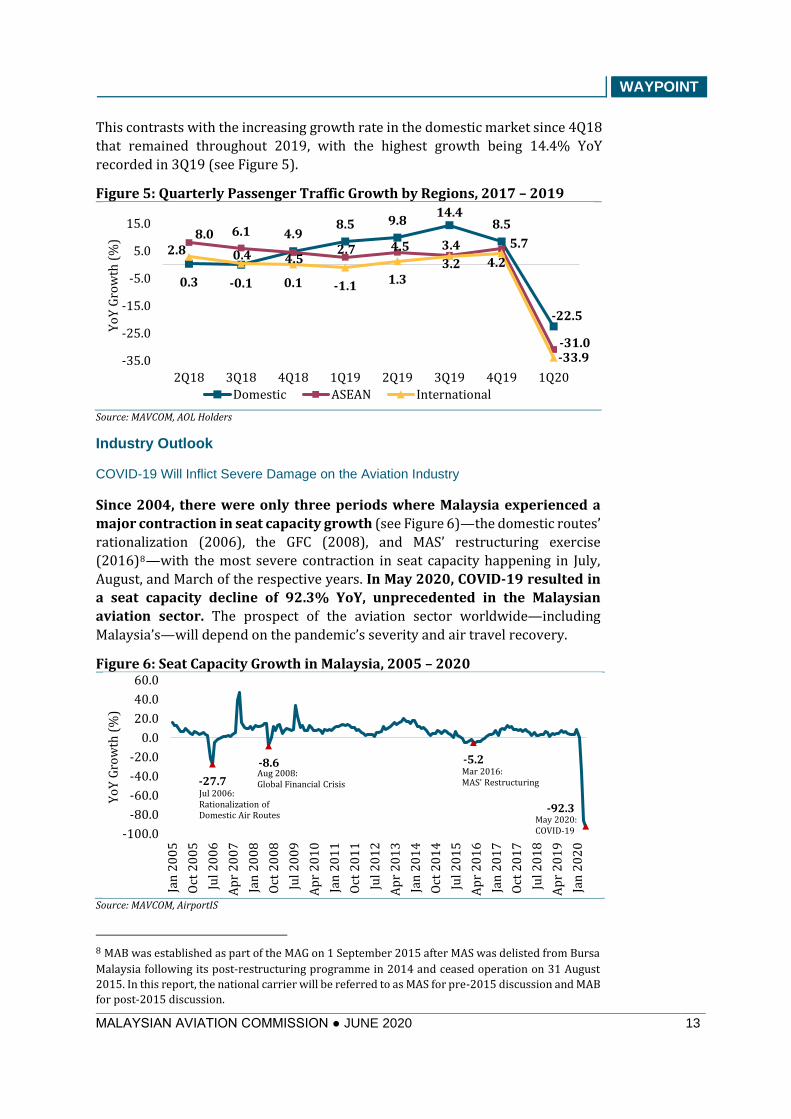
This contrasts with the increasing growth rate in the domestic market since 4Q18
that remained throughout 2019, with the highest growth being 14.4% YoY
recorded in 3Q19 (see Figure 5).
Figure 5: Quarterly Passenger Traffic Growth by Regions, 2017 – 2019
Source: MAVCOM, AOL Holders
Industry Outlook
COVID-19 Will Inflict Severe Damage on the Aviation Industry
Since 2004, there were only three periods where Malaysia experienced a
major contraction in seat capacity growth (see Figure 6)—the domestic routes’
rationalization (2006), the GFC (2008), and MAS’ restructuring exercise
(2016)8—with the most severe contraction in seat capacity happening in July,
August, and March of the respective years. In May 2020, COVID-19 resulted in
a seat capacity decline of 92.3% YoY, unprecedented in the Malaysian
aviation sector. The prospect of the aviation sector worldwide—including
Malaysia’s—will depend on the pandemic’s severity and air travel recovery.
Figure 6: Seat Capacity Growth in Malaysia, 2005 – 2020
Source: MAVCOM, AirportIS
8 MAB was established as part of the MAG on 1 September 2015 after MAS was delisted from Bursa
Malaysia following its post-restructuring programme in 2014 and ceased operation on 31 August
2015. In this report, the national carrier will be referred to as MAS for pre-2015 discussion and MAB
for post-2015 discussion.
0.3 -0.1
4.98.5 9.8
14.48.5
-22.5
8.0 6.1
4.52.7 4.5 3.4 5.7
-31.0
2.8 0.4
0.1 -1.1 1.33.2 4.2
-33.9-35.0
-25.0
-15.0
-5.0
5.0
15.0
2Q18 3Q18 4Q18 1Q19 2Q19 3Q19 4Q19 1Q20
Yo
Y G
row
th (
%)
Domestic ASEAN International
-27.7
-8.6 -5.2
-92.3
-100.0
-80.0
-60.0
-40.0
-20.0
0.0
20.0
40.0
60.0
Jan
20
05
Oct
20
05
Jul 2
00
6
Ap
r 2
00
7
Jan
20
08
Oct
20
08
Jul 2
00
9
Ap
r 2
01
0
Jan
20
11
Oct
20
11
Jul 2
01
2
Ap
r 2
01
3
Jan
20
14
Oct
20
14
Jul 2
01
5
Ap
r 2
01
6
Jan
20
17
Oct
20
17
Jul 2
01
8
Ap
r 2
01
9
Jan
20
20
Yo
Y G
row
th (
%)
Jul 2006: Rationalization of Domestic Air Routes
Aug 2008: Global Financial Crisis
Mar 2016:MAS' Restructuring
May 2020: COVID-19
WAYPOINT
MALAYSIAN AVIATION COMMISSION ● JUNE 2020 14
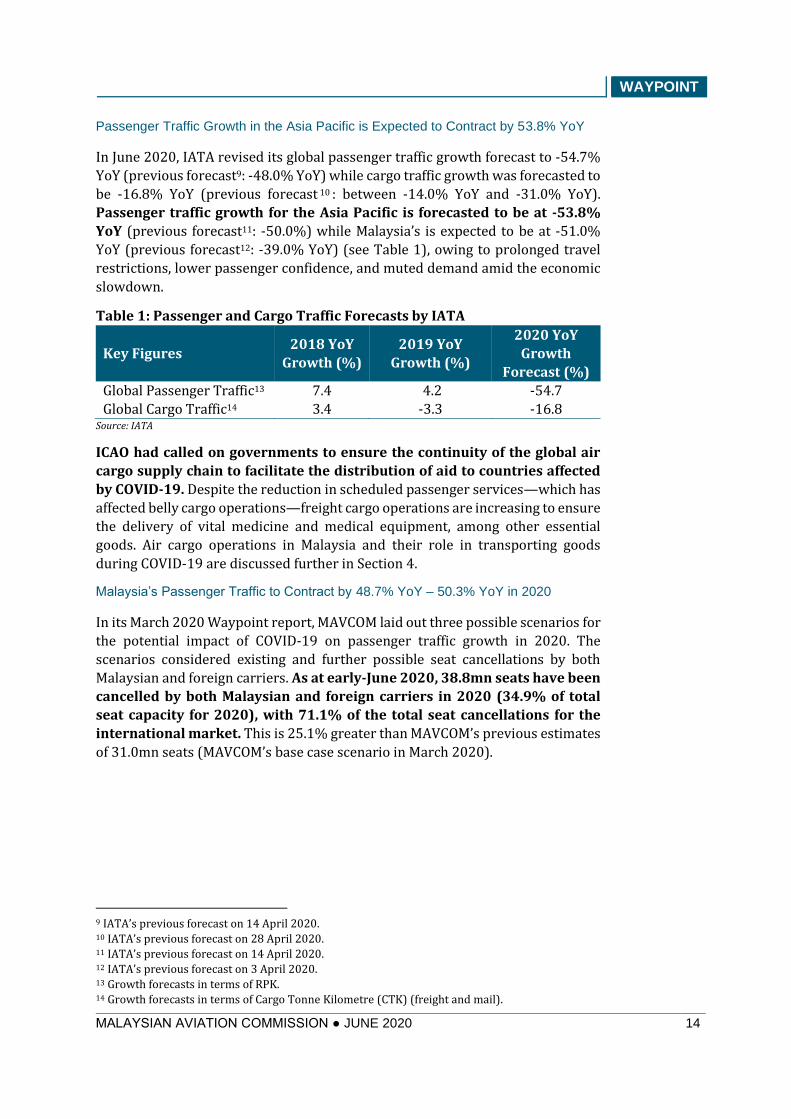
Passenger Traffic Growth in the Asia Pacific is Expected to Contract by 53.8% YoY
In June 2020, IATA revised its global passenger traffic growth forecast to -54.7%
YoY (previous forecast9: -48.0% YoY) while cargo traffic growth was forecasted to
be -16.8% YoY (previous forecast 10 : between -14.0% YoY and -31.0% YoY).
Passenger traffic growth for the Asia Pacific is forecasted to be at -53.8%
YoY (previous forecast11: -50.0%) while Malaysia’s is expected to be at -51.0%
YoY (previous forecast12: -39.0% YoY) (see Table 1), owing to prolonged travel
restrictions, lower passenger confidence, and muted demand amid the economic
slowdown.
Table 1: Passenger and Cargo Traffic Forecasts by IATA
Key Figures 2018 YoY
Growth (%)
2019 YoY
Growth (%)
2020 YoY
Growth
Forecast (%)
Global Passenger Traffic13 7.4 4.2 -54.7
Global Cargo Traffic14 3.4 -3.3 -16.8 Source: IATA
ICAO had called on governments to ensure the continuity of the global air
cargo supply chain to facilitate the distribution of aid to countries affected
by COVID-19. Despite the reduction in scheduled passenger services—which has
affected belly cargo operations—freight cargo operations are increasing to ensure
the delivery of vital medicine and medical equipment, among other essential
goods. Air cargo operations in Malaysia and their role in transporting goods
during COVID-19 are discussed further in Section 4.
Malaysia’s Passenger Traffic to Contract by 48.7% YoY – 50.3% YoY in 2020
In its March 2020 Waypoint report, MAVCOM laid out three possible scenarios for
the potential impact of COVID-19 on passenger traffic growth in 2020. The
scenarios considered existing and further possible seat cancellations by both
Malaysian and foreign carriers. As at early-June 2020, 38.8mn seats have been
cancelled by both Malaysian and foreign carriers in 2020 (34.9% of total
seat capacity for 2020), with 71.1% of the total seat cancellations for the
international market. This is 25.1% greater than MAVCOM’s previous estimates
of 31.0mn seats (MAVCOM’s base case scenario in March 2020).
9 IATA’s previous forecast on 14 April 2020. 10 IATA’s previous forecast on 28 April 2020. 11 IATA’s previous forecast on 14 April 2020. 12 IATA’s previous forecast on 3 April 2020. 13 Growth forecasts in terms of RPK. 14 Growth forecasts in terms of Cargo Tonne Kilometre (CTK) (freight and mail).
WAYPOINT
MALAYSIAN AVIATION COMMISSION ● JUNE 2020 15
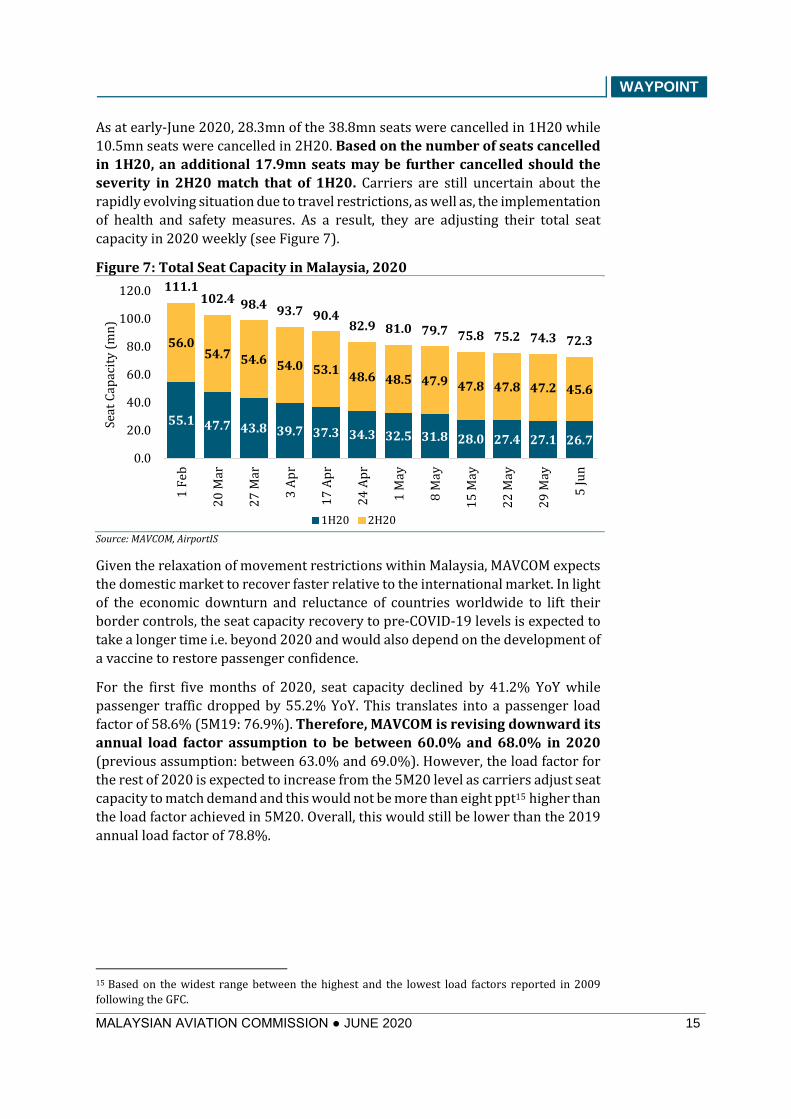
As at early-June 2020, 28.3mn of the 38.8mn seats were cancelled in 1H20 while
10.5mn seats were cancelled in 2H20. Based on the number of seats cancelled
in 1H20, an additional 17.9mn seats may be further cancelled should the
severity in 2H20 match that of 1H20. Carriers are still uncertain about the
rapidly evolving situation due to travel restrictions, as well as, the implementation
of health and safety measures. As a result, they are adjusting their total seat
capacity in 2020 weekly (see Figure 7).
Figure 7: Total Seat Capacity in Malaysia, 2020
Source: MAVCOM, AirportIS
Given the relaxation of movement restrictions within Malaysia, MAVCOM expects
the domestic market to recover faster relative to the international market. In light
of the economic downturn and reluctance of countries worldwide to lift their
border controls, the seat capacity recovery to pre-COVID-19 levels is expected to
take a longer time i.e. beyond 2020 and would also depend on the development of
a vaccine to restore passenger confidence.
For the first five months of 2020, seat capacity declined by 41.2% YoY while
passenger traffic dropped by 55.2% YoY. This translates into a passenger load
factor of 58.6% (5M19: 76.9%). Therefore, MAVCOM is revising downward its
annual load factor assumption to be between 60.0% and 68.0% in 2020
(previous assumption: between 63.0% and 69.0%). However, the load factor for
the rest of 2020 is expected to increase from the 5M20 level as carriers adjust seat
capacity to match demand and this would not be more than eight ppt15 higher than
the load factor achieved in 5M20. Overall, this would still be lower than the 2019
annual load factor of 78.8%.
15 Based on the widest range between the highest and the lowest load factors reported in 2009
following the GFC.
55.1 47.7 43.8 39.7 37.3 34.3 32.5 31.8 28.0 27.4 27.1 26.7
56.054.7 54.6 54.0 53.1
48.6 48.5 47.9 47.8 47.8 47.2 45.6
111.1102.4 98.4 93.7 90.4
82.9 81.0 79.7 75.8 75.2 74.3 72.3
0.0
20.0
40.0
60.0
80.0
100.0
120.0
1 F
eb
20
Mar
27
Mar
3 A
pr
17
Ap
r
24
Ap
r
1 M
ay
8 M
ay
15
May
22
May
29
May
5 J
un
Seat
Cap
acit
y (
mn
)
1H20 2H20
WAYPOINT
MALAYSIAN AVIATION COMMISSION ● JUNE 2020 16
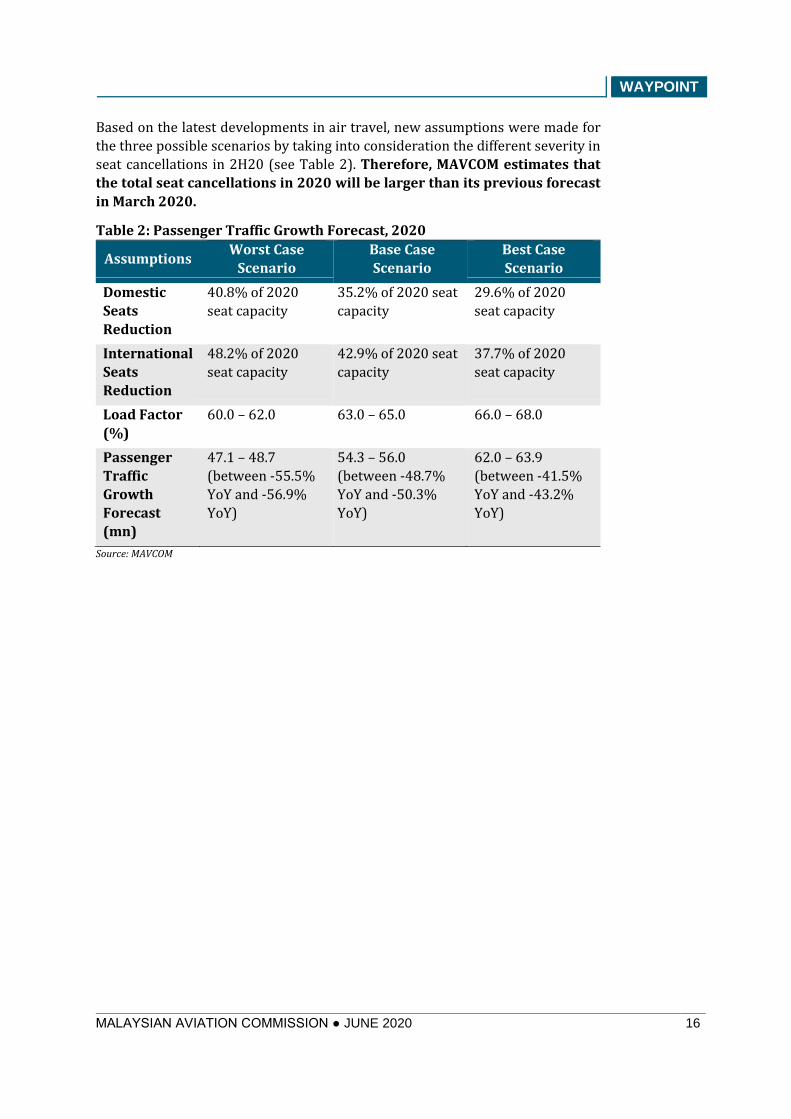
Based on the latest developments in air travel, new assumptions were made for
the three possible scenarios by taking into consideration the different severity in
seat cancellations in 2H20 (see Table 2). Therefore, MAVCOM estimates that
the total seat cancellations in 2020 will be larger than its previous forecast
in March 2020.
Table 2: Passenger Traffic Growth Forecast, 2020
Assumptions Worst Case
Scenario
Base Case
Scenario
Best Case
Scenario
Domestic
Seats
Reduction
40.8% of 2020
seat capacity
35.2% of 2020 seat
capacity
29.6% of 2020
seat capacity
International
Seats
Reduction
48.2% of 2020
seat capacity
42.9% of 2020 seat
capacity
37.7% of 2020
seat capacity
Load Factor
(%)
60.0 – 62.0 63.0 – 65.0 66.0 – 68.0
Passenger
Traffic
Growth
Forecast
(mn)
47.1 – 48.7
(between -55.5%
YoY and -56.9%
YoY)
54.3 – 56.0
(between -48.7%
YoY and -50.3%
YoY)
62.0 – 63.9
(between -41.5%
YoY and -43.2%
YoY)
Source: MAVCOM
WAYPOINT
MALAYSIAN AVIATION COMMISSION ● JUNE 2020 17
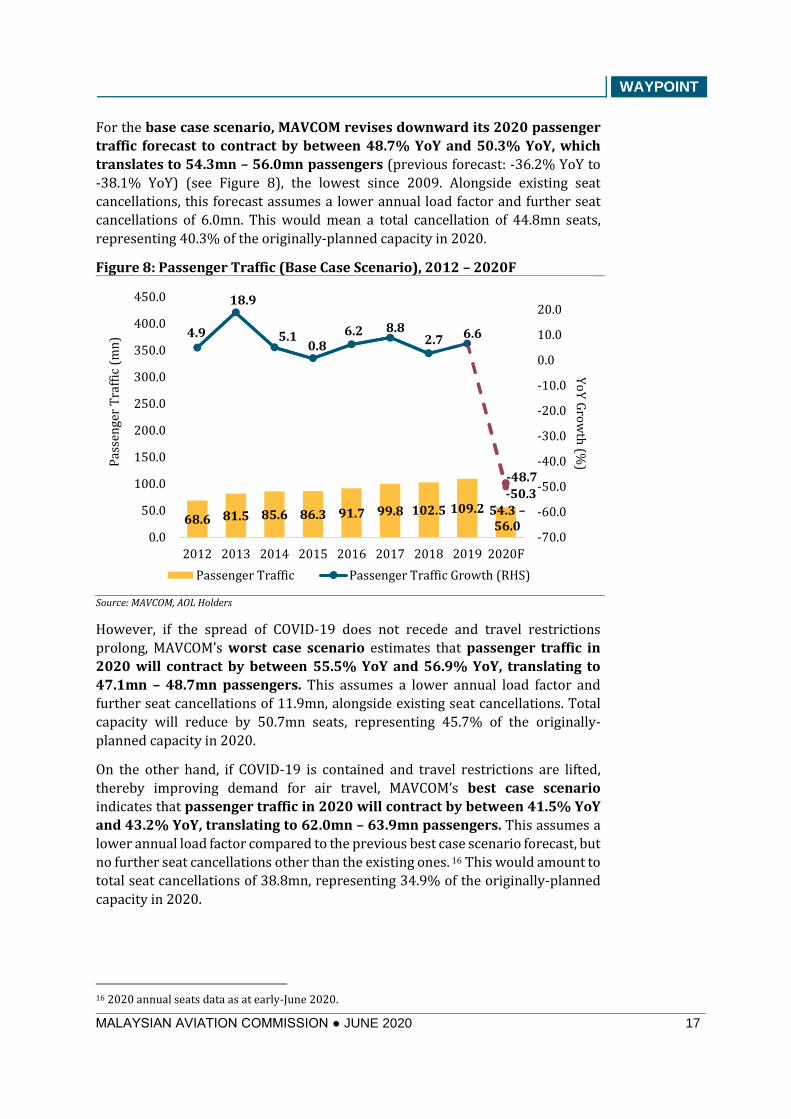
For the base case scenario, MAVCOM revises downward its 2020 passenger
traffic forecast to contract by between 48.7% YoY and 50.3% YoY, which
translates to 54.3mn – 56.0mn passengers (previous forecast: -36.2% YoY to
-38.1% YoY) (see Figure 8), the lowest since 2009. Alongside existing seat
cancellations, this forecast assumes a lower annual load factor and further seat
cancellations of 6.0mn. This would mean a total cancellation of 44.8mn seats,
representing 40.3% of the originally-planned capacity in 2020.
Figure 8: Passenger Traffic (Base Case Scenario), 2012 – 2020F
Source: MAVCOM, AOL Holders
However, if the spread of COVID-19 does not recede and travel restrictions
prolong, MAVCOM’s worst case scenario estimates that passenger traffic in
2020 will contract by between 55.5% YoY and 56.9% YoY, translating to
47.1mn – 48.7mn passengers. This assumes a lower annual load factor and
further seat cancellations of 11.9mn, alongside existing seat cancellations. Total
capacity will reduce by 50.7mn seats, representing 45.7% of the originally-
planned capacity in 2020.
On the other hand, if COVID-19 is contained and travel restrictions are lifted,
thereby improving demand for air travel, MAVCOM’s best case scenario
indicates that passenger traffic in 2020 will contract by between 41.5% YoY
and 43.2% YoY, translating to 62.0mn – 63.9mn passengers. This assumes a
lower annual load factor compared to the previous best case scenario forecast, but
no further seat cancellations other than the existing ones. 16 This would amount to
total seat cancellations of 38.8mn, representing 34.9% of the originally-planned
capacity in 2020.
16 2020 annual seats data as at early-June 2020.
68.6 81.5 85.6 86.3 91.7 99.8 102.5 109.2 54.3 –56.0
4.9
18.9
5.10.8
6.2 8.82.7 6.6
-48.7
-50.3
-70.0
-60.0
-50.0
-40.0
-30.0
-20.0
-10.0
0.0
10.0
20.0
0.0
50.0
100.0
150.0
200.0
250.0
300.0
350.0
400.0
450.0
2012 2013 2014 2015 2016 2017 2018 2019 2020F
Yo
Y G
row
th (%
)Pas
sen
ger
Tra
ffic
(m
n)
Passenger Traffic Passenger Traffic Growth (RHS)
WAYPOINT
MALAYSIAN AVIATION COMMISSION ● JUNE 2020 18
The Revenue-at-Risk for Malaysian Air Service Licence and Aerodrome Operating
Licence Holders is Estimated at RM11.8bn
Based on MAVCOM’s passenger traffic growth forecast in 2020, for the base case
scenario, the revenue-at-risk for Malaysian and foreign carriers is estimated
at RM11.3bn and RM4.6bn (previous estimates: RM6.8bn and RM5.0bn),
respectively (51.1% of estimated total airfare revenue in 2019), whilst for
Malaysian aerodrome operators, the revenue derived from passenger
service charge that is at risk is estimated at RM0.5bn (previous estimates:
RM0.4bn) (33.4% of estimated total revenue derived from passenger service
charge in 2019). The revenue-at-risk for both ASL and AOL holders is estimated
at RM11.8bn (previous estimates: RM7.2bn).
New Norms and Uncertainties for the Aviation Industry
Our passenger traffic growth forecasts and outlook for the Malaysian
aviation industry are subject to a high degree of uncertainty. The
performance of the industry will depend on the pandemic’s severity, as well as,
how consumers, industry players, and policymakers react. Some of the sources of
uncertainty are as follows:
• The pathway of the pandemic: while Malaysia has experienced
considerable success in containing the spread of COVID-19 so far, the
possibility of a second wave remains. 17 This may necessitate the re-
imposition of movement controls, which will directly impact the air
transport industry. The spread of the pandemic will also affect the outlook for the international passenger market, as this will influence government-
imposed restrictions on international movement (see Box 1). Ultimately,
the only decisive solution to the pandemic is the development of a vaccine.
Progress or setbacks in efforts to develop a vaccine will influence the
medium-to-long-term outlook of the aviation industry.
• Public health measures: Malaysia began its Recovery MCO phase on 10
June 2020 which is scheduled to end on 31 August 2020. Interstate travel
is now allowed under the Recovery MCO rules although large gatherings
such as conferences and exhibitions will still be subject to the SOPs set by
the GOM. The GOM has maintained its border controls and quarantine
measures, which may reduce demand for air travel.
• Economic outlook: as discussed in Section 1, Malaysia is likely to face an
economic contraction due to the disruptions caused by COVID-19 and the
consequent lockdown measures. Should the contraction prove more
severe than expected, or the recovery more muted, the reaction of
households and corporations in reducing their discretionary spending—
including air travel—will be more pronounced.
17 Kaos Jr., J. (2020, May 12). Health DG: Malaysia concerned about possible emergence of COVID-19
second wave. The Star.
WAYPOINT
MALAYSIAN AVIATION COMMISSION ● JUNE 2020 19
• Changes in passenger behaviour: independent of the economic
circumstances, the non-monetary cost of air travel (the risk of contracting
COVID-19) may mean that consumers will be less willing to travel by air.
Leisure travellers may choose to use private vehicles to travel to their
destinations, substitute towards more proximate locations, or not travel
altogether. Corporations, having already invested and become
accustomed to telecommuting and online conferencing facilities, may also
reduce the demand for business travel.
Box 1: Restrictions on International Movement and Travel Bubbles
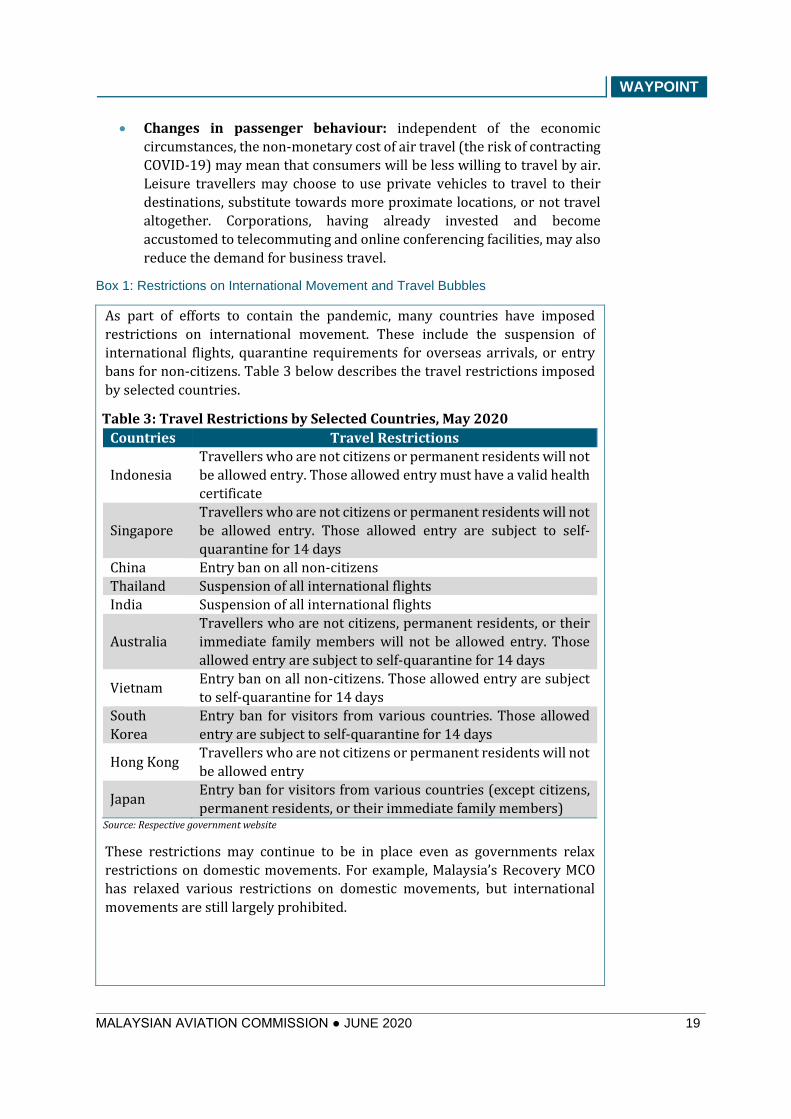
As part of efforts to contain the pandemic, many countries have imposed
restrictions on international movement. These include the suspension of
international flights, quarantine requirements for overseas arrivals, or entry
bans for non-citizens. Table 3 below describes the travel restrictions imposed
by selected countries.
Table 3: Travel Restrictions by Selected Countries, May 2020
Countries Travel Restrictions
Indonesia
Travellers who are not citizens or permanent residents will not
be allowed entry. Those allowed entry must have a valid health
certificate
Singapore
Travellers who are not citizens or permanent residents will not
be allowed entry. Those allowed entry are subject to self-
quarantine for 14 days
China Entry ban on all non-citizens
Thailand Suspension of all international flights
India Suspension of all international flights
Australia
Travellers who are not citizens, permanent residents, or their
immediate family members will not be allowed entry. Those
allowed entry are subject to self-quarantine for 14 days
Vietnam Entry ban on all non-citizens. Those allowed entry are subject
to self-quarantine for 14 days
South
Korea
Entry ban for visitors from various countries. Those allowed
entry are subject to self-quarantine for 14 days
Hong Kong Travellers who are not citizens or permanent residents will not
be allowed entry
Japan Entry ban for visitors from various countries (except citizens,
permanent residents, or their immediate family members) Source: Respective government website
These restrictions may continue to be in place even as governments relax
restrictions on domestic movements. For example, Malaysia’s Recovery MCO
has relaxed various restrictions on domestic movements, but international
movements are still largely prohibited.
WAYPOINT
MALAYSIAN AVIATION COMMISSION ● JUNE 2020 20
Some governments have agreed to open their borders to selected countries
(travel bubbles) to facilitate a partial recovery in trade and tourism, such as:
• Australia and New Zealand
• Austria, France, Germany, and Switzerland
• Estonia, Latvia, and Lithuania
Malaysia is also considering setting up travel bubbles with six countries namely
Australia, Brunei, Japan, New Zealand, Singapore, and South Korea to begin
restoring international travel. 18 Passenger traffic from these six countries
constituted 17.3% of total passenger traffic in Malaysia in 2019. However,
certain prerequisites and mutual agreement on the Standard Operating
Procedures (SOPs) must be reached before the travel bubble arrangements can
be pursued.
The performance of the aviation industry will also be affected by
measures—either adopted by industry players themselves or that imposed
by governments—to reduce the spread of COVID-19 via air transport. For
example, the GOM previously imposed a 66.6% load factor limit19 on scheduled
flights to Peninsular Malaysia from Sabah and Sarawak during the Conditional MCO period. This limit may increase fares or reduce flights due to airlines’
inability to cover their costs. However, this was lifted under the Recovery MCO.20
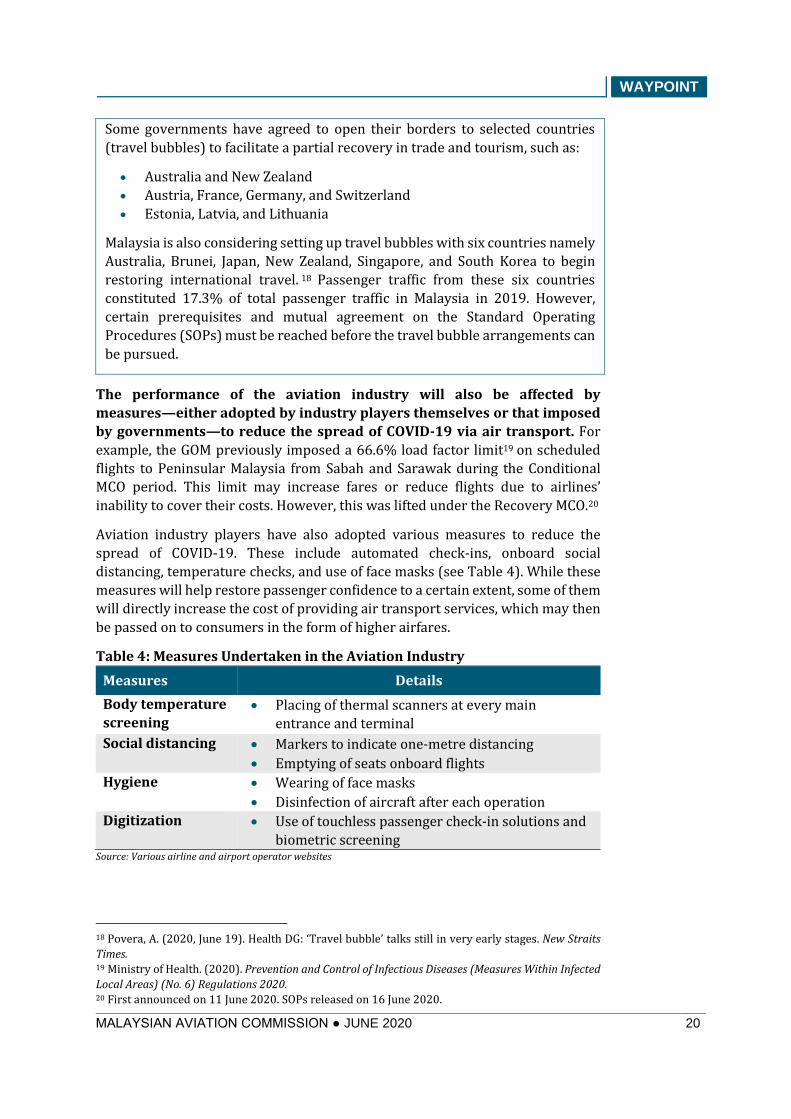
Aviation industry players have also adopted various measures to reduce the
spread of COVID-19. These include automated check-ins, onboard social
distancing, temperature checks, and use of face masks (see Table 4). While these
measures will help restore passenger confidence to a certain extent, some of them
will directly increase the cost of providing air transport services, which may then
be passed on to consumers in the form of higher airfares.
Table 4: Measures Undertaken in the Aviation Industry
Measures Details
Body temperature
screening • Placing of thermal scanners at every main
entrance and terminal
Social distancing • Markers to indicate one-metre distancing
• Emptying of seats onboard flights
Hygiene • Wearing of face masks
• Disinfection of aircraft after each operation
Digitization • Use of touchless passenger check-in solutions and
biometric screening Source: Various airline and airport operator websites
18 Povera, A. (2020, June 19). Health DG: ‘Travel bubble’ talks still in very early stages. New Straits
Times. 19 Ministry of Health. (2020). Prevention and Control of Infectious Diseases (Measures Within Infected
Local Areas) (No. 6) Regulations 2020. 20 First announced on 11 June 2020. SOPs released on 16 June 2020.
WAYPOINT
MALAYSIAN AVIATION COMMISSION ● JUNE 2020 21
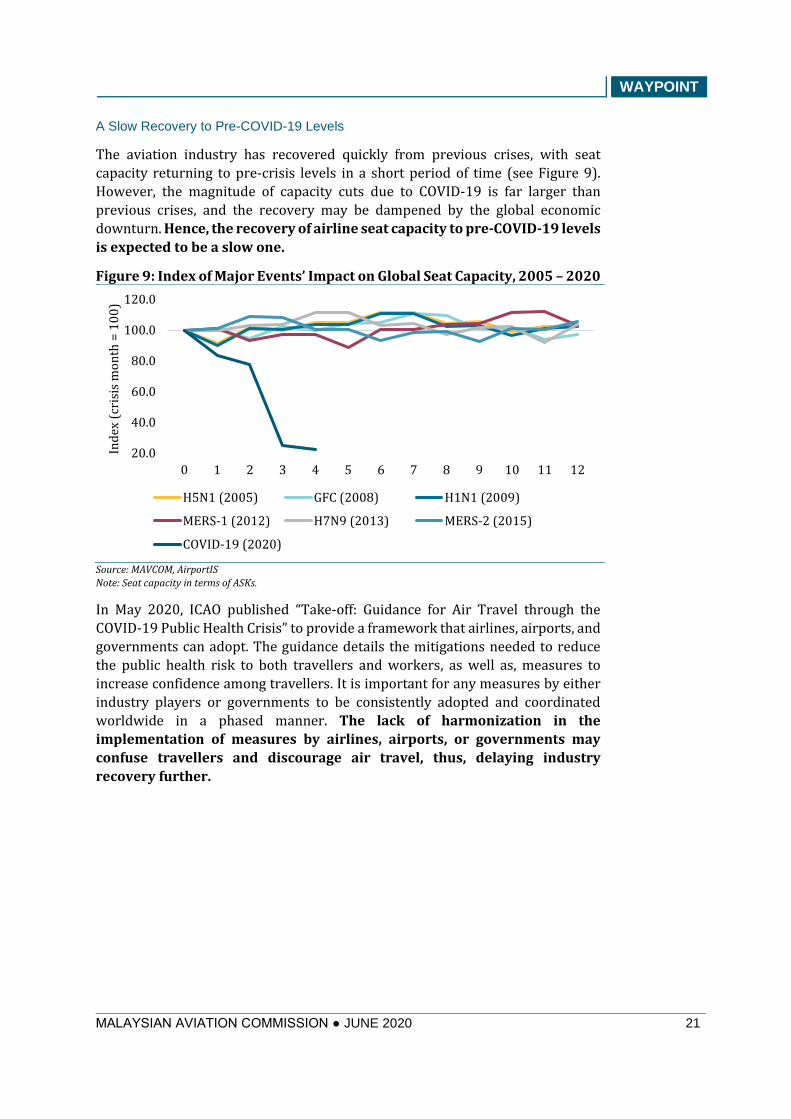
A Slow Recovery to Pre-COVID-19 Levels
The aviation industry has recovered quickly from previous crises, with seat
capacity returning to pre-crisis levels in a short period of time (see Figure 9).
However, the magnitude of capacity cuts due to COVID-19 is far larger than
previous crises, and the recovery may be dampened by the global economic
downturn. Hence, the recovery of airline seat capacity to pre-COVID-19 levels
is expected to be a slow one.
Figure 9: Index of Major Events’ Impact on Global Seat Capacity, 2005 – 2020
Source: MAVCOM, AirportIS
Note: Seat capacity in terms of ASKs.
In May 2020, ICAO published “Take-off: Guidance for Air Travel through the
COVID-19 Public Health Crisis” to provide a framework that airlines, airports, and
governments can adopt. The guidance details the mitigations needed to reduce
the public health risk to both travellers and workers, as well as, measures to
increase confidence among travellers. It is important for any measures by either
industry players or governments to be consistently adopted and coordinated
worldwide in a phased manner. The lack of harmonization in the
implementation of measures by airlines, airports, or governments may
confuse travellers and discourage air travel, thus, delaying industry
recovery further.
20.0
40.0
60.0
80.0
100.0
120.0
0 1 2 3 4 5 6 7 8 9 10 11 12
Ind
ex (
cris
is m
on
th =
10
0)
H5N1 (2005) GFC (2008) H1N1 (2009)
MERS-1 (2012) H7N9 (2013) MERS-2 (2015)
COVID-19 (2020)
WAYPOINT
MALAYSIAN AVIATION COMMISSION ● JUNE 2020 22
SECTION 3: INDUSTRY STRUCTURE AND
PERFORMANCE
Scheduled Passenger Services Market
Reduction of Market Shares for Malindo, AirAsia X, and Firefly in 1Q20
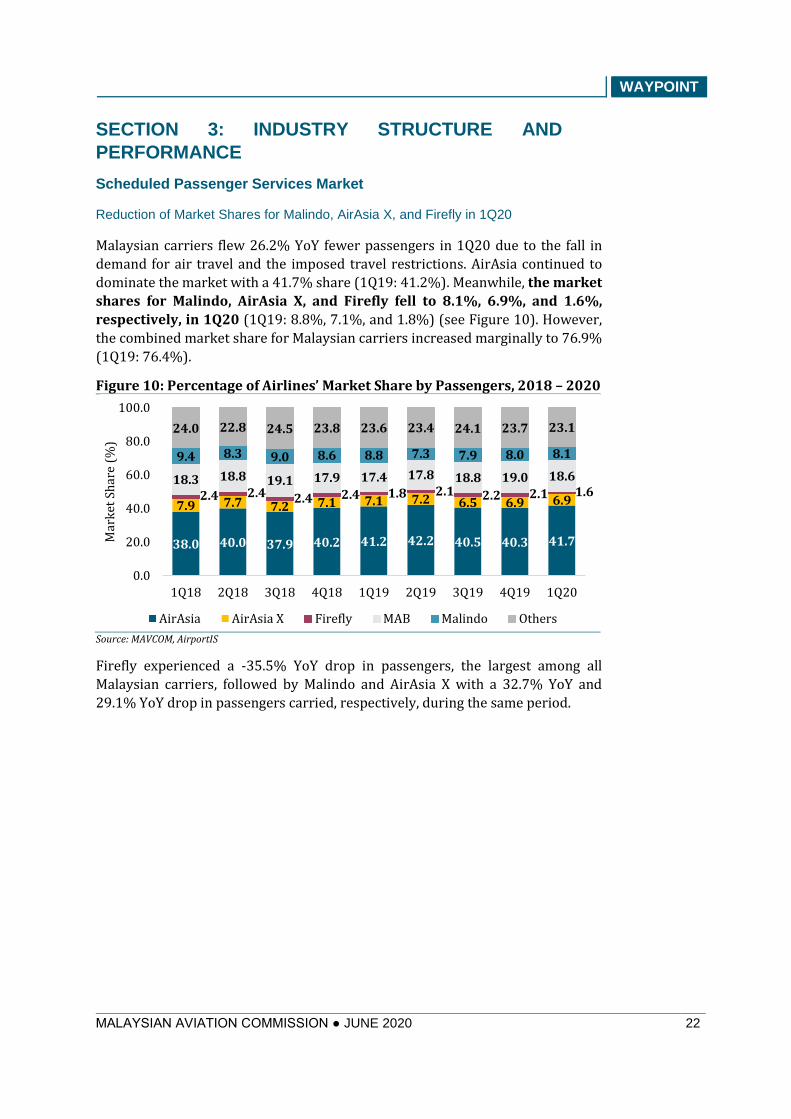
Malaysian carriers flew 26.2% YoY fewer passengers in 1Q20 due to the fall in
demand for air travel and the imposed travel restrictions. AirAsia continued to
dominate the market with a 41.7% share (1Q19: 41.2%). Meanwhile, the market
shares for Malindo, AirAsia X, and Firefly fell to 8.1%, 6.9%, and 1.6%,
respectively, in 1Q20 (1Q19: 8.8%, 7.1%, and 1.8%) (see Figure 10). However,
the combined market share for Malaysian carriers increased marginally to 76.9%
(1Q19: 76.4%).
Figure 10: Percentage of Airlines’ Market Share by Passengers, 2018 – 2020
Source: MAVCOM, AirportIS
Firefly experienced a -35.5% YoY drop in passengers, the largest among all
Malaysian carriers, followed by Malindo and AirAsia X with a 32.7% YoY and
29.1% YoY drop in passengers carried, respectively, during the same period.
38.0 40.0 37.9 40.2 41.2 42.2 40.5 40.3 41.7
7.9 7.7 7.2 7.1 7.1 7.2 6.5 6.9 6.92.4 2.4 2.4 2.4 1.8 2.1 2.2 2.1 1.618.3 18.8 19.1 17.9 17.4 17.8 18.8 19.0 18.6
9.4 8.3 9.0 8.6 8.8 7.3 7.9 8.0 8.1
24.0 22.8 24.5 23.8 23.6 23.4 24.1 23.7 23.1
0.0
20.0
40.0
60.0
80.0
100.0
1Q18 2Q18 3Q18 4Q18 1Q19 2Q19 3Q19 4Q19 1Q20
Mar
ket
Sh
are
(%)
AirAsia AirAsia X Firefly MAB Malindo Others
WAYPOINT
MALAYSIAN AVIATION COMMISSION ● JUNE 2020 23
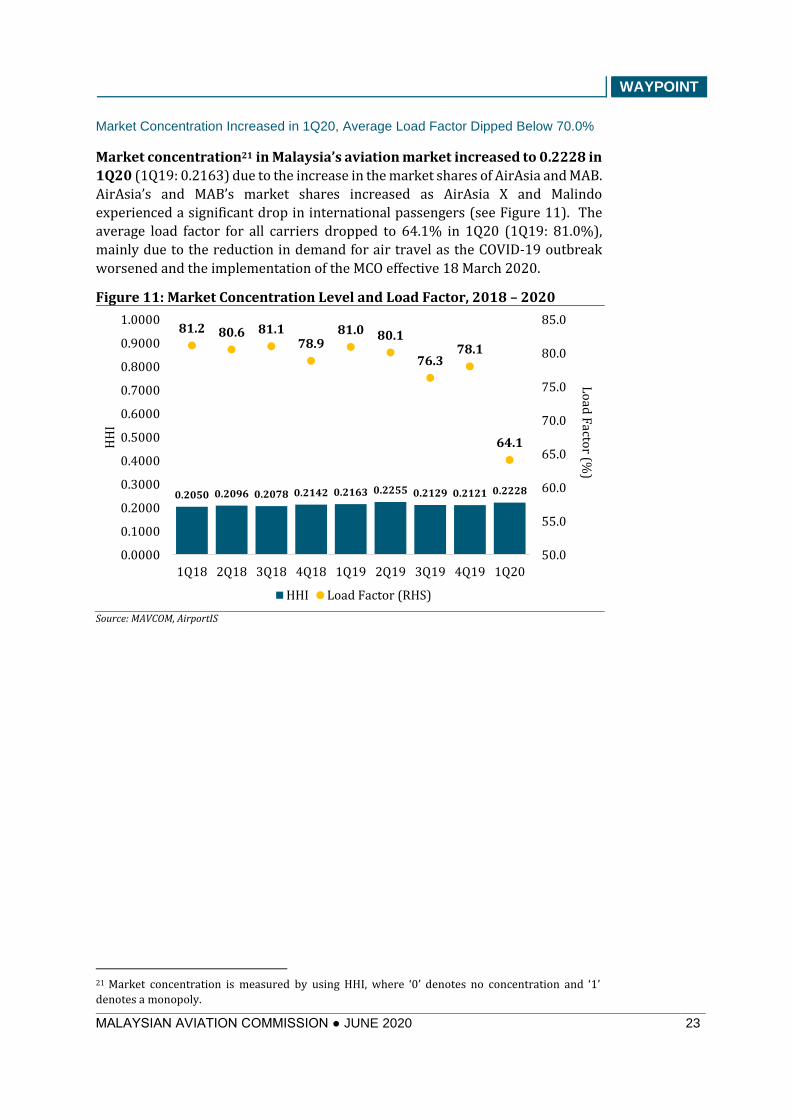
Market Concentration Increased in 1Q20, Average Load Factor Dipped Below 70.0%
Market concentration21 in Malaysia’s aviation market increased to 0.2228 in
1Q20 (1Q19: 0.2163) due to the increase in the market shares of AirAsia and MAB.
AirAsia’s and MAB’s market shares increased as AirAsia X and Malindo
experienced a significant drop in international passengers (see Figure 11). The
average load factor for all carriers dropped to 64.1% in 1Q20 (1Q19: 81.0%),
mainly due to the reduction in demand for air travel as the COVID-19 outbreak
worsened and the implementation of the MCO effective 18 March 2020.
Figure 11: Market Concentration Level and Load Factor, 2018 – 2020
Source: MAVCOM, AirportIS
21 Market concentration is measured by using HHI, where ‘0’ denotes no concentration and ‘1’
denotes a monopoly.
0.2050 0.2096 0.2078 0.2142 0.2163 0.2255 0.2129 0.2121 0.2228
81.2 80.6 81.178.9
81.0 80.1
76.378.1
64.1
50.0
55.0
60.0
65.0
70.0
75.0
80.0
85.0
0.0000
0.1000
0.2000
0.3000
0.4000
0.5000
0.6000
0.7000
0.8000
0.9000
1.0000
1Q18 2Q18 3Q18 4Q18 1Q19 2Q19 3Q19 4Q19 1Q20
Lo
ad F
actor (%
)
HH
I
HHI Load Factor (RHS)
WAYPOINT
MALAYSIAN AVIATION COMMISSION ● JUNE 2020 24
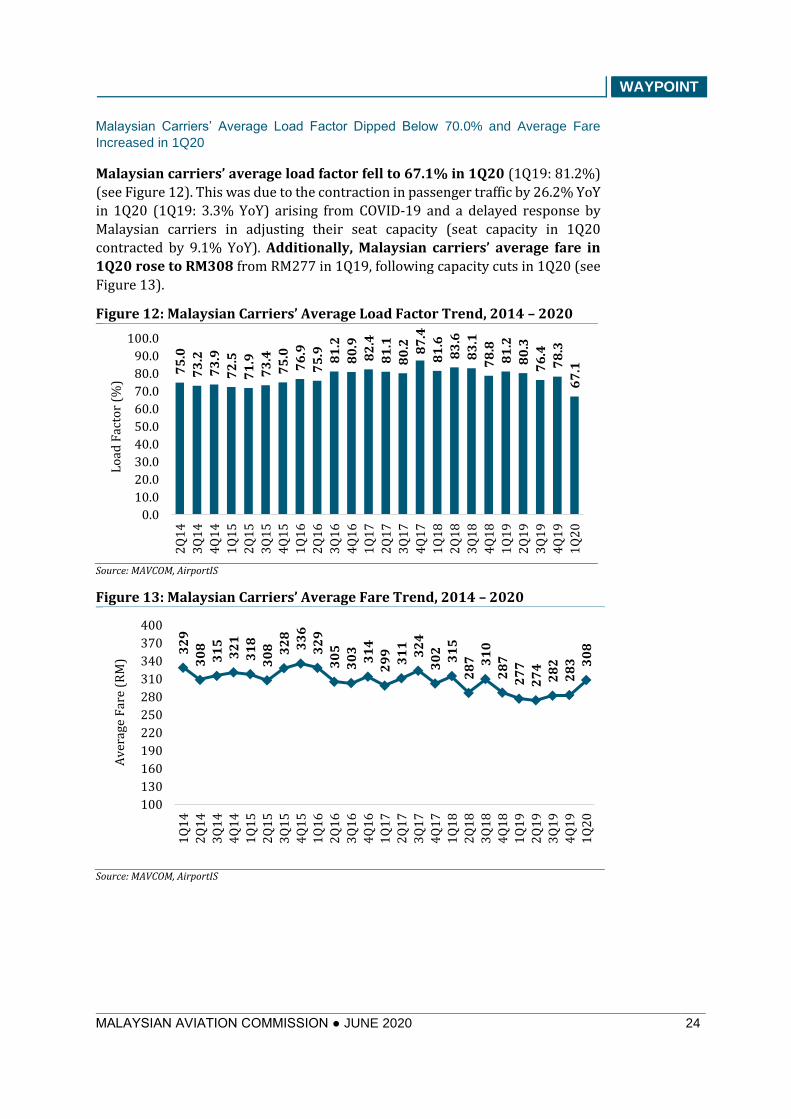
Malaysian Carriers’ Average Load Factor Dipped Below 70.0% and Average Fare
Increased in 1Q20
Malaysian carriers’ average load factor fell to 67.1% in 1Q20 (1Q19: 81.2%)
(see Figure 12). This was due to the contraction in passenger traffic by 26.2% YoY
in 1Q20 (1Q19: 3.3% YoY) arising from COVID-19 and a delayed response by
Malaysian carriers in adjusting their seat capacity (seat capacity in 1Q20
contracted by 9.1% YoY). Additionally, Malaysian carriers’ average fare in
1Q20 rose to RM308 from RM277 in 1Q19, following capacity cuts in 1Q20 (see
Figure 13).
Figure 12: Malaysian Carriers’ Average Load Factor Trend, 2014 – 2020
Source: MAVCOM, AirportIS
Figure 13: Malaysian Carriers’ Average Fare Trend, 2014 – 2020
Source: MAVCOM, AirportIS
75
.0
73
.2
73
.9
72
.5
71
.9
73
.4
75
.0
76
.9
75
.9 81
.2
80
.9
82
.4
81
.1
80
.2 87
.4
81
.6
83
.6
83
.1
78
.8
81
.2
80
.3
76
.4
78
.3
67
.1
0.0
10.0
20.0
30.0
40.0
50.0
60.0
70.0
80.0
90.0
100.0
2Q
14
3Q
14
4Q
14
1Q
15
2Q
15
3Q
15
4Q
15
1Q
16
2Q
16
3Q
16
4Q
16
1Q
17
2Q
17
3Q
17
4Q
17
1Q
18
2Q
18
3Q
18
4Q
18
1Q
19
2Q
19
3Q
19
4Q
19
1Q
20
Lo
ad F
acto
r (%
)
32
9
30
8
31
5
32
1
31
8
30
8 32
8
33
6
32
9
30
5
30
3
31
4
29
9
31
1
32
4
30
2
31
5
28
7 31
0
28
7
27
7
27
4
28
2
28
3 30
8
100
130
160
190
220
250
280
310
340
370
400
1Q
14
2Q
14
3Q
14
4Q
14
1Q
15
2Q
15
3Q
15
4Q
15
1Q
16
2Q
16
3Q
16
4Q
16
1Q
17
2Q
17
3Q
17
4Q
17
1Q
18
2Q
18
3Q
18
4Q
18
1Q
19
2Q
19
3Q
19
4Q
19
1Q
20
Av
erag
e F
are
(RM
)
WAYPOINT
MALAYSIAN AVIATION COMMISSION ● JUNE 2020 25
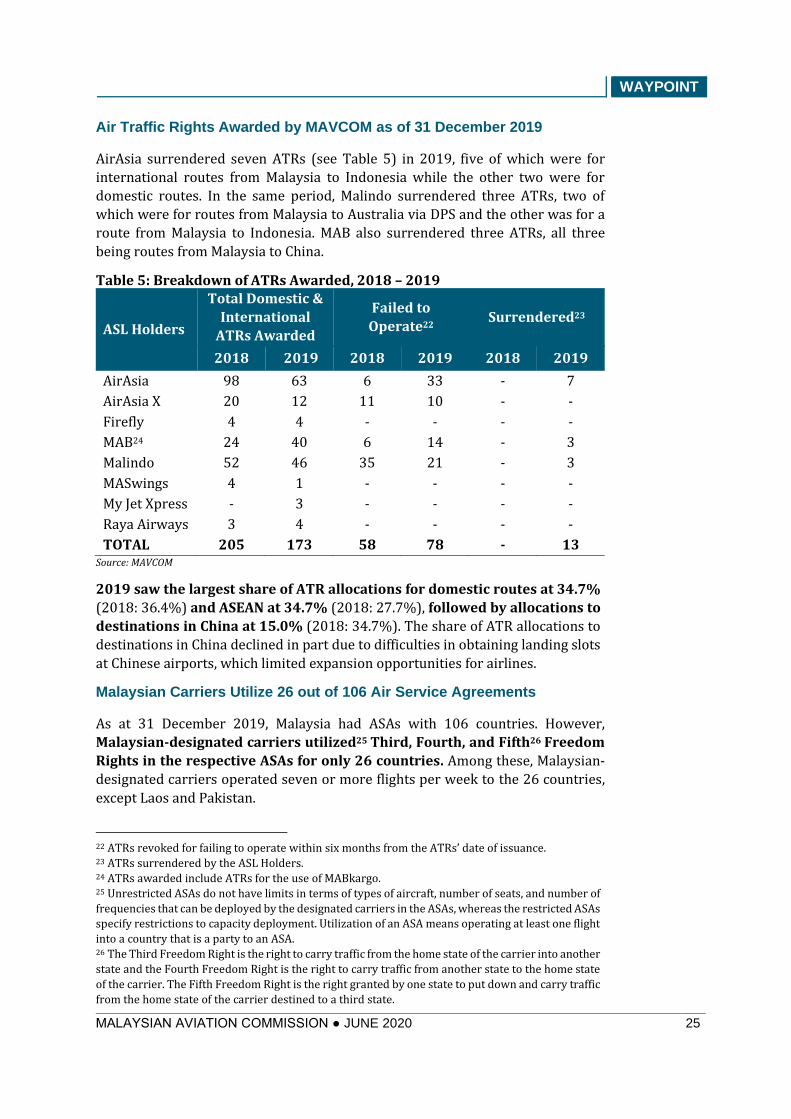
Air Traffic Rights Awarded by MAVCOM as of 31 December 2019
AirAsia surrendered seven ATRs (see Table 5) in 2019, five of which were for
international routes from Malaysia to Indonesia while the other two were for
domestic routes. In the same period, Malindo surrendered three ATRs, two of
which were for routes from Malaysia to Australia via DPS and the other was for a
route from Malaysia to Indonesia. MAB also surrendered three ATRs, all three
being routes from Malaysia to China.
Table 5: Breakdown of ATRs Awarded, 2018 – 2019
ASL Holders
Total Domestic &
International
ATRs Awarded
Failed to
Operate22 Surrendered23
2018 2019 2018 2019 2018 2019
AirAsia 98 63 6 33 - 7
AirAsia X 20 12 11 10 - -
Firefly 4 4 - - - -
MAB24 24 40 6 14 - 3
Malindo 52 46 35 21 - 3
MASwings 4 1 - - - -
My Jet Xpress - 3 - - - -
Raya Airways 3 4 - - - -
TOTAL 205 173 58 78 - 13 Source: MAVCOM
2019 saw the largest share of ATR allocations for domestic routes at 34.7%
(2018: 36.4%) and ASEAN at 34.7% (2018: 27.7%), followed by allocations to
destinations in China at 15.0% (2018: 34.7%). The share of ATR allocations to
destinations in China declined in part due to difficulties in obtaining landing slots
at Chinese airports, which limited expansion opportunities for airlines.
Malaysian Carriers Utilize 26 out of 106 Air Service Agreements
As at 31 December 2019, Malaysia had ASAs with 106 countries. However,
Malaysian-designated carriers utilized25 Third, Fourth, and Fifth26 Freedom
Rights in the respective ASAs for only 26 countries. Among these, Malaysian-
designated carriers operated seven or more flights per week to the 26 countries,
except Laos and Pakistan.
22 ATRs revoked for failing to operate within six months from the ATRs’ date of issuance. 23 ATRs surrendered by the ASL Holders. 24 ATRs awarded include ATRs for the use of MABkargo. 25 Unrestricted ASAs do not have limits in terms of types of aircraft, number of seats, and number of
frequencies that can be deployed by the designated carriers in the ASAs, whereas the restricted ASAs
specify restrictions to capacity deployment. Utilization of an ASA means operating at least one flight
into a country that is a party to an ASA. 26 The Third Freedom Right is the right to carry traffic from the home state of the carrier into another
state and the Fourth Freedom Right is the right to carry traffic from another state to the home state
of the carrier. The Fifth Freedom Right is the right granted by one state to put down and carry traffic
from the home state of the carrier destined to a third state.
WAYPOINT
MALAYSIAN AVIATION COMMISSION ● JUNE 2020 26
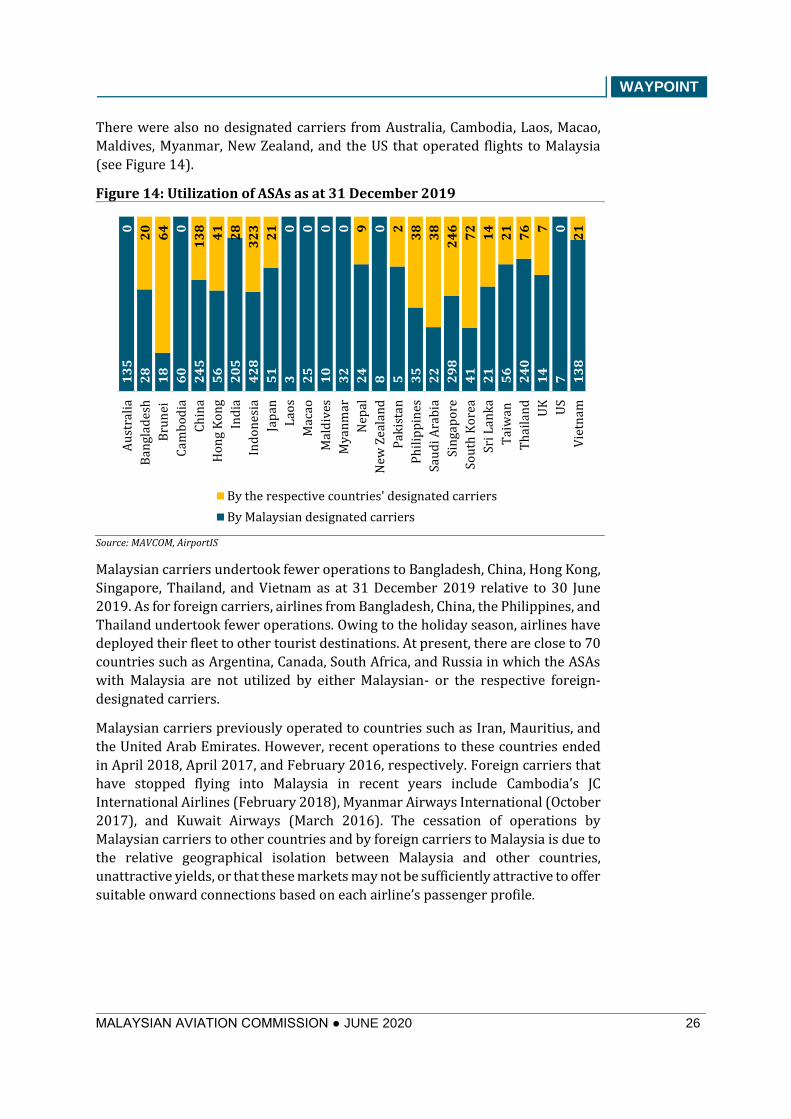
There were also no designated carriers from Australia, Cambodia, Laos, Macao,
Maldives, Myanmar, New Zealand, and the US that operated flights to Malaysia
(see Figure 14).
Figure 14: Utilization of ASAs as at 31 December 2019
Source: MAVCOM, AirportIS
Malaysian carriers undertook fewer operations to Bangladesh, China, Hong Kong,
Singapore, Thailand, and Vietnam as at 31 December 2019 relative to 30 June
2019. As for foreign carriers, airlines from Bangladesh, China, the Philippines, and
Thailand undertook fewer operations. Owing to the holiday season, airlines have deployed their fleet to other tourist destinations. At present, there are close to 70
countries such as Argentina, Canada, South Africa, and Russia in which the ASAs
with Malaysia are not utilized by either Malaysian- or the respective foreign-
designated carriers.
Malaysian carriers previously operated to countries such as Iran, Mauritius, and
the United Arab Emirates. However, recent operations to these countries ended
in April 2018, April 2017, and February 2016, respectively. Foreign carriers that
have stopped flying into Malaysia in recent years include Cambodia’s JC
International Airlines (February 2018), Myanmar Airways International (October
2017), and Kuwait Airways (March 2016). The cessation of operations by
Malaysian carriers to other countries and by foreign carriers to Malaysia is due to
the relative geographical isolation between Malaysia and other countries,
unattractive yields, or that these markets may not be sufficiently attractive to offer
suitable onward connections based on each airline’s passenger profile.
13
5
28
18
60
24
5
56
20
5
42
8
51
3 25
10
32
24
8 5 35
22
29
8
41
21
56
24
0
14
7 13
8
0
20
64 0
13
8
41
28
32
3
21 0 0 0 0 9 0 2
38
38
24
6
72
14
21
76 7 0
21
Au
stra
lia
Ban
glad
esh
Bru
nei
Cam
bo
dia
Ch
ina
Ho
ng
Ko
ng
Ind
ia
Ind
on
esia
Jap
an
Lao
s
Mac
ao
Mal
div
es
My
anm
ar
Nep
al
New
Zea
lan
d
Pak
ista
n
Ph
ilip
pin
es
Sau
di
Ara
bia
Sin
gap
ore
Sou
th K
ore
a
Sri L
ank
a
Tai
wan
Th
aila
nd
UK
US
Vie
tnam
By the respective countries' designated carriers
By Malaysian designated carriers
WAYPOINT
MALAYSIAN AVIATION COMMISSION ● JUNE 2020 27
SECTION 4: AIR CARGO OPERATIONS AND COVID-19
Air cargo plays a crucial role in transporting essential goods and maintaining
global value chains in the current pandemic. Airlines have been increasing air
cargo operations due to the rising demand—partly contributed by growing
e-commerce transactions—amid a decline in belly cargo capacity from
reduced passenger services segment. This section presents an overview of the
Malaysian air cargo market and changes in operations due to COVID-19.
Air Cargo Operations in Malaysia
Air Service Licence or Air Service Permit is Required for Cargo Operations in Malaysia
Generally, air cargo involves the transport of freight and mail. The cargo is carried
on full-freight aircraft, passenger aircraft (belly cargo), and Road Feeder
Services27. ICAO includes cargo operations as part of commercial air transport
services, one of the nine services categorized as civil aviation activities. In
Malaysia, Act 771 defines air transport service as “a commercial air service that is
operated for the purpose of transporting persons, personal belongings, baggage,
goods or cargo in an aircraft between two points”. Air transport operations
involving cargo carriage in Malaysia require either an ASL or ASP. The details
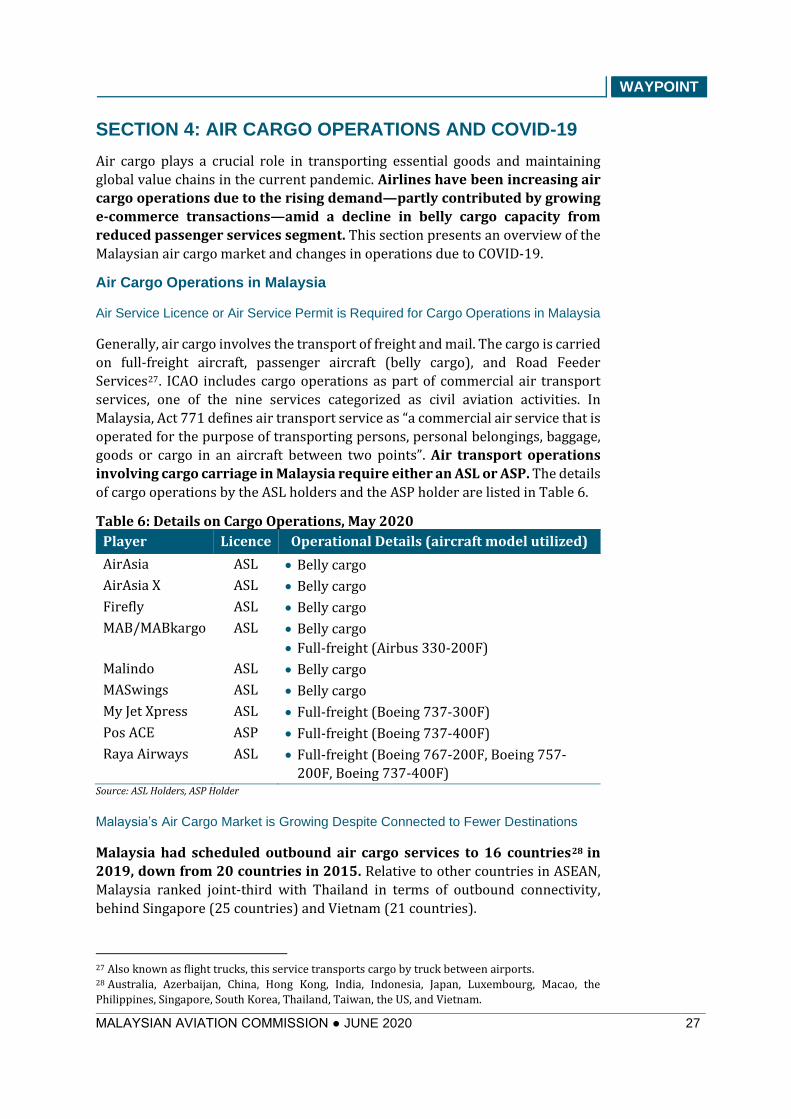
of cargo operations by the ASL holders and the ASP holder are listed in Table 6.
Table 6: Details on Cargo Operations, May 2020
Player Licence Operational Details (aircraft model utilized)
AirAsia ASL • Belly cargo
AirAsia X ASL • Belly cargo
Firefly ASL • Belly cargo
MAB/MABkargo ASL • Belly cargo
• Full-freight (Airbus 330-200F)
Malindo ASL • Belly cargo
MASwings ASL • Belly cargo
My Jet Xpress ASL • Full-freight (Boeing 737-300F)
Pos ACE ASP • Full-freight (Boeing 737-400F)
Raya Airways ASL • Full-freight (Boeing 767-200F, Boeing 757-
200F, Boeing 737-400F) Source: ASL Holders, ASP Holder
Malaysia’s Air Cargo Market is Growing Despite Connected to Fewer Destinations
Malaysia had scheduled outbound air cargo services to 16 countries28 in
2019, down from 20 countries in 2015. Relative to other countries in ASEAN,
Malaysia ranked joint-third with Thailand in terms of outbound connectivity,
behind Singapore (25 countries) and Vietnam (21 countries).
27 Also known as flight trucks, this service transports cargo by truck between airports. 28 Australia, Azerbaijan, China, Hong Kong, India, Indonesia, Japan, Luxembourg, Macao, the
Philippines, Singapore, South Korea, Thailand, Taiwan, the US, and Vietnam.
WAYPOINT
MALAYSIAN AVIATION COMMISSION ● JUNE 2020 28
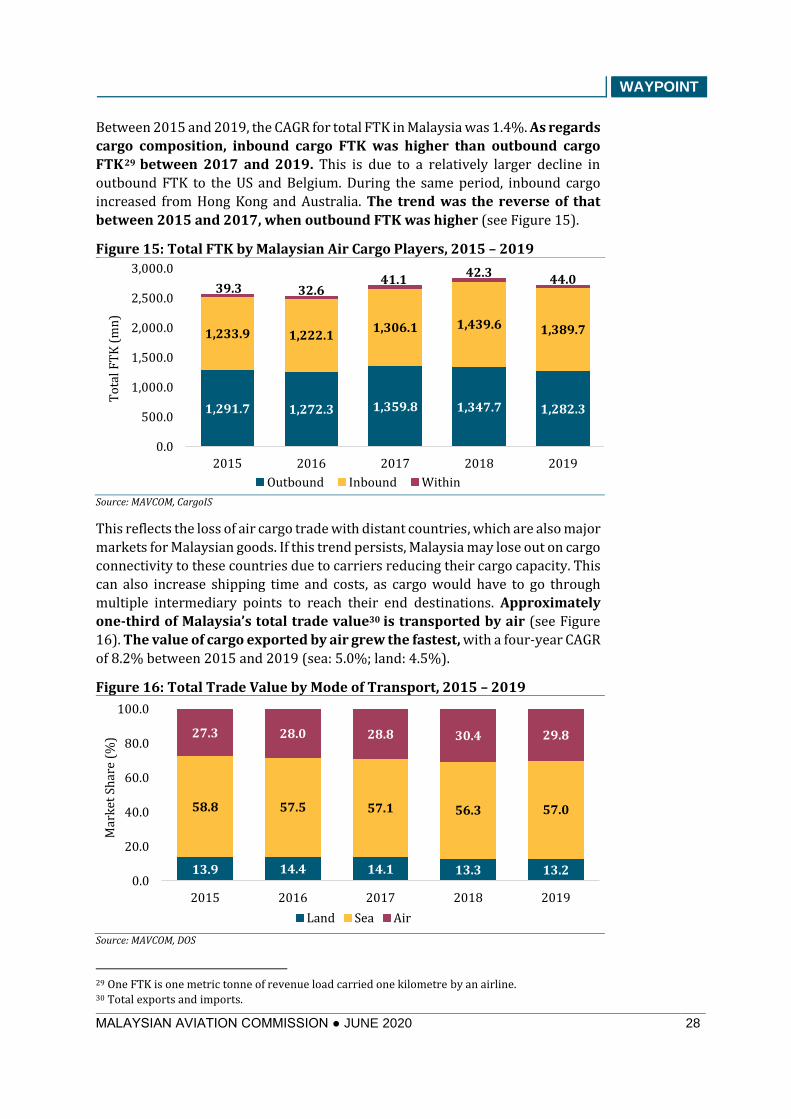
Between 2015 and 2019, the CAGR for total FTK in Malaysia was 1.4%. As regards
cargo composition, inbound cargo FTK was higher than outbound cargo
FTK29 between 2017 and 2019. This is due to a relatively larger decline in
outbound FTK to the US and Belgium. During the same period, inbound cargo
increased from Hong Kong and Australia. The trend was the reverse of that
between 2015 and 2017, when outbound FTK was higher (see Figure 15).
Figure 15: Total FTK by Malaysian Air Cargo Players, 2015 – 2019
Source: MAVCOM, CargoIS
This reflects the loss of air cargo trade with distant countries, which are also major
markets for Malaysian goods. If this trend persists, Malaysia may lose out on cargo
connectivity to these countries due to carriers reducing their cargo capacity. This
can also increase shipping time and costs, as cargo would have to go through
multiple intermediary points to reach their end destinations. Approximately
one-third of Malaysia’s total trade value30 is transported by air (see Figure
16). The value of cargo exported by air grew the fastest, with a four-year CAGR
of 8.2% between 2015 and 2019 (sea: 5.0%; land: 4.5%).
Figure 16: Total Trade Value by Mode of Transport, 2015 – 2019
Source: MAVCOM, DOS
29 One FTK is one metric tonne of revenue load carried one kilometre by an airline. 30 Total exports and imports.
1,291.7 1,272.3 1,359.8 1,347.7 1,282.3
1,233.9 1,222.11,306.1 1,439.6 1,389.7
39.3 32.641.1
42.344.0
0.0
500.0
1,000.0
1,500.0
2,000.0
2,500.0
3,000.0
2015 2016 2017 2018 2019
To
tal
FT
K (
mn
)
Outbound Inbound Within
13.9 14.4 14.1 13.3 13.2
58.8 57.5 57.1 56.3 57.0
27.3 28.0 28.8 30.4 29.8
0.0
20.0
40.0
60.0
80.0
100.0
2015 2016 2017 2018 2019
Mar
ket
Sh
are
(%)
Land Sea Air
WAYPOINT
MALAYSIAN AVIATION COMMISSION ● JUNE 2020 29
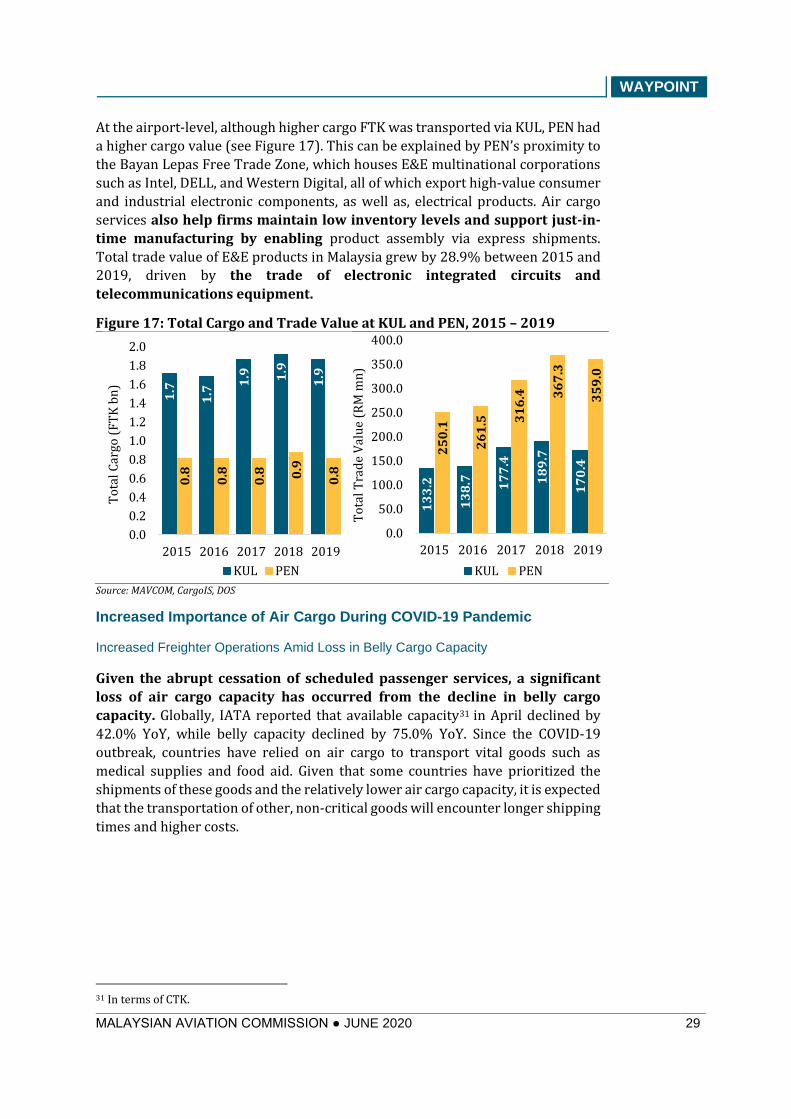
At the airport-level, although higher cargo FTK was transported via KUL, PEN had
a higher cargo value (see Figure 17). This can be explained by PEN’s proximity to
the Bayan Lepas Free Trade Zone, which houses E&E multinational corporations
such as Intel, DELL, and Western Digital, all of which export high-value consumer
and industrial electronic components, as well as, electrical products. Air cargo
services also help firms maintain low inventory levels and support just-in-
time manufacturing by enabling product assembly via express shipments.
Total trade value of E&E products in Malaysia grew by 28.9% between 2015 and
2019, driven by the trade of electronic integrated circuits and
telecommunications equipment.
Figure 17: Total Cargo and Trade Value at KUL and PEN, 2015 – 2019
Source: MAVCOM, CargoIS, DOS
Increased Importance of Air Cargo During COVID-19 Pandemic
Increased Freighter Operations Amid Loss in Belly Cargo Capacity
Given the abrupt cessation of scheduled passenger services, a significant
loss of air cargo capacity has occurred from the decline in belly cargo
capacity. Globally, IATA reported that available capacity31 in April declined by
42.0% YoY, while belly capacity declined by 75.0% YoY. Since the COVID-19
outbreak, countries have relied on air cargo to transport vital goods such as
medical supplies and food aid. Given that some countries have prioritized the
shipments of these goods and the relatively lower air cargo capacity, it is expected
that the transportation of other, non-critical goods will encounter longer shipping
times and higher costs.
31 In terms of CTK.
1.7
1.7
1.9 1.9
1.9
0.8
0.8
0.8 0
.9
0.8
0.0
0.2
0.4
0.6
0.8
1.0
1.2
1.4
1.6
1.8
2.0
2015 2016 2017 2018 2019
To
tal
Car
go (
FT
K b
n)
KUL PEN
13
3.2
13
8.7 17
7.4
18
9.7
17
0.4
25
0.1
26
1.5 3
16
.4 36
7.3
35
9.0
0.0
50.0
100.0
150.0
200.0
250.0
300.0
350.0
400.0
2015 2016 2017 2018 2019
To
tal
Tra
de
Val
ue
(RM
mn
)
KUL PEN
WAYPOINT
MALAYSIAN AVIATION COMMISSION ● JUNE 2020 30
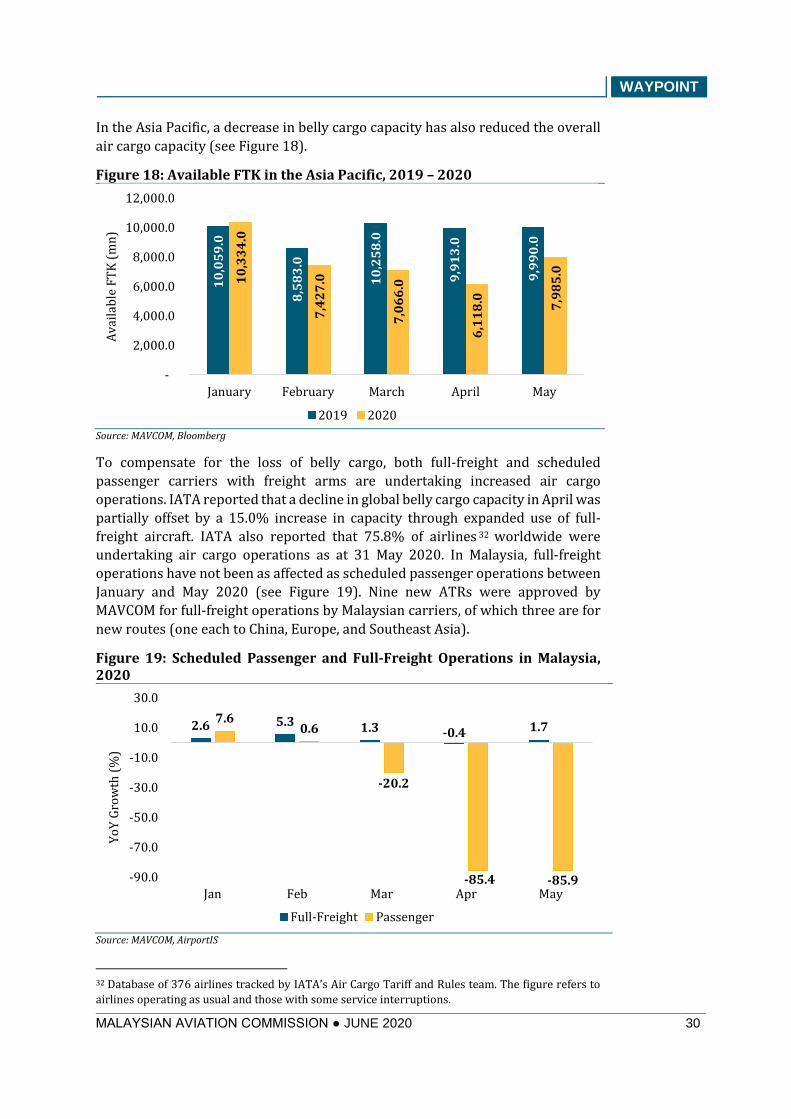
In the Asia Pacific, a decrease in belly cargo capacity has also reduced the overall
air cargo capacity (see Figure 18).
Figure 18: Available FTK in the Asia Pacific, 2019 – 2020
Source: MAVCOM, Bloomberg
To compensate for the loss of belly cargo, both full-freight and scheduled
passenger carriers with freight arms are undertaking increased air cargo
operations. IATA reported that a decline in global belly cargo capacity in April was
partially offset by a 15.0% increase in capacity through expanded use of full-
freight aircraft. IATA also reported that 75.8% of airlines 32 worldwide were
undertaking air cargo operations as at 31 May 2020. In Malaysia, full-freight
operations have not been as affected as scheduled passenger operations between
January and May 2020 (see Figure 19). Nine new ATRs were approved by
MAVCOM for full-freight operations by Malaysian carriers, of which three are for
new routes (one each to China, Europe, and Southeast Asia).
Figure 19: Scheduled Passenger and Full-Freight Operations in Malaysia, 2020
Source: MAVCOM, AirportIS
32 Database of 376 airlines tracked by IATA’s Air Cargo Tariff and Rules team. The figure refers to
airlines operating as usual and those with some service interruptions.
10
,05
9.0
8,5
83
.0
10
,25
8.0
9,9
13
.0
9,9
90
.0
10
,33
4.0
7,4
27
.0
7,0
66
.0
6,1
18
.0
7,9
85
.0
-
2,000.0
4,000.0
6,000.0
8,000.0
10,000.0
12,000.0
January February March April May
Av
aila
ble
FT
K (
mn
)
2019 2020
2.6 5.3 1.3 -0.4 1.77.6
0.6
-20.2
-85.4 -85.9-90.0
-70.0
-50.0
-30.0
-10.0
10.0
30.0
Jan Feb Mar Apr May
Yo
Y G
row
th (
%)
Full-Freight Passenger
WAYPOINT
MALAYSIAN AVIATION COMMISSION ● JUNE 2020 31
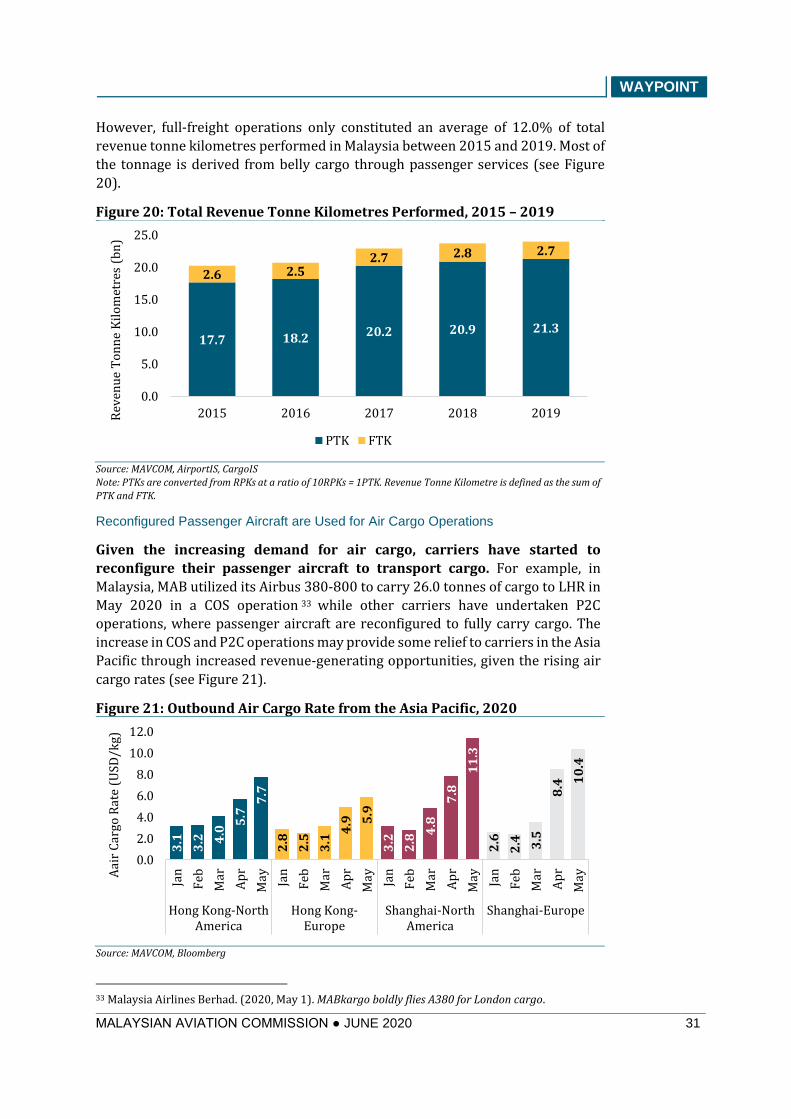
However, full-freight operations only constituted an average of 12.0% of total
revenue tonne kilometres performed in Malaysia between 2015 and 2019. Most of
the tonnage is derived from belly cargo through passenger services (see Figure
20).
Figure 20: Total Revenue Tonne Kilometres Performed, 2015 – 2019
Source: MAVCOM, AirportIS, CargoIS
Note: PTKs are converted from RPKs at a ratio of 10RPKs = 1PTK. Revenue Tonne Kilometre is defined as the sum of
PTK and FTK.
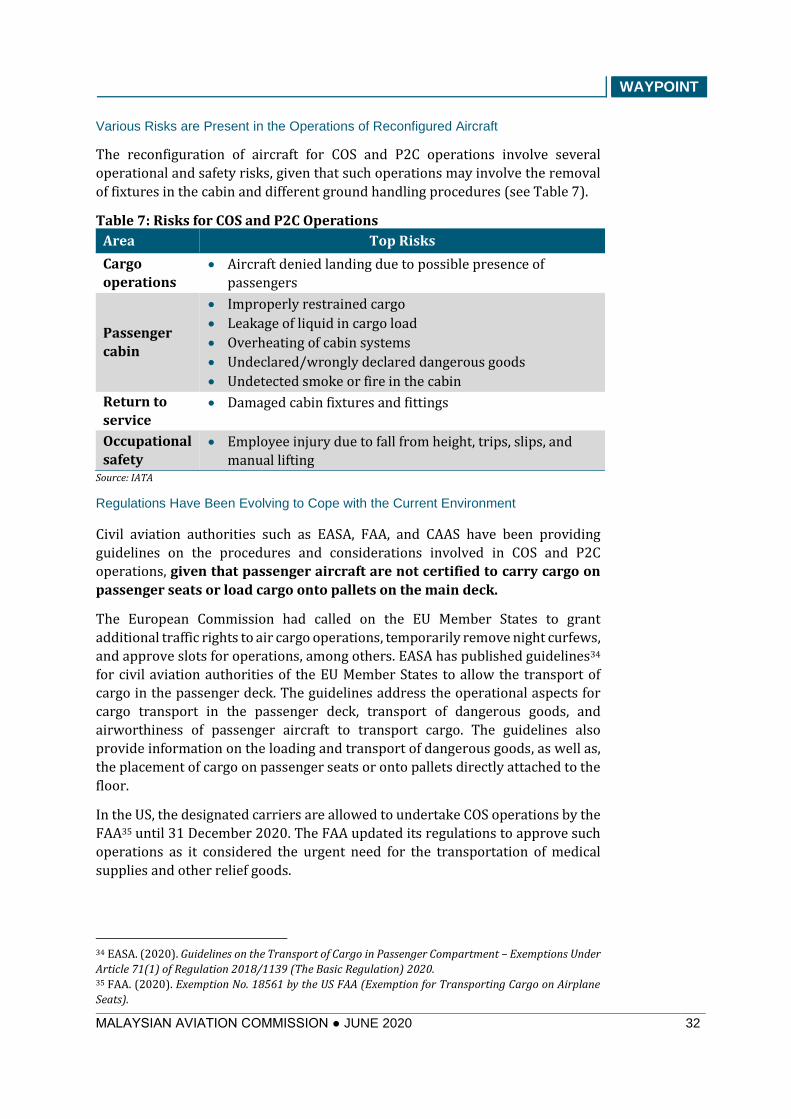
Reconfigured Passenger Aircraft are Used for Air Cargo Operations
Given the increasing demand for air cargo, carriers have started to
reconfigure their passenger aircraft to transport cargo. For example, in
Malaysia, MAB utilized its Airbus 380-800 to carry 26.0 tonnes of cargo to LHR in
May 2020 in a COS operation 33 while other carriers have undertaken P2C
operations, where passenger aircraft are reconfigured to fully carry cargo. The
increase in COS and P2C operations may provide some relief to carriers in the Asia
Pacific through increased revenue-generating opportunities, given the rising air
cargo rates (see Figure 21).
Figure 21: Outbound Air Cargo Rate from the Asia Pacific, 2020
Source: MAVCOM, Bloomberg
33 Malaysia Airlines Berhad. (2020, May 1). MABkargo boldly flies A380 for London cargo.
17.7 18.2 20.2 20.9 21.3
2.6 2.52.7 2.8 2.7
0.0
5.0
10.0
15.0
20.0
25.0
2015 2016 2017 2018 2019Rev
enu
e T
on
ne
Kil
om
etre
s (b
n)
PTK FTK
3.1
3.2 4
.0
5.7
7.7
2.8
2.5
3.1
4.9 5
.9
3.2
2.8
4.8
7.8
11
.3
2.6
2.4 3.5
8.4 1
0.4
0.0
2.0
4.0
6.0
8.0
10.0
12.0
Jan
Feb
Mar
Ap
r
May Jan
Feb
Mar
Ap
r
May Jan
Feb
Mar
Ap
r
May Jan
Feb
Mar
Ap
r
May
Hong Kong-NorthAmerica
Hong Kong-Europe
Shanghai-NorthAmerica
Shanghai-Europe
Aai
r C
argo
Rat
e (U
SD/k
g)
WAYPOINT
MALAYSIAN AVIATION COMMISSION ● JUNE 2020 32
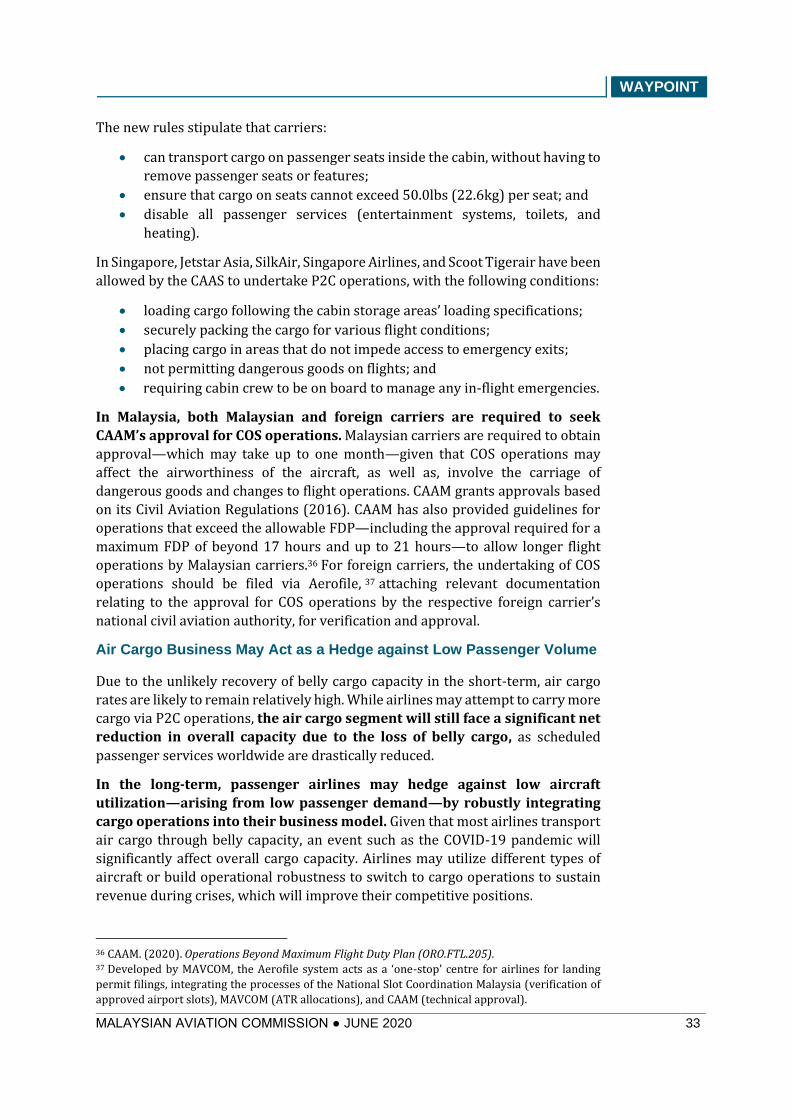
Various Risks are Present in the Operations of Reconfigured Aircraft
The reconfiguration of aircraft for COS and P2C operations involve several
operational and safety risks, given that such operations may involve the removal
of fixtures in the cabin and different ground handling procedures (see Table 7).
Table 7: Risks for COS and P2C Operations
Area Top Risks
Cargo
operations • Aircraft denied landing due to possible presence of
passengers
Passenger
cabin
• Improperly restrained cargo
• Leakage of liquid in cargo load
• Overheating of cabin systems
• Undeclared/wrongly declared dangerous goods
• Undetected smoke or fire in the cabin
Return to
service • Damaged cabin fixtures and fittings
Occupational
safety • Employee injury due to fall from height, trips, slips, and
manual lifting Source: IATA
Regulations Have Been Evolving to Cope with the Current Environment
Civil aviation authorities such as EASA, FAA, and CAAS have been providing
guidelines on the procedures and considerations involved in COS and P2C
operations, given that passenger aircraft are not certified to carry cargo on
passenger seats or load cargo onto pallets on the main deck.
The European Commission had called on the EU Member States to grant
additional traffic rights to air cargo operations, temporarily remove night curfews,
and approve slots for operations, among others. EASA has published guidelines34
for civil aviation authorities of the EU Member States to allow the transport of cargo in the passenger deck. The guidelines address the operational aspects for
cargo transport in the passenger deck, transport of dangerous goods, and
airworthiness of passenger aircraft to transport cargo. The guidelines also
provide information on the loading and transport of dangerous goods, as well as,
the placement of cargo on passenger seats or onto pallets directly attached to the
floor.
In the US, the designated carriers are allowed to undertake COS operations by the
FAA35 until 31 December 2020. The FAA updated its regulations to approve such
operations as it considered the urgent need for the transportation of medical
supplies and other relief goods.
34 EASA. (2020). Guidelines on the Transport of Cargo in Passenger Compartment – Exemptions Under
Article 71(1) of Regulation 2018/1139 (The Basic Regulation) 2020. 35 FAA. (2020). Exemption No. 18561 by the US FAA (Exemption for Transporting Cargo on Airplane
Seats).
WAYPOINT
MALAYSIAN AVIATION COMMISSION ● JUNE 2020 33
The new rules stipulate that carriers:
• can transport cargo on passenger seats inside the cabin, without having to
remove passenger seats or features;
• ensure that cargo on seats cannot exceed 50.0lbs (22.6kg) per seat; and
• disable all passenger services (entertainment systems, toilets, and
heating).
In Singapore, Jetstar Asia, SilkAir, Singapore Airlines, and Scoot Tigerair have been
allowed by the CAAS to undertake P2C operations, with the following conditions:
• loading cargo following the cabin storage areas’ loading specifications;
• securely packing the cargo for various flight conditions;
• placing cargo in areas that do not impede access to emergency exits;
• not permitting dangerous goods on flights; and
• requiring cabin crew to be on board to manage any in-flight emergencies.
In Malaysia, both Malaysian and foreign carriers are required to seek
CAAM’s approval for COS operations. Malaysian carriers are required to obtain
approval—which may take up to one month—given that COS operations may
affect the airworthiness of the aircraft, as well as, involve the carriage of
dangerous goods and changes to flight operations. CAAM grants approvals based
on its Civil Aviation Regulations (2016). CAAM has also provided guidelines for
operations that exceed the allowable FDP—including the approval required for a
maximum FDP of beyond 17 hours and up to 21 hours—to allow longer flight
operations by Malaysian carriers.36 For foreign carriers, the undertaking of COS
operations should be filed via Aerofile, 37 attaching relevant documentation
relating to the approval for COS operations by the respective foreign carrier’s
national civil aviation authority, for verification and approval.
Air Cargo Business May Act as a Hedge against Low Passenger Volume
Due to the unlikely recovery of belly cargo capacity in the short-term, air cargo
rates are likely to remain relatively high. While airlines may attempt to carry more
cargo via P2C operations, the air cargo segment will still face a significant net
reduction in overall capacity due to the loss of belly cargo, as scheduled
passenger services worldwide are drastically reduced.
In the long-term, passenger airlines may hedge against low aircraft
utilization—arising from low passenger demand—by robustly integrating
cargo operations into their business model. Given that most airlines transport
air cargo through belly capacity, an event such as the COVID-19 pandemic will
significantly affect overall cargo capacity. Airlines may utilize different types of
aircraft or build operational robustness to switch to cargo operations to sustain
revenue during crises, which will improve their competitive positions.
36 CAAM. (2020). Operations Beyond Maximum Flight Duty Plan (ORO.FTL.205). 37 Developed by MAVCOM, the Aerofile system acts as a ‘one-stop’ centre for airlines for landing
permit filings, integrating the processes of the National Slot Coordination Malaysia (verification of
approved airport slots), MAVCOM (ATR allocations), and CAAM (technical approval).
WAYPOINT
MALAYSIAN AVIATION COMMISSION ● JUNE 2020 34
APPENDIX A: DATA TABLES
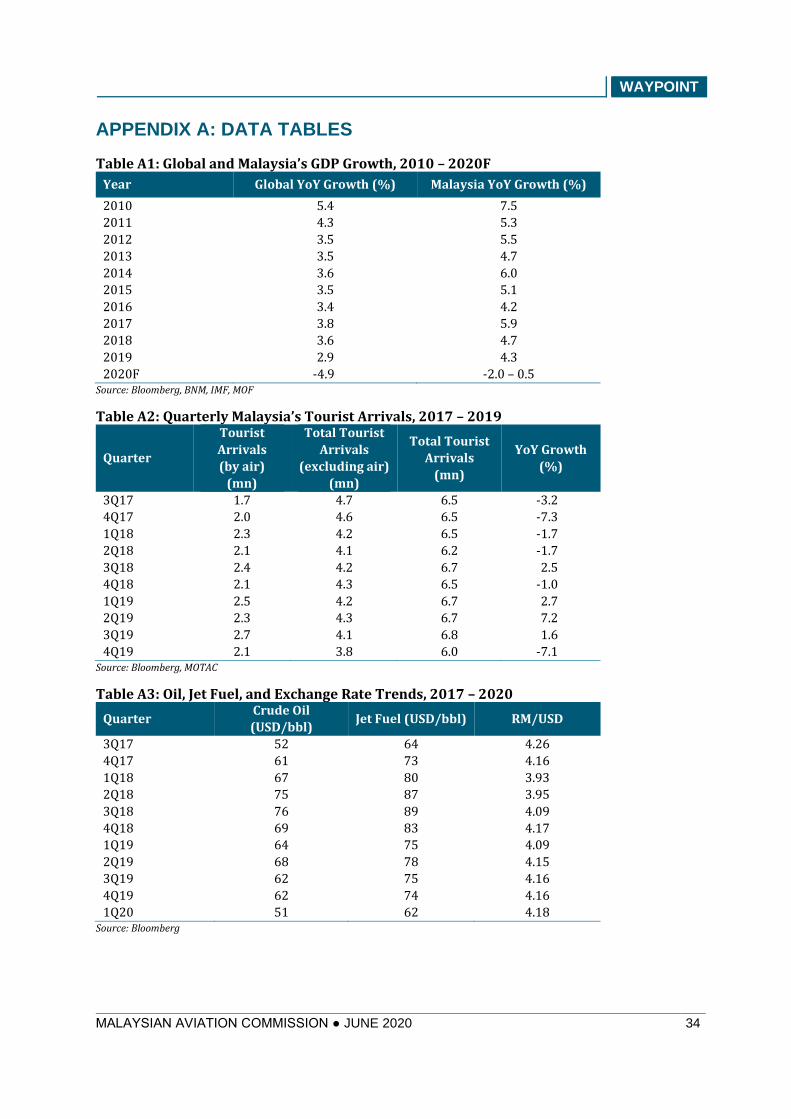
Table A1: Global and Malaysia’s GDP Growth, 2010 – 2020F
Year Global YoY Growth (%) Malaysia YoY Growth (%)
2010 5.4 7.5 2011 4.3 5.3 2012 3.5 5.5 2013 3.5 4.7 2014 3.6 6.0 2015 3.5 5.1 2016 3.4 4.2 2017 3.8 5.9 2018 3.6 4.7 2019 2.9 4.3 2020F -4.9 -2.0 – 0.5
Source: Bloomberg, BNM, IMF, MOF
Table A2: Quarterly Malaysia’s Tourist Arrivals, 2017 – 2019
Quarter
Tourist
Arrivals
(by air)
(mn)
Total Tourist
Arrivals
(excluding air)
(mn)
Total Tourist
Arrivals (mn)
YoY Growth
(%)
3Q17 1.7 4.7 6.5 -3.2 4Q17 2.0 4.6 6.5 -7.3 1Q18 2.3 4.2 6.5 -1.7 2Q18 2.1 4.1 6.2 -1.7 3Q18 2.4 4.2 6.7 2.5 4Q18 2.1 4.3 6.5 -1.0 1Q19 2.5 4.2 6.7 2.7 2Q19 2.3 4.3 6.7 7.2 3Q19 2.7 4.1 6.8 1.6
4Q19 2.1 3.8 6.0 -7.1 Source: Bloomberg, MOTAC
Table A3: Oil, Jet Fuel, and Exchange Rate Trends, 2017 – 2020
Quarter Crude Oil
(USD/bbl) Jet Fuel (USD/bbl) RM/USD
3Q17 52 64 4.26 4Q17 61 73 4.16 1Q18 67 80 3.93 2Q18 75 87 3.95 3Q18 76 89 4.09 4Q18 69 83 4.17 1Q19 64 75 4.09 2Q19 68 78 4.15 3Q19 62 75 4.16
4Q19 62 74 4.16
1Q20 51 62 4.18 Source: Bloomberg
WAYPOINT
MALAYSIAN AVIATION COMMISSION ● JUNE 2020 35
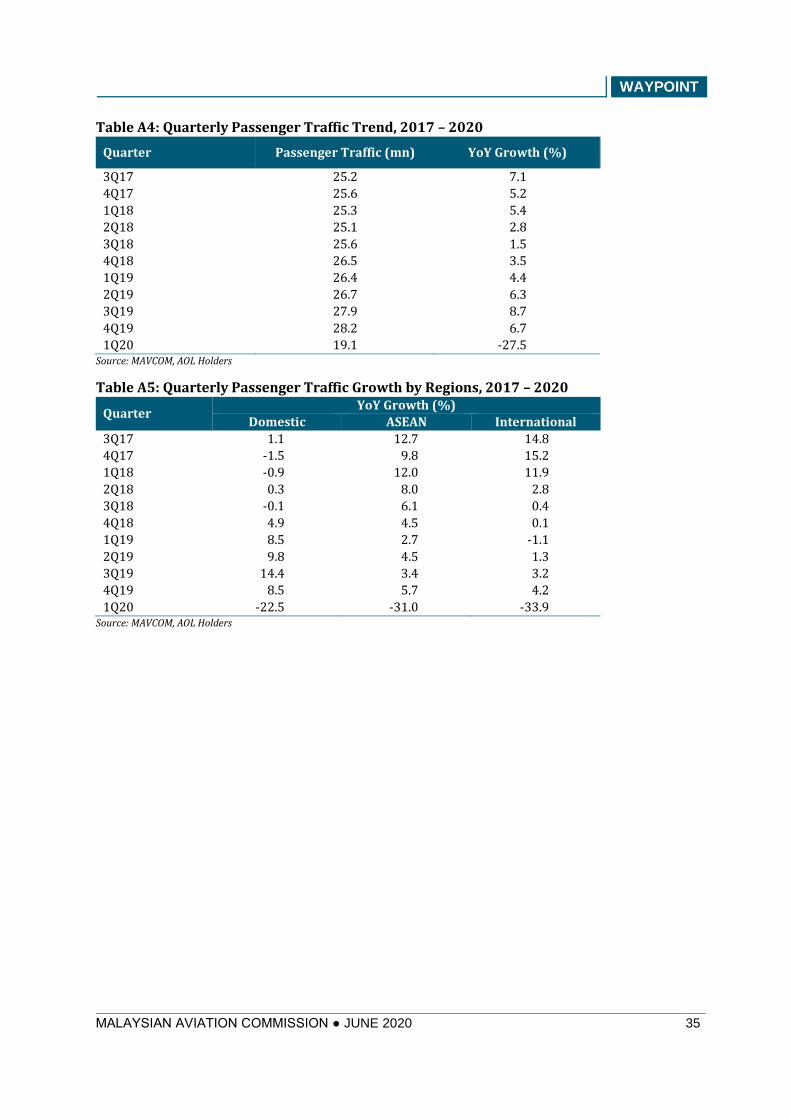
Table A4: Quarterly Passenger Traffic Trend, 2017 – 2020
Quarter Passenger Traffic (mn) YoY Growth (%)
3Q17 25.2 7.1 4Q17 25.6 5.2 1Q18 25.3 5.4 2Q18 25.1 2.8 3Q18 25.6 1.5 4Q18 26.5 3.5 1Q19 26.4 4.4 2Q19 26.7 6.3 3Q19 27.9 8.7
4Q19 28.2 6.7
1Q20 19.1 -27.5 Source: MAVCOM, AOL Holders
Table A5: Quarterly Passenger Traffic Growth by Regions, 2017 – 2020
Quarter YoY Growth (%)
Domestic ASEAN International
3Q17 1.1 12.7 14.8 4Q17 -1.5 9.8 15.2 1Q18 -0.9 12.0 11.9 2Q18 0.3 8.0 2.8 3Q18 -0.1 6.1 0.4 4Q18 4.9 4.5 0.1 1Q19 8.5 2.7 -1.1 2Q19 9.8 4.5 1.3 3Q19 14.4 3.4 3.2
4Q19 8.5 5.7 4.2
1Q20 -22.5 -31.0 -33.9 Source: MAVCOM, AOL Holders
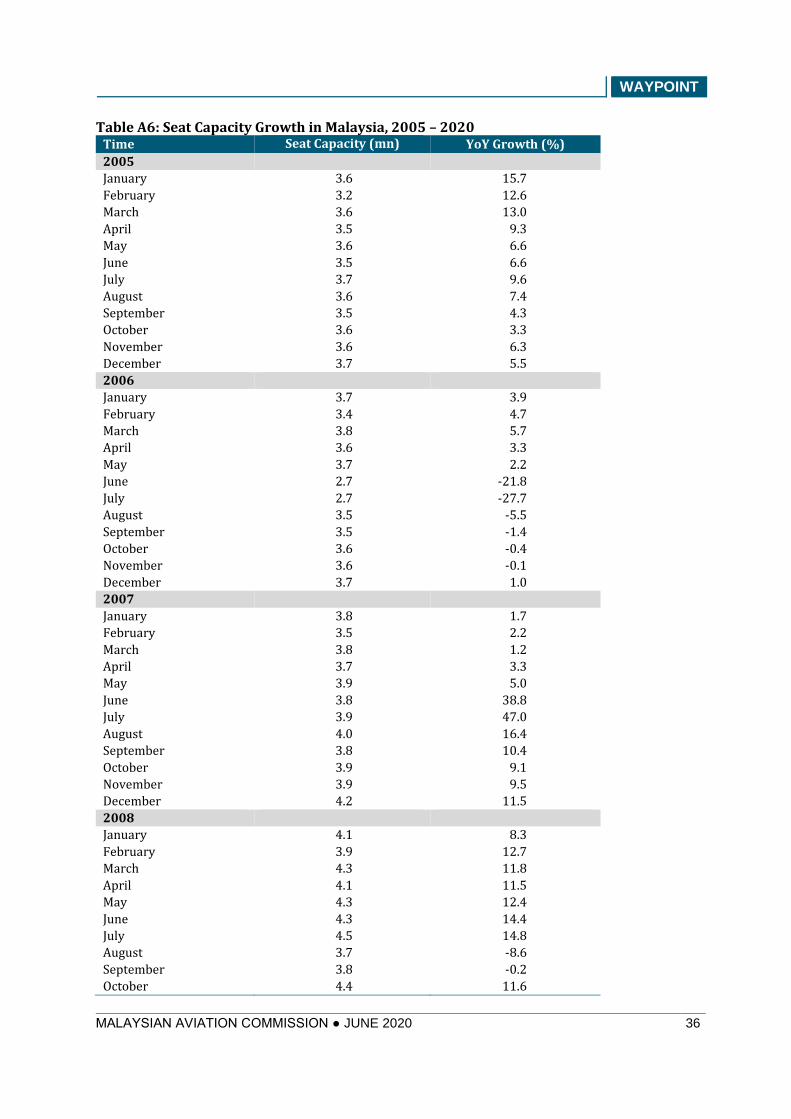
WAYPOINT
MALAYSIAN AVIATION COMMISSION ● JUNE 2020 36
Table A6: Seat Capacity Growth in Malaysia, 2005 – 2020 Time Seat Capacity (mn) YoY Growth (%) 2005
January 3.6 15.7
February 3.2 12.6
March 3.6 13.0
April 3.5 9.3
May 3.6 6.6
June 3.5 6.6
July 3.7 9.6
August 3.6 7.4
September 3.5 4.3
October 3.6 3.3
November 3.6 6.3
December 3.7 5.5
2006
January 3.7 3.9
February 3.4 4.7
March 3.8 5.7
April 3.6 3.3
May 3.7 2.2
June 2.7 -21.8
July 2.7 -27.7
August 3.5 -5.5
September 3.5 -1.4
October 3.6 -0.4
November 3.6 -0.1
December 3.7 1.0
2007
January 3.8 1.7
February 3.5 2.2
March 3.8 1.2
April 3.7 3.3
May 3.9 5.0
June 3.8 38.8
July 3.9 47.0
August 4.0 16.4
September 3.8 10.4
October 3.9 9.1
November 3.9 9.5
December 4.2 11.5
2008
January 4.1 8.3
February 3.9 12.7
March 4.3 11.8
April 4.1 11.5
May 4.3 12.4
June 4.3 14.4
July 4.5 14.8
August 3.7 -8.6
September 3.8 -0.2
October 4.4 11.6
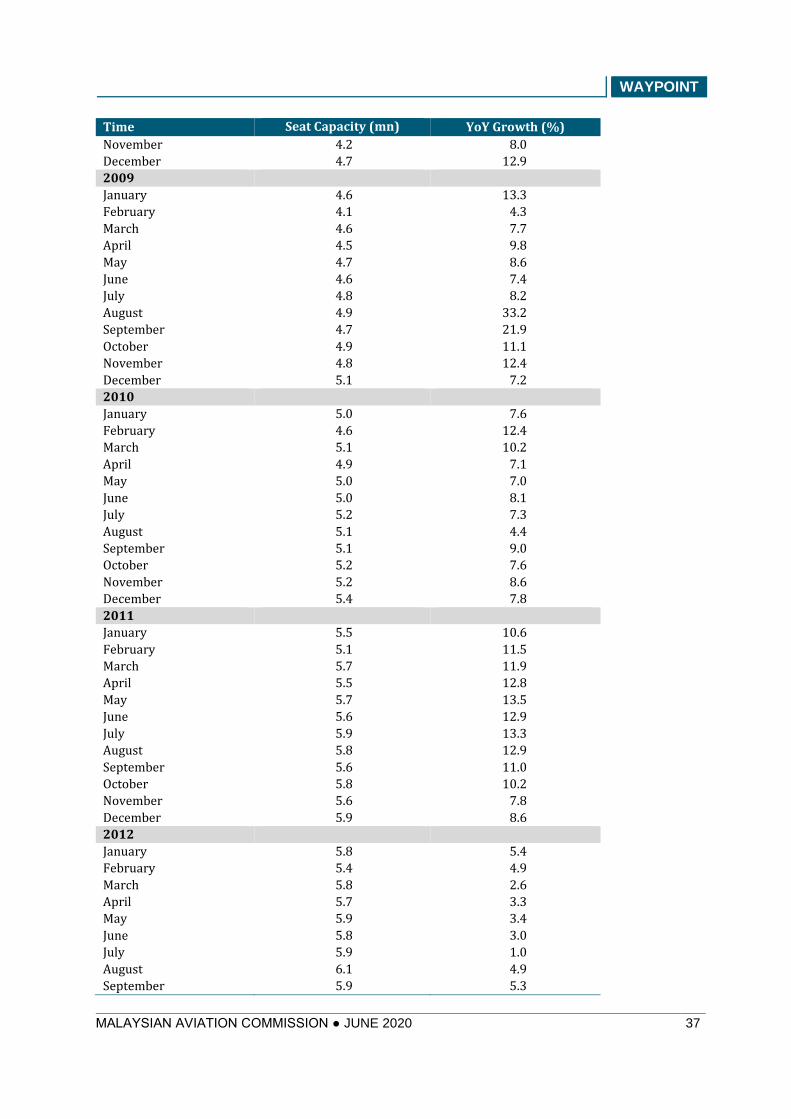
WAYPOINT
MALAYSIAN AVIATION COMMISSION ● JUNE 2020 37
Time Seat Capacity (mn) YoY Growth (%) November 4.2 8.0
December 4.7 12.9
2009
January 4.6 13.3
February 4.1 4.3
March 4.6 7.7
April 4.5 9.8
May 4.7 8.6
June 4.6 7.4
July 4.8 8.2
August 4.9 33.2
September 4.7 21.9
October 4.9 11.1
November 4.8 12.4
December 5.1 7.2
2010
January 5.0 7.6
February 4.6 12.4
March 5.1 10.2
April 4.9 7.1
May 5.0 7.0
June 5.0 8.1
July 5.2 7.3
August 5.1 4.4
September 5.1 9.0
October 5.2 7.6
November 5.2 8.6
December 5.4 7.8
2011
January 5.5 10.6
February 5.1 11.5
March 5.7 11.9
April 5.5 12.8
May 5.7 13.5
June 5.6 12.9
July 5.9 13.3
August 5.8 12.9
September 5.6 11.0
October 5.8 10.2
November 5.6 7.8
December 5.9 8.6
2012
January 5.8 5.4
February 5.4 4.9
March 5.8 2.6
April 5.7 3.3
May 5.9 3.4
June 5.8 3.0
July 5.9 1.0
August 6.1 4.9
September 5.9 5.3

WAYPOINT
MALAYSIAN AVIATION COMMISSION ● JUNE 2020 38
Time Seat Capacity (mn) YoY Growth (%) October 6.1 6.9
November 6.2 11.1
December 6.4 8.7
2013
January 6.4 9.5
February 6.0 11.4
March 6.6 13.4
April 6.6 15.5
May 6.7 14.0
June 6.7 15.9
July 6.9 16.8
August 7.3 20.3
September 6.9 16.9
October 7.2 17.0
November 7.1 14.7
December 7.6 18.3
2014
January 7.5 17.7
February 6.7 11.6
March 7.4 12.0
April 7.2 9.9
May 7.5 10.9
June 7.3 7.8
July 7.2 4.3
August 7.4 2.3
September 7.2 4.3
October 7.5 4.6
November 7.6 7.1
December 8.1 6.8
2015
January 7.8 4.5
February 7.2 7.1
March 7.9 6.8
April 7.6 4.9
May 7.8 3.7
June 7.3 0.3
July 7.7 6.7
August 7.6 2.7
September 7.3 1.4
October 7.5 -0.5
November 7.3 -4.8
December 7.7 -4.9
2016
January 7.5 -3.9
February 7.1 -1.4
March 7.5 -5.2
April 7.2 -4.8
May 7.5 -3.9
June 7.0 -4.1
July 7.6 -2.1
August 7.6 -1.0
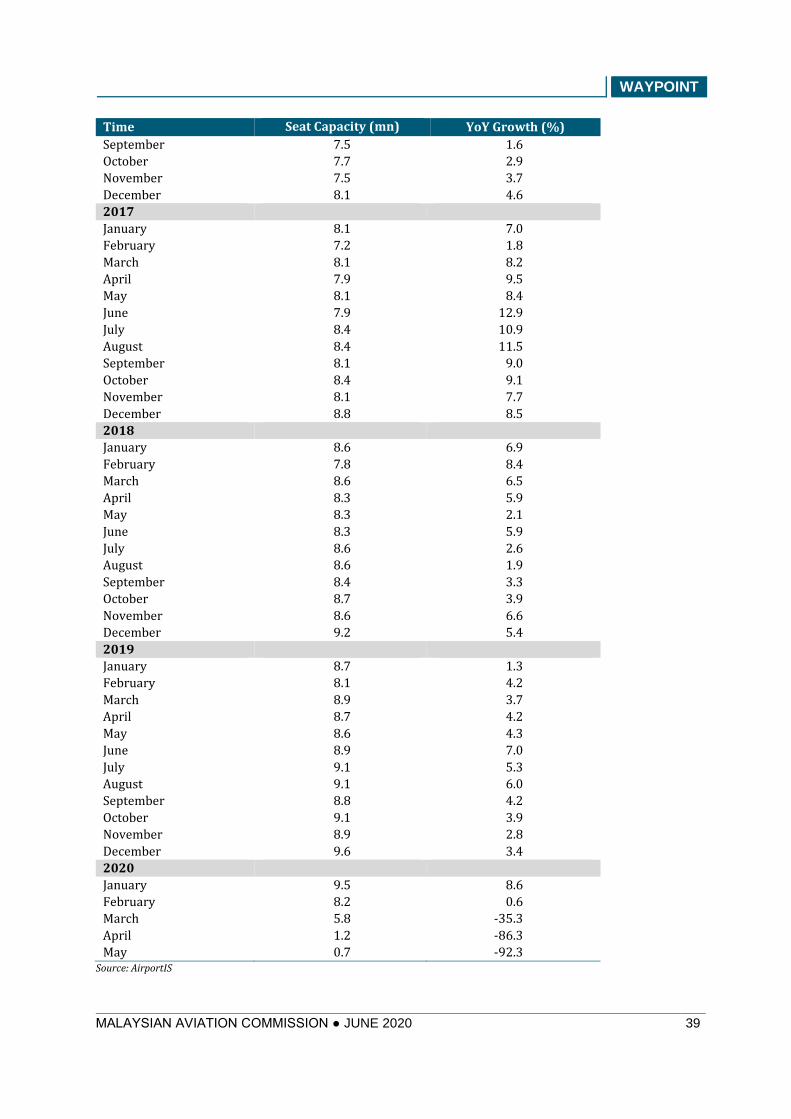
WAYPOINT
MALAYSIAN AVIATION COMMISSION ● JUNE 2020 39
Time Seat Capacity (mn) YoY Growth (%) September 7.5 1.6
October 7.7 2.9
November 7.5 3.7
December 8.1 4.6
2017
January 8.1 7.0
February 7.2 1.8
March 8.1 8.2
April 7.9 9.5
May 8.1 8.4
June 7.9 12.9
July 8.4 10.9
August 8.4 11.5
September 8.1 9.0
October 8.4 9.1
November 8.1 7.7
December 8.8 8.5
2018
January 8.6 6.9
February 7.8 8.4
March 8.6 6.5
April 8.3 5.9
May 8.3 2.1
June 8.3 5.9
July 8.6 2.6
August 8.6 1.9
September 8.4 3.3
October 8.7 3.9
November 8.6 6.6
December 9.2 5.4
2019
January 8.7 1.3
February 8.1 4.2
March 8.9 3.7
April 8.7 4.2
May 8.6 4.3
June 8.9 7.0
July 9.1 5.3
August 9.1 6.0
September 8.8 4.2
October 9.1 3.9
November 8.9 2.8
December 9.6 3.4
2020
January 9.5 8.6
February 8.2 0.6
March 5.8 -35.3
April 1.2 -86.3
May 0.7 -92.3 Source: AirportIS
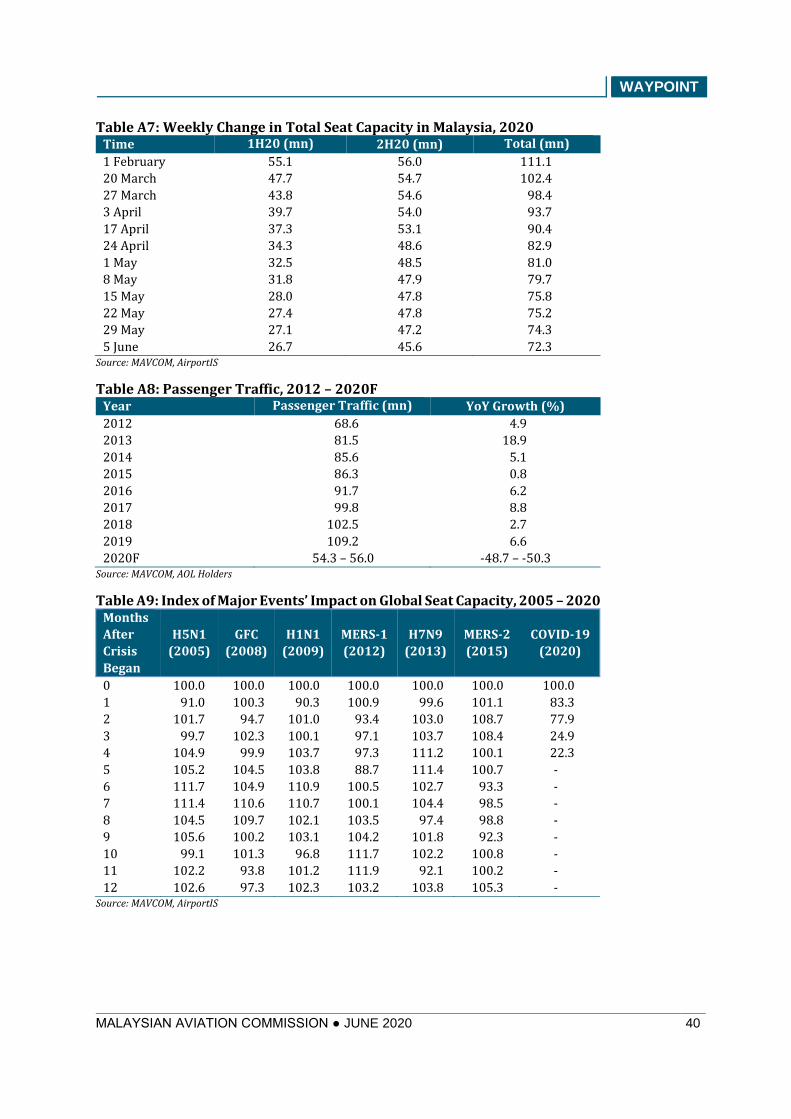
WAYPOINT
MALAYSIAN AVIATION COMMISSION ● JUNE 2020 40
Table A7: Weekly Change in Total Seat Capacity in Malaysia, 2020
Time 1H20 (mn) 2H20 (mn) Total (mn)
1 February 55.1 56.0 111.1
20 March 47.7 54.7 102.4
27 March 43.8 54.6 98.4
3 April 39.7 54.0 93.7
17 April 37.3 53.1 90.4
24 April 34.3 48.6 82.9
1 May 32.5 48.5 81.0
8 May 31.8 47.9 79.7
15 May 28.0 47.8 75.8
22 May 27.4 47.8 75.2
29 May 27.1 47.2 74.3
5 June 26.7 45.6 72.3 Source: MAVCOM, AirportIS
Table A8: Passenger Traffic, 2012 – 2020F
Year Passenger Traffic (mn) YoY Growth (%) 2012 68.6 4.9
2013 81.5 18.9
2014 85.6 5.1
2015 86.3 0.8
2016 91.7 6.2
2017 99.8 8.8
2018 102.5 2.7
2019 109.2 6.6
2020F 54.3 – 56.0 -48.7 – -50.3 Source: MAVCOM, AOL Holders
Table A9: Index of Major Events’ Impact on Global Seat Capacity, 2005 – 2020 Months
After
Crisis
Began
H5N1
(2005)
GFC
(2008)
H1N1
(2009)
MERS-1
(2012)
H7N9
(2013)
MERS-2
(2015)
COVID-19
(2020)
0 100.0 100.0 100.0 100.0 100.0 100.0 100.0
1 91.0 100.3 90.3 100.9 99.6 101.1 83.3
2 101.7 94.7 101.0 93.4 103.0 108.7 77.9
3 99.7 102.3 100.1 97.1 103.7 108.4 24.9
4 104.9 99.9 103.7 97.3 111.2 100.1 22.3
5 105.2 104.5 103.8 88.7 111.4 100.7 -
6 111.7 104.9 110.9 100.5 102.7 93.3 -
7 111.4 110.6 110.7 100.1 104.4 98.5 -
8 104.5 109.7 102.1 103.5 97.4 98.8 -
9 105.6 100.2 103.1 104.2 101.8 92.3 -
10 99.1 101.3 96.8 111.7 102.2 100.8 -
11 102.2 93.8 101.2 111.9 92.1 100.2 -
12 102.6 97.3 102.3 103.2 103.8 105.3 - Source: MAVCOM, AirportIS
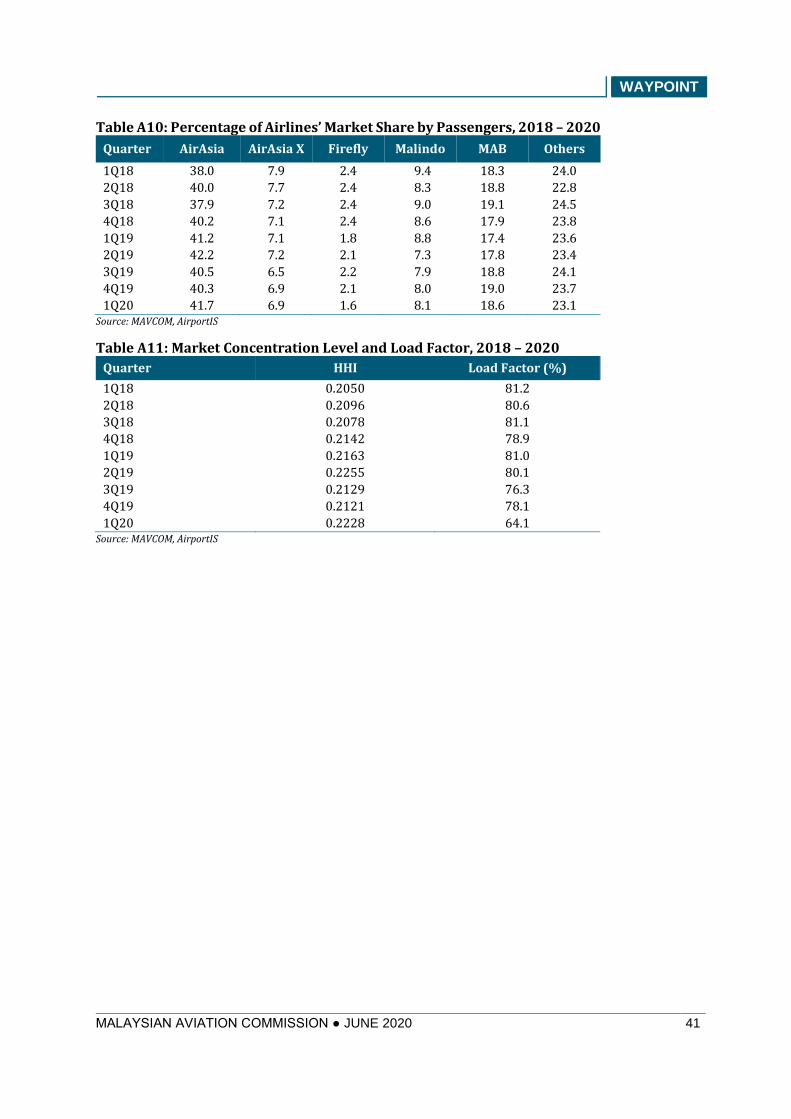
WAYPOINT
MALAYSIAN AVIATION COMMISSION ● JUNE 2020 41
Table A10: Percentage of Airlines’ Market Share by Passengers, 2018 – 2020
Quarter AirAsia AirAsia X Firefly Malindo MAB Others
1Q18 38.0 7.9 2.4 9.4 18.3 24.0
2Q18 40.0 7.7 2.4 8.3 18.8 22.8
3Q18 37.9 7.2 2.4 9.0 19.1 24.5
4Q18 40.2 7.1 2.4 8.6 17.9 23.8
1Q19 41.2 7.1 1.8 8.8 17.4 23.6
2Q19 42.2 7.2 2.1 7.3 17.8 23.4
3Q19 40.5 6.5 2.2 7.9 18.8 24.1
4Q19 40.3 6.9 2.1 8.0 19.0 23.7
1Q20 41.7 6.9 1.6 8.1 18.6 23.1 Source: MAVCOM, AirportIS
Table A11: Market Concentration Level and Load Factor, 2018 – 2020
Quarter HHI Load Factor (%)
1Q18 0.2050 81.2
2Q18 0.2096 80.6
3Q18 0.2078 81.1
4Q18 0.2142 78.9
1Q19 0.2163 81.0
2Q19 0.2255 80.1
3Q19 0.2129 76.3
4Q19 0.2121 78.1
1Q20 0.2228 64.1 Source: MAVCOM, AirportIS
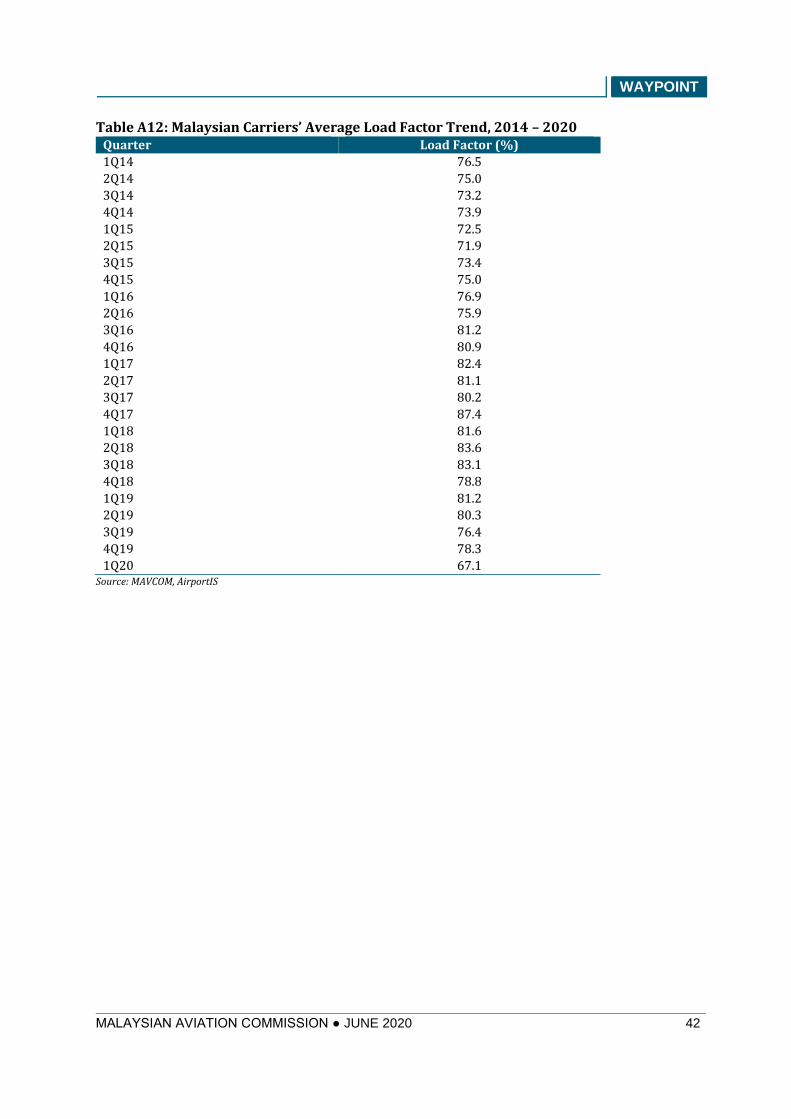
WAYPOINT
MALAYSIAN AVIATION COMMISSION ● JUNE 2020 42
Table A12: Malaysian Carriers’ Average Load Factor Trend, 2014 – 2020 Quarter Load Factor (%)
1Q14 76.5
2Q14 75.0
3Q14 73.2
4Q14 73.9
1Q15 72.5
2Q15 71.9
3Q15 73.4
4Q15 75.0
1Q16 76.9
2Q16 75.9
3Q16 81.2
4Q16 80.9
1Q17 82.4
2Q17 81.1
3Q17 80.2
4Q17 87.4
1Q18 81.6
2Q18 83.6
3Q18 83.1
4Q18 78.8
1Q19 81.2
2Q19 80.3
3Q19 76.4
4Q19 78.3
1Q20 67.1 Source: MAVCOM, AirportIS

WAYPOINT
MALAYSIAN AVIATION COMMISSION ● JUNE 2020 43
Table A13: Malaysian Carriers’ Average Fare Trend, 2014 – 2020 Quarter Average Fare (RM)
1Q14 329
2Q14 308
3Q14 315
4Q14 321
1Q15 318
2Q15 308
3Q15 328
4Q15 336
1Q16 329
2Q16 305
3Q16 303
4Q16 314
1Q17 299
2Q17 311
3Q17 324
4Q17 302
1Q18 315
2Q18 287
3Q18 310
4Q18 287
1Q19 277
2Q19 274
3Q19 282
4Q19 283
1Q20 308 Source: MAVCOM, AirportIS
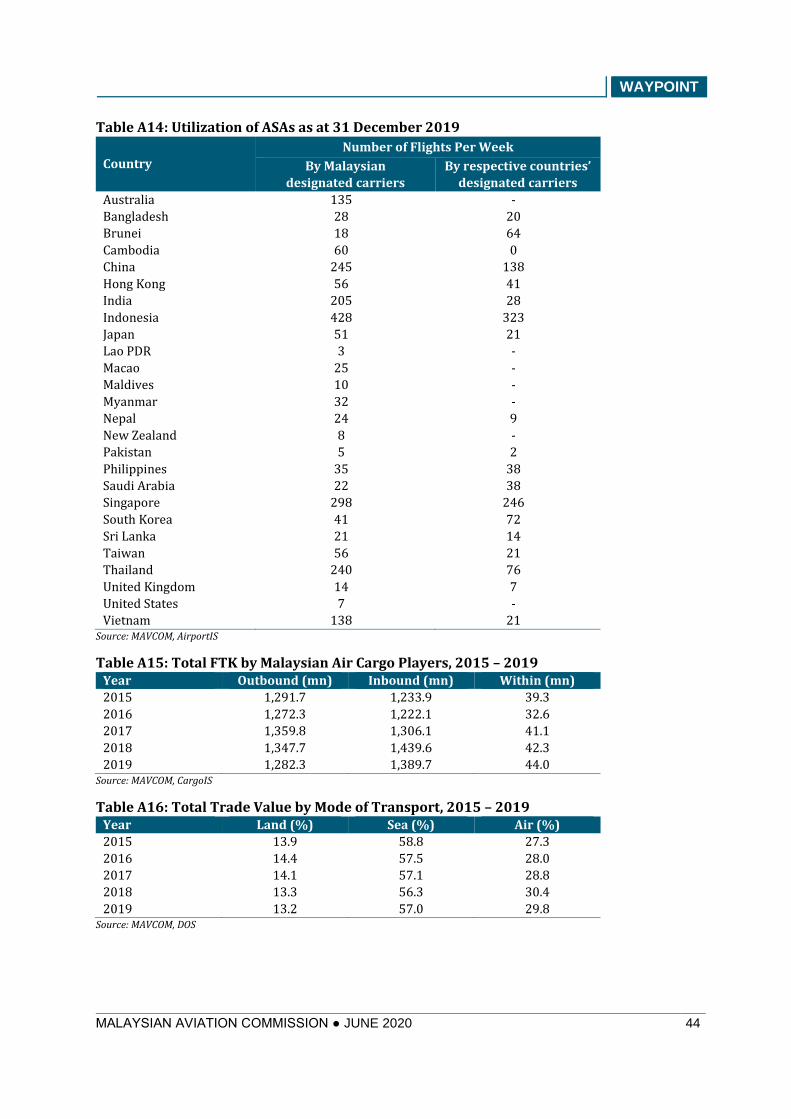
WAYPOINT
MALAYSIAN AVIATION COMMISSION ● JUNE 2020 44
Table A14: Utilization of ASAs as at 31 December 2019
Country Number of Flights Per Week
By Malaysian
designated carriers By respective countries’
designated carriers Australia 135 -
Bangladesh 28 20
Brunei 18 64
Cambodia 60 0
China 245 138
Hong Kong 56 41
India 205 28
Indonesia 428 323
Japan 51 21
Lao PDR 3 -
Macao 25 -
Maldives 10 -
Myanmar 32 -
Nepal 24 9
New Zealand 8 -
Pakistan 5 2
Philippines 35 38
Saudi Arabia 22 38
Singapore 298 246
South Korea 41 72
Sri Lanka 21 14
Taiwan 56 21
Thailand 240 76
United Kingdom 14 7
United States 7 -
Vietnam 138 21 Source: MAVCOM, AirportIS
Table A15: Total FTK by Malaysian Air Cargo Players, 2015 – 2019 Year Outbound (mn) Inbound (mn) Within (mn)
2015 1,291.7 1,233.9 39.3
2016 1,272.3 1,222.1 32.6
2017 1,359.8 1,306.1 41.1
2018 1,347.7 1,439.6 42.3
2019 1,282.3 1,389.7 44.0 Source: MAVCOM, CargoIS
Table A16: Total Trade Value by Mode of Transport, 2015 – 2019 Year Land (%) Sea (%) Air (%)
2015 13.9 58.8 27.3
2016 14.4 57.5 28.0
2017 14.1 57.1 28.8
2018 13.3 56.3 30.4
2019 13.2 57.0 29.8 Source: MAVCOM, DOS
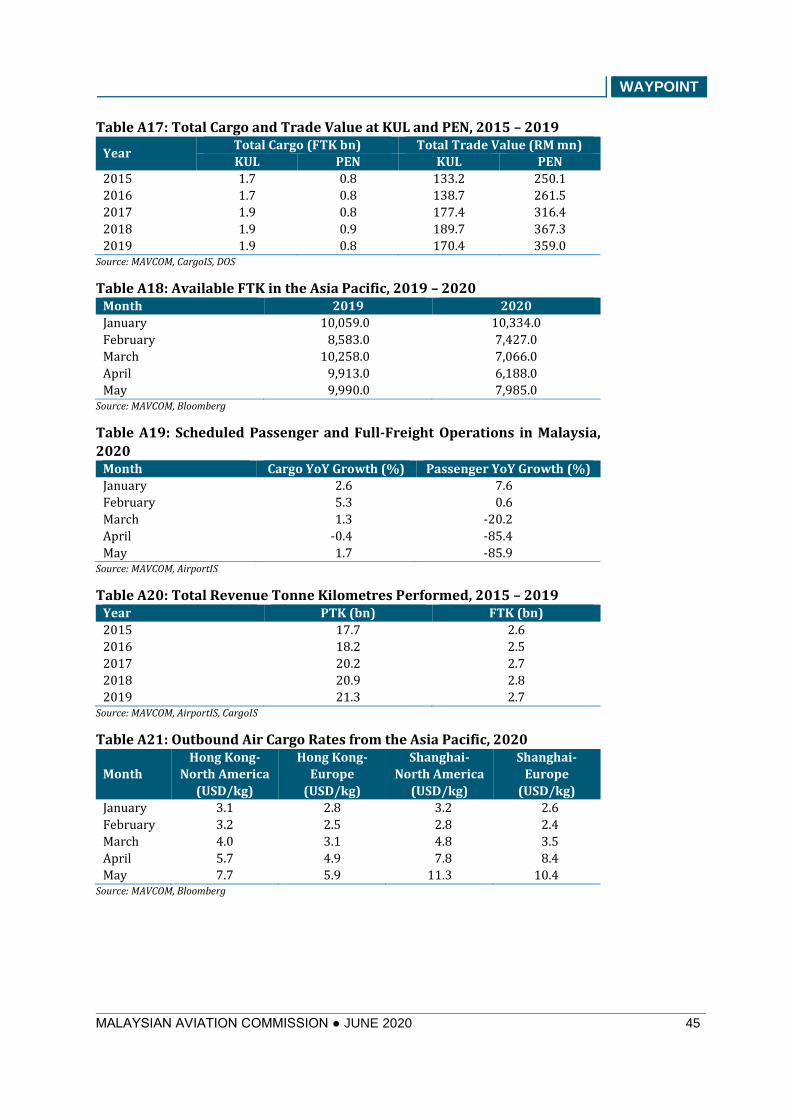
WAYPOINT
MALAYSIAN AVIATION COMMISSION ● JUNE 2020 45
Table A17: Total Cargo and Trade Value at KUL and PEN, 2015 – 2019
Year Total Cargo (FTK bn) Total Trade Value (RM mn)
KUL PEN KUL PEN
2015 1.7 0.8 133.2 250.1
2016 1.7 0.8 138.7 261.5
2017 1.9 0.8 177.4 316.4
2018 1.9 0.9 189.7 367.3
2019 1.9 0.8 170.4 359.0 Source: MAVCOM, CargoIS, DOS
Table A18: Available FTK in the Asia Pacific, 2019 – 2020 Month 2019 2020
January 10,059.0 10,334.0
February 8,583.0 7,427.0
March 10,258.0 7,066.0
April 9,913.0 6,188.0
May 9,990.0 7,985.0 Source: MAVCOM, Bloomberg
Table A19: Scheduled Passenger and Full-Freight Operations in Malaysia,
2020 Month Cargo YoY Growth (%) Passenger YoY Growth (%)
January 2.6 7.6
February 5.3 0.6
March 1.3 -20.2
April -0.4 -85.4
May 1.7 -85.9 Source: MAVCOM, AirportIS
Table A20: Total Revenue Tonne Kilometres Performed, 2015 – 2019 Year PTK (bn) FTK (bn)
2015 17.7 2.6
2016 18.2 2.5
2017 20.2 2.7
2018 20.9 2.8
2019 21.3 2.7 Source: MAVCOM, AirportIS, CargoIS
Table A21: Outbound Air Cargo Rates from the Asia Pacific, 2020
Month
Hong Kong-
North America
(USD/kg)
Hong Kong-
Europe
(USD/kg)
Shanghai-
North America
(USD/kg)
Shanghai-
Europe
(USD/kg)
January 3.1 2.8 3.2 2.6
February 3.2 2.5 2.8 2.4
March 4.0 3.1 4.8 3.5
April 5.7 4.9 7.8 8.4
May 7.7 5.9 11.3 10.4 Source: MAVCOM, Bloomberg
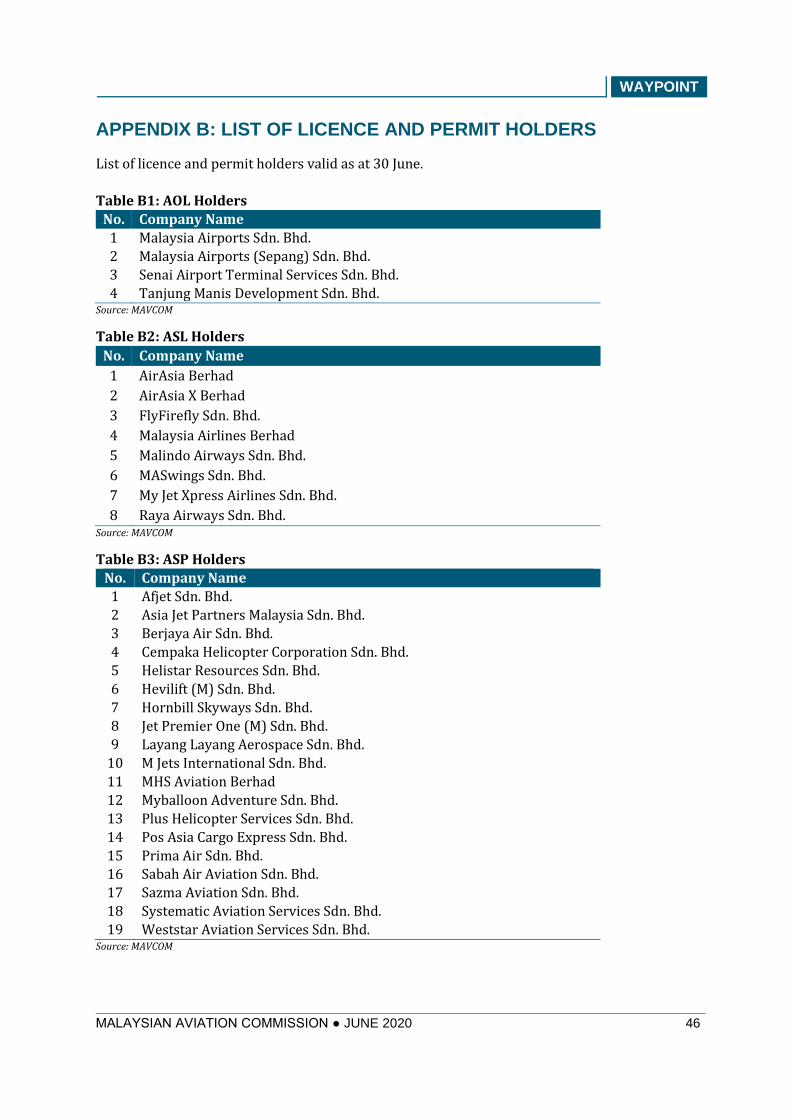
WAYPOINT
MALAYSIAN AVIATION COMMISSION ● JUNE 2020 46
APPENDIX B: LIST OF LICENCE AND PERMIT HOLDERS
List of licence and permit holders valid as at 30 June.
Table B1: AOL Holders
No. Company Name
1 Malaysia Airports Sdn. Bhd.
2 Malaysia Airports (Sepang) Sdn. Bhd.
3 Senai Airport Terminal Services Sdn. Bhd.
4 Tanjung Manis Development Sdn. Bhd. Source: MAVCOM
Table B2: ASL Holders
No. Company Name
1 AirAsia Berhad
2 AirAsia X Berhad
3 FlyFirefly Sdn. Bhd.
4 Malaysia Airlines Berhad
5 Malindo Airways Sdn. Bhd.
6 MASwings Sdn. Bhd.
7 My Jet Xpress Airlines Sdn. Bhd.
8 Raya Airways Sdn. Bhd. Source: MAVCOM
Table B3: ASP Holders
No. Company Name
1 Afjet Sdn. Bhd.
2 Asia Jet Partners Malaysia Sdn. Bhd.
3 Berjaya Air Sdn. Bhd.
4 Cempaka Helicopter Corporation Sdn. Bhd.
5 Helistar Resources Sdn. Bhd.
6 Hevilift (M) Sdn. Bhd.
7 Hornbill Skyways Sdn. Bhd.
8 Jet Premier One (M) Sdn. Bhd.
9 Layang Layang Aerospace Sdn. Bhd.
10 M Jets International Sdn. Bhd.
11 MHS Aviation Berhad
12 Myballoon Adventure Sdn. Bhd.
13 Plus Helicopter Services Sdn. Bhd.
14 Pos Asia Cargo Express Sdn. Bhd.
15 Prima Air Sdn. Bhd.
16 Sabah Air Aviation Sdn. Bhd.
17 Sazma Aviation Sdn. Bhd.
18 Systematic Aviation Services Sdn. Bhd.
19 Weststar Aviation Services Sdn. Bhd. Source: MAVCOM
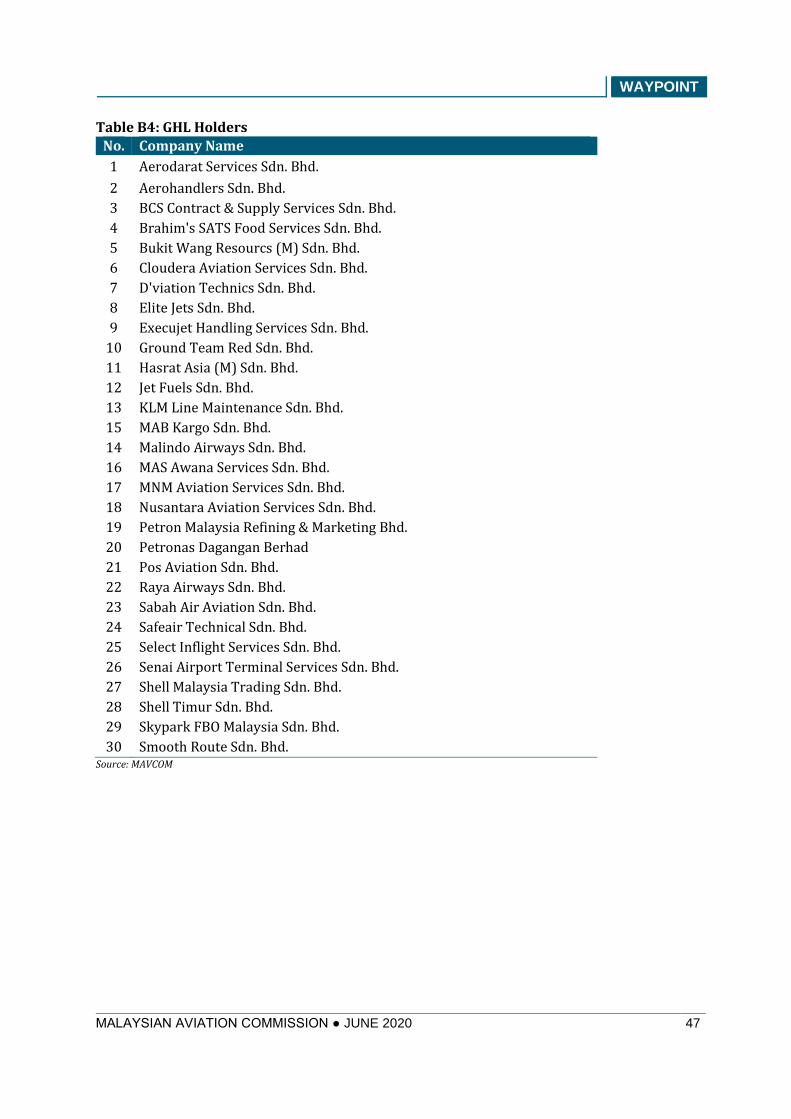
WAYPOINT
MALAYSIAN AVIATION COMMISSION ● JUNE 2020 47
Table B4: GHL Holders
No. Company Name
1 Aerodarat Services Sdn. Bhd.
2 Aerohandlers Sdn. Bhd.
3 BCS Contract & Supply Services Sdn. Bhd.
4 Brahim's SATS Food Services Sdn. Bhd.
5 Bukit Wang Resourcs (M) Sdn. Bhd.
6 Cloudera Aviation Services Sdn. Bhd.
7 D'viation Technics Sdn. Bhd.
8 Elite Jets Sdn. Bhd.
9 Execujet Handling Services Sdn. Bhd.
10 Ground Team Red Sdn. Bhd.
11 Hasrat Asia (M) Sdn. Bhd.
12 Jet Fuels Sdn. Bhd.
13 KLM Line Maintenance Sdn. Bhd.
15 MAB Kargo Sdn. Bhd.
14 Malindo Airways Sdn. Bhd.
16 MAS Awana Services Sdn. Bhd.
17 MNM Aviation Services Sdn. Bhd.
18 Nusantara Aviation Services Sdn. Bhd.
19 Petron Malaysia Refining & Marketing Bhd.
20 Petronas Dagangan Berhad
21 Pos Aviation Sdn. Bhd.
22 Raya Airways Sdn. Bhd.
23 Sabah Air Aviation Sdn. Bhd.
24 Safeair Technical Sdn. Bhd.
25 Select Inflight Services Sdn. Bhd.
26 Senai Airport Terminal Services Sdn. Bhd.
27 Shell Malaysia Trading Sdn. Bhd.
28 Shell Timur Sdn. Bhd.
29 Skypark FBO Malaysia Sdn. Bhd.
30 Smooth Route Sdn. Bhd. Source: MAVCOM
WAYPOINT
MALAYSIAN AVIATION COMMISSION ● JUNE 2020 48
©2020 ALL RIGHTS RESERVED. No part of this report may be
used, copied, photocopied, or duplicated in any form or by any means or redistributed without the prior consent of
MAVCOM.
No opinions and articles published in this report are
exhaustive on the subject or topic they cover and are not
intended to be a substitute for legal advice or opinion on the
topic. Under no circumstances shall MAVCOM be liable to any
person for actions and decisions taken from reliance on any
information contained in this report.
If you have any queries or comments, please contact:
Level 19, Menara 1 Sentrum
201, Jalan Tun Sambanthan
50470 Kuala Lumpur
Malaysia
Tel: +603 2772 0600
Fax: +603 2772 0601
Email: [email protected]