Embed Size (px)
Citation preview
WEEKLY ECONOMIC DIGESTEconomic Development Winnipeg
M A R C H 1 8 , 2 0 2 2 , V O L U M E 3 , I S S U E 4
Bottom LineRussia invaded Ukraine on February 24, 2022, from Russian and Belarussian territory.This act of war brought down significant economic sanctions from the West on Russia, andBelarus. The European countries of Russia, Ukraine, and Belarus are enormouscommodity exporters of energy, fertilizer, food, and metals. The war and sanctions havegenerated uncertainty, pushing up these commodities’ prices. So, while Canada does nothave significant direct trade with any of these three countries, we are seeing a sharpincrease in global prices for these commodities within Canada.
Canadian producers of crude oil, and natural gas will benefit from this price increase, whileconsumers will face higher costs. There are similar issues with producers and consumersof iron and iron related products.
(continued).
HOW THE WAR IN UKRAINE IS AFFECTING MANITOBA'SECONOMYDISRUPTIONS TO THE TRADE OF ENERGY, FERTILIZER, FOOD AND METALS Chris Ferris, Senior Economist
© 2022 ECONOMIC DEVELOPMENT WINNIPEG 2
ANALYSIS
Bottom Line (Continued) Food commodity production is particularly sensitive to timing—spring planting season for cropsin Ukraine and Russia is coming up soon, along with the harvest of winter crops. In Ukraine,having sufficient labour and inputs to plant and harvest is important for them to have crops tosell. In Russia, with sanctions in place, there may be challenges to financing crop planting.Buyers of Ukrainian and Russian wheat are concerned about rising wheat prices, with a foodcrisis already brewing in some countries.
Many world crop prices were already high, with tight world supply and demand balances due tocrop production problems in 2021. Looking ahead to spring planting in 2022, Canadian farmersare looking favourably at higher crop prices, which they could lock-in by using various contractsor with futures and options. At the same time, farmers are facing higher fertilizer, diesel, engineoil and lubricant prices. Livestock producers are facing even higher feed prices, along withhigher fuel costs.
Even before the invasion in Ukraine, the Bank of Canada had a need to raise policy interestrates to tame inflation. This extra source of inflation adds more pressure on select commodityprices faced by Canadians. We are likely to see a 1.25 per cent overnight rate in January2023, possibly with some Quantitative Tightening (QT). With the added inflation from theRussian invasion of Ukraine, the probability of even higher rates is rising. Either way, the Bankmust ensure inflation expectations remain well anchored, so we avoid even the spectre ofstagflation.
For businesses and individuals, understanding the implication of interest rates rising from 0.25per cent in January 2022 to 1.25 per cent or higher is something you should consider beforelaunching new projects or taking on new debts.
A preliminary economic analysis of the 2022 Russian invasion of UkraineThe easing of COVID-19’s economic impact in Canada is very welcome news.[1] Unfortunately,the world was suddenly confronted by a new source of economic uncertainty through theRussian invasion of Ukraine, beginning on February 24, 2022. The launch of this offensive thisyear follows the seizure of Crimea in 2014 and other ongoing conflicts in Eastern Ukraine. Seethe map on the following page.[2]
[1] See Chris Ferris (March 15, 2022) “Is COVID-19 Beginning to Fade as an Economic Influence in Canada?,”https://www.linkedin.com/pulse/covid-19-beginning-fade-economic-influence-canada-chris-ferris.
[2] For Source for map, Washington Post, January 21, 2022. Updated February 26, 2022.https://www.washingtonpost.com/world/2022/01/21/ukraine-russia-explain-maps/.

© 2022 ECONOMIC DEVELOPMENT WINNIPEG 3
ANALYSIS
Much of the world has responded in favour of Ukraine, with harsh sanctions being imposed onRussia and extended to Belarus. Numerous countries (particularly NATO countries) are alsosupplying Ukraine with arms and other supplies to aid their resistance to Russia’s assault.[3]
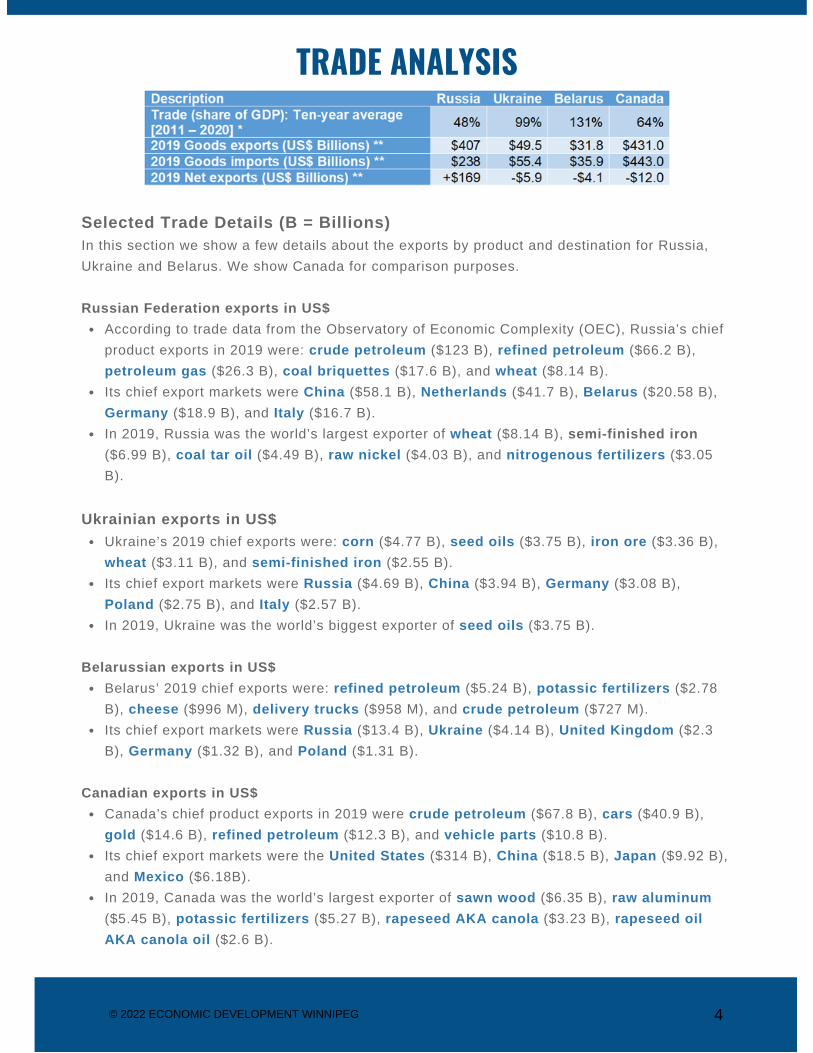
The outcome of the war and the length of time it will take to resolve it are unclear. What we cando is consider some parameters of the Ukrainian, Belarussian, and Russian economies, thenconsider a few scenarios to understand the potential effects on the rest of the world. Trade Exposure Russia’s trade in goods (Exports + Imports) as a share of GDP (Gross Domestic Product) islower than that of Ukraine and Belarus. Russia’s goods exports in 2019 were worth US$407billion, approximately eight times more than Ukraine’s exports.[4] We are showing Canada'sexports as a point of comparison to Russia. See the following table.
[3] I briefly touched on some of the impacts of Russia’s invasion in an economic outlook presentation to the BrandonChamber of Commerce on March 8, 2022. The presentation was covered in a Brandon Sun article by Colin Slark.https://www.brandonsun.com/local/outlook-positive-for-manitobas-economy-576273492.html.
[4] Source: * World Bank, World Development Indicators, February 15, 2022.https://databank.worldbank.org/reports.aspx?source=2&series=NE.TRD.GNFS.ZS&country=#, and ** TheObservatory of Economic Complexity (OEC), https://oec.world/en/resources/about.
© 2022 ECONOMIC DEVELOPMENT WINNIPEG 4
TRADE ANALYSIS
According to trade data from the Observatory of Economic Complexity (OEC), Russia’s chiefproduct exports in 2019 were: crude petroleum ($123 B), refined petroleum ($66.2 B),petroleum gas ($26.3 B), coal briquettes ($17.6 B), and wheat ($8.14 B). Its chief export markets were China ($58.1 B), Netherlands ($41.7 B), Belarus ($20.58 B),Germany ($18.9 B), and Italy ($16.7 B). In 2019, Russia was the world’s largest exporter of wheat ($8.14 B), semi-finished iron($6.99 B), coal tar oil ($4.49 B), raw nickel ($4.03 B), and nitrogenous fertilizers ($3.05B).
Ukraine’s 2019 chief exports were: corn ($4.77 B), seed oils ($3.75 B), iron ore ($3.36 B),wheat ($3.11 B), and semi-finished iron ($2.55 B). Its chief export markets were Russia ($4.69 B), China ($3.94 B), Germany ($3.08 B),Poland ($2.75 B), and Italy ($2.57 B).In 2019, Ukraine was the world’s biggest exporter of seed oils ($3.75 B).
Belarus’ 2019 chief exports were: refined petroleum ($5.24 B), potassic fertilizers ($2.78B), cheese ($996 M), delivery trucks ($958 M), and crude petroleum ($727 M).Its chief export markets were Russia ($13.4 B), Ukraine ($4.14 B), United Kingdom ($2.3B), Germany ($1.32 B), and Poland ($1.31 B).
Canada’s chief product exports in 2019 were crude petroleum ($67.8 B), cars ($40.9 B),gold ($14.6 B), refined petroleum ($12.3 B), and vehicle parts ($10.8 B).Its chief export markets were the United States ($314 B), China ($18.5 B), Japan ($9.92 B),and Mexico ($6.18B).In 2019, Canada was the world’s largest exporter of sawn wood ($6.35 B), raw aluminum($5.45 B), potassic fertilizers ($5.27 B), rapeseed AKA canola ($3.23 B), rapeseed oilAKA canola oil ($2.6 B).
Selected Trade Details (B = Billions)In this section we show a few details about the exports by product and destination for Russia,Ukraine and Belarus. We show Canada for comparison purposes.
Russian Federation exports in US$
Ukrainian exports in US$
Belarussian exports in US$
Canadian exports in US$
[5] The key feedstock for making nitrogenous fertilizers is natural gas.
[6] See International Energy Agency (IEA): https://www.iea.org/reports/russian-supplies-to-global-energy-markets/oil-market-and-russian-supply-2. China’s current lockdowns are thought to reduce demand for crude oil andnatural gas so this also pressuring prices lower. The war is likely to result in further short-term and medium term changes toenergy markets.
[7] See Germany’s announcement on February 27, 2022, of boosting defense spending to 2 per cent of GDP and building ofTwo Liquified Natural Gas (LNG) ports. https://www.politico.eu/article/germany-to-ramp-up-defense-spending-in-response-to-russias-war-on-ukraine/.
© 2022 ECONOMIC DEVELOPMENT WINNIPEG 5
TRADE ANALYSIS (CONTINUED)
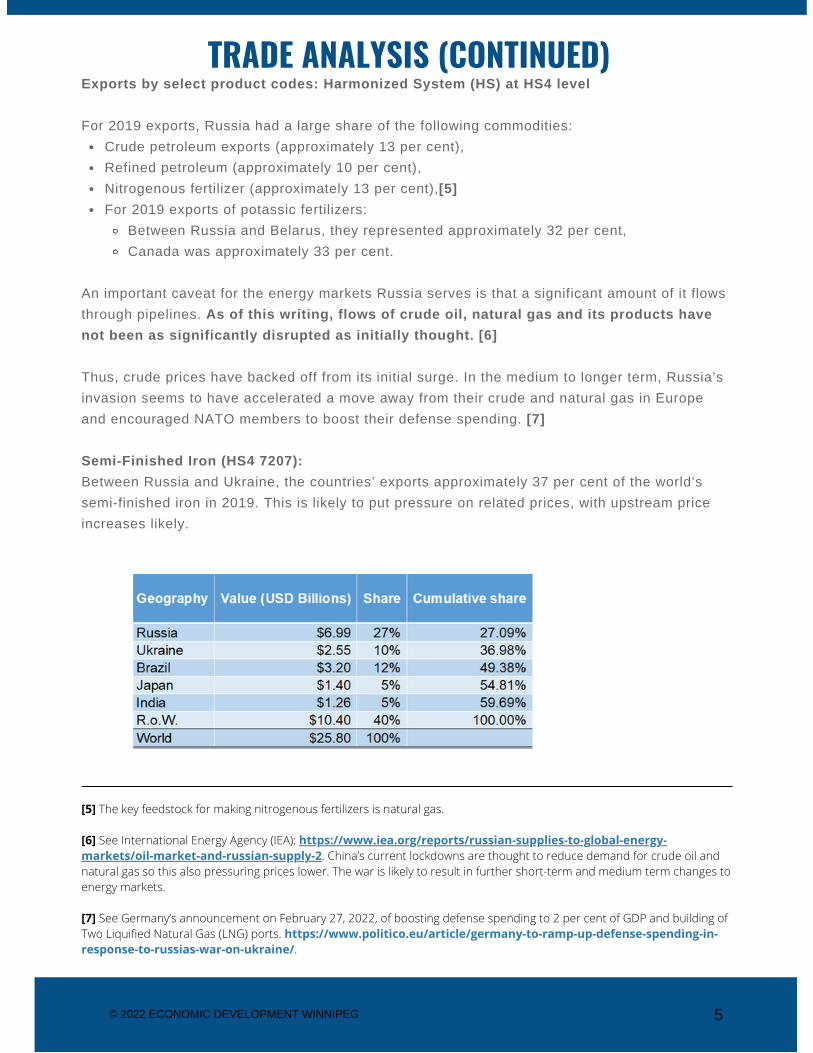
Crude petroleum exports (approximately 13 per cent), Refined petroleum (approximately 10 per cent),Nitrogenous fertilizer (approximately 13 per cent),[5] For 2019 exports of potassic fertilizers:
Between Russia and Belarus, they represented approximately 32 per cent, Canada was approximately 33 per cent.
Exports by select product codes: Harmonized System (HS) at HS4 level
For 2019 exports, Russia had a large share of the following commodities:
An important caveat for the energy markets Russia serves is that a significant amount of it flowsthrough pipelines. As of this writing, flows of crude oil, natural gas and its products havenot been as significantly disrupted as initially thought. [6]
Thus, crude prices have backed off from its initial surge. In the medium to longer term, Russia’sinvasion seems to have accelerated a move away from their crude and natural gas in Europeand encouraged NATO members to boost their defense spending. [7]
Semi-Finished Iron (HS4 7207): Between Russia and Ukraine, the countries’ exports approximately 37 per cent of the world’ssemi-finished iron in 2019. This is likely to put pressure on related prices, with upstream priceincreases likely.

© 2022 ECONOMIC DEVELOPMENT WINNIPEG 6
TRADE ANALYSIS (CONTINUED)
Wheat (HS4 1001)Between the two countries, Russia and Ukraine represented approximately 25 per cent of worldtrade in wheat.[8] Their wheat typically is some of the cheapest in the world on a US$/MTF.O.B. (Free on Board), Black-Sea-ports basis. Thus, their wheat is often the winner of tendersby large buyers like Egypt that run subsidized bread programs. If their winter wheat does not getharvested and spring wheat does not get planted and harvested, this may set off a round of foodriots in North Africa and other markets the two countries dominate. A food crisis is already aserious concern in parts of North Africa and the Middle East, and matters may worsen if the warin Ukraine lasts longer.
The core wheat producing areas of Ukraine and Russia are relatively close to the shoreline ofthe Black Sea and Sea of Azov.[9] The most pressing issue is planting barley, corn, rice,soybeans and sunflowers since the planting windows for these crops are coming up soon.[10]Russia has significant offshore participation in farming and grain handling along the Black Sea,which is its core winter wheat growing area. If offshore firms end up pulling out of the area, thenfinancing, producing, and shipping crops from the area may be disrupted as well.
Cargo Vessel Traffic DisruptionUkrainian ports are closed due to the ongoing conflict, so cargo vessels are avoiding Ukraine’sshoreline along the Black Sea and Sea of Azov.[11] The closures are cutting off exportshipments of grains and oilseeds out of Ukrainian ports. Vessels are calling on other ports in theBlack Sea and Sea of Azov. Some grains and oilseeds are reportedly being shipped by rail toneighboring countries including Romania, Hungary, Slovakia and Poland, but it is not clear howmuch if any is being shipped. Having alternative export channels will become important if thewar drags on, since its key exports are crops.
[8] See OEC https://oec.world/en/profile/hs92/wheat?redirect=true.[9] Source: USDA Foreign Agricultural Service. https://ipad.fas.usda.gov/rssiws/al/global_cropprod.aspx. [10] See planting and harvesting time for Ukraine in: https://www.linkedin.com/posts/higby-barrett-llc_the-ability-to-harvest-the-wheat-and-export-activity-6909504594238676992-_O0w?utm_source=linkedin_share&utm_medium=member_desktop_web.[11] See Marine Traffic https://www.marinetraffic.com/en/ais/home/centerx:32.9/centery:45.5/zoom:7 Cargo shipswill often avoid war zones since their marine insurance typically does not cover acts of war that result in them being sunk orcaptured. In this case Ukraine has closed the ports due to the war.

Possible Scenarios and OutcomesIf the war were to end within the next two weeks to – at most - a month, Ukraine andRussia’s spring planting could occur, and the harvest of spring and winter crops wouldnot be as significantly disrupted. In this scenario, crop prices should ease somewhat,along with related input prices, but expect disruptions to continue to reverberate.
If the war disrupts planting and harvesting in Ukraine and Russia throughout 2022 eitherdirectly or through sanctions, expect higher crops and input prices to continue. This willencourage farmers in other countries to attempt to make up for the lack of productioncoming from Ukraine and Russia. Given the Russia and Ukraine’s share of these cropsthough, a fair bit of the work may have to be done by rationing demand and pushing someconsumers to substitute goods.
If higher natural gas and crude oil prices are sustained, it could dampen economic activityaround the world. Major central banks are reversing extraordinary supports that were putin place due to the COVID-19 pandemic. Some commentators are concerned thatstagflationary effects could arise. The effect would be muted compared to the 1970senergy crisis, since the West uses much less crude oil per dollar of GDP.
© 2022 ECONOMIC DEVELOPMENT WINNIPEG 7
TRADE ANALYSIS AND SCENARIOSMarine Traffic in the Black Sea and Sea of Azov (Approximately March 15, 2022)
© 2022 ECONOMIC DEVELOPMENT WINNIPEG 8
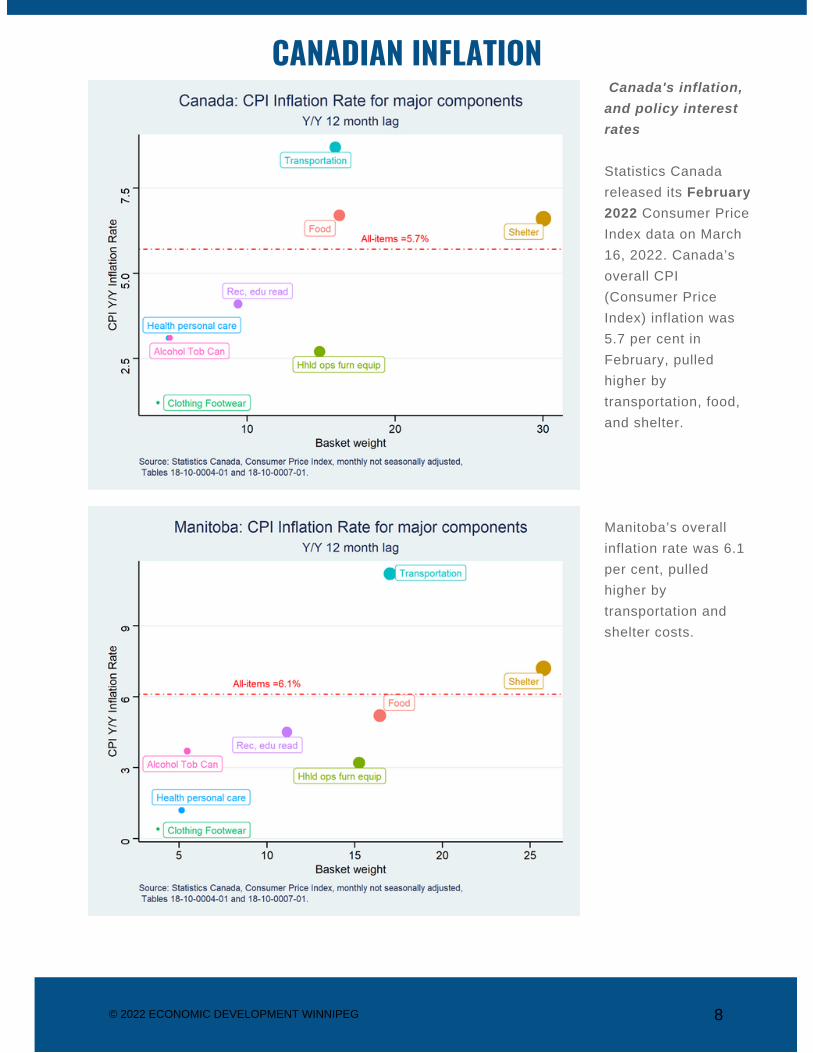
CANADIAN INFLATION Canada's inflation,and policy interestrates
Statistics Canadareleased its February2022 Consumer PriceIndex data on March16, 2022. Canada’soverall CPI(Consumer PriceIndex) inflation was5.7 per cent inFebruary, pulledhigher bytransportation, food,and shelter.
Manitoba’s overallinflation rate was 6.1per cent, pulledhigher bytransportation andshelter costs.

© 2022 ECONOMIC DEVELOPMENT WINNIPEG 9
CANADIAN INFLATION (CONTINUED)The low base-yeareffect on CPI during2020 and 2021 willbegin to ease withthe March 2022numbers and ceasebeing relevant as ofMay 2022.
It will be key to watchhousing,transportation, andfood costs over thecoming months sincethey are drivingoverall inflation.
Rising interest ratesand the opening ofthe economy shouldstart taking the frothout of the housingmarket over thecoming year (which isbeing driven by theowned sheltersubindex of theshelter index).
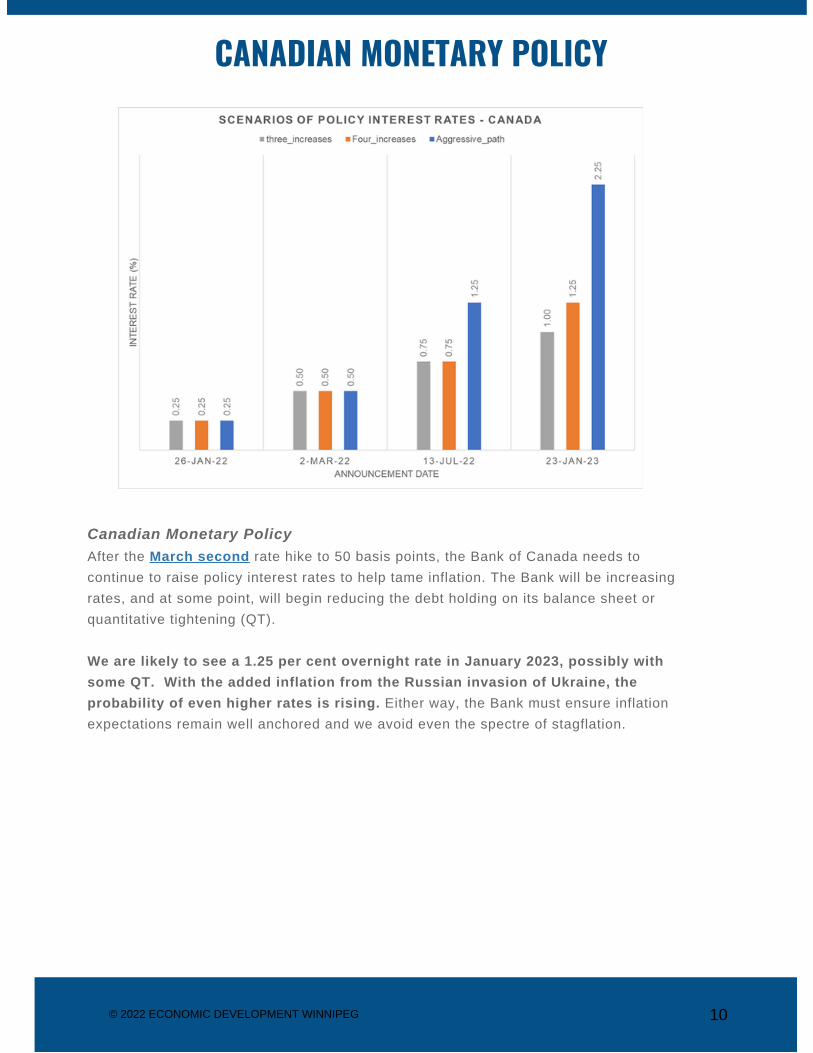
Canadian Monetary PolicyAfter the March second rate hike to 50 basis points, the Bank of Canada needs tocontinue to raise policy interest rates to help tame inflation. The Bank will be increasingrates, and at some point, will begin reducing the debt holding on its balance sheet orquantitative tightening (QT).
We are likely to see a 1.25 per cent overnight rate in January 2023, possibly withsome QT. With the added inflation from the Russian invasion of Ukraine, theprobability of even higher rates is rising. Either way, the Bank must ensure inflationexpectations remain well anchored and we avoid even the spectre of stagflation.
© 2022 ECONOMIC DEVELOPMENT WINNIPEG 10
CANADIAN MONETARY POLICY

INQUIRIES AND CONTACTSIf you require help accessing government programs, contact our YES!Winnipeg team through the Help us help you form.General inquires: [email protected] & communications inquiries:[email protected]
Looking Forward: What does this mean for individuals and businesses?Businesses and individuals need to consider the implications of rising interest rates. Theovernight rate could easily be 1.25 per cent by January 23, 2023. The central bank couldraises rates more aggressively, but we are unlikely to see overnight rates exceed 2.25 percent by January 2023.
For individuals, this calls for stress testing your ability to comfortably carry debt in the caseof an interest rate increase of at least 1 to 2 per cent.
For businesses, if borrowing to implement projects, stress test an increase in the interestrate of at least 1 to 2 per cent to ensure your Return on Investment (ROI) will not becompromised by rising interest rates.
Talk to your financial advisors and lenders to review your situation and adjust before itbecomes a problem.


![CSR Report 2015 [Digest]](https://img.pdfslide.net/doc/110x75/63257519cedd78c2b50c99c4/csr-report-2015-digest.jpg)