Embed Size (px)
Citation preview
UPPER ROCK RIVER WATERSHED(WI) HUC: 07090001
1
The United States Department of Agriculture (USDA) prohibits discrimination in all its programs and activities on the basis of race, color, national origin, sex, religion, age, disability, political beliefs, sexual orientation, and marital or family status. (Not all prohibited bases apply to all programs.) Persons with disabilities who require alternative means forcommunication of program information (Braille, large print, audiotape, etc.) should contact USDA’s TARGET Center at 202-720-2600 (voice and TDD).
To fi le a complaint of discrimination, write USDA, Director, Offi ce of Civil Rights, Room 326W, Whitten Building, 14th and Independence Avenue, SW, Washington DC 20250-9410, or call (202) 720-5964 (voice and TDD). USDA is an equal opportunity provider and employer.
Wisconsin
Rapid Watershed AssessmentUpper Rock River
Rapid watershed assessments provide initial estimates of where conservation investments would best address the concerns of landowners, conservation districts, and other community organizations and stakeholders. These assessments help landowners and local leaders set priorities and determine the best actions to achieve their goals.
Wisconsin October 2007
UPPER ROCK RIVER WATERSHED(WI) HUC: 07090001
2
CONTENTS
INTRODUCTION 1
COMMON RESOURCE AREA 105.WI1 DESCRIPTION 2
PHYSICAL DESCRIPTION 2
ASSESSMENT OF WATERS 4
SOILS 6
Drainage Classifi cation 6
Farmland Classifi cation 7
Hydric Soils 8
Land Capability Classifi cation 9
RESOURCE CONCERNS 9
WATERSHED ASSESSMENT 9
PRS AND OTHER DATA 10
CENSUS AND SOCIAL DATA (RELEVANT) 11
WATERSHED PROJECTS, STUDIES, MONITORING, ETC 13
PARTNER GROUPS 13
ECOLOGICAL LANDSCAPES 14
UPPER ROCK RIVER WATERSHED(WI) HUC: 07090001
1
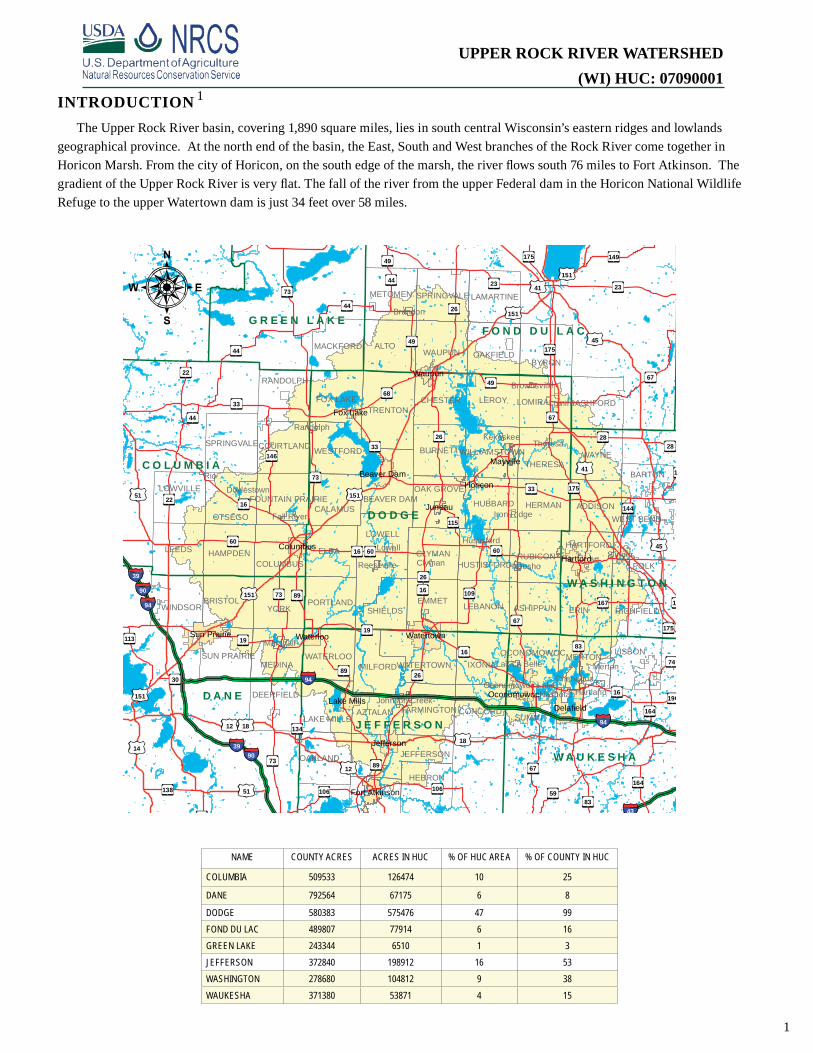
INTRODUCTION The Upper Rock River basin, covering 1,890 square miles, lies in south central Wisconsin’s eastern ridges and lowlands
geographical province. At the north end of the basin, the East, South and West branches of the Rock River come together in Horicon Marsh. From the city of Horicon, on the south edge of the marsh, the river fl ows south 76 miles to Fort Atkinson. The gradient of the Upper Rock River is very fl at. The fall of the river from the upper Federal dam in the Horicon National Wildlife Refuge to the upper Watertown dam is just 34 feet over 58 miles.
NAME COUNTY ACRES ACRES IN HUC % OF HUC AREA % OF COUNTY IN HUC
COLUMBIA 509533 126474 10 25
DANE 792564 67175 6 8
DODGE 580383 575476 47 99FOND DU LAC 489807 77914 6 16GREEN LAKE 243344 6510 1 3JEFFERSON 372840 198912 16 53WASHINGTON 278680 104812 9 38WAUKESHA 371380 53871 4 15
1
D A N E
D O D G E
C O L U M B I A
J E F F E R S O N
F O N D D U L A C
W A U K E S H A
W A S H I N G T O N
G R E E N L A K E
94
90
43
18
45
151
51
12
41
151
151
14
51
16
109
44
149
67
106
60
23
19
49
146
73 89
83
26
22
33
74
68
28
59
175
1
14
115
138
167
190
134
30
175
164
175
6744
60
164
73
28
26
113
144
89
67
73
26
89
94
90
18
12
26
16
16
16
33
33
23
45
41
16
60
73
19
151
151
49
49
44
44
2267
83
39
39
175
106
94
ERIN
ALTO
ELBA
LOWELL
YORK
POLK
TRENTONLEROY
LEEDS
IXONIA
BYRON
WAYNE
MEDINA
EMMET
CLYMAN
HERMAN
FOX LAKE
BRISTOL
ADDISON
WAUPUN
MILFORD
BURNETT
RUBICON
THERESA
OAKLAND
CALAMUS
LEBANON
LISBON
JEFFERSON
OAKFIELD
ASHFORD
OTSEGO
SUMMIT
CHESTER
LOWVILLE
HAMPDEN
METOMEN
CONCORD
ASHIPPUN RICHFIELD
HUBBARD
HEBRON
PORTLAND
RANDOLPH
LAMARTINE
WINDSOR
DEERFIELD
SHIELDS
WESTFORD
MACKFORD
LAKE MILLS
WATERLOO
AZTALAN
COLUMBUS
BARTON
LOMIRA
BEAVER DAM
MERTON
SPRINGVALE
WATERTOWN
OAK GROVE
COURTLAND
SPRINGVALE
HARTFORD
HUSTISFORD
FARMINGTON
SUN PRAIRIE
WILLIAMSTOWN
OCONOMOWOC
FOUNTAIN PRAIRIE
WEST BEND
Hartland
Slinger
ChenequaMerton
Rio
Doylestown
Lomira
Marshall
NashotahOconomowoc Lake
Lowell
Fall River
Johnson Creek
Randolph
Hustisford
Theresa
Brandon
Neosho
Iron Ridge
Reeseville
Lac La Belle
Brownsville
Clyman
Kekoskee
Delafield
WatertownSun Prairie
Hartford
Beaver Dam
Oconomowoc
Jefferson
Waupun
Horicon
Waterloo
Fort Atkinson
Columbus
Lake Mills
Mayville
Juneau
Fox Lake
UPPER ROCK RIVER WATERSHED(WI) HUC: 07090001
2
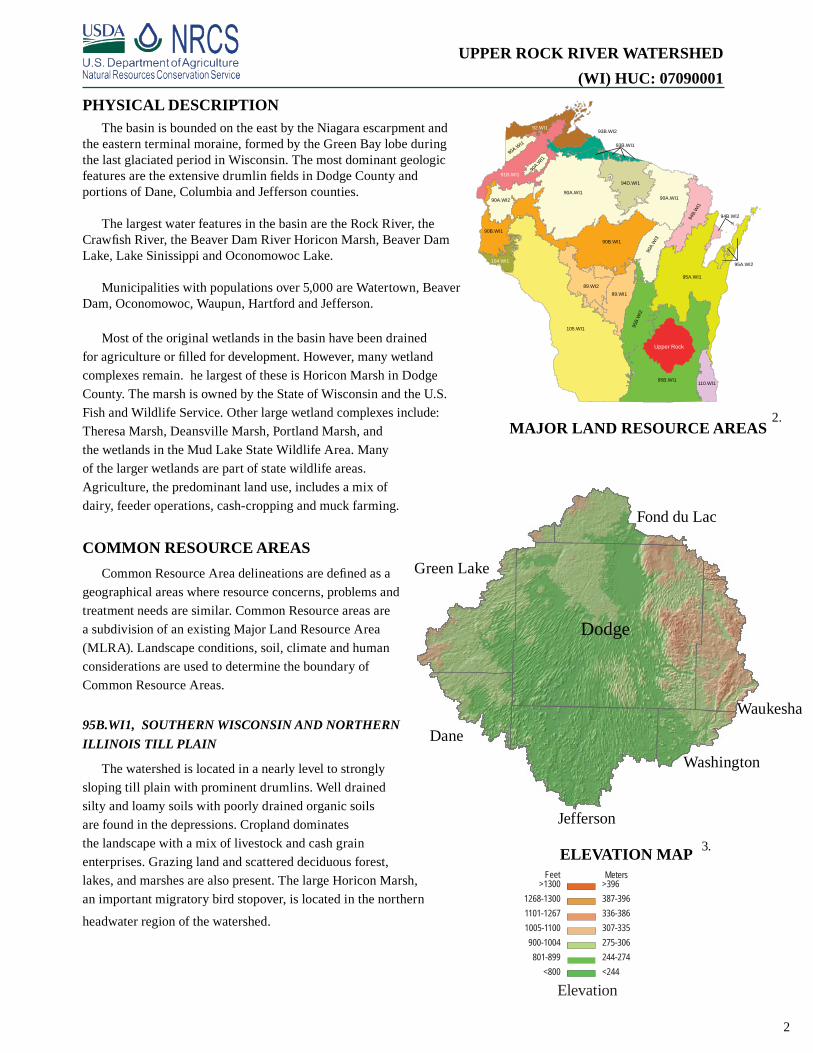
PHYSICAL DESCRIPTIONThe basin is bounded on the east by the Niagara escarpment and
the eastern terminal moraine, formed by the Green Bay lobe during the last glaciated period in Wisconsin. The most dominant geologic features are the extensive drumlin fi elds in Dodge County and portions of Dane, Columbia and Jefferson counties.
The largest water features in the basin are the Rock River, the Crawfi sh River, the Beaver Dam River Horicon Marsh, Beaver Dam Lake, Lake Sinissippi and Oconomowoc Lake.
Municipalities with populations over 5,000 are Watertown, Beaver Dam, Oconomowoc, Waupun, Hartford and Jefferson.
Most of the original wetlands in the basin have been drained for agriculture or fi lled for development. However, many wetland complexes remain. he largest of these is Horicon Marsh in Dodge County. The marsh is owned by the State of Wisconsin and the U.S. Fish and Wildlife Service. Other large wetland complexes include: Theresa Marsh, Deansville Marsh, Portland Marsh, and the wetlands in the Mud Lake State Wildlife Area. Many of the larger wetlands are part of state wildlife areas. Agriculture, the predominant land use, includes a mix of dairy, feeder operations, cash-cropping and muck farming.
COMMON RESOURCE AREASCommon Resource Area delineations are defi ned as a
geographical areas where resource concerns, problems and treatment needs are similar. Common Resource areas are a subdivision of an existing Major Land Resource Area (MLRA). Landscape conditions, soil, climate and human considerations are used to determine the boundary of Common Resource Areas.
95B.WI1, SOUTHERN WISCONSIN AND NORTHERN ILLINOIS TILL PLAIN
The watershed is located in a nearly level to strongly sloping till plain with prominent drumlins. Well drained silty and loamy soils with poorly drained organic soils are found in the depressions. Cropland dominates the landscape with a mix of livestock and cash grain enterprises. Grazing land and scattered deciduous forest, lakes, and marshes are also present. The large Horicon Marsh, an important migratory bird stopover, is located in the northern
headwater region of the watershed.
MAJOR LAND RESOURCE AREAS
ELEVATION MAP
Dodge
Fond du Lac
Waukesha
Washington
Jefferson
Dane
Green Lake
>396387-396336-386307-335275-306244-274<244
>13001268-13001101-12671005-1100900-1004
801-899<800
Elevation
Feet Meters
2.
3.
Upper Rock
105.WI1
90A.WI1
95B.WI1
90B.WI1
95A.WI1
89.WI1
95B.
WI2
89.WI2
90A.
WI3
110.WI1
91B.WI1
94D.WI1
92.WI1
94B.
WI1
90A.WI2
104.WI1
90A.WI1
93B.WI2
90A.W
I1
95A.WI2
93B.WI1
94B.WI2
90A.WI1
90B.WI1
UPPER ROCK RIVER WATERSHED(WI) HUC: 07090001
3
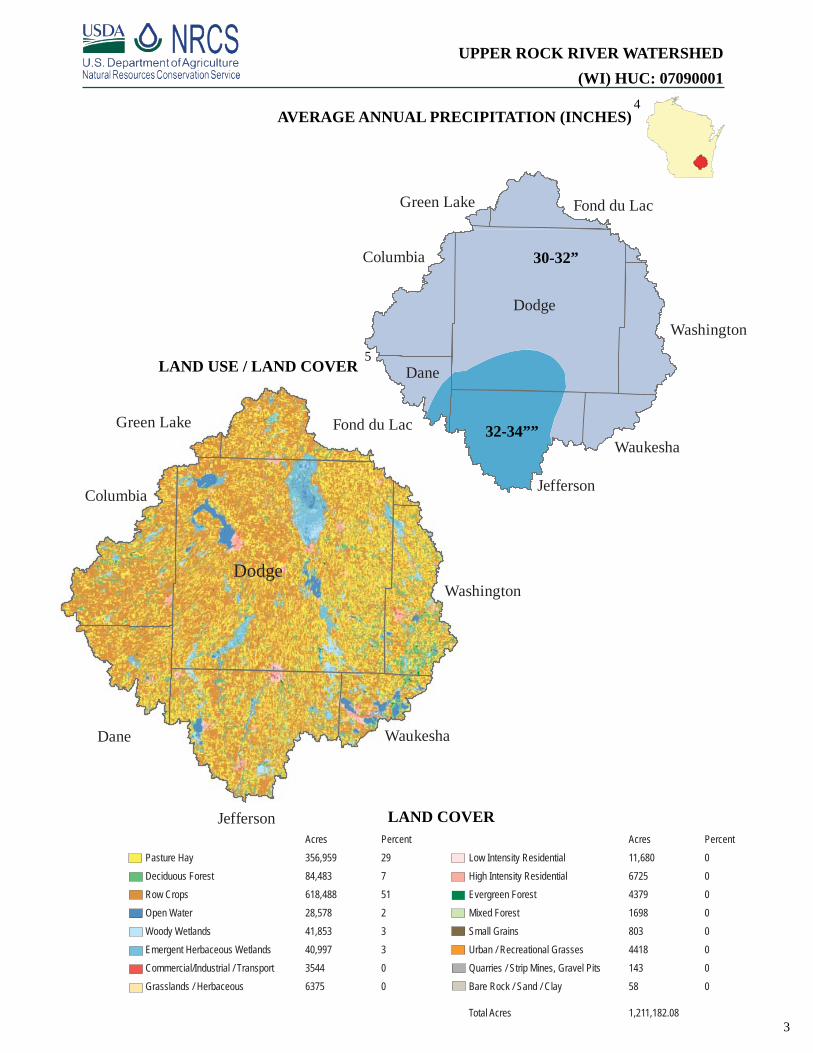
LAND USE / LAND COVER
Dodge
Dane
Fond du Lac
Columbia
Washington
Waukesha
Green Lake
Acres PercentLow Intensity Residential 11,680 0High Intensity Residential 6725 0Evergreen Forest 4379 0Mixed Forest 1698 0Small Grains 803 0Urban / Recreational Grasses 4418 0Quarries / Strip Mines, Gravel Pits 143 0Bare Rock / Sand / Clay 58 0
Total Acres 1,211,182.08
Acres PercentPasture Hay 356,959 29Deciduous Forest 84,483 7Row Crops 618,488 51Open Water 28,578 2Woody Wetlands 41,853 3Emergent Herbaceous Wetlands 40,997 3Commercial/Industrial / Transport 3544 0Grasslands / Herbaceous 6375 0
Jefferson
AVERAGE ANNUAL PRECIPITATION (INCHES)
Dodge
Jefferson
Dane
Fond du Lac
Columbia
Washington
Waukesha
Green Lake
30-32”
LAND COVER
5
4
32-34””
UPPER ROCK RIVER WATERSHED(WI) HUC: 07090001
4
For information on specifi c subwatersheds, 303(d) or Exceptional/Outstanding Resource Waters (ERW/ORW): http://dnr.wi.gov/org/water/wm/wqs/303d/faqs.html
http://dnr.wi.gov/org/gmu/gpsp/gpbasin/
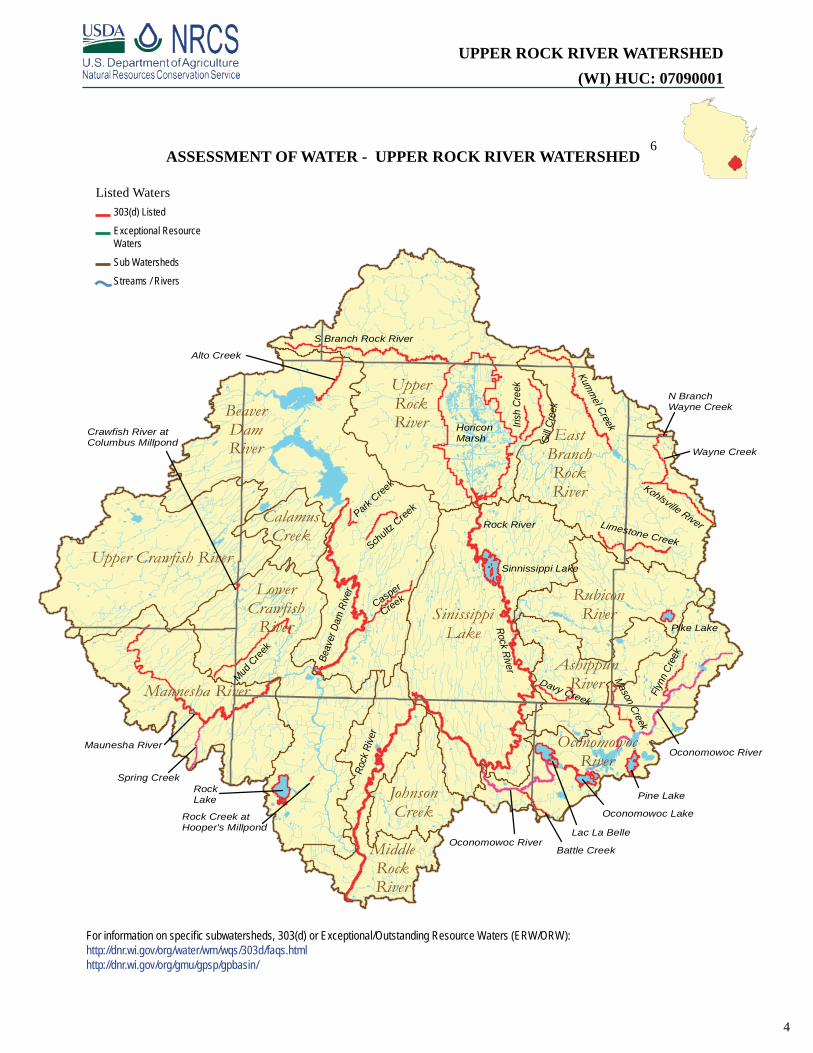
ASSESSMENT OF WATER - UPPER ROCK RIVER WATERSHED6
Alto Creek
Beav
erDa
mRi
ver
Casper
Creek
Spring Creek
Maunesha River
ParkCree
k
RockLake
Schultz
Creek
Crawfish River atColumbus Millpond
Rock Creek atHooper's Millpond
BeaverDamRiver
SinissippiLake
UpperRockRiver
LowerCrawfishRiver
Maunesha River
EastBranchRockRiver
Upper Crawfish River
OconomowocRiver
RubiconRiver
MiddleRockRiver
AshippunRiver
JohnsonCreek
CalamusCreek
Battle Creek
Davy Creek
Flyn
nCr
eek
Gill C
reek
Irish
Cree
k
Kohlsville River
Kumm
el Creek
Limestone Creek
Mason
Creek
N BranchWayne Creek
Rock River
S Branch Rock River
MudCree
k
Wayne Creek
Oconomowoc River
Lac La Belle
Oconomowoc Lake
Pike Lake
Pine Lake
Oconomowoc River
Sinnissippi Lake
RockRiver
Rock
Rive
r
HoriconMarsh
Listed Waters303(d) Listed
Exceptional ResourceWaters
Sub Watersheds
Streams / Rivers
UPPER ROCK RIVER WATERSHED(WI) HUC: 07090001
5
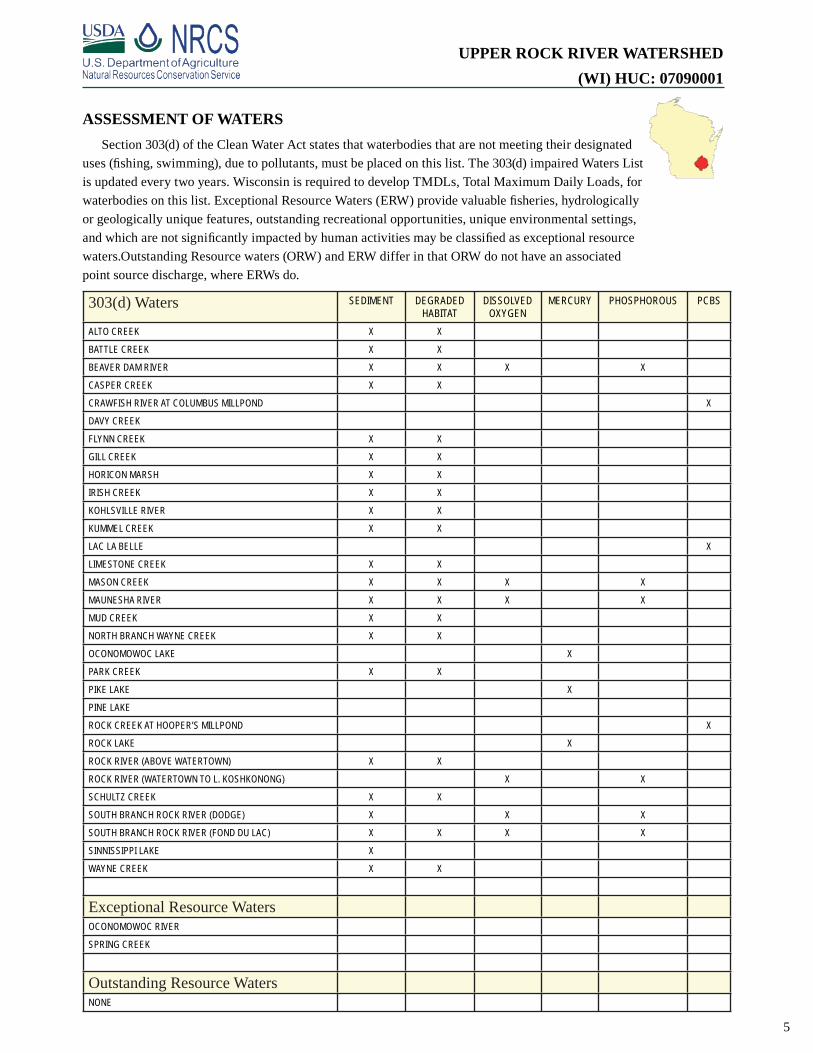
ASSESSMENT OF WATERSSection 303(d) of the Clean Water Act states that waterbodies that are not meeting their designated
uses (fi shing, swimming), due to pollutants, must be placed on this list. The 303(d) impaired Waters List is updated every two years. Wisconsin is required to develop TMDLs, Total Maximum Daily Loads, for waterbodies on this list. Exceptional Resource Waters (ERW) provide valuable fi sheries, hydrologically or geologically unique features, outstanding recreational opportunities, unique environmental settings, and which are not signifi cantly impacted by human activities may be classifi ed as exceptional resource waters.Outstanding Resource waters (ORW) and ERW differ in that ORW do not have an associated point source discharge, where ERWs do.
303(d) Waters SEDIMENT DEGRADED HABITAT
DISSOLVED OXYGEN
MERCURY PHOSPHOROUS PCBS
ALTO CREEK X X
BATTLE CREEK X X
BEAVER DAM RIVER X X X X
CASPER CREEK X X
CRAWFISH RIVER AT COLUMBUS MILLPOND X
DAVY CREEK
FLYNN CREEK X X
GILL CREEK X X
HORICON MARSH X X
IRISH CREEK X X
KOHLSVILLE RIVER X X
KUMMEL CREEK X X
LAC LA BELLE X
LIMESTONE CREEK X X
MASON CREEK X X X X
MAUNESHA RIVER X X X X
MUD CREEK X X
NORTH BRANCH WAYNE CREEK X X
OCONOMOWOC LAKE X
PARK CREEK X X
PIKE LAKE X
PINE LAKE
ROCK CREEK AT HOOPER’S MILLPOND X
ROCK LAKE X
ROCK RIVER (ABOVE WATERTOWN) X X
ROCK RIVER (WATERTOWN TO L. KOSHKONONG) X X
SCHULTZ CREEK X X
SOUTH BRANCH ROCK RIVER (DODGE) X X X
SOUTH BRANCH ROCK RIVER (FOND DU LAC) X X X X
SINNISSIPPI LAKE X
WAYNE CREEK X X
Exceptional Resource WatersOCONOMOWOC RIVER
SPRING CREEK
Outstanding Resource WatersNONE
UPPER ROCK RIVER WATERSHED(WI) HUC: 07090001
6
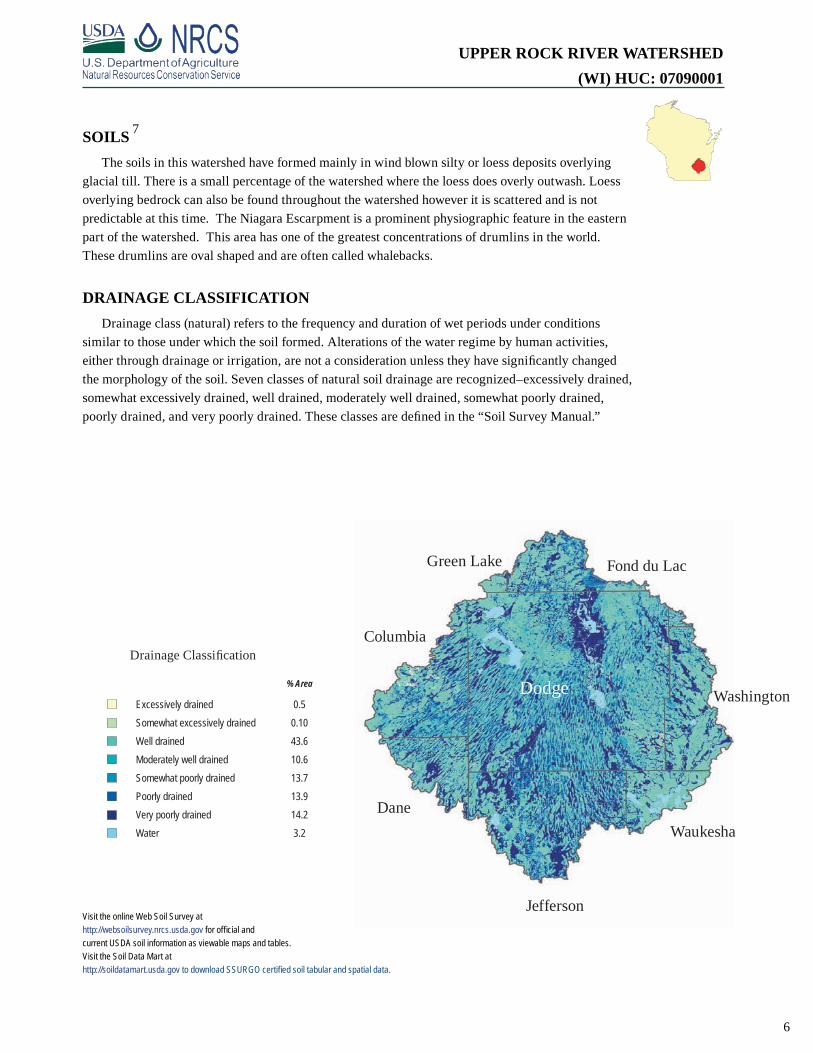
Drainage Classifi cation
% Area
Excessively drained 0.5Somewhat excessively drained 0.10Well drained 43.6Moderately well drained 10.6Somewhat poorly drained 13.7Poorly drained 13.9Very poorly drained 14.2Water 3.2
Visit the online Web Soil Survey athttp://websoilsurvey.nrcs.usda.gov for offi cial and current USDA soil information as viewable maps and tables. Visit the Soil Data Mart athttp://soildatamart.usda.gov to download SSURGO certifi ed soil tabular and spatial data.
Dodge
Jefferson
Dane
Fond du Lac
Columbia
Washington
Waukesha
Green Lake
SOILSThe soils in this watershed have formed mainly in wind blown silty or loess deposits overlying
glacial till. There is a small percentage of the watershed where the loess does overly outwash. Loess overlying bedrock can also be found throughout the watershed however it is scattered and is not predictable at this time. The Niagara Escarpment is a prominent physiographic feature in the eastern part of the watershed. This area has one of the greatest concentrations of drumlins in the world. These drumlins are oval shaped and are often called whalebacks.
DRAINAGE CLASSIFICATIONDrainage class (natural) refers to the frequency and duration of wet periods under conditions
similar to those under which the soil formed. Alterations of the water regime by human activities, either through drainage or irrigation, are not a consideration unless they have signifi cantly changed the morphology of the soil. Seven classes of natural soil drainage are recognized–excessively drained, somewhat excessively drained, well drained, moderately well drained, somewhat poorly drained, poorly drained, and very poorly drained. These classes are defi ned in the “Soil Survey Manual.”
7
UPPER ROCK RIVER WATERSHED(WI) HUC: 07090001
7
Visit the online Web Soil Survey athttp://websoilsurvey.nrcs.usda.gov for offi cial and current USDA soil information as viewable maps and tables. Visit the Soil Data Mart athttp://soildatamart.usda.gov to download SSURGO certifi ed soil tabular and spatial data.
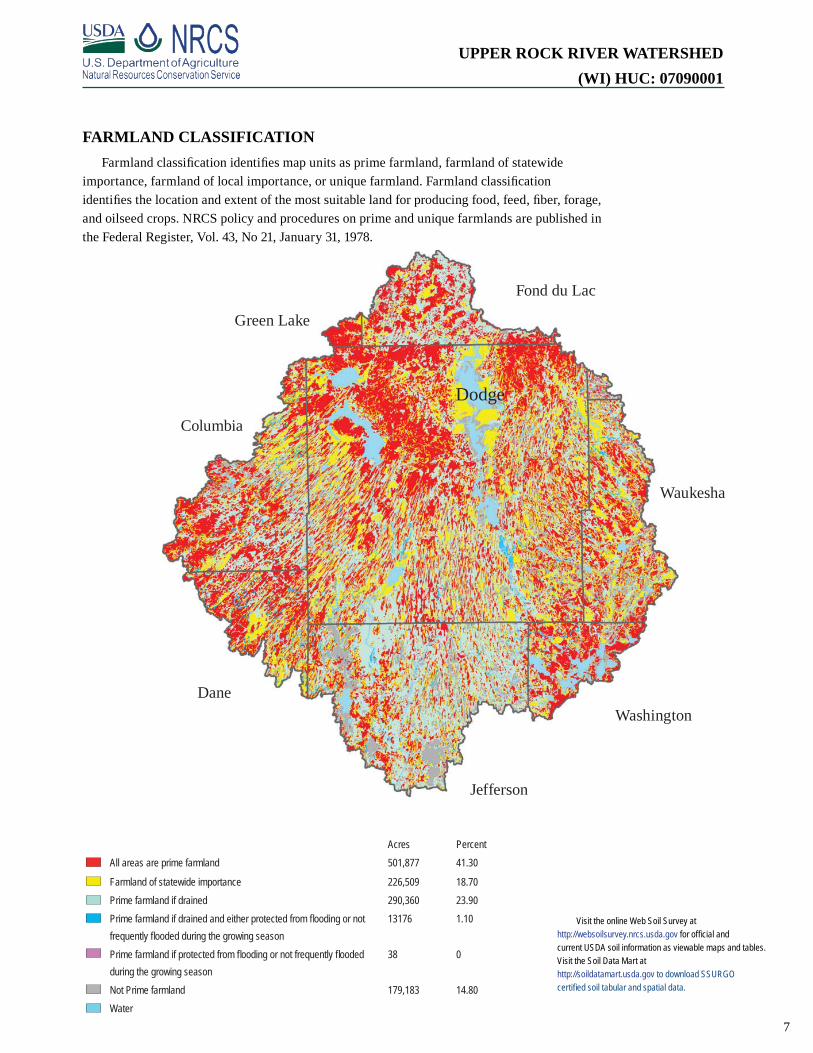
FARMLAND CLASSIFICATION Farmland classifi cation identifi es map units as prime farmland, farmland of statewide
importance, farmland of local importance, or unique farmland. Farmland classifi cation identifi es the location and extent of the most suitable land for producing food, feed, fi ber, forage, and oilseed crops. NRCS policy and procedures on prime and unique farmlands are published in the Federal Register, Vol. 43, No 21, January 31, 1978.
Jefferson
DaneWashington
Dodge
Green Lake
Fond du Lac
Waukesha
Columbia
Acres PercentAll areas are prime farmland 501,877 41.30
Farmland of statewide importance 226,509 18.70Prime farmland if drained 290,360 23.90Prime farmland if drained and either protected from fl ooding or not frequently fl ooded during the growing season
13176 1.10
Prime farmland if protected from fl ooding or not frequently fl ooded during the growing season
38 0
Not Prime farmland 179,183 14.80Water
UPPER ROCK RIVER WATERSHED(WI) HUC: 07090001
8
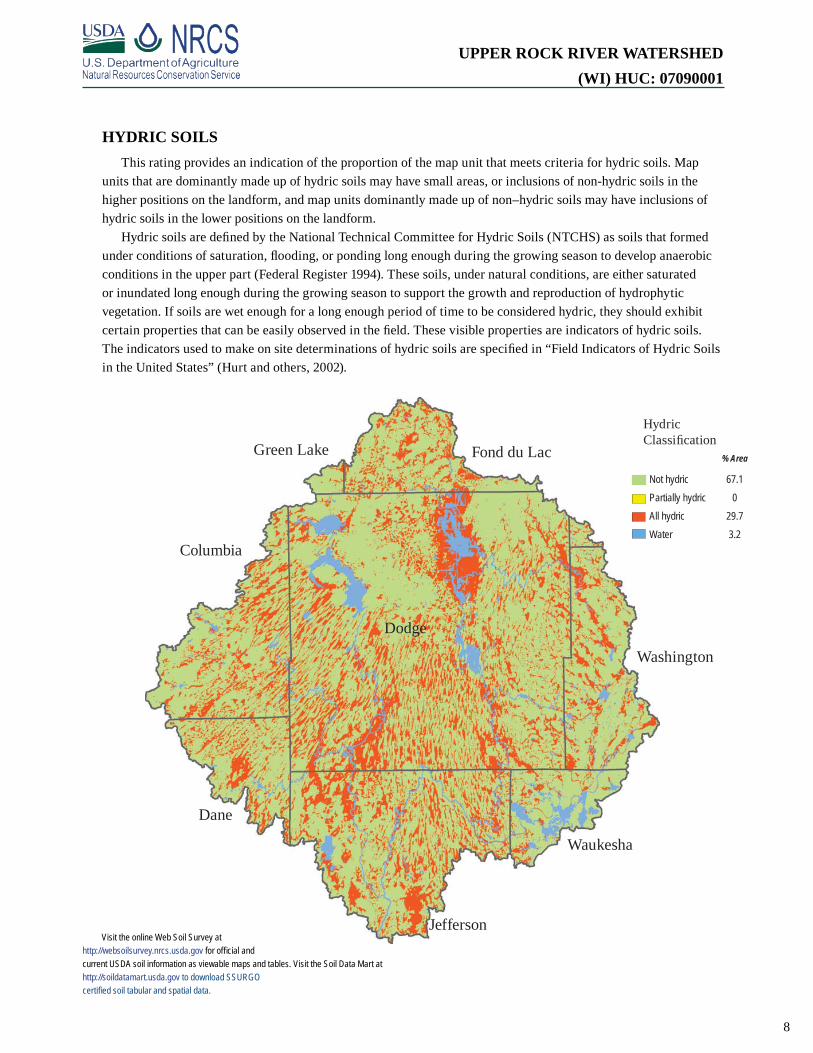
HYDRIC SOILSThis rating provides an indication of the proportion of the map unit that meets criteria for hydric soils. Map
units that are dominantly made up of hydric soils may have small areas, or inclusions of non-hydric soils in the higher positions on the landform, and map units dominantly made up of non–hydric soils may have inclusions of hydric soils in the lower positions on the landform.
Hydric soils are defi ned by the National Technical Committee for Hydric Soils (NTCHS) as soils that formed under conditions of saturation, fl ooding, or ponding long enough during the growing season to develop anaerobic conditions in the upper part (Federal Register 1994). These soils, under natural conditions, are either saturated or inundated long enough during the growing season to support the growth and reproduction of hydrophytic vegetation. If soils are wet enough for a long enough period of time to be considered hydric, they should exhibit certain properties that can be easily observed in the fi eld. These visible properties are indicators of hydric soils. The indicators used to make on site determinations of hydric soils are specifi ed in “Field Indicators of Hydric Soils in the United States” (Hurt and others, 2002).
Jefferson
Dane
Fond du Lac
Columbia
Waukesha
Green Lake
Dodge
Washington
Visit the online Web Soil Survey athttp://websoilsurvey.nrcs.usda.gov for offi cial and current USDA soil information as viewable maps and tables. Visit the Soil Data Mart athttp://soildatamart.usda.gov to download SSURGO certifi ed soil tabular and spatial data.
Hydric Classifi cation
% Area
Not hydric 67.1Partially hydric 0All hydric 29.7Water 3.2
UPPER ROCK RIVER WATERSHED(WI) HUC: 07090001
9
Dodge
Fond du Lac
Columbia
Washington
Waukesha
Green Lake
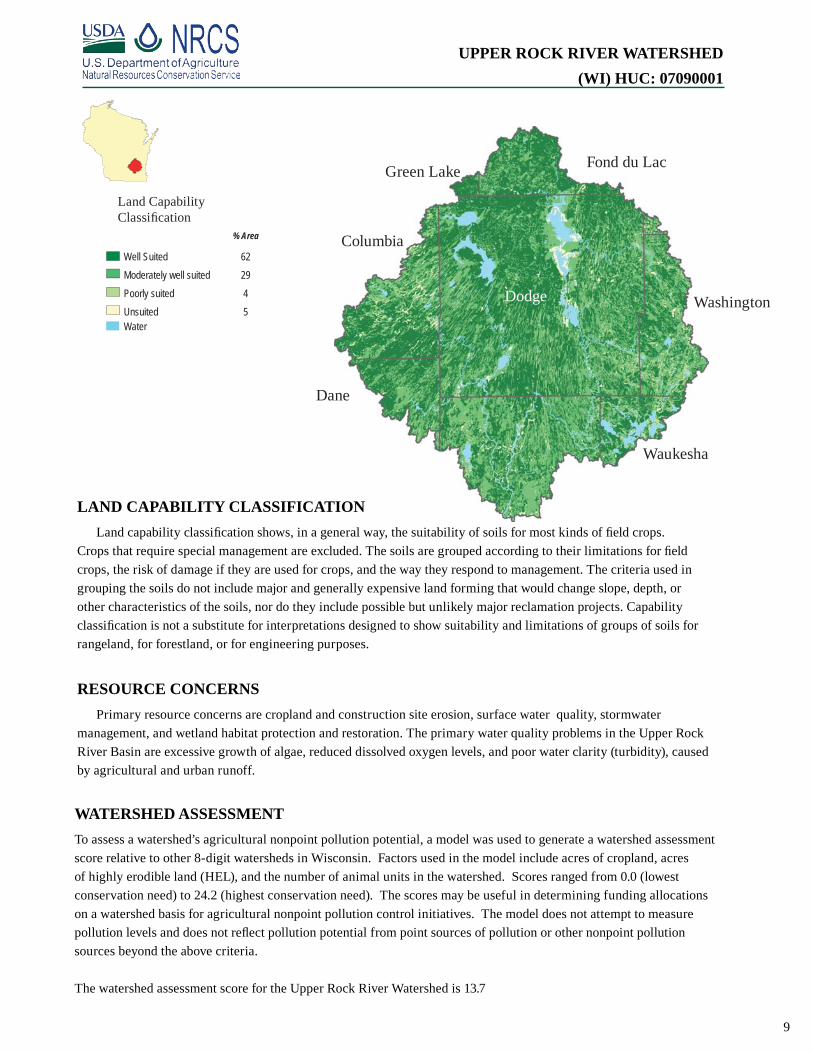
LAND CAPABILITY CLASSIFICATIONLand capability classifi cation shows, in a general way, the suitability of soils for most kinds of fi eld crops.
Crops that require special management are excluded. The soils are grouped according to their limitations for fi eld crops, the risk of damage if they are used for crops, and the way they respond to management. The criteria used in grouping the soils do not include major and generally expensive land forming that would change slope, depth, or other characteristics of the soils, nor do they include possible but unlikely major reclamation projects. Capability classifi cation is not a substitute for interpretations designed to show suitability and limitations of groups of soils for rangeland, for forestland, or for engineering purposes.
RESOURCE CONCERNSPrimary resource concerns are cropland and construction site erosion, surface water quality, stormwater
management, and wetland habitat protection and restoration. The primary water quality problems in the Upper Rock River Basin are excessive growth of algae, reduced dissolved oxygen levels, and poor water clarity (turbidity), caused by agricultural and urban runoff.
Dane
Land Capability Classifi cation
% Area
Well Suited 62Moderately well suited 29Poorly suited 4UnsuitedWater
5
WATERSHED ASSESSMENTTo assess a watershed’s agricultural nonpoint pollution potential, a model was used to generate a watershed assessment score relative to other 8-digit watersheds in Wisconsin. Factors used in the model include acres of cropland, acres of highly erodible land (HEL), and the number of animal units in the watershed. Scores ranged from 0.0 (lowest conservation need) to 24.2 (highest conservation need). The scores may be useful in determining funding allocations on a watershed basis for agricultural nonpoint pollution control initiatives. The model does not attempt to measure pollution levels and does not refl ect pollution potential from point sources of pollution or other nonpoint pollution sources beyond the above criteria.
The watershed assessment score for the Upper Rock River Watershed is 13.7
UPPER ROCK RIVER WATERSHED(WI) HUC: 07090001
10
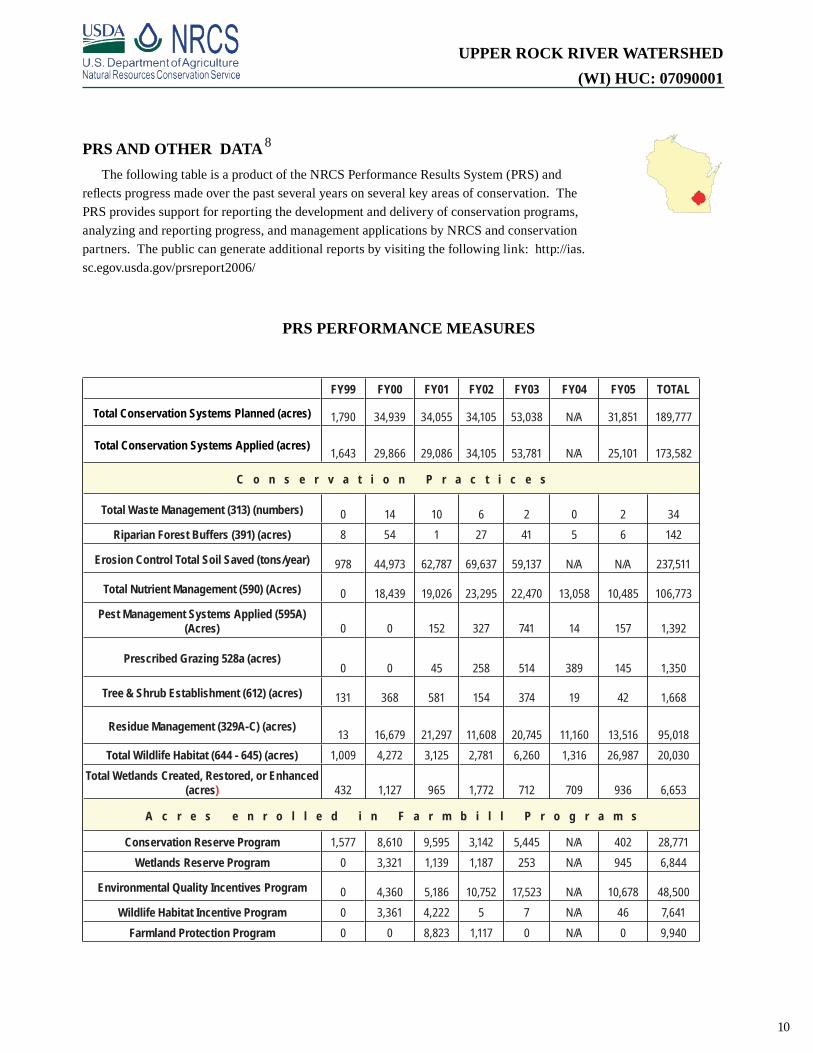
FY99 FY00 FY01 FY02 FY03 FY04 FY05 TOTAL
Total Conservation Systems Planned (acres) 1,790 34,939 34,055 34,105 53,038 N/A 31,851 189,777
Total Conservation Systems Applied (acres) 1,643 29,866 29,086 34,105 53,781 N/A 25,101 173,582
C o n s e r v a t i o n P r a c t i c e s
Total Waste Management (313) (numbers) 0 14 10 6 2 0 2 34Riparian Forest Buffers (391) (acres) 8 54 1 27 41 5 6 142
Erosion Control Total Soil Saved (tons/year) 978 44,973 62,787 69,637 59,137 N/A N/A 237,511
Total Nutrient Management (590) (Acres) 0 18,439 19,026 23,295 22,470 13,058 10,485 106,773Pest Management Systems Applied (595A)
(Acres) 0 0 152 327 741 14 157 1,392
Prescribed Grazing 528a (acres)0 0 45 258 514 389 145 1,350
Tree & Shrub Establishment (612) (acres) 131 368 581 154 374 19 42 1,668
Residue Management (329A-C) (acres)13 16,679 21,297 11,608 20,745 11,160 13,516 95,018
Total Wildlife Habitat (644 - 645) (acres) 1,009 4,272 3,125 2,781 6,260 1,316 26,987 20,030Total Wetlands Created, Restored, or Enhanced
(acres) 432 1,127 965 1,772 712 709 936 6,653
A c r e s e n r o l l e d i n F a r m b i l l P r o g r a m s
Conservation Reserve Program 1,577 8,610 9,595 3,142 5,445 N/A 402 28,771Wetlands Reserve Program 0 3,321 1,139 1,187 253 N/A 945 6,844
Environmental Quality Incentives Program 0 4,360 5,186 10,752 17,523 N/A 10,678 48,500Wildlife Habitat Incentive Program 0 3,361 4,222 5 7 N/A 46 7,641
Farmland Protection Program 0 0 8,823 1,117 0 N/A 0 9,940
PRS AND OTHER DATAThe following table is a product of the NRCS Performance Results System (PRS) and
refl ects progress made over the past several years on several key areas of conservation. The PRS provides support for reporting the development and delivery of conservation programs, analyzing and reporting progress, and management applications by NRCS and conservation partners. The public can generate additional reports by visiting the following link: http://ias.sc.egov.usda.gov/prsreport2006/
PRS PERFORMANCE MEASURES
8
UPPER ROCK RIVER WATERSHED(WI) HUC: 07090001
11
2002
Ag
Cen
sus D
ata
COLUMBIA
DANE
DODGE
FOND DU LAC
GREEN LAKE
JEFFERSON
WASHINGTON
WAUKESHA
TOTAL
FARM
S (N
UMBE
R)37
824
51,9
5226
018
759
317
110
4,041
LAND
IN FA
RMS
(ACR
ES)
86,39
643
,815
400,8
2254
,741
3,994
132,3
8648
,807
14,26
978
5,230
TOTA
L CRO
PLAN
D (A
CRES
)65
,614
35,30
133
7,904
46,46
93,1
4510
3,793
39,50
011
,702
643,4
27IR
RIGA
TED
LAND
(ACR
ES)
387
448
492
124
695,1
6328
611
27,0
81PR
INCI
PAL O
PERA
TOR
BY P
RIMA
RY O
CCUP
ATIO
N - F
ARMI
NG (N
UMBE
R)23
013
71,2
9417
412
418
208
562,5
27
FARMS BY SIZE
FARM
S BY
SIZ
E - 1
TO
9 ACR
ES28
2613
917
149
2517
301
FARM
S BY
SIZ
E - 1
0 TO
49 A
CRES
8273
434
543
233
101
471,0
28
FARM
S BY
SIZ
E - 5
0 TO
179 A
CRES
139
8171
595
829
111
829
1,476
FARM
S BY
SIZ
E - 1
80 T
O 49
9 ACR
ES87
4750
171
513
854
1191
3FA
RMS
BY S
IZE
- 500
TO
999 A
CRES
2712
121
151
2812
322
0FA
RMS
BY S
IZE
- 1,00
0 ACR
ES O
R MO
RE16
642
81
217
310
3
LIVESTOCK AND POULTRY
LIVES
TOCK
AND
POU
LTRY
- CA
TTLE
AND
CAL
VES
INVE
NTOR
Y (F
ARMS
)15
687
993
120
727
513
528
1,800
LIVES
TOCK
AND
POU
LTRY
- CA
TTLE
AND
CAL
VES
INVE
NTOR
Y - B
EEF
COW
S (F
ARMS
)56
2420
217
179
2913
422
LIVES
TOCK
AND
POU
LTRY
- CA
TTLE
AND
CAL
VES
INVE
NTOR
Y - M
ILK C
OWS
(FAR
MS)
5237
485
714
105
658
827
LIVES
TOCK
AND
POU
LTRY
- HO
GS A
ND P
IGS
INVE
NTOR
Y (F
ARMS
)20
710
99
141
134
204
LIVES
TOCK
AND
POU
LTRY
- SH
EEP
AND
LAMB
S IN
VENT
ORY
(FAR
MS)
229
556
131
87
139
LIVES
TOCK
AND
POU
LTRY
- LA
YERS
20 W
EEKS
OLD
AND
OLD
ER IN
VENT
ORY
(FAR
MS)
1910
828
158
186
203
LIVES
TOCK
AND
POU
LTRY
- BR
OILE
RS A
ND O
THER
MEA
T-TY
PE C
HICK
ENS
SOLD
(F
ARMS
)8
229
20
125
260
SELECTED CROPS HARVESTED
SELE
CTED
CRO
PS H
ARVE
STED
- CO
RN F
OR G
RAIN
(ACR
ES)
29,97
313
,461
127,4
0713
,805
1,220
37,68
110
,475
3,845
237,8
66SE
LECT
ED C
ROPS
HAR
VEST
ED -
CORN
FOR
SILA
GE O
R GR
EENC
HOP
(ACR
ES)
2,444
2,158
23,32
83,4
5914
05,0
983,2
5433
140
,212
SELE
CTED
CRO
PS H
ARVE
STED
- W
HEAT
FOR
GRA
IN, A
LL (A
CRES
)1,5
6457
59,6
101,9
7490
2,233
1,662
266
17,97
4SE
LECT
ED C
ROPS
HAR
VEST
ED -
WHE
AT F
OR G
RAIN
, ALL
- W
INTE
R W
HEAT
FOR
GR
AIN
(ACR
ES)
1,547
09,4
350
880
026
311
,332
SELE
CTED
CRO
PS H
ARVE
STED
- W
HEAT
FOR
GRA
IN, A
LL -
SPRI
NG W
HEAT
FOR
GR
AIN
(ACR
ES)
170
175
03
00
419
8
SELE
CTED
CRO
PS H
ARVE
STED
- OA
TS F
OR G
RAIN
(ACR
ES)
816
422
5,999
986
491,0
411,5
2319
511
,030
SELE
CTED
CRO
PS H
ARVE
STED
- BA
RLEY
FOR
GRA
IN (A
CRES
)44
2057
912
93
6328
36
1,127
SELE
CTED
CRO
PS H
ARVE
STED
- SO
YBEA
NS F
OR B
EANS
(ACR
ES)
12,82
57,4
1165
,913
7,604
449
26,32
77,7
763,3
1613
1,622
SELE
CTED
CRO
PS H
ARVE
STED
- FO
RAGE
- LA
ND U
SED
FOR
ALL H
AY A
ND A
LL H
AY-
LAGE
, GRA
SS S
ILAGE
, AND
GRE
ENCH
OP (S
EE T
EXT)
(ACR
ES)
10,38
16,6
5268
,692
11,25
447
915
,911
10,74
52,0
9112
6,205
SELE
CTED
CRO
PS H
ARVE
STED
- VE
GETA
BLES
HAR
VEST
ED F
OR S
ALE
(SEE
TEX
T)
(ACR
ES)
1,111
213
11,14
92,7
1727
01,2
0881
415
617
,637
SELE
CTED
CRO
PS H
ARVE
STED
- LA
ND IN
ORC
HARD
S (A
CRES
)10
1516
816
138
2815
291
9
UPPER ROCK RIVER WATERSHED(WI) HUC: 07090001
12
POPULATION ETHNICITY
Total PopulationUrban Population
Rural Population
White Alone
Hispanicor Latino
Two or more races
Black or African American Alone
Some other race alone
American indian and laska Native Alone
Asian Alone
Native Hawaiian and Other Pacifi c Islander alone
221,790 126,044 95,744 213,908 5,172 1,666 2,553 1,950 987 698 44
1990 2000 2004 Median Income*
Chenequa 601 583 594 163,428Oconomowoc Lake 493 564 638 112,760Lac La Belle 258 329 440 96,712Nashotah 567 1,266 1,378 77,406Merton 1,199 1,926 2,643 71,509Brownsville 415 570 553 62,679Delafi eld 5,347 6,472 6,767 61,938Hartland 6,906 7,905 8,672 58,359Doylestown 316 328 349 53,125Sun Prairie 15,333 20,369 25,392 51,345Oconomowoc 10,993 12,382 13,711 51,250Horicon 3,873 3,775 3,604 50,577Neosho 658 593 579 50,167Waterloo 2,712 3,259 3,282 49,221Slinger 2,340 3,901 4,358 47,125Fall River 842 1,097 1,280 46,597Hartford 8,188 10,905 13,017 46,561Lomira 1,542 2,233 2,410 46,522Marshall 2,329 3,432 3,561 46,141Johnson Creek 1,259 1,581 2,024 45,694Theresa 771 1,252 1,265 44,200Lake Mills 4,143 4,843 5,241 44,132Fort Atkinson 10,227 11,621 11,949 43,807Lowell 300 366 362 43,594Brandon 872 912 888 43,542Columbus 4,093 4,479 5,101 42,667Watertown 19,142 21,598 22,816 42,562Mayville 4,374 4,902 5,055 42,393Rio 768 938 998 42,292Juneau 2,157 2,485 2,587 42,162Iron Ridge 887 998 987 42,083Jefferson 6,078 7,338 7,592 40,962Hustisford 979 1,135 1,106 40,929Waupun 8,207 10,718 10,558 40,597Clyman 370 388388 378378 40,00040,000RandolphRandolph 1,7291,729 1,8691,869 1,8201,820 39,62039,620KekoskeeKekoskee 188188 169169 164164 38,75038,750Beaver DamBeaver Dam 14,19614,196 15,16915,169 15,15315,153 37,87337,873ReesevilleReeseville 673673 703703 692692 37,12037,120Fox LakeFox Lake 1,2691,269 1,4541,454 1,4581,458 36,60736,607
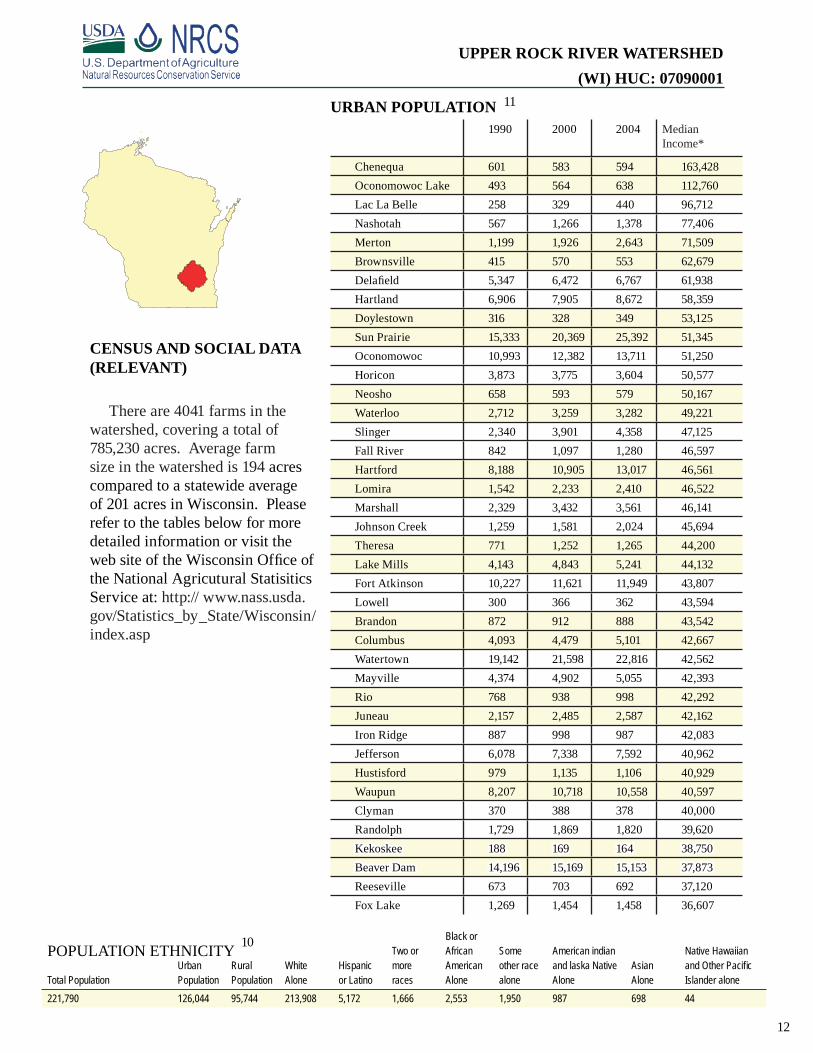
CENSUS AND SOCIAL DATA (RELEVANT)
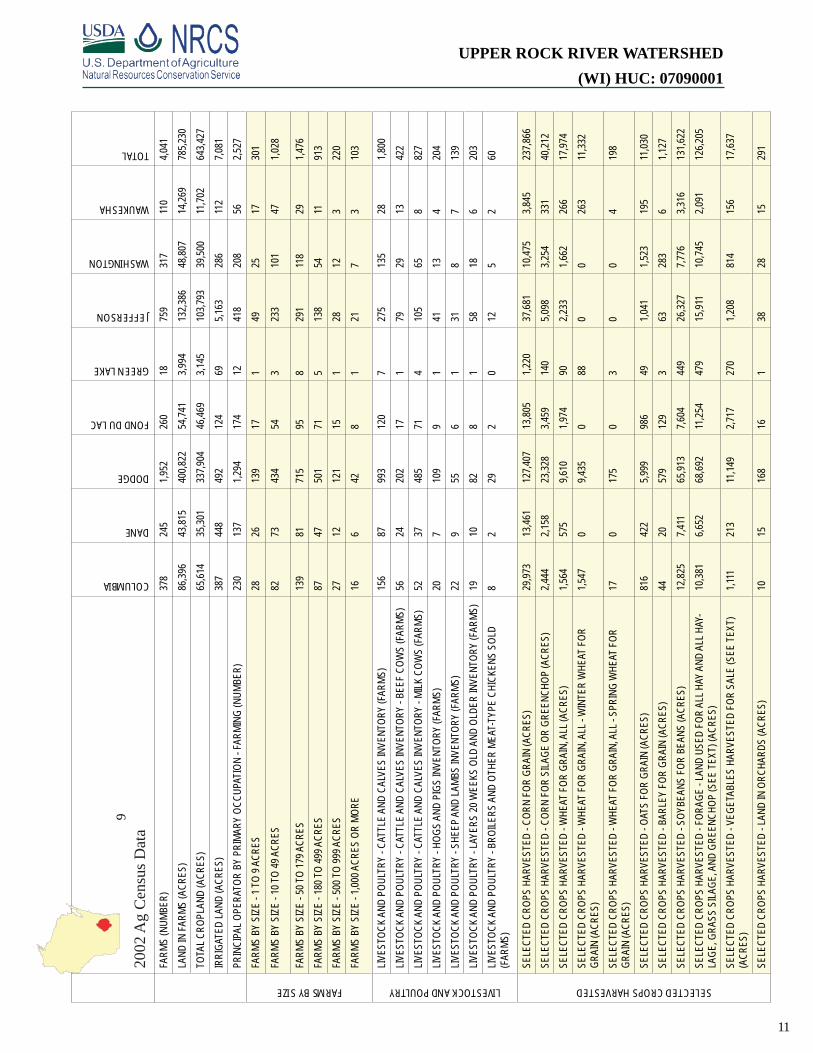
There are 4041 farms in the watershed, covering a total of 785,230 acres. Average farm size in the watershed is 194 acres compared to a statewide average of 201 acres in Wisconsin. Please refer to the tables below for more detailed information or visit the web site of the Wisconsin Offi ce of the National Agricutural Statisitics Service at: http:// www.nass.usda.gov/Statistics_by_State/Wisconsin/index.asp
URBAN POPULATION 11
10
UPPER ROCK RIVER WATERSHED(WI) HUC: 07090001
13
WATERSHED PROJECTS, STUDIES, MONITORING, ETC.
The Beaver Dam River, part of the Upper Rock River Watershed, was a Wisconsin Department of Natural Resources (WDNR) priority watershed in the 1990’s that provided cost-sharing and technical assistance for installing or adopting best management practices.
The WDNR also conducts ongoing, baseline monitoring in many streams and lakes within the watershed each year.
The Sand County Foundation has been developing nutrient management plans with farmers over the past 2 years as part of a multi-year, multi-million dollar Congressional earmark administered by Wisconsin NRCS. The Rock River Coalition, a local watershed group, has a citizen-led water quality monitoring program, installs demonstration projects and conducts many educational events.
PARTNER GROUPS• County Land Conservation Departments (Directory Link http://www.datcp.state.wi.us/arm/agriculture/land-water/conservation/pdf/ar-pub-119web_dec2005.pdf )
• River Alliance http://www.wisconsinrivers.org/
• Rock River Coalition http://www.rockrivercoalition.org/
• USDA Farm Service Agency http://www.fsa.usda.gov/wi/news/default.asp
• US Fish and Wildlife Service http://www.fws.gov/midwest/maps/wisconsin.htm
• UW Cooperative Extension http://www.uwex.edu/ces/ and http://basineducation.uwex.edu/rockriver/
• Wisconsin Department of Agriculture, Trade, and Consumer Protection http://www.datcp.state.wi.us
• Wisconsin Department of Natural Resources http://dnr.wi.gov
UPPER ROCK RIVER WATERSHED(WI) HUC: 07090001
14
ECOLOGICAL LANDSCAPES
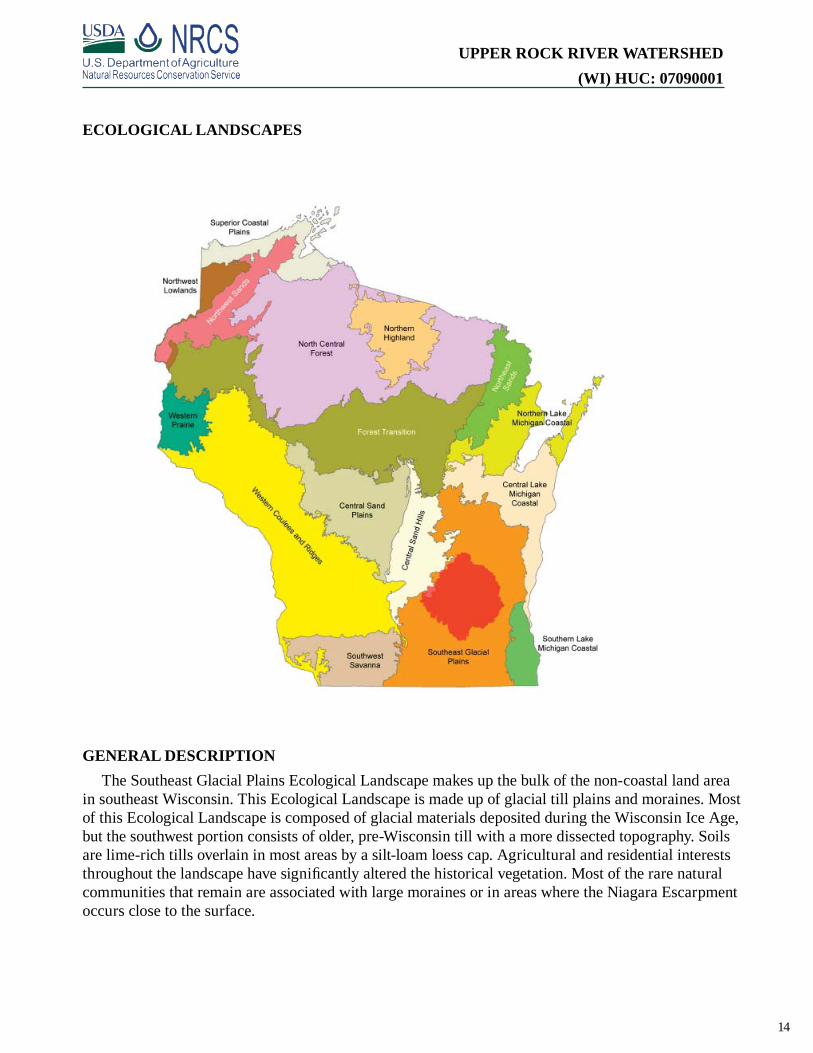
GENERAL DESCRIPTIONThe Southeast Glacial Plains Ecological Landscape makes up the bulk of the non-coastal land area
in southeast Wisconsin. This Ecological Landscape is made up of glacial till plains and moraines. Most of this Ecological Landscape is composed of glacial materials deposited during the Wisconsin Ice Age, but the southwest portion consists of older, pre-Wisconsin till with a more dissected topography. Soils are lime-rich tills overlain in most areas by a silt-loam loess cap. Agricultural and residential interests throughout the landscape have signifi cantly altered the historical vegetation. Most of the rare natural communities that remain are associated with large moraines or in areas where the Niagara Escarpment occurs close to the surface.
UPPER ROCK RIVER WATERSHED(WI) HUC: 07090001
15
FOOTNOTES/BIBLIOGRAPHYAll data is provided “as is.” There are no warranties, express or implied, including the warranty of fi tness
for a particular purpose, accompanying this document. Use for general planning purposes only.
1. Introduction and the description of resource concerns of the Upper Rock River Basin were derived from a report issued by the Wisconsin Department of Natural Resources titled “The State of the Rock River Basin”, 4/12, WDNR.
2. Common Resource Area (CRA) Map delineations are defi ned as geographical areas where resource concerns, problems, or treatment needs are similar. It is considered a subdivision of an existing Major Land Resource Area (MLRA) map delineation or polygon. Landscape conditions, soil, climate, human considerations, and other natural resource information are used to determine the geographic boundaries of a Common Resource Area. Online linkage: http://soils.usda.gov/survey/geography/cra.html.
3. The relief map was created using the National Elevation Dataset (NED) 1 arc second, approximately 30 meters, digital elevation model (DEM) raster product assembled by the U.S. Geological Survey (USGS). A hillshade grid was derived from the 30m DEM and draped over the DEM to symbolize the map and create a 3-D effect. The data was downloaded from the NRCS Geospatial Data Gateway http://datagateway.nrcs.usda.gov/. For more information about NED visit http://ned.usgs.gov/.
4. Average Annual Precipitation data was originated by Chris Daly of Oregon State University and George Taylor of the Oregon Climate Service at Oregon State University and published by the Water and Climate Center of the Natural Resources Conservation Service in 1998. Annual precipitation data was derived from the climatological period of 1961-1990. Parameter-elevation Regressions on Independent Slopes Model (PRISM) derived raster data is the underlying data set from which the polygons and vectors were created. For more information about PRISM visit http://www.ocs.orst.edu/prism/prism_new.html. Precipitation data was downloaded from the NRCS Geospatial Data Gateway http://datagateway.nrcs.usda.gov/.
5 The Land Use/Land Cover data was generated from the National Land Cover Dataset (NLCD) compiled from Landsat satellite TM imagery (circa 1992) with a spatial resolution of 30 meters and supplemented by various ancillary data (where available). The data was assembled by the USGS and published in June of 1999. The analysis and interpretation of the satellite imagery was conducted using very large, sometimes multi-state image mosaics. For more information about NLCD visit http://edcwww.cr.usgs.gov/programs/lccp/nationallandcover.html. The data was downloaded from the NRCS Geospatial Data Gateway http://datagateway.nrcs.usda.gov/.
UPPER ROCK RIVER WATERSHED(WI) HUC: 07090001
16
6. 303(d) listed streams were derived from the Water Quality Standards Section of the Wisconsin Department of Natural Resources (WIDNR) website: http://dnr.wi.gov/org/water/wm/wqs/303d/Lists303d/Approved_2004_303(d)_list.pdf. The sub-watersheds were acquired from the Upper Rock River Basin Page. For more information about the individual sub-watersheds visit http://dnr.wi.gov/org/gmu/gpsp/gpbasin/index.htm. For a list and explanation of Outstanding and Exceptional Resource Waters visit: http://dnr.wi.gov/org/water/wm/wqs/orwerw/.
7. Soil Survey Geographic Database (SSURGO) tabular and spatial data were downloaded for the following surveys: Dane., WI (WI025) Published 2006 01 23 Dodge Co., WI (WI027) Published 2006 03 03
Fond du Lac, WI (WI039) Published 2006 01 20 Green Lake Co., WI (WI027) Published 2006 03 03 Jefferson Co., WI (WI055) Published 2006 03 03
Waukesha Co., WI (WI602) Published 2006 01 20 Washington Co., WI (WI131) Published 2006 01 20Metadata and SSURGO data for the aforementioned surveys were downloaded from the NRCS Soil Data Mart at http://soildatamart.nrcs.usda.gov. Component and layer tables from the tabular data were linked to the spatial data to derive the soil classifi cations found in this section. Visit the online Web Soil Survey at http://websoilsurvey.nrcs.usda.gov for offi cial and current USDA soil information as viewable maps and tables.
8. Performance Results System (PRS) data was extracted from the PRS homepage by year, conservation systems and practices and Hydrologic Unit Code (HUC) level. HUC level reporting was not available where N/A is listed. For more information on these and other performance reports visit http://ias.sc.egov.usda.gov/prshome/.
9. Ag Census data were downloaded from the National Agricultural Statistics Service (NASS) Website and the data were adjusted by percent of HUC in the county. For more information on individual census queries visit the NASS website at http://www.nass.usda.gov/.
10. Population ethnicity data were extracted from the Census 2000 Summary File 3 compiled by the U.S. Census Bureau. The data were adjusted by Block Group percentage in the HUC. Population items were selected from the SF30001 table. For more information on census data and defi nitions visit http://www.census.gov/Press-Release/www/2002/sumfi le3.html.
11. Urban population and median household income data were derived from the American FactFinder assembled by the U.S. Census Bureau. American FactFinder is a quick source for population, housing, income and geographic data. For other census items and trends visit http://factfi nder.census.gov/home/saff/main.html?_lan