Embed Size (px)
Citation preview
Wisconsin
Comprehensive Annual Financial Report
For the fiscal year ended June 30, 2020

STATE OFWISCONSIN
Comprehensive Annual Financial Report
For the fiscal year ended June 30, 2020
Tony Evers, Governor
Department of Administration Joel Brennan, Secretary
Carol Herwig, State Controller
Prepared by the State Controller’s OfficeThis document is available electronically on the internet at: http://www.doa.wi.gov
State of WisconsinComprehensive Annual Financial ReportFor the Fiscal Year Ended June 30, 2020
Table of ContentsPageINTRODUCTORY SECTION
Letter of Transmittal........................................................................................................................................................................................... 2
GFOA Certificate of Achievement...................................................................................................................................................................... 13
Organizational Chart.......................................................................................................................................................................................... 14
Principal State Officials...................................................................................................................................................................................... 15
FINANCIAL SECTIONAuditor's Report................................................................................................................................................................................................. 19
Management's Discussion and Analysis............................................................................................................................................................ 23
Basic Financial Statements:
Government-wide Financial Statements:
Statement of Net Position............................................................................................................................................................................ 40
Statement of Activities.................................................................................................................................................................................. 42
Fund Financial Statements:
Governmental Funds:
Balance Sheet........................................................................................................................................................................................... 44
Statement of Revenues, Expenditures, and Changes in Fund Balances................................................................................................. 46
Proprietary Funds:
Statement of Net Position............................................................................................................................................................................ 48
Statement of Revenues, Expenses, and Changes in Fund Net Position..................................................................................................... 52
Statement of Cash Flows............................................................................................................................................................................. 54
Fiduciary Funds:
Statement of Fiduciary Net Position............................................................................................................................................................ 58
Statement of Changes in Fiduciary Net Position......................................................................................................................................... 60
Notes to the Financial Statements Index........................................................................................................................................................ 62
Notes to the Financial Statements.................................................................................................................................................................. 63
Required Supplementary Information:
Postemployment Benefits - State Health Insurance Program........................................................................................................................... 164
Postemployment Benefits - State Life Insurance Program................................................................................................................................ 165
Postemployment Benefits - Supplemental Health Insurance Conversion Credit Program................................................................................ 166
State's Proportionate Share of Net Pension Liability or Net Pension (Asset).................................................................................................... 167
State's Pension Contributions............................................................................................................................................................................ 168
Infrastructure Assets Reported Using the Modified Approach........................................................................................................................... 169
Budgetary Comparison Schedule - General Fund............................................................................................................................................. 172
Budgetary Comparison Schedule - Transportation Fund.................................................................................................................................. 173
Notes to Required Supplementary Information - Budgetary Information........................................................................................................... 175
Supplementary Information:
Nonmajor Governmental Funds:
Combining Balance Sheet.............................................................................................................................................................................. 182
Combining Statement of Revenues, Expenditures, and Changes in Fund Balances..................................................................................... 186
Budgetary Comparison Schedule Nonmajor Budgeted Governmental Funds............................................................................................... 190
Nonmajor Enterprise Funds:
Combining Statement of Net Position............................................................................................................................................................. 196
Combining Statement of Revenues, Expenses, and Changes in Fund Net Position..................................................................................... 200
Combining Statement of Cash Flows............................................................................................................................................................. 202
Internal Service Funds:
Combining Statement of Net Position............................................................................................................................................................. 208
Combining Statement of Revenues, Expenses, and Changes in Fund Net Position..................................................................................... 212
Combining Statement of Cash Flows............................................................................................................................................................. 214
(Continued)
Comprehensive Annual Financial ReportFor the Fiscal Year Ended June 30, 2020
PageSupplementary Information (Continued)
Fiduciary Funds:
Combining Statement of Fiduciary Net Position - Pension and Other Employee Benefit Trust Funds.......................................................................... 220
Combining Statement of Changes in Fiduciary Net Position - Pension and Other Employee Benefit Trust Funds....................................................... 221
Combining Statement of Fiduciary Net Position - Investment Trust Funds.................................................................................................................... 222
Combining Statement of Changes in Fiduciary Net Position - Investment Trust Funds................................................................................................. 223
Combining Statement of Fiduciary Net Position - Private-Purpose Trust Funds............................................................................................................ 224
Combining Statement of Changes in Fiduciary Net Position - Private-Purpose Trust Funds........................................................................................ 225
Combining Statement of Fiduciary Net Position - Custodial Funds............................................................................................................................... 226
Combining Statement of Changes in Assets and Liabilities - Custodial Funds.............................................................................................................. 227
STATISTICAL SECTION:Statistical Section Narrative and Table of Contents.......................................................................................................................................................... 230
Net Position by Component............................................................................................................................................................................................... 232
Changes in Net Position.................................................................................................................................................................................................... 234
Fund Balances of Governmental Funds............................................................................................................................................................................ 238
Changes in Fund Balances of Governmental Funds......................................................................................................................................................... 240
Personal Income by Industry............................................................................................................................................................................................. 242
Personal Income Tax Rates............................................................................................................................................................................................... 243
Personal Income Filers and Liability by Income Level...................................................................................................................................................... 244
Ratio of Outstanding Debt by Type.................................................................................................................................................................................... 245
Ratio of General Obligation Bonded Debt and Appropriation Bonds to Personal Income and Per Capita....................................................................... 246
Legal Debt Margin............................................................................................................................................................................................................. 248
Department of Transportation Revenue Bond Coverage.................................................................................................................................................. 249
Environmental Improvement Fund Revenue Bond Coverage........................................................................................................................................... 250
Petroleum Inspection Fee Revenue Bond Coverage........................................................................................................................................................ 251
Demographic and Economic Statistics.............................................................................................................................................................................. 252
Full Time Equivalent State Government Employees by Function/Program....................................................................................................................... 254
Operating Indicators by Function...................................................................................................................................................................................... 256
Capital Asset Statistics by Function.................................................................................................................................................................................. 258
Local Government Property Insurance Fund Ten-Year Claims Development Information................................................................................................ 260
Income Continuation Insurance Risk Pool Ten-Year Claims Development Information.................................................................................................... 262
Health Insurance Risk Pool (Pharmacy Benefit) Ten-Year Claims Development Information........................................................................................... 263
Health Insurance Risk Pool (Dental Benefit) Ten-Year Claims Development Information................................................................................................. 264
Duty Disability Ten Year Claims Development Information............................................................................................................................................... 265
Acknowledgments................................................................................................................................................................................................................ 266


INTRODUCTORY SECTION
1
December 21, 2020
The Honorable Tony EversThe Honorable Members of the LegislatureCitizens of the State of Wisconsin
We are pleased to submit the Comprehensive Annual Financial Report (CAFR) for the State of Wisconsin for the fiscal year ended June 30, 2020.
The State’s CAFR is prepared by the Department of Administration, Division of Executive Budget and Finance, State Controller's Office, which is responsible for the completeness and reliability of the information contained in this report, based upon a comprehensive framework of internal controls that it has established for this purpose. Because the cost of internal controls should not exceed anticipated benefits, the objective is to provide reasonable, rather than absolute, assurance that the financial statements are free of any material misstatements.
This report has been prepared in accordance with generally accepted accounting principles (GAAP) for governments as promulgated by the Governmental Accounting Standards Board (GASB). To report the State's financial activity, the State's budgetary funds are grouped into the fund types required by GAAP. As a result, the State's 68 budgetary funds have been analyzed, restructured and are currently reported in 59 GAAP funds. The most significant change has been to reclassify certain activities from the budgetary General Fund and present them in proprietary and fiduciary fund types more appropriate for the financial reporting of transactions related to commercial and trust activities. Notes 1-C and 1-D to the financial statements include a more detailed discussion of the GAAP fund types.
Independent Audit
In compliance with Wis. Stat. Sec. 13.94 (1)(c), the State Legislative Audit Bureau has performed an audit of and has issued an unmodified opinion on the State’s primary government basic financial statements included in this report. The independent auditor’s report is located at the front of the financial section of this report.
Management Discussion and Analysis
GAAP requires that management provide a narrative introduction, overview, and analysis to accompany the basic financial statements in the form of Management’s Discussion and Analysis (MD&A). This letter of transmittal is designed to complement MD&A and should be read in conjunction with it. The State’s MD&A can be found immediately following the auditor’s report.
STATE OF WISCONSIN DEPARTMENT OF ADMINISTRATION
TonyEvers,GovernorJoelBrennan,Secretary
BrianPahnke,Administrator
ExecutiveBudgetandFinance,StateController’sOffice,POBox7932,Madison,WI53707-7932Phone:(608)266-1694|DOA.WI.GOV
2
PROFILE OF THE STATE
The State of Wisconsin was admitted to the Union as the 30th state in 1848. Wisconsin, situated between Lake Michigan and the Mississippi River, covers 54,310 square miles and serves a population of 5.8 million.
Wisconsin government is divided into three branches. The executive branch, headed by the governor, includes five other elected constitutional officers, as shown on the organization chart on Page 12. The legislative branch includes the Wisconsin Legislature, which is composed of a 33-member senate and a 99-member assembly. The judicial branch includes the Wisconsin Supreme Court, the Court of Appeals, and circuit courts.
The State provides a full range of services that include commerce, education, transportation, environmental resources, human relations and resources, judicial, legislative and general administrative services. The financial statements present information on the financial position and operations of State government as a single comprehensive reporting entity. The various agencies, departments, boards, commissions and accounts of the State that constitute the State reporting entity are included in this report.
Component Units
In accordance with criteria established by the GASB, this report also includes component units which are legally separate organizations for which the State is financially accountable or receives a substantial benefit.
Discretely presented component units function independently and are presented separately from the data of the State. Discretely presented component units include the Wisconsin Housing and Economic Development Authority, Wisconsin Health Care Liability Insurance Plan, University of Wisconsin Hospitals and Clinics Authority, Wisconsin Economic Development Corporation, and the University of Wisconsin Foundation.
Although legally separate, a blended component unit is, in substance, part of the State’s operations. The Wisconsin Public Broadcasting Foundation, Inc., is the State’s only blended component unit.
Budgetary Process
The State's biennial budget is prepared on a mixture of cash and modified accrual bases of accounting and represents departmental appropriations based on agency requests reviewed by the Department of Administration and recommended by the Governor. The Governor's budget is submitted to the State Legislature for approval. Following debate, amendment and approval by the Senate and Assembly, the budget bill is returned to the Governor for his signature or veto in entirety or in part.
The State Constitution provides that no money shall be paid out of the Treasury except as appropriated by law. The Statutes require that the Secretary of Administration must approve all payments. The Department of Administration exercises detail allotment control over all agency appropriations and approval authority over all encumbrances.
The budgetary basis of accounting required by State law differs materially from the basis used to report revenues and expenditures in accordance with GAAP. The State's biennial budget is developed according to the statutorily required fund structure that, as previously noted, differs extensively from the fund structure used in the financial statements.
Wisconsin Retirement System and Accumulated Sick Leave Conversion Credit Program
The Wisconsin Retirement System (WRS) is a pension plan administered by the Department of Employee Trust Funds (DETF). The WRS provides coverage to all eligible employees of the State of Wisconsin and other participating local units of government. The most current actuarial valuations of this pension plan indicated that the WRS was funded at approximately 100.0 percent of liabilities for the 648,000 participants of the WRS. The State’s contribution to WRS represents approximately 31.6 percent of total contributions required of all participating entities.
The Accumulated Sick Leave Conversion Credit (ASLCC) benefit program, reported as an internal service fund and also administered by DETF, allows employees at the time of their retirement to convert the value of their accumulated unused sick leave into an account to be used to pay for post-retirement health insurance. The
3
actuarial value-based funded ratio of this program was 100.0 percent as of December 31, 2019 (the date of the most recent valuation).
ECONOMIC CONDITION AND OUTLOOK
In 2020, Wisconsin, along with the global economy, suffered a severe and sudden interruption in what had been more than a decade of steady economic growth due to the shock of the COVID-19 global pandemic. While Wisconsin and the nation have recovered from the worst of the employment declines inflicted by the pandemic and its effects, the pandemic's economic impacts continue to unfold.
Key highlights of Wisconsin's relative economic performance include:
• Wisconsin's unemployment rate increased drastically along with the national rate during the early stages of the pandemic, but has since fallen to 5.4 percent as of September 2020, well below the national rate of 7.9 percent for the same month. Volatility in the surveys for employment and unemployment this year make precise comparisons difficult, however.
• Wisconsin's labor force participation rate remains higher than the national average at 67.3 percent as of September 2020 compared to a national rate of 61.4 percent for the same month. Wisconsin's labor force participation rate is the 7th highest nationally based on September data, maintaining the state's strong relative standing.
• Since the low point in employment in April 2020, Wisconsin nonfarm payrolls have risen 10.4 percent, which is the 14th best rate of growth in the nation.
• Prior to the pandemic and its economic shock, Wisconsin's per capita personal income growth in 2019 was 3.1 percent, exceeding the Great Lakes region's growth rate of 2.9 percent.
Revenues for the first several months of Fiscal Year 2020 grew at a robust pace before the COVID-19 pandemic caused an immediate and severe decline in revenues during the initial mitigation measures that then moderated as the economy recovered. Total general fund tax collections increased 1.1 percent in Fiscal Year 2020 from Fiscal Year 2019. Individual income tax collections fell 2.8 percent, sales and use taxes rose 2.5 percent, while corporate income taxes surged 20.2 percent. Overall collections were ahead of budgeted estimates for Fiscal Year 2020, but were lower than the January 2020 reestimates by about $112.6 million. Corporate tax collections continued a pattern of strong performance largely due to significant audit payments and a shift from individual income taxes to corporate income taxes by pass-through entities electing to pay tax at the entity level under the corporate income tax.
Looking ahead, Wisconsin's recovery is expected to be largely determined by national trends. Due to the volatility in economic forecasts, a Wisconsin-specific forecast reflecting more current conditions is not available at this time. Instead, the following projections are from the November 2020 IHS Markit forecast for national economic conditions and presume that Wisconsin will largely follow national trends. National real GDP is expected to contract by 3.6 percent in 2020, followed by growth of 3.1 percent in 2021 and 2.5 percent in both 2022 and 2023. Personal income, boosted by federal government transfer payments, is expected to grow by 5.8 percent in 2020 before falling 1.4 percent in 2021 and then rising by 3.6 percent in 2022 and 4.4 percent in 2023. Total nonfarm payrolls are following the same trajectory as overall output nationally with a decline of 5.6 percent in 2020 and then increasing by 3.6 percent in 2021, 2.6 percent in 2022 and 1.4 percent in 2023. Since Wisconsin has seen job losses similar to the overall national trend, it is likely that Wisconsin's performance will continue to mirror the national patterns.
The State of Wisconsin continues to maintain its commitment to solid financial responsibility. An additional deposit of $105.8 million was made into the state's Budget Stabilization Fund in Fiscal Year 2020. This deposit raised the balance in the state's "rainy day" fund to $761.8 million at the end of Fiscal Year 2020, an amount which is nearly 140 percent higher than just two years ago and is its highest balance ever. In addition, the current fiscal year ended with a total fund balance of $1.5 million, a change of $764.6 million from a deficit of $(763.1) million reported in the prior year. This is the first time that the State’s General Fund has ended a fiscal year with a positive fund balance under Generally Accepted Accounting Principles since the State began issuing a CAFR in Fiscal Year 1990.
4
Investors and independent research recognize the strengths of the Wisconsin retirement system; Wisconsin's fully funded pension system and minimal other postemployment benefit (OPEB) liabilities continue to be recognized by the credit rating agencies. In August 2017 and October 2017, Moody's Investors Service, Fitch Ratings, and Kroll Bond Rating Agency all raised Wisconsin's credit rating, and in July 2019, Kroll Bond Rating Agency changed the rating outlook to positive from stable, citing Wisconsin's strong pension funding, conservatively managed budgets and improving economy. Higher credit ratings will lower borrowing costs and continue to improve Wisconsin's fiscal position.
Sound fiscal management has allowed critical expenditure needs to be addressed without raising taxes. From Fiscal Year 2015 to Fiscal Year 2020, school aids increased by $873.7 million (16.4 percent). During this same period, total Medicaid expenditures from all sources increased by $2.1 billion (24.2 percent), of which the general fund increase was $325.4 million (12.9 percent). The Fiscal Year 2020 Medicaid expenditures from the general fund decreased from Fiscal Year 2019 due to increased federal funding under the Families First Coronavirus Response Act.
In total, the State of Wisconsin's continued commitment to tax relief, financial responsibility and an enhanced business climate are yielding positive results. Wisconsin's combined state and local tax ranking has fallen from the 10th highest in Fiscal Year 2011 to the 23rd highest in Fiscal Year 2018 as the State reduced the tax burden on both households and businesses.
MAJOR INITIATIVES
Economic Development. Wisconsin's 2019-21 Biennial Budget established funding levels for the state for both Fiscal Year 2020 and Fiscal Year 2021. The 2019-21 Biennial Budget, together with subsequent legislation signed into law, enacted significant measures that will further Wisconsin's economic development by providing additional resources to improve the state's roads, bridges and harbors; improve broadband service across the state; and deliver income tax reductions to boost household buying power.
The 2019-21 Biennial Budget provided substantial new funding for transportation projects across the State of Wisconsin. It invests more ongoing revenue than ever before in Wisconsin's transportation infrastructure, while at the same time holding transportation bonding to its lowest level in 20 years. Increases were provided to improve and maintain both state and local roads – including large funding increases for the State Highway Rehabilitation program and a 10 percent increase in funding for general transportation aids paid to counties, towns, villages and cities.
The 2019-21 Biennial Budget also provides $48 million across the biennium to expand the Broadband Expansion Grant program to reach more underserved areas of the state.
Household buying power will be enhanced by the combination of two individual income tax rate reductions targeting lower and middle income earners. Fully implemented in tax year 2020, these rate reductions will provide a typical middle class single filer with an income tax reduction of approximately $194 annually and a middle class married-joint filer with a reduction of $261 annually. By reducing the lowest two individual income tax bracket rates, these changes provide a progressive shift in the state's individual income tax structure. This benefit to lower and middle income earners will be provided while keeping property taxes affordable for Wisconsin homeowners by roughly aligning expected property tax changes with estimated inflation.
Complementing more general tax relief initiatives, the State has also expanded targeted business incentives in recent years to enhance the State's ability to attract and retain key employers. The State's two primary economic development tax incentives are the Enterprise Zone Jobs Credit and the Business Development Credit. Both are refundable credits that provide incentives for businesses retaining or creating jobs or making substantial capital investments in the state. The Enterprise Zone Jobs Credit program was formerly limited to 30 zones in the state, but those limits were repealed by 2017 Wisconsin Act 369, which allows the Wisconsin Economic Development Corporation to request the creation of an unlimited number of zones, subject to approval by the Joint Committee on Finance. The Business Development Tax Credit program is subject to a $22 million annual award limit and provides incentives related to job creation and retention, workforce training, capital investment, and headquarters retention and relocation.
5
In addition, the State offers a variety of programs that target minority and rural business development, dairy manufacturing and agricultural production. Through the end of Fiscal Year 2020, over 600 businesses had been certified as minority-owned to increase the opportunity for these firms to sell their products and services to the State of Wisconsin. Further, a variety of sales tax exemptions for fuel, electricity, farm machinery, veterinary services, and other personal property and supplies have reduced farming costs in the state by over $200 million annually.
Wisconsin's Farmland Preservation Credit programs provide credits to approximately 11,000 farmers, who qualify through farmland preservation zoning or individual farmland preservation agreements. The credit is calculated based on qualifying acres and certain other criteria. Expenditures under the program were $17.1 million in Fiscal Year 2020.
At the end of 2019, Wisconsin was home to more than 7,000 dairy farms with almost 1.28 million cows. Wisconsin's milk production continues to grow as the dairy farms in the state yielded more than 30.6 billion pounds of milk in 2019. Wisconsin accounts for more than 14 percent of the nation's milk production. Milk production per cow in Wisconsin continues to grow and was at 24,152 pounds per year in 2019. Dairy production and processing accounts for $45.6 billion in economic activity, almost half of all economic activity associated with agriculture, and accounts for nearly 157,100 jobs.
In 2019, Wisconsin was the nation's top cheese producing state with over 3.36 billion pounds of cheese, more than 26 percent of the nation's cheese production. Wisconsin's nearly 1,200 licensed cheesemakers produce over 600 types, styles and varieties of cheese. Wisconsin's specialty cheese production also continues to increase, producing over 818 million pounds in 2019.
Wisconsin exported $3.3 billion in agricultural products to 151 countries in 2019. Wisconsin currently ranks 13th among U.S. states in agricultural exports. Wisconsin's top five markets for agricultural exports were Canada, Mexico, China, Korea and Japan. Wisconsin ranked first in the export of bovine genetics, ginseng, raw furskins, prepared/preserved sweet corn and prepared/preserved cranberries. Wisconsin ranked second in the export of cheese and whey.
The State continued to encourage private investment in entrepreneurial activities with the Angel Investment and Early Stage Seed Investment tax credit programs, which initially became effective for tax years beginning after January 1, 2005. Through the programs, individuals and businesses are eligible for tax credits equal to a portion of the investment made in qualified new business ventures. In Fiscal Year 2020, 50 new companies were certified as qualified new business ventures. There were 248 active qualified new business ventures in total as of June 30, 2020.
Similar to other states, in mid-2020, Wisconsin experienced a spike in unemployment claims due to the COVID-19 pandemic. However, Wisconsin's unemployment rate improved more quickly than many other states. By September 2020, Wisconsin's unemployment rate was 2.5 percent lower than the national unemployment rate.
The Department of Workforce Development's efforts related to the state's Fast Forward program continue to address the state's need for an increasingly skilled workforce. The program provides funding for employer-led customized training for new or current employees, as well as teacher and nurse training, high school technical education (including certifications, dual enrollment programs and advanced manufacturing equipment) and employee resource networks. In 2019, Wisconsin Fast Forward awarded $14.3 million in grants.
Transportation. The State continued to make significant investments in transportation infrastructure through reconstruction of existing highways and bridges and through aid to local governments. In Fiscal Year 2020, 556 miles of State Trunk Highway and local highways were improved, and work was initiated or completed to rehabilitate or replace 501 deficient state and local bridges. Some of these investments took place as the state faced the many challenges brought by the COVID-19 public health emergency, and demanded a strong focus on health and safety at all work sites. In Fiscal Year 2020, more than $1.09 billion in construction projects on state and local road systems were contracted through the Department of Transportation. In addition, in Calendar Year 2020, 97.2 percent of state bridges were rated fair or better condition.
6
Significant project milestones in Fiscal Year 2020 include:
• The I-94 North-South project opened all lanes to traffic in June. The project's total $1.6 billion investment spanned 35 miles of Interstate highway to add capacity and create the first brand new interchanges in the Milwaukee area since the early 1970s.
• The I-94 East/West project design has been restarted with efforts currently underway to complete the Record of Decisions and prepare for construction. The I-43 project design process has also been restarted.
• The North Leg of the Zoo Interchange has begun with the preliminary work well underway. The project will complete the $1.7 billion Zoo Interchange project by investing the final $150.4 million. Work will take three years with mainline impacts being seen in later winter 2021.
• Proposed expansion of I-41 between WIS 96 in the city of Appleton and County F in the city of De Pere officially kicked off this year. The department is exploring options to improve I-41 within the project limits to address numerous safety and operational issues. Environmental document completion is expected in April 2021 with approval in November 2021. Final engineering will occur from 2022 to 2024; currently, there is no date set for construction.
• WIS 23 expansion is progressing with additional lanes opened in Sheboygan County. Work on WIS 23 near Fond du Lac is ongoing and will continue in 2021. The entire $168.7 million Majors project will finish in late 2022.
• Verona Road (US 18/151), Dane County entered its final year. Crews reconstructed and expanded County PD/McKee Road between Fitchrona Road and Commerce Park Drive, including the Verona Road interchange. The seven-year project was completed in November 2020.
• Interstate 39/90, Dane and Rock counties is ongoing, with most of the Interstate mainline completed this year and the opening of additional lanes to full capacity this fall. Complete transformations are underway for interchanges in Madison (US 12/18), Janesville (WIS 26 and US 14) and Beloit (I-43 and WIS 81). The entire Interstate project is expected to be completed in fall 2021.
• WIS 35, Vernon County is part of the Great River Road National Scenic Byway along the state's western border with Minnesota and Iowa. The 2020 project resurfaced WIS 35 between Genoa and Stoddard, replaced four bridge structures, and performed an urban reconstruction in Stoddard.
• The East 2nd Street (US 2/53) project in Superior repaired concrete pavement and updated manholes, inlets and traffic signals as well as curb ramps for pedestrian crossings. An additional segment of work on East 2nd Street is planned in 2021. Combined, the projects total $12.42 million.
• In partnership with the Minnesota Department of Transportation, a $63.4 million project to replace the US 63 bridges over the Mississippi River at Red Wing, Minnesota, is nearing completion. A joint effort involving local, state and federal resources opened the Eisenhower Bridge of Valor in November 2019, with the former structure dismantled in 2020.
The department continued its focus on effective use of resources and performance improvement. Examples from Fiscal Year 2020 include:
• The Culvert Asset Management Program (CAMP) received a prestigious 2020 Esri Special Achievement award. Department engineers developed CAMP using mobile and GIS technologies to streamline workload and create uniform condition reporting. Culvert inspection productivity has doubled.
• Continued efforts to work with county highway staffs on training, salt management practices and liquid winter maintenance treatments. Overall, these efforts saved 203 million tons of salt, valued at
7
approximately $8.1 million, in the 2019-20 winter. A new record was set during that time frame with 11.4 million gallons of liquids; 2.1 million gallons more than the previous year.
• The department and its county partners remain committed to using less salt to achieve cost-savings while being environmentally focused and still providing the expected level of service on the state highway system. Fifty-five of 72 counties used salt more efficiently during the 2019‑20 winter season and applied less to roadways compared to their five-year averages.
• The Division of Motor Vehicles made additional changes to some on-line applications to further promote the "eNotify" program to its customers. These changes assisted in enrolling an additional 160,000 customers, for a total postage savings of $85,000 in Fiscal Year 2020.
• During the pandemic, the Division of Motor Vehicles quickly implemented two pilot programs to assist customers with driver licensing transactions which would typically require an in-person visit. Effective May 2020, the Division of Motor Vehicles implemented a road test waiver program for persons under the age of 18 that have completed all other driver education requirements and have sign-off by a parent/sponsor. During the first five months, 26,000 new drivers and their parents took advantage of this opportunity. The second pilot program allows persons age 64 and younger to renew their driver license on-line. More than 47,000 drivers took advantage of this program between May and October 2020.
• An update to the long-range statewide multimodal transportation plan, Connect 2050, was begun in Fiscal Year 2020. This long-range plan will inform the department's decision making about changes to and investments in our statewide system. Activities in Fiscal Year 2020 mainly included public involvement and stakeholder outreach that will be considered when the department sets the policy direction in the plan. Writing the plan, and a second phase of public involvement will be conducted in Fiscal Year 2021, with an anticipated completion date of summer/fall 2021.
• The department remains focused on continuous improvement. In Fiscal Year 2020, department staff completed 34 projects that resulted in the repurposing of 16,530 hours of staff time with $346,836.30 in annual costs saved and $730,224 in one-time cost savings.
• Performance remains a top priority for the department. The department continues to publish its Mobility, Accountability, Performance, Safety and Service (MAPSS) Performance Improvement Program report quarterly, reporting progress in five key core goals areas to create a result driven environment, inform the public and policymakers on the department's progress in fulfilling its mission, and provide transparency and accountability for results.
In Fiscal Year 2020 the department continued its emphasis on transportation safety:
• In Fiscal Year 2020, the Bureau of Transportation Safety, within the Division of State Patrol, organized and funded multijurisdictional, high-visibility enforcement task forces to improve services statewide. In Fiscal Year 2020, the bureau increased task force participation by 28 agencies statewide. During the fiscal year, there were 39 seat belt task forces, 24 impaired driving task forces, 37 speed enforcement task forces and 2 task forces focusing on pedestrian right-of-way laws. Officers from 301 law enforcement agencies participated in these efforts.
• The Bureau of Transportation Safety continues to evolve its use of data and collaboration and has expanded its predictive analytics program and is sending out quarterly hotspot information reports to post to each State Patrol post to assist in efficiently planning and pursuing traffic safety concerns. The bureau and University of Wisconsin-Madison Traffic Operations and Safety Laboratory continue to improve the analysis processes and data sources of Community Maps. These efforts provide all Community Maps users with more accurate, timely and uniform information for planning, education and collaboration opportunities.
• The Bureau of Transportation Safety and other law enforcement agencies adapted procedures to safely conduct operations during the current pandemic. During this time, agencies continued to respond to traffic safety in the safest manner possible in order to protect both health and transportation safety. The
8
bureau and the department's Office of Public Affairs adapted the safety messaging plan in response to the pandemic's closure of sports venues and other public gatherings. The bureau and the University of Wisconsin-Madison Traffic Operations and Safety Laboratory completed the public and partner survey for the next edition of the Wisconsin Strategic Highway Safety Plan with over 1,100 surveys completed and turned in to the University of Wisconsin-Madison Traffic Operations and Safety Laboratory. The information received will help the bureau create a more inclusive and responsive plan for transportation safety.
• The Bureau of Transportation Safety is leveraging grant opportunities with nongovernmental agencies to garner funds to better educate the driving public on drug impairment, and to study the role drug-impaired driving has on Wisconsin roads. This will aid transportation safety to develop new countermeasures and initiatives to improve safety.
The department also worked proactively with industry, counties and partnering stakeholders on solutions to maintain department operations during the coronavirus pandemic.
• The department has engaged with a number of stakeholder groups informally and through structured advisory committees. Specifically, the department kicked off two stakeholder committees in 2020 – the Wisconsin Non-Driver Advisory Committee and the Wisconsin Automated Vehicle External Committee. Comprised of a range of stakeholder interests from government, the private sector, academia and advocacy groups, both committees were created to provide the department with feedback on critical issues focused on their topical areas of interest. The department used virtual meeting technology to host meetings with both committees. In addition, department staff met with the Transportation Stakeholder Task Force (formed in 2019) earlier this year. Plans are underway to host a meeting prior to the close of Calendar Year 2020.
• The department's work with technology was critical in creating seamless working solutions for hundreds of teleworking and field staff as statewide precautions were implemented to work remotely as much as possible. This transition was supported by statewide implementation of advanced cloud-based IT systems such as file-sharing (Box.com), electronic signatures (DocuSign), and collaborative design-review technologies for Plans, Specifications and Estimates (PS&E) plan review (Bluebeam) and collaboration platform (MS Teams). The Division of Transportation System Development's Innovation Program has continued to pilot and implement process improvements and technologies to streamline business activities and support key division efforts such as transportation asset management and project delivery.
• In March 2020, the department proactively evaluated ways to continue delivering exceptional public involvement on highway projects across the state while maintaining safe social distancing. On-line efforts were quickly discussed between the department and the Federal Highway Administration to meet any environmental requirements. The department has virtually held dozens of public involvement meetings through project Web sites, recorded presentations on YouTube and traditional letter mailings. In addition, new guidance was circulated for distancing and handwashing stations at work sites.
• The iconic Merrimac Ferry underwent major mechanical repairs and repainting during the winter months and resumed operations as scheduled in April 2020 with guidelines to accommodate passengers and staff during the pandemic. There was great collaboration between the department and Columbia County staff to maintain safety and mobility.
• The department also altered policies to ensure timely delivery of freight as businesses worked to meet increased customer demand on grocery and household products. This involved temporary processes enabling heavier than standard legal loads as well as keeping the state's full inventory of rest areas and weight facilities clean and operational to ensure safe rest periods for commercial drivers.
• Wisconsin also distributes state transportation user fee revenues to local governments for transportation infrastructure improvements and transit operating assistance, targeting economic and infrastructure development. In Fiscal Year 2020, $798 million was provided to local governments for these purposes.
9
• The Transportation Economic Assistance program provides grants of up to $1 million to communities for infrastructure improvements that are essential for economic development projects that attract employers to Wisconsin or encourage businesses to remain and expand in the state. In Calendar Year 2020, the Transportation Economic Assistance program awarded grants to eight communities totaling approximately $3.3 million.
Environment. Wisconsin's Warren Knowles-Gaylord Nelson Stewardship Program and its successor, the Warren Knowles-Gaylord Nelson Stewardship 2000 Program, are available for land acquisition, easements and nature-based outdoor recreational property development activities. The original Stewardship Program committed $250 million through the sale of general obligation bonds and the use of federal grant monies for various resource development and land protection activities, including acquisition of State park lands, protection of urban rivers and assistance to local parks. The program was reauthorized in 2007 Wisconsin Act 20 through Fiscal Year 2020 with an annual bonding authority of $86 million beginning in Fiscal Year 2011. The 2011-13 Biennial Budget subsequently reduced the annual bonding authority to $60 million beginning in Fiscal Year 2012. Under 2013 Wisconsin Act 20, the annual bonding authorization was reduced further to $47.5 million in Fiscal Year 2014 and $54.5 million in Fiscal Year 2015. Finally, under 2015 Wisconsin Act 55 and 2019 Wisconsin Act 9, the annual authorization was reduced to $33.3 million in Fiscal Year 2016 through Fiscal Year 2022, the revised program end date. During Fiscal Year 2019, the State encumbered $1,140,967 in Stewardship Program financing to acquire over 15,361 acres of public recreational land through acquisition and recreational easement. Some encumbered Fiscal Year 2020 properties may include acquisitions which will close in Fiscal Year 2021. An additional $7,502,126 in Stewardship grants was awarded to local governments and nonprofit conservation organizations for the acquisition of easements and title in fee.
In addition to land acquisition through the Stewardship Program, Wisconsin's efforts to protect and enhance its natural resources include partnerships with individual landowners. In November 2001, the State entered into an agreement with the U.S. Department of Agriculture for the authority to enroll up to 100,000 acres of Wisconsin farmland in the Conservation Reserve Enhancement Program. The federal government will provide up to $200 million for the program, which will be matched by the State with up to $28 million from the sale of general obligation bonds. As of October 1, 2020, total State payments to landowners for both newly-enrolled and reenrolled contracts amounted to just over $20.1 million on approximately 70,000 acres. The State's payments to date will leverage federal payments to program participants 7 to 1 over the course of the program contracts.
Wisconsin's Environmental Improvement Fund (clean water fund program and safe drinking water loan program) provides financial assistance to municipalities for the planning, design and construction of wastewater collection and treatment, and drinking water treatment and distribution facilities. Most communities applying for assistance receive subsidized loans. Funding is provided from a State-matched federal capitalization grant and through State revenue bonds and repayments from loans previously made. In addition, the federal capitalization grant has been leveraged through the issuance of revenue bonds on the clean water side of the fund, and since November 2019, on the safe drinking water loan program side. In Fiscal Year 2020, the Environmental Improvement Fund awarded $370.6 million to municipalities for 60 projects and amendments. This brings the total amount of loans and grants awarded to $5.9 billion since its inception in 1991. The funding has financed high-priority infrastructure projects to ensure clean water and safe drinking water across the state.
Human Resources. In Fiscal Year 2020, Medical Assistance program expenditures were lower than budgeted, and program enrollment increased in several key enrollment groups. Fiscal Year 2020 expenditures for the Medical Assistance program increased by approximately 5.4 percent over the prior year, compared with a 7.8 percent increase in Fiscal Year 2019 and 3.4 percent growth in Fiscal Year 2018. Medical Assistance expenditures from all funds totaled $10.8 billion in Fiscal Year 2020. In Fiscal Year 2020, GPR expenditures decreased by $160.8 million from Fiscal Year 2019. The decrease was primarily driven by the increased matching rate the Medical Assistance program received under the federal Families First Coronavirus Response Act. Average monthly enrollment in Medical Assistance programs increased by 1.92 percent between Fiscal Years 2019 and 2020, compared to a decrease of 0.54 percent between Fiscal Years 2018 and 2019 and a decrease of 0.18 percent between Fiscal Years 2017 and 2018.
In Fiscal Year 2020, average monthly enrollment of low-income adults and children in the BadgerCare Plus program increased by 2.30 percent, approximately 18,200 individuals, while the average monthly enrollment of elderly individuals and people with disabilities increased by 4.15 percent, approximately 9,500 individuals. In
10
Fiscal Year 2020, the enrollment increase was primarily driven by the economic effects of the coronavirus pandemic and the continuous coverage provision of the federal Families First Coronavirus Response Act.
Expenditures for the SeniorCare pharmacy assistance program totaled $109.4 million from all funding sources, representing a 3.7 percent increase over the prior year. Of the "all funds" amounts, actual Fiscal Year 2020 GPR expenditures totaled $9.9 million, a $0.1 million increase from Fiscal Year 2019. Average monthly enrollment in SeniorCare increased by 1.67 percent in Fiscal Year 2020.
The Department of Children and Families continued the State's commitment to seek permanent placements for children referred to the State's child welfare system in Fiscal Year 2020. This included finalizing 764 public adoptions in Fiscal Year 2020. In other program areas, the Wisconsin Shares subsidy program had expenditures in Fiscal Year 2020 of $311.2 million, which was approximately $35.4 million above Fiscal Year 2019 expenditures, but $31.0 million below the amount originally budgeted for Fiscal Year 2020. Under Wisconsin Shares, a monthly average of 36,582 children received subsidies in Fiscal Year 2020. Benefit payments under the Wisconsin Works (W-2) program for Fiscal Year 2020 totaled $26.7 million, an increase of $0.9 million from the Fiscal Year 2019 amount. An average of 5,374 families received cash benefits each month in Fiscal Year 2020 under the W-2 program. During Federal Fiscal Year 2020, state and county child support partnership efforts provided full case management services to 345,855 cases and provided financial management services to an additional 165,497 cases.
Education. Overall state school aids and property tax credits totaled approximately $7.2 billion in 2019‑20. This was a $173.9 million increase from the 2018-19 figure of just over $7 billion. Actual state school aids, not including property tax credits, that are paid directly to school districts totaled roughly $6.1 billion in 2019‑20.
The largest increases in individual state school aid appropriations were in: (a) per pupil categorical aid, which all school districts receive; (b) state general equalization aid, which continued to be the state's largest GPR-funded appropriation; and (c) special education aid, which reimburses school districts for a portion of special education costs and had been held flat for several biennia. In addition, school districts were provided a revenue limit increase in 2019-20 of $175 per pupil. Further, the low revenue threshold that permits school districts to increase their state and local revenues per pupil without having to go to referendum was increased by $300 per pupil to $9,700 for the 2019-20 school year.
In Fiscal Year 2020, Wisconsin continued to enhance transparency and accountability in education. At the elementary and secondary education level, all school districts and most individual public schools, independent charter schools and private schools participating in the state's voucher programs continued to receive report cards that provide them with an annual rating.
In addition, the portion of Wisconsin Technical College System general aid allocated on the basis of performance on ten criteria remained at 30 percent. These criteria measure individual campuses on metrics related to state workforce and educational needs, such as job placement, technical skill attainment and dual enrollment. Further, the University of Wisconsin System distributed $48.8 million of state funding using an outcomes-based formula.
State support for the University of Wisconsin System totaled $1,075.7 million in Fiscal Year 2020; a $44.6 million, or 4.1 percent, decrease from Fiscal Year 2019. To maintain a reasonable cost of higher education for State residents, the Governor continued a freeze on in-state undergraduate tuition rates and maintained support for state need-based financial aid programs in Fiscal Year 2020.
AWARDS AND ACKNOWLEDGMENTS
Award
The Government Finance Officers Association of the United States and Canada (GFOA) awarded a “Certificate of Achievement for Excellence in Financial Reporting” to the State of Wisconsin for its Comprehensive Annual Financial Report for the fiscal year ended June 30, 2019. The Certificate of Achievement is a prestigious national award recognizing conformance with the highest standards for preparation of state and local government financial reports.
11
In order to be awarded a Certificate of Achievement, a government unit must publish an easily readable and efficiently organized comprehensive annual financial report whose contents conform to program standards. Such reports must satisfy both generally accepted accounting principles and applicable legal requirements.
A Certificate of Achievement is valid for a period of one year only. This is the 24th year the State has received this award. We believe our current report continues to conform to the Certificate of Achievement Program requirements and we plan to submit it to the GFOA.
Acknowledgments
We wish to express our appreciation to the many individuals whose dedicated efforts have made this report possible. The preparation of this report could not have been accomplished without the professionalism and dedication demonstrated by the financial managers and accountants of the State agencies and component units, along with staff within the State Controller's Office.
Sincerely,
Joel BrennanSecretary
Carol Herwig, CPAState Controller
12

Government Finance Officers Association
Certificate ofAchievementfor Excellencein FinancialReporting
Presented to
State of Wisconsin
For its Comprehensive AnnualFinancial Report
for the Fiscal Year Ended
June 30, 2019
Executive Director/CEO
13
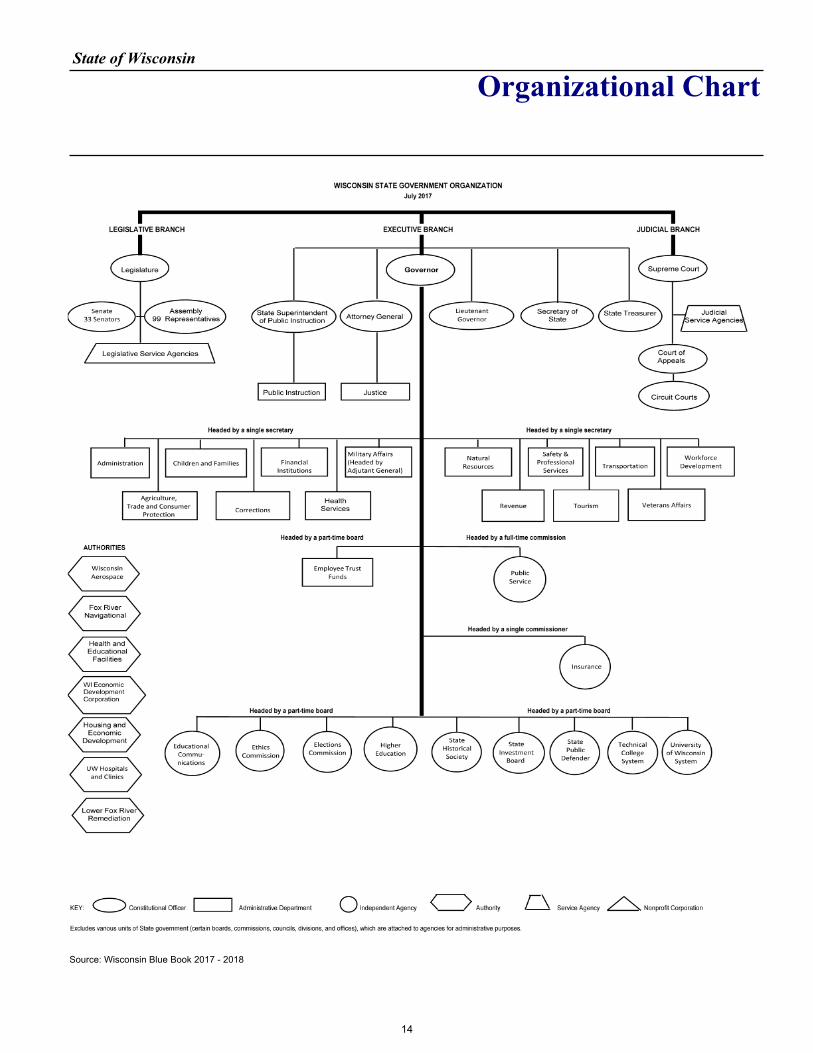
State of Wisconsin
Organizational Chart
Source: Wisconsin Blue Book 2017 - 2018
14
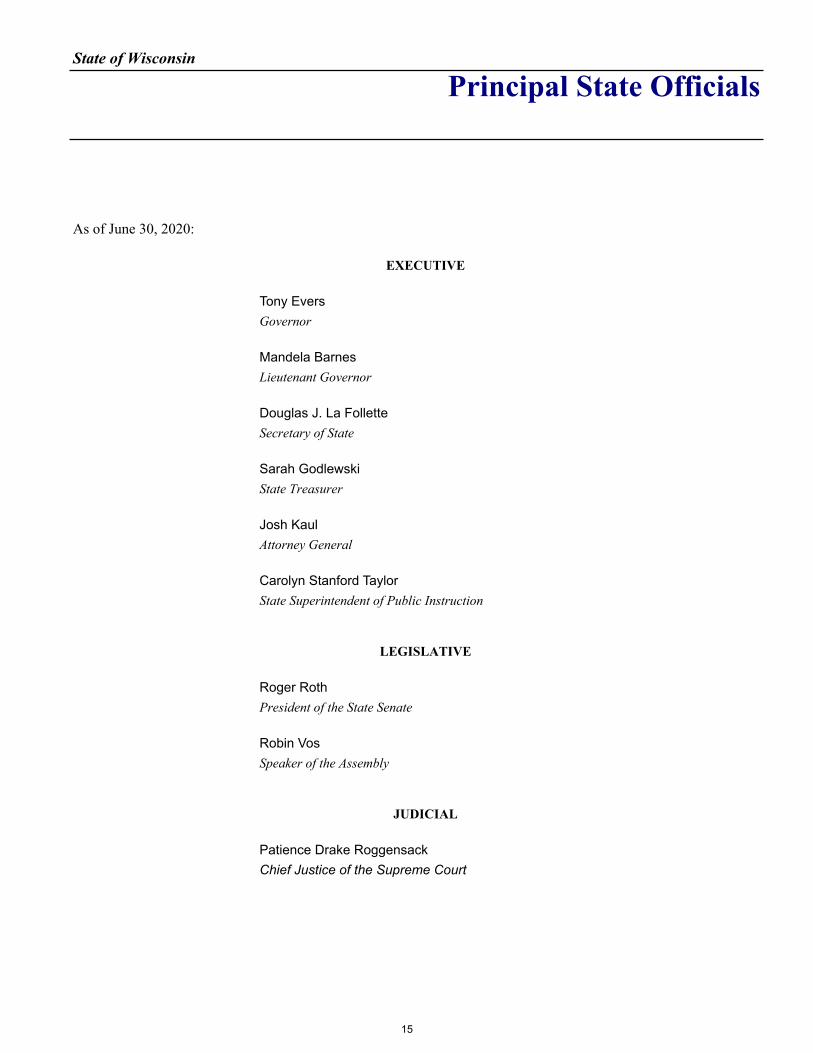
State of Wisconsin
Principal State Officials
As of June 30, 2020:
EXECUTIVE
Tony EversGovernor
Mandela BarnesLieutenant Governor
Douglas J. La FolletteSecretary of State
Sarah GodlewskiState Treasurer
Josh KaulAttorney General
Carolyn Stanford TaylorState Superintendent of Public Instruction
LEGISLATIVE
Roger RothPresident of the State Senate
Robin VosSpeaker of the Assembly
JUDICIAL
Patience Drake RoggensackChief Justice of the Supreme Court
15

16

FINANCIAL SECTION
17

18
19
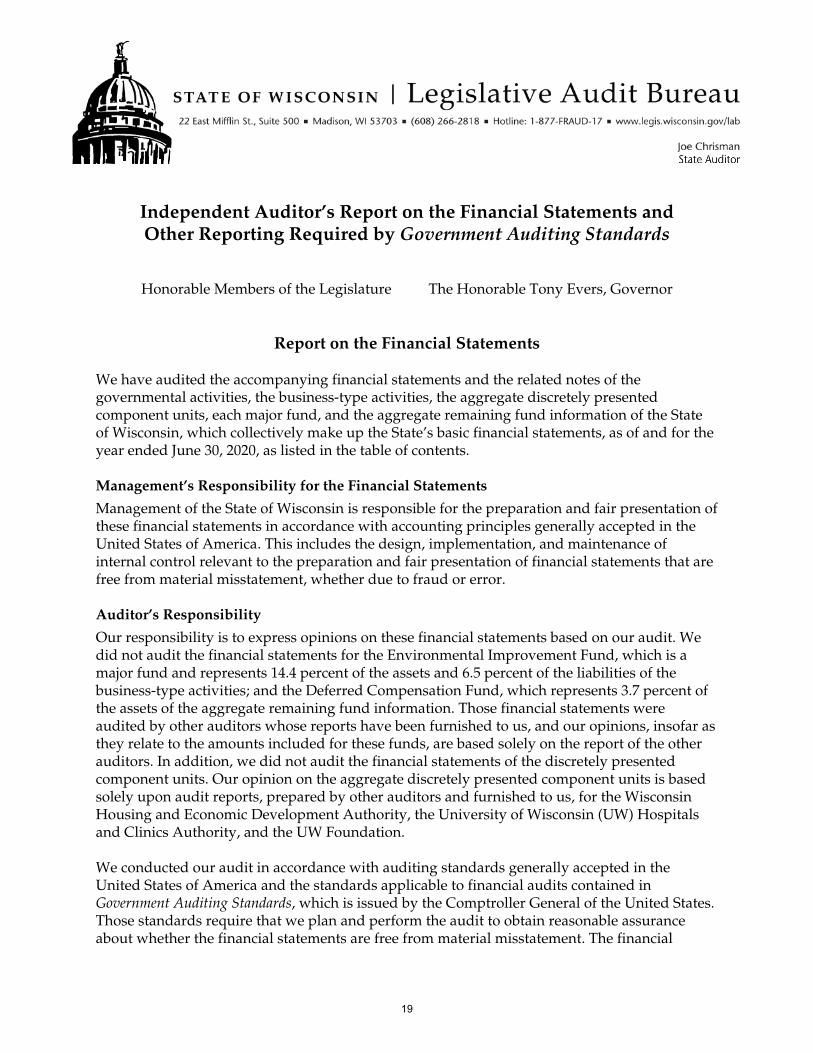
Independent Auditor’s Report on the Financial Statements and Other Reporting Required by Government Auditing Standards
Honorable Members of the Legislature The Honorable Tony Evers, Governor
Report on the Financial Statements
We have audited the accompanying financial statements and the related notes of the governmental activities, the business-type activities, the aggregate discretely presented component units, each major fund, and the aggregate remaining fund information of the State of Wisconsin, which collectively make up the State’s basic financial statements, as of and for the year ended June 30, 2020, as listed in the table of contents.
Management’s Responsibility for the Financial Statements
Management of the State of Wisconsin is responsible for the preparation and fair presentation of these financial statements in accordance with accounting principles generally accepted in the United States of America. This includes the design, implementation, and maintenance of internal control relevant to the preparation and fair presentation of financial statements that are free from material misstatement, whether due to fraud or error.
Auditor’s Responsibility
Our responsibility is to express opinions on these financial statements based on our audit. We did not audit the financial statements for the Environmental Improvement Fund, which is a major fund and represents 14.4 percent of the assets and 6.5 percent of the liabilities of the business-type activities; and the Deferred Compensation Fund, which represents 3.7 percent of the assets of the aggregate remaining fund information. Those financial statements were audited by other auditors whose reports have been furnished to us, and our opinions, insofar as they relate to the amounts included for these funds, are based solely on the report of the other auditors. In addition, we did not audit the financial statements of the discretely presented component units. Our opinion on the aggregate discretely presented component units is based solely upon audit reports, prepared by other auditors and furnished to us, for the Wisconsin Housing and Economic Development Authority, the University of Wisconsin (UW) Hospitals and Clinics Authority, and the UW Foundation.
We conducted our audit in accordance with auditing standards generally accepted in the United States of America and the standards applicable to financial audits contained in Government Auditing Standards, which is issued by the Comptroller General of the United States. Those standards require that we plan and perform the audit to obtain reasonable assurance about whether the financial statements are free from material misstatement. The financial
20
statements for the Environmental Improvement Fund and the Wisconsin Housing and Economic Development Authority were audited by other auditors in accordance with these standards. The financial statements of the Deferred Compensation Fund, UW Hospitals and Clinics Authority, and the UW Foundation were audited by other auditors in accordance with auditing standards generally accepted in the United States of America, but not in accordance with Government Auditing Standards. An audit involves performing procedures to obtain audit evidence about the amounts and disclosures in the financial statements. The procedures selected depend on the auditor’s judgment, including the assessment of the risks of material misstatement of the financial statements, whether due to fraud or error. In making those risk assessments, the auditor considers internal control relevant to the entity’s preparation and fair presentation of the financial statements in order to design audit procedures that are appropriate in the circumstances, but not for the purpose of expressing an opinion on the effectiveness of the entity’s internal control. Accordingly, we express no such opinion. An audit also includes evaluating the appropriateness of the accounting policies used and the reasonableness of significant accounting estimates made by management, as well as evaluating the overall presentation of the financial statements. We believe that the audit evidence we have obtained is sufficient and appropriate to provide a basis for our opinions on these financial statements. Opinions
In our opinion, based on our audit and the reports of other auditors, the financial statements referred to in the first paragraph present fairly, in all material respects, the financial position of the governmental activities, the business-type activities, the aggregate discretely presented component units, each major fund, and the aggregate remaining fund information of the State of Wisconsin as of June 30, 2020, and the respective changes in its financial position and, where applicable, cash flows for the year then ended in accordance with accounting principles generally accepted in the United States of America. Emphases of Matter
As discussed in Note 1D, the State implemented Governmental Accounting Standards Board (GASB) Statement Number 84, Fiduciary Activities. This statement changed the classification and reporting for certain fiduciary activities for the State as discussed in Note 23. The basic portion of the Accumulated Sick Leave Conversion Credit program was reclassified as an internal service fund. This change required the remeasurement of certain fund liabilities. As discussed in Note 5B, the financial statements include investments that do not have readily ascertainable market prices and are valued based on a variety of third-party pricing methods. However, because of the inherent uncertainty of valuation, those estimated values may differ from the values that would have been used had a ready market for the investments existed. As discussed in Note 5B to the financial statements, as of June 30, 2020, the State Investment Fund held $2.0 billion in a repurchase agreement with the Wisconsin Retirement System. The State Investment Fund and the Wisconsin Retirement System are both administered by the State of Wisconsin Investment Board.
21
Certain account balances cannot be measured precisely but must be estimated, particularly actuarially accrued liabilities and infrastructure assets reported in the financial statements and notes. Notes 14, 17, 18, and 20 include a discussion of estimates used by funds that accrue liabilities based upon actuarial information, including assumptions used in their calculation, and other sources. Note 1E includes information related to the estimated historical cost of infrastructure assets constructed prior to July 1, 2000. Because estimates are based upon information available when the financial statements are prepared, actual values may differ from the estimated amounts. These differences cannot be quantified. As discussed in Note 24, the State was not able to develop an estimate of payments related to the remaining backlog of weekly unemployment claims that related to FY 2019-20, as of November 30, 2020, and therefore a liability for these claims has not been reported in the Unemployment Reserve Fund. Our opinions are not modified with respect to these matters. Other Matters
Required Supplementary Information—Accounting principles generally accepted in the United States of America require that the Management’s Discussion and Analysis, and the following items in the required supplementary information section, as listed in the table of contents—Postemployment Benefits–State Health Insurance Program, Postemployment Benefits–State Life Insurance Program, Postemployment Benefits–Supplemental Health Insurance Conversion Credit Program, State’s Proportionate Share of Net Pension Liability or Net Pension (Asset), State’s Pension Contributions, Infrastructure Assets Reported Using the Modified Approach, Budgetary Comparison Schedule–General Fund, Budgetary Comparison Schedule–Transportation Fund, and Notes to Required Supplementary Information–Budgetary Information—be presented to supplement the basic financial statements. Such information, although not a part of the basic financial statements, is required by GASB, which considers it to be essential for placing the basic financial statements in an appropriate operational, economic, or historical context. In accordance with auditing standards generally accepted in the United States of America, we have applied certain limited procedures to the required supplementary information that included inquiries of management about the methods of preparing the information. We further compared the information for consistency with management’s responses to our inquiries, the basic financial statements, and other knowledge we obtained during our audit of the basic financial statements. We do not express an opinion or provide any assurance on the information because the limited procedures do not provide us with sufficient evidence to express an opinion or provide any assurance. Accompanying Information—Our audit was conducted for the purpose of forming opinions on the financial statements that collectively comprise the State’s basic financial statements. The combining statements and budgetary comparison schedule in the supplementary information section, as listed in the table of contents, are presented for purposes of additional analysis and are not a required part of the basic financial statements. Such information is the responsibility of management and was derived from and relates directly to the underlying accounting and other records used to prepare the basic financial statements. The combining statements and budgetary comparison schedule have been subjected to the auditing procedures applied in the audit of the basic financial statements and certain additional procedures, including comparing and reconciling such information directly to the underlying accounting and other records used
22
to prepare the basic financial statements or to the basic financial statements themselves, and other additional procedures in accordance with auditing standards generally accepted in the United States of America. Based on our audit, the procedures performed as described, and the report of other auditors, in our opinion the combining statements and budgetary comparison schedule are fairly stated in all material respects in relation to the basic financial statements as a whole.
The introductory and statistical sections, as listed in the table of contents, are presented for purposes of additional analysis and are not a required part of the basic financial statements. The introductory and statistical sections have not been subjected to the auditing procedures applied in the audit of the basic financial statements and, accordingly, we do not express an opinion or provide any assurance on them.
Other Reporting Required by Government Auditing Standards
In accordance with Government Auditing Standards, we have also issued a report, which was dated December 21, 2020, and published as report 20-30, on our consideration of the State of Wisconsin’s internal control over financial reporting; our tests of its compliance with certain provisions of laws, regulations, contracts, and grant agreements; and other matters. The purpose of that report is solely to describe the scope of our testing of internal control over financial reporting and compliance and the result of that testing, and not to provide an opinion on the effectiveness of the State’s internal control over financial reporting or on compliance. That report is an integral part of an audit performed in accordance with Government Auditing Standards and should be used when considering the State’s internal control over financial reporting and compliance.
LEGISLATIVE AUDIT BUREAU
Joe ChrismanState Auditor
December 21, 2020
MANAGEMENT’S DISCUSSION AND ANALYSIS
The Management's Discussion and Analysis of the State of Wisconsin’s Comprehensive Annual Financial Report (CAFR) presents a discussion and analysis of the State’s financial performance during the fiscal year that ended June 30, 2020. It should be read in conjunction with the transmittal letter located at the front of this CAFR, and the State’s financial statements, including the note disclosures which are an integral part of the statements, that follow this part of the CAFR.
FINANCIAL HIGHLIGHTS -- PRIMARY GOVERNMENT
Government-wide (Tables 2 and 3 on Pages 26 and 27)
• Net Position. The assets plus deferred outflows of resources of the State of Wisconsin exceeded its liabilities plus deferred inflows of resources at the close of Fiscal Year 2020 by $27.9 billion (reported as "net position"). Of this amount, $(7.7) billion was reported as "unrestricted net position". A positive balance in unrestricted net position would represent the amount available to be used to meet a government's ongoing obligations to citizens and creditors.
• Changes in Net Position. The State's total net position increased by $2.0 billion in Fiscal Year 2020. Net position of governmental activities increased by $2.0 billion or 13.8 percent, while net position of the business-type activities showed a decrease of $43.7 million or 0.4 percent.
• Excess of Revenues over (under) Expenses -- Governmental Activities. During Fiscal Year 2020, the State’s total revenues for governmental activities of $33.8 billion were $3.3 billion more than total expenses (excluding transfers) for governmental activities of $30.6 billion. Of these expenses, $14.2 billion were covered by program revenues. General revenues, generated primarily from various taxes, totaled $19.6 billion.
Fund
• Governmental Funds -- Fund Balances. As of the close of Fiscal Year 2020, the State's governmental funds reported combined ending fund balances of $2.7 billion, an increase of $644.0 million in comparison with the prior year. Of this total amount, $(1.3) billion represents the unassigned fund balances.
• General Fund -- Fund Balance. At the end of the current fiscal year, total fund balance was $1.5 million, a change of $764.6 million from a deficit of $(763.1) million reported in the prior year. The unassigned fund deficit for the General Fund was $(1.1) billion, or 4.2 percent of total General Fund expenditures.
Additional information regarding individual funds begins on page 31.
Long-term Debt• The State's total long-term debt obligations (bonds and notes payable) decreased by $262.5 million during the current fiscal
year which represents the net difference between new issuances, payments and refundings of outstanding debt. Decreases in debt resulted primarily from repayments of existing bonds in excess of new debt issued. During the year repayments of general obligation debt exceeded new issuances by $82.8 million. Revenue bonds outstanding decreased by $207.6 million. Annual appropriation bonds outstanding increased by $27.8 million.
Additional detail regarding these activities begins on page 36.
OVERVIEW OF THE FINANCIAL STATEMENTS
The Financial Section of this CAFR consists of four parts: (1) management's discussion and analysis (this section), (2) basic financial statements, (3) additional required supplementary information, and (4) optional other supplementary information. Parts (2), (3), and (4) are briefly described on the following pages:
State of Wisconsin Management Discussion and Analysis
For the Fiscal Year Ended June 30, 2020
23
Basic Financial Statements
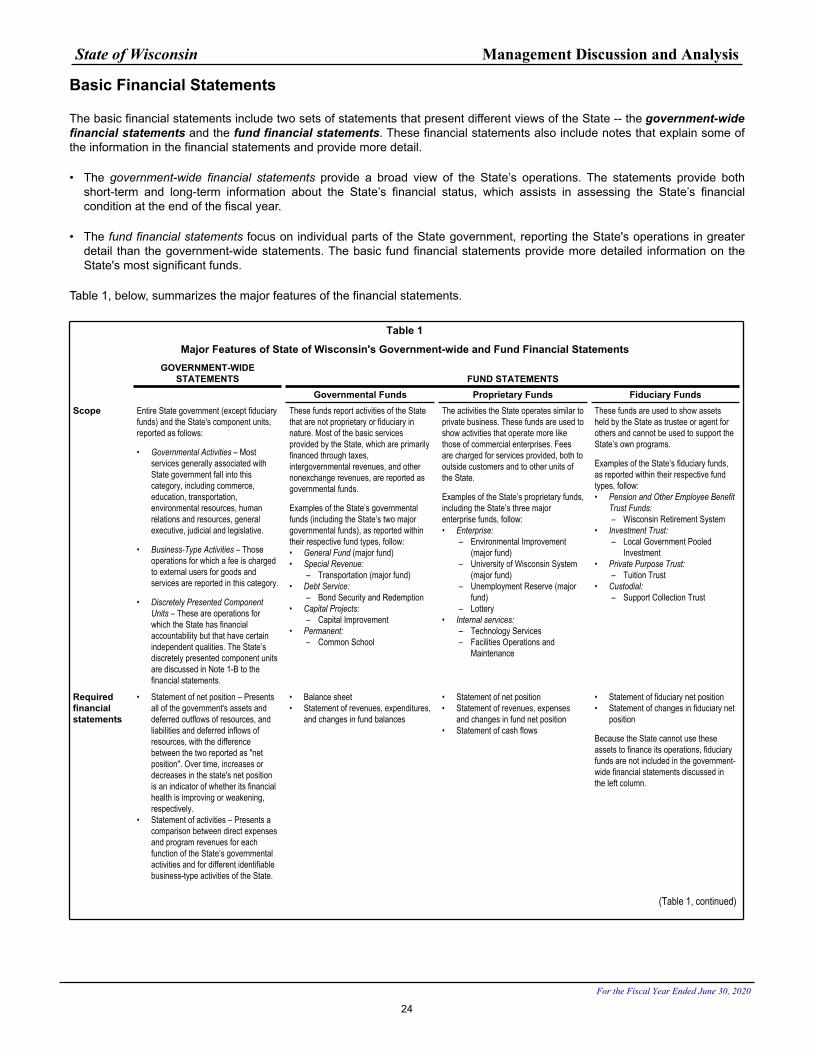
The basic financial statements include two sets of statements that present different views of the State -- the government-wide financial statements and the fund financial statements. These financial statements also include notes that explain some of the information in the financial statements and provide more detail.
• The government-wide financial statements provide a broad view of the State’s operations. The statements provide both short-term and long-term information about the State’s financial status, which assists in assessing the State’s financial condition at the end of the fiscal year.
• The fund financial statements focus on individual parts of the State government, reporting the State's operations in greater detail than the government-wide statements. The basic fund financial statements provide more detailed information on the State's most significant funds.
Table 1, below, summarizes the major features of the financial statements.
Table 1
Major Features of State of Wisconsin's Government-wide and Fund Financial StatementsGOVERNMENT-WIDE
STATEMENTS FUND STATEMENTSGovernmental Funds Proprietary Funds Fiduciary Funds
Scope Entire State government (except fiduciary funds) and the State's component units, reported as follows:
• Governmental Activities – Most services generally associated with State government fall into this category, including commerce, education, transportation, environmental resources, human relations and resources, general executive, judicial and legislative.
• Business-Type Activities – Those operations for which a fee is charged to external users for goods and services are reported in this category.
• Discretely Presented Component Units – These are operations for which the State has financial accountability but that have certain independent qualities. The State’s discretely presented component units are discussed in Note 1-B to the financial statements.
These funds report activities of the State that are not proprietary or fiduciary in nature. Most of the basic services provided by the State, which are primarily financed through taxes, intergovernmental revenues, and other nonexchange revenues, are reported as governmental funds.
Examples of the State’s governmental funds (including the State’s two major governmental funds), as reported within their respective fund types, follow:• General Fund (major fund)• Special Revenue:
– Transportation (major fund)• Debt Service:
– Bond Security and Redemption• Capital Projects:
– Capital Improvement• Permanent:
– Common School
The activities the State operates similar to private business. These funds are used to show activities that operate more like those of commercial enterprises. Fees are charged for services provided, both to outside customers and to other units of the State.
Examples of the State’s proprietary funds, including the State’s three major enterprise funds, follow:• Enterprise:
– Environmental Improvement (major fund)
– University of Wisconsin System (major fund)
– Unemployment Reserve (major fund)
– Lottery• Internal services:
– Technology Services– Facilities Operations and
Maintenance
These funds are used to show assets held by the State as trustee or agent for others and cannot be used to support the State’s own programs.
Examples of the State’s fiduciary funds, as reported within their respective fund types, follow:• Pension and Other Employee Benefit
Trust Funds:– Wisconsin Retirement System
• Investment Trust:– Local Government Pooled
Investment• Private Purpose Trust:
– Tuition Trust• Custodial:
– Support Collection Trust
Requiredfinancialstatements
• Statement of net position – Presents all of the government's assets and deferred outflows of resources, and liabilities and deferred inflows of resources, with the difference between the two reported as "net position". Over time, increases or decreases in the state's net position is an indicator of whether its financial health is improving or weakening, respectively.
• Statement of activities – Presents a comparison between direct expenses and program revenues for each function of the State’s governmental activities and for different identifiable business-type activities of the State.
• Balance sheet• Statement of revenues, expenditures,
and changes in fund balances
• Statement of net position• Statement of revenues, expenses
and changes in fund net position• Statement of cash flows
• Statement of fiduciary net position• Statement of changes in fiduciary net
position
Because the State cannot use these assets to finance its operations, fiduciary funds are not included in the government-wide financial statements discussed in the left column.
(Table 1, continued)
State of Wisconsin Management Discussion and Analysis
For the Fiscal Year Ended June 30, 2020
24
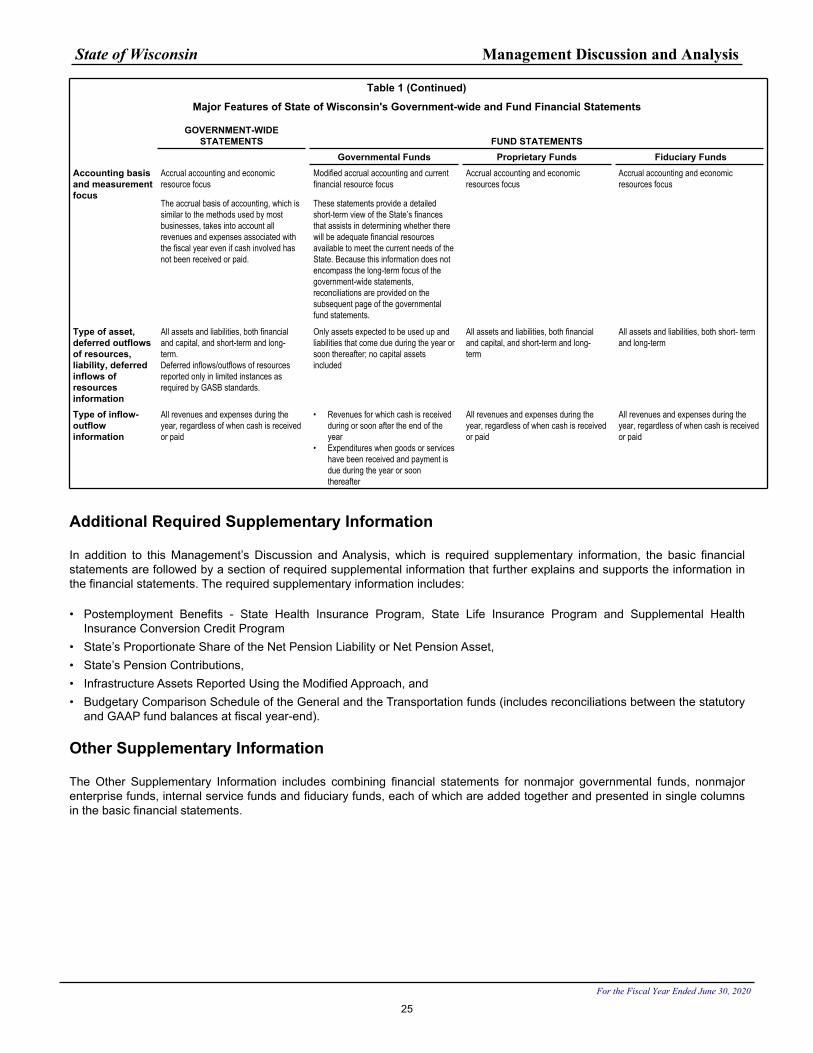
Table 1 (Continued)
Major Features of State of Wisconsin's Government-wide and Fund Financial Statements
GOVERNMENT-WIDE STATEMENTS FUND STATEMENTS
Governmental Funds Proprietary Funds Fiduciary FundsAccounting basisand measurementfocus
Accrual accounting and economic resource focus
The accrual basis of accounting, which is similar to the methods used by most businesses, takes into account all revenues and expenses associated with the fiscal year even if cash involved has not been received or paid.
Modified accrual accounting and current financial resource focus
These statements provide a detailed short-term view of the State’s finances that assists in determining whether there will be adequate financial resources available to meet the current needs of the State. Because this information does not encompass the long-term focus of the government-wide statements, reconciliations are provided on the subsequent page of the governmental fund statements.
Accrual accounting and economic resources focus
Accrual accounting and economic resources focus
Type of asset,deferred outflowsof resources,liability, deferredinflows ofresourcesinformation
All assets and liabilities, both financial and capital, and short-term and long-term.Deferred inflows/outflows of resources reported only in limited instances as required by GASB standards.
Only assets expected to be used up and liabilities that come due during the year or soon thereafter; no capital assets included
All assets and liabilities, both financial and capital, and short-term and long- term
All assets and liabilities, both short- term and long-term
Type of inflow- outflow information
All revenues and expenses during the year, regardless of when cash is received or paid
• Revenues for which cash is received during or soon after the end of the year
• Expenditures when goods or services have been received and payment is due during the year or soon thereafter
All revenues and expenses during the year, regardless of when cash is received or paid
All revenues and expenses during the year, regardless of when cash is received or paid
Additional Required Supplementary Information
In addition to this Management’s Discussion and Analysis, which is required supplementary information, the basic financial statements are followed by a section of required supplemental information that further explains and supports the information in the financial statements. The required supplementary information includes:
• Postemployment Benefits - State Health Insurance Program, State Life Insurance Program and Supplemental Health Insurance Conversion Credit Program
• State’s Proportionate Share of the Net Pension Liability or Net Pension Asset,• State’s Pension Contributions,• Infrastructure Assets Reported Using the Modified Approach, and• Budgetary Comparison Schedule of the General and the Transportation funds (includes reconciliations between the statutory
and GAAP fund balances at fiscal year-end).
Other Supplementary Information
The Other Supplementary Information includes combining financial statements for nonmajor governmental funds, nonmajor enterprise funds, internal service funds and fiduciary funds, each of which are added together and presented in single columns in the basic financial statements.
State of Wisconsin Management Discussion and Analysis
For the Fiscal Year Ended June 30, 2020
25
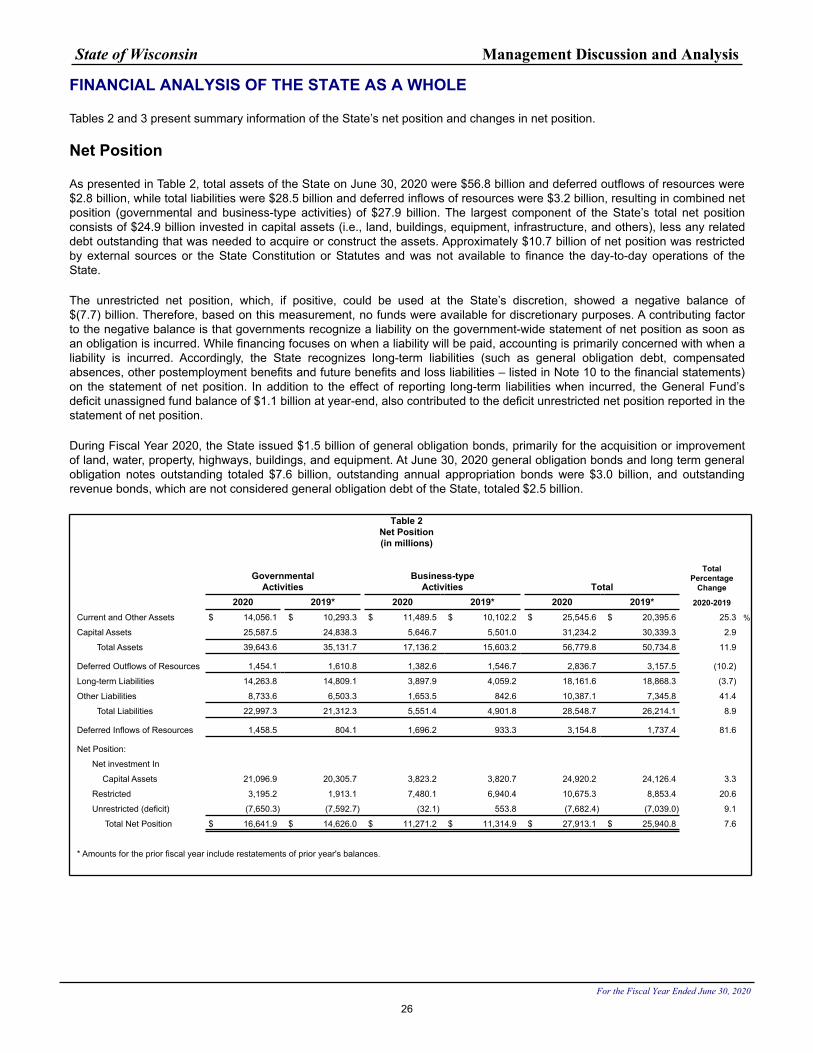
FINANCIAL ANALYSIS OF THE STATE AS A WHOLE
Tables 2 and 3 present summary information of the State’s net position and changes in net position.
Net Position
As presented in Table 2, total assets of the State on June 30, 2020 were $56.8 billion and deferred outflows of resources were $2.8 billion, while total liabilities were $28.5 billion and deferred inflows of resources were $3.2 billion, resulting in combined net position (governmental and business-type activities) of $27.9 billion. The largest component of the State’s total net position consists of $24.9 billion invested in capital assets (i.e., land, buildings, equipment, infrastructure, and others), less any related debt outstanding that was needed to acquire or construct the assets. Approximately $10.7 billion of net position was restricted by external sources or the State Constitution or Statutes and was not available to finance the day-to-day operations of the State.
The unrestricted net position, which, if positive, could be used at the State’s discretion, showed a negative balance of $(7.7) billion. Therefore, based on this measurement, no funds were available for discretionary purposes. A contributing factor to the negative balance is that governments recognize a liability on the government-wide statement of net position as soon as an obligation is incurred. While financing focuses on when a liability will be paid, accounting is primarily concerned with when a liability is incurred. Accordingly, the State recognizes long-term liabilities (such as general obligation debt, compensated absences, other postemployment benefits and future benefits and loss liabilities – listed in Note 10 to the financial statements) on the statement of net position. In addition to the effect of reporting long-term liabilities when incurred, the General Fund’s deficit unassigned fund balance of $1.1 billion at year-end, also contributed to the deficit unrestricted net position reported in the statement of net position.
During Fiscal Year 2020, the State issued $1.5 billion of general obligation bonds, primarily for the acquisition or improvement of land, water, property, highways, buildings, and equipment. At June 30, 2020 general obligation bonds and long term general obligation notes outstanding totaled $7.6 billion, outstanding annual appropriation bonds were $3.0 billion, and outstanding revenue bonds, which are not considered general obligation debt of the State, totaled $2.5 billion.
Table 2 Net Position (in millions)
Governmental Activities
Business-type Activities Total
Total Percentage
Change
2020 2019* 2020 2019* 2020 2019* 2020-2019
Current and Other Assets $ 14,056.1 $ 10,293.3 $ 11,489.5 $ 10,102.2 $ 25,545.6 $ 20,395.6 25.3 %
Capital Assets 25,587.5 24,838.3 5,646.7 5,501.0 31,234.2 30,339.3 2.9
Total Assets 39,643.6 35,131.7 17,136.2 15,603.2 56,779.8 50,734.8 11.9
Deferred Outflows of Resources 1,454.1 1,610.8 1,382.6 1,546.7 2,836.7 3,157.5 (10.2)
Long-term Liabilities 14,263.8 14,809.1 3,897.9 4,059.2 18,161.6 18,868.3 (3.7)
Other Liabilities 8,733.6 6,503.3 1,653.5 842.6 10,387.1 7,345.8 41.4
Total Liabilities 22,997.3 21,312.3 5,551.4 4,901.8 28,548.7 26,214.1 8.9
Deferred Inflows of Resources 1,458.5 804.1 1,696.2 933.3 3,154.8 1,737.4 81.6
Net Position:
Net investment In
Capital Assets 21,096.9 20,305.7 3,823.2 3,820.7 24,920.2 24,126.4 3.3
Restricted 3,195.2 1,913.1 7,480.1 6,940.4 10,675.3 8,853.4 20.6
Unrestricted (deficit) (7,650.3) (7,592.7) (32.1) 553.8 (7,682.4) (7,039.0) 9.1
Total Net Position $ 16,641.9 $ 14,626.0 $ 11,271.2 $ 11,314.9 $ 27,913.1 $ 25,940.8 7.6
* Amounts for the prior fiscal year include restatements of prior year's balances.
State of Wisconsin Management Discussion and Analysis
For the Fiscal Year Ended June 30, 2020
26
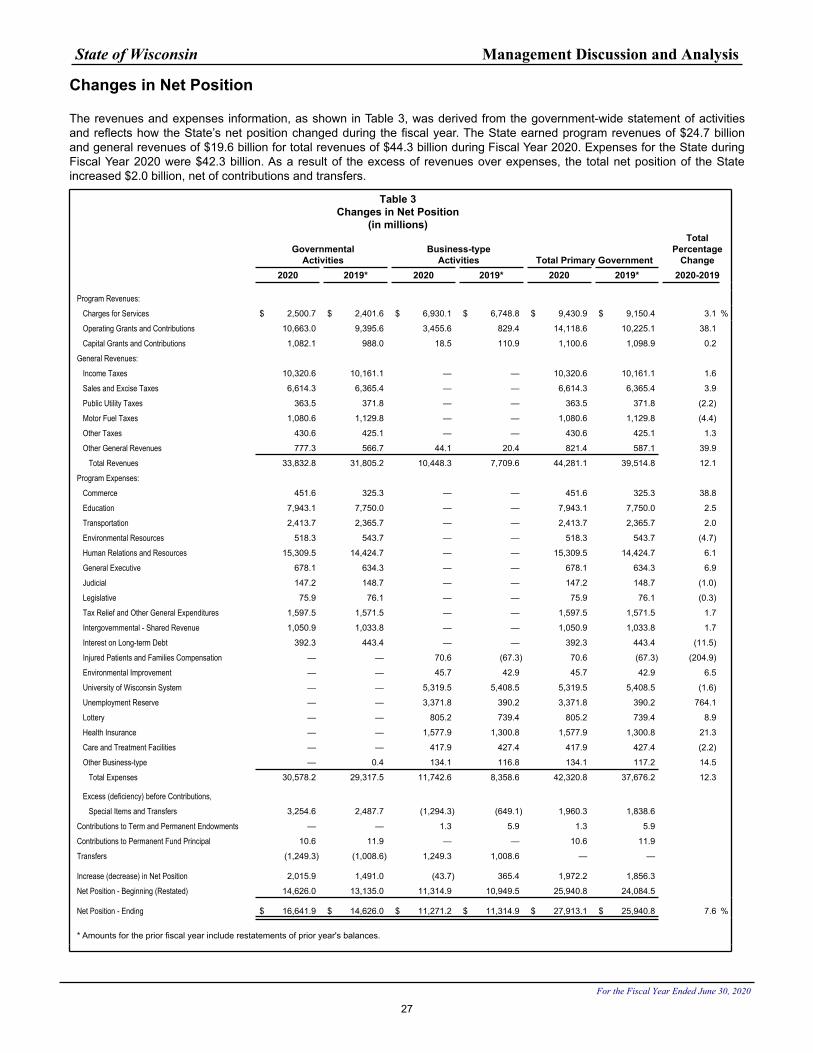
Changes in Net Position
The revenues and expenses information, as shown in Table 3, was derived from the government-wide statement of activities and reflects how the State’s net position changed during the fiscal year. The State earned program revenues of $24.7 billion and general revenues of $19.6 billion for total revenues of $44.3 billion during Fiscal Year 2020. Expenses for the State during Fiscal Year 2020 were $42.3 billion. As a result of the excess of revenues over expenses, the total net position of the State increased $2.0 billion, net of contributions and transfers.
Table 3 Changes in Net Position
(in millions)
Governmental Activities
Business-type Activities Total Primary Government
Total Percentage
Change2020 2019* 2020 2019* 2020 2019* 2020-2019
Program Revenues: Charges for Services $ 2,500.7 $ 2,401.6 $ 6,930.1 $ 6,748.8 $ 9,430.9 $ 9,150.4 3.1 %
Operating Grants and Contributions 10,663.0 9,395.6 3,455.6 829.4 14,118.6 10,225.1 38.1
Capital Grants and Contributions 1,082.1 988.0 18.5 110.9 1,100.6 1,098.9 0.2
General Revenues: Income Taxes 10,320.6 10,161.1 — — 10,320.6 10,161.1 1.6
Sales and Excise Taxes 6,614.3 6,365.4 — — 6,614.3 6,365.4 3.9
Public Utility Taxes 363.5 371.8 — — 363.5 371.8 (2.2)
Motor Fuel Taxes 1,080.6 1,129.8 — — 1,080.6 1,129.8 (4.4)
Other Taxes 430.6 425.1 — — 430.6 425.1 1.3
Other General Revenues 777.3 566.7 44.1 20.4 821.4 587.1 39.9
Total Revenues 33,832.8 31,805.2 10,448.3 7,709.6 44,281.1 39,514.8 12.1
Program Expenses: Commerce 451.6 325.3 — — 451.6 325.3 38.8
Education 7,943.1 7,750.0 — — 7,943.1 7,750.0 2.5
Transportation 2,413.7 2,365.7 — — 2,413.7 2,365.7 2.0
Environmental Resources 518.3 543.7 — — 518.3 543.7 (4.7)
Human Relations and Resources 15,309.5 14,424.7 — — 15,309.5 14,424.7 6.1
General Executive 678.1 634.3 — — 678.1 634.3 6.9
Judicial 147.2 148.7 — — 147.2 148.7 (1.0)
Legislative 75.9 76.1 — — 75.9 76.1 (0.3)
Tax Relief and Other General Expenditures 1,597.5 1,571.5 — — 1,597.5 1,571.5 1.7
Intergovernmental - Shared Revenue 1,050.9 1,033.8 — — 1,050.9 1,033.8 1.7
Interest on Long-term Debt 392.3 443.4 — — 392.3 443.4 (11.5)
Injured Patients and Families Compensation — — 70.6 (67.3) 70.6 (67.3) (204.9)
Environmental Improvement — — 45.7 42.9 45.7 42.9 6.5
University of Wisconsin System — — 5,319.5 5,408.5 5,319.5 5,408.5 (1.6)
Unemployment Reserve — — 3,371.8 390.2 3,371.8 390.2 764.1
Lottery — — 805.2 739.4 805.2 739.4 8.9
Health Insurance — — 1,577.9 1,300.8 1,577.9 1,300.8 21.3
Care and Treatment Facilities — — 417.9 427.4 417.9 427.4 (2.2)
Other Business-type — 0.4 134.1 116.8 134.1 117.2 14.5
Total Expenses 30,578.2 29,317.5 11,742.6 8,358.6 42,320.8 37,676.2 12.3
Excess (deficiency) before Contributions, Special Items and Transfers 3,254.6 2,487.7 (1,294.3) (649.1) 1,960.3 1,838.6
Contributions to Term and Permanent Endowments — — 1.3 5.9 1.3 5.9
Contributions to Permanent Fund Principal 10.6 11.9 — — 10.6 11.9
Transfers (1,249.3) (1,008.6) 1,249.3 1,008.6 — —
Increase (decrease) in Net Position 2,015.9 1,491.0 (43.7) 365.4 1,972.2 1,856.3
Net Position - Beginning (Restated) 14,626.0 13,135.0 11,314.9 10,949.5 25,940.8 24,084.5
Net Position - Ending $ 16,641.9 $ 14,626.0 $ 11,271.2 $ 11,314.9 $ 27,913.1 $ 25,940.8 7.6 %
* Amounts for the prior fiscal year include restatements of prior year's balances.
State of Wisconsin Management Discussion and Analysis
For the Fiscal Year Ended June 30, 2020
27
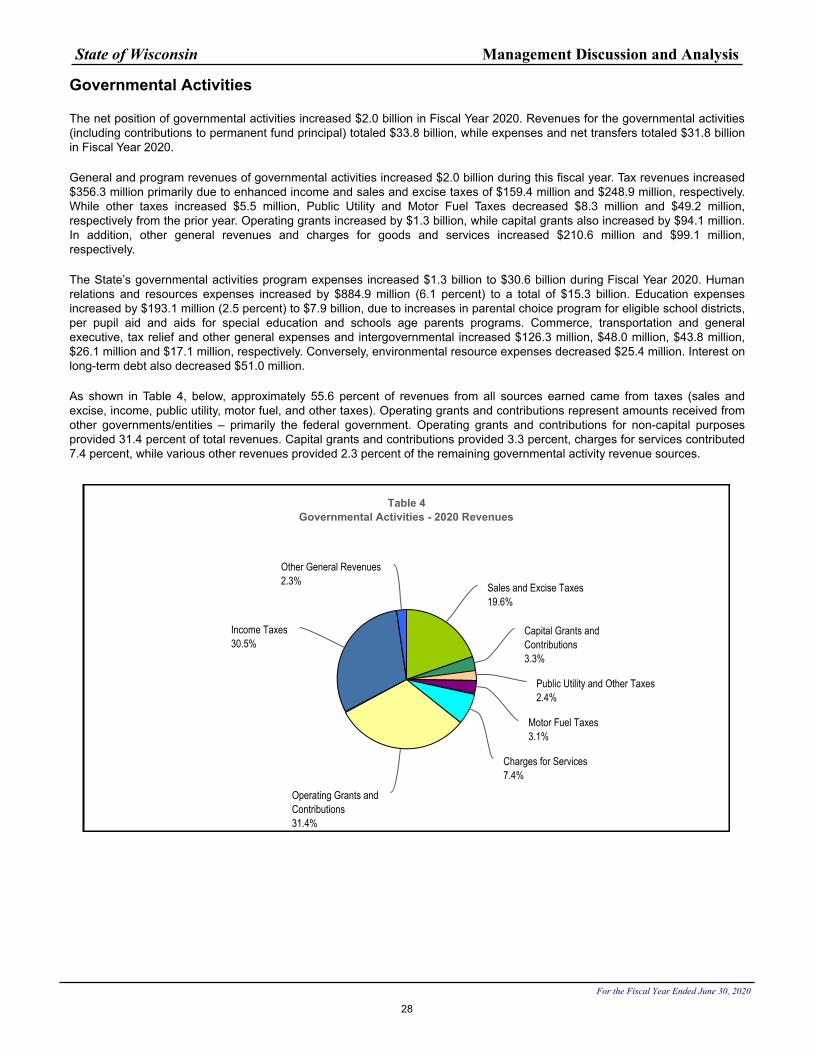
Governmental Activities
The net position of governmental activities increased $2.0 billion in Fiscal Year 2020. Revenues for the governmental activities (including contributions to permanent fund principal) totaled $33.8 billion, while expenses and net transfers totaled $31.8 billion in Fiscal Year 2020.
General and program revenues of governmental activities increased $2.0 billion during this fiscal year. Tax revenues increased $356.3 million primarily due to enhanced income and sales and excise taxes of $159.4 million and $248.9 million, respectively. While other taxes increased $5.5 million, Public Utility and Motor Fuel Taxes decreased $8.3 million and $49.2 million, respectively from the prior year. Operating grants increased by $1.3 billion, while capital grants also increased by $94.1 million. In addition, other general revenues and charges for goods and services increased $210.6 million and $99.1 million, respectively.
The State’s governmental activities program expenses increased $1.3 billion to $30.6 billion during Fiscal Year 2020. Human relations and resources expenses increased by $884.9 million (6.1 percent) to a total of $15.3 billion. Education expenses increased by $193.1 million (2.5 percent) to $7.9 billion, due to increases in parental choice program for eligible school districts, per pupil aid and aids for special education and schools age parents programs. Commerce, transportation and general executive, tax relief and other general expenses and intergovernmental increased $126.3 million, $48.0 million, $43.8 million, $26.1 million and $17.1 million, respectively. Conversely, environmental resource expenses decreased $25.4 million. Interest on long-term debt also decreased $51.0 million.
As shown in Table 4, below, approximately 55.6 percent of revenues from all sources earned came from taxes (sales and excise, income, public utility, motor fuel, and other taxes). Operating grants and contributions represent amounts received from other governments/entities – primarily the federal government. Operating grants and contributions for non-capital purposes provided 31.4 percent of total revenues. Capital grants and contributions provided 3.3 percent, charges for services contributed 7.4 percent, while various other revenues provided 2.3 percent of the remaining governmental activity revenue sources.
Table 4Governmental Activities - 2020 Revenues
Sales and Excise Taxes19.6%
Capital Grants andContributions3.3%
Public Utility and Other Taxes2.4%
Motor Fuel Taxes3.1%
Charges for Services7.4%
Operating Grants andContributions31.4%
Income Taxes30.5%
Other General Revenues2.3%
State of Wisconsin Management Discussion and Analysis
For the Fiscal Year Ended June 30, 2020
28
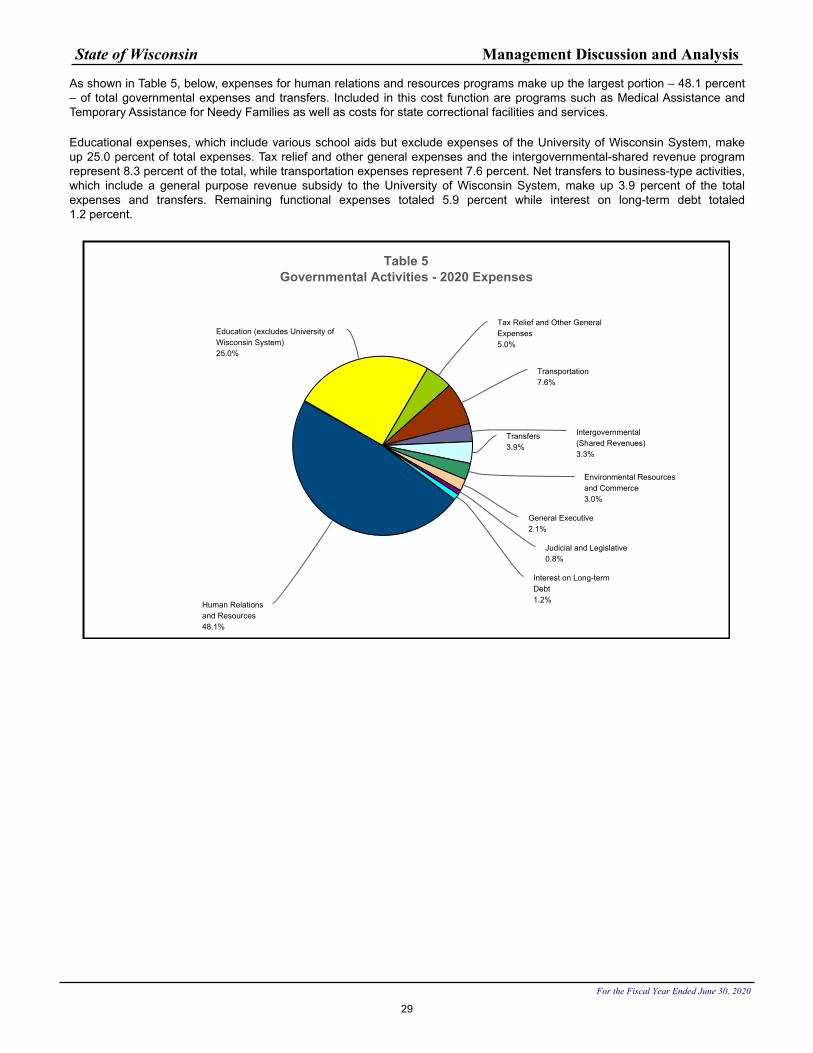
As shown in Table 5, below, expenses for human relations and resources programs make up the largest portion – 48.1 percent – of total governmental expenses and transfers. Included in this cost function are programs such as Medical Assistance and Temporary Assistance for Needy Families as well as costs for state correctional facilities and services.
Educational expenses, which include various school aids but exclude expenses of the University of Wisconsin System, make up 25.0 percent of total expenses. Tax relief and other general expenses and the intergovernmental-shared revenue program represent 8.3 percent of the total, while transportation expenses represent 7.6 percent. Net transfers to business-type activities, which include a general purpose revenue subsidy to the University of Wisconsin System, make up 3.9 percent of the total expenses and transfers. Remaining functional expenses totaled 5.9 percent while interest on long-term debt totaled 1.2 percent.
Table 5Governmental Activities - 2020 Expenses
Education (excludes University ofWisconsin System)25.0%
Tax Relief and Other GeneralExpenses5.0%
Transportation7.6%
Intergovernmental(Shared Revenues)3.3%
Transfers3.9%
Environmental Resourcesand Commerce3.0%
General Executive2.1%
Judicial and Legislative0.8%
Interest on Long-termDebt1.2%Human Relations
and Resources48.1%
State of Wisconsin Management Discussion and Analysis
For the Fiscal Year Ended June 30, 2020
29
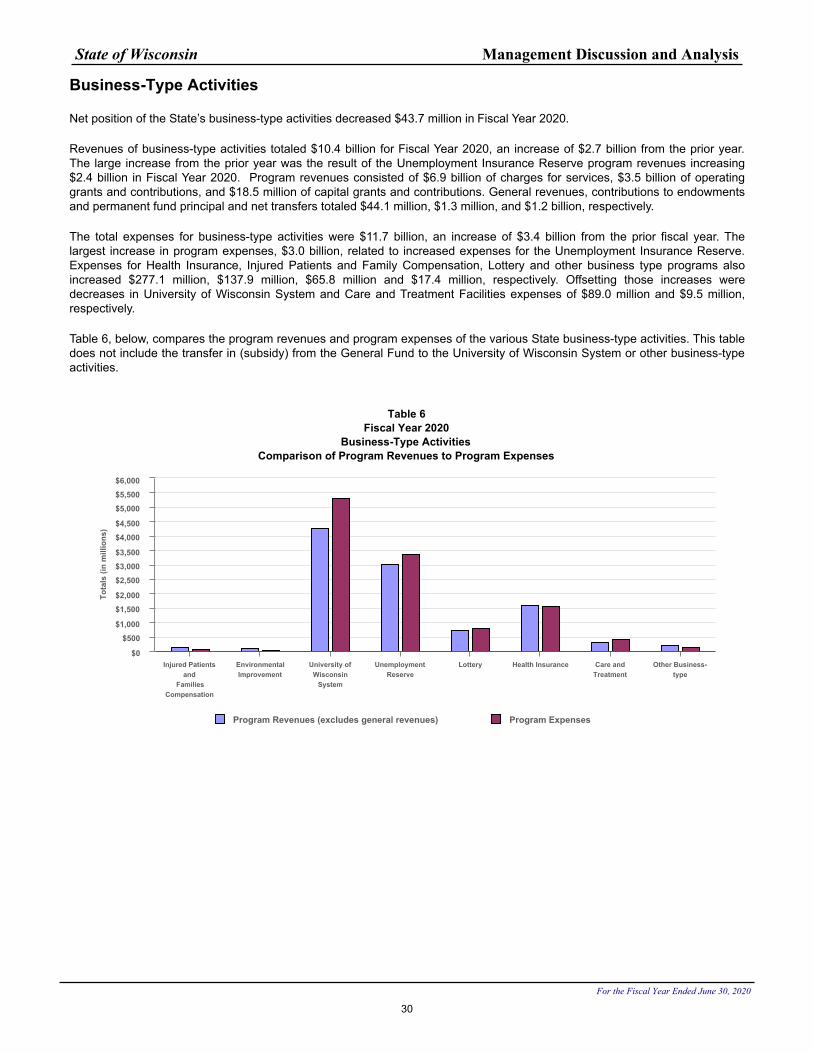
Business-Type Activities
Net position of the State’s business-type activities decreased $43.7 million in Fiscal Year 2020.
Revenues of business-type activities totaled $10.4 billion for Fiscal Year 2020, an increase of $2.7 billion from the prior year. The large increase from the prior year was the result of the Unemployment Insurance Reserve program revenues increasing $2.4 billion in Fiscal Year 2020. Program revenues consisted of $6.9 billion of charges for services, $3.5 billion of operating grants and contributions, and $18.5 million of capital grants and contributions. General revenues, contributions to endowments and permanent fund principal and net transfers totaled $44.1 million, $1.3 million, and $1.2 billion, respectively.
The total expenses for business-type activities were $11.7 billion, an increase of $3.4 billion from the prior fiscal year. The largest increase in program expenses, $3.0 billion, related to increased expenses for the Unemployment Insurance Reserve. Expenses for Health Insurance, Injured Patients and Family Compensation, Lottery and other business type programs also increased $277.1 million, $137.9 million, $65.8 million and $17.4 million, respectively. Offsetting those increases were decreases in University of Wisconsin System and Care and Treatment Facilities expenses of $89.0 million and $9.5 million, respectively.
Table 6, below, compares the program revenues and program expenses of the various State business-type activities. This table does not include the transfer in (subsidy) from the General Fund to the University of Wisconsin System or other business-type activities.
Tota
ls (i
n m
illio
ns)
Table 6Fiscal Year 2020
Business-Type ActivitiesComparison of Program Revenues to Program Expenses
Program Revenues (excludes general revenues) Program Expenses
Injured Patientsand
FamiliesCompensation
EnvironmentalImprovement
University ofWisconsin
System
UnemploymentReserve
Lottery Health Insurance Care andTreatment
Other Business-type
$0
$500
$1,000
$1,500
$2,000
$2,500
$3,000
$3,500
$4,000
$4,500
$5,000
$5,500
$6,000
State of Wisconsin Management Discussion and Analysis
For the Fiscal Year Ended June 30, 2020
30
FINANCIAL ANALYSIS OF THE STATE'S INDIVIDUAL FUNDS
Governmental Funds
At the end of Fiscal Year 2020, the State's governmental funds reported a combined fund balance of $2.7 billion. Funds with significant changes in fund balance are discussed below:
General Fund
The General Fund is the chief operating fund of the State. At June 30, 2020, the State's General Fund reported a positive total fund balance of $1.5 million. The State’s General Fund hasn’t ended a fiscal year with a positive fund balance since the State began issuing a CAFR in Fiscal Year 1990. The net change in fund balance during Fiscal Year 2020 was $764.7 million, in contrast to $480.1 million in Fiscal Year 2019. Major revenue, expenditure and other sources/uses contributing to the change in fund balance are as follows:
Revenues
Revenues of the General Fund totaled $29.4 billion in Fiscal Year 2020, an increase of $1.6 billion (5.6 percent) from the prior year. Factors contributing to this change included the following:
• Revenues from taxes increased $378.3 million. The increase relate to sales and income taxes, which increased $254.9 million and $135.9 million, respectively, from Fiscal Year 2019. While there was some slowing of spending in spring, consumption did not drop as precipitously as employment during the early days of the pandemic. Wisconsin sales tax revenues received a boost starting in January, when the state began collecting on Marketplace sales, a category of on-line sales reporting strong growth. Income tax revenues increased as the result of higher corporate income taxes collected..
• Intergovernmental revenues (i.e., federal assistance) increased $1.2 billion to $10.3 billion in Fiscal Year 2020. Human relations and resources programs (e.g., Medicaid) reported increased revenues of $967.1 million. Because costs are split between federal and State sources, revenues associated with Medicaid related programs increase as costs increase. The State also received $2.0 billion of Coronavirus Relief Funds in Fiscal Year 2020, but at the end of the fiscal year had only spent $144.8 million of the funds. The State also passed through $75.0 million of the funds to the Wisconsin Economic Development Corporation (a component unit), which is shown as unearned revenue on their statements. The remaining unspent amount was recorded as unearned revenue by the State and will be recorded as intergovernmental revenue in Fiscal Year 2021 as the funds are spent.
Expenditures
2019 Wisconsin Act 9 established spending authority for the State of Wisconsin for Fiscal Year 2020. Expenditures of the General Fund totaled $26.8 billion in Fiscal Year 2020, an increase of $1.3 billion from Fiscal Year 2019. Factors contributing to the change include the following:
▪ Human relations and resources expenditures increased by $903.4 million to $15.0 billion, primarily the result of increased grants and aids to individuals and organizations, in part for coronavirus relief and other medical assistance costs. These costs comprise 56.2 percent of General Fund expenditures.
▪ Education expenditures increased $150.0 million to $7.8 billion, due in part to increases in parental choice program for eligible school districts, per pupil aid and aids for special education and schools age parents programs in Fiscal Year 2020. These costs comprise 29.2 percent of General Fund expenditures.
▪ Commerce expenditures increased by $122.1 million to a total of $354.8 million primarily the result of expenditures related to the Wisconsin Healthcare Stability Plan created in 2017 Wisconsin Act 138.
Other Financing Sources and Uses
Other financing sources/(uses) totaled a net $(1.9) billion in Fiscal Year 2020, a $5.5 million decrease from Fiscal Year 2019. The components of this included the following:
▪ Transfers out of the General Fund totaled $2.0 billion, a decrease of $9.3 million from the prior year.
State of Wisconsin Management Discussion and Analysis
For the Fiscal Year Ended June 30, 2020
31
◦ The GPR supplement comprises a large portion of the transfers out and is provided to various enterprise funds. The supplement totaled $984.2 million, an increase of $7.0 million from the prior year. The University of Wisconsin System, which receives the majority of the GPR supplement, had $885.3 million in GPR expenses in Fiscal Year 2020, an increase of $1.1 million.
◦ Transfers out for debt service payments to the Bond Security and Redemption Fund totaled $488.5 million in Fiscal Year 2020 compared to $534.6 million in Fiscal Year 2019.
◦ Transfers out to nonmajor enterprise funds and Transportation Fund were $186.2 million and $44.4 million, respectively.
▪ Transfers in to the General Fund decreased $1.9 million (from $61.1 million in Fiscal Year 2019 to $59.2 million in Fiscal Year 2020). The University of Wisconsin System transferred $23.9 million, while non-major governmental funds and non-major enterprise funds transferred $20.2 million and $12.0 million, respectively.
Note 9D provides additional information on transfers in and out of the General Fund.
As of June 30, 2020, the General Fund reported an unassigned fund balance deficit of $(1.1) billion, a reduction of the deficit of $601.8 million from the prior year. A deficit unassigned fund balance represents the excess of the liabilities of the General Fund over its assets and nonspendable, restricted, and committed fund balance accounts.
General Fund Budgetary Highlights
Differences between the original budget and the final amended budget were significant and included a $5.8 billion increase in appropriations. Contributing to the variance is the fact that several of the State’s programs and various transfers (see the items denoted with *, below) are not included in the original budget. In addition, numerous adjustments to spending estimates were needed as the year progressed because of changing circumstances (spending needs can change dramatically over a one-year period). The largest variances occurred in the following appropriations (in millions):
Program Variance
Food Stamps, Electronic Benefit Transfer* $ 1,200.0
Federal Aid Medical Assistance 1,156.1
UW System, General Program Operations (part of Statutory General Fund) 897.3
Federal Aid 500.8
UW System, Gifts and Nonfederal Grants and Contracts 191.3
Budget Stabilization Transfer (statutorily separate fund)* 105.8
Actual charges to appropriations (expenditures) were $5.4 billion below the final budgeted estimates. Large positive expenditure variances were reported in the Medical Assistance Federal Aid ($794.4 million) and the Food Stamps Benefits ($229.0 million) appropriations.
During the past fiscal year, the budgetary-based fund balance increased $2.2 billion for the statutory General Fund, mainly the result of unspent Coronavirus Relief Funds and also in part, because of increased general purpose revenues for taxes. Net transfers from other funds totaled $(125.1) million in Fiscal Year 2020 compared to $(309.4) million in the prior fiscal year.
State of Wisconsin Management Discussion and Analysis
For the Fiscal Year Ended June 30, 2020
32
Transportation Fund
In Fiscal Year 2020, the Transportation Fund’s fund balance increased $140.8 million (20.3 percent) from $694.5 million to $835.2 million. The state constitutionally restricts use of state resources deposited into the Fund for transportation purposes. As such, $798.6 million or 95.6 percent of fund balance is reported as restricted for Fiscal Year 2020. Remaining fund balance is reported as nonspendable and correlates to prepaid and inventory assets.
Primary revenue sources of the fund include motor fuel taxes, intergovernmental, and license and permit revenue sources, as well as interfund transfers in. In Fiscal Year 2020 revenues of the fund increased $183.3 million (6.5 percent) to a total of $3.0 billion. Intergovernmental revenues increased $164.7 million; use of external sources of funding for projects, rather than state resources regularly contributes to revenue fluctuations in this category between years. License and permit revenues increased $124.6 million in fiscal year 2020 due to a fee increase effective October 1, 2019. Alternatively, motor fuel tax revenues decreased $49.2 million likely due to circumstances related to the pandemic.
Transportation operating expenditures of $2.8 billion increased 4.8 percent or $129.0 million, including a 12.3 percent or $57.3 million increase in capital outlay expenditures.The change in the types of expenditures reported in the fund was the result of a higher proportion of capitalizable projects versus maintenance and preservation projects. In addition to the expenditures reported in the Transportation Fund, long term debt-funded transportation expenditures of $244.4 million and $75.3 million were reported in the Capital Improvement Fund and Transportation Revenue Bonds Fund, respectively. In the current year, transportation-related expenditures increased $136.2 million in the Capital Improvement Fund, while decreasing $31.7 million in the Transportation Revenue Bonds Fund.
Transfers in increased from $75.5 million to $112.3 million in Fiscal Year 2020. An on-going transfer equal to 0.25 percent of general fund taxes as published in the general fund condition statement is made annually with that amount being $44.1 million in Fiscal Year 2020. In addition, $67.6 million was transferred from the Petroleum Inspection special revenue fund, compared to $30.3 million transferred in Fiscal Year 2019. Transfers out decreased $2.1 million to $183.6 million. Transfers out to the Bond Security and Redemption Fund for debt service were $154.4 million, while transfers out to the Conservation Fund were $20.7 million in Fiscal Year 2020.
Proprietary Funds
Proprietary funds provide the same type of information found in the government-wide financial statements but in more detail. Significant changes to balances of major proprietary funds from Fiscal Year 2019 to Fiscal Year 2020 include the following:
Environmental Improvement
Fund net position of the Environmental Improvement Fund increased $61.7 million to $2.1 billion. Total assets of the Fund increased by $136.6 million, while total liabilities increased by $74.5 million. Assets increased to $2.5 billion as the result of a cash increase of $143.0 million, while loans to local governments were reduced $9.0 million. Conversely, liabilities increased to $358.3 million due to a $76.8 million increase in revenue bonds payable.
Operating income of the Fund decreased by $0.9 million to $28.4 million in Fiscal Year 2020. Operating revenue of $45.3 million, which consists primarily of investment and interest income, remained steady in Fiscal Year 2020. Operating expenses decreased $0.6 million in Fiscal Year 2020, the result of a $1.4 million reduction in interest expense and a $0.6 million increase in salaries and benefits.
State of Wisconsin Management Discussion and Analysis
For the Fiscal Year Ended June 30, 2020
33
Unemployment Reserve
Net position of the Unemployment Reserve Fund decreased by $345.4 million during Fiscal Year 2020 from $2.0 billion at June 30, 2019 to $1.7 billion at June 30, 2020. Benefit expenses increased from $387.0 million in Fiscal Year 2019 to $3.4 billion in Fiscal Year 2020, an increase of $3.0 billion (770.6 percent). The increase in benefits is the result of the average unemployment rate increasing from 3.1 percent during Fiscal Year 2019 to 5.4 percent during Fiscal Year 2020. In addition, benefit periods were extended during the current fiscal year from a possible 26 weeks to a possible 39 weeks. Also, starting for the week ending February 8, 2020, 39 weeks of benefits were made available to those otherwise ineligible for unemployment who were unable to work due to COVID-19. Finally, an extra $600 was paid each week starting for the week ending April 4, 2020.
Total operating revenues increased by $2.4 billion from $588.7 million in Fiscal Year 2019 to $3.0 billion in Fiscal Year 2020. Employer contributions decreased from $561.5 million in Fiscal Year 2019 to $514.3 million in Fiscal Year 2020, a decrease of $47.2 million (8.4 percent). The average tax rate on taxable wages decreased from 1.75% during Calendar Year 2019 to an estimated 1.58% in Calendar Year 2020. Federal aids revenue for the unemployment program increased from $1.6 million in FY 2019 to $2.4 billion in Fiscal Year 2020, an increase of $2.4 billion (150,490.6 percent). The increase in federal aids is the result of six new federal unemployment programs enacted during the current fiscal year. These programs temporarily fund an extra 13 weeks of eligibility, an extra $600 per week, 39 weeks of benefits for those otherwise ineligible, the first week of regular benefits that otherwise would be a waiting week, benefits paid under a short-time compensation or workshare program, and 50 percent of benefits paid on behalf of non-contributory employers.
University of Wisconsin SystemFund net position increased $39.9 million to $5.4 billion. Assets, which consist primarily of capital assets and cash, increased $635.6 million to $8.9 billion. Liabilities, which consists primarily of bonds payable, decreased by $247.4 million to $3.1 billion. The Fund reported a restricted net pension asset of $430.5 million in Fiscal Year 2020 compared to a net pension liability of $(474.4) million in the prior year. The fund also reported a restricted net OPEB asset of $67.9 million in Fiscal Year 2020. Deferred outflows of resources decreased $157.0 million to $1.2 billion, while deferred inflows of resources increased $686.1 million to $1.5 billion. The changes in deferred outflows and inflows were primarily related to changes in pension related amounts.
Operating revenues decreased $51.9 million or 1.4 percent to $3.6 billion. Student tuition, and federal grants and contracts of $1.4 billion and $810.0 million, respectively, comprise 61.3 percent of operating revenues. Increases of $24.4 million, $38.0 million and $5.6 million were reported for local and private grants and contracts, federal grants and contracts and tuition and fees, respectively. Conversely, revenues decreased by $79.3 million (18.3 percent), $33.2 million (8.9 percent) and $4.4 million (7.7 percent), for sales and services of auxiliary enterprises, sales and services of educational activities and sales and services to UW Hospital Authority, respectively. Other income revenues also declined by $3.0 million (0.7 percent). Operating expenses decreased $83.8 million or 1.6 percent. Supplies and services and personal services decreased by $108.9 million and $2.0 million, respectively. These were offset by increases for scholarship and fellowships and other expenses $22.9 million and $2.5 million, respectively. Offsetting those changes were increases in operating grants and disposal of capital assets of $61.9 million and $18.5 million, respectively. With decreases in nonoperating investment, loss on disposal of capital assets, gifts and donations and other revenues of $42.3 million, $18.5 million, $13.4 million and $7.2 million, respectively.
Transfers in to the University of Wisconsin System totaled $1.1 billion in Fiscal Year 2020. The general purpose revenue supplement received from the State’s General Fund was $885.3 million an increase of $1.1 million. The Capital Improvement Fund also transferred $193.8 million of bond and note proceeds to the University of Wisconsin System, an increase of $163.8 million from the prior year. Bond proceeds transferred in are a function of on-going capital projects funded with those bonds. Capital contributions also decreased $93.0 million from the prior year.
State of Wisconsin Management Discussion and Analysis
For the Fiscal Year Ended June 30, 2020
34
GOVERNMENT-WIDE CAPITAL ASSET AND DEBT ADMINISTRATION
Capital Assets
At the close of Fiscal Year 2020, the State reported $31.2 billion invested in capital assets, net of accumulated depreciation of $8.6 billion. This represents an increase of $884.0 million, or 2.9 percent, from Fiscal Year 2019. Depreciation charges totaled $159.4 million and $346.3 million for governmental and business-type activities, respectively, in Fiscal Year 2020. The details of these assets are presented in Table 7, below. Additional information about the State’s capital assets is presented in Note 7 to the financial statements.
Table 7Capital Assets, Net of Depreciation, as of June 30
(in millions)
GovernmentalActivities
Business-TypeActivities
TotalPrimary Government
2020 2019* 2020 2019* 2020 2019*Land and Land Improvements $ 2,987 $ 2,941 $ 180 $ 173 $ 3,167 $ 3,114
Buildings and Improvements 1,466 1,528 4,208 4,072 5,673 5,600
Library Holdings 59 59 150 152 210 211
Machinery and Equipment 318 331 326 319 645 650
Infrastructure 18,429 17,586 — — 18,429 17,586
Construction and Software in Progress 2,328 2,404 782 784 3,110 3,188
Totals $ 25,587 $ 24,849 $ 5,646 $ 5,500 $ 31,234 $ 30,349
*Amounts for the prior fiscal year have been restated
The major capital asset additions completed or acquired during Fiscal Year 2020 included the:
• I-94 North South Freeway Project $1.6 billion• St. Croix Bridge Crossing $305.0 million• USH 18/151: Verona Road $264.9 million• UW Sellery & Witte Renovation $52.8 million
• UW Music Performance Facility $50.7 million
• UW Eau Claire New Residence Hall $32.5 million
• UW Stout North Hall Addition and Renovation $21.7 million
• UW Lathrop and Bascom Utility Improvement $19.4 million
• Willow River State Park Lower Dams Renovation $16.9 million
• UW South Campus Utilities $16.9 million
In addition to these completed projects, construction and software in progress as of June 30, 2020 for governmental and business-type activities totaled $2.3 billion and $782.5 million, respectively. A list of those projects is provided in Note 7. The State’s continuing or proposed major capital projects for Fiscal Year 2020 and future years include:
• Zoo Interchange (Completion in 2023) $1.5 billion• I39/90: USH 12 to Illinois (Completion 2021) $1.2 billion• I43 Silver Spring to STH60 (Completion 2025) $556.2 million• STH 23 / State Highway 67 / US 41 (Completion in 2022) $168.7 million• USH 53 La Crosse Corridor (Completion TBD) $148.2 million• STH 15 / STH 76 New London (Completion in 2024) $137.7 million• STH 50 / I94 43rd Avenue (Completion 2023) $119.1 million
State of Wisconsin Management Discussion and Analysis
For the Fiscal Year Ended June 30, 2020
35
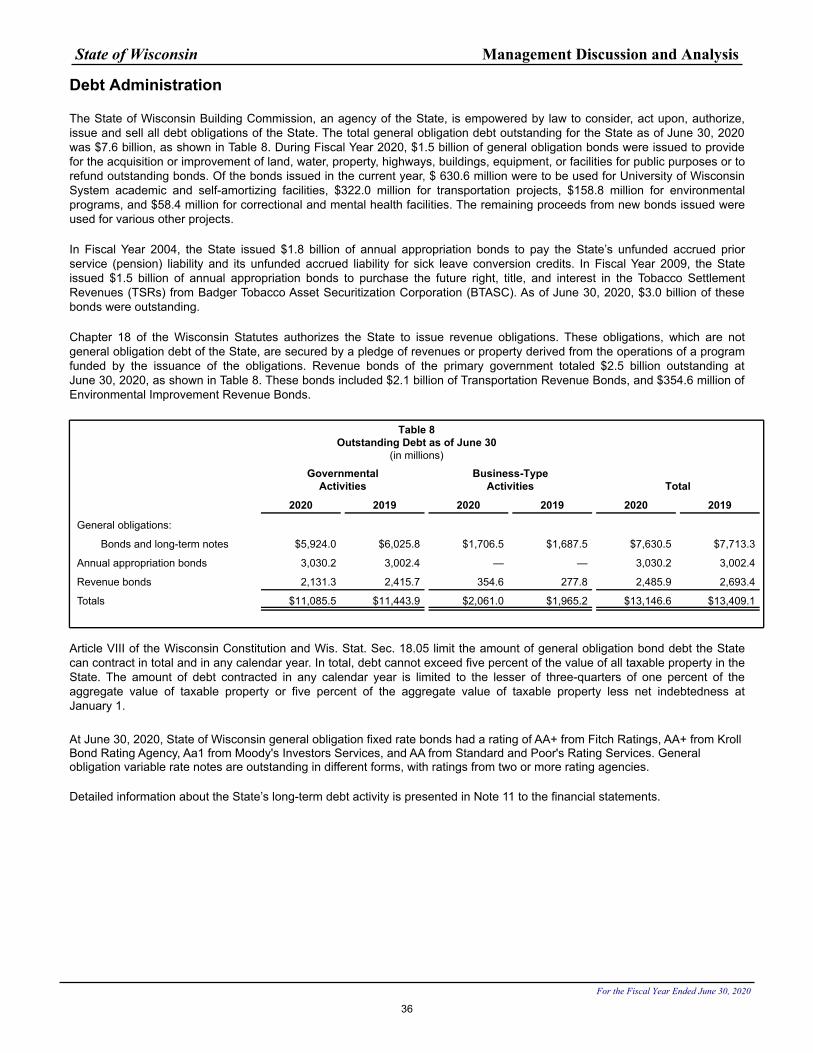
Debt Administration
The State of Wisconsin Building Commission, an agency of the State, is empowered by law to consider, act upon, authorize, issue and sell all debt obligations of the State. The total general obligation debt outstanding for the State as of June 30, 2020 was $7.6 billion, as shown in Table 8. During Fiscal Year 2020, $1.5 billion of general obligation bonds were issued to provide for the acquisition or improvement of land, water, property, highways, buildings, equipment, or facilities for public purposes or to refund outstanding bonds. Of the bonds issued in the current year, $ 630.6 million were to be used for University of Wisconsin System academic and self-amortizing facilities, $322.0 million for transportation projects, $158.8 million for environmental programs, and $58.4 million for correctional and mental health facilities. The remaining proceeds from new bonds issued were used for various other projects.
In Fiscal Year 2004, the State issued $1.8 billion of annual appropriation bonds to pay the State’s unfunded accrued prior service (pension) liability and its unfunded accrued liability for sick leave conversion credits. In Fiscal Year 2009, the State issued $1.5 billion of annual appropriation bonds to purchase the future right, title, and interest in the Tobacco Settlement Revenues (TSRs) from Badger Tobacco Asset Securitization Corporation (BTASC). As of June 30, 2020, $3.0 billion of these bonds were outstanding.
Chapter 18 of the Wisconsin Statutes authorizes the State to issue revenue obligations. These obligations, which are not general obligation debt of the State, are secured by a pledge of revenues or property derived from the operations of a program funded by the issuance of the obligations. Revenue bonds of the primary government totaled $2.5 billion outstanding at June 30, 2020, as shown in Table 8. These bonds included $2.1 billion of Transportation Revenue Bonds, and $354.6 million of Environmental Improvement Revenue Bonds.
Table 8Outstanding Debt as of June 30
(in millions)
GovernmentalActivities
Business-TypeActivities Total
2020 2019 2020 2019 2020 2019
General obligations:
Bonds and long-term notes $5,924.0 $6,025.8 $1,706.5 $1,687.5 $7,630.5 $7,713.3
Annual appropriation bonds 3,030.2 3,002.4 — — 3,030.2 3,002.4
Revenue bonds 2,131.3 2,415.7 354.6 277.8 2,485.9 2,693.4
Totals $11,085.5 $11,443.9 $2,061.0 $1,965.2 $13,146.6 $13,409.1
Article VIII of the Wisconsin Constitution and Wis. Stat. Sec. 18.05 limit the amount of general obligation bond debt the State can contract in total and in any calendar year. In total, debt cannot exceed five percent of the value of all taxable property in the State. The amount of debt contracted in any calendar year is limited to the lesser of three-quarters of one percent of the aggregate value of taxable property or five percent of the aggregate value of taxable property less net indebtedness at January 1.
At June 30, 2020, State of Wisconsin general obligation fixed rate bonds had a rating of AA+ from Fitch Ratings, AA+ from Kroll Bond Rating Agency, Aa1 from Moody's Investors Services, and AA from Standard and Poor's Rating Services. General obligation variable rate notes are outstanding in different forms, with ratings from two or more rating agencies.
Detailed information about the State’s long-term debt activity is presented in Note 11 to the financial statements.
State of Wisconsin Management Discussion and Analysis
For the Fiscal Year Ended June 30, 2020
36
INFRASTRUCTURE -- MODIFIED APPROACH
The State reports infrastructure (i.e., roads, bridges, and buildings considered an ancillary part of roads) as capital assets. Infrastructure assets exclude right-of-way costs. The State has elected to report its infrastructure assets (11,200 centerline miles of roads and 5,200 bridges with a combined value of $18.4 billion) using the modified approach. Under this method, infrastructure assets are not required to be depreciated if the State manages its eligible infrastructure assets using an asset management system designed to maintain and preserve these assets at a condition level established and disclosed by the State.
All infrastructure assets constructed prior to July 1, 2000 have been recorded at estimated historical cost. Historical cost was determined by calculating current costs of a similar asset and deflating that cost, using the Federal Highway Administration’s composite index for federal-aid highway construction, to the estimated average construction date. All infrastructure assets constructed on or after July 1, 2000 have been recorded at historical cost.
In order to adequately serve the traveling public and support the State economy, it is the State’s policy to ensure at least 85 percent of the state-owned roads and bridges are in good or fair condition. As of June 30, 2020, 92.4 percent of the roads and 97.7 percent of bridges were in good or fair condition, consistent with State policies. This compares to 92.4 percent of the roads and 97.4 percent of bridges as of June 30, 2019.
For the fiscal year ended June 30, 2020, actual maintenance and preservation costs for the State’s road network were $671.0 million, or $157.6 million less than the estimated amount. On the same date, actual maintenance and preservation costs for the State’s bridge network were $67.5 million, or $39.8 million less than the estimated amount. In developing estimated costs at the beginning of the fiscal year, it is difficult to predict the types of projects that will actually incur costs during the year. In addition, the State of Wisconsin, Department of Transportation’s multi-year contracting process, allowing encumbrances to carry forward, makes a comparison of actual to estimate amounts difficult since expenditures for the current year may have been budgeted and committed to a project in prior years.
ECONOMIC FACTORS
During calendar year 2019, the Wisconsin economy continued its expansion.
Wisconsin employment continued to grow throughout 2019 at a moderate pace. According to the federal Bureau of Labor Statistics, total nonfarm employment in Wisconsin increased 0.7 percent in 2017, 0.9 percent in 2018 and 0.2 percent during 2019. Nationally, employment grew 1.5 percent in 2017, 1.6 percent in 2018 and 1.4 percent in 2019. Wisconsin employment growth is somewhat constrained due to a lower unemployment rate and a slower overall population growth than the nation as a whole.
More recently, due to the economic effects of the COVID-19 global pandemic, Wisconsin employment and national employment both have contracted sharply compared to the prior year. Between September 2019 and September 2020, Wisconsin employment decreased 6.5 percent. Nationally, employment is down 6.4 percent over the same period. Wisconsin's seasonally adjusted unemployment rate in September 2020 was 5.4 percent, below the 7.9 percent national unemployment rate for the same month. Both Wisconsin and national employment have rebounded significantly from the lows reached in April 2020 due to the effects of virus mitigation efforts.
Reflecting the expansion prior to the pandemic, Wisconsin's state nominal gross domestic product increased 3.5 percent in 2019, tracking national growth of 4.0 percent. Wisconsin's 2019 growth followed growth rates of 2.3 percent and 5.3 percent in 2017 and 2018, respectively. These figures compare with the 50-state total gross domestic product increases of 4.3 percent in 2017 and 5.5 percent in 2018.
Steady growth in output has spurred gains in personal income. Wisconsin personal income grew 3.8 percent, 5.1 percent and 3.4 percent in 2017, 2018 and 2019, respectively. Nationally, personal income grew 4.9 percent, 5.3 percent and 3.9 percent in the same years. On a per capita basis, Wisconsin's income performance is similar to the nation's. Per capita income in Wisconsin increased by 3.5 percent, 4.8 percent and 3.1 percent in 2017, 2018 and 2019, respectively. This compares to growth of 4.2 percent, 4.8 percent and 3.5 percent in the same years nationally. Relative to the national average, Wisconsin per capita income has remained in approximately the same range for the past three years at 94.5 percent, 94.5 percent and 94.2 percent of the national average in 2017, 2018 and 2019, respectively.
State of Wisconsin Management Discussion and Analysis
For the Fiscal Year Ended June 30, 2020
37
Wisconsin's statewide total property value increased again in 2020 for the seventh straight year following five years of declines from 2009 through 2013. The increase in values has been broad-based, reflecting improvements in all major sectors. In 2020, total property values increased 5.5 percent, with residential property value growing at 5.3 percent. In addition, commercial real estate values grew 7.5 percent and manufacturing values grew 5.0 percent.
CONTACTING THE STATE'S FINANCIAL MANAGEMENT
This financial report is designed to provide Wisconsin's citizens, taxpayers, customers, investors and creditors with a general overview of the State's finances and to demonstrate the State's accountability for the money it receives. Questions about this report or requests for additional financial information should be addressed to: State of Wisconsin, State Controller's Office, 101 E. Wilson Street, 5th Floor, Madison, WI 53703 or by email to: [email protected].
Some state agencies, such as the State of Wisconsin Investment Board, Department of Employee Trust Funds and the University of Wisconsin, issue stand-alone audited financial statements. The information contained in those statements may vary from this document due to scope and application of generally accepted accounting principles. Questions about how to obtain the separately issued financial statements should be directed to individual agencies or to the State Controller’s Office.
The State’s component units issue their own separate audited financial statements. These statements may be obtained by directly contacting the component unit through their administrative offices identified in Note 1-B.
* * * *
State of Wisconsin Management Discussion and Analysis
For the Fiscal Year Ended June 30, 2020
38

Basic Financial Statements
39
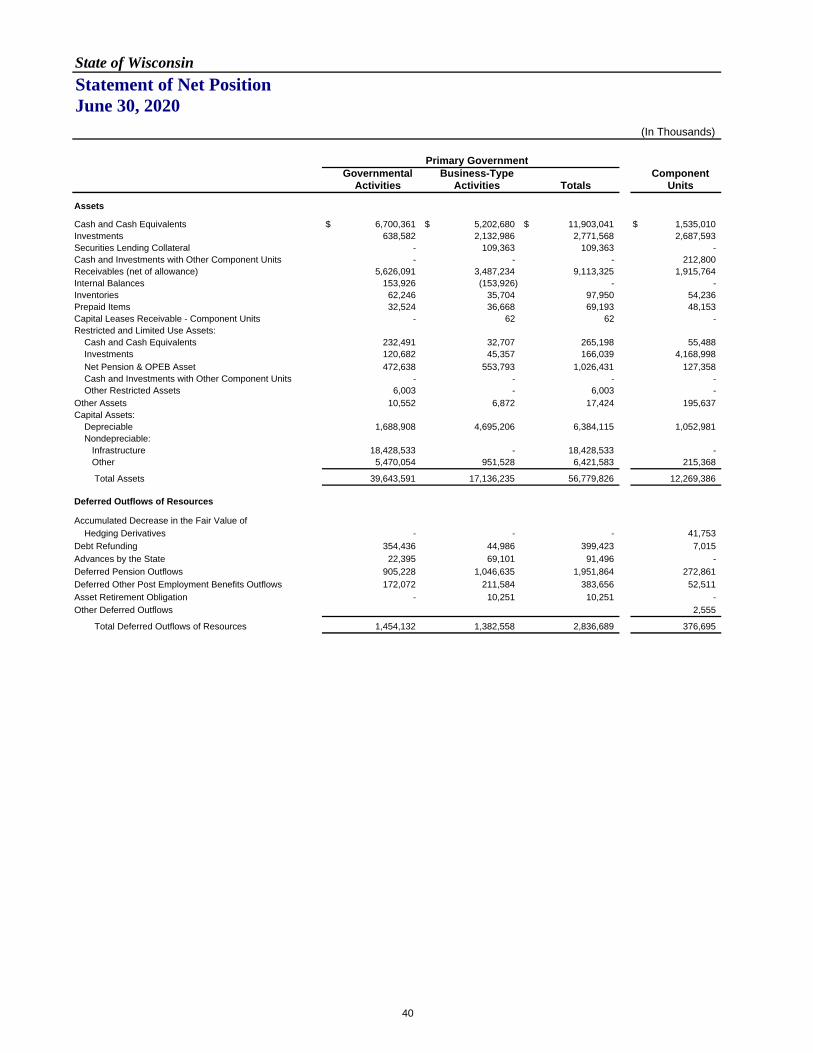
State of Wisconsin
Statement of Net PositionJune 30, 2020
(In Thousands)
Primary GovernmentGovernmental Business-Type Component
Activities Activities Totals Units
Assets
Cash and Cash Equivalents $ 6,700,361 $ 5,202,680 $ 11,903,041 $ 1,535,010 Investments 638,582 2,132,986 2,771,568 2,687,593 Securities Lending Collateral - 109,363 109,363 - Cash and Investments with Other Component Units - - - 212,800 Receivables (net of allowance) 5,626,091 3,487,234 9,113,325 1,915,764 Internal Balances 153,926 (153,926) - - Inventories 62,246 35,704 97,950 54,236 Prepaid Items 32,524 36,668 69,193 48,153 Capital Leases Receivable - Component Units - 62 62 - Restricted and Limited Use Assets: Cash and Cash Equivalents 232,491 32,707 265,198 55,488 Investments 120,682 45,357 166,039 4,168,998
Net Pension & OPEB Asset 472,638 553,793 1,026,431 127,358 Cash and Investments with Other Component Units - - - - Other Restricted Assets 6,003 - 6,003 - Other Assets 10,552 6,872 17,424 195,637 Capital Assets: Depreciable 1,688,908 4,695,206 6,384,115 1,052,981 Nondepreciable: Infrastructure 18,428,533 - 18,428,533 - Other 5,470,054 951,528 6,421,583 215,368
Total Assets 39,643,591 17,136,235 56,779,826 12,269,386
Deferred Outflows of Resources
Accumulated Decrease in the Fair Value of
Hedging Derivatives - - - 41,753
Debt Refunding 354,436 44,986 399,423 7,015
Advances by the State 22,395 69,101 91,496 -
Deferred Pension Outflows 905,228 1,046,635 1,951,864 272,861
Deferred Other Post Employment Benefits Outflows 172,072 211,584 383,656 52,511
Asset Retirement Obligation - 10,251 10,251 -
Other Deferred Outflows 2,555
Total Deferred Outflows of Resources 1,454,132 1,382,558 2,836,689 376,695
40
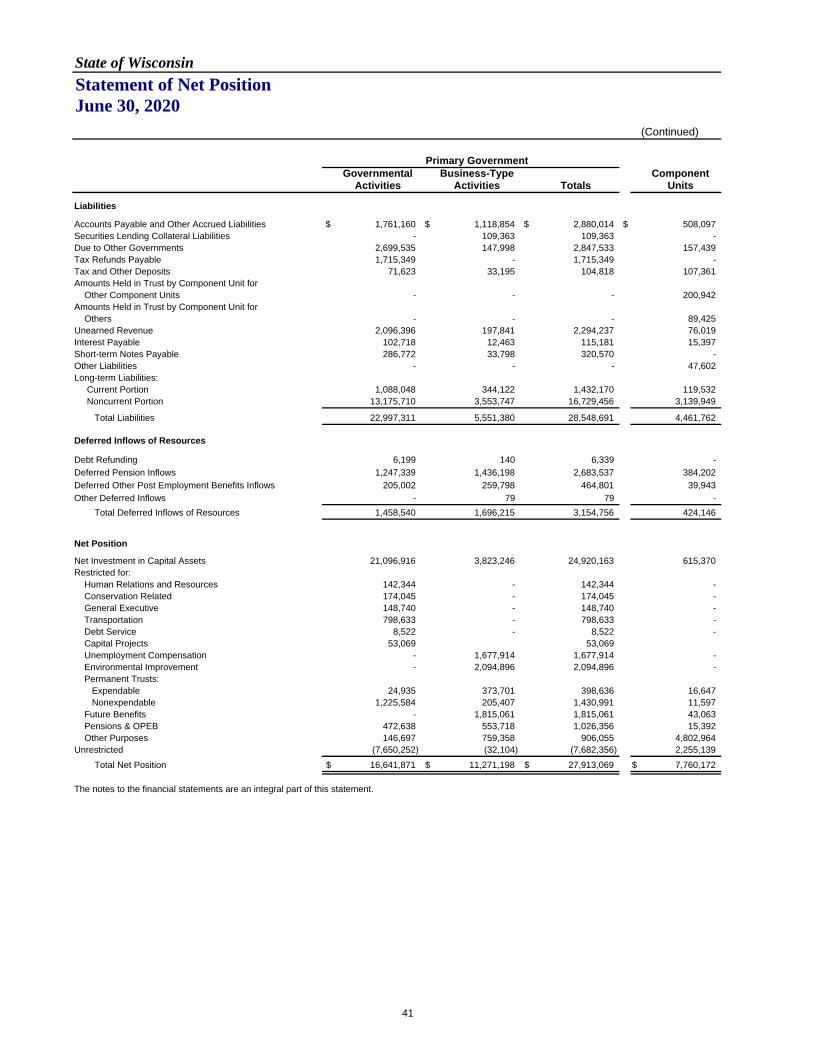
State of Wisconsin
Statement of Net PositionJune 30, 2020
(Continued)
Primary GovernmentGovernmental Business-Type Component
Activities Activities Totals Units
Liabilities
Accounts Payable and Other Accrued Liabilities $ 1,761,160 $ 1,118,854 $ 2,880,014 $ 508,097 Securities Lending Collateral Liabilities - 109,363 109,363 - Due to Other Governments 2,699,535 147,998 2,847,533 157,439 Tax Refunds Payable 1,715,349 - 1,715,349 - Tax and Other Deposits 71,623 33,195 104,818 107,361 Amounts Held in Trust by Component Unit for Other Component Units - - - 200,942 Amounts Held in Trust by Component Unit for Others - - - 89,425 Unearned Revenue 2,096,396 197,841 2,294,237 76,019 Interest Payable 102,718 12,463 115,181 15,397 Short-term Notes Payable 286,772 33,798 320,570 - Other Liabilities - - - 47,602 Long-term Liabilities: Current Portion 1,088,048 344,122 1,432,170 119,532 Noncurrent Portion 13,175,710 3,553,747 16,729,456 3,139,949
Total Liabilities 22,997,311 5,551,380 28,548,691 4,461,762
Deferred Inflows of Resources
Debt Refunding 6,199 140 6,339 -
Deferred Pension Inflows 1,247,339 1,436,198 2,683,537 384,202
Deferred Other Post Employment Benefits Inflows 205,002 259,798 464,801 39,943
Other Deferred Inflows - 79 79 -
Total Deferred Inflows of Resources 1,458,540 1,696,215 3,154,756 424,146
Net Position
Net Investment in Capital Assets 21,096,916 3,823,246 24,920,163 615,370 Restricted for: Human Relations and Resources 142,344 - 142,344 - Conservation Related 174,045 - 174,045 - General Executive 148,740 - 148,740 - Transportation 798,633 - 798,633 - Debt Service 8,522 - 8,522 - Capital Projects 53,069 53,069 Unemployment Compensation - 1,677,914 1,677,914 - Environmental Improvement - 2,094,896 2,094,896 - Permanent Trusts: Expendable 24,935 373,701 398,636 16,647 Nonexpendable 1,225,584 205,407 1,430,991 11,597 Future Benefits - 1,815,061 1,815,061 43,063 Pensions & OPEB 472,638 553,718 1,026,356 15,392 Other Purposes 146,697 759,358 906,055 4,802,964 Unrestricted (7,650,252) (32,104) (7,682,356) 2,255,139
Total Net Position $ 16,641,871 $ 11,271,198 $ 27,913,069 $ 7,760,172
The notes to the financial statements are an integral part of this statement.
41
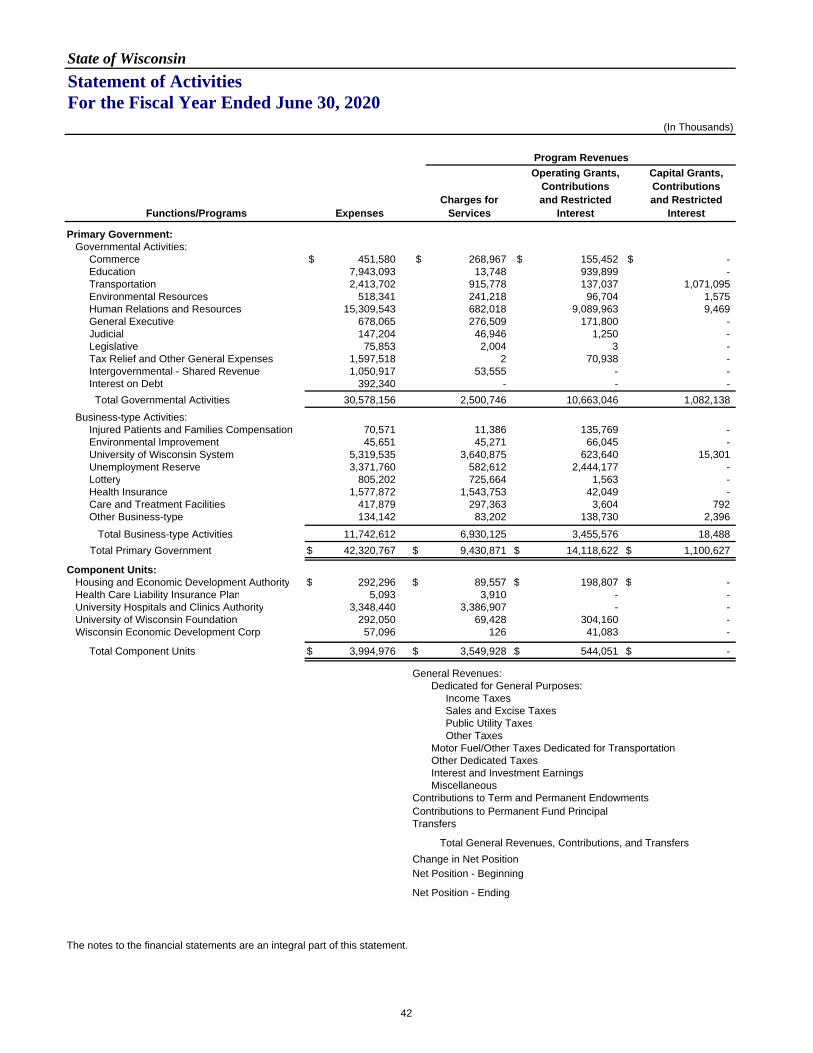
State of Wisconsin
Statement of Activities For the Fiscal Year Ended June 30, 2020
(In Thousands)
Operating Grants, Capital Grants,Contributions Contributions
Charges for and Restricted and RestrictedFunctions/Programs Expenses Services Interest Interest
Primary Government: Governmental Activities:
Commerce $ 451,580 $ 268,967 $ 155,452 $ - Education 7,943,093 13,748 939,899 - Transportation 2,413,702 915,778 137,037 1,071,095 Environmental Resources 518,341 241,218 96,704 1,575 Human Relations and Resources 15,309,543 682,018 9,089,963 9,469 General Executive 678,065 276,509 171,800 - Judicial 147,204 46,946 1,250 - Legislative 75,853 2,004 3 - Tax Relief and Other General Expenses 1,597,518 2 70,938 - Intergovernmental - Shared Revenue 1,050,917 53,555 - - Interest on Debt 392,340 - - -
Total Governmental Activities 30,578,156 2,500,746 10,663,046 1,082,138
Business-type Activities:Injured Patients and Families Compensation 70,571 11,386 135,769 - Environmental Improvement 45,651 45,271 66,045 - University of Wisconsin System 5,319,535 3,640,875 623,640 15,301 Unemployment Reserve 3,371,760 582,612 2,444,177 - Lottery 805,202 725,664 1,563 - Health Insurance 1,577,872 1,543,753 42,049 - Care and Treatment Facilities 417,879 297,363 3,604 792 Other Business-type 134,142 83,202 138,730 2,396
Total Business-type Activities 11,742,612 6,930,125 3,455,576 18,488
Total Primary Government $ 42,320,767 $ 9,430,871 $ 14,118,622 $ 1,100,627
Component Units: Housing and Economic Development Authority $ 292,296 $ 89,557 $ 198,807 $ - Health Care Liability Insurance Plan 5,093 3,910 - - University Hospitals and Clinics Authority 3,348,440 3,386,907 - - University of Wisconsin Foundation 292,050 69,428 304,160 - Wisconsin Economic Development Corp 57,096 126 41,083 -
Total Component Units $ 3,994,976 $ 3,549,928 $ 544,051 $ -
General Revenues:Dedicated for General Purposes: Income Taxes Sales and Excise Taxes Public Utility Taxes Other TaxesMotor Fuel/Other Taxes Dedicated for TransportationOther Dedicated TaxesInterest and Investment EarningsMiscellaneous
Contributions to Term and Permanent EndowmentsContributions to Permanent Fund PrincipalTransfers
Total General Revenues, Contributions, and Transfers
Change in Net PositionNet Position - Beginning
Net Position - Ending
The notes to the financial statements are an integral part of this statement.
Program Revenues
42
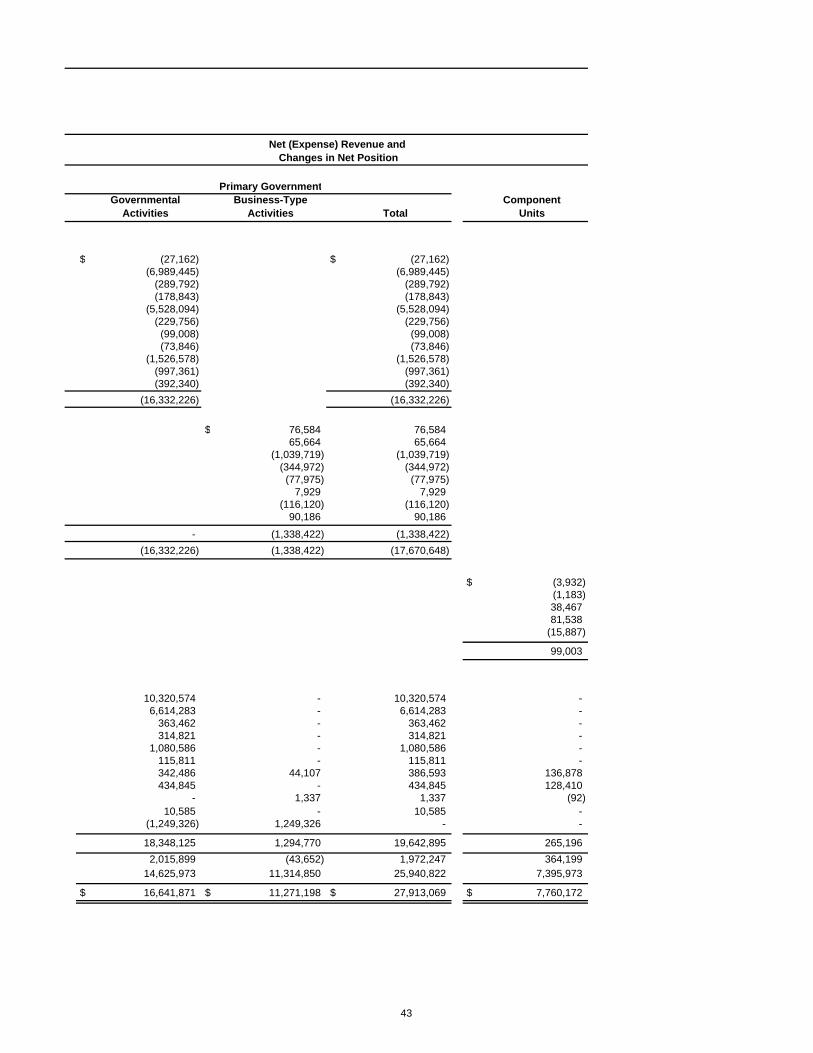
Governmental Business-Type ComponentActivities Activities Total Units
$ (27,162) $ (27,162) (6,989,445) (6,989,445)
(289,792) (289,792) (178,843) (178,843)
(5,528,094) (5,528,094) (229,756) (229,756) (99,008) (99,008) (73,846) (73,846)
(1,526,578) (1,526,578) (997,361) (997,361) (392,340) (392,340)
(16,332,226) (16,332,226)
$ 76,584 76,584 65,664 65,664
(1,039,719) (1,039,719) (344,972) (344,972) (77,975) (77,975)
7,929 7,929 (116,120) (116,120)
90,186 90,186
- (1,338,422) (1,338,422)
(16,332,226) (1,338,422) (17,670,648)
$ (3,932) (1,183) 38,467 81,538
(15,887)
99,003
10,320,574 - 10,320,574 - 6,614,283 - 6,614,283 -
363,462 - 363,462 - 314,821 - 314,821 -
1,080,586 - 1,080,586 - 115,811 - 115,811 - 342,486 44,107 386,593 136,878 434,845 - 434,845 128,410
- 1,337 1,337 (92) 10,585 - 10,585 -
(1,249,326) 1,249,326 - -
18,348,125 1,294,770 19,642,895 265,196
2,015,899 (43,652) 1,972,247 364,199 14,625,973 11,314,850 25,940,822 7,395,973
$ 16,641,871 $ 11,271,198 $ 27,913,069 $ 7,760,172
Primary Government
Net (Expense) Revenue and Changes in Net Position
43
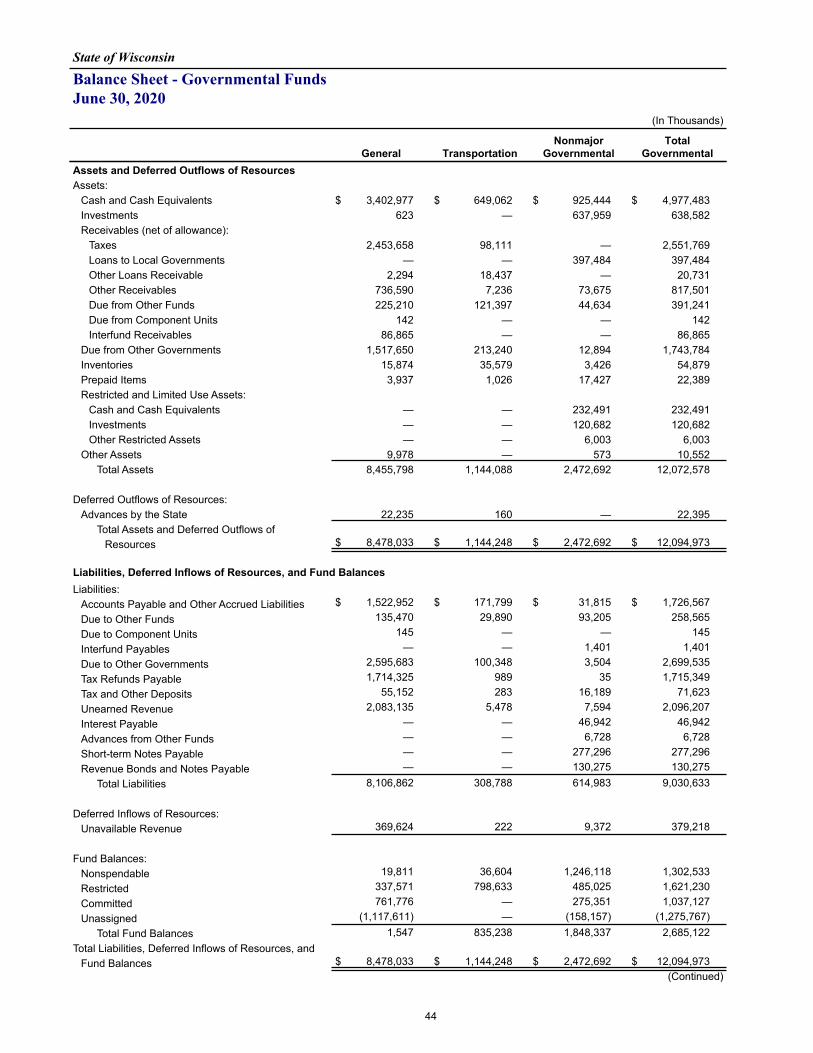
State of Wisconsin
Balance Sheet - Governmental FundsJune 30, 2020
(In Thousands)
General TransportationNonmajor
GovernmentalTotal
GovernmentalAssets and Deferred Outflows of ResourcesAssets:
Cash and Cash Equivalents $ 3,402,977 $ 649,062 $ 925,444 $ 4,977,483 Investments 623 — 637,959 638,582 Receivables (net of allowance):
Taxes 2,453,658 98,111 — 2,551,769 Loans to Local Governments — — 397,484 397,484 Other Loans Receivable 2,294 18,437 — 20,731 Other Receivables 736,590 7,236 73,675 817,501 Due from Other Funds 225,210 121,397 44,634 391,241 Due from Component Units 142 — — 142 Interfund Receivables 86,865 — — 86,865
Due from Other Governments 1,517,650 213,240 12,894 1,743,784 Inventories 15,874 35,579 3,426 54,879 Prepaid Items 3,937 1,026 17,427 22,389 Restricted and Limited Use Assets:
Cash and Cash Equivalents — — 232,491 232,491 Investments — — 120,682 120,682 Other Restricted Assets — — 6,003 6,003
Other Assets 9,978 — 573 10,552 Total Assets 8,455,798 1,144,088 2,472,692 12,072,578
Deferred Outflows of Resources:Advances by the State 22,235 160 — 22,395
Total Assets and Deferred Outflows of Resources $ 8,478,033 $ 1,144,248 $ 2,472,692 $ 12,094,973
Liabilities, Deferred Inflows of Resources, and Fund BalancesLiabilities:
Accounts Payable and Other Accrued Liabilities $ 1,522,952 $ 171,799 $ 31,815 $ 1,726,567 Due to Other Funds 135,470 29,890 93,205 258,565 Due to Component Units 145 — — 145 Interfund Payables — — 1,401 1,401 Due to Other Governments 2,595,683 100,348 3,504 2,699,535 Tax Refunds Payable 1,714,325 989 35 1,715,349 Tax and Other Deposits 55,152 283 16,189 71,623 Unearned Revenue 2,083,135 5,478 7,594 2,096,207 Interest Payable — — 46,942 46,942 Advances from Other Funds — — 6,728 6,728 Short-term Notes Payable — — 277,296 277,296 Revenue Bonds and Notes Payable — — 130,275 130,275
Total Liabilities 8,106,862 308,788 614,983 9,030,633
Deferred Inflows of Resources:Unavailable Revenue 369,624 222 9,372 379,218
Fund Balances:Nonspendable 19,811 36,604 1,246,118 1,302,533 Restricted 337,571 798,633 485,025 1,621,230 Committed 761,776 — 275,351 1,037,127 Unassigned (1,117,611) — (158,157) (1,275,767)
Total Fund Balances 1,547 835,238 1,848,337 2,685,122 Total Liabilities, Deferred Inflows of Resources, and
Fund Balances $ 8,478,033 $ 1,144,248 $ 2,472,692 $ 12,094,973 (Continued)
44
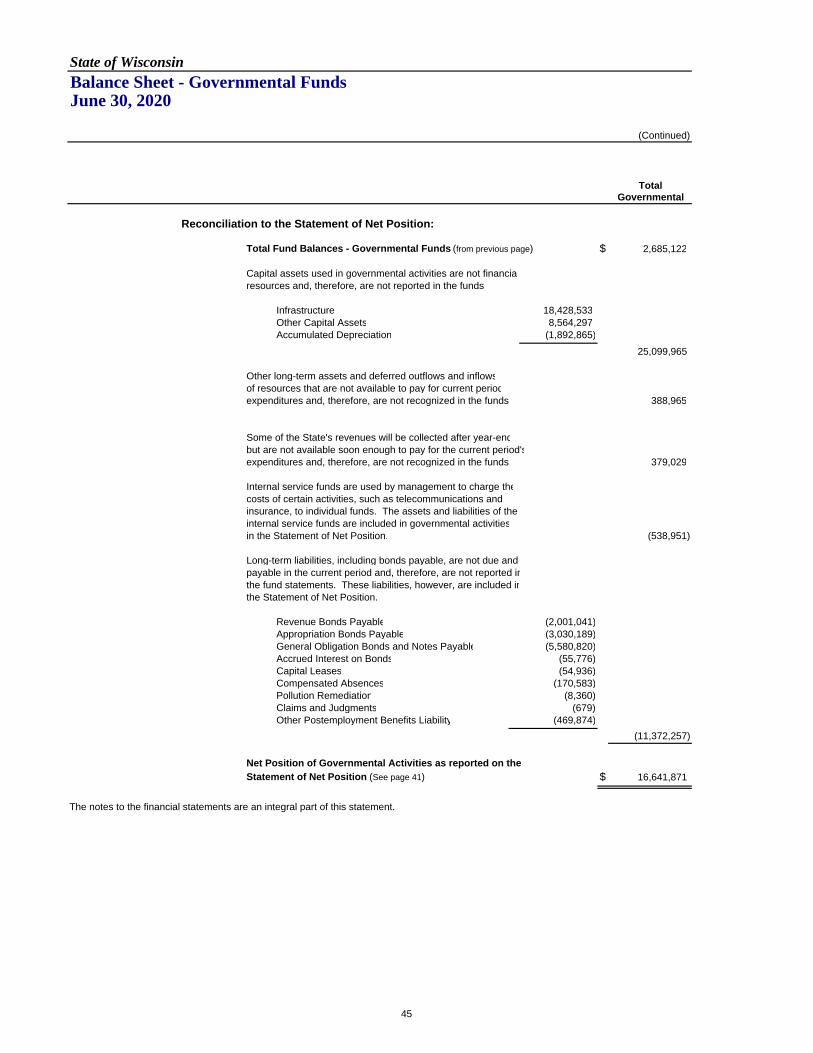
State of Wisconsin
Balance Sheet - Governmental Funds June 30, 2020
(Continued)
TotalGovernmental
Reconciliation to the Statement of Net Position:
Total Fund Balances - Governmental Funds (from previous page) $ 2,685,122
Capital assets used in governmental activities are not financiaresources and, therefore, are not reported in the funds
Infrastructure 18,428,533 Other Capital Assets 8,564,297 Accumulated Depreciation (1,892,865)
25,099,965
Other long-term assets and deferred outflows and inflowsof resources that are not available to pay for current periodexpenditures and, therefore, are not recognized in the funds 388,965
Some of the State's revenues will be collected after year-endbut are not available soon enough to pay for the current period'sexpenditures and, therefore, are not recognized in the funds 379,029
Internal service funds are used by management to charge thecosts of certain activities, such as telecommunications and insurance, to individual funds. The assets and liabilities of the internal service funds are included in governmental activitiesin the Statement of Net Position. (538,951)
Long-term liabilities, including bonds payable, are not due and payable in the current period and, therefore, are not reported inthe fund statements. These liabilities, however, are included inthe Statement of Net Position.
Revenue Bonds Payable (2,001,041) Appropriation Bonds Payable (3,030,189) General Obligation Bonds and Notes Payable (5,580,820) Accrued Interest on Bonds (55,776) Capital Leases (54,936) Compensated Absences (170,583) Pollution Remediation (8,360) Claims and Judgments (679) Other Postemployment Benefits Liability (469,874)
(11,372,257)
Net Position of Governmental Activities as reported on the Statement of Net Position (See page 41) $ 16,641,871
The notes to the financial statements are an integral part of this statement.
45
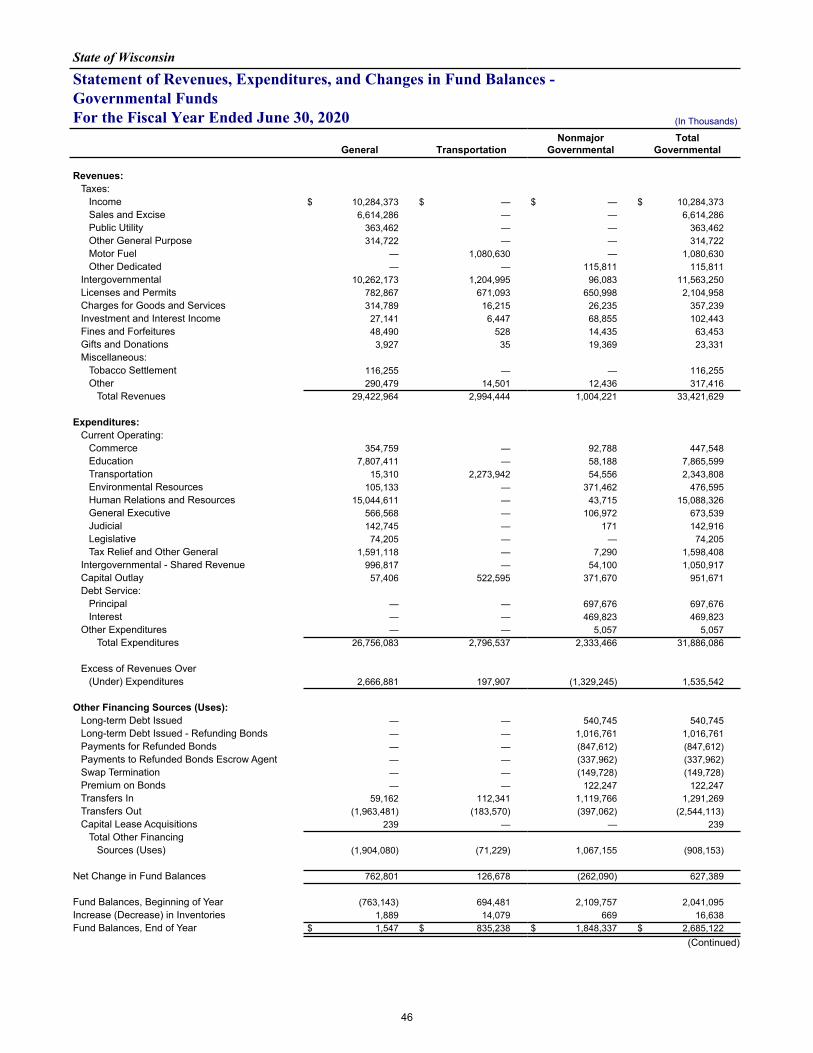
State of Wisconsin
Statement of Revenues, Expenditures, and Changes in Fund Balances -Governmental FundsFor the Fiscal Year Ended June 30, 2020 (In Thousands)
General TransportationNonmajor
GovernmentalTotal
Governmental
Revenues:Taxes:
Income $ 10,284,373 $ — $ — $ 10,284,373 Sales and Excise 6,614,286 — — 6,614,286 Public Utility 363,462 — — 363,462 Other General Purpose 314,722 — — 314,722 Motor Fuel — 1,080,630 — 1,080,630 Other Dedicated — — 115,811 115,811
Intergovernmental 10,262,173 1,204,995 96,083 11,563,250 Licenses and Permits 782,867 671,093 650,998 2,104,958 Charges for Goods and Services 314,789 16,215 26,235 357,239 Investment and Interest Income 27,141 6,447 68,855 102,443 Fines and Forfeitures 48,490 528 14,435 63,453 Gifts and Donations 3,927 35 19,369 23,331 Miscellaneous:
Tobacco Settlement 116,255 — — 116,255 Other 290,479 14,501 12,436 317,416
Total Revenues 29,422,964 2,994,444 1,004,221 33,421,629
Expenditures:Current Operating:
Commerce 354,759 — 92,788 447,548 Education 7,807,411 — 58,188 7,865,599 Transportation 15,310 2,273,942 54,556 2,343,808 Environmental Resources 105,133 — 371,462 476,595 Human Relations and Resources 15,044,611 — 43,715 15,088,326 General Executive 566,568 — 106,972 673,539 Judicial 142,745 — 171 142,916 Legislative 74,205 — — 74,205 Tax Relief and Other General 1,591,118 — 7,290 1,598,408
Intergovernmental - Shared Revenue 996,817 — 54,100 1,050,917 Capital Outlay 57,406 522,595 371,670 951,671 Debt Service:
Principal — — 697,676 697,676 Interest — — 469,823 469,823
Other Expenditures — — 5,057 5,057 Total Expenditures 26,756,083 2,796,537 2,333,466 31,886,086
Excess of Revenues Over(Under) Expenditures 2,666,881 197,907 (1,329,245) 1,535,542
Other Financing Sources (Uses):Long-term Debt Issued — — 540,745 540,745 Long-term Debt Issued - Refunding Bonds — — 1,016,761 1,016,761 Payments for Refunded Bonds — — (847,612) (847,612) Payments to Refunded Bonds Escrow Agent — — (337,962) (337,962) Swap Termination — — (149,728) (149,728) Premium on Bonds — — 122,247 122,247 Transfers In 59,162 112,341 1,119,766 1,291,269 Transfers Out (1,963,481) (183,570) (397,062) (2,544,113) Capital Lease Acquisitions 239 — — 239
Total Other FinancingSources (Uses) (1,904,080) (71,229) 1,067,155 (908,153)
Net Change in Fund Balances 762,801 126,678 (262,090) 627,389
Fund Balances, Beginning of Year (763,143) 694,481 2,109,757 2,041,095 Increase (Decrease) in Inventories 1,889 14,079 669 16,638 Fund Balances, End of Year $ 1,547 $ 835,238 $ 1,848,337 $ 2,685,122
(Continued)
46
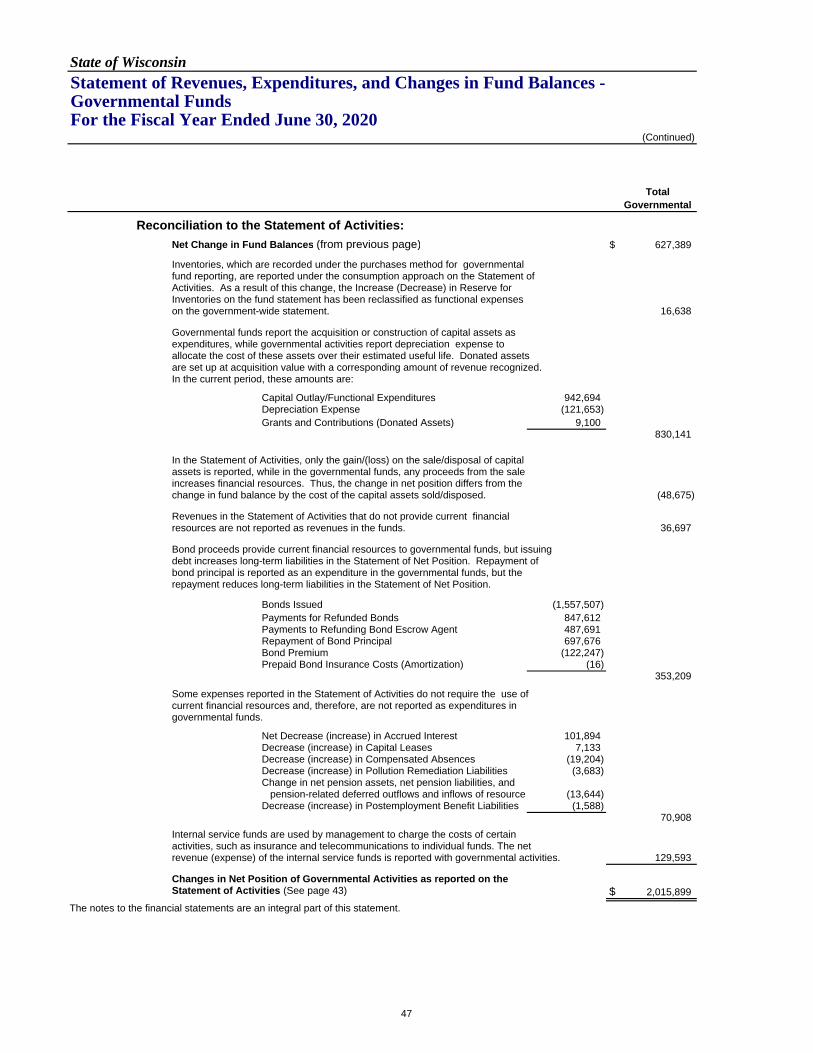
State of Wisconsin
Statement of Revenues, Expenditures, and Changes in Fund Balances - Governmental Funds For the Fiscal Year Ended June 30, 2020
(Continued)
TotalGovernmental
Reconciliation to the Statement of Activities:
Net Change in Fund Balances (from previous page) $ 627,389
Inventories, which are recorded under the purchases method for governmentalfund reporting, are reported under the consumption approach on the Statement ofActivities. As a result of this change, the Increase (Decrease) in Reserve forInventories on the fund statement has been reclassified as functional expenseson the government-wide statement. 16,638
Governmental funds report the acquisition or construction of capital assets asexpenditures, while governmental activities report depreciation expense toallocate the cost of these assets over their estimated useful life. Donated assets are set up at acquisition value with a corresponding amount of revenue recognized.In the current period, these amounts are:
Capital Outlay/Functional Expenditures 942,694 Depreciation Expense (121,653) Grants and Contributions (Donated Assets) 9,100
830,141
In the Statement of Activities, only the gain/(loss) on the sale/disposal of capitalassets is reported, while in the governmental funds, any proceeds from the saleincreases financial resources. Thus, the change in net position differs from thechange in fund balance by the cost of the capital assets sold/disposed. (48,675)
Revenues in the Statement of Activities that do not provide current financialresources are not reported as revenues in the funds. 36,697
Bond proceeds provide current financial resources to governmental funds, but issuingdebt increases long-term liabilities in the Statement of Net Position. Repayment ofbond principal is reported as an expenditure in the governmental funds, but therepayment reduces long-term liabilities in the Statement of Net Position.
Bonds Issued (1,557,507) Payments for Refunded Bonds 847,612 Payments to Refunding Bond Escrow Agent 487,691 Repayment of Bond Principal 697,676 Bond Premium (122,247) Prepaid Bond Insurance Costs (Amortization) (16)
353,209
Some expenses reported in the Statement of Activities do not require the use ofcurrent financial resources and, therefore, are not reported as expenditures ingovernmental funds.
Net Decrease (increase) in Accrued Interest 101,894 Decrease (increase) in Capital Leases 7,133 Decrease (increase) in Compensated Absences (19,204) Decrease (increase) in Pollution Remediation Liabilities (3,683) Change in net pension assets, net pension liabilities, and pension-related deferred outflows and inflows of resources (13,644) Decrease (increase) in Postemployment Benefit Liabilities (1,588)
70,908
Internal service funds are used by management to charge the costs of certainactivities, such as insurance and telecommunications to individual funds. The netrevenue (expense) of the internal service funds is reported with governmental activities. 129,593
Changes in Net Position of Governmental Activities as reported on the Statement of Activities (See page 43) $ 2,015,899
The notes to the financial statements are an integral part of this statement.
47
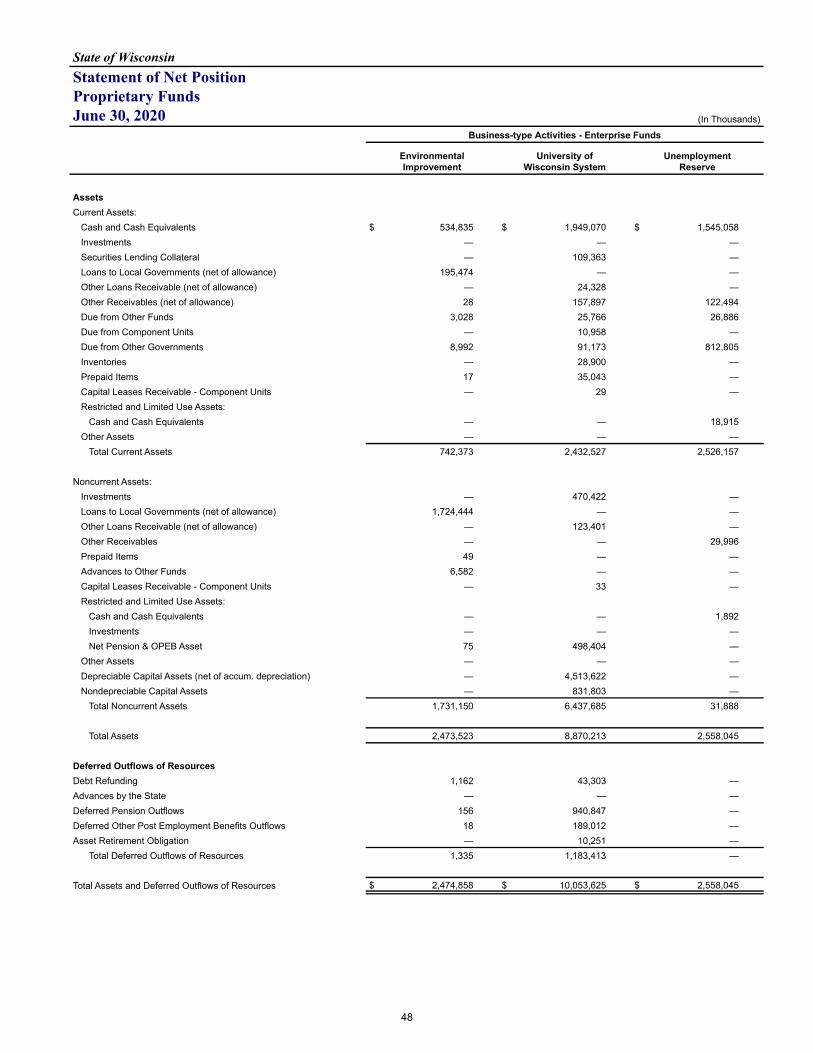
State of WisconsinStatement of Net PositionProprietary FundsJune 30, 2020 (In Thousands)
Business-type Activities - Enterprise Funds
Environmental Improvement
University ofWisconsin System
UnemploymentReserve
AssetsCurrent Assets:
Cash and Cash Equivalents $ 534,835 $ 1,949,070 $ 1,545,058 Investments — — — Securities Lending Collateral — 109,363 — Loans to Local Governments (net of allowance) 195,474 — — Other Loans Receivable (net of allowance) — 24,328 — Other Receivables (net of allowance) 28 157,897 122,494 Due from Other Funds 3,028 25,766 26,886 Due from Component Units — 10,958 — Due from Other Governments 8,992 91,173 812,805 Inventories — 28,900 — Prepaid Items 17 35,043 — Capital Leases Receivable - Component Units — 29 — Restricted and Limited Use Assets:
Cash and Cash Equivalents — — 18,915 Other Assets — — —
Total Current Assets 742,373 2,432,527 2,526,157
Noncurrent Assets:Investments — 470,422 — Loans to Local Governments (net of allowance) 1,724,444 — — Other Loans Receivable (net of allowance) — 123,401 — Other Receivables — — 29,996 Prepaid Items 49 — — Advances to Other Funds 6,582 — — Capital Leases Receivable - Component Units — 33 — Restricted and Limited Use Assets:
Cash and Cash Equivalents — — 1,892 Investments — — — Net Pension & OPEB Asset 75 498,404 —
Other Assets — — — Depreciable Capital Assets (net of accum. depreciation) — 4,513,622 — Nondepreciable Capital Assets — 831,803 —
Total Noncurrent Assets 1,731,150 6,437,685 31,888
Total Assets 2,473,523 8,870,213 2,558,045
Deferred Outflows of ResourcesDebt Refunding 1,162 43,303 — Advances by the State — — — Deferred Pension Outflows 156 940,847 — Deferred Other Post Employment Benefits Outflows 18 189,012 — Asset Retirement Obligation — 10,251 —
Total Deferred Outflows of Resources 1,335 1,183,413 —
Total Assets and Deferred Outflows of Resources $ 2,474,858 $ 10,053,625 $ 2,558,045
48
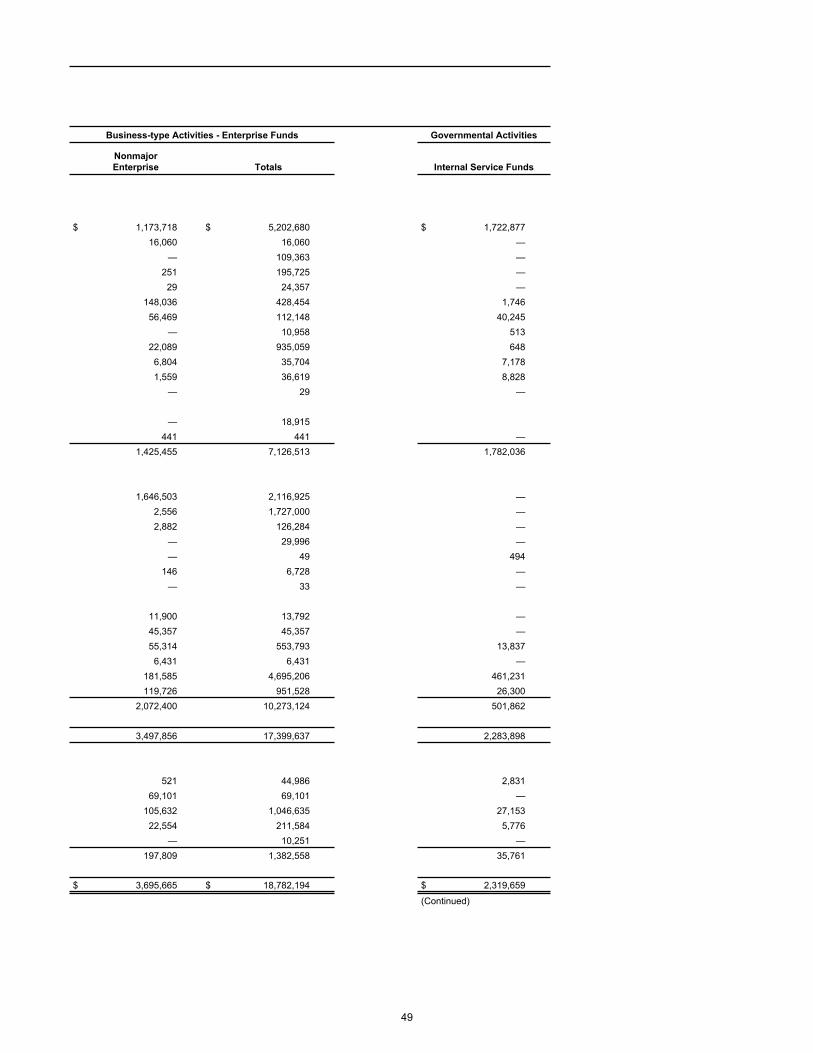
Business-type Activities - Enterprise Funds Governmental Activities
NonmajorEnterprise Totals Internal Service Funds
$ 1,173,718 $ 5,202,680 $ 1,722,877 16,060 16,060 — — 109,363 — 251 195,725 — 29 24,357 — 148,036 428,454 1,746 56,469 112,148 40,245 — 10,958 513 22,089 935,059 648 6,804 35,704 7,178 1,559 36,619 8,828 — 29 —
— 18,915 441 441 — 1,425,455 7,126,513 1,782,036
1,646,503 2,116,925 — 2,556 1,727,000 — 2,882 126,284 — — 29,996 — — 49 494 146 6,728 — — 33 —
11,900 13,792 — 45,357 45,357 — 55,314 553,793 13,837 6,431 6,431 — 181,585 4,695,206 461,231 119,726 951,528 26,300 2,072,400 10,273,124 501,862
3,497,856 17,399,637 2,283,898
521 44,986 2,831 69,101 69,101 — 105,632 1,046,635 27,153 22,554 211,584 5,776 — 10,251 — 197,809 1,382,558 35,761
$ 3,695,665 $ 18,782,194 $ 2,319,659
(Continued)
49
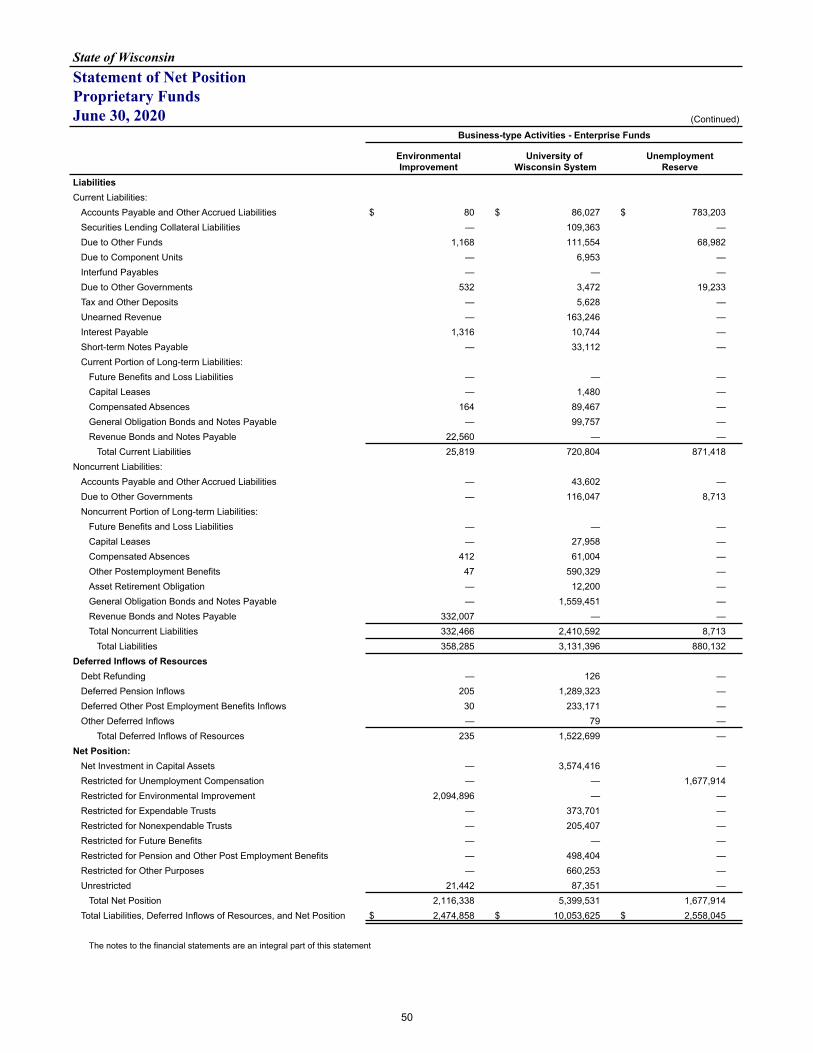
State of WisconsinStatement of Net PositionProprietary FundsJune 30, 2020 (Continued)
Business-type Activities - Enterprise Funds
Environmental Improvement
University of Wisconsin System
UnemploymentReserve
LiabilitiesCurrent Liabilities:
Accounts Payable and Other Accrued Liabilities $ 80 $ 86,027 $ 783,203 Securities Lending Collateral Liabilities — 109,363 — Due to Other Funds 1,168 111,554 68,982 Due to Component Units — 6,953 — Interfund Payables — — — Due to Other Governments 532 3,472 19,233 Tax and Other Deposits — 5,628 — Unearned Revenue — 163,246 — Interest Payable 1,316 10,744 — Short-term Notes Payable — 33,112 — Current Portion of Long-term Liabilities:
Future Benefits and Loss Liabilities — — — Capital Leases — 1,480 — Compensated Absences 164 89,467 — General Obligation Bonds and Notes Payable — 99,757 — Revenue Bonds and Notes Payable 22,560 — —
Total Current Liabilities 25,819 720,804 871,418 Noncurrent Liabilities:
Accounts Payable and Other Accrued Liabilities — 43,602 — Due to Other Governments — 116,047 8,713 Noncurrent Portion of Long-term Liabilities:
Future Benefits and Loss Liabilities — — — Capital Leases — 27,958 — Compensated Absences 412 61,004 — Other Postemployment Benefits 47 590,329 — Asset Retirement Obligation — 12,200 — General Obligation Bonds and Notes Payable — 1,559,451 — Revenue Bonds and Notes Payable 332,007 — — Total Noncurrent Liabilities 332,466 2,410,592 8,713
Total Liabilities 358,285 3,131,396 880,132 Deferred Inflows of Resources
Debt Refunding — 126 — Deferred Pension Inflows 205 1,289,323 — Deferred Other Post Employment Benefits Inflows 30 233,171 — Other Deferred Inflows — 79 —
Total Deferred Inflows of Resources 235 1,522,699 — Net Position:
Net Investment in Capital Assets — 3,574,416 — Restricted for Unemployment Compensation — — 1,677,914 Restricted for Environmental Improvement 2,094,896 — — Restricted for Expendable Trusts — 373,701 — Restricted for Nonexpendable Trusts — 205,407 — Restricted for Future Benefits — — — Restricted for Pension and Other Post Employment Benefits — 498,404 — Restricted for Other Purposes — 660,253 — Unrestricted 21,442 87,351 —
Total Net Position 2,116,338 5,399,531 1,677,914 Total Liabilities, Deferred Inflows of Resources, and Net Position $ 2,474,858 $ 10,053,625 $ 2,558,045
The notes to the financial statements are an integral part of this statement
50
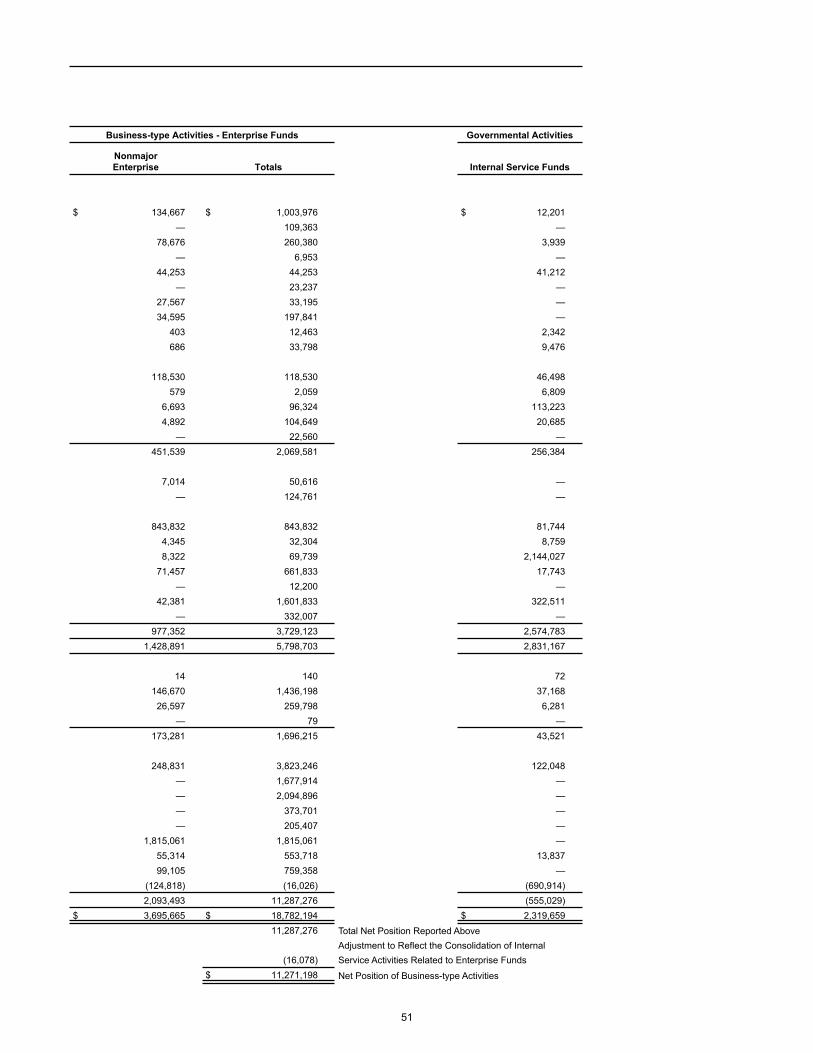
Business-type Activities - Enterprise Funds Governmental Activities
NonmajorEnterprise Totals Internal Service Funds
$ 134,667 $ 1,003,976 $ 12,201 — 109,363 — 78,676 260,380 3,939 — 6,953 — 44,253 44,253 41,212 — 23,237 — 27,567 33,195 — 34,595 197,841 — 403 12,463 2,342 686 33,798 9,476
118,530 118,530 46,498 579 2,059 6,809 6,693 96,324 113,223 4,892 104,649 20,685 — 22,560 — 451,539 2,069,581 256,384
7,014 50,616 — — 124,761 —
843,832 843,832 81,744 4,345 32,304 8,759 8,322 69,739 2,144,027 71,457 661,833 17,743 — 12,200 — 42,381 1,601,833 322,511 — 332,007 — 977,352 3,729,123 2,574,783 1,428,891 5,798,703 2,831,167
14 140 72 146,670 1,436,198 37,168 26,597 259,798 6,281 — 79 — 173,281 1,696,215 43,521
248,831 3,823,246 122,048 — 1,677,914 — — 2,094,896 — — 373,701 — — 205,407 — 1,815,061 1,815,061 — 55,314 553,718 13,837 99,105 759,358 — (124,818) (16,026) (690,914) 2,093,493 11,287,276 (555,029) $ 3,695,665 $ 18,782,194 $ 2,319,659
11,287,276 Total Net Position Reported AboveAdjustment to Reflect the Consolidation of Internal
(16,078) Service Activities Related to Enterprise Funds$ 11,271,198 Net Position of Business-type Activities
51
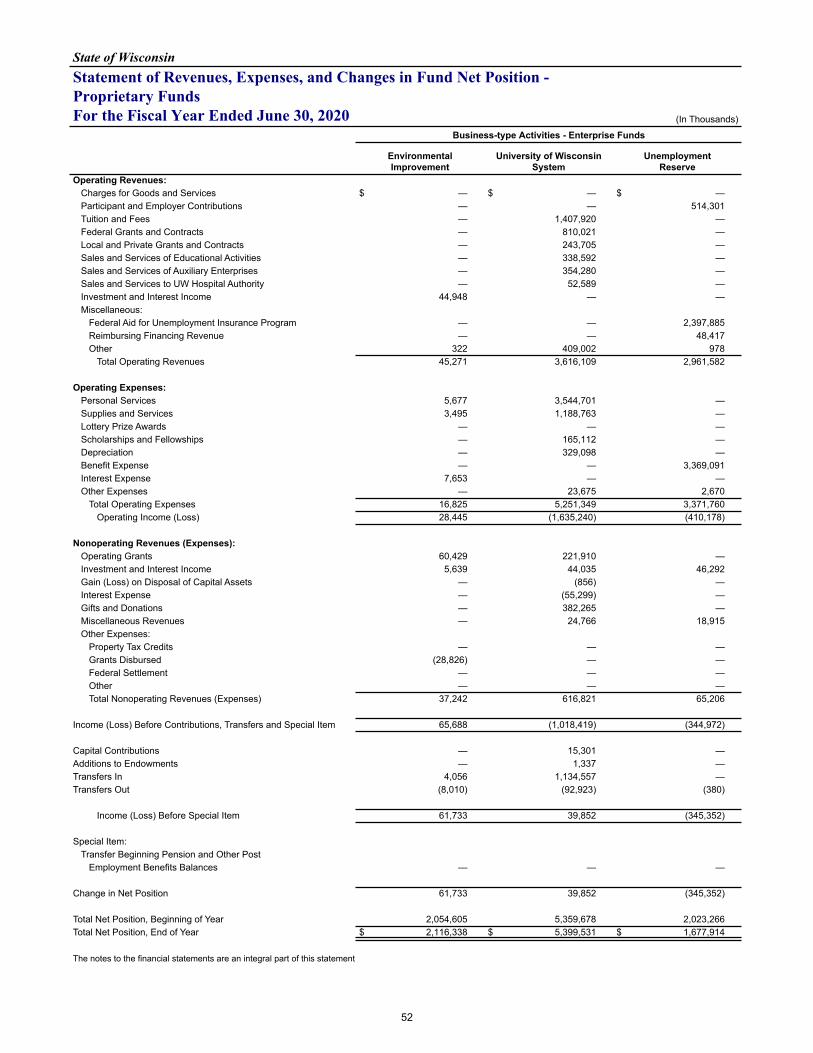
State of WisconsinStatement of Revenues, Expenses, and Changes in Fund Net Position - Proprietary FundsFor the Fiscal Year Ended June 30, 2020 (In Thousands)
Business-type Activities - Enterprise Funds
Environmental Improvement
University of Wisconsin System
UnemploymentReserve
Operating Revenues:Charges for Goods and Services $ — $ — $ — Participant and Employer Contributions — — 514,301 Tuition and Fees — 1,407,920 — Federal Grants and Contracts — 810,021 — Local and Private Grants and Contracts — 243,705 — Sales and Services of Educational Activities — 338,592 — Sales and Services of Auxiliary Enterprises — 354,280 — Sales and Services to UW Hospital Authority — 52,589 — Investment and Interest Income 44,948 — — Miscellaneous:
Federal Aid for Unemployment Insurance Program — — 2,397,885 Reimbursing Financing Revenue — — 48,417 Other 322 409,002 978
Total Operating Revenues 45,271 3,616,109 2,961,582
Operating Expenses:Personal Services 5,677 3,544,701 — Supplies and Services 3,495 1,188,763 — Lottery Prize Awards — — — Scholarships and Fellowships — 165,112 — Depreciation — 329,098 — Benefit Expense — — 3,369,091 Interest Expense 7,653 — — Other Expenses — 23,675 2,670
Total Operating Expenses 16,825 5,251,349 3,371,760 Operating Income (Loss) 28,445 (1,635,240) (410,178)
Nonoperating Revenues (Expenses):
Operating Grants 60,429 221,910 — Investment and Interest Income 5,639 44,035 46,292 Gain (Loss) on Disposal of Capital Assets — (856) — Interest Expense — (55,299) — Gifts and Donations — 382,265 — Miscellaneous Revenues — 24,766 18,915 Other Expenses:
Property Tax Credits — — — Grants Disbursed (28,826) — — Federal Settlement — — — Other — — — Total Nonoperating Revenues (Expenses) 37,242 616,821 65,206
Income (Loss) Before Contributions, Transfers and Special Item 65,688 (1,018,419) (344,972)
Capital Contributions — 15,301 — Additions to Endowments — 1,337 — Transfers In 4,056 1,134,557 — Transfers Out (8,010) (92,923) (380)
Income (Loss) Before Special Item 61,733 39,852 (345,352)
Special Item:Transfer Beginning Pension and Other Post
Employment Benefits Balances — — —
Change in Net Position 61,733 39,852 (345,352)
Total Net Position, Beginning of Year 2,054,605 5,359,678 2,023,266 Total Net Position, End of Year $ 2,116,338 $ 5,399,531 $ 1,677,914
The notes to the financial statements are an integral part of this statement
52
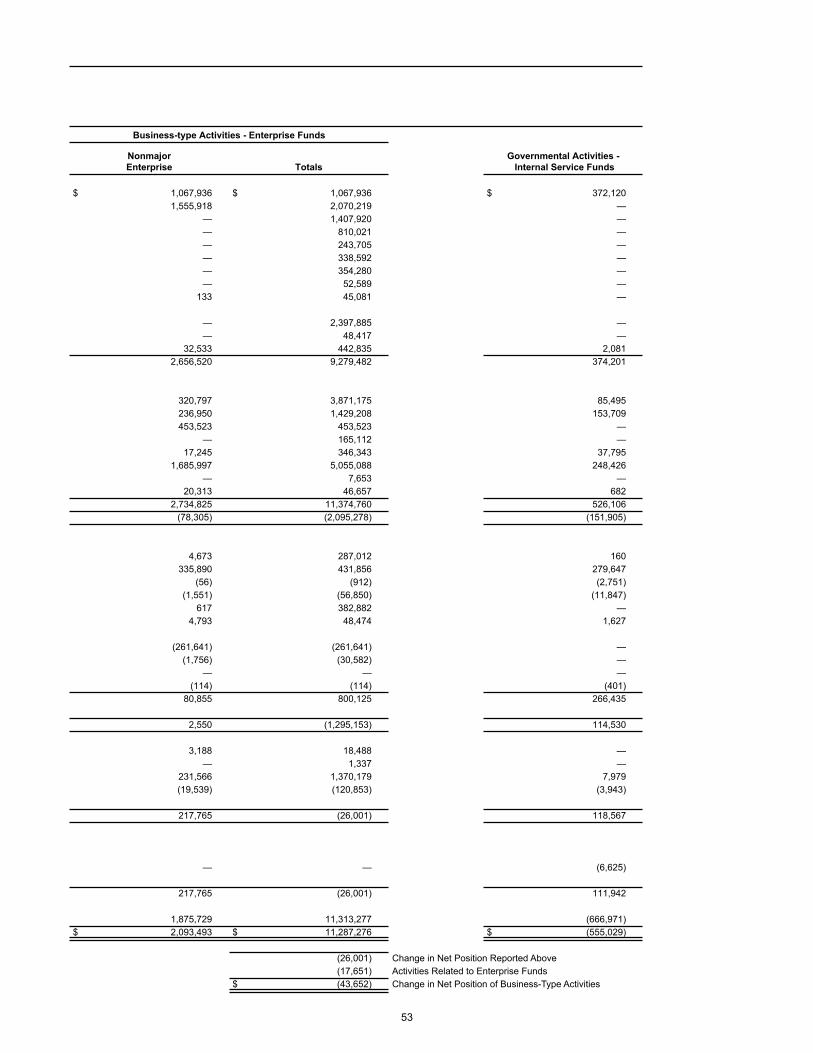
Business-type Activities - Enterprise Funds
NonmajorEnterprise Totals
Governmental Activities - Internal Service Funds
$ 1,067,936 $ 1,067,936 $ 372,120 1,555,918 2,070,219 — — 1,407,920 — — 810,021 — — 243,705 — — 338,592 — — 354,280 — — 52,589 — 133 45,081 —
— 2,397,885 — — 48,417 — 32,533 442,835 2,081 2,656,520 9,279,482 374,201
320,797 3,871,175 85,495 236,950 1,429,208 153,709 453,523 453,523 — — 165,112 — 17,245 346,343 37,795 1,685,997 5,055,088 248,426 — 7,653 — 20,313 46,657 682 2,734,825 11,374,760 526,106 (78,305) (2,095,278) (151,905)
4,673 287,012 160 335,890 431,856 279,647 (56) (912) (2,751) (1,551) (56,850) (11,847) 617 382,882 — 4,793 48,474 1,627
(261,641) (261,641) — (1,756) (30,582) — — — — (114) (114) (401) 80,855 800,125 266,435
2,550 (1,295,153) 114,530
3,188 18,488 — — 1,337 — 231,566 1,370,179 7,979 (19,539) (120,853) (3,943)
217,765 (26,001) 118,567
— — (6,625)
217,765 (26,001) 111,942
1,875,729 11,313,277 (666,971) $ 2,093,493 $ 11,287,276 $ (555,029)
(26,001) Change in Net Position Reported Above (17,651) Activities Related to Enterprise Funds$ (43,652) Change in Net Position of Business-Type Activities
53
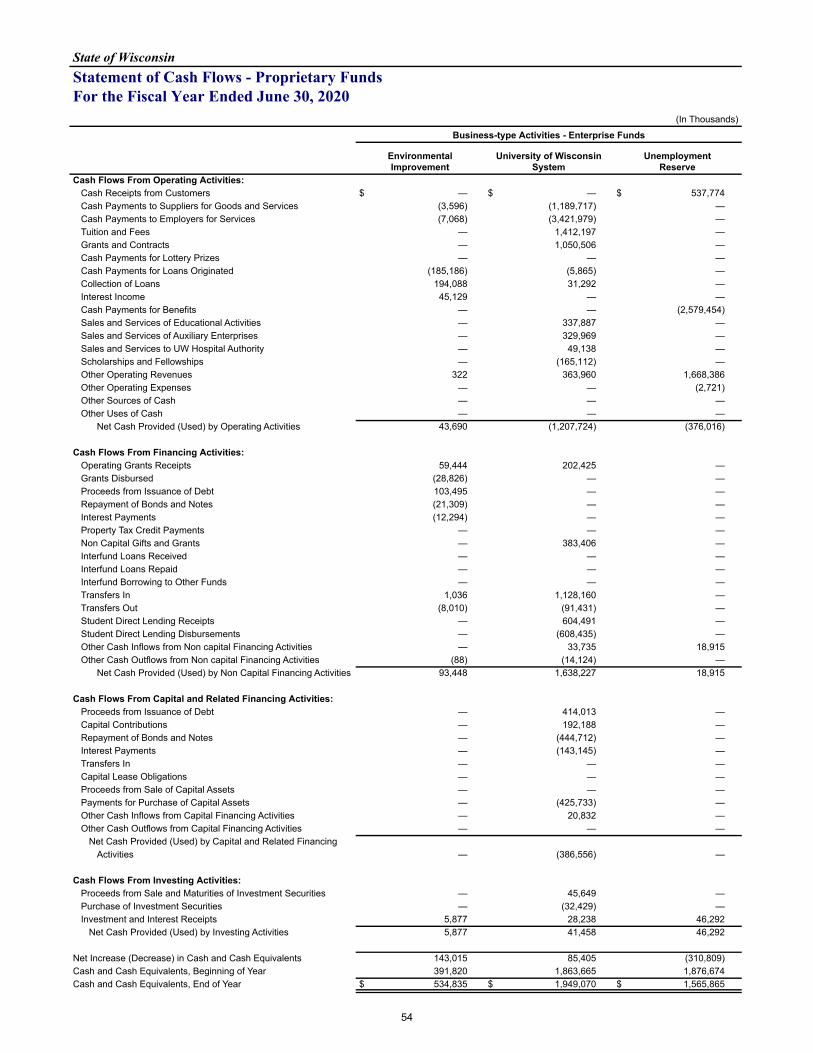
State of WisconsinStatement of Cash Flows - Proprietary FundsFor the Fiscal Year Ended June 30, 2020
(In Thousands)
Business-type Activities - Enterprise Funds
Environmental Improvement
University of Wisconsin System
UnemploymentReserve
Cash Flows From Operating Activities:Cash Receipts from Customers $ — $ — $ 537,774 Cash Payments to Suppliers for Goods and Services (3,596) (1,189,717) — Cash Payments to Employers for Services (7,068) (3,421,979) — Tuition and Fees — 1,412,197 — Grants and Contracts — 1,050,506 — Cash Payments for Lottery Prizes — — — Cash Payments for Loans Originated (185,186) (5,865) — Collection of Loans 194,088 31,292 — Interest Income 45,129 — — Cash Payments for Benefits — — (2,579,454) Sales and Services of Educational Activities — 337,887 — Sales and Services of Auxiliary Enterprises — 329,969 — Sales and Services to UW Hospital Authority — 49,138 — Scholarships and Fellowships — (165,112) — Other Operating Revenues 322 363,960 1,668,386 Other Operating Expenses — — (2,721) Other Sources of Cash — — — Other Uses of Cash — — —
Net Cash Provided (Used) by Operating Activities 43,690 (1,207,724) (376,016)
Cash Flows From Financing Activities:Operating Grants Receipts 59,444 202,425 — Grants Disbursed (28,826) — — Proceeds from Issuance of Debt 103,495 — — Repayment of Bonds and Notes (21,309) — — Interest Payments (12,294) — — Property Tax Credit Payments — — — Non Capital Gifts and Grants — 383,406 — Interfund Loans Received — — — Interfund Loans Repaid — — — Interfund Borrowing to Other Funds — — — Transfers In 1,036 1,128,160 — Transfers Out (8,010) (91,431) — Student Direct Lending Receipts — 604,491 — Student Direct Lending Disbursements — (608,435) — Other Cash Inflows from Non capital Financing Activities — 33,735 18,915 Other Cash Outflows from Non capital Financing Activities (88) (14,124) —
Net Cash Provided (Used) by Non Capital Financing Activities 93,448 1,638,227 18,915
Cash Flows From Capital and Related Financing Activities:Proceeds from Issuance of Debt — 414,013 — Capital Contributions — 192,188 — Repayment of Bonds and Notes — (444,712) — Interest Payments — (143,145) — Transfers In — — — Capital Lease Obligations — — — Proceeds from Sale of Capital Assets — — — Payments for Purchase of Capital Assets — (425,733) — Other Cash Inflows from Capital Financing Activities — 20,832 — Other Cash Outflows from Capital Financing Activities — — —
Net Cash Provided (Used) by Capital and Related FinancingActivities — (386,556) —
Cash Flows From Investing Activities:Proceeds from Sale and Maturities of Investment Securities — 45,649 — Purchase of Investment Securities — (32,429) — Investment and Interest Receipts 5,877 28,238 46,292
Net Cash Provided (Used) by Investing Activities 5,877 41,458 46,292
Net Increase (Decrease) in Cash and Cash Equivalents 143,015 85,405 (310,809) Cash and Cash Equivalents, Beginning of Year 391,820 1,863,665 1,876,674 Cash and Cash Equivalents, End of Year $ 534,835 $ 1,949,070 $ 1,565,865
54
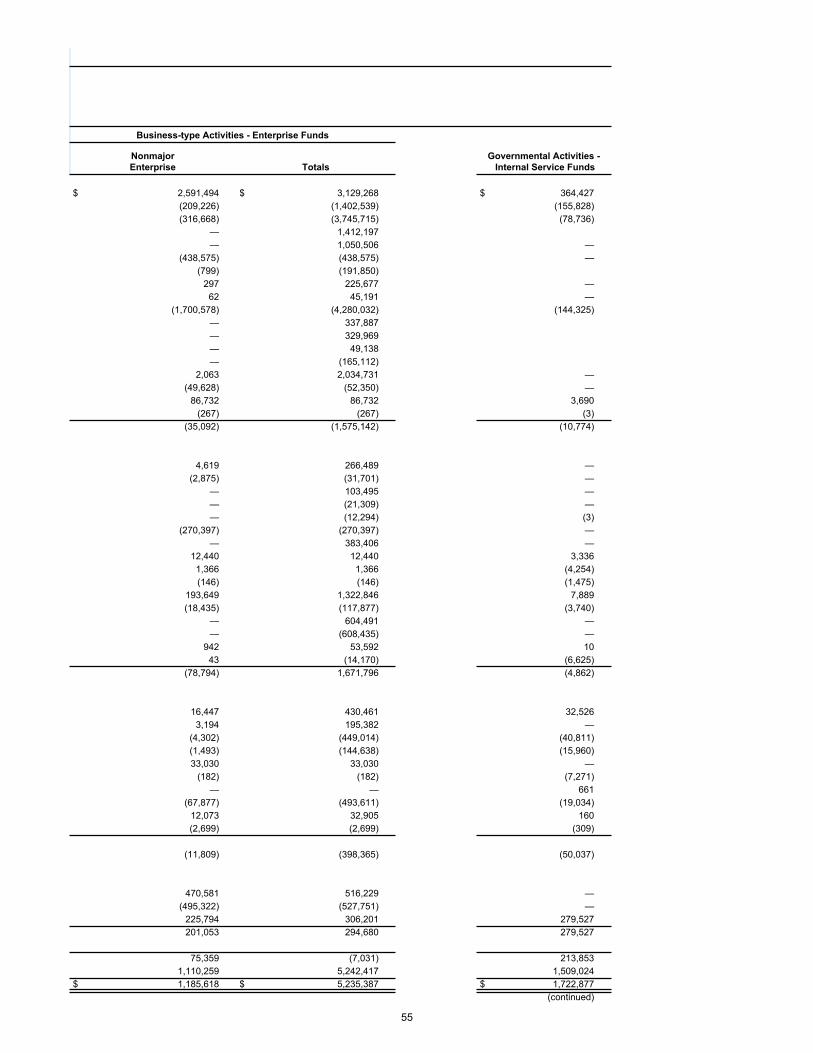
Business-type Activities - Enterprise Funds
NonmajorEnterprise Totals
Governmental Activities - Internal Service Funds
$ 2,591,494 $ 3,129,268 $ 364,427 (209,226) (1,402,539) (155,828) (316,668) (3,745,715) (78,736) — 1,412,197 — 1,050,506 — (438,575) (438,575) — (799) (191,850) 297 225,677 — 62 45,191 — (1,700,578) (4,280,032) (144,325) — 337,887 — 329,969 — 49,138 — (165,112) 2,063 2,034,731 — (49,628) (52,350) — 86,732 86,732 3,690 (267) (267) (3) (35,092) (1,575,142) (10,774)
4,619 266,489 — (2,875) (31,701) — — 103,495 — — (21,309) — — (12,294) (3) (270,397) (270,397) — — 383,406 — 12,440 12,440 3,336 1,366 1,366 (4,254) (146) (146) (1,475) 193,649 1,322,846 7,889 (18,435) (117,877) (3,740) — 604,491 — — (608,435) — 942 53,592 10 43 (14,170) (6,625) (78,794) 1,671,796 (4,862)
16,447 430,461 32,526 3,194 195,382 — (4,302) (449,014) (40,811) (1,493) (144,638) (15,960) 33,030 33,030 — (182) (182) (7,271) — — 661 (67,877) (493,611) (19,034) 12,073 32,905 160 (2,699) (2,699) (309)
(11,809) (398,365) (50,037)
470,581 516,229 — (495,322) (527,751) — 225,794 306,201 279,527 201,053 294,680 279,527
75,359 (7,031) 213,853 1,110,259 5,242,417 1,509,024 $ 1,185,618 $ 5,235,387 $ 1,722,877
(continued)
55
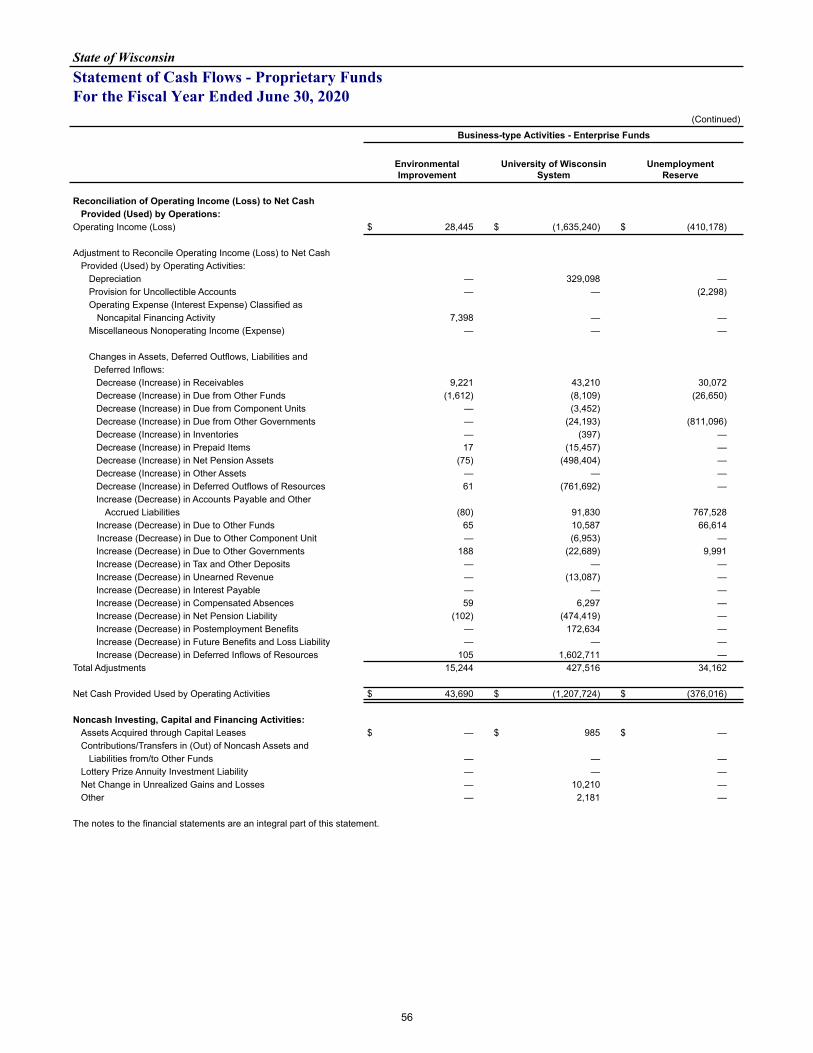
State of WisconsinStatement of Cash Flows - Proprietary FundsFor the Fiscal Year Ended June 30, 2020
(Continued)
Business-type Activities - Enterprise Funds
Environmental Improvement
University of Wisconsin System
UnemploymentReserve
Reconciliation of Operating Income (Loss) to Net Cash Provided (Used) by Operations:
Operating Income (Loss) $ 28,445 $ (1,635,240) $ (410,178)
Adjustment to Reconcile Operating Income (Loss) to Net CashProvided (Used) by Operating Activities:
Depreciation — 329,098 — Provision for Uncollectible Accounts — — (2,298) Operating Expense (Interest Expense) Classified as
Noncapital Financing Activity 7,398 — — Miscellaneous Nonoperating Income (Expense) — — —
Changes in Assets, Deferred Outflows, Liabilities and Deferred Inflows:
Decrease (Increase) in Receivables 9,221 43,210 30,072 Decrease (Increase) in Due from Other Funds (1,612) (8,109) (26,650) Decrease (Increase) in Due from Component Units — (3,452) Decrease (Increase) in Due from Other Governments — (24,193) (811,096) Decrease (Increase) in Inventories — (397) — Decrease (Increase) in Prepaid Items 17 (15,457) — Decrease (Increase) in Net Pension Assets (75) (498,404) — Decrease (Increase) in Other Assets — — — Decrease (Increase) in Deferred Outflows of Resources 61 (761,692) — Increase (Decrease) in Accounts Payable and Other
Accrued Liabilities (80) 91,830 767,528 Increase (Decrease) in Due to Other Funds 65 10,587 66,614
Increase (Decrease) in Due to Other Component Unit — (6,953) — Increase (Decrease) in Due to Other Governments 188 (22,689) 9,991 Increase (Decrease) in Tax and Other Deposits — — — Increase (Decrease) in Unearned Revenue — (13,087) — Increase (Decrease) in Interest Payable — — — Increase (Decrease) in Compensated Absences 59 6,297 — Increase (Decrease) in Net Pension Liability (102) (474,419) — Increase (Decrease) in Postemployment Benefits — 172,634 — Increase (Decrease) in Future Benefits and Loss Liability — — — Increase (Decrease) in Deferred Inflows of Resources 105 1,602,711 — Total Adjustments 15,244 427,516 34,162
Net Cash Provided Used by Operating Activities $ 43,690 $ (1,207,724) $ (376,016)
Noncash Investing, Capital and Financing Activities:Assets Acquired through Capital Leases $ — $ 985 $ — Contributions/Transfers in (Out) of Noncash Assets and
Liabilities from/to Other Funds — — — Lottery Prize Annuity Investment Liability — — — Net Change in Unrealized Gains and Losses — 10,210 — Other — 2,181 —
The notes to the financial statements are an integral part of this statement.
56
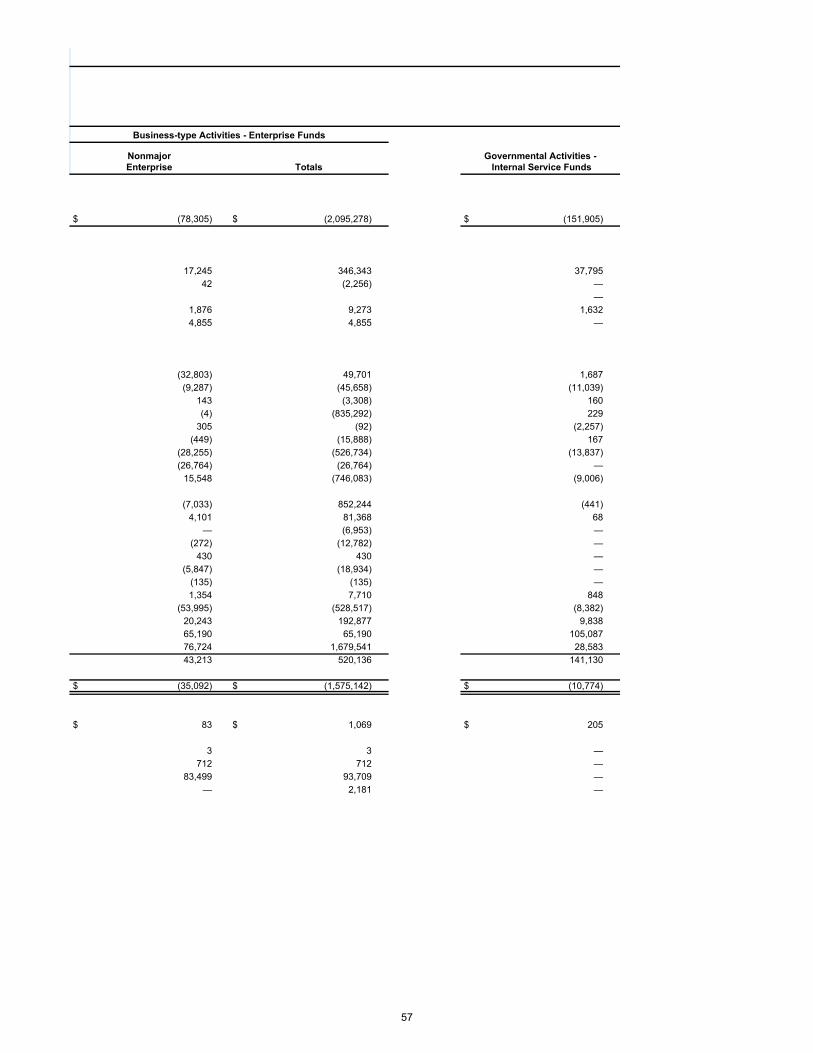
Business-type Activities - Enterprise Funds
NonmajorEnterprise Totals
Governmental Activities - Internal Service Funds
$ (78,305) $ (2,095,278) $ (151,905)
17,245 346,343 37,795 42 (2,256) —
— 1,876 9,273 1,632 4,855 4,855 —
(32,803) 49,701 1,687 (9,287) (45,658) (11,039) 143 (3,308) 160 (4) (835,292) 229 305 (92) (2,257) (449) (15,888) 167 (28,255) (526,734) (13,837) (26,764) (26,764) — 15,548 (746,083) (9,006)
(7,033) 852,244 (441) 4,101 81,368 68 — (6,953) — (272) (12,782) — 430 430 — (5,847) (18,934) — (135) (135) — 1,354 7,710 848 (53,995) (528,517) (8,382) 20,243 192,877 9,838 65,190 65,190 105,087 76,724 1,679,541 28,583 43,213 520,136 141,130
$ (35,092) $ (1,575,142) $ (10,774)
$ 83 $ 1,069 $ 205
3 3 — 712 712 — 83,499 93,709 — — 2,181 —
57
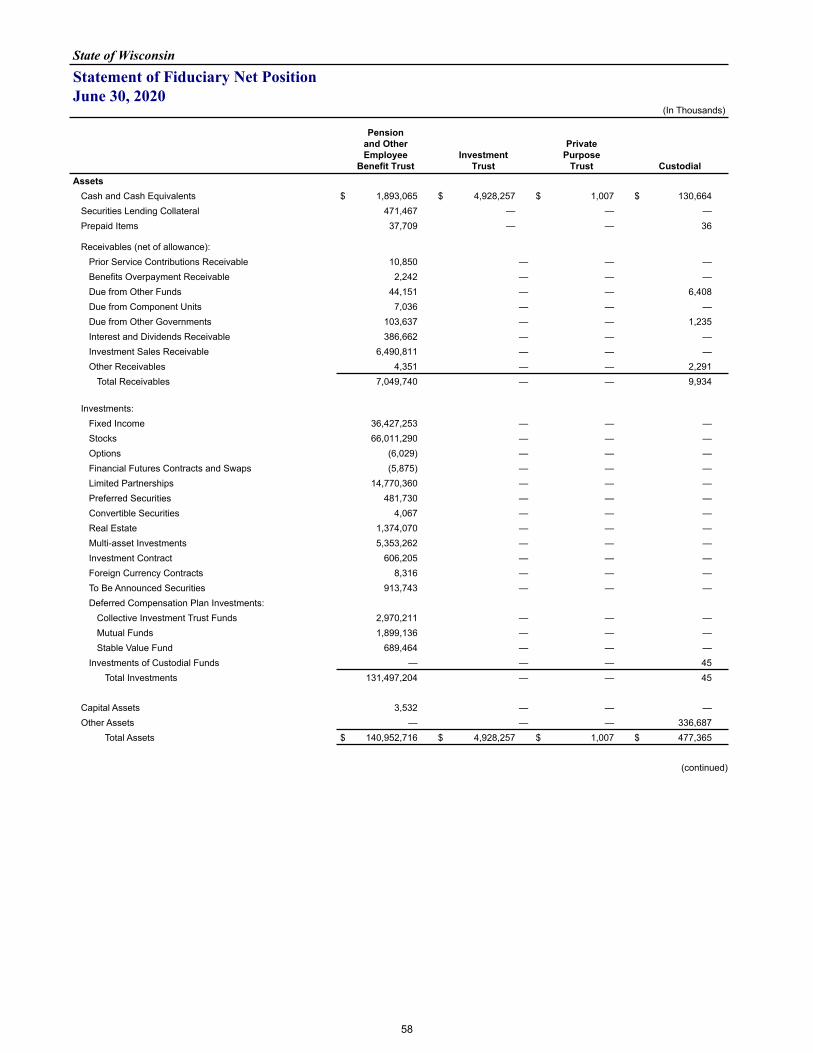
State of Wisconsin
Statement of Fiduciary Net PositionJune 30, 2020
(In Thousands)
Pensionand OtherEmployee
Benefit TrustInvestment
Trust
PrivatePurpose
Trust CustodialAssets
Cash and Cash Equivalents $ 1,893,065 $ 4,928,257 $ 1,007 $ 130,664 Securities Lending Collateral 471,467 — — — Prepaid Items 37,709 — — 36
Receivables (net of allowance):Prior Service Contributions Receivable 10,850 — — — Benefits Overpayment Receivable 2,242 — — — Due from Other Funds 44,151 — — 6,408 Due from Component Units 7,036 — — — Due from Other Governments 103,637 — — 1,235 Interest and Dividends Receivable 386,662 — — — Investment Sales Receivable 6,490,811 — — — Other Receivables 4,351 — — 2,291
Total Receivables 7,049,740 — — 9,934
Investments:Fixed Income 36,427,253 — — — Stocks 66,011,290 — — — Options (6,029) — — — Financial Futures Contracts and Swaps (5,875) — — — Limited Partnerships 14,770,360 — — — Preferred Securities 481,730 — — — Convertible Securities 4,067 — — — Real Estate 1,374,070 — — — Multi-asset Investments 5,353,262 — — — Investment Contract 606,205 — — — Foreign Currency Contracts 8,316 — — — To Be Announced Securities 913,743 — — — Deferred Compensation Plan Investments:
Collective Investment Trust Funds 2,970,211 — — — Mutual Funds 1,899,136 — — — Stable Value Fund 689,464 — — —
Investments of Custodial Funds — — — 45 Total Investments 131,497,204 — — 45
Capital Assets 3,532 — — — Other Assets — — — 336,687
Total Assets $ 140,952,716 $ 4,928,257 $ 1,007 $ 477,365
(continued)
58
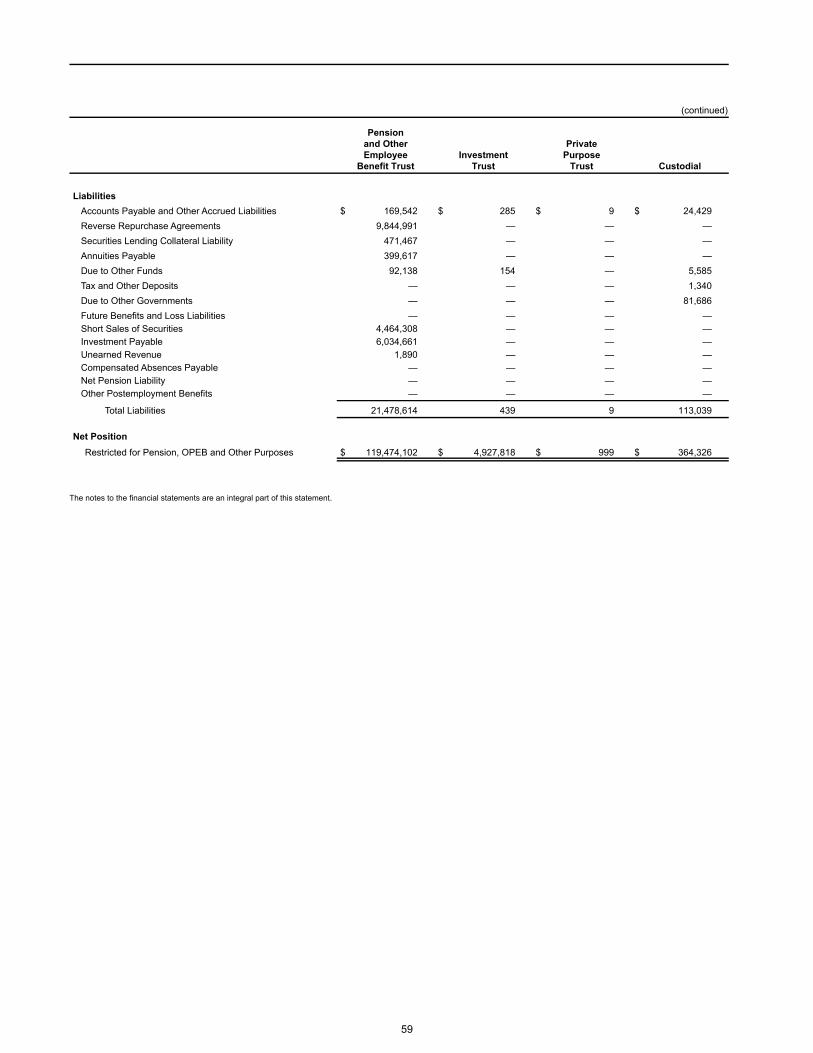
(continued)
Pensionand OtherEmployee
Benefit TrustInvestment
Trust
PrivatePurpose
Trust Custodial
LiabilitiesAccounts Payable and Other Accrued Liabilities $ 169,542 $ 285 $ 9 $ 24,429 Reverse Repurchase Agreements 9,844,991 — — — Securities Lending Collateral Liability 471,467 — — — Annuities Payable 399,617 — — — Due to Other Funds 92,138 154 — 5,585 Tax and Other Deposits — — — 1,340 Due to Other Governments — — — 81,686 Future Benefits and Loss Liabilities — — — — Short Sales of Securities 4,464,308 — — — Investment Payable 6,034,661 — — — Unearned Revenue 1,890 — — — Compensated Absences Payable — — — — Net Pension Liability — — — — Other Postemployment Benefits — — — —
Total Liabilities 21,478,614 439 9 113,039
Net PositionRestricted for Pension, OPEB and Other Purposes $ 119,474,102 $ 4,927,818 $ 999 $ 364,326
The notes to the financial statements are an integral part of this statement.
59
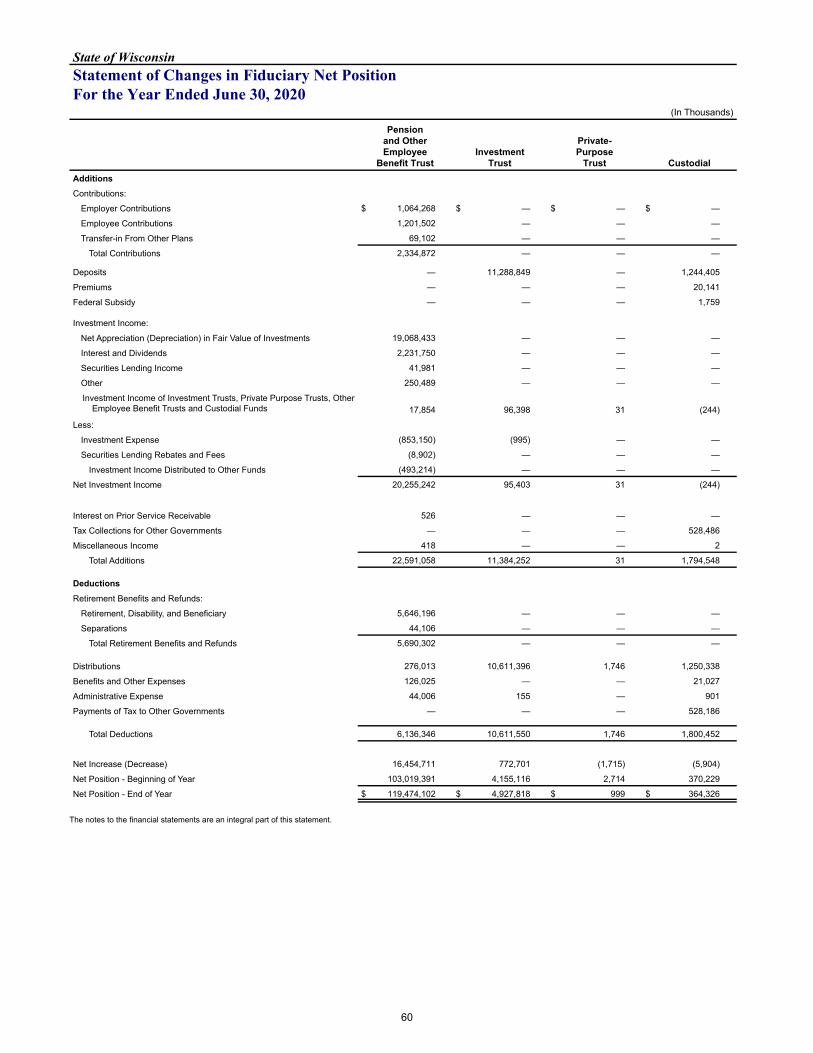
State of WisconsinStatement of Changes in Fiduciary Net PositionFor the Year Ended June 30, 2020
(In Thousands)
Pensionand OtherEmployee
Benefit TrustInvestment
Trust
Private-Purpose
Trust CustodialAdditionsContributions:
Employer Contributions $ 1,064,268 $ — $ — $ —
Employee Contributions 1,201,502 — — —
Transfer-in From Other Plans 69,102 — — —
Total Contributions 2,334,872 — — —
Deposits — 11,288,849 — 1,244,405
Premiums — — — 20,141
Federal Subsidy — — — 1,759
Investment Income:
Net Appreciation (Depreciation) in Fair Value of Investments 19,068,433 — — —
Interest and Dividends 2,231,750 — — —
Securities Lending Income 41,981 — — —
Other 250,489 — — —
Investment Income of Investment Trusts, Private Purpose Trusts, Other Employee Benefit Trusts and Custodial Funds 17,854 96,398 31 (244)
Less:
Investment Expense (853,150) (995) — —
Securities Lending Rebates and Fees (8,902) — — —
Investment Income Distributed to Other Funds (493,214) — — —
Net Investment Income 20,255,242 95,403 31 (244)
Interest on Prior Service Receivable 526 — — —
Tax Collections for Other Governments — — — 528,486
Miscellaneous Income 418 — — 2
Total Additions 22,591,058 11,384,252 31 1,794,548
Deductions
Retirement Benefits and Refunds:
Retirement, Disability, and Beneficiary 5,646,196 — — —
Separations 44,106 — — —
Total Retirement Benefits and Refunds 5,690,302 — — —
Distributions 276,013 10,611,396 1,746 1,250,338
Benefits and Other Expenses 126,025 — — 21,027
Administrative Expense 44,006 155 — 901
Payments of Tax to Other Governments — — — 528,186
Total Deductions 6,136,346 10,611,550 1,746 1,800,452
Net Increase (Decrease) 16,454,711 772,701 (1,715) (5,904)
Net Position - Beginning of Year 103,019,391 4,155,116 2,714 370,229
Net Position - End of Year $ 119,474,102 $ 4,927,818 $ 999 $ 364,326
The notes to the financial statements are an integral part of this statement.
60

61
IndexPage
Summary of Significant Accounting PoliciesNote 1. Summary of Significant Accounting Policies........................................................................................................... 63
Explanation of Certain Differences Between Governmental Fund Statements andGovernment-Wide StatementsNote 2. Detailed Reconciliation of the Government-wide and Fund Statements................................................................ 74
Stewardship and ComplianceNote 3. Budgetary Control................................................................................................................................................... 78Note 4. Deficit Fund Balance/Fund Net Position, Restricted Net Position, Budget Stabilization Arrangement, Minimum
Fund Balance Policy, and Fund Balance of Governmental Funds.......................................................................... 78
Detailed Disclosures Regarding Assets and RevenuesNote 5. Deposits and Investments...................................................................................................................................... 80Note 6. Receivables and Net Revenues............................................................................................................................. 104Note 7. Capital Assets......................................................................................................................................................... 105Note 8. Endowments........................................................................................................................................................... 108Note 9. Interfund Receivables, Payables and Transfers..................................................................................................... 109
Detailed Disclosures Regarding Liabilities and Expenses/ExpendituresNote 10. Changes in Long-term Liabilities............................................................................................................................ 112Note 11. Bonds, Notes and Other Debt Obligations.............................................................................................................. 114Note 12. Lease Commitments and Installment Purchases................................................................................................... 124Note 13. Pollution Remediation Obligations.......................................................................................................................... 126Note 14. Retirement Plan...................................................................................................................................................... 127Note 15. Milwaukee Retirement System............................................................................................................................... 130Note 16. Postemployment Benefits Program........................................................................................................................ 131Note 17. Other Postemployment Benefit (OPEB) Plans....................................................................................................... 134Note 18. Public Entity Risk Pools Administered by the Department of Employee Trust Funds............................................. 145Note 19. Self-Insurance......................................................................................................................................................... 147Note 20. Insurance Funds..................................................................................................................................................... 148
Other Note DisclosuresNote 21. Segment Information and Condensed Financial Data............................................................................................ 151Note 22. Component Units - Condensed Financial Information............................................................................................ 152Note 23. Restatements of Beginning Fund Balances/Net Positions and Other Changes..................................................... 153Note 24. Litigation, Contingencies and Commitments.......................................................................................................... 156Note 25. Tax Abatements...................................................................................................................................................... 158Note 26. Subsequent Events................................................................................................................................................. 161
State of Wisconsin
Notes To The Financial Statements
62
NOTE 1. SUMMARY OF SIGNIFICANT ACCOUNTING POLICIES
A. Basis of Presentation
The accompanying basic financial statements have been prepared in conformity with generally accepted accounting principles (GAAP) for governments as prescribed by the Governmental Accounting Standards Board (GASB).
B. Financial Reporting Entity
For GAAP purposes, the State of Wisconsin includes all funds, elected offices, departments and agencies of the State, as well as boards, commissions, authorities and universities. The State has also considered all potential "component units" for which it is financially accountable, and other affiliated organizations for which the nature and significance of their relationship, including their ongoing financial support, with the State are such that exclusion would cause the State's financial statements to be misleading or incomplete.
The decision to include a potential component unit in the State’s reporting entity is based on the criteria set forth in GASB Statement No. 14, The Financial Reporting Entity, GASB Statement No. 39, Determining Whether Certain Organizations Are Component Units, an amendment of GASB Statement No. 14, and GASB Statement No. 61, The Financial Reporting Entity: Omnibus, an amendment of GASB Statements No. 14 and No. 34. GASB Statement No. 14 criteria include the ability to appoint a voting majority of an organization's governing body and (1) the ability of the State to impose its will on that organization or (2) the potential for the organization to provide specific financial benefits to, or impose specific financial burdens on, the State. GASB Statement No. 39 provisions relate to separately legal, tax-exempt organizations and include: (1) the economic resources received or held are entirely or almost entirely for the direct benefit of the State, (2) the State is entitled to, or has the ability to otherwise access, a majority of the economic resources received or held by the separate organization, and (3) the economic resources received or held by an individual organization that the State is entitled to, or has the ability to otherwise access, are significant to the State. GASB Statement No. 61 modifies certain requirements for inclusion in the financial reporting entity, especially in regard to the fiscal dependency criterion where a financial benefit or burden relationship is now required. It also amends the “blending” criteria for component units and clarifies the reporting of equity interests in legally separate organizations.
Based upon the application of the criteria contained in GASB Statement No. 14, as amended by GASB Statement No. 39, the Wisconsin Public Broadcasting Foundation, Inc. is reported as a blended component unit; and the Wisconsin Housing and Economic Development Authority, the Wisconsin Health Care Liability Insurance Plan, the University of Wisconsin Hospital and Clinics Authority, the Wisconsin Economic Development Corporation and the University of Wisconsin Foundation, are presented as discrete component units, as discussed below.
Complete financial statements of the individual component units that issue separate statements can be obtained from their respective administrative offices:
Wisconsin Public Broadcasting Foundation Inc. Wisconsin Educational Communications Board 3319 West Beltline HighwayMadison, WI 53713http://www.ecb.org
Wisconsin Housing and Economic Development Authority 201 West Washington Avenue, Suite 700Madison, WI 53703http://www.wheda.com
Wisconsin Health Care Liability Insurance Plan Office of the Commissioner of Insurance125 South Webster Street Madison, WI 53703http://oci.wi.gov
University of Wisconsin Hospital and Clinics Authority 301 South Westfield RoadMadison, WI 53717http://www.uwhealth.org
Wisconsin Economic Development Corporation 201 West Washington AvenueMadison, Wisconsin 53703 http://inwisconsin.com
University of Wisconsin Foundation 1848 University AvenueMadison, WI 53726-4090https://www.supportuw.org
State of Wisconsin
Notes To The Financial Statements
63
Blended Component Unit
Blended component units are entities that are legally separate from the State but are so intertwined with the State that they are, in substance, the same as the State. The blended component unit serves or benefits the primary government. They are reported as part of the State and blended into the appropriate funds.
Wisconsin Public Broadcasting Foundation, Inc. – The Wisconsin Public Broadcasting Foundation, Inc. (Foundation), created in 1983 by the Wisconsin Legislature, is a private, non-stock, nonprofit Wisconsin Corporation, wholly owned by the Wisconsin Educational Communications Board (ECB), a unit of the State. The Foundation solicits funds in the name of, and with the approval of, the ECB. The Foundation's funds are managed by a five-member board of trustees consisting of the executive director of the ECB and four members of the ECB board. The Foundation is reported as a special revenue fund.
Discretely Presented Component Units
Discretely presented component units are entities which are legally separate from the State, but are financially accountable to the State, whose relationship with the State is such that exclusion would cause the State's financial statements to be misleading or incomplete. The Wisconsin Housing and Economic Development Authority, the Wisconsin Health Care Liability Insurance Plan, the University of Wisconsin Hospital and Clinics Authority, the Wisconsin Economic Development Corporation and the University of Wisconsin Foundation are reported in a separate column and in separate rows in the government-wide statements to emphasize that they are legally separate.
Wisconsin Housing and Economic Development Authority – The Wisconsin Housing and Economic Development Authority (Authority) was established by the Wisconsin Legislature in 1972 to help meet the housing needs of Wisconsin's low and moderate income citizens. The State has significantly expanded the scope of services of the Authority by adding programs that include financing for farmers and for economic development projects. While the Authority receives no State tax dollars for its bond- supported programs and the State is not liable on bonds the Authority issues, the State has the ability to impose its will on the Authority through legislation. The State appoints the Authority's Board. The Authority reports on a June 30 fiscal year-end.
Wisconsin Health Care Liability Insurance Plan – The Wisconsin Health Care Liability Insurance Plan (Plan) was established by rule of the Commissioner of Insurance of the State of Wisconsin to provide health care liability insurance and liability coverage normally incidental to health care liability insurance to eligible health care providers in the State. Eight out of 13 members of the Board of Directors are appointed by the Governor, and the State
has the ability to impose its will upon the Plan. The Plan reports on a fiscal year ended December 31.
University of Wisconsin Hospital and Clinics Authority – The University of Wisconsin Hospital and Clinics Authority (Hospital) is a not-for-profit academic medical center. The Hospital operates an acute-care hospital with 566 beds, numerous specialty clinics, and six intensive care units with a total of 83 beds, and it provides comprehensive health care to patients, education programs, research and community service. Prior to June 1996, the Hospital was a unit of the University of Wisconsin-Madison. In June 1996, in accordance with legislation enacted by the State Legislature, the Hospital was restructured as a Public Authority, a public body corporate and politic created by State statutes. The State appoints a majority of the Hospital’s Board of Directors and a financial benefit/burden relationship exists between the Hospital and the State. The Hospital reports on a June 30 fiscal year-end.
The legislation that created the Hospital Authority also provided, among other things, for the Board of Regents of the University of Wisconsin System to execute various agreements with the Hospital. These agreements include an Affiliation Agreement, a Lease Agreement, a Conveyance Agreement and a Contractual Services Agreement and Operating and Service Agreement.
The Affiliation Agreement requires the Hospital to continue to support the educational, research and clinical activities of the University of Wisconsin-Madison, which are administered by the Hospital. Under the terms of a Lease Agreement, the Hospital leases facilities which were occupied by the Hospital as of June 29, 1996. Under a Conveyance Agreement, certain assets and liabilities related to the Hospital were identified and transferred to the Hospital effective July 1, 1996. Subject to the Contractual Services Agreement and Operating and Service Agreement between the Board of Regents and the Hospital, the two parties have entered into contracts for the continuation of services in support of programs and operations.
Wisconsin Economic Development Corporation-The Wisconsin Economic Development Corporation (WEDC) is a legally separate body corporate and politic. The WEDC’s primary purpose is economic development activities in the State. The State appoints a majority of the WEDC’s Board, has the ability to impose its will on the WEDC, and a financial benefit/burden relationship exists. The WEDC reports on a fiscal year ended June 30.
University of Wisconsin Foundation – The University of Wisconsin Foundation (the Foundation) is a legally separate, tax-exempt component unit of the State. The Foundation acts primarily as a fund-raising organization to supplement the resources that are available mostly to the University of Wisconsin-Madison (UW- Madison) as well as several other units of the University of Wisconsin System in support of its programs. These include scientific, literary, athletic and educational program purposes. The University of Wisconsin System is reported as an enterprise fund
State of Wisconsin Notes to the Financial Statements
For the Fiscal Year Ended June 30, 2020
64
of the State. Although the State does not control the timing or amount of receipts from the Foundation, the majority of resources, or income thereon, that the Foundation holds and invests, are restricted to the activities of the UW-Madison by the donors. Because these restricted resources held by the Foundation can only be used by, or for the benefit of, the UW-Madison and several other units of the University of Wisconsin System, the Foundation is considered a component unit of the State. The Foundation reports on a fiscal year ended June 30.
Related Organizations
These related organizations are excluded from the reporting entity because the State's accountability does not extend beyond appointing a voting majority of the organization's board members. Financial statements are available from the respective organizations.
Wisconsin Health and Educational Facilities Authority – a public body politic and corporate that provides financing for capital expenditures and refinancing of indebtedness for Wisconsin health care and educational institutions.
Fox River Navigational System Authority – created under Chapter 237 as a public body corporate and politic to oversee the Fox River navigational system after the federal government (the U.S. Army Corps of Engineers) transferred the system to the State.
C. Government-wide and Fund Financial Statements
The government-wide financial statements consist of the statement of net position and the statement of activities.
These statements report information on all activities, except for fiduciary activities, of the primary government and its component units. The statement of net position and the statement of activities distinguish between the governmental and business-type activities of the State. Governmental activities are generally financed through taxes, intergovernmental revenues and other nonexchange revenues. Business-type activities are generally financed in whole or in part by fees charged to external parties for goods and services. The focus of the government-wide statements is the primary government. A separate column on the statement of net position and the statement of activities reports activities for all discretely presented component units.
The fund financial statements provide detailed information on all governmental, proprietary and fiduciary funds. Separate columns are presented for all major governmental and enterprise funds. Nonmajor governmental and enterprise funds are aggregated and presented as a single column on the respective governmental or proprietary statements. Internal service funds are exempt from the major fund reporting requirements and are aggregated and
ultimately reported as a single column on the proprietary statements. Fiduciary funds are also exempt from major fund reporting and are aggregated by fund type and ultimately reported as single columns on the fiduciary statements.
D. Measurement Focus, Basis of Accounting, and Financial Statement Presentation
The government-wide statement of net position and statement of activities, as well as the proprietary and fiduciary fund statements, are reported using the economic resources measurement focus and the accrual basis of accounting. With this measurement focus, all assets, deferred outflows of resources, liabilities, and deferred inflows of resources associated with the operation of these funds are included on the statement of net position. Under the accrual basis, revenues are recorded when earned and expenses are recorded when the related liability is incurred.
In the University of Wisconsin System's enterprise fund, revenues and expenses of an academic term that spans two fiscal years are recognized in two years based on a proration of summer session days.
In reporting the financial activity of its enterprise funds and business-type activities, the State applies all applicable GASB pronouncements.
Most of the funds included in the State’s Comprehensive Annual Financial Report are presented on a fiscal year ended June 30. However, because funds of the Department of Employee Trust Funds (DETF) are administered on a calendar year basis, they are presented on a fiscal year ended December 31. This may result in GASB standards being implemented in different fiscal years for the DETF GAAP funds. Funds reported as of December 31 include: Wisconsin Retirement System, Accumulated Sick Leave Conversion Credit, Supplemental Health Insurance Conversion Credit, Wisconsin Deferred Compensation, Duty Disability, Reimbursed Employee Expense, Local Retiree Life Insurance, Retiree Life Insurance, Milwaukee Retirement System, Retiree Health Insurance, Local Retiree Health Insurance, Income Continuation Insurance, and Health Insurance.
As a result of the differences in timing, transactions between funds with different fiscal year ends may result in inconsistencies in amounts reported as due to/due from other funds or as interfund transfers. Similar differences may occur in amounts reported as due to/from component units.
The University of Wisconsin Foundation and Wisconsin Health Care Liability Insurance Plan are reported as component units. The Foundation financial statements are prepared using accounting standards promulgated by the Financial Accounting Standards Board as they apply to not-for-profit corporations. The Plan financial statements are prepared using prescribed statutory accounting practices included in the National Association of
State of Wisconsin Notes to the Financial Statements
For the Fiscal Year Ended June 30, 2020
65
Insurance Commissioner’s Accounting Practices and Procedures Manual. Statutory accounting practices vary somewhat from United States GAAP but are expected to be immaterial.
Governmental fund financial statements are accounted for using the current financial resources measurement focus. With this measurement focus, only current assets and current liabilities generally are included on the balance sheet. Operating statements of these funds present increases (i.e., revenues and other financing sources) and decreases (i.e., expenditures and other financing uses) in net available financial resources.
Governmental funds are reported on the modified accrual basis of accounting. This basis of accounting recognizes revenues generally when they become measurable and available to pay current reporting period liabilities. For this purpose, the State considers tax revenues to be available if they are collected within 60 days of the end of the current fiscal year end. Other revenues are considered to be available if received within one year after the fiscal year end except for tobacco settlement revenues for which just one-half of revenues expected to be received within one year are recognized. Material revenue sources susceptible to accrual include individual and corporate income taxes, sales taxes, public utility taxes, motor fuel taxes and federal revenues.
Expenditures and related liabilities are recognized when obligations are incurred as a result of the receipt of goods and services. However, expenditures related to debt service, compensated absences, and claims and judgments, are recorded only when payment is due.
The State reports the following major funds:
Major Governmental Funds
• General Fund – the primary operating fund of the State, accounts for all financial transactions except those required to be accounted for in another fund.
• Transportation Fund – a special revenue fund, accounts for the proceeds from motor fuel taxes, vehicle registrations, licensing fees, and federal and local governments which are used to supply and support safe, efficient and effective transportation in Wisconsin.
Major Enterprise Funds
• Environmental Improvement Fund – accounts for financial resources generated and used for clean water projects. Federal capitalization grants, interest earnings, revenue bond proceeds, and general obligation bond proceeds are its primary funding sources.
• University of Wisconsin System Fund – accounts for the 13 four-year universities, 13 additional campuses affiliated with seven of the four-year institutions, and System Administration.
• Unemployment Reserve Fund – accounts for unemployment contributions made by employers, federal program receipts, benefit payment recoveries and unemployment benefits paid to laid off workers in the State.
In addition, the State reports the following fund types:
Governmental Funds
• Special Revenue Funds – account for and report the proceeds of specific revenue sources that are restricted or committed to expenditure for specified purposes other than debt service or capital projects. Examples include the Conservation Fund and the Petroleum Inspection Fund.
• Debt Service Funds – account for and report financial resources that are restricted, committed, or assigned to expenditure for principal and interest. Financial resources that are being accumulated for future principal and interest are also reported in debt service funds.
• Capital Projects Funds – account for and report financial resources that are restricted, committed or assigned to expenditure for capital outlays, including the acquisition or construction of capital facilities and other capital assets (other than those financed by proprietary funds or that will be held in trust for individuals, private organizations, or other governments).
• Permanent Funds – account for and report resources that are restricted to the extent that only earnings, and not principal, may be used for purposes that support the State’s programs – that is, for the benefit of the State or its citizenry.
State of Wisconsin Notes to the Financial Statements
For the Fiscal Year Ended June 30, 2020
66
Proprietary Funds
• Enterprise Funds – account for the activities for which fees are charged to external users for goods or services. Examples include the Lottery Fund and the Veterans Trust Fund.
• Internal Service Funds – account for the operations of State agencies which provide goods or services to other State units or other governments on a cost-reimbursement basis. These services include technology, fleet management, financial, facilities management, risk management, human resource services and accumulated sick leave. Additional goods and services are provided by the inmate work experience program, Badger State Industries.
Fiduciary Funds
• Pension and Other Employee Benefit Trust Funds – used to account for resources that are required to be held in trust for members and beneficiaries for public employee retirement or other benefit plans e.g. Wisconsin Retirement System.
• Investment Trust Funds – account for assets invested on a commingled basis by the State on behalf of other governmental entities e.g. local government pooled investments.
• Private-purpose Trust Funds – account for all other trust arrangements which benefit individuals, private organizations, or other governments e.g. the state-sponsored college savings program.
• Custodial Funds – account for those assets for which the State acts solely in a custodial capacity e.g. the collection and disbursement of court-ordered child support payments.
Amounts reported as program revenues on the government-wide statement of activities include (a) charges for services – amounts received from customers or applicants who purchase, use or directly benefit from the goods, services or privileges provided by the State; including interest earnings from various loan funds/ component units, (b) program-specific operating grants, contributions, and restricted interest, and (c) program-specific capital grants, contributions, and restricted interest. General revenues consist of taxes and all other revenues that do not meet the definition of program revenues. Special items, if any, are significant transactions or events within the control of management that are either unusual in nature or infrequent in occurrence.
As a general rule, the effect of interfund activity has been eliminated from the government-wide financial statements. This includes all internal service fund activity, as well as other internal allocations. Exceptions to this general rule are certain charges between various functions of the government, whose elimination would distort the direct costs and program revenues reported for the various functions concerned.
The revenues and expenses shown on the proprietary fund statements are identified as either operating or nonoperating.
Operating revenues and expenses generally result from providing goods and services in connection with a proprietary fund’s primary mission. The State’s enterprise funds are involved in many diverse fields including patient care, insurance programs, loan programs, the University of Wisconsin System, employee benefit plans, and the lottery. The internal service funds provide services and goods to other State agencies and departments.
A significant portion of operating revenues for the proprietary funds is recorded under charges for goods and services. In the case of the State’s loan program enterprise funds, investment and interest income is an important component of operating revenue. Operating revenues of the University of Wisconsin include tuition and fees, certain grants and contracts resulting from exchange transactions, and sales and services of educational activities and auxiliary enterprises. In regards to the employee benefit plans, the primary operating revenue source is participant and employer contributions. Operating expenses for the proprietary funds include the costs of sales and services, benefit expenses, administration expenses and depreciation on capital assets. All revenues and expenses not related to a fund’s primary purpose are reported as nonoperating.
When both restricted and unrestricted resources are available for use, it is the State’s policy to use restricted resources first, then unrestricted resources as they are needed.
GASB Standards Implemented During the Fiscal Year
Effective for Fiscal Year 2020, the State implemented Governmental Accounting Standards Board (GASB) Statement No. 84, Fiduciary Activities. This statement improves guidance regarding the identification of fiduciary activities for accounting and financial reporting purposes and how those activities should be reported.
The State also implemented GASB Statement No. 95, Postponement of the Effective Dates of Certain Authoritative Guidance. This statement provided temporary relief in light of the COVID-19 pandemic by postponing the effective dates of certain provisions in Statements and Implementation Guides that first became effective or were scheduled to become effective for periods beginning after June 15, 2018 and later. Earlier application is still permitted under this standard.
State of Wisconsin Notes to the Financial Statements
For the Fiscal Year Ended June 30, 2020
67
E. Assets, Deferred Outflows of Resources, Liabilities, Deferred Inflows of Resources, and Net Position/Fund Balances
1. Cash and Cash Equivalents
Cash balances of most funds are deposited with the Department of Administration (DOA) where the available balances beyond immediate needs are pooled in the State Investment Fund for short-term investment purposes. Balances pooled are restricted to legally stipulated investments valued consistent with GASB Statement No. 72, Fair Value Measurement and Application. Cash balances not controlled by DOA may be invested where permitted by statute.
Cash and cash equivalents, reported on the balance sheet and statement of cash flows, include bank accounts, petty cash, cash in transit, short-term investments with an original maturity of three months or less such as certificates of deposit, money market certificates, repurchase agreements and individual funds' shares in the State Investment Fund.
GASB Statement No. 40, Deposit and Investment Risk Disclosures, requires disclosure of risks associated with deposit and investment balances and the policies applied to mitigate such risks. Specific disclosures are included in Note 5, Deposits and Investments.
2. Investments
The State may invest in direct obligations of the United States and Canada, securities guaranteed by the United States, certificates of deposit issued by banks in the United States and solvent financial institutions in the State, commercial paper and nonsecured corporate notes and bonds, bankers acceptances, participation agreements, privately placed bonds and mortgages, common and preferred stock and other securities approved by applicable sections of the Wisconsin Statutes, bond resolutions, and various trust indentures (see Note 5 to the financial statements).
Investments of the primary government are reported at fair value consistent with the provisions of GASB Statement No. 72, Fair Value Measurement and Application. Typically, fair value information is determined using quoted market prices. However, when quoted market prices are not available for certain securities, fair values are estimated through techniques such as discounted future cash flows, matrix pricing and multi-tiers.
In some instances, securities are reported at cost. Certain non- public or closely held stocks are carried at cost since no independent quotation is available to price these securities. Further, certain investment agreements are reported on a cost basis because the State cannot readily determine whether these agreements meet the definition of interest-earning investment
contracts as defined by GASB Statement No. 31. However, the impact on the financial statements is immaterial.
Under Wisconsin Statutes, the investment earnings of certain Permanent Funds are assigned to other funds. The following table shows the funds earning the investment income and the ultimate recipients of that income:
Fund GeneratingInvestment Income
Fund ReceivingInvestment Income
Agricultural College University of Wisconsin System
Normal School General Fund and University of Wisconsin System
University University of Wisconsin System
3. Mortgage and Other Loans
Mortgage loans of the Veterans Mortgage Loan Repayment Fund and the Veterans Trust Fund programs, business-type activities, are stated at the outstanding loan balance less an allowance for doubtful accounts.
4. Forestation State Tax
2017 Wis. Act 59 (the Budget Act) ended the forestry mill tax, the only property tax that had been levied by the State. The proceeds of the tax had been paid to the Conservation Fund. The tax ended effective with the January 1, 2017 property tax assessments (property taxes levied in 2017 for payment in 2018).
5. Interfund Assets/Liabilities
During the course of operations, numerous transactions occur between individual funds for goods provided or services rendered. The balance sheet or statement of net position for proprietary and fiduciary funds classifies these receivables and payables as "Due from Other Funds" or "Due to Other Funds." Short-term interfund loans are classified as "Interfund Receivables" or "Interfund Payables." Long-term interfund loans are classified as "Advances to Other Funds" and "Advances from Other Funds".
Balances that exist between the primary government and component units are classified as “Due to/from Primary Government” and, correspondingly, “Due to/from Component Units”.
Amounts reported in the funds as interfund assets/liabilities are eliminated in the governmental and business-type columns of the Statement of Net Position, except for the net residual amount due between governmental and business-type activities which is shown as internal balances.
State of Wisconsin Notes to the Financial Statements
For the Fiscal Year Ended June 30, 2020
68
6. Inventories and Prepaid Items
Inventories of governmental and proprietary funds are valued at cost, which approximates market, using the first-in/first-out, last in/first out, or weighted-average method. The costs of governmental fund-type inventories are recorded as expenditures when purchased rather than when consumed.
Inventories of the University of Wisconsin System held by central stores are valued at average cost, fuels are valued at market, and other inventories held by individual institutional cost centers are valued using a variety of cost flow assumptions that, for each type of inventory, are consistently applied from year to year.
Prepaid items reflect payments for costs applicable to future accounting periods.
The fund balances of governmental funds are reported as nonspendable for inventories and prepaid items, except in cases where prepaid items are offset by unearned revenues, to indicate that these accounts do not represent expendable available financial resources.
7. Capital Assets
Capital assets, which include property, plant, equipment, intangibles, land, library holdings, and infrastructure assets (roads, bridges, and buildings considered an ancillary part of roads), are reported in the applicable governmental or business-type activities columns in the government-wide financial statements. Assets of the primary government, other than infrastructure and land purchased for the construction of infrastructure assets, are capitalized when they have a unit cost of $5,000 or more (except for a collection of library resources that must have a cumulative value equal to or greater than $5.0 million and software purchased by the University of Wisconsin System) and a useful life of more than one year. In addition, internally generated intangible assets are capitalized only if costs are equal to or are greater than $1.0 million.
Purchased or constructed capital assets are valued at cost or estimated historical cost if actual historical cost is not practicably determinable. Donated capital assets are recorded at their acquisition value at the time received.
The State has elected to report infrastructure assets (roads, bridges and buildings considered an ancillary part of roads) using the modified approach. Under this method infrastructure assets are not required to be depreciated if the State manages its eligible infrastructure assets using an asset management system designed to maintain and preserve its infrastructure assets at a condition level established and disclosed by the State. All infrastructure assets constructed prior to July 1, 2000 have been recorded at estimated historical cost which was determined by calculating the current cost of a similar asset and deflating that
cost using Federal Highway Administration’s composite index for federal aid highway construction to the estimated average construction date. All infrastructure assets constructed after July 1, 2000 have been recorded at historical cost. The costs of maintenance and preservation that do not add to the asset’s capacity or efficiency are not capitalized. Interest incurred during construction is not capitalized.
Exhaustible capital assets of the primary government generally are depreciated on the straight-line method over the asset’s useful life. Select buildings of the University of Wisconsin System are depreciated using the componentized method over the estimated useful life of the related assets. Depreciation expense is recorded in the government-wide financial statements, as well as in the proprietary fund statements. There is no depreciation recorded for land, construction in process, and infrastructure. In addition, depreciation is not recorded for certain other capital assets including the State Capitol, Executive Residence and associated furnishings, and the Historical Society library collection. Generally, estimated useful lives are as follows:
Buildings and improvements 6 - 40 years
Equipment, machinery and furnishings 3 - 15 years
Library Holdings 15 years
Collections of works of art, historical treasures, and similar assets, which are on public display, used in furtherance of historical education, or involved in advancement of artistic or historical research, are not capitalized unless these collections were already capitalized at June 30, 1999. Collections range from memorabilia on display in the Wisconsin Veterans Museum, the Wisconsin Historical Society Museum and other museums to buildings such as the Villa Louis Mansion and the Fur Trade Museum located at the Villa Louis historical site. In addition, works of art or historical treasures on display in the various State office buildings, as well as statues on display outside the State Capitol, also are not capitalized.
8. Restricted and Limited Use Assets
Assets that are required to be held and/or used as specified in Wisconsin statutes, bond indentures, bond resolutions, trustee agreements, board resolutions, and donor specifications have been reported as Restricted and Limited Use Assets.
State of Wisconsin Notes to the Financial Statements
For the Fiscal Year Ended June 30, 2020
69
9. Local Assistance Aids
Municipal and County Shared Revenue Program
Through the Municipal and County Shared Revenue Program, the State distributes general revenues collected from general State tax sources to municipal and county governments to be used for providing local government services. State statutes require that payment to local governments be made during July and November.
The State was liable to various local governments for unpaid shared revenue aid. To measure the amount of the program allocable to the State's fiscal year, the amount is prorated over portions of recipient local governments’ calendar fiscal years that are within the State's fiscal year. The result is that a liability of $445.1 million representing one-half of the total appropriated amount is reported at June 30, 2020 as Due to Other Governments.
State Property Tax Credit Program
The State was liable to various taxing jurisdictions for the school levy, the first dollar, and the lottery property tax credits paid through the State Property Tax Credit Program.
The school levy tax credit provides property tax relief in the form of State credits on individual property tax bills.
The first dollar tax credit was first established for property taxes levied in 2008, and payable in 2009. This credit is allowed on every taxable real estate parcel containing an improvement in the state.
Under the lottery property tax credit, owners of property used as a primary residence receive a tax credit equal to the school property tax on a portion of the dwelling’s value.
State statutes require that payment to local taxing jurisdictions for the school levy and first dollar tax credits be made during July. Although the state property tax credit is calculated on the property tax levy for school purposes, the State's July payment is paid to an administering municipality who treats the payment the same as other tax collections and distributes the collections to the various tax levying jurisdictions (e.g., cities, towns, and school districts).
The portion of the liability payable to school districts for the school levy and first dollar tax credits represents the amount of the July payment earned over the school districts' previous fiscal year ended June 30. Since the entire school districts' portion of the July payment occurs within the State's fiscal year, 100 percent of the July payment relating to the school taxing jurisdictions' levy is reported as a liability at June 30, 2020.
The portion of the liability payable to general government for the school levy and first dollar tax credits represents the amount of the July payment prorated over the portion of the local governments' calendar year which is within the State's fiscal year. The result is that 50 percent of the July payment based on the general government taxing jurisdictions' levy is reported as a liability at June 30, 2020.
The aggregated State Property Tax Credit Program liability of $811.0 million is reported in the General Fund as Due to Other Governments. Of that amount, $699.8 million relates to the school levy tax credit and $111.2 million relates to the first dollar tax credit.
The lottery property tax credit is accounted for in the Lottery Fund, an enterprise fund that records revenues and expenses on the accrual basis. The State pays municipal treasurers for lottery credits who distribute the moneys to the various taxing jurisdictions. For credits reducing the calendar year 2020 property tax bills, the State made this payment in March 2020. A portion of the State’s March payment distributed to the general government taxing jurisdictions applies to their fiscal year that ends on December 31. Therefore, part of the March distribution represents an expense of the State in Fiscal Year 2020, while the remaining portion represents advanced payments. The resulting deferred outflow of resources reported within the Lottery Fund totals $69.1 million at June 30, 2020.
State Aid for Exempt Computers
The Aid for Exempt Computers compensates local governments for tax base lost due to the property tax exemption for computers, software and related equipment. Aid payments are calculated using a procedure that results in an aid amount equal to the amount of taxes that would be paid if the property were taxable. Payments to local governments are made on the fourth Monday in July.
At June 30, 2020, the State was liable to various local governments and other taxing jurisdictions for unpaid exempt computer aid payments of $67.3 million.
State Aid for Exempt Personal Property
2017 Wis. Act 59 (the Budget Act) exempted machinery, tools, and patterns, not including such items considered manufacturing property under current law, from the property tax effective with property assessed as of January 1, 2018 (the 2018(19) property tax levy). The Act also created a state aid program administered by DOR to make payments to each local taxing jurisdiction, including tax increment districts, that imposed property taxes on those items that were not manufacturing property in 2017(18).
State of Wisconsin Notes to the Financial Statements
For the Fiscal Year Ended June 30, 2020
70
Upon certification by DOR, payments will be made to local taxing jurisdictions on or before the first Monday in May. Under the Act, aid payments totaling $74.7 million was made in May 2020.
10. Long-term Debt Obligations
In the government-wide financial statements, and proprietary fund types in the fund financial statements, long-term debt is reported as a liability net of the applicable bond premium or discount. Bond premiums and discounts are deferred and amortized using the effective interest rate method on a prospective basis beginning in Fiscal Year 2004, except for the annual appropriation bonds that are amortized ratably over the life of the obligations to which they relate.
In the fund financial statements, governmental fund types recognize flows for bond premiums and discounts, as well as issuance costs, during the current period. The face amount of the debt issued is reported as other financing sources. Premiums and discounts are reported as other financing sources and other financing uses, respectively. Issuance costs are reported as other debt service expenditures for governmental fund types, and non- operating expenses for proprietary fund types.
On the government-wide financial statements, bond premiums and discounts related to the Transportation Revenue Bonds, which finance programs in a capital projects fund, are amortized ratably over the life of the obligations to which they relate. Results from the use of this method do not vary materially from those that would be obtained by use of the effective interest rate method.
11. Compensated Absences
Consistent with the compensated absences reporting standards of GASB Statement No. 16, Accounting for Compensated Absences, an accrual for certain salary-related payments associated with annual leave and an accrual for a certain portion of sick leave is included in the compensated absences liability at year end.
Annual Leave
Full-time employees' annual leave days are credited on January 1 of each calendar year in general at a minimum of 15 or 13 days per year, depending on Fair Labor Standards Act (FLSA) status. There is no requirement to use annual leave. However, unused leave is lost unless approval to carry over the unused portion is obtained from the employing agency. In general, each full-time employee is eligible for four and one-half personal holidays each calendar year, provided the employee is in pay status for at least one day in the year. If a holiday occurs on a Saturday, employees receive leave time proportional to their working status to use at their discretion.
The State's compensated absence liability at June 30 consists of accumulated unpaid annual leave, personal holiday hours, and
Saturday/legal hours earned and vested during January through June. The liability is reported in the government-wide, proprietary fund types and fiduciary funds.
Sick Leave
Full-time employees earn sick leave at a rate of five hours per pay period. Unused sick leave is accumulated from year to year without limit until termination or retirement. Accumulated sick leave is not paid. However, at employee retirement the accumulated sick leave may be converted to pay for the retiree's health insurance premiums. The State accumulates resources to pay for the expected health insurance premiums of retired employees. The portion of the health insurance obligation funded through the sick leave conversion and accumulated resources are presented as two funds. The basic component of sick leave is presented as an internal service fund and the supplementary component of sick leave is presented as a pension and other employee benefit trust fund.
12. Unearned Revenue
In both the government-wide and fund financial statements unearned revenue represents amounts for which asset recognition criteria have been met, but not revenue recognition criteria. Unearned revenue arises when resources are received by the State before it has a legal claim to them, such as when grant moneys are received prior to the incurrence of qualifying expenditures. In subsequent periods, when revenue recognition criteria are met, or when the State has a legal claim to the resources, the liability for unearned revenue is removed and revenue is recognized.
Unearned revenue of the University of Wisconsin System consists of payments received but not earned at June 30, 2020, primarily for summer session tuition, tuition and room deposits for the next fall term, advance ticket sales for upcoming intercollegiate athletic events, and amounts received from grant and contract sponsors that have not yet been earned under the terms of the agreement.
13. Self-Insurance
Consistent with the requirements of GASB Statement No. 10, Accounting and Financial Reporting for Risk Financing and Related Insurance Issues, the State’s risk management activities are reported in an internal service fund, and the claims liabilities associated with that fund are reported therein.
The State's policy is generally not to purchase commercial insurance for the risk of losses to which it is exposed. Instead, State management believes it is more economical to manage its own risks internally. The Risk Management Fund, an internal service fund, is used to pay for losses incurred by any State agency and for administrative costs incurred to manage a state-wide risk management program. These losses include damage to
State of Wisconsin Notes to the Financial Statements
For the Fiscal Year Ended June 30, 2020
71
property owned by the agencies, personal injury or property damage liabilities incurred by a State officer, agent or employee, and worker's compensation costs for State employees. A limited amount of insurance is purchased to limit the exposure to catastrophic losses. Annually, a charge is allocated to each agency for its proportionate share of the estimated cost attributable to the program per Wis. Stat. Sec. 16.865(8).
14. Deferred Outflows of Resources and Deferred Inflows of Resources
Deferred outflows of resources are a consumption of net position by the government that is applicable to a future reporting period. Deferred inflows of resources are an acquisition of net position by the government that is applicable to a future reporting period. The events associated with the outflows and inflows of resources have already occurred. Under GASB standards, however, the recognition of those outflows and inflows as expenses or expenditures and revenues are deferred until the future periods to which the outflows and inflows are applicable. GASB standards identify circumstances under which deferred outflows of resources and deferred inflows of resources must be reported. The reporting of deferred inflows and outflows are only allowable under those circumstances.
As applicable, the State reports deferred outflows of resources or deferred inflows of resources in the Statement of Net Position for governmental activities and business-type activities and for proprietary and fiduciary fund types as follows:
A decrease or increase in the fair value of derivative instruments classified as effective hedges is presented as a deferred outflow or deferred inflow of resources, respectively, with an off-setting liability or asset, as applicable.
Gains on refunded debt (i.e. the reacquisition price is less than the net carrying amount of the old debt) are reported as deferred inflows, while losses on refunded debt (i.e. the reacquisition price is greater than the net carrying amount of the old debt) are reported as deferred outflows. Both are amortized to interest expense over the remaining life of the old bonds or the life of the new bonds, whichever is shorter.
Differences between expected and actual experience with regard to economic and demographic factors in the measurement of the pension and OPEB liabilities for the State’s proportionate share are reported as deferred inflows or deferred outflows of resources. They are amortized using a systematic and rational method over a closed period equal to the average of the expected remaining service lives of all active and inactive employees provided with pensions or OPEBs through the applicable plans.
Changes of assumptions about future economic or demographic factors, or of other inputs in the measurement of the pension or OPEB liabilities for the State’s proportionate share, are reported
as deferred inflows or deferred outflows of resources. They are amortized using a systematic and rational method over a closed period equal to the average of the expected remaining service lives of all active and inactive employees provided with pensions or OPEBs through the applicable plans.
Differences between projected and actual earnings on the State’s proportionate share of pension or OPEB plan investments, if any, are reported as deferred inflows or deferred outflows of resources and amortized using a systematic and rational method over a closed five-year period.
Changes in the State’s proportionate share of the pension or OPEB liabilities since the prior measurement date, and differences between actual and proportionate share of contributions are reported as deferred inflows or deferred outflows of resources. They are amortized using a systematic and rational method over a closed period equal to the average expected remaining service lives of all active and inactive employees provided with pensions or OPEBs through the applicable plans.
Contributions to the pension or OPEB plans from the State subsequent to the measurement date of the pension or OPEB liabilities and before the end of the State’s fiscal year end are reported as deferred outflows of resources.
State resources transmitted to an entity before time requirements are met, but after all other eligibility requirements have been met, are reported as a deferred outflow of resources.
Federal or other entities’ resources transmitted to the State before time requirements are met, but after all other eligibility requirements have been met, are reported as deferred inflows of resources.
When asset retirement obligations (ARO) are recognized, a corresponding deferred outflow of resources is also recognized and reduced in a systematic and rational manner over the estimated useful life of the capital asset.
Further, governmental fund types may report deferred inflows of resources for unavailable revenue, such as derived nonexchange revenue transactions (e.g. sales tax, income tax, assessments on earnings and consumption, etc.). These inflows are not deferred in the government-wide financial statements; rather, they are recognized as revenue.
State of Wisconsin Notes to the Financial Statements
For the Fiscal Year Ended June 30, 2020
72
15. Fund Balance Classification and Restricted Net Position
Fund Balance Classification
In the fund financial statements, governmental funds report fund balance classifications that comprise a hierarchy based primarily on the extent to which the state is bound to honor constraints on the specific purposes for which amounts in those funds can be spent. Fund balance is reported as restricted when constraints placed on the use of the resources are either externally imposed by creditors, grantors, contributors, or laws or regulations of other governments; or, imposed by law through constitutional provisions or enabling legislation.
Amounts that may be used only for specific purposes, pursuant to constraints imposed by passage of a bill by both houses of the legislature that is signed into law by the governor, are reported as committed fund balance. Those committed amounts cannot be used for any other purpose unless a bill passes both houses of the legislature and is signed by the governor to remove or change the specified use. Passage of a bill by both houses of the legislature and signing of the bill by the governor is the highest level action that results in committed fund balance.
Amounts that are constrained by the state’s intent to be used for specific purposes, but are neither restricted nor committed, are classified as assigned fund balances. Intent is expressed by state officials to whom the state has delegated the authority to assign amounts to be used for specific purposes. Unassigned fund balance represents fund balance that has not been restricted, committed, or assigned to specific purposes within the General Fund. Unassigned fund balance may also include negative balances for any governmental fund if expenditures exceed amounts restricted, committed, or assigned for those purposes. Nonspendable fund balances include amounts that cannot be spent because they are either not in spendable form or are legally or contractually required to be maintained intact.
When both restricted and unrestricted resources are available for use it is the State’s policy to use restricted resources first, and then unrestricted as they are needed. The state has not established a policy for use of unrestricted fund balance. Under the provisions of GASB Statement No. 54, Fund Balance Reporting and Governmental Fund Type Definitions, if a government does not establish a policy for its use of unrestricted fund balance amounts, committed amounts would be reduced first, followed by assigned amounts, and then unassigned amounts.
Restricted Net Position
Restricted Net Position, presented in the government-wide and proprietary funds statement of net position are reported when constraints placed on use are either (1) externally imposed by creditors (such as through debt covenants), grantors, contributors, or laws or regulations of other governments, or (2) imposed by law
through constitutional provisions or enabling legislation. Enabling legislation authorizes the government to assess, levy, charge, or otherwise mandate payment of resources (from external resource providers) and includes a legally enforceable requirement that those resources be used only for the specific purposes stipulated in the legislation. Unrestricted net position may be used at the State’s discretion but may have limitations on use based on State statutes.
State of Wisconsin Notes to the Financial Statements
For the Fiscal Year Ended June 30, 2020
73
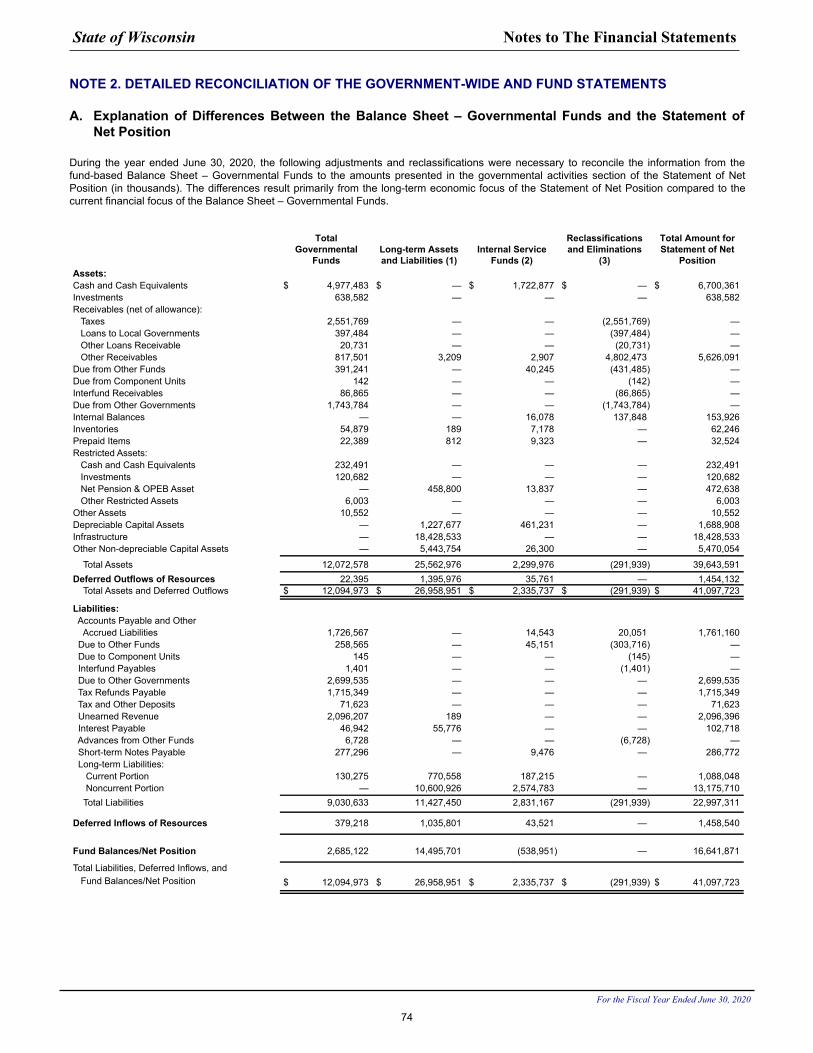
NOTE 2. DETAILED RECONCILIATION OF THE GOVERNMENT-WIDE AND FUND STATEMENTS
A. Explanation of Differences Between the Balance Sheet – Governmental Funds and the Statement of Net Position
During the year ended June 30, 2020, the following adjustments and reclassifications were necessary to reconcile the information from the fund-based Balance Sheet – Governmental Funds to the amounts presented in the governmental activities section of the Statement of Net Position (in thousands). The differences result primarily from the long-term economic focus of the Statement of Net Position compared to the current financial focus of the Balance Sheet – Governmental Funds.
Total Governmental
FundsLong-term Assets and Liabilities (1)
Internal Service Funds (2)
Reclassifications and Eliminations
(3)
Total Amount for Statement of Net
PositionAssets: Cash and Cash Equivalents $ 4,977,483 $ — $ 1,722,877 $ — $ 6,700,361 Investments 638,582 — — — 638,582 Receivables (net of allowance): Taxes 2,551,769 — — (2,551,769) — Loans to Local Governments 397,484 — — (397,484) — Other Loans Receivable 20,731 — — (20,731) — Other Receivables 817,501 3,209 2,907 4,802,473 5,626,091 Due from Other Funds 391,241 — 40,245 (431,485) — Due from Component Units 142 — — (142) — Interfund Receivables 86,865 — — (86,865) — Due from Other Governments 1,743,784 — — (1,743,784) — Internal Balances — — 16,078 137,848 153,926 Inventories 54,879 189 7,178 — 62,246 Prepaid Items 22,389 812 9,323 — 32,524 Restricted Assets: Cash and Cash Equivalents 232,491 — — — 232,491 Investments 120,682 — — — 120,682 Net Pension & OPEB Asset — 458,800 13,837 — 472,638 Other Restricted Assets 6,003 — — — 6,003 Other Assets 10,552 — — — 10,552 Depreciable Capital Assets — 1,227,677 461,231 — 1,688,908 Infrastructure — 18,428,533 — — 18,428,533 Other Non-depreciable Capital Assets — 5,443,754 26,300 — 5,470,054
Total Assets 12,072,578 25,562,976 2,299,976 (291,939) 39,643,591 Deferred Outflows of Resources 22,395 1,395,976 35,761 — 1,454,132 Total Assets and Deferred Outflows $ 12,094,973 $ 26,958,951 $ 2,335,737 $ (291,939) $ 41,097,723
Liabilities: Accounts Payable and Other Accrued Liabilities 1,726,567 — 14,543 20,051 1,761,160 Due to Other Funds 258,565 — 45,151 (303,716) — Due to Component Units 145 — — (145) — Interfund Payables 1,401 — — (1,401) — Due to Other Governments 2,699,535 — — — 2,699,535 Tax Refunds Payable 1,715,349 — — — 1,715,349 Tax and Other Deposits 71,623 — — — 71,623 Unearned Revenue 2,096,207 189 — — 2,096,396 Interest Payable 46,942 55,776 — — 102,718 Advances from Other Funds 6,728 — — (6,728) — Short-term Notes Payable 277,296 — 9,476 — 286,772 Long-term Liabilities: Current Portion 130,275 770,558 187,215 — 1,088,048 Noncurrent Portion — 10,600,926 2,574,783 — 13,175,710 Total Liabilities 9,030,633 11,427,450 2,831,167 (291,939) 22,997,311
Deferred Inflows of Resources 379,218 1,035,801 43,521 — 1,458,540
Fund Balances/Net Position 2,685,122 14,495,701 (538,951) — 16,641,871
Total Liabilities, Deferred Inflows, and Fund Balances/Net Position $ 12,094,973 $ 26,958,951 $ 2,335,737 $ (291,939) $ 41,097,723
State of Wisconsin Notes to The Financial Statements
For the Fiscal Year Ended June 30, 2020
74
(1) Long-term asset and liability differences arise because governmental funds focus only on short-term financing (that is, resources that will be available to pay for current period expenditures). In contrast, the Statement of Net Position has a long-term economic focus and reports on all capital and financial resources.
(2) The adjustment for internal service funds reflects the reclassification of these funds for the government-wide statement. The assets and liabilities of these funds are reported as proprietary activities on the fund statements, but are included as governmental activities on the Statement of Net Position.
(3) Various reclassifications are necessary due to the differing level of detail needed on each of the statements. Eliminations are done on the Statement of Net Position to minimize the grossing-up effect on assets and liabilities within the governmental and business- type activities columns of the primary government. The net residual amounts due between governmental and business-type activities are shown as internal balances.
State of Wisconsin Notes to The Financial Statements
For the Fiscal Year Ended June 30, 2020
75
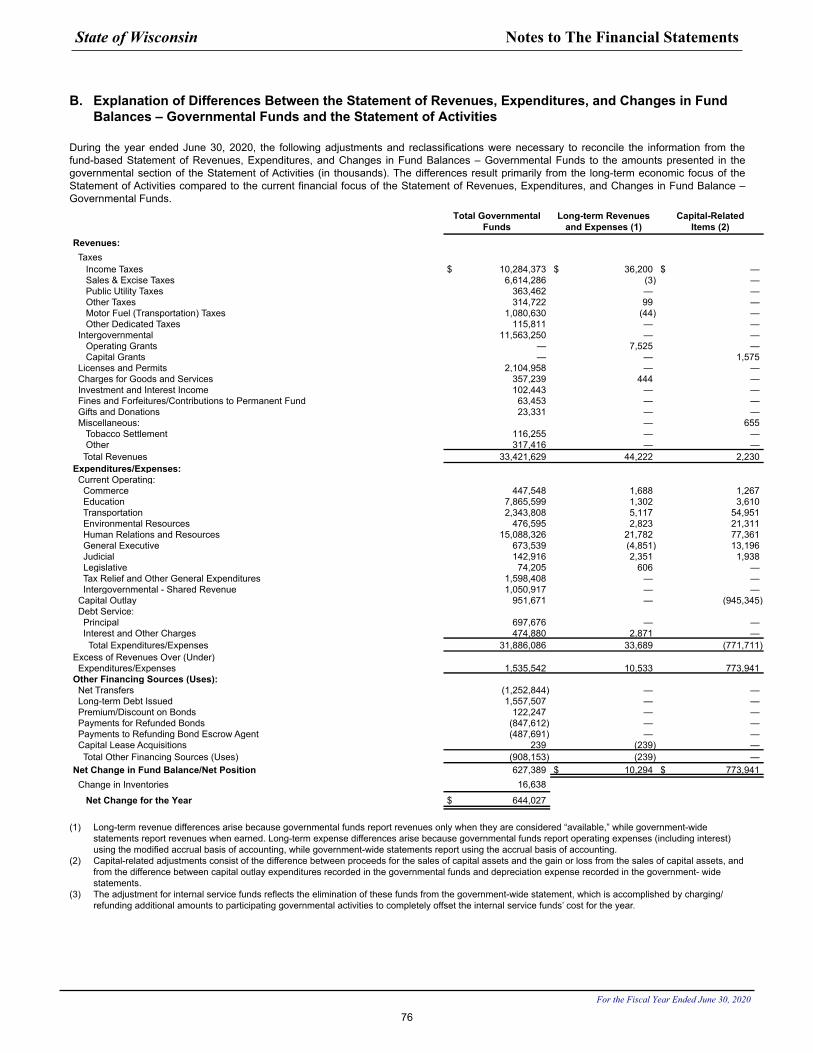
B. Explanation of Differences Between the Statement of Revenues, Expenditures, and Changes in Fund Balances – Governmental Funds and the Statement of Activities
During the year ended June 30, 2020, the following adjustments and reclassifications were necessary to reconcile the information from the fund-based Statement of Revenues, Expenditures, and Changes in Fund Balances – Governmental Funds to the amounts presented in the governmental section of the Statement of Activities (in thousands). The differences result primarily from the long-term economic focus of the Statement of Activities compared to the current financial focus of the Statement of Revenues, Expenditures, and Changes in Fund Balance – Governmental Funds.
Total Governmental Funds
Long-term Revenues and Expenses (1)
Capital-RelatedItems (2)
Revenues: Taxes Income Taxes $ 10,284,373 $ 36,200 $ — Sales & Excise Taxes 6,614,286 (3) — Public Utility Taxes 363,462 — — Other Taxes 314,722 99 — Motor Fuel (Transportation) Taxes 1,080,630 (44) — Other Dedicated Taxes 115,811 — — Intergovernmental 11,563,250 — — Operating Grants — 7,525 — Capital Grants — — 1,575 Licenses and Permits 2,104,958 — — Charges for Goods and Services 357,239 444 — Investment and Interest Income 102,443 — — Fines and Forfeitures/Contributions to Permanent Fund 63,453 — — Gifts and Donations 23,331 — — Miscellaneous: — 655 Tobacco Settlement 116,255 — — Other 317,416 — — Total Revenues 33,421,629 44,222 2,230 Expenditures/Expenses: Current Operating: Commerce 447,548 1,688 1,267 Education 7,865,599 1,302 3,610 Transportation 2,343,808 5,117 54,951 Environmental Resources 476,595 2,823 21,311 Human Relations and Resources 15,088,326 21,782 77,361 General Executive 673,539 (4,851) 13,196 Judicial 142,916 2,351 1,938 Legislative 74,205 606 — Tax Relief and Other General Expenditures 1,598,408 — — Intergovernmental - Shared Revenue 1,050,917 — — Capital Outlay 951,671 — (945,345) Debt Service: Principal 697,676 — — Interest and Other Charges 474,880 2,871 — Total Expenditures/Expenses 31,886,086 33,689 (771,711) Excess of Revenues Over (Under) Expenditures/Expenses 1,535,542 10,533 773,941 Other Financing Sources (Uses): Net Transfers (1,252,844) — — Long-term Debt Issued 1,557,507 — — Premium/Discount on Bonds 122,247 — — Payments for Refunded Bonds (847,612) — — Payments to Refunding Bond Escrow Agent (487,691) — — Capital Lease Acquisitions 239 (239) — Total Other Financing Sources (Uses) (908,153) (239) — Net Change in Fund Balance/Net Position 627,389 $ 10,294 $ 773,941 Change in Inventories 16,638
Net Change for the Year $ 644,027
(1) Long-term revenue differences arise because governmental funds report revenues only when they are considered “available,” while government-wide statements report revenues when earned. Long-term expense differences arise because governmental funds report operating expenses (including interest) using the modified accrual basis of accounting, while government-wide statements report using the accrual basis of accounting.
(2) Capital-related adjustments consist of the difference between proceeds for the sales of capital assets and the gain or loss from the sales of capital assets, and from the difference between capital outlay expenditures recorded in the governmental funds and depreciation expense recorded in the government- wide statements.
(3) The adjustment for internal service funds reflects the elimination of these funds from the government-wide statement, which is accomplished by charging/refunding additional amounts to participating governmental activities to completely offset the internal service funds’ cost for the year.
State of Wisconsin Notes to The Financial Statements
For the Fiscal Year Ended June 30, 2020
76
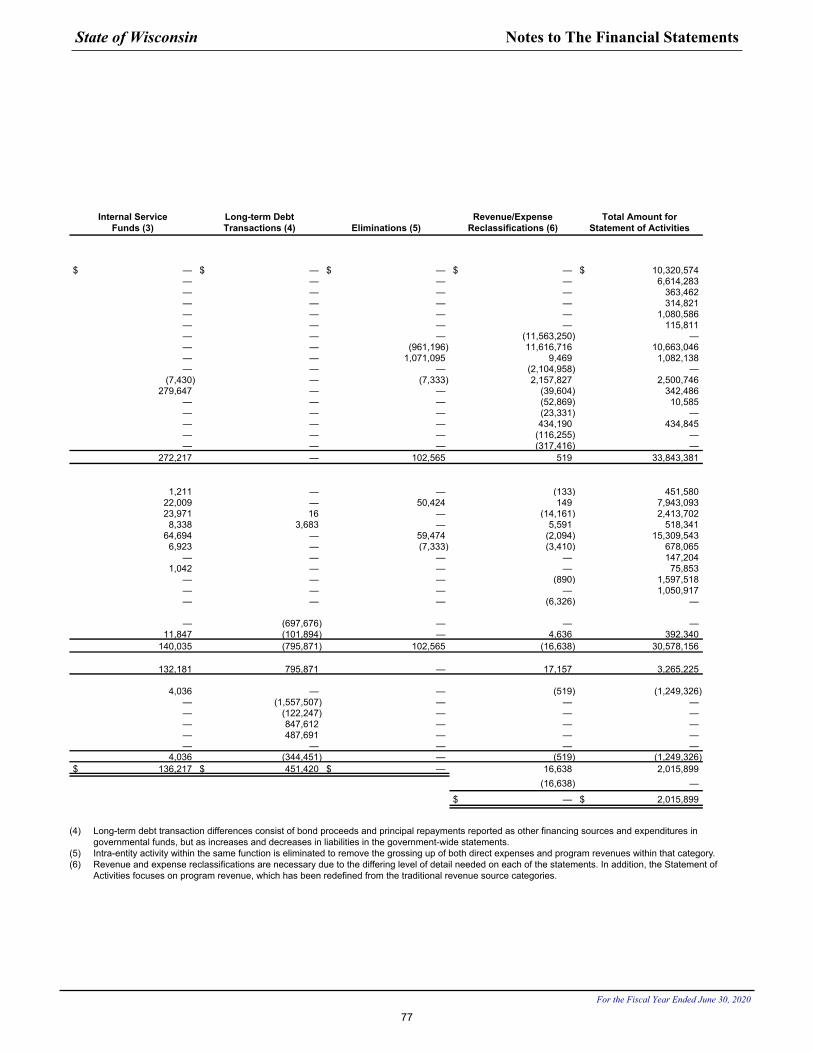
Internal Service Funds (3)
Long-term Debt Transactions (4) Eliminations (5)
Revenue/Expense Reclassifications (6)
Total Amount for Statement of Activities
$ — $ — $ — $ — $ 10,320,574 — — — — 6,614,283 — — — — 363,462 — — — — 314,821 — — — — 1,080,586 — — — — 115,811 — — — (11,563,250) — — — (961,196) 11,616,716 10,663,046 — — 1,071,095 9,469 1,082,138 — — — (2,104,958) — (7,430) — (7,333) 2,157,827 2,500,746 279,647 — — (39,604) 342,486 — — — (52,869) 10,585 — — — (23,331) — — — — 434,190 434,845 — — — (116,255) — — — — (317,416) — 272,217 — 102,565 519 33,843,381
1,211 — — (133) 451,580 22,009 — 50,424 149 7,943,093 23,971 16 — (14,161) 2,413,702 8,338 3,683 — 5,591 518,341 64,694 — 59,474 (2,094) 15,309,543 6,923 — (7,333) (3,410) 678,065 — — — — 147,204 1,042 — — — 75,853 — — — (890) 1,597,518 — — — — 1,050,917 — — — (6,326) —
— (697,676) — — — 11,847 (101,894) — 4,636 392,340 140,035 (795,871) 102,565 (16,638) 30,578,156
132,181 795,871 — 17,157 3,265,225
4,036 — — (519) (1,249,326) — (1,557,507) — — — — (122,247) — — — — 847,612 — — — — 487,691 — — — — — — — — 4,036 (344,451) — (519) (1,249,326) $ 136,217 $ 451,420 $ — 16,638 2,015,899
(16,638) —
$ — $ 2,015,899
(4) Long-term debt transaction differences consist of bond proceeds and principal repayments reported as other financing sources and expenditures in governmental funds, but as increases and decreases in liabilities in the government-wide statements.
(5) Intra-entity activity within the same function is eliminated to remove the grossing up of both direct expenses and program revenues within that category.(6) Revenue and expense reclassifications are necessary due to the differing level of detail needed on each of the statements. In addition, the Statement of
Activities focuses on program revenue, which has been redefined from the traditional revenue source categories.
State of Wisconsin Notes to The Financial Statements
For the Fiscal Year Ended June 30, 2020
77
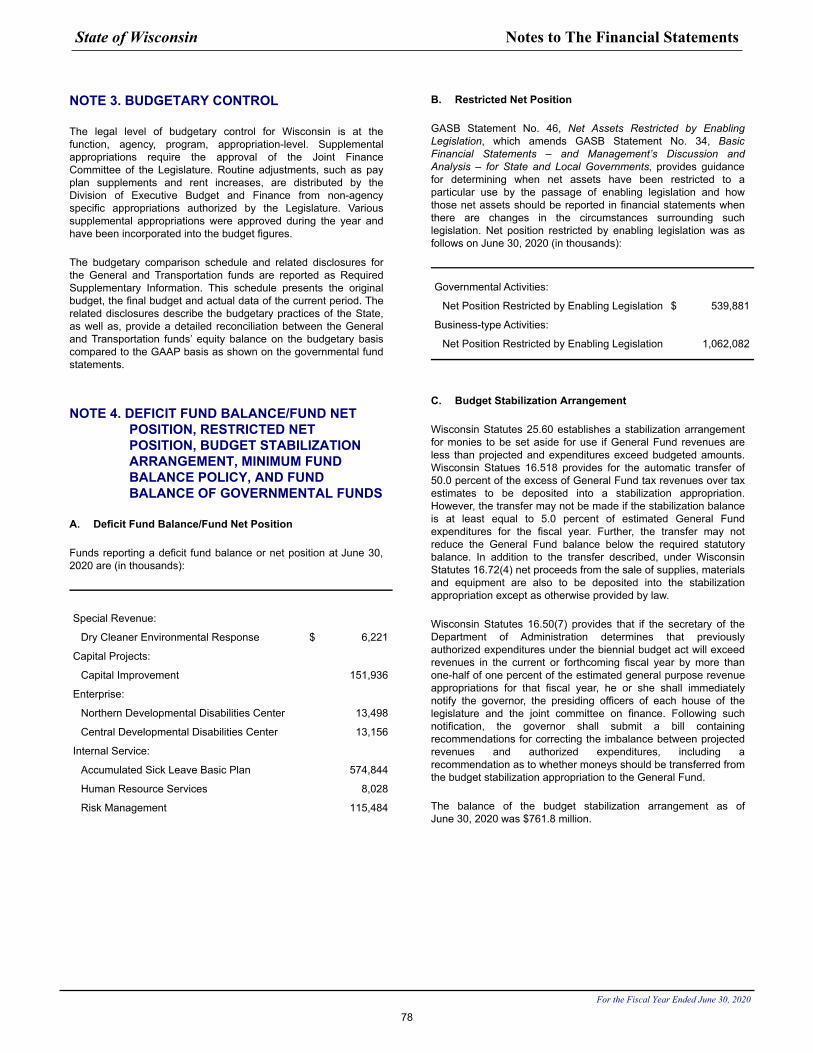
NOTE 3. BUDGETARY CONTROL
The legal level of budgetary control for Wisconsin is at the function, agency, program, appropriation-level. Supplemental appropriations require the approval of the Joint Finance Committee of the Legislature. Routine adjustments, such as pay plan supplements and rent increases, are distributed by the Division of Executive Budget and Finance from non-agency specific appropriations authorized by the Legislature. Various supplemental appropriations were approved during the year and have been incorporated into the budget figures.
The budgetary comparison schedule and related disclosures for the General and Transportation funds are reported as Required Supplementary Information. This schedule presents the original budget, the final budget and actual data of the current period. The related disclosures describe the budgetary practices of the State, as well as, provide a detailed reconciliation between the General and Transportation funds’ equity balance on the budgetary basis compared to the GAAP basis as shown on the governmental fund statements.
NOTE 4. DEFICIT FUND BALANCE/FUND NET POSITION, RESTRICTED NET POSITION, BUDGET STABILIZATION ARRANGEMENT, MINIMUM FUND BALANCE POLICY, AND FUND BALANCE OF GOVERNMENTAL FUNDS
A. Deficit Fund Balance/Fund Net Position
Funds reporting a deficit fund balance or net position at June 30, 2020 are (in thousands):
Special Revenue:
Dry Cleaner Environmental Response $ 6,221
Capital Projects:
Capital Improvement 151,936
Enterprise:
Northern Developmental Disabilities Center 13,498
Central Developmental Disabilities Center 13,156
Internal Service:
Accumulated Sick Leave Basic Plan 574,844
Human Resource Services 8,028
Risk Management 115,484
B. Restricted Net Position
GASB Statement No. 46, Net Assets Restricted by Enabling Legislation, which amends GASB Statement No. 34, Basic Financial Statements – and Management’s Discussion and Analysis – for State and Local Governments, provides guidance for determining when net assets have been restricted to a particular use by the passage of enabling legislation and how those net assets should be reported in financial statements when there are changes in the circumstances surrounding such legislation. Net position restricted by enabling legislation was as follows on June 30, 2020 (in thousands):
Governmental Activities:
Net Position Restricted by Enabling Legislation $ 539,881
Business-type Activities:
Net Position Restricted by Enabling Legislation 1,062,082
C. Budget Stabilization Arrangement
Wisconsin Statutes 25.60 establishes a stabilization arrangement for monies to be set aside for use if General Fund revenues are less than projected and expenditures exceed budgeted amounts. Wisconsin Statues 16.518 provides for the automatic transfer of 50.0 percent of the excess of General Fund tax revenues over tax estimates to be deposited into a stabilization appropriation. However, the transfer may not be made if the stabilization balance is at least equal to 5.0 percent of estimated General Fund expenditures for the fiscal year. Further, the transfer may not reduce the General Fund balance below the required statutory balance. In addition to the transfer described, under Wisconsin Statutes 16.72(4) net proceeds from the sale of supplies, materials and equipment are also to be deposited into the stabilization appropriation except as otherwise provided by law.
Wisconsin Statutes 16.50(7) provides that if the secretary of the Department of Administration determines that previously authorized expenditures under the biennial budget act will exceed revenues in the current or forthcoming fiscal year by more than one-half of one percent of the estimated general purpose revenue appropriations for that fiscal year, he or she shall immediately notify the governor, the presiding officers of each house of the legislature and the joint committee on finance. Following such notification, the governor shall submit a bill containing recommendations for correcting the imbalance between projected revenues and authorized expenditures, including a recommendation as to whether moneys should be transferred from the budget stabilization appropriation to the General Fund.
The balance of the budget stabilization arrangement as of June 30, 2020 was $761.8 million.
State of Wisconsin Notes to The Financial Statements
For the Fiscal Year Ended June 30, 2020
78
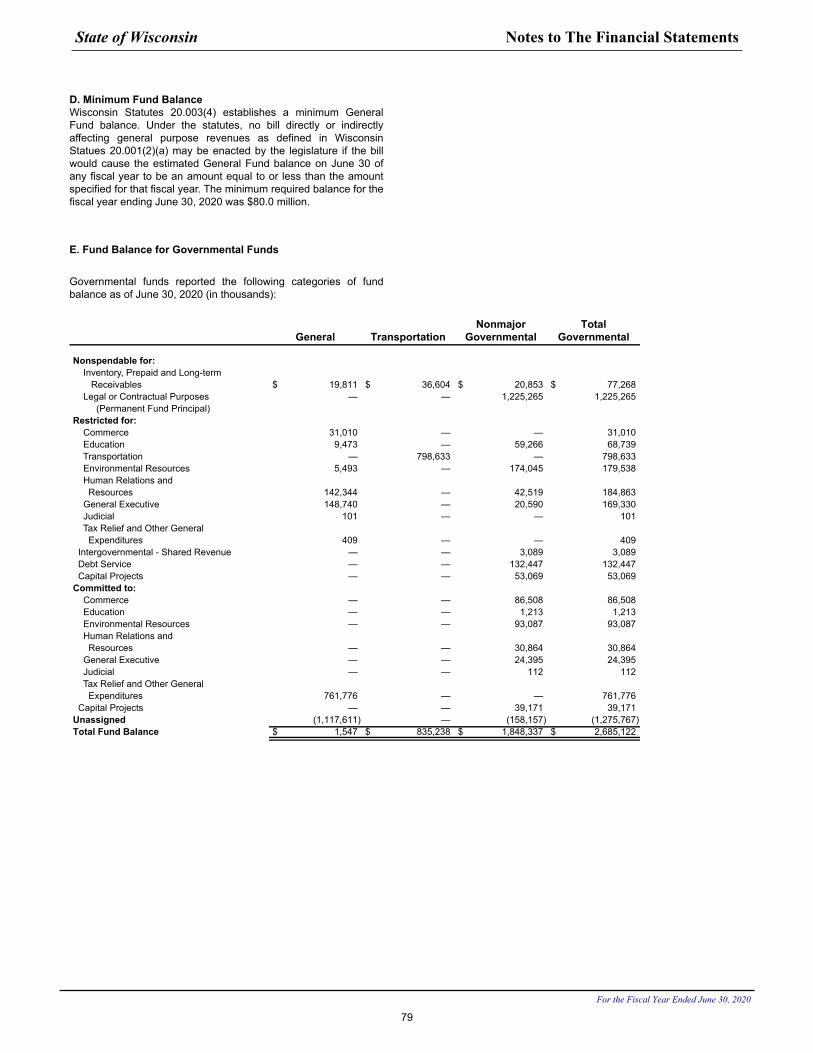
D. Minimum Fund BalanceWisconsin Statutes 20.003(4) establishes a minimum General Fund balance. Under the statutes, no bill directly or indirectly affecting general purpose revenues as defined in Wisconsin Statues 20.001(2)(a) may be enacted by the legislature if the bill would cause the estimated General Fund balance on June 30 of any fiscal year to be an amount equal to or less than the amount specified for that fiscal year. The minimum required balance for the fiscal year ending June 30, 2020 was $80.0 million.
E. Fund Balance for Governmental Funds
Governmental funds reported the following categories of fund balance as of June 30, 2020 (in thousands):
General TransportationNonmajor
Governmental Total
Governmental
Nonspendable for: Inventory, Prepaid and Long-term Receivables $ 19,811 $ 36,604 $ 20,853 $ 77,268 Legal or Contractual Purposes — — 1,225,265 1,225,265 (Permanent Fund Principal)Restricted for: Commerce 31,010 — — 31,010 Education 9,473 — 59,266 68,739 Transportation — 798,633 — 798,633 Environmental Resources 5,493 — 174,045 179,538 Human Relations and Resources 142,344 — 42,519 184,863 General Executive 148,740 — 20,590 169,330 Judicial 101 — — 101 Tax Relief and Other General Expenditures 409 — — 409 Intergovernmental - Shared Revenue — — 3,089 3,089 Debt Service — — 132,447 132,447 Capital Projects — — 53,069 53,069 Committed to: Commerce — — 86,508 86,508 Education — — 1,213 1,213 Environmental Resources — — 93,087 93,087 Human Relations and Resources — — 30,864 30,864 General Executive — — 24,395 24,395 Judicial — — 112 112 Tax Relief and Other General Expenditures 761,776 — — 761,776 Capital Projects — — 39,171 39,171 Unassigned (1,117,611) — (158,157) (1,275,767) Total Fund Balance $ 1,547 $ 835,238 $ 1,848,337 $ 2,685,122
State of Wisconsin Notes to The Financial Statements
For the Fiscal Year Ended June 30, 2020
79
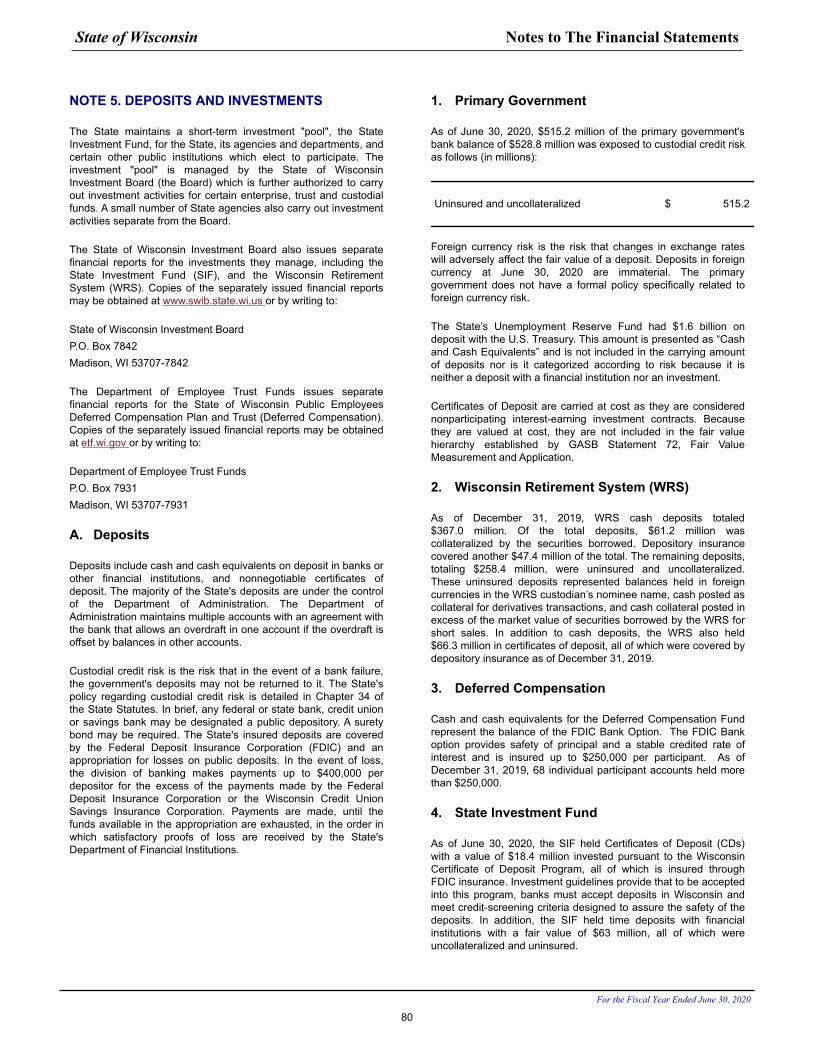
NOTE 5. DEPOSITS AND INVESTMENTS
The State maintains a short-term investment "pool", the State Investment Fund, for the State, its agencies and departments, and certain other public institutions which elect to participate. The investment "pool" is managed by the State of Wisconsin Investment Board (the Board) which is further authorized to carry out investment activities for certain enterprise, trust and custodial funds. A small number of State agencies also carry out investment activities separate from the Board.
The State of Wisconsin Investment Board also issues separate financial reports for the investments they manage, including the State Investment Fund (SIF), and the Wisconsin Retirement System (WRS). Copies of the separately issued financial reports may be obtained at www.swib.state.wi.us or by writing to:
State of Wisconsin Investment BoardP.O. Box 7842Madison, WI 53707-7842
The Department of Employee Trust Funds issues separate financial reports for the State of Wisconsin Public Employees Deferred Compensation Plan and Trust (Deferred Compensation). Copies of the separately issued financial reports may be obtained at etf.wi.gov or by writing to:
Department of Employee Trust FundsP.O. Box 7931Madison, WI 53707-7931
A. Deposits
Deposits include cash and cash equivalents on deposit in banks or other financial institutions, and nonnegotiable certificates of deposit. The majority of the State's deposits are under the control of the Department of Administration. The Department of Administration maintains multiple accounts with an agreement with the bank that allows an overdraft in one account if the overdraft is offset by balances in other accounts.
Custodial credit risk is the risk that in the event of a bank failure, the government's deposits may not be returned to it. The State's policy regarding custodial credit risk is detailed in Chapter 34 of the State Statutes. In brief, any federal or state bank, credit union or savings bank may be designated a public depository. A surety bond may be required. The State's insured deposits are covered by the Federal Deposit Insurance Corporation (FDIC) and an appropriation for losses on public deposits. In the event of loss, the division of banking makes payments up to $400,000 per depositor for the excess of the payments made by the Federal Deposit Insurance Corporation or the Wisconsin Credit Union Savings Insurance Corporation. Payments are made, until the funds available in the appropriation are exhausted, in the order in which satisfactory proofs of loss are received by the State's Department of Financial Institutions.
1. Primary Government
As of June 30, 2020, $515.2 million of the primary government's bank balance of $528.8 million was exposed to custodial credit risk as follows (in millions):
Uninsured and uncollateralized $ 515.2
Foreign currency risk is the risk that changes in exchange rates will adversely affect the fair value of a deposit. Deposits in foreign currency at June 30, 2020 are immaterial. The primary government does not have a formal policy specifically related to foreign currency risk.
The State’s Unemployment Reserve Fund had $1.6 billion on deposit with the U.S. Treasury. This amount is presented as “Cash and Cash Equivalents” and is not included in the carrying amount of deposits nor is it categorized according to risk because it is neither a deposit with a financial institution nor an investment.
Certificates of Deposit are carried at cost as they are considered nonparticipating interest-earning investment contracts. Because they are valued at cost, they are not included in the fair value hierarchy established by GASB Statement 72, Fair Value Measurement and Application.
2. Wisconsin Retirement System (WRS)
As of December 31, 2019, WRS cash deposits totaled $367.0 million. Of the total deposits, $61.2 million was collateralized by the securities borrowed. Depository insurance covered another $47.4 million of the total. The remaining deposits, totaling $258.4 million, were uninsured and uncollateralized. These uninsured deposits represented balances held in foreign currencies in the WRS custodian’s nominee name, cash posted as collateral for derivatives transactions, and cash collateral posted in excess of the market value of securities borrowed by the WRS for short sales. In addition to cash deposits, the WRS also held $66.3 million in certificates of deposit, all of which were covered by depository insurance as of December 31, 2019.
3. Deferred Compensation
Cash and cash equivalents for the Deferred Compensation Fund represent the balance of the FDIC Bank Option. The FDIC Bank option provides safety of principal and a stable credited rate of interest and is insured up to $250,000 per participant. As of December 31, 2019, 68 individual participant accounts held more than $250,000.
4. State Investment Fund
As of June 30, 2020, the SIF held Certificates of Deposit (CDs) with a value of $18.4 million invested pursuant to the Wisconsin Certificate of Deposit Program, all of which is insured through FDIC insurance. Investment guidelines provide that to be accepted into this program, banks must accept deposits in Wisconsin and meet credit-screening criteria designed to assure the safety of the deposits. In addition, the SIF held time deposits with financial institutions with a fair value of $63 million, all of which were uncollateralized and uninsured.
State of Wisconsin Notes to The Financial Statements
For the Fiscal Year Ended June 30, 2020
80

B. Investments
1. Primary Government
Wisconsin Statutes, program policy provisions, appropriate governing boards, and general resolutions contained in revenue bond indenture documents define the types of securities authorized as appropriate investments and the conditions for making investment transactions.
Investments of the State are managed by various portfolios. For disclosure purposes, the following investment portfolios are discussed separately:• Primary government, excluding the University of Wisconsin
System, Wisconsin Retirement System and the State Investment Fund. The primary government portfolios include funds separately managed by the State of Wisconsin Investment Board consisting of the following:-- State Life Insurance Fund (SLF)-- Injured Patients and Families Compensation Fund (IPFCF)-- Historical Society Fund
• The University of Wisconsin System (UWS)• State of Wisconsin Public Employees Deferred Compensation
Plan and Trust (Deferred Compensation)• Wisconsin Retirement System (WRS)• State Investment Fund (SIF) -- functions as the State's cash
management fund by "pooling" the idle cash balances of all State funds and other public institutions. Investments of the SIF are discussed in section B2 of this note disclosure.
Primary Government (excluding the UWS, WRS, and SIF)
For the primary government, except for the Separately Managed Funds discussed later, permitted investments include: direct general obligations of the United States of America and obligations (including obligations of any federal agency or corporation) for which the payment of the principal and interest are unconditionally guaranteed by the full faith and credit of the United States; bonds or other obligations of any state or the United States of America or of any agency, instrumentality or local governmental unit of any such state including the State of Wisconsin; bonds, debentures, participation certificates, notes or similar evidences of indebtedness of any of the Federal Financing Bank, Federal Home Loan Bank System, Federal Farm Credit Bank, Federal National Mortgage Association, Federal Home Loan Mortgage Corporation, Resolution Funding Corporation, Government National Mortgage Association, Student Loan Marketing Association or Tennessee Valley Authority; public housing bonds issued by public agencies or municipalities; commercial paper; interest-bearing time deposits, certificates of deposit or other similar banking arrangements; shares of a diversified open-end management investment company; repurchase agreements; common and preferred stock; bankers acceptances; corporate commercial paper; bonds issued by a local district created under Wisconsin Act 229; and investment agreements with a bank, bank holding company, insurance company or other financial institution.
The State of Wisconsin Investment Board (SWIB or the Board) has control of the investment and collection of principal, interest, and dividends of all monies invested of the State Life Insurance Fund (SLF), the Injured Patients and Families Compensation Fund (IPFCF), and the Historical Society Trust Fund, which are collectively known as the “Separately Managed Funds”.
Permitted classes of investments of the SLF and the IPFCF include bonds of government units or of corporations, loans secured by mortgages, preferred or common stocks, real property and other investments not specifically prohibited by statute.
Funds available for the Historical Society Trust Fund are managed with an investment objective of maintaining a diversified portfolio of high quality publicly issued equities and fixed income obligations providing long-term growth in capital and income generation.
University of Wisconsin System (UWS)
The UWS Board of Regents authorize and govern the UWS investment policies and guidelines. Beginning in FY 2018, the UWS Board of Regents has delegated investment management authority to SWIB and is responsible for monitoring its delegation of this investment management authority. SWIB determines and sets UWS asset allocation targets which are reviewed quarterly.
In addition, UWS continues to have an allocation to private markets through a “legacy” portfolio that will self-liquidate over time as investments are sold and cash proceeds are received.
Effective April 1, 2019, a new investment fund was established for a limited and select number of participating Trust Funds accounts. This fund was established by the Board of Regents to continue to provide an educational investment management opportunity for the UW-Madison School of Business's Applied Security Analysis Program. The "RegentFund" is an intermediate-term fixed income portfolio, governed by and subject to a Board-approved Memorandum of Understanding, which includes detailed investment guidelines.
The UWS also issues separate financial reports. Copies of these separately issued financial reports may be obtained at www.wisconsin.edu or by writing to:
Office of Financial Administration 780 Regent Street, Suite 255Madison, WI 53715
Deferred Compensation
The State of Wisconsin Public Employees Deferred Compensation Plan and Trust (Deferred Compensation) was established in 1981 pursuant to Wisconsin State Statute Section 40.80. Deferred Compensation is governed by the Wisconsin Deferred Compensation Board and is administered by a third party.
Under Deferred Compensation Plan provisions, employees of the State of Wisconsin and public employers in Wisconsin that elect to participate are eligible to contribute to the Plan through payroll deductions. Employees electing the participate in the plan may contribute to or exchange within several available investment options.
Wisconsin Retirement System (WRS)
All assets of the WRS are invested by the State of Wisconsin Investment Board (the Board). The WRS consists of shares in the Core Retirement Investment Trust and the Variable Retirement Investment Trust.
State of Wisconsin Notes to The Financial Statements
For the Fiscal Year Ended June 30, 2020
81
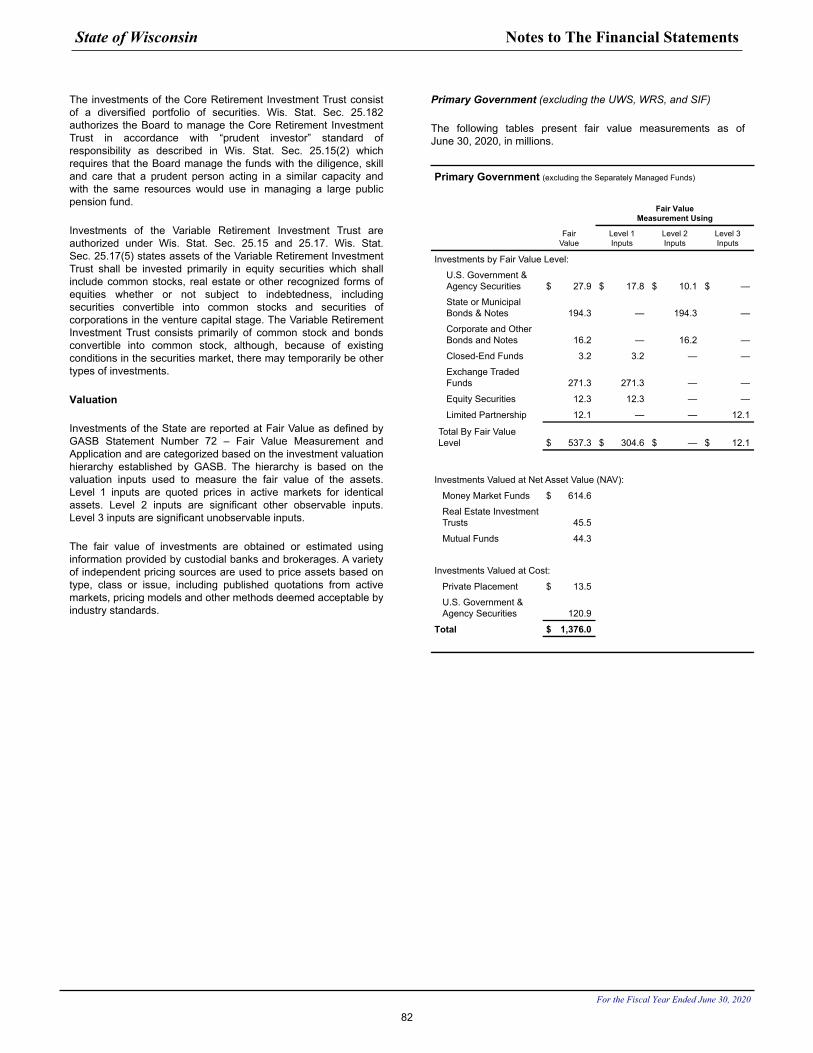
The investments of the Core Retirement Investment Trust consist of a diversified portfolio of securities. Wis. Stat. Sec. 25.182 authorizes the Board to manage the Core Retirement Investment Trust in accordance with “prudent investor” standard of responsibility as described in Wis. Stat. Sec. 25.15(2) which requires that the Board manage the funds with the diligence, skill and care that a prudent person acting in a similar capacity and with the same resources would use in managing a large public pension fund.
Investments of the Variable Retirement Investment Trust are authorized under Wis. Stat. Sec. 25.15 and 25.17. Wis. Stat. Sec. 25.17(5) states assets of the Variable Retirement Investment Trust shall be invested primarily in equity securities which shall include common stocks, real estate or other recognized forms of equities whether or not subject to indebtedness, including securities convertible into common stocks and securities of corporations in the venture capital stage. The Variable Retirement Investment Trust consists primarily of common stock and bonds convertible into common stock, although, because of existing conditions in the securities market, there may temporarily be other types of investments.
Valuation
Investments of the State are reported at Fair Value as defined by GASB Statement Number 72 – Fair Value Measurement and Application and are categorized based on the investment valuation hierarchy established by GASB. The hierarchy is based on the valuation inputs used to measure the fair value of the assets. Level 1 inputs are quoted prices in active markets for identical assets. Level 2 inputs are significant other observable inputs. Level 3 inputs are significant unobservable inputs.
The fair value of investments are obtained or estimated using information provided by custodial banks and brokerages. A variety of independent pricing sources are used to price assets based on type, class or issue, including published quotations from active markets, pricing models and other methods deemed acceptable by industry standards.
Primary Government (excluding the UWS, WRS, and SIF)
The following tables present fair value measurements as of June 30, 2020, in millions.
Primary Government (excluding the Separately Managed Funds)
Fair ValueMeasurement Using
FairValue
Level 1 Inputs
Level 2 Inputs
Level 3 Inputs
Investments by Fair Value Level:
U.S. Government & Agency Securities $ 27.9 $ 17.8 $ 10.1 $ —
State or Municipal Bonds & Notes 194.3 — 194.3 —
Corporate and Other Bonds and Notes 16.2 — 16.2 —
Closed-End Funds 3.2 3.2 — —
Exchange Traded Funds 271.3 271.3 — —
Equity Securities 12.3 12.3 — —
Limited Partnership 12.1 — — 12.1
Total By Fair Value Level $ 537.3 $ 304.6 $ — $ 12.1
Investments Valued at Net Asset Value (NAV):
Money Market Funds $ 614.6
Real Estate Investment Trusts 45.5
Mutual Funds 44.3
Investments Valued at Cost:
Private Placement $ 13.5
U.S. Government & Agency Securities 120.9
Total $ 1,376.0
State of Wisconsin Notes to The Financial Statements
For the Fiscal Year Ended June 30, 2020
82
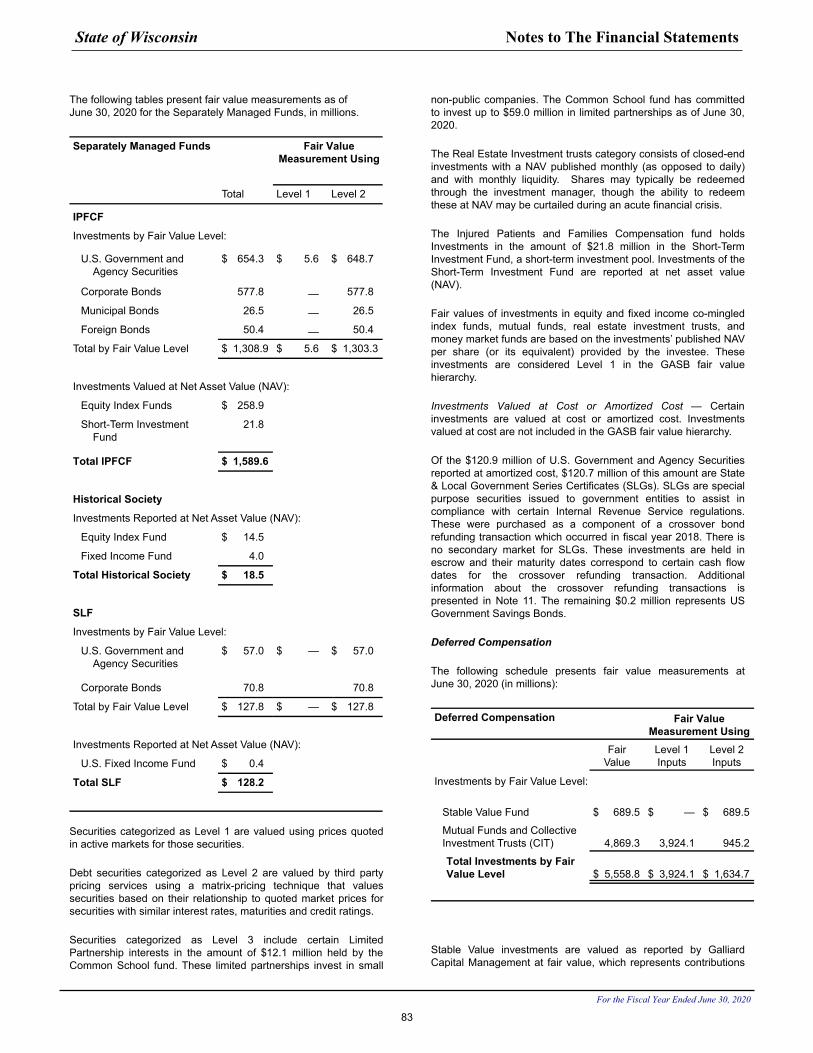
The following tables present fair value measurements as of June 30, 2020 for the Separately Managed Funds, in millions.
Separately Managed Funds Fair Value Measurement Using
Total Level 1 Level 2
IPFCF
Investments by Fair Value Level:
U.S. Government and Agency Securities
$ 654.3 $ 5.6 $ 648.7
Corporate Bonds 577.8 — 577.8
Municipal Bonds 26.5 — 26.5
Foreign Bonds 50.4 — 50.4
Total by Fair Value Level $ 1,308.9 $ 5.6 $ 1,303.3
Investments Valued at Net Asset Value (NAV):
Equity Index Funds $ 258.9
Short-Term Investment Fund
21.8
Total IPFCF $ 1,589.6
Historical Society
Investments Reported at Net Asset Value (NAV):
Equity Index Fund $ 14.5
Fixed Income Fund 4.0
Total Historical Society $ 18.5
SLF
Investments by Fair Value Level:
U.S. Government and Agency Securities
$ 57.0 $ — $ 57.0
Corporate Bonds 70.8 70.8
Total by Fair Value Level $ 127.8 $ — $ 127.8
Investments Reported at Net Asset Value (NAV):
U.S. Fixed Income Fund $ 0.4
Total SLF $ 128.2
Securities categorized as Level 1 are valued using prices quoted in active markets for those securities.
Debt securities categorized as Level 2 are valued by third party pricing services using a matrix-pricing technique that values securities based on their relationship to quoted market prices for securities with similar interest rates, maturities and credit ratings.
Securities categorized as Level 3 include certain Limited Partnership interests in the amount of $12.1 million held by the Common School fund. These limited partnerships invest in small
non-public companies. The Common School fund has committed to invest up to $59.0 million in limited partnerships as of June 30, 2020.
The Real Estate Investment trusts category consists of closed-end investments with a NAV published monthly (as opposed to daily) and with monthly liquidity. Shares may typically be redeemed through the investment manager, though the ability to redeem these at NAV may be curtailed during an acute financial crisis.
The Injured Patients and Families Compensation fund holds Investments in the amount of $21.8 million in the Short-Term Investment Fund, a short-term investment pool. Investments of the Short-Term Investment Fund are reported at net asset value (NAV).
Fair values of investments in equity and fixed income co-mingled index funds, mutual funds, real estate investment trusts, and money market funds are based on the investments’ published NAV per share (or its equivalent) provided by the investee. These investments are considered Level 1 in the GASB fair value hierarchy.
Investments Valued at Cost or Amortized Cost — Certain investments are valued at cost or amortized cost. Investments valued at cost are not included in the GASB fair value hierarchy.
Of the $120.9 million of U.S. Government and Agency Securities reported at amortized cost, $120.7 million of this amount are State & Local Government Series Certificates (SLGs). SLGs are special purpose securities issued to government entities to assist in compliance with certain Internal Revenue Service regulations. These were purchased as a component of a crossover bond refunding transaction which occurred in fiscal year 2018. There is no secondary market for SLGs. These investments are held in escrow and their maturity dates correspond to certain cash flow dates for the crossover refunding transaction. Additional information about the crossover refunding transactions is presented in Note 11. The remaining $0.2 million represents US Government Savings Bonds.
Deferred Compensation
The following schedule presents fair value measurements at June 30, 2020 (in millions):
Deferred Compensation Fair Value Measurement Using
FairValue
Level 1 Inputs
Level 2 Inputs
Investments by Fair Value Level:
Stable Value Fund $ 689.5 $ — $ 689.5
Mutual Funds and Collective Investment Trusts (CIT) 4,869.3 3,924.1 945.2
Total Investments by Fair Value Level $ 5,558.8 $ 3,924.1 $ 1,634.7
Stable Value investments are valued as reported by Galliard Capital Management at fair value, which represents contributions
State of Wisconsin Notes to The Financial Statements
For the Fiscal Year Ended June 30, 2020
83
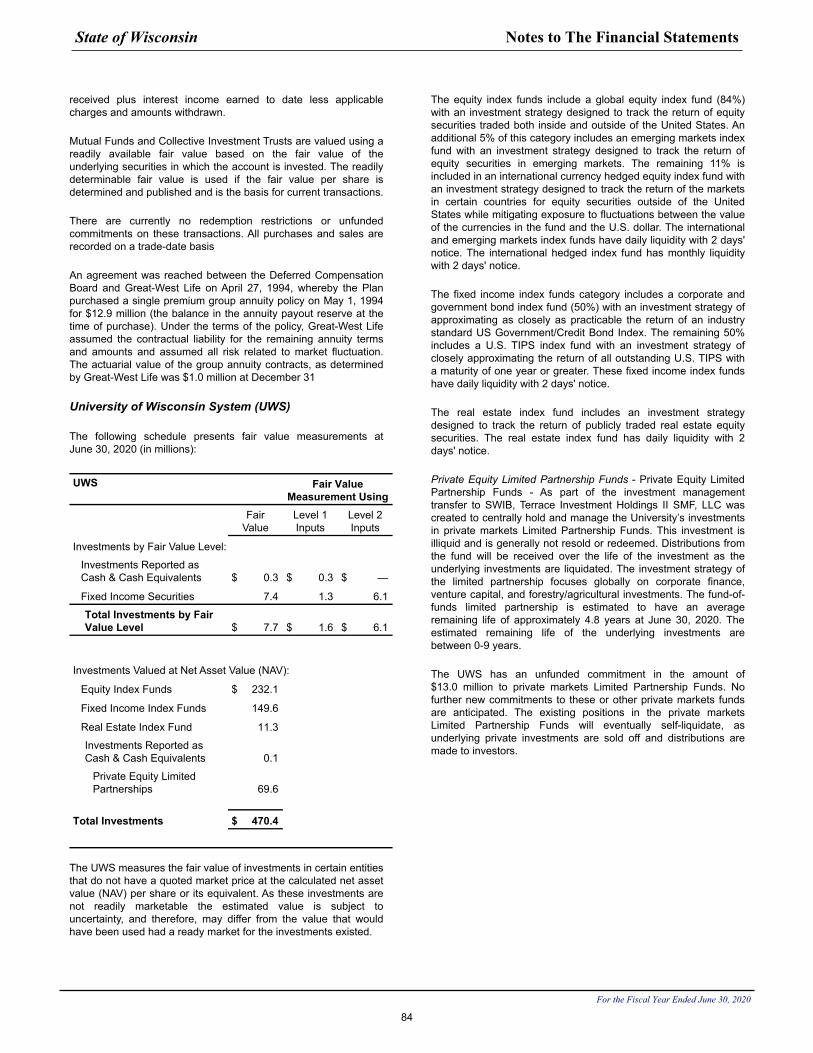
received plus interest income earned to date less applicable charges and amounts withdrawn.
Mutual Funds and Collective Investment Trusts are valued using a readily available fair value based on the fair value of the underlying securities in which the account is invested. The readily determinable fair value is used if the fair value per share is determined and published and is the basis for current transactions.
There are currently no redemption restrictions or unfunded commitments on these transactions. All purchases and sales are recorded on a trade-date basis
An agreement was reached between the Deferred Compensation Board and Great-West Life on April 27, 1994, whereby the Plan purchased a single premium group annuity policy on May 1, 1994 for $12.9 million (the balance in the annuity payout reserve at the time of purchase). Under the terms of the policy, Great-West Life assumed the contractual liability for the remaining annuity terms and amounts and assumed all risk related to market fluctuation. The actuarial value of the group annuity contracts, as determined by Great-West Life was $1.0 million at December 31
University of Wisconsin System (UWS)
The following schedule presents fair value measurements at June 30, 2020 (in millions):
UWS Fair Value Measurement Using
FairValue
Level 1 Inputs
Level 2 Inputs
Investments by Fair Value Level:
Investments Reported as Cash & Cash Equivalents $ 0.3 $ 0.3 $ —
Fixed Income Securities 7.4 1.3 6.1
Total Investments by Fair Value Level $ 7.7 $ 1.6 $ 6.1
Investments Valued at Net Asset Value (NAV):
Equity Index Funds $ 232.1
Fixed Income Index Funds 149.6
Real Estate Index Fund 11.3
Investments Reported as Cash & Cash Equivalents 0.1
Private Equity Limited Partnerships 69.6
Total Investments $ 470.4
The UWS measures the fair value of investments in certain entities that do not have a quoted market price at the calculated net asset value (NAV) per share or its equivalent. As these investments are not readily marketable the estimated value is subject to uncertainty, and therefore, may differ from the value that would have been used had a ready market for the investments existed.
The equity index funds include a global equity index fund (84%) with an investment strategy designed to track the return of equity securities traded both inside and outside of the United States. An additional 5% of this category includes an emerging markets index fund with an investment strategy designed to track the return of equity securities in emerging markets. The remaining 11% is included in an international currency hedged equity index fund with an investment strategy designed to track the return of the markets in certain countries for equity securities outside of the United States while mitigating exposure to fluctuations between the value of the currencies in the fund and the U.S. dollar. The international and emerging markets index funds have daily liquidity with 2 days' notice. The international hedged index fund has monthly liquidity with 2 days' notice.
The fixed income index funds category includes a corporate and government bond index fund (50%) with an investment strategy of approximating as closely as practicable the return of an industry standard US Government/Credit Bond Index. The remaining 50% includes a U.S. TIPS index fund with an investment strategy of closely approximating the return of all outstanding U.S. TIPS with a maturity of one year or greater. These fixed income index funds have daily liquidity with 2 days' notice.
The real estate index fund includes an investment strategy designed to track the return of publicly traded real estate equity securities. The real estate index fund has daily liquidity with 2 days' notice.
Private Equity Limited Partnership Funds - Private Equity Limited Partnership Funds - As part of the investment management transfer to SWIB, Terrace Investment Holdings II SMF, LLC was created to centrally hold and manage the University’s investments in private markets Limited Partnership Funds. This investment is illiquid and is generally not resold or redeemed. Distributions from the fund will be received over the life of the investment as the underlying investments are liquidated. The investment strategy of the limited partnership focuses globally on corporate finance, venture capital, and forestry/agricultural investments. The fund-of-funds limited partnership is estimated to have an average remaining life of approximately 4.8 years at June 30, 2020. The estimated remaining life of the underlying investments are between 0-9 years.
The UWS has an unfunded commitment in the amount of $13.0 million to private markets Limited Partnership Funds. No further new commitments to these or other private markets funds are anticipated. The existing positions in the private markets Limited Partnership Funds will eventually self-liquidate, as underlying private investments are sold off and distributions are made to investors.
State of Wisconsin Notes to The Financial Statements
For the Fiscal Year Ended June 30, 2020
84
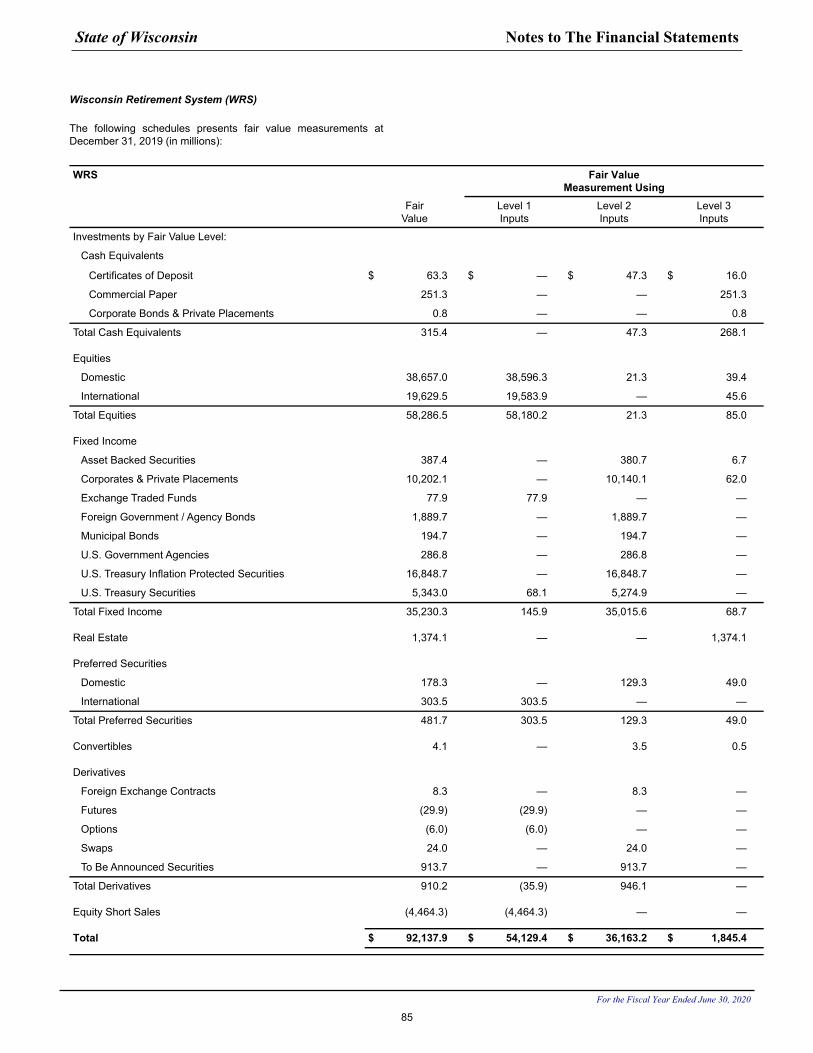
Wisconsin Retirement System (WRS)
The following schedules presents fair value measurements at December 31, 2019 (in millions):
WRS Fair ValueMeasurement Using
FairValue
Level 1Inputs
Level 2Inputs
Level 3Inputs
Investments by Fair Value Level:
Cash Equivalents
Certificates of Deposit $ 63.3 $ — $ 47.3 $ 16.0
Commercial Paper 251.3 — — 251.3
Corporate Bonds & Private Placements 0.8 — — 0.8
Total Cash Equivalents 315.4 — 47.3 268.1
Equities
Domestic 38,657.0 38,596.3 21.3 39.4
International 19,629.5 19,583.9 — 45.6
Total Equities 58,286.5 58,180.2 21.3 85.0
Fixed Income
Asset Backed Securities 387.4 — 380.7 6.7
Corporates & Private Placements 10,202.1 — 10,140.1 62.0
Exchange Traded Funds 77.9 77.9 — —
Foreign Government / Agency Bonds 1,889.7 — 1,889.7 —
Municipal Bonds 194.7 — 194.7 —
U.S. Government Agencies 286.8 — 286.8 —
U.S. Treasury Inflation Protected Securities 16,848.7 — 16,848.7 —
U.S. Treasury Securities 5,343.0 68.1 5,274.9 —
Total Fixed Income 35,230.3 145.9 35,015.6 68.7
Real Estate 1,374.1 — — 1,374.1
Preferred Securities
Domestic 178.3 — 129.3 49.0
International 303.5 303.5 — —
Total Preferred Securities 481.7 303.5 129.3 49.0
Convertibles 4.1 — 3.5 0.5
Derivatives
Foreign Exchange Contracts 8.3 — 8.3 —
Futures (29.9) (29.9) — —
Options (6.0) (6.0) — —
Swaps 24.0 — 24.0 —
To Be Announced Securities 913.7 — 913.7 —
Total Derivatives 910.2 (35.9) 946.1 —
Equity Short Sales (4,464.3) (4,464.3) — —
Total $ 92,137.9 $ 54,129.4 $ 36,163.2 $ 1,845.4
State of Wisconsin Notes to The Financial Statements
For the Fiscal Year Ended June 30, 2020
85
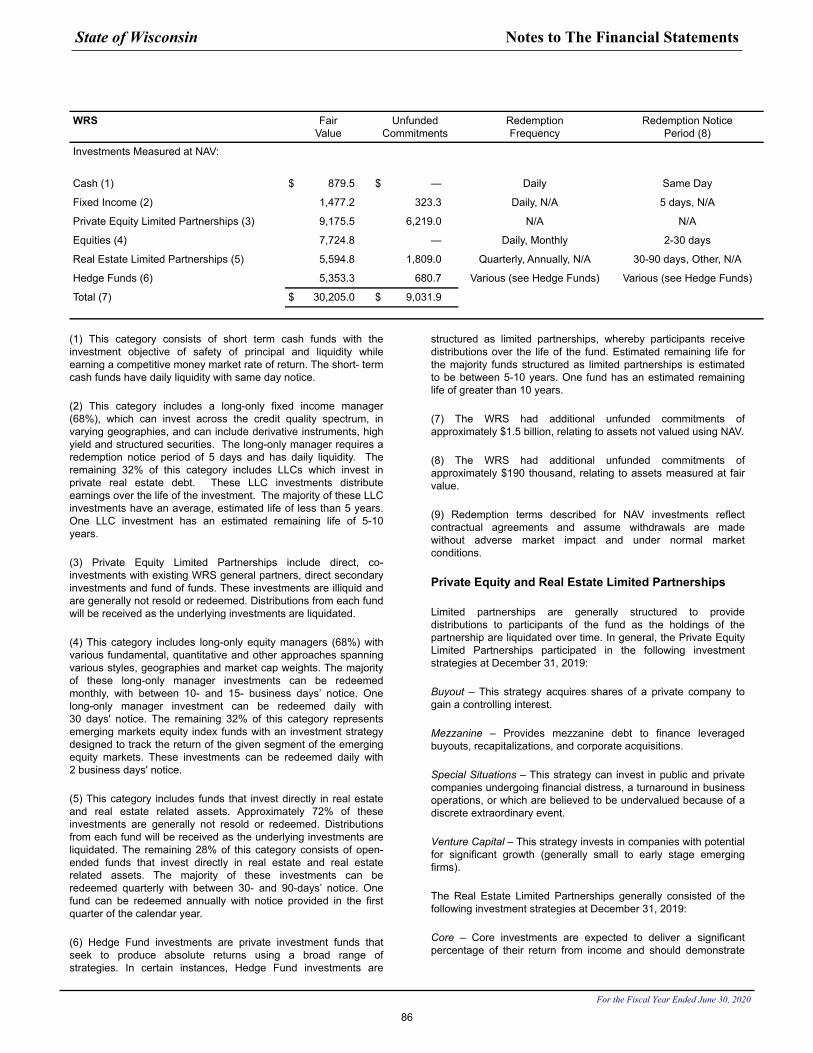
WRS FairValue
UnfundedCommitments
RedemptionFrequency
Redemption NoticePeriod (8)
Investments Measured at NAV:
Cash (1) $ 879.5 $ — Daily Same Day
Fixed Income (2) 1,477.2 323.3 Daily, N/A 5 days, N/A
Private Equity Limited Partnerships (3) 9,175.5 6,219.0 N/A N/A
Equities (4) 7,724.8 — Daily, Monthly 2-30 days
Real Estate Limited Partnerships (5) 5,594.8 1,809.0 Quarterly, Annually, N/A 30-90 days, Other, N/A
Hedge Funds (6) 5,353.3 680.7 Various (see Hedge Funds) Various (see Hedge Funds)
Total (7) $ 30,205.0 $ 9,031.9
(1) This category consists of short term cash funds with the investment objective of safety of principal and liquidity while earning a competitive money market rate of return. The short- term cash funds have daily liquidity with same day notice.
(2) This category includes a long-only fixed income manager (68%), which can invest across the credit quality spectrum, in varying geographies, and can include derivative instruments, high yield and structured securities. The long-only manager requires a redemption notice period of 5 days and has daily liquidity. The remaining 32% of this category includes LLCs which invest in private real estate debt. These LLC investments distribute earnings over the life of the investment. The majority of these LLC investments have an average, estimated life of less than 5 years. One LLC investment has an estimated remaining life of 5-10 years.
(3) Private Equity Limited Partnerships include direct, co- investments with existing WRS general partners, direct secondary investments and fund of funds. These investments are illiquid and are generally not resold or redeemed. Distributions from each fund will be received as the underlying investments are liquidated.
(4) This category includes long-only equity managers (68%) with various fundamental, quantitative and other approaches spanning various styles, geographies and market cap weights. The majority of these long-only manager investments can be redeemed monthly, with between 10- and 15- business days’ notice. One long-only manager investment can be redeemed daily with 30 days' notice. The remaining 32% of this category represents emerging markets equity index funds with an investment strategy designed to track the return of the given segment of the emerging equity markets. These investments can be redeemed daily with 2 business days' notice.
(5) This category includes funds that invest directly in real estate and real estate related assets. Approximately 72% of these investments are generally not resold or redeemed. Distributions from each fund will be received as the underlying investments are liquidated. The remaining 28% of this category consists of open- ended funds that invest directly in real estate and real estate related assets. The majority of these investments can be redeemed quarterly with between 30- and 90-days’ notice. One fund can be redeemed annually with notice provided in the first quarter of the calendar year.
(6) Hedge Fund investments are private investment funds that seek to produce absolute returns using a broad range of strategies. In certain instances, Hedge Fund investments are
structured as limited partnerships, whereby participants receive distributions over the life of the fund. Estimated remaining life for the majority funds structured as limited partnerships is estimated to be between 5-10 years. One fund has an estimated remaining life of greater than 10 years.
(7) The WRS had additional unfunded commitments of approximately $1.5 billion, relating to assets not valued using NAV.
(8) The WRS had additional unfunded commitments of approximately $190 thousand, relating to assets measured at fair value.
(9) Redemption terms described for NAV investments reflect contractual agreements and assume withdrawals are made without adverse market impact and under normal market conditions.
Private Equity and Real Estate Limited Partnerships
Limited partnerships are generally structured to provide distributions to participants of the fund as the holdings of the partnership are liquidated over time. In general, the Private Equity Limited Partnerships participated in the following investment strategies at December 31, 2019:
Buyout – This strategy acquires shares of a private company to gain a controlling interest.
Mezzanine – Provides mezzanine debt to finance leveraged buyouts, recapitalizations, and corporate acquisitions.
Special Situations – This strategy can invest in public and private companies undergoing financial distress, a turnaround in business operations, or which are believed to be undervalued because of a discrete extraordinary event.
Venture Capital – This strategy invests in companies with potential for significant growth (generally small to early stage emerging firms).
The Real Estate Limited Partnerships generally consisted of the following investment strategies at December 31, 2019:
Core – Core investments are expected to deliver a significant percentage of their return from income and should demonstrate
State of Wisconsin Notes to The Financial Statements
For the Fiscal Year Ended June 30, 2020
86
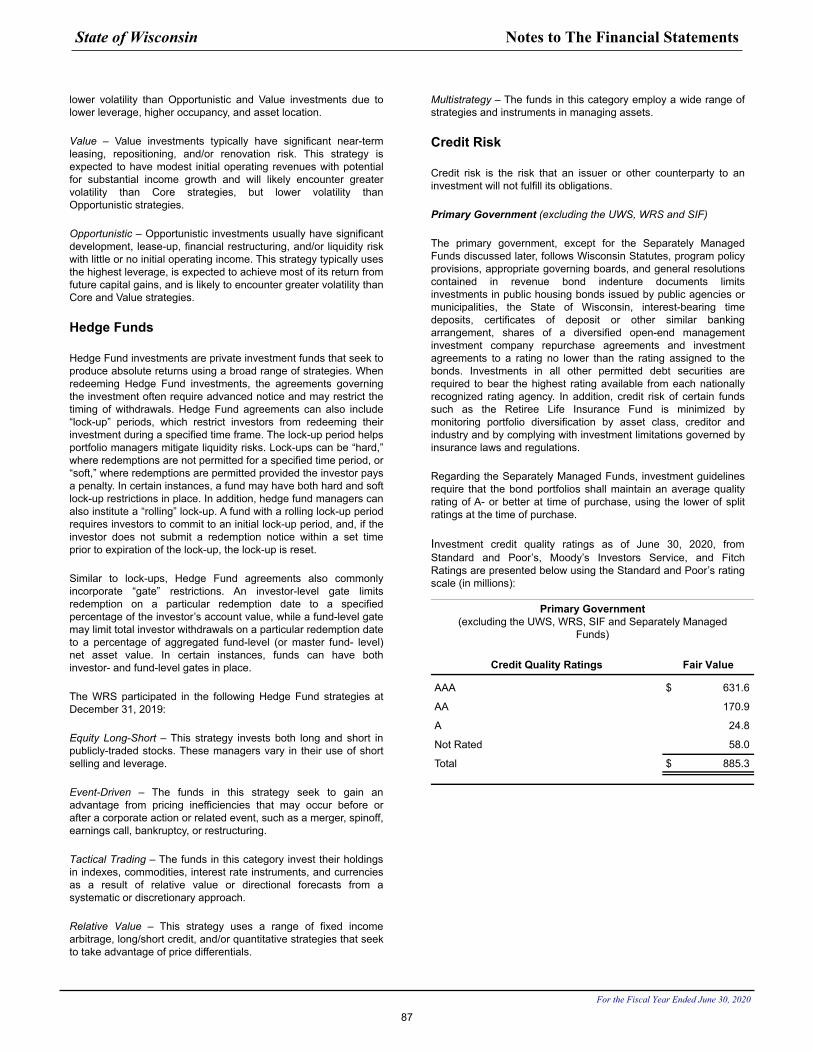
lower volatility than Opportunistic and Value investments due to lower leverage, higher occupancy, and asset location.
Value – Value investments typically have significant near-term leasing, repositioning, and/or renovation risk. This strategy is expected to have modest initial operating revenues with potential for substantial income growth and will likely encounter greater volatility than Core strategies, but lower volatility than Opportunistic strategies.
Opportunistic – Opportunistic investments usually have significant development, lease-up, financial restructuring, and/or liquidity risk with little or no initial operating income. This strategy typically uses the highest leverage, is expected to achieve most of its return from future capital gains, and is likely to encounter greater volatility than Core and Value strategies.
Hedge Funds
Hedge Fund investments are private investment funds that seek to produce absolute returns using a broad range of strategies. When redeeming Hedge Fund investments, the agreements governing the investment often require advanced notice and may restrict the timing of withdrawals. Hedge Fund agreements can also include “lock-up” periods, which restrict investors from redeeming their investment during a specified time frame. The lock-up period helps portfolio managers mitigate liquidity risks. Lock-ups can be “hard,” where redemptions are not permitted for a specified time period, or “soft,” where redemptions are permitted provided the investor pays a penalty. In certain instances, a fund may have both hard and soft lock-up restrictions in place. In addition, hedge fund managers can also institute a “rolling” lock-up. A fund with a rolling lock-up period requires investors to commit to an initial lock-up period, and, if the investor does not submit a redemption notice within a set time prior to expiration of the lock-up, the lock-up is reset.
Similar to lock-ups, Hedge Fund agreements also commonly incorporate “gate” restrictions. An investor-level gate limits redemption on a particular redemption date to a specified percentage of the investor’s account value, while a fund-level gate may limit total investor withdrawals on a particular redemption date to a percentage of aggregated fund-level (or master fund- level) net asset value. In certain instances, funds can have both investor- and fund-level gates in place.
The WRS participated in the following Hedge Fund strategies at December 31, 2019:
Equity Long-Short – This strategy invests both long and short in publicly-traded stocks. These managers vary in their use of short selling and leverage.
Event-Driven – The funds in this strategy seek to gain an advantage from pricing inefficiencies that may occur before or after a corporate action or related event, such as a merger, spinoff, earnings call, bankruptcy, or restructuring.
Tactical Trading – The funds in this category invest their holdings in indexes, commodities, interest rate instruments, and currencies as a result of relative value or directional forecasts from a systematic or discretionary approach.
Relative Value – This strategy uses a range of fixed income arbitrage, long/short credit, and/or quantitative strategies that seek to take advantage of price differentials.
Multistrategy – The funds in this category employ a wide range of strategies and instruments in managing assets.
Credit Risk
Credit risk is the risk that an issuer or other counterparty to an investment will not fulfill its obligations.
Primary Government (excluding the UWS, WRS and SIF)
The primary government, except for the Separately Managed Funds discussed later, follows Wisconsin Statutes, program policy provisions, appropriate governing boards, and general resolutions contained in revenue bond indenture documents limits investments in public housing bonds issued by public agencies or municipalities, the State of Wisconsin, interest-bearing time deposits, certificates of deposit or other similar banking arrangement, shares of a diversified open-end management investment company repurchase agreements and investment agreements to a rating no lower than the rating assigned to the bonds. Investments in all other permitted debt securities are required to bear the highest rating available from each nationally recognized rating agency. In addition, credit risk of certain funds such as the Retiree Life Insurance Fund is minimized by monitoring portfolio diversification by asset class, creditor and industry and by complying with investment limitations governed by insurance laws and regulations.
Regarding the Separately Managed Funds, investment guidelines require that the bond portfolios shall maintain an average quality rating of A- or better at time of purchase, using the lower of split ratings at the time of purchase.
Investment credit quality ratings as of June 30, 2020, from Standard and Poor’s, Moody’s Investors Service, and Fitch Ratings are presented below using the Standard and Poor’s rating scale (in millions):
Primary Government(excluding the UWS, WRS, SIF and Separately Managed
Funds)
Credit Quality Ratings Fair Value
AAA $ 631.6
AA 170.9
A 24.8
Not Rated 58.0
Total $ 885.3
State of Wisconsin Notes to The Financial Statements
For the Fiscal Year Ended June 30, 2020
87
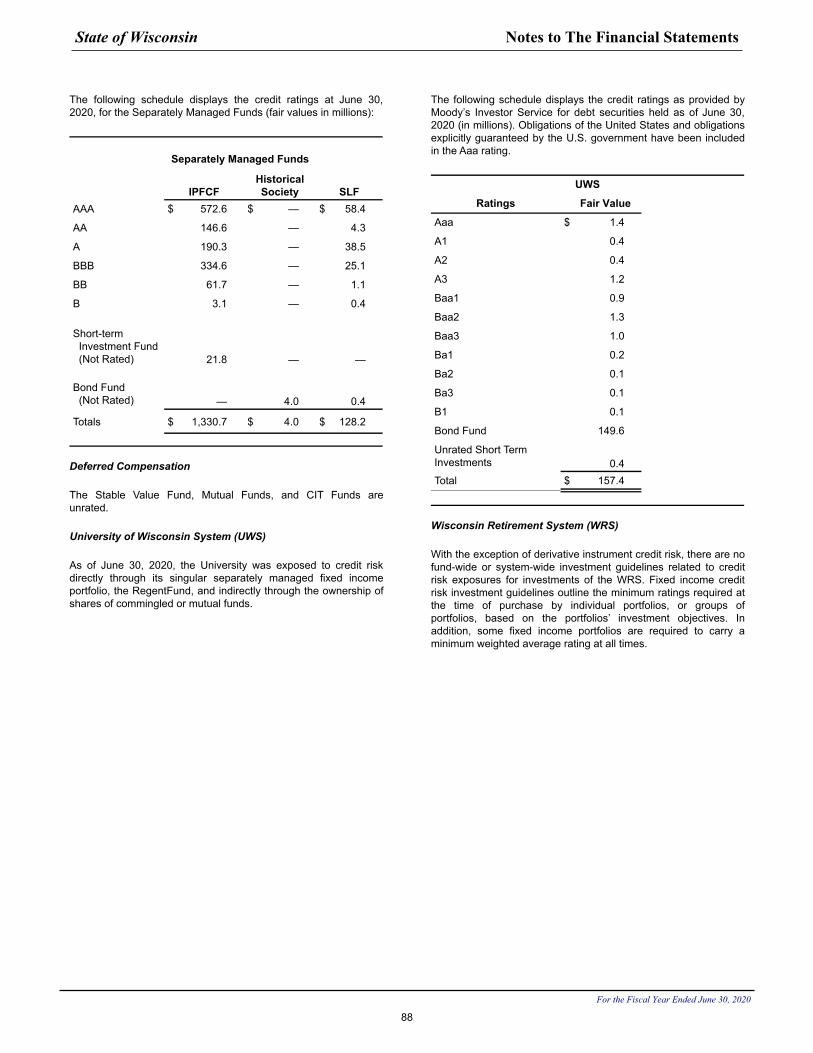
The following schedule displays the credit ratings at June 30, 2020, for the Separately Managed Funds (fair values in millions):
Separately Managed Funds
IPFCFHistorical Society SLF
AAA $ 572.6 $ — $ 58.4
AA 146.6 — 4.3
A 190.3 — 38.5
BBB 334.6 — 25.1
BB 61.7 — 1.1
B 3.1 — 0.4
Short-term Investment Fund (Not Rated) 21.8 — —
Bond Fund (Not Rated) — 4.0 0.4
Totals $ 1,330.7 $ 4.0 $ 128.2
Deferred Compensation
The Stable Value Fund, Mutual Funds, and CIT Funds are unrated.
University of Wisconsin System (UWS)
As of June 30, 2020, the University was exposed to credit risk directly through its singular separately managed fixed income portfolio, the RegentFund, and indirectly through the ownership of shares of commingled or mutual funds.
The following schedule displays the credit ratings as provided by Moody’s Investor Service for debt securities held as of June 30, 2020 (in millions). Obligations of the United States and obligations explicitly guaranteed by the U.S. government have been included in the Aaa rating.
UWS
Ratings Fair Value
Aaa $ 1.4
A1 0.4
A2 0.4
A3 1.2
Baa1 0.9
Baa2 1.3
Baa3 1.0
Ba1 0.2
Ba2 0.1
Ba3 0.1
B1 0.1
Bond Fund 149.6
Unrated Short Term Investments 0.4 Total $ 157.4
Wisconsin Retirement System (WRS)
With the exception of derivative instrument credit risk, there are no fund-wide or system-wide investment guidelines related to credit risk exposures for investments of the WRS. Fixed income credit risk investment guidelines outline the minimum ratings required at the time of purchase by individual portfolios, or groups of portfolios, based on the portfolios’ investment objectives. In addition, some fixed income portfolios are required to carry a minimum weighted average rating at all times.
State of Wisconsin Notes to The Financial Statements
For the Fiscal Year Ended June 30, 2020
88
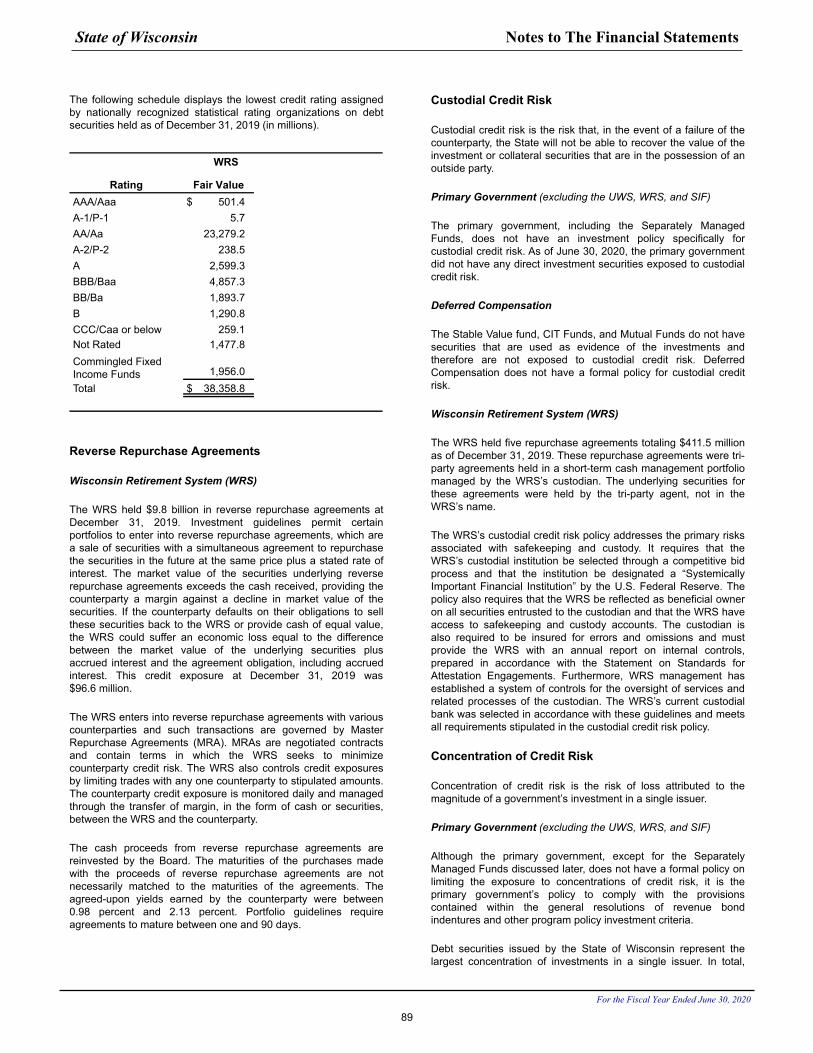
The following schedule displays the lowest credit rating assigned by nationally recognized statistical rating organizations on debt securities held as of December 31, 2019 (in millions).
WRS
Rating Fair ValueAAA/Aaa $ 501.4 A-1/P-1 5.7 AA/Aa 23,279.2 A-2/P-2 238.5 A 2,599.3 BBB/Baa 4,857.3 BB/Ba 1,893.7 B 1,290.8 CCC/Caa or below 259.1 Not Rated 1,477.8 Commingled Fixed Income Funds 1,956.0 Total $ 38,358.8
Reverse Repurchase Agreements
Wisconsin Retirement System (WRS)
The WRS held $9.8 billion in reverse repurchase agreements at December 31, 2019. Investment guidelines permit certain portfolios to enter into reverse repurchase agreements, which are a sale of securities with a simultaneous agreement to repurchase the securities in the future at the same price plus a stated rate of interest. The market value of the securities underlying reverse repurchase agreements exceeds the cash received, providing the counterparty a margin against a decline in market value of the securities. If the counterparty defaults on their obligations to sell these securities back to the WRS or provide cash of equal value, the WRS could suffer an economic loss equal to the difference between the market value of the underlying securities plus accrued interest and the agreement obligation, including accrued interest. This credit exposure at December 31, 2019 was $96.6 million.
The WRS enters into reverse repurchase agreements with various counterparties and such transactions are governed by Master Repurchase Agreements (MRA). MRAs are negotiated contracts and contain terms in which the WRS seeks to minimize counterparty credit risk. The WRS also controls credit exposures by limiting trades with any one counterparty to stipulated amounts. The counterparty credit exposure is monitored daily and managed through the transfer of margin, in the form of cash or securities, between the WRS and the counterparty.
The cash proceeds from reverse repurchase agreements are reinvested by the Board. The maturities of the purchases made with the proceeds of reverse repurchase agreements are not necessarily matched to the maturities of the agreements. The agreed-upon yields earned by the counterparty were between 0.98 percent and 2.13 percent. Portfolio guidelines require agreements to mature between one and 90 days.
Custodial Credit Risk
Custodial credit risk is the risk that, in the event of a failure of the counterparty, the State will not be able to recover the value of the investment or collateral securities that are in the possession of an outside party.
Primary Government (excluding the UWS, WRS, and SIF)
The primary government, including the Separately Managed Funds, does not have an investment policy specifically for custodial credit risk. As of June 30, 2020, the primary government did not have any direct investment securities exposed to custodial credit risk.
Deferred Compensation
The Stable Value fund, CIT Funds, and Mutual Funds do not have securities that are used as evidence of the investments and therefore are not exposed to custodial credit risk. Deferred Compensation does not have a formal policy for custodial credit risk.
Wisconsin Retirement System (WRS)
The WRS held five repurchase agreements totaling $411.5 million as of December 31, 2019. These repurchase agreements were tri-party agreements held in a short-term cash management portfolio managed by the WRS’s custodian. The underlying securities for these agreements were held by the tri-party agent, not in the WRS’s name.
The WRS’s custodial credit risk policy addresses the primary risks associated with safekeeping and custody. It requires that the WRS’s custodial institution be selected through a competitive bid process and that the institution be designated a “Systemically Important Financial Institution” by the U.S. Federal Reserve. The policy also requires that the WRS be reflected as beneficial owner on all securities entrusted to the custodian and that the WRS have access to safekeeping and custody accounts. The custodian is also required to be insured for errors and omissions and must provide the WRS with an annual report on internal controls, prepared in accordance with the Statement on Standards for Attestation Engagements. Furthermore, WRS management has established a system of controls for the oversight of services and related processes of the custodian. The WRS’s current custodial bank was selected in accordance with these guidelines and meets all requirements stipulated in the custodial credit risk policy.
Concentration of Credit Risk
Concentration of credit risk is the risk of loss attributed to the magnitude of a government’s investment in a single issuer.
Primary Government (excluding the UWS, WRS, and SIF)
Although the primary government, except for the Separately Managed Funds discussed later, does not have a formal policy on limiting the exposure to concentrations of credit risk, it is the primary government’s policy to comply with the provisions contained within the general resolutions of revenue bond indentures and other program policy investment criteria.
Debt securities issued by the State of Wisconsin represent the largest concentration of investments in a single issuer. In total,
State of Wisconsin Notes to The Financial Statements
For the Fiscal Year Ended June 30, 2020
89
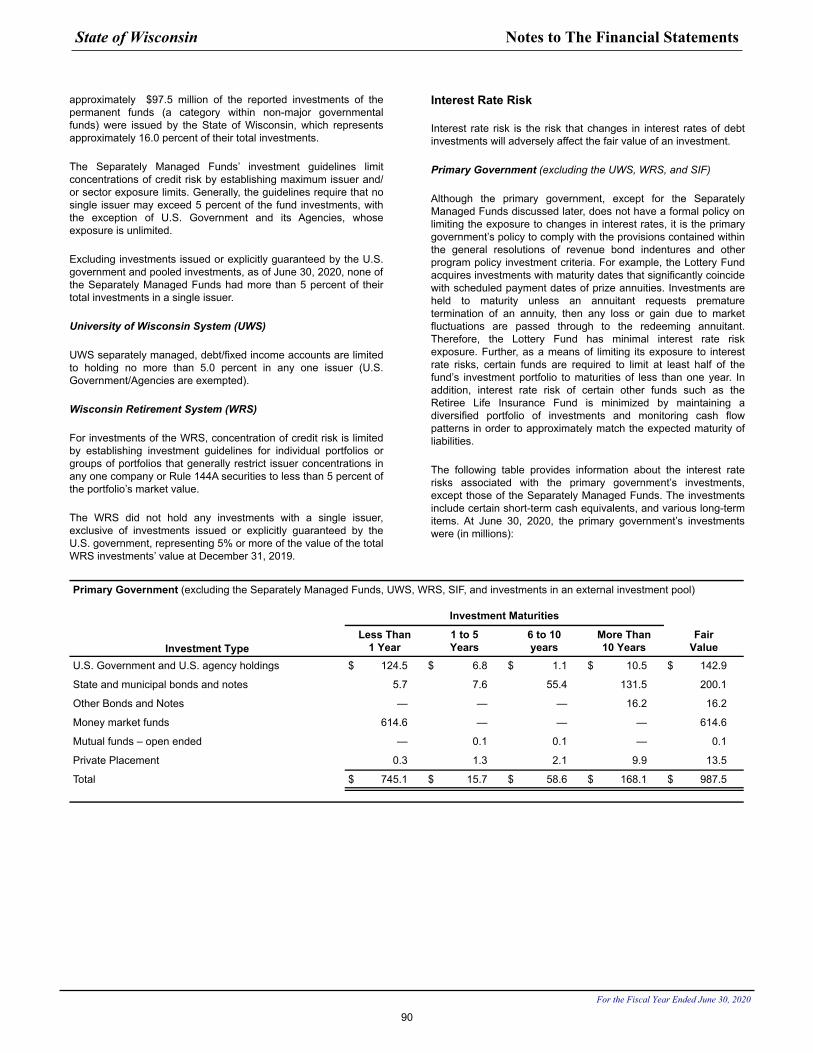
approximately $97.5 million of the reported investments of the permanent funds (a category within non-major governmental funds) were issued by the State of Wisconsin, which represents approximately 16.0 percent of their total investments.
The Separately Managed Funds’ investment guidelines limit concentrations of credit risk by establishing maximum issuer and/or sector exposure limits. Generally, the guidelines require that no single issuer may exceed 5 percent of the fund investments, with the exception of U.S. Government and its Agencies, whose exposure is unlimited.
Excluding investments issued or explicitly guaranteed by the U.S. government and pooled investments, as of June 30, 2020, none of the Separately Managed Funds had more than 5 percent of their total investments in a single issuer.
University of Wisconsin System (UWS)
UWS separately managed, debt/fixed income accounts are limited to holding no more than 5.0 percent in any one issuer (U.S. Government/Agencies are exempted).
Wisconsin Retirement System (WRS)
For investments of the WRS, concentration of credit risk is limited by establishing investment guidelines for individual portfolios or groups of portfolios that generally restrict issuer concentrations in any one company or Rule 144A securities to less than 5 percent of the portfolio’s market value.
The WRS did not hold any investments with a single issuer, exclusive of investments issued or explicitly guaranteed by the U.S. government, representing 5% or more of the value of the total WRS investments’ value at December 31, 2019.
Interest Rate Risk
Interest rate risk is the risk that changes in interest rates of debt investments will adversely affect the fair value of an investment.
Primary Government (excluding the UWS, WRS, and SIF)
Although the primary government, except for the Separately Managed Funds discussed later, does not have a formal policy on limiting the exposure to changes in interest rates, it is the primary government’s policy to comply with the provisions contained within the general resolutions of revenue bond indentures and other program policy investment criteria. For example, the Lottery Fund acquires investments with maturity dates that significantly coincide with scheduled payment dates of prize annuities. Investments are held to maturity unless an annuitant requests premature termination of an annuity, then any loss or gain due to market fluctuations are passed through to the redeeming annuitant. Therefore, the Lottery Fund has minimal interest rate risk exposure. Further, as a means of limiting its exposure to interest rate risks, certain funds are required to limit at least half of the fund’s investment portfolio to maturities of less than one year. In addition, interest rate risk of certain other funds such as the Retiree Life Insurance Fund is minimized by maintaining a diversified portfolio of investments and monitoring cash flow patterns in order to approximately match the expected maturity of liabilities.
The following table provides information about the interest rate risks associated with the primary government’s investments, except those of the Separately Managed Funds. The investments include certain short-term cash equivalents, and various long-term items. At June 30, 2020, the primary government’s investments were (in millions):
Primary Government (excluding the Separately Managed Funds, UWS, WRS, SIF, and investments in an external investment pool)
Investment Maturities
Investment TypeLess Than
1 Year1 to 5 Years
6 to 10 years
More Than 10 Years
Fair Value
U.S. Government and U.S. agency holdings $ 124.5 $ 6.8 $ 1.1 $ 10.5 $ 142.9
State and municipal bonds and notes 5.7 7.6 55.4 131.5 200.1
Other Bonds and Notes — — — 16.2 16.2
Money market funds 614.6 — — — 614.6
Mutual funds – open ended — 0.1 0.1 — 0.1
Private Placement 0.3 1.3 2.1 9.9 13.5
Total $ 745.1 $ 15.7 $ 58.6 $ 168.1 $ 987.5
State of Wisconsin Notes to The Financial Statements
For the Fiscal Year Ended June 30, 2020
90
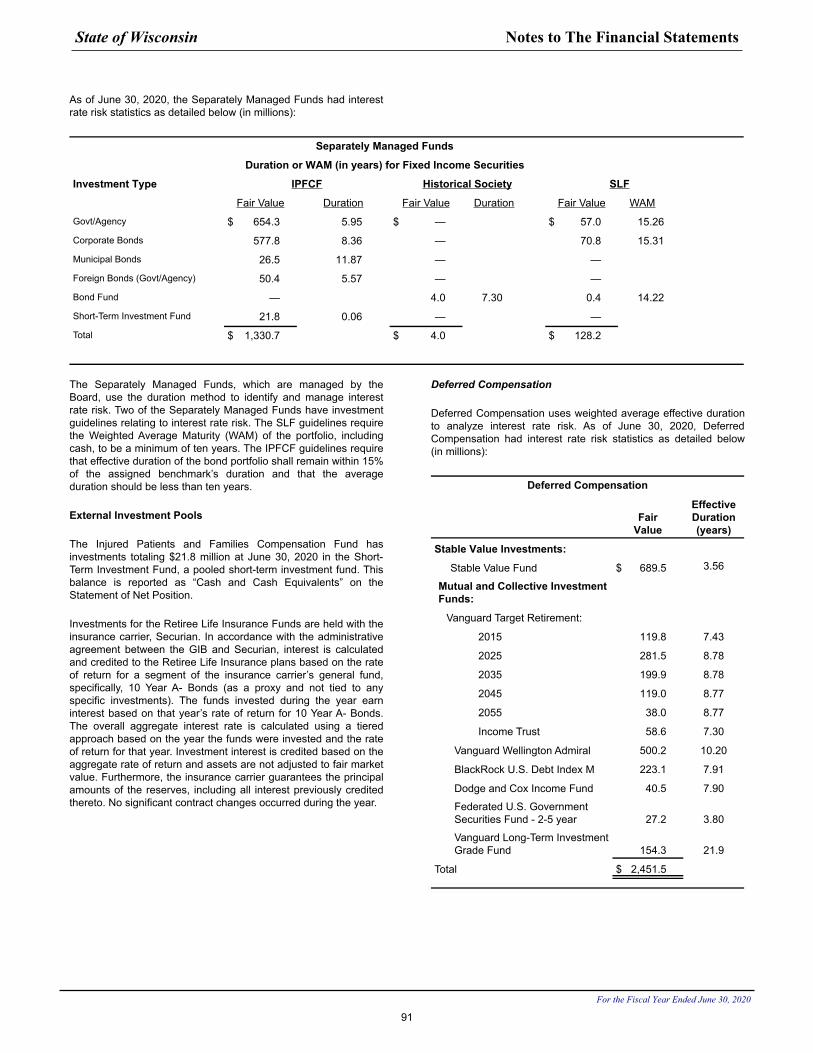
As of June 30, 2020, the Separately Managed Funds had interest rate risk statistics as detailed below (in millions):
Separately Managed Funds
Duration or WAM (in years) for Fixed Income Securities
Investment Type IPFCF Historical Society SLF
Fair Value Duration Fair Value Duration Fair Value WAM
Govt/Agency $ 654.3 5.95 $ — $ 57.0 15.26
Corporate Bonds 577.8 8.36 — 70.8 15.31
Municipal Bonds 26.5 11.87 — —
Foreign Bonds (Govt/Agency) 50.4 5.57 — —
Bond Fund — 4.0 7.30 0.4 14.22
Short-Term Investment Fund 21.8 0.06 — —
Total $ 1,330.7 $ 4.0 $ 128.2
The Separately Managed Funds, which are managed by the Board, use the duration method to identify and manage interest rate risk. Two of the Separately Managed Funds have investment guidelines relating to interest rate risk. The SLF guidelines require the Weighted Average Maturity (WAM) of the portfolio, including cash, to be a minimum of ten years. The IPFCF guidelines require that effective duration of the bond portfolio shall remain within 15% of the assigned benchmark’s duration and that the average duration should be less than ten years.
External Investment Pools
The Injured Patients and Families Compensation Fund has investments totaling $21.8 million at June 30, 2020 in the Short- Term Investment Fund, a pooled short-term investment fund. This balance is reported as “Cash and Cash Equivalents” on the Statement of Net Position.
Investments for the Retiree Life Insurance Funds are held with the insurance carrier, Securian. In accordance with the administrative agreement between the GIB and Securian, interest is calculated and credited to the Retiree Life Insurance plans based on the rate of return for a segment of the insurance carrier’s general fund, specifically, 10 Year A- Bonds (as a proxy and not tied to any specific investments). The funds invested during the year earn interest based on that year’s rate of return for 10 Year A- Bonds. The overall aggregate interest rate is calculated using a tiered approach based on the year the funds were invested and the rate of return for that year. Investment interest is credited based on the aggregate rate of return and assets are not adjusted to fair market value. Furthermore, the insurance carrier guarantees the principal amounts of the reserves, including all interest previously credited thereto. No significant contract changes occurred during the year.
Deferred Compensation
Deferred Compensation uses weighted average effective duration to analyze interest rate risk. As of June 30, 2020, Deferred Compensation had interest rate risk statistics as detailed below (in millions):
Deferred Compensation
FairValue
EffectiveDuration (years)
Stable Value Investments:
Stable Value Fund $ 689.5 3.56
Mutual and Collective Investment Funds:
Vanguard Target Retirement:
2015 119.8 7.43
2025 281.5 8.78
2035 199.9 8.78
2045 119.0 8.77
2055 38.0 8.77
Income Trust 58.6 7.30
Vanguard Wellington Admiral 500.2 10.20
BlackRock U.S. Debt Index M 223.1 7.91
Dodge and Cox Income Fund 40.5 7.90
Federated U.S. Government Securities Fund - 2-5 year 27.2 3.80
Vanguard Long-Term Investment Grade Fund 154.3 21.9
Total $ 2,451.5
State of Wisconsin Notes to The Financial Statements
For the Fiscal Year Ended June 30, 2020
91
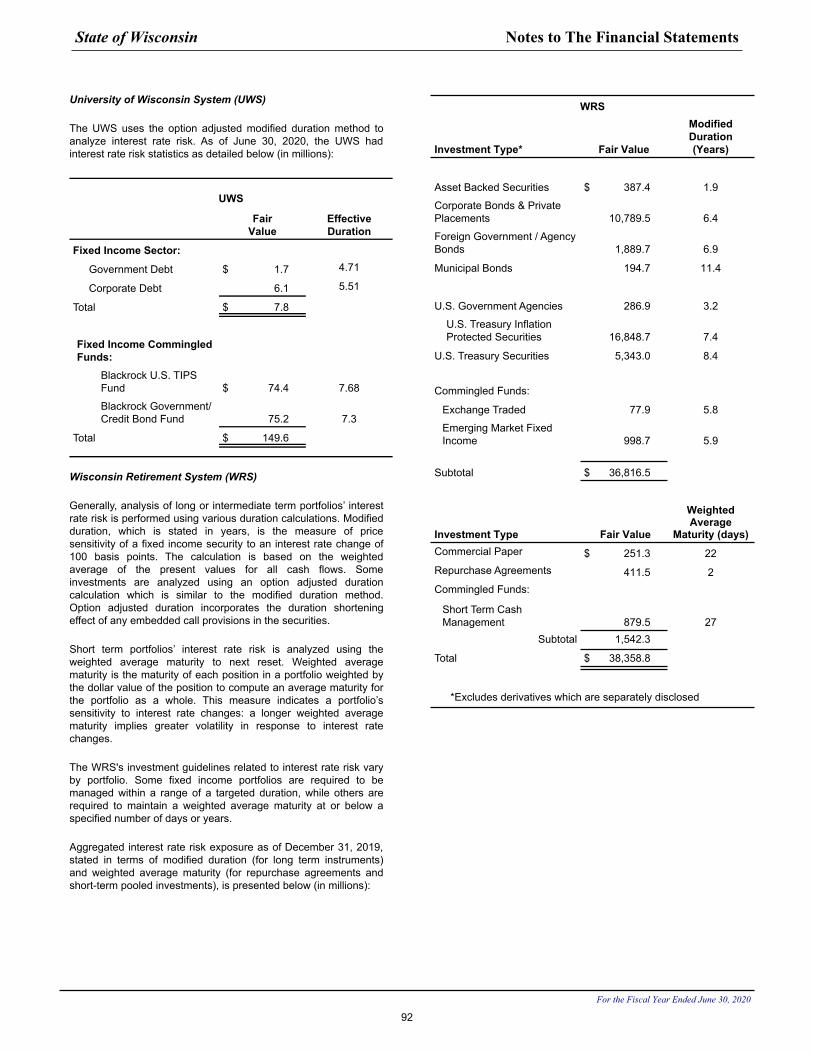
University of Wisconsin System (UWS)
The UWS uses the option adjusted modified duration method to analyze interest rate risk. As of June 30, 2020, the UWS had interest rate risk statistics as detailed below (in millions):
UWS
FairValue
EffectiveDuration
Fixed Income Sector:
Government Debt $ 1.7 4.71
Corporate Debt 6.1 5.51
Total $ 7.8
Fixed Income Commingled Funds:
Blackrock U.S. TIPS Fund $ 74.4 7.68
Blackrock Government/Credit Bond Fund 75.2 7.3
Total $ 149.6
Wisconsin Retirement System (WRS)
Generally, analysis of long or intermediate term portfolios’ interest rate risk is performed using various duration calculations. Modified duration, which is stated in years, is the measure of price sensitivity of a fixed income security to an interest rate change of 100 basis points. The calculation is based on the weighted average of the present values for all cash flows. Some investments are analyzed using an option adjusted duration calculation which is similar to the modified duration method. Option adjusted duration incorporates the duration shortening effect of any embedded call provisions in the securities.
Short term portfolios’ interest rate risk is analyzed using the weighted average maturity to next reset. Weighted average maturity is the maturity of each position in a portfolio weighted by the dollar value of the position to compute an average maturity for the portfolio as a whole. This measure indicates a portfolio’s sensitivity to interest rate changes: a longer weighted average maturity implies greater volatility in response to interest rate changes.
The WRS's investment guidelines related to interest rate risk vary by portfolio. Some fixed income portfolios are required to be managed within a range of a targeted duration, while others are required to maintain a weighted average maturity at or below a specified number of days or years.
Aggregated interest rate risk exposure as of December 31, 2019, stated in terms of modified duration (for long term instruments) and weighted average maturity (for repurchase agreements and short-term pooled investments), is presented below (in millions):
WRS
Investment Type* Fair Value
ModifiedDuration (Years)
Asset Backed Securities $ 387.4 1.9
Corporate Bonds & Private Placements 10,789.5 6.4
Foreign Government / Agency Bonds 1,889.7 6.9
Municipal Bonds 194.7 11.4
U.S. Government Agencies 286.9 3.2
U.S. Treasury Inflation Protected Securities 16,848.7 7.4
U.S. Treasury Securities 5,343.0 8.4
Commingled Funds:
Exchange Traded 77.9 5.8
Emerging Market Fixed Income 998.7 5.9
Subtotal $ 36,816.5
Investment Type Fair Value
Weighted Average
Maturity (days)Commercial Paper $ 251.3 22Repurchase Agreements 411.5 2Commingled Funds:
Short Term Cash Management 879.5 27
Subtotal 1,542.3
Total $ 38,358.8
*Excludes derivatives which are separately disclosed
State of Wisconsin Notes to The Financial Statements
For the Fiscal Year Ended June 30, 2020
92
Foreign Currency Risk
Foreign currency risk is the risk that changes in exchange rates will adversely impact the fair value of an investment.
Primary Government (excluding the UWS, WRS, and SIF)
The primary government, except for the Separately Managed Funds discussed later, does not have a formal policy to limit foreign currency risk, however, certain funds such as the Environmental Improvement Fund are not permitted to invest in foreign currency based on provisions contained in its bond indenture general resolution. However, foreign currency risk of the Retiree Life Insurance Fund is minimized by utilizing short- duration spot forward contracts to minimize the adverse impact of foreign currency exchange rate risks inherent in the elapsed time between trade processing and trade settlement. At June 30, 2020, the primary government, excluding the Separately Managed Funds, did not own any issues denominated in a foreign currency.
The Separately Managed Funds’ investment guidelines do not specifically address foreign currency risk with the exception that the SLF only allows investments in U.S. dollar denominated instruments. As of June 30, 2020, the Separately Managed Funds did not directly own any issues denominated in a foreign currency.
Deferred Compensation
Deferred Compensation allows the option of investments in Mutual Funds and CIT Funds that make investments in foreign securities. The fair value of these investments was $385.3 million as of December 31, 2019.
University of Wisconsin System (UWS)
The UWS held positions only in passively-managed, indexed commingled funds which may invest in securities denominated in foreign currencies. However, the fund used for exposure to developed market equities generally seeks to hedge against the variations in returns deriving solely from the value of the foreign currencies in the fund relative to the U.S. dollar. The fund used for exposure to emerging market equities generally does not engage in similar foreign currency hedging efforts, due largely to the high cost and more limited efficacy of such hedging. Deposits in foreign currency for the RegentFund at June 30, 2020 are immaterial.
State of Wisconsin Notes to The Financial Statements
For the Fiscal Year Ended June 30, 2020
93
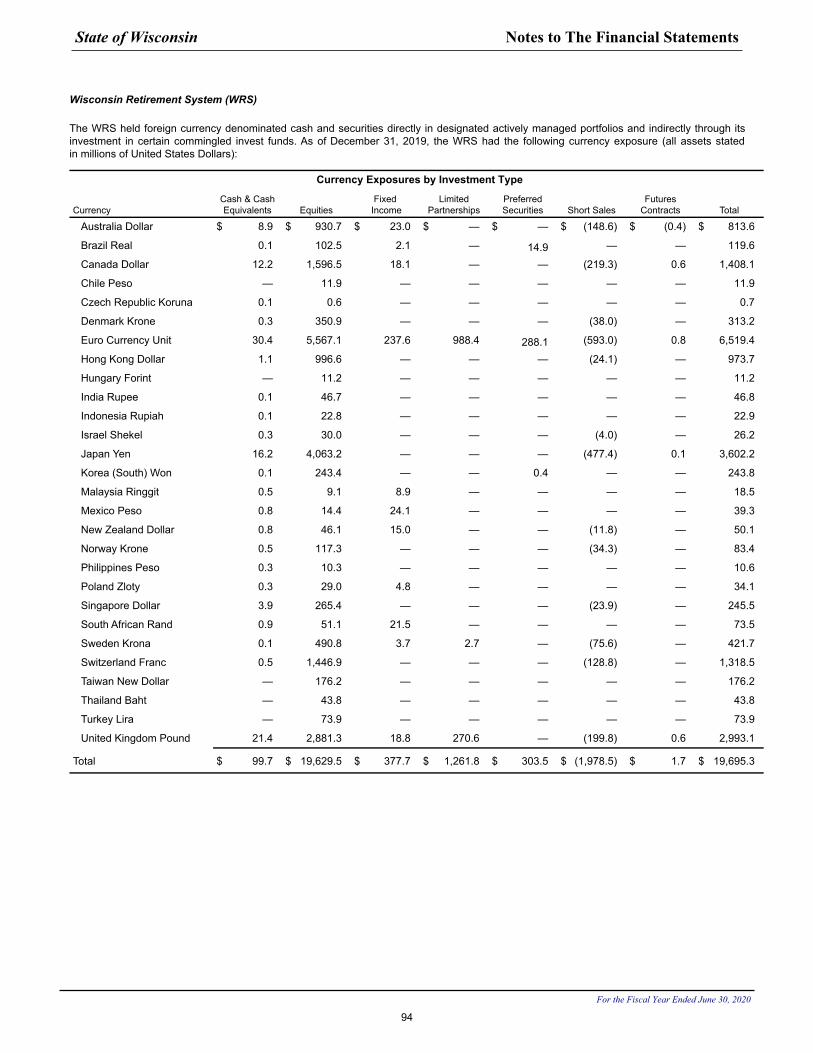
Wisconsin Retirement System (WRS)
The WRS held foreign currency denominated cash and securities directly in designated actively managed portfolios and indirectly through its investment in certain commingled invest funds. As of December 31, 2019, the WRS had the following currency exposure (all assets stated in millions of United States Dollars):
Currency Exposures by Investment Type
CurrencyCash & Cash Equivalents Equities
Fixed Income
Limited Partnerships
Preferred Securities Short Sales
Futures Contracts Total
Australia Dollar $ 8.9 $ 930.7 $ 23.0 $ — $ — $ (148.6) $ (0.4) $ 813.6
Brazil Real 0.1 102.5 2.1 — 14.9 — — 119.6
Canada Dollar 12.2 1,596.5 18.1 — — (219.3) 0.6 1,408.1
Chile Peso — 11.9 — — — — — 11.9
Czech Republic Koruna 0.1 0.6 — — — — — 0.7
Denmark Krone 0.3 350.9 — — — (38.0) — 313.2
Euro Currency Unit 30.4 5,567.1 237.6 988.4 288.1 (593.0) 0.8 6,519.4
Hong Kong Dollar 1.1 996.6 — — — (24.1) — 973.7
Hungary Forint — 11.2 — — — — — 11.2
India Rupee 0.1 46.7 — — — — — 46.8
Indonesia Rupiah 0.1 22.8 — — — — — 22.9
Israel Shekel 0.3 30.0 — — — (4.0) — 26.2
Japan Yen 16.2 4,063.2 — — — (477.4) 0.1 3,602.2
Korea (South) Won 0.1 243.4 — — 0.4 — — 243.8
Malaysia Ringgit 0.5 9.1 8.9 — — — — 18.5
Mexico Peso 0.8 14.4 24.1 — — — — 39.3
New Zealand Dollar 0.8 46.1 15.0 — — (11.8) — 50.1
Norway Krone 0.5 117.3 — — — (34.3) — 83.4
Philippines Peso 0.3 10.3 — — — — — 10.6
Poland Zloty 0.3 29.0 4.8 — — — — 34.1
Singapore Dollar 3.9 265.4 — — — (23.9) — 245.5
South African Rand 0.9 51.1 21.5 — — — — 73.5
Sweden Krona 0.1 490.8 3.7 2.7 — (75.6) — 421.7
Switzerland Franc 0.5 1,446.9 — — — (128.8) — 1,318.5
Taiwan New Dollar — 176.2 — — — — — 176.2
Thailand Baht — 43.8 — — — — — 43.8
Turkey Lira — 73.9 — — — — — 73.9
United Kingdom Pound 21.4 2,881.3 18.8 270.6 — (199.8) 0.6 2,993.1
Total $ 99.7 $ 19,629.5 $ 377.7 $ 1,261.8 $ 303.5 $ (1,978.5) $ 1.7 $ 19,695.3
State of Wisconsin Notes to The Financial Statements
For the Fiscal Year Ended June 30, 2020
94
Securities Lending Transactions
University of Wisconsin System (UWS)
The UWS has an agreement with BlackRock Institutional Trust Company, N.A., which acts as custodian for the University's Long Term Fund investments and authorizes the bank to lend securities held in UWS accounts to third parties. The bank must obtain collateral from the borrower, or acceptable securities. When UWS securities are delivered to a borrower as part of a securities lending arrangement, the borrower is required to place collateral with the lending agent equal to at least 102% of the loaned securities' fair value, including interest accrued, as of the delivery date. Both the collateral and the securities loaned are marked to market on a daily basis, with additional collateral obtained or refunded as necessary. In the event that the loaned securities are not returned by the borrower, the bank will, at its own expense, either replace the loaned securities or, if unable to purchase those securities on the open market, credit UWS accounts with cash equal to the fair value of the loaned securities.
The UWS receives 75 percent of the net revenue derived from all securities lending activities and the bank receives the remainder of the net revenue. Interest and dividend income earned in conjunction with the securities lending program is reported as part of non-operating investment income in the Statement of Revenues, Expenses, and Changes in Net Position.
Although the UWS securities lending activities are collateralized as described above, the securities lending program involves both market and credit risk. In this context, market risk refers to the possibility that the borrower of securities will be unable to collateralize the loan upon a sudden material change in the fair value of the loaned securities or the collateral, or that the bank's investment of collateral received from the borrowers of UWS securities may be subject to unfavorable market fluctuations. Credit risk refers to the possibility that counterparties involved in the securities lending program may fail to perform in accordance with the terms of their contracts.
At June 30, 2020, the fair value of securities loaned, was $106.8 million. Collateral received consisted of $109.4 million in cash and $0.3 million in non-cash collateral. In accordance with accounting standards the value of the collateral held and a corresponding liability to return the collateral have been reported on the accompanying Statement of Net Position.
Wisconsin Retirement System (WRS)
State statutes and Board policies permit the use of investments of the WRS to enter into securities lending transactions. These transactions involve the lending of securities to broker-dealers and other entities in exchange for collateral, in the form of cash or securities, with the simultaneous agreement to return the collateral for identical securities in the future. The securities custodian is an agent in lending the directly-held domestic and international securities. When securities are delivered to a borrower as part of a securities lending agreement, the borrower is required to place collateral equal to at least 102 percent of the loaned securities' fair value, including interest accrued, as of the delivery date with the lending agent. In the event that securities are loaned against collateral denominated in a different currency, the borrower is required to place collateral totaling 105 percent of the loaned securities’ fair value, including interest accrued, as of the delivery date with the lending agent. Collateral is marked to market daily and adjusted as needed to maintain the required minimum level.
On December 31, 2019, the fair value of the securities on loan to counterparties was approximately $12.0 billion.
Cash collateral is reinvested by the lending agent in two separate pools, a U.S. dollar cash collateral pool and a pool denominated in Euros, in accordance with contractual investment guidelines, which are designed to minimize the risk of principal loss and provide a modest rate of return. Investment guidelines limit credit and liquidity risk by restricting new investments to overnight repurchase agreements collateralized with high quality U.S. government, U.S. government agencies, and sovereign debt securities. The earnings generated from the collateral investments, plus or minus the rebates received from or paid to the dealers and less fees paid to agents, results in the net earnings from lending activities, which are then split on a percentage basis with the lending agent. Cash from the U.S. dollar pool may be posted as collateral relating to short sale transactions and earns the Overnight Bank Funding rate plus 10 basis points.
At December 31, 2019, the WRS had minimal credit risk exposure to borrowers because loans are collateralized in excess of 100%. In addition to the cash collateral reinvestment indemnification, the contract with the lending agent requires it to indemnify the WRS if the borrowers fail to return the loaned securities and the collateral is inadequate to replace the securities lent. The WRS is also indemnified against losses resulting from violations of investment guidelines.
The majority of security loans are open-ended and can be terminated on demand by the WRS or the borrower. Maturities of investments made with cash collateral are not necessarily matched to the maturities of the securities loaned because most loans do not have a fixed maturity date. The risk that the WRS would be unable to return collateral to securities borrowers upon termination of the loan is mitigated by the highly liquid nature of investments held in the collateral reinvestment pools. The average maturities of the loans and the average maturities of the assets held in the collateral reinvestment pools were similar at December 31, 2019.
Securities lending is allowed in certain commingled fund investments. As an investor in such funds, the WRS does not own the underlying securities and does not separately report on securities lending activity. All earnings of these funds are reported in the Statement of Changes in Fiduciary Net Position.
Derivative Instruments
Wisconsin Retirement System (WRS)
Derivatives may be used to implement investment strategies for the Core and Variable Funds. All derivative instruments are subjected to risk analysis and monitoring processes at the portfolio, asset class and fund levels. Investment guidelines define allowable derivative activity for each portfolio and are based on the investment objectives which have been approved by the Board. Where derivatives are permitted, guidelines stipulate allowable instruments and the manner and degree to which they are to be used.
Gains and losses for all derivative instruments are reported in the Statement of Changes in Fiduciary Net Position.
The WRS seeks to mitigate counterparty credit risk through counterparty credit evaluations and approvals, counterparty credit limits, and exposure monitoring procedures. Additionally, policies
State of Wisconsin Notes to The Financial Statements
For the Fiscal Year Ended June 30, 2020
95
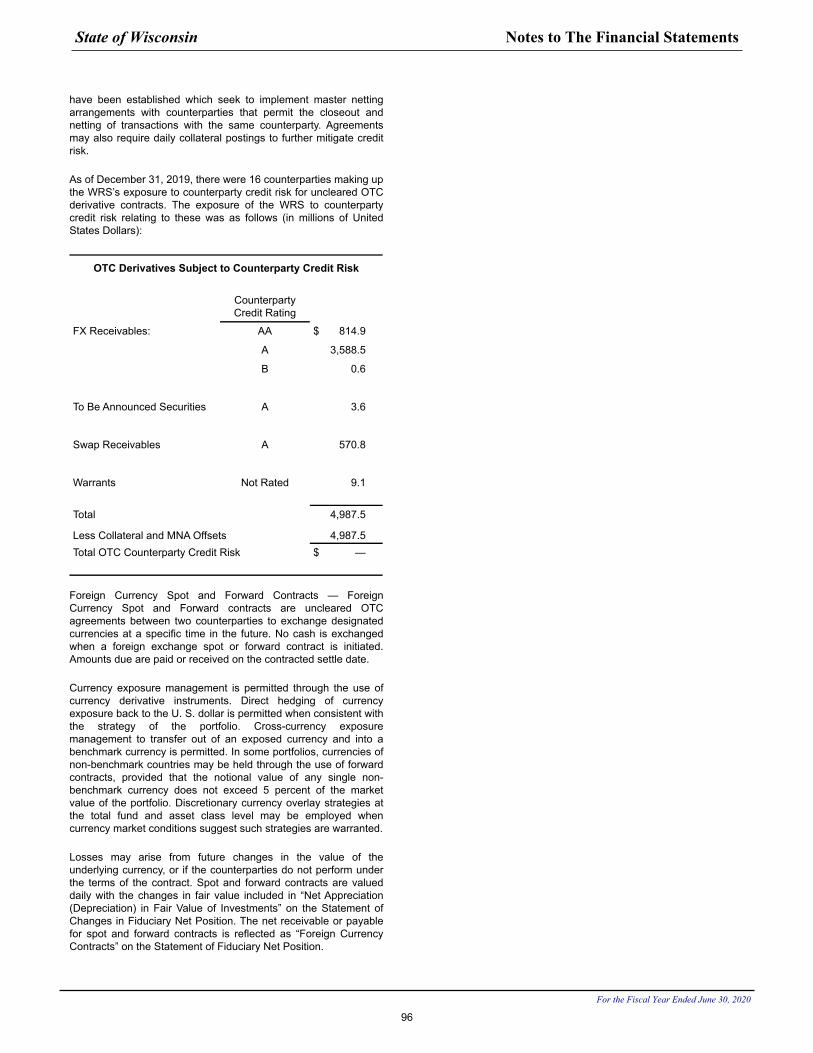
have been established which seek to implement master netting arrangements with counterparties that permit the closeout and netting of transactions with the same counterparty. Agreements may also require daily collateral postings to further mitigate credit risk.
As of December 31, 2019, there were 16 counterparties making up the WRS’s exposure to counterparty credit risk for uncleared OTC derivative contracts. The exposure of the WRS to counterparty credit risk relating to these was as follows (in millions of United States Dollars):
OTC Derivatives Subject to Counterparty Credit Risk
Counterparty Credit Rating
FX Receivables: AA $ 814.9
A 3,588.5
B 0.6
To Be Announced Securities A 3.6
Swap Receivables A 570.8
Warrants Not Rated 9.1
Total 4,987.5
Less Collateral and MNA Offsets 4,987.5 Total OTC Counterparty Credit Risk $ —
Foreign Currency Spot and Forward Contracts — Foreign Currency Spot and Forward contracts are uncleared OTC agreements between two counterparties to exchange designated currencies at a specific time in the future. No cash is exchanged when a foreign exchange spot or forward contract is initiated. Amounts due are paid or received on the contracted settle date.
Currency exposure management is permitted through the use of currency derivative instruments. Direct hedging of currency exposure back to the U. S. dollar is permitted when consistent with the strategy of the portfolio. Cross-currency exposure management to transfer out of an exposed currency and into a benchmark currency is permitted. In some portfolios, currencies of non-benchmark countries may be held through the use of forward contracts, provided that the notional value of any single non-benchmark currency does not exceed 5 percent of the market value of the portfolio. Discretionary currency overlay strategies at the total fund and asset class level may be employed when currency market conditions suggest such strategies are warranted.
Losses may arise from future changes in the value of the underlying currency, or if the counterparties do not perform under the terms of the contract. Spot and forward contracts are valued daily with the changes in fair value included in “Net Appreciation (Depreciation) in Fair Value of Investments” on the Statement of Changes in Fiduciary Net Position. The net receivable or payable for spot and forward contracts is reflected as “Foreign Currency Contracts” on the Statement of Fiduciary Net Position.
State of Wisconsin Notes to The Financial Statements
For the Fiscal Year Ended June 30, 2020
96
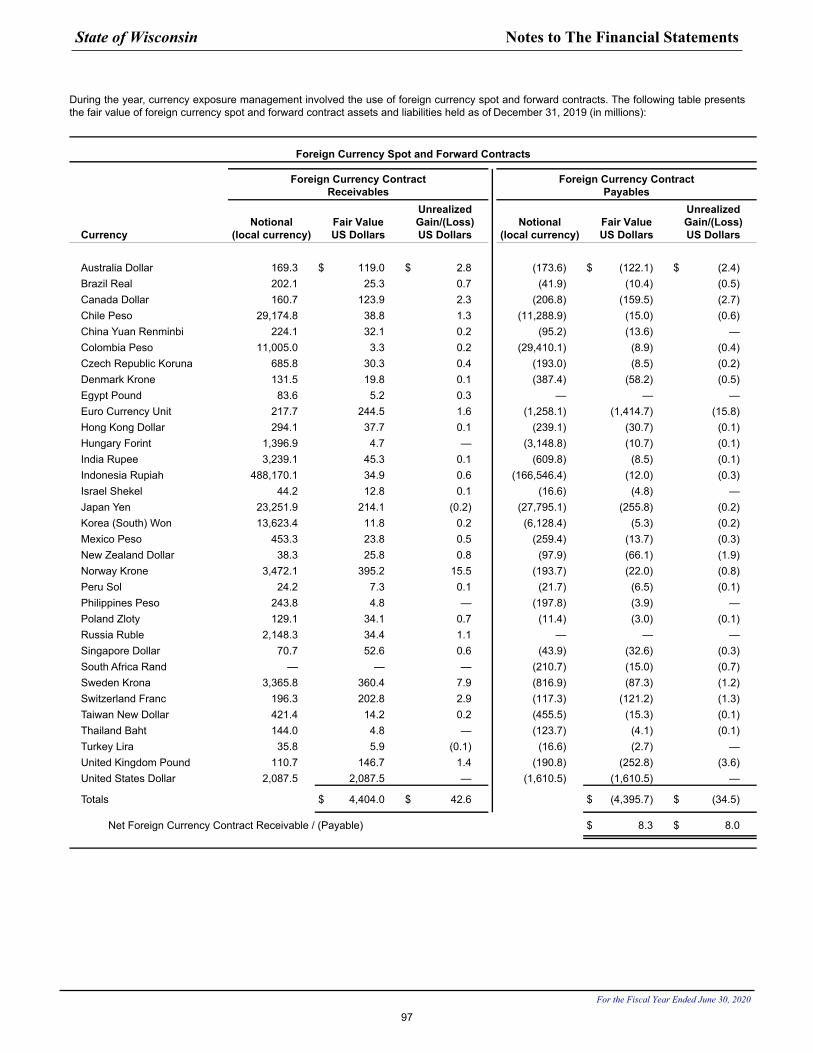
During the year, currency exposure management involved the use of foreign currency spot and forward contracts. The following table presents the fair value of foreign currency spot and forward contract assets and liabilities held as of December 31, 2019 (in millions):
Foreign Currency Spot and Forward Contracts
Foreign Currency Contract Receivables
Foreign Currency Contract Payables
CurrencyNotional
(local currency)Fair Value US Dollars
Unrealized Gain/(Loss) US Dollars
Notional (local currency)
Fair Value US Dollars
Unrealized Gain/(Loss) US Dollars
Australia Dollar 169.3 $ 119.0 $ 2.8 (173.6) $ (122.1) $ (2.4) Brazil Real 202.1 25.3 0.7 (41.9) (10.4) (0.5) Canada Dollar 160.7 123.9 2.3 (206.8) (159.5) (2.7) Chile Peso 29,174.8 38.8 1.3 (11,288.9) (15.0) (0.6) China Yuan Renminbi 224.1 32.1 0.2 (95.2) (13.6) — Colombia Peso 11,005.0 3.3 0.2 (29,410.1) (8.9) (0.4) Czech Republic Koruna 685.8 30.3 0.4 (193.0) (8.5) (0.2) Denmark Krone 131.5 19.8 0.1 (387.4) (58.2) (0.5) Egypt Pound 83.6 5.2 0.3 — — — Euro Currency Unit 217.7 244.5 1.6 (1,258.1) (1,414.7) (15.8) Hong Kong Dollar 294.1 37.7 0.1 (239.1) (30.7) (0.1) Hungary Forint 1,396.9 4.7 — (3,148.8) (10.7) (0.1) India Rupee 3,239.1 45.3 0.1 (609.8) (8.5) (0.1) Indonesia Rupiah 488,170.1 34.9 0.6 (166,546.4) (12.0) (0.3) Israel Shekel 44.2 12.8 0.1 (16.6) (4.8) — Japan Yen 23,251.9 214.1 (0.2) (27,795.1) (255.8) (0.2) Korea (South) Won 13,623.4 11.8 0.2 (6,128.4) (5.3) (0.2) Mexico Peso 453.3 23.8 0.5 (259.4) (13.7) (0.3) New Zealand Dollar 38.3 25.8 0.8 (97.9) (66.1) (1.9) Norway Krone 3,472.1 395.2 15.5 (193.7) (22.0) (0.8) Peru Sol 24.2 7.3 0.1 (21.7) (6.5) (0.1) Philippines Peso 243.8 4.8 — (197.8) (3.9) — Poland Zloty 129.1 34.1 0.7 (11.4) (3.0) (0.1) Russia Ruble 2,148.3 34.4 1.1 — — — Singapore Dollar 70.7 52.6 0.6 (43.9) (32.6) (0.3) South Africa Rand — — — (210.7) (15.0) (0.7) Sweden Krona 3,365.8 360.4 7.9 (816.9) (87.3) (1.2) Switzerland Franc 196.3 202.8 2.9 (117.3) (121.2) (1.3) Taiwan New Dollar 421.4 14.2 0.2 (455.5) (15.3) (0.1) Thailand Baht 144.0 4.8 — (123.7) (4.1) (0.1) Turkey Lira 35.8 5.9 (0.1) (16.6) (2.7) — United Kingdom Pound 110.7 146.7 1.4 (190.8) (252.8) (3.6) United States Dollar 2,087.5 2,087.5 — (1,610.5) (1,610.5) —
Totals $ 4,404.0 $ 42.6 $ (4,395.7) $ (34.5)
Net Foreign Currency Contract Receivable / (Payable) $ 8.3 $ 8.0
State of Wisconsin Notes to The Financial Statements
For the Fiscal Year Ended June 30, 2020
97
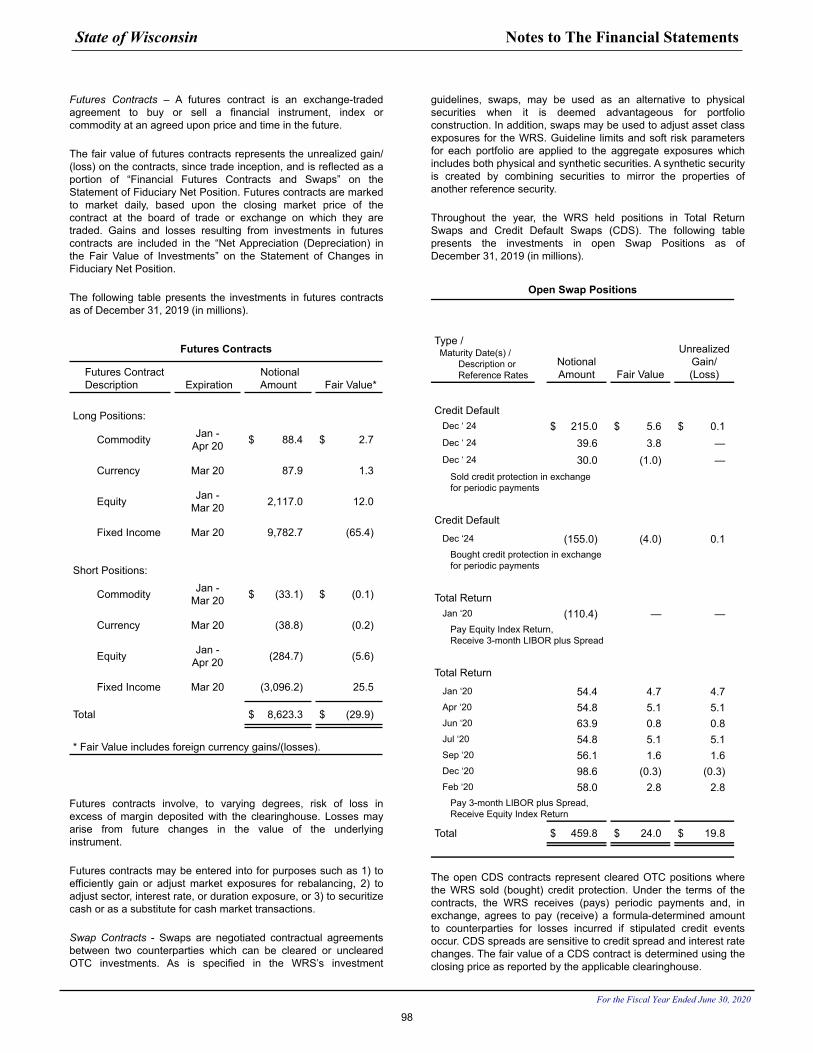
Futures Contracts – A futures contract is an exchange-traded agreement to buy or sell a financial instrument, index or commodity at an agreed upon price and time in the future.
The fair value of futures contracts represents the unrealized gain/(loss) on the contracts, since trade inception, and is reflected as a portion of “Financial Futures Contracts and Swaps” on the Statement of Fiduciary Net Position. Futures contracts are marked to market daily, based upon the closing market price of the contract at the board of trade or exchange on which they are traded. Gains and losses resulting from investments in futures contracts are included in the “Net Appreciation (Depreciation) in the Fair Value of Investments” on the Statement of Changes in Fiduciary Net Position.
The following table presents the investments in futures contracts as of December 31, 2019 (in millions).
Futures Contracts
Futures Contract Description Expiration
Notional Amount Fair Value*
Long Positions:
Commodity Jan -Apr 20 $ 88.4 $ 2.7
Currency Mar 20 87.9 1.3
Equity Jan -Mar 20 2,117.0 12.0
Fixed Income Mar 20 9,782.7 (65.4)
Short Positions:
Commodity Jan -Mar 20 $ (33.1) $ (0.1)
Currency Mar 20 (38.8) (0.2)
Equity Jan - Apr 20 (284.7) (5.6)
Fixed Income Mar 20 (3,096.2) 25.5
Total $ 8,623.3 $ (29.9)
* Fair Value includes foreign currency gains/(losses).
Futures contracts involve, to varying degrees, risk of loss in excess of margin deposited with the clearinghouse. Losses may arise from future changes in the value of the underlying instrument.
Futures contracts may be entered into for purposes such as 1) to efficiently gain or adjust market exposures for rebalancing, 2) to adjust sector, interest rate, or duration exposure, or 3) to securitize cash or as a substitute for cash market transactions.
Swap Contracts - Swaps are negotiated contractual agreements between two counterparties which can be cleared or uncleared OTC investments. As is specified in the WRS’s investment
guidelines, swaps, may be used as an alternative to physical securities when it is deemed advantageous for portfolio construction. In addition, swaps may be used to adjust asset class exposures for the WRS. Guideline limits and soft risk parameters for each portfolio are applied to the aggregate exposures which includes both physical and synthetic securities. A synthetic security is created by combining securities to mirror the properties of another reference security.
Throughout the year, the WRS held positions in Total Return Swaps and Credit Default Swaps (CDS). The following table presents the investments in open Swap Positions as of December 31, 2019 (in millions).
Open Swap Positions
Type / Maturity Date(s) /
Description or Reference Rates
Notional Amount Fair Value
Unrealized Gain/(Loss)
Credit DefaultDec ‘ 24 $ 215.0 $ 5.6 $ 0.1 Dec ‘ 24 39.6 3.8 — Dec ‘ 24 30.0 (1.0) —
Sold credit protection in exchange for periodic payments
Credit Default
Dec ‘24 (155.0) (4.0) 0.1 Bought credit protection in exchange for periodic payments
Total ReturnJan ‘20 (110.4) — —
Pay Equity Index Return,Receive 3-month LIBOR plus Spread
Total Return
Jan ‘20 54.4 4.7 4.7 Apr ‘20 54.8 5.1 5.1 Jun ‘20 63.9 0.8 0.8 Jul ‘20 54.8 5.1 5.1 Sep ‘20 56.1 1.6 1.6 Dec ‘20 98.6 (0.3) (0.3) Feb ‘20 58.0 2.8 2.8
Pay 3-month LIBOR plus Spread, Receive Equity Index Return
Total $ 459.8 $ 24.0 $ 19.8
The open CDS contracts represent cleared OTC positions where the WRS sold (bought) credit protection. Under the terms of the contracts, the WRS receives (pays) periodic payments and, in exchange, agrees to pay (receive) a formula-determined amount to counterparties for losses incurred if stipulated credit events occur. CDS spreads are sensitive to credit spread and interest rate changes. The fair value of a CDS contract is determined using the closing price as reported by the applicable clearinghouse.
State of Wisconsin Notes to The Financial Statements
For the Fiscal Year Ended June 30, 2020
98
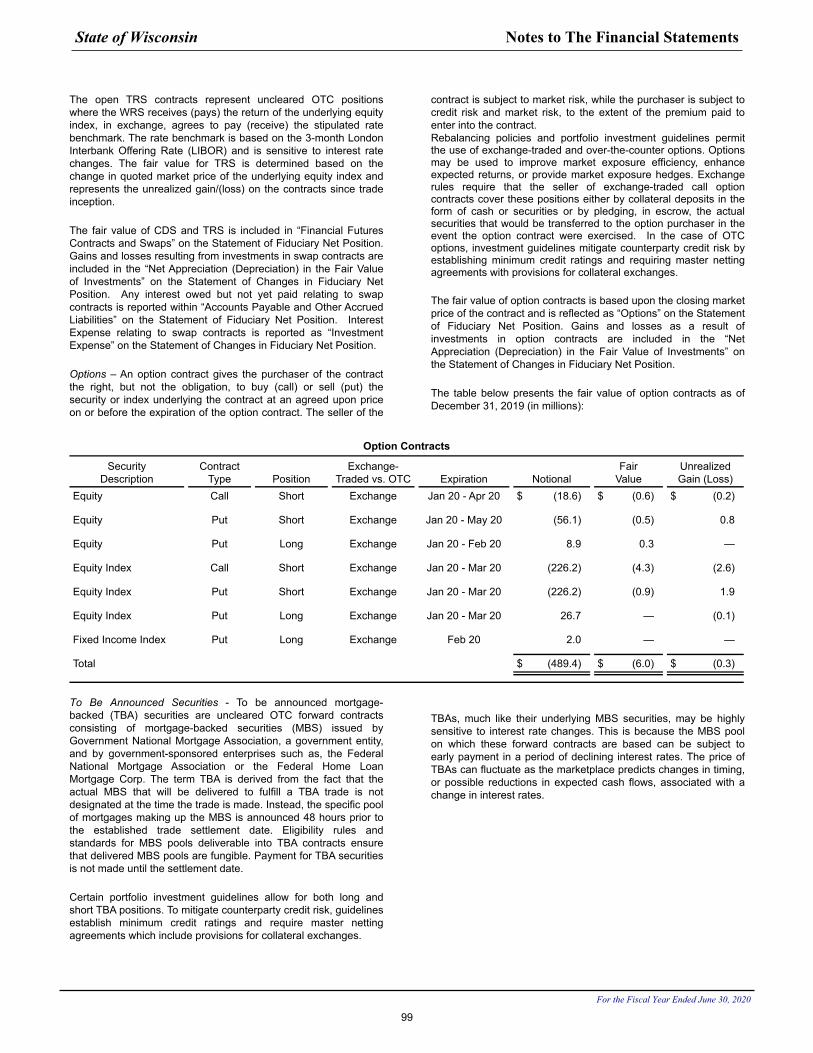
The open TRS contracts represent uncleared OTC positions where the WRS receives (pays) the return of the underlying equity index, in exchange, agrees to pay (receive) the stipulated rate benchmark. The rate benchmark is based on the 3-month London Interbank Offering Rate (LIBOR) and is sensitive to interest rate changes. The fair value for TRS is determined based on the change in quoted market price of the underlying equity index and represents the unrealized gain/(loss) on the contracts since trade inception.
The fair value of CDS and TRS is included in “Financial Futures Contracts and Swaps” on the Statement of Fiduciary Net Position. Gains and losses resulting from investments in swap contracts are included in the “Net Appreciation (Depreciation) in the Fair Value of Investments” on the Statement of Changes in Fiduciary Net Position. Any interest owed but not yet paid relating to swap contracts is reported within “Accounts Payable and Other Accrued Liabilities” on the Statement of Fiduciary Net Position. Interest Expense relating to swap contracts is reported as “Investment Expense” on the Statement of Changes in Fiduciary Net Position.
Options – An option contract gives the purchaser of the contract the right, but not the obligation, to buy (call) or sell (put) the security or index underlying the contract at an agreed upon price on or before the expiration of the option contract. The seller of the
contract is subject to market risk, while the purchaser is subject to credit risk and market risk, to the extent of the premium paid to enter into the contract.Rebalancing policies and portfolio investment guidelines permit the use of exchange-traded and over-the-counter options. Options may be used to improve market exposure efficiency, enhance expected returns, or provide market exposure hedges. Exchange rules require that the seller of exchange-traded call option contracts cover these positions either by collateral deposits in the form of cash or securities or by pledging, in escrow, the actual securities that would be transferred to the option purchaser in the event the option contract were exercised. In the case of OTC options, investment guidelines mitigate counterparty credit risk by establishing minimum credit ratings and requiring master netting agreements with provisions for collateral exchanges.
The fair value of option contracts is based upon the closing market price of the contract and is reflected as “Options” on the Statement of Fiduciary Net Position. Gains and losses as a result of investments in option contracts are included in the “Net Appreciation (Depreciation) in the Fair Value of Investments” on the Statement of Changes in Fiduciary Net Position.
The table below presents the fair value of option contracts as of December 31, 2019 (in millions):
Option Contracts
SecurityDescription
ContractType Position
Exchange-Traded vs. OTC Expiration Notional
FairValue
UnrealizedGain (Loss)
Equity Call Short Exchange Jan 20 - Apr 20 $ (18.6) $ (0.6) $ (0.2)
Equity Put Short Exchange Jan 20 - May 20 (56.1) (0.5) 0.8
Equity Put Long Exchange Jan 20 - Feb 20 8.9 0.3 —
Equity Index Call Short Exchange Jan 20 - Mar 20 (226.2) (4.3) (2.6)
Equity Index Put Short Exchange Jan 20 - Mar 20 (226.2) (0.9) 1.9
Equity Index Put Long Exchange Jan 20 - Mar 20 26.7 — (0.1)
Fixed Income Index Put Long Exchange Feb 20 2.0 — —
Total $ (489.4) $ (6.0) $ (0.3)
To Be Announced Securities - To be announced mortgage- backed (TBA) securities are uncleared OTC forward contracts consisting of mortgage-backed securities (MBS) issued by Government National Mortgage Association, a government entity, and by government-sponsored enterprises such as, the Federal National Mortgage Association or the Federal Home Loan Mortgage Corp. The term TBA is derived from the fact that the actual MBS that will be delivered to fulfill a TBA trade is not designated at the time the trade is made. Instead, the specific pool of mortgages making up the MBS is announced 48 hours prior to the established trade settlement date. Eligibility rules and standards for MBS pools deliverable into TBA contracts ensure that delivered MBS pools are fungible. Payment for TBA securities is not made until the settlement date.
Certain portfolio investment guidelines allow for both long and short TBA positions. To mitigate counterparty credit risk, guidelines establish minimum credit ratings and require master netting agreements which include provisions for collateral exchanges.
TBAs, much like their underlying MBS securities, may be highly sensitive to interest rate changes. This is because the MBS pool on which these forward contracts are based can be subject to early payment in a period of declining interest rates. The price of TBAs can fluctuate as the marketplace predicts changes in timing, or possible reductions in expected cash flows, associated with a change in interest rates.
State of Wisconsin Notes to The Financial Statements
For the Fiscal Year Ended June 30, 2020
99
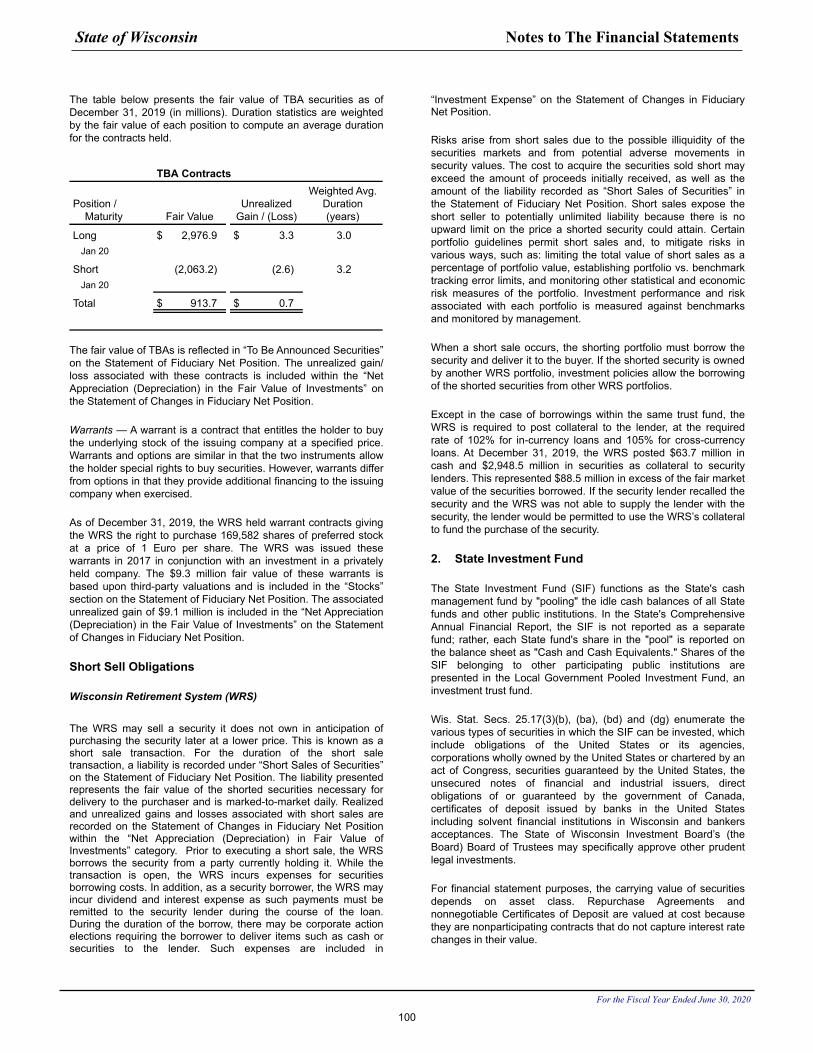
The table below presents the fair value of TBA securities as of December 31, 2019 (in millions). Duration statistics are weighted by the fair value of each position to compute an average duration for the contracts held.
TBA Contracts
Position /Maturity Fair Value
Unrealized Gain / (Loss)
Weighted Avg. Duration (years)
Long $ 2,976.9 $ 3.3 3.0Jan 20
Short (2,063.2) (2.6) 3.2Jan 20
Total $ 913.7 $ 0.7
The fair value of TBAs is reflected in “To Be Announced Securities” on the Statement of Fiduciary Net Position. The unrealized gain/loss associated with these contracts is included within the “Net Appreciation (Depreciation) in the Fair Value of Investments” on the Statement of Changes in Fiduciary Net Position.
Warrants — A warrant is a contract that entitles the holder to buy the underlying stock of the issuing company at a specified price. Warrants and options are similar in that the two instruments allow the holder special rights to buy securities. However, warrants differ from options in that they provide additional financing to the issuing company when exercised.
As of December 31, 2019, the WRS held warrant contracts giving the WRS the right to purchase 169,582 shares of preferred stock at a price of 1 Euro per share. The WRS was issued these warrants in 2017 in conjunction with an investment in a privately held company. The $9.3 million fair value of these warrants is based upon third-party valuations and is included in the “Stocks” section on the Statement of Fiduciary Net Position. The associated unrealized gain of $9.1 million is included in the “Net Appreciation (Depreciation) in the Fair Value of Investments” on the Statement of Changes in Fiduciary Net Position.
Short Sell Obligations
Wisconsin Retirement System (WRS)
The WRS may sell a security it does not own in anticipation of purchasing the security later at a lower price. This is known as a short sale transaction. For the duration of the short sale transaction, a liability is recorded under “Short Sales of Securities” on the Statement of Fiduciary Net Position. The liability presented represents the fair value of the shorted securities necessary for delivery to the purchaser and is marked-to-market daily. Realized and unrealized gains and losses associated with short sales are recorded on the Statement of Changes in Fiduciary Net Position within the “Net Appreciation (Depreciation) in Fair Value of Investments” category. Prior to executing a short sale, the WRS borrows the security from a party currently holding it. While the transaction is open, the WRS incurs expenses for securities borrowing costs. In addition, as a security borrower, the WRS may incur dividend and interest expense as such payments must be remitted to the security lender during the course of the loan. During the duration of the borrow, there may be corporate action elections requiring the borrower to deliver items such as cash or securities to the lender. Such expenses are included in
“Investment Expense” on the Statement of Changes in Fiduciary Net Position.
Risks arise from short sales due to the possible illiquidity of the securities markets and from potential adverse movements in security values. The cost to acquire the securities sold short may exceed the amount of proceeds initially received, as well as the amount of the liability recorded as “Short Sales of Securities” in the Statement of Fiduciary Net Position. Short sales expose the short seller to potentially unlimited liability because there is no upward limit on the price a shorted security could attain. Certain portfolio guidelines permit short sales and, to mitigate risks in various ways, such as: limiting the total value of short sales as a percentage of portfolio value, establishing portfolio vs. benchmark tracking error limits, and monitoring other statistical and economic risk measures of the portfolio. Investment performance and risk associated with each portfolio is measured against benchmarks and monitored by management.
When a short sale occurs, the shorting portfolio must borrow the security and deliver it to the buyer. If the shorted security is owned by another WRS portfolio, investment policies allow the borrowing of the shorted securities from other WRS portfolios.
Except in the case of borrowings within the same trust fund, the WRS is required to post collateral to the lender, at the required rate of 102% for in-currency loans and 105% for cross-currency loans. At December 31, 2019, the WRS posted $63.7 million in cash and $2,948.5 million in securities as collateral to security lenders. This represented $88.5 million in excess of the fair market value of the securities borrowed. If the security lender recalled the security and the WRS was not able to supply the lender with the security, the lender would be permitted to use the WRS’s collateral to fund the purchase of the security.
2. State Investment Fund
The State Investment Fund (SIF) functions as the State's cash management fund by "pooling" the idle cash balances of all State funds and other public institutions. In the State's Comprehensive Annual Financial Report, the SIF is not reported as a separate fund; rather, each State fund's share in the "pool" is reported on the balance sheet as "Cash and Cash Equivalents." Shares of the SIF belonging to other participating public institutions are presented in the Local Government Pooled Investment Fund, an investment trust fund.
Wis. Stat. Secs. 25.17(3)(b), (ba), (bd) and (dg) enumerate the various types of securities in which the SIF can be invested, which include obligations of the United States or its agencies, corporations wholly owned by the United States or chartered by an act of Congress, securities guaranteed by the United States, the unsecured notes of financial and industrial issuers, direct obligations of or guaranteed by the government of Canada, certificates of deposit issued by banks in the United States including solvent financial institutions in Wisconsin and bankers acceptances. The State of Wisconsin Investment Board’s (the Board) Board of Trustees may specifically approve other prudent legal investments.
For financial statement purposes, the carrying value of securities depends on asset class. Repurchase Agreements and nonnegotiable Certificates of Deposit are valued at cost because they are nonparticipating contracts that do not capture interest rate changes in their value.
State of Wisconsin Notes to The Financial Statements
For the Fiscal Year Ended June 30, 2020
100
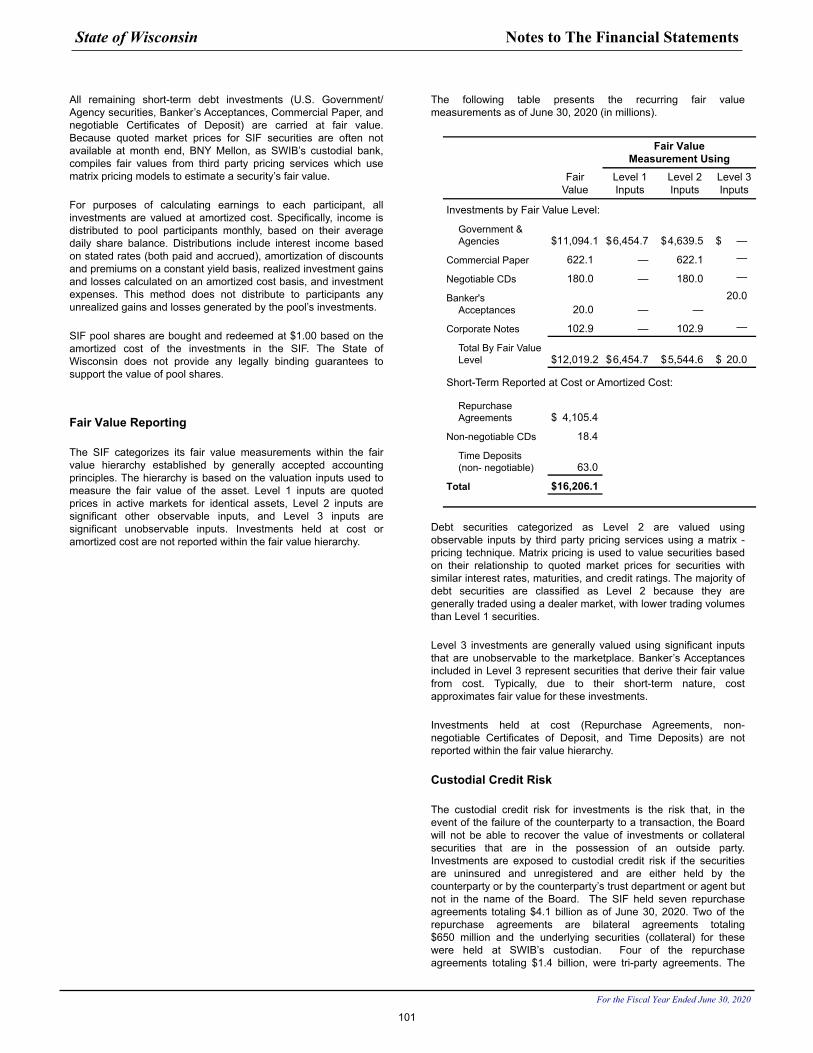
All remaining short-term debt investments (U.S. Government/ Agency securities, Banker’s Acceptances, Commercial Paper, and negotiable Certificates of Deposit) are carried at fair value. Because quoted market prices for SIF securities are often not available at month end, BNY Mellon, as SWIB’s custodial bank, compiles fair values from third party pricing services which use matrix pricing models to estimate a security’s fair value.
For purposes of calculating earnings to each participant, all investments are valued at amortized cost. Specifically, income is distributed to pool participants monthly, based on their average daily share balance. Distributions include interest income based on stated rates (both paid and accrued), amortization of discounts and premiums on a constant yield basis, realized investment gains and losses calculated on an amortized cost basis, and investment expenses. This method does not distribute to participants any unrealized gains and losses generated by the pool’s investments.
SIF pool shares are bought and redeemed at $1.00 based on the amortized cost of the investments in the SIF. The State of Wisconsin does not provide any legally binding guarantees to support the value of pool shares.
Fair Value Reporting
The SIF categorizes its fair value measurements within the fair value hierarchy established by generally accepted accounting principles. The hierarchy is based on the valuation inputs used to measure the fair value of the asset. Level 1 inputs are quoted prices in active markets for identical assets, Level 2 inputs are significant other observable inputs, and Level 3 inputs are significant unobservable inputs. Investments held at cost or amortized cost are not reported within the fair value hierarchy.
The following table presents the recurring fair value measurements as of June 30, 2020 (in millions).
Fair Value Measurement Using
Fair Value
Level 1 Inputs
Level 2 Inputs
Level 3 Inputs
Investments by Fair Value Level:
Government & Agencies $ 11,094.1 $ 6,454.7 $ 4,639.5 $ —
Commercial Paper 622.1 — 622.1 —
Negotiable CDs 180.0 — 180.0 —
Banker's Acceptances 20.0 — —
20.0
Corporate Notes 102.9 — 102.9 —
Total By Fair Value Level $ 12,019.2 $ 6,454.7 $ 5,544.6 $ 20.0
Short-Term Reported at Cost or Amortized Cost:
Repurchase Agreements $ 4,105.4
Non-negotiable CDs 18.4
Time Deposits (non- negotiable) 63.0
Total $ 16,206.1
Debt securities categorized as Level 2 are valued using observable inputs by third party pricing services using a matrix -pricing technique. Matrix pricing is used to value securities based on their relationship to quoted market prices for securities with similar interest rates, maturities, and credit ratings. The majority of debt securities are classified as Level 2 because they are generally traded using a dealer market, with lower trading volumes than Level 1 securities.
Level 3 investments are generally valued using significant inputs that are unobservable to the marketplace. Banker’s Acceptances included in Level 3 represent securities that derive their fair value from cost. Typically, due to their short-term nature, cost approximates fair value for these investments.
Investments held at cost (Repurchase Agreements, non- negotiable Certificates of Deposit, and Time Deposits) are not reported within the fair value hierarchy.
Custodial Credit Risk
The custodial credit risk for investments is the risk that, in the event of the failure of the counterparty to a transaction, the Board will not be able to recover the value of investments or collateral securities that are in the possession of an outside party. Investments are exposed to custodial credit risk if the securities are uninsured and unregistered and are either held by the counterparty or by the counterparty’s trust department or agent but not in the name of the Board. The SIF held seven repurchase agreements totaling $4.1 billion as of June 30, 2020. Two of the repurchase agreements are bilateral agreements totaling $650 million and the underlying securities (collateral) for these were held at SWIB’s custodian. Four of the repurchase agreements totaling $1.4 billion, were tri-party agreements. The
State of Wisconsin Notes to The Financial Statements
For the Fiscal Year Ended June 30, 2020
101
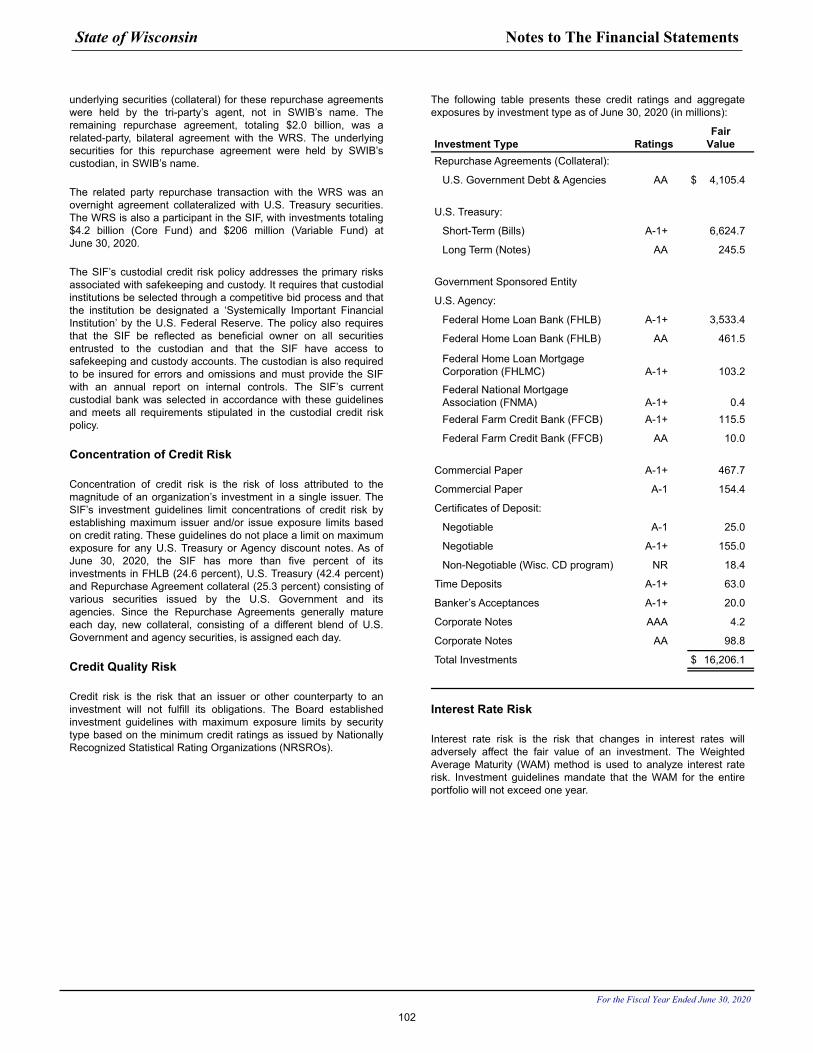
underlying securities (collateral) for these repurchase agreements were held by the tri-party’s agent, not in SWIB’s name. The remaining repurchase agreement, totaling $2.0 billion, was a related-party, bilateral agreement with the WRS. The underlying securities for this repurchase agreement were held by SWIB’s custodian, in SWIB’s name.
The related party repurchase transaction with the WRS was an overnight agreement collateralized with U.S. Treasury securities. The WRS is also a participant in the SIF, with investments totaling $4.2 billion (Core Fund) and $206 million (Variable Fund) at June 30, 2020.
The SIF’s custodial credit risk policy addresses the primary risks associated with safekeeping and custody. It requires that custodial institutions be selected through a competitive bid process and that the institution be designated a ‘Systemically Important Financial Institution’ by the U.S. Federal Reserve. The policy also requires that the SIF be reflected as beneficial owner on all securities entrusted to the custodian and that the SIF have access to safekeeping and custody accounts. The custodian is also required to be insured for errors and omissions and must provide the SIF with an annual report on internal controls. The SIF’s current custodial bank was selected in accordance with these guidelines and meets all requirements stipulated in the custodial credit risk policy.
Concentration of Credit Risk
Concentration of credit risk is the risk of loss attributed to the magnitude of an organization’s investment in a single issuer. The SIF’s investment guidelines limit concentrations of credit risk by establishing maximum issuer and/or issue exposure limits based on credit rating. These guidelines do not place a limit on maximum exposure for any U.S. Treasury or Agency discount notes. As of June 30, 2020, the SIF has more than five percent of its investments in FHLB (24.6 percent), U.S. Treasury (42.4 percent) and Repurchase Agreement collateral (25.3 percent) consisting of various securities issued by the U.S. Government and its agencies. Since the Repurchase Agreements generally mature each day, new collateral, consisting of a different blend of U.S. Government and agency securities, is assigned each day.
Credit Quality Risk
Credit risk is the risk that an issuer or other counterparty to an investment will not fulfill its obligations. The Board established investment guidelines with maximum exposure limits by security type based on the minimum credit ratings as issued by Nationally Recognized Statistical Rating Organizations (NRSROs).
The following table presents these credit ratings and aggregate exposures by investment type as of June 30, 2020 (in millions):
Investment Type RatingsFair
ValueRepurchase Agreements (Collateral):
U.S. Government Debt & Agencies AA $ 4,105.4
U.S. Treasury:
Short-Term (Bills) A-1+ 6,624.7
Long Term (Notes) AA 245.5
Government Sponsored Entity
U.S. Agency:
Federal Home Loan Bank (FHLB) A-1+ 3,533.4
Federal Home Loan Bank (FHLB) AA 461.5
Federal Home Loan Mortgage Corporation (FHLMC) A-1+ 103.2
Federal National Mortgage Association (FNMA) A-1+ 0.4 Federal Farm Credit Bank (FFCB) A-1+ 115.5
Federal Farm Credit Bank (FFCB) AA 10.0
Commercial Paper A-1+ 467.7
Commercial Paper A-1 154.4
Certificates of Deposit:
Negotiable A-1 25.0
Negotiable A-1+ 155.0
Non-Negotiable (Wisc. CD program) NR 18.4
Time Deposits A-1+ 63.0
Banker’s Acceptances A-1+ 20.0
Corporate Notes AAA 4.2
Corporate Notes AA 98.8
Total Investments $ 16,206.1
Interest Rate Risk
Interest rate risk is the risk that changes in interest rates will adversely affect the fair value of an investment. The Weighted Average Maturity (WAM) method is used to analyze interest rate risk. Investment guidelines mandate that the WAM for the entire portfolio will not exceed one year.
State of Wisconsin Notes to The Financial Statements
For the Fiscal Year Ended June 30, 2020
102
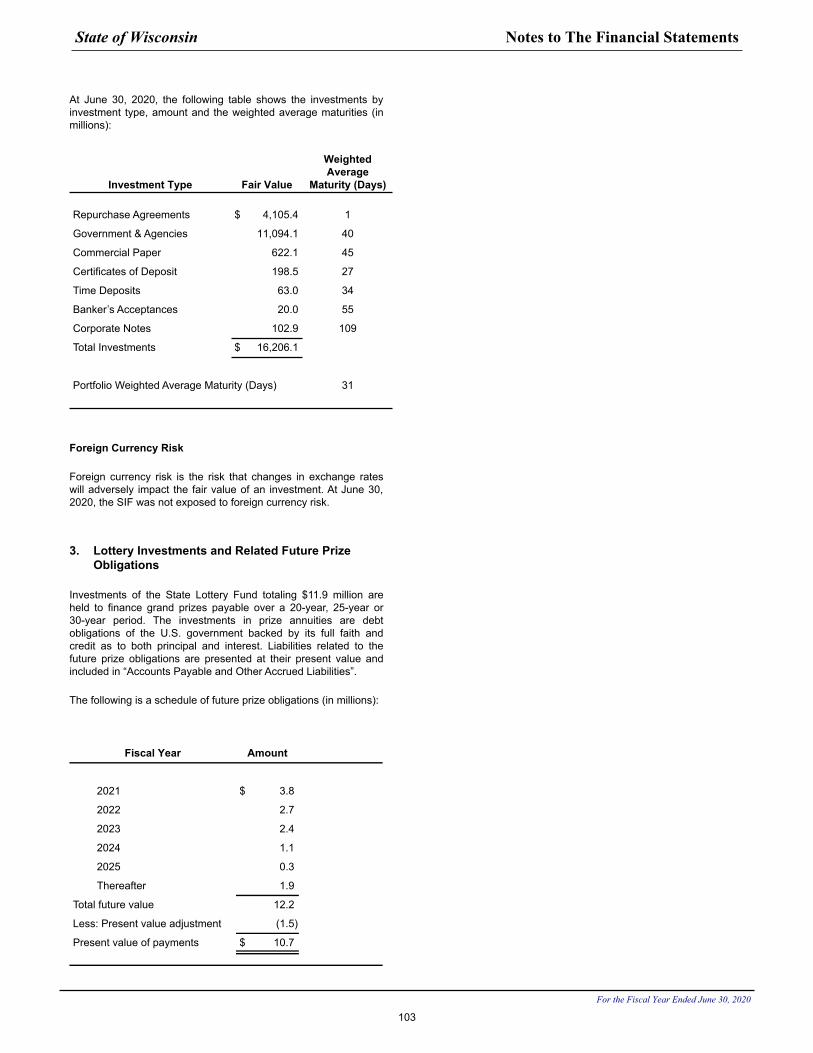
At June 30, 2020, the following table shows the investments by investment type, amount and the weighted average maturities (in millions):
Investment Type Fair Value
Weighted Average
Maturity (Days)
Repurchase Agreements $ 4,105.4 1
Government & Agencies 11,094.1 40
Commercial Paper 622.1 45
Certificates of Deposit 198.5 27
Time Deposits 63.0 34
Banker’s Acceptances 20.0 55
Corporate Notes 102.9 109
Total Investments $ 16,206.1
Portfolio Weighted Average Maturity (Days) 31
Foreign Currency Risk
Foreign currency risk is the risk that changes in exchange rates will adversely impact the fair value of an investment. At June 30, 2020, the SIF was not exposed to foreign currency risk.
3. Lottery Investments and Related Future Prize Obligations
Investments of the State Lottery Fund totaling $11.9 million are held to finance grand prizes payable over a 20-year, 25-year or 30-year period. The investments in prize annuities are debt obligations of the U.S. government backed by its full faith and credit as to both principal and interest. Liabilities related to the future prize obligations are presented at their present value and included in “Accounts Payable and Other Accrued Liabilities”.
The following is a schedule of future prize obligations (in millions):
Fiscal Year Amount
2021 $ 3.8
2022 2.7
2023 2.4
2024 1.1
2025 0.3
Thereafter 1.9
Total future value 12.2
Less: Present value adjustment (1.5)
Present value of payments $ 10.7
State of Wisconsin Notes to The Financial Statements
For the Fiscal Year Ended June 30, 2020
103
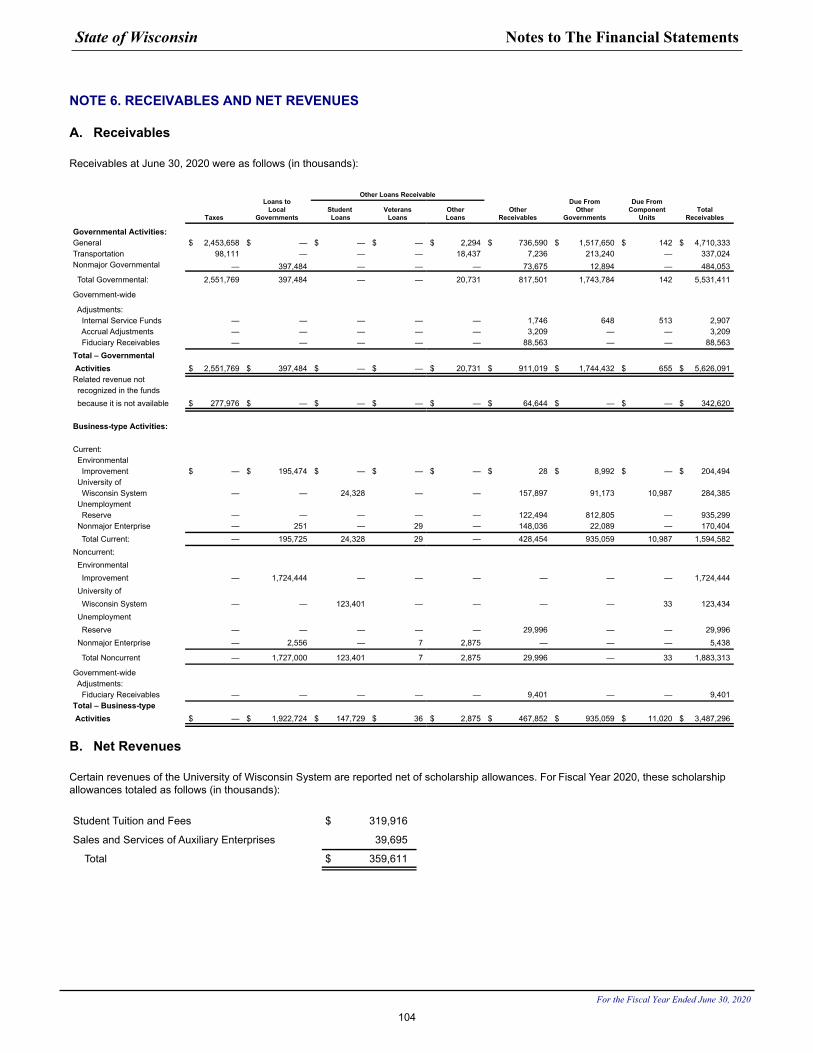
NOTE 6. RECEIVABLES AND NET REVENUES
A. Receivables
Receivables at June 30, 2020 were as follows (in thousands):
Taxes
Loans toLocal
Governments
Other Loans Receivable
OtherReceivables
Due FromOther
Governments
Due FromComponent
Units Total
ReceivablesStudent Loans
VeteransLoans
OtherLoans
Governmental Activities:General $ 2,453,658 $ — $ — $ — $ 2,294 $ 736,590 $ 1,517,650 $ 142 $ 4,710,333 Transportation 98,111 — — — 18,437 7,236 213,240 — 337,024 Nonmajor Governmental — 397,484 — — — 73,675 12,894 — 484,053 Total Governmental: 2,551,769 397,484 — — 20,731 817,501 1,743,784 142 5,531,411
Government-wide
Adjustments: Internal Service Funds — — — — — 1,746 648 513 2,907 Accrual Adjustments — — — — — 3,209 — — 3,209 Fiduciary Receivables — — — — — 88,563 — — 88,563 Total – Governmental Activities $ 2,551,769 $ 397,484 $ — $ — $ 20,731 $ 911,019 $ 1,744,432 $ 655 $ 5,626,091 Related revenue not recognized in the funds because it is not available $ 277,976 $ — $ — $ — $ — $ 64,644 $ — $ — $ 342,620
Business-type Activities:
Current: Environmental Improvement $ — $ 195,474 $ — $ — $ — $ 28 $ 8,992 $ — $ 204,494 University of Wisconsin System — — 24,328 — — 157,897 91,173 10,987 284,385 Unemployment Reserve — — — — — 122,494 812,805 — 935,299 Nonmajor Enterprise — 251 — 29 — 148,036 22,089 — 170,404 Total Current: — 195,725 24,328 29 — 428,454 935,059 10,987 1,594,582 Noncurrent: Environmental Improvement — 1,724,444 — — — — — — 1,724,444 University of Wisconsin System — — 123,401 — — — — 33 123,434 Unemployment Reserve — — — — — 29,996 — — 29,996 Nonmajor Enterprise — 2,556 — 7 2,875 — — — 5,438
Total Noncurrent — 1,727,000 123,401 7 2,875 29,996 — 33 1,883,313
Government-wide Adjustments: Fiduciary Receivables — — — — — 9,401 — — 9,401 Total – Business-type Activities $ — $ 1,922,724 $ 147,729 $ 36 $ 2,875 $ 467,852 $ 935,059 $ 11,020 $ 3,487,296
B. Net Revenues
Certain revenues of the University of Wisconsin System are reported net of scholarship allowances. For Fiscal Year 2020, these scholarship allowances totaled as follows (in thousands):
Student Tuition and Fees $ 319,916
Sales and Services of Auxiliary Enterprises 39,695
Total $ 359,611
State of Wisconsin Notes to The Financial Statements
For the Fiscal Year Ended June 30, 2020
104
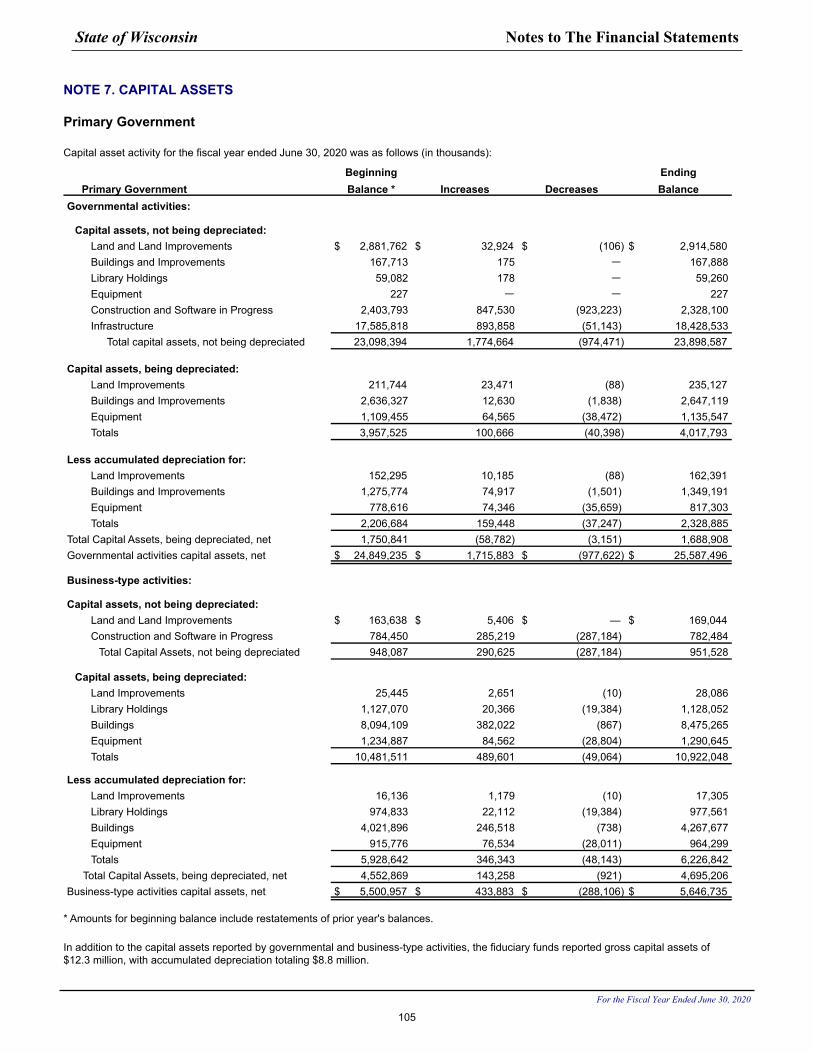
NOTE 7. CAPITAL ASSETS
Primary Government
Capital asset activity for the fiscal year ended June 30, 2020 was as follows (in thousands):
Beginning Ending Primary Government Balance * Increases Decreases BalanceGovernmental activities:
Capital assets, not being depreciated:Land and Land Improvements $ 2,881,762 $ 32,924 $ (106) $ 2,914,580 Buildings and Improvements 167,713 175 — 167,888Library Holdings 59,082 178 — 59,260Equipment 227 — — 227Construction and Software in Progress 2,403,793 847,530 (923,223) 2,328,100Infrastructure 17,585,818 893,858 (51,143) 18,428,533
Total capital assets, not being depreciated 23,098,394 1,774,664 (974,471) 23,898,587
Capital assets, being depreciated:Land Improvements 211,744 23,471 (88) 235,127 Buildings and Improvements 2,636,327 12,630 (1,838) 2,647,119Equipment 1,109,455 64,565 (38,472) 1,135,547Totals 3,957,525 100,666 (40,398) 4,017,793
Less accumulated depreciation for:Land Improvements 152,295 10,185 (88) 162,391 Buildings and Improvements 1,275,774 74,917 (1,501) 1,349,191Equipment 778,616 74,346 (35,659) 817,303Totals 2,206,684 159,448 (37,247) 2,328,885
Total Capital Assets, being depreciated, net 1,750,841 (58,782) (3,151) 1,688,908Governmental activities capital assets, net $ 24,849,235 $ 1,715,883 $ (977,622) $ 25,587,496
Business-type activities:
Capital assets, not being depreciated:Land and Land Improvements $ 163,638 $ 5,406 $ — $ 169,044 Construction and Software in Progress 784,450 285,219 (287,184) 782,484
Total Capital Assets, not being depreciated 948,087 290,625 (287,184) 951,528
Capital assets, being depreciated:Land Improvements 25,445 2,651 (10) 28,086Library Holdings 1,127,070 20,366 (19,384) 1,128,052Buildings 8,094,109 382,022 (867) 8,475,265Equipment 1,234,887 84,562 (28,804) 1,290,645Totals 10,481,511 489,601 (49,064) 10,922,048
Less accumulated depreciation for:Land Improvements 16,136 1,179 (10) 17,305Library Holdings 974,833 22,112 (19,384) 977,561Buildings 4,021,896 246,518 (738) 4,267,677Equipment 915,776 76,534 (28,011) 964,299Totals 5,928,642 346,343 (48,143) 6,226,842
Total Capital Assets, being depreciated, net 4,552,869 143,258 (921) 4,695,206Business-type activities capital assets, net $ 5,500,957 $ 433,883 $ (288,106) $ 5,646,735
* Amounts for beginning balance include restatements of prior year's balances.
In addition to the capital assets reported by governmental and business-type activities, the fiduciary funds reported gross capital assets of $12.3 million, with accumulated depreciation totaling $8.8 million.
State of Wisconsin Notes to The Financial Statements
For the Fiscal Year Ended June 30, 2020
105
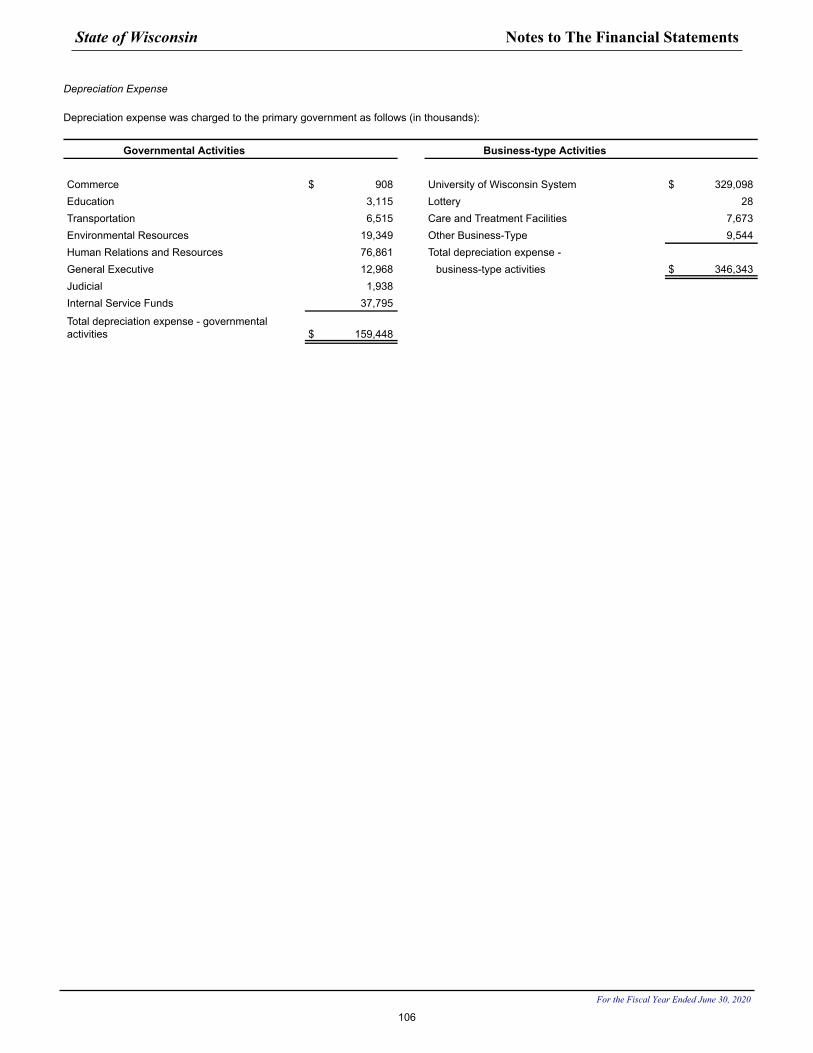
Depreciation Expense
Depreciation expense was charged to the primary government as follows (in thousands):
Governmental Activities Business-type Activities
Commerce $ 908 University of Wisconsin System $ 329,098 Education 3,115 Lottery 28 Transportation 6,515 Care and Treatment Facilities 7,673 Environmental Resources 19,349 Other Business-Type 9,544 Human Relations and Resources 76,861 Total depreciation expense -General Executive 12,968 business-type activities $ 346,343 Judicial 1,938 Internal Service Funds 37,795
Total depreciation expense - governmental activities $ 159,448
State of Wisconsin Notes to The Financial Statements
For the Fiscal Year Ended June 30, 2020
106
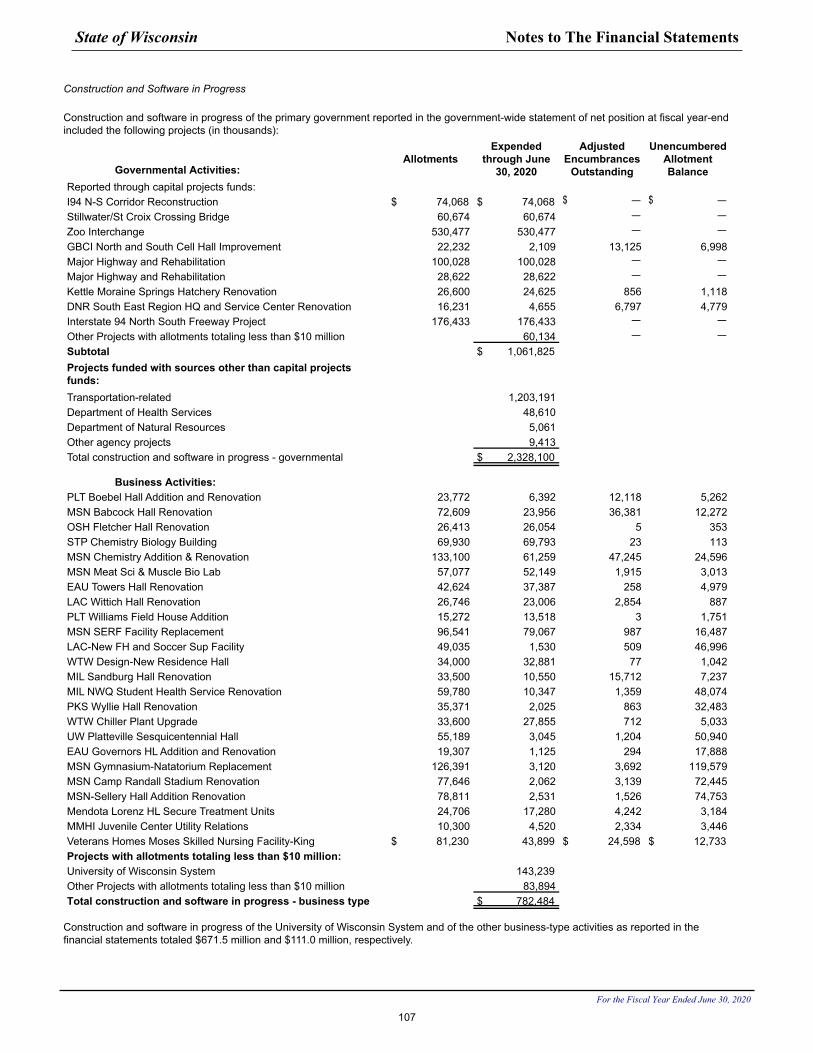
Construction and Software in Progress
Construction and software in progress of the primary government reported in the government-wide statement of net position at fiscal year-end included the following projects (in thousands):
Governmental Activities:Allotments
Expended through June
30, 2020
Adjusted Encumbrances
Outstanding
Unencumbered Allotment Balance
Reported through capital projects funds:I94 N-S Corridor Reconstruction $ 74,068 $ 74,068 $ — $ — Stillwater/St Croix Crossing Bridge 60,674 60,674 — — Zoo Interchange 530,477 530,477 — — GBCI North and South Cell Hall Improvement 22,232 2,109 13,125 6,998Major Highway and Rehabilitation 100,028 100,028 — — Major Highway and Rehabilitation 28,622 28,622 — — Kettle Moraine Springs Hatchery Renovation 26,600 24,625 856 1,118DNR South East Region HQ and Service Center Renovation 16,231 4,655 6,797 4,779Interstate 94 North South Freeway Project 176,433 176,433 — — Other Projects with allotments totaling less than $10 million 60,134 — — Subtotal $ 1,061,825 Projects funded with sources other than capital projects funds:Transportation-related 1,203,191Department of Health Services 48,610Department of Natural Resources 5,061Other agency projects 9,413Total construction and software in progress - governmental $ 2,328,100
Business Activities:PLT Boebel Hall Addition and Renovation 23,772 6,392 12,118 5,262MSN Babcock Hall Renovation 72,609 23,956 36,381 12,272OSH Fletcher Hall Renovation 26,413 26,054 5 353STP Chemistry Biology Building 69,930 69,793 23 113MSN Chemistry Addition & Renovation 133,100 61,259 47,245 24,596MSN Meat Sci & Muscle Bio Lab 57,077 52,149 1,915 3,013EAU Towers Hall Renovation 42,624 37,387 258 4,979LAC Wittich Hall Renovation 26,746 23,006 2,854 887PLT Williams Field House Addition 15,272 13,518 3 1,751MSN SERF Facility Replacement 96,541 79,067 987 16,487LAC-New FH and Soccer Sup Facility 49,035 1,530 509 46,996WTW Design-New Residence Hall 34,000 32,881 77 1,042MIL Sandburg Hall Renovation 33,500 10,550 15,712 7,237MIL NWQ Student Health Service Renovation 59,780 10,347 1,359 48,074PKS Wyllie Hall Renovation 35,371 2,025 863 32,483WTW Chiller Plant Upgrade 33,600 27,855 712 5,033UW Platteville Sesquicentennial Hall 55,189 3,045 1,204 50,940EAU Governors HL Addition and Renovation 19,307 1,125 294 17,888MSN Gymnasium-Natatorium Replacement 126,391 3,120 3,692 119,579MSN Camp Randall Stadium Renovation 77,646 2,062 3,139 72,445MSN-Sellery Hall Addition Renovation 78,811 2,531 1,526 74,753Mendota Lorenz HL Secure Treatment Units 24,706 17,280 4,242 3,184MMHI Juvenile Center Utility Relations 10,300 4,520 2,334 3,446Veterans Homes Moses Skilled Nursing Facility-King $ 81,230 43,899 $ 24,598 $ 12,733 Projects with allotments totaling less than $10 million:University of Wisconsin System 143,239 Other Projects with allotments totaling less than $10 million 83,894Total construction and software in progress - business type $ 782,484
Construction and software in progress of the University of Wisconsin System and of the other business-type activities as reported in the financial statements totaled $671.5 million and $111.0 million, respectively.
State of Wisconsin Notes to The Financial Statements
For the Fiscal Year Ended June 30, 2020
107
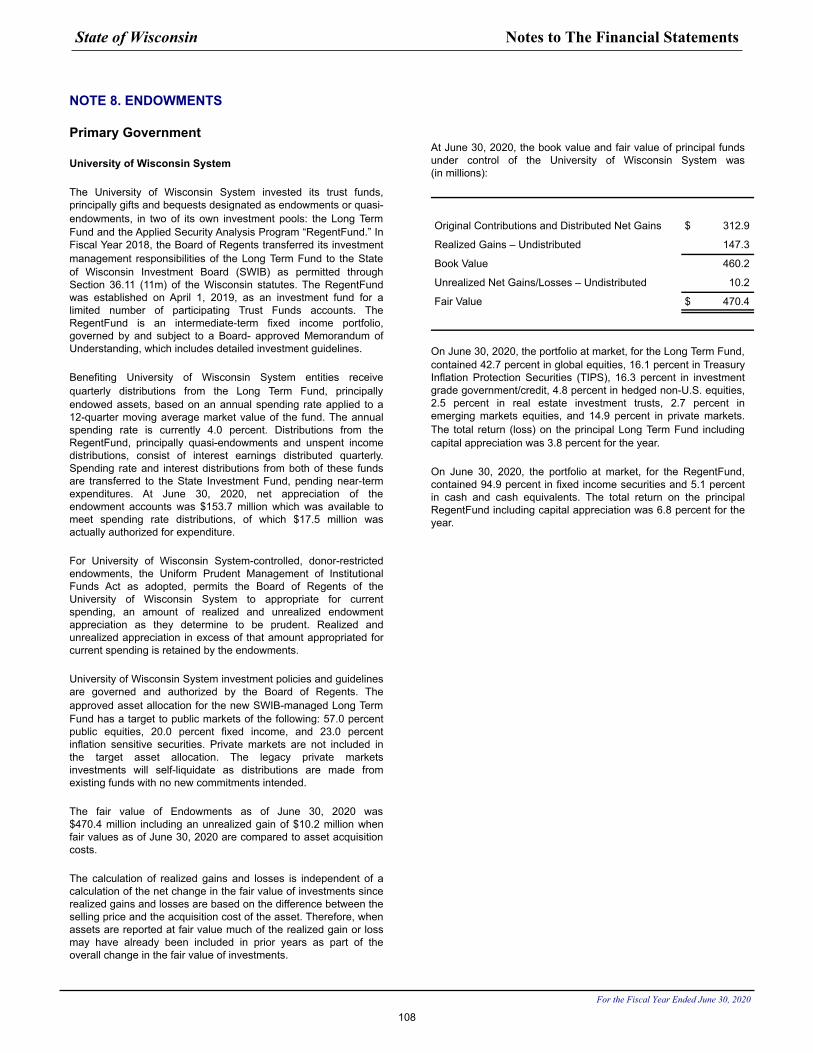
NOTE 8. ENDOWMENTS
Primary Government
University of Wisconsin System
The University of Wisconsin System invested its trust funds, principally gifts and bequests designated as endowments or quasi-endowments, in two of its own investment pools: the Long Term Fund and the Applied Security Analysis Program “RegentFund.” In Fiscal Year 2018, the Board of Regents transferred its investment management responsibilities of the Long Term Fund to the State of Wisconsin Investment Board (SWIB) as permitted through Section 36.11 (11m) of the Wisconsin statutes. The RegentFund was established on April 1, 2019, as an investment fund for a limited number of participating Trust Funds accounts. The RegentFund is an intermediate-term fixed income portfolio, governed by and subject to a Board- approved Memorandum of Understanding, which includes detailed investment guidelines.
Benefiting University of Wisconsin System entities receive quarterly distributions from the Long Term Fund, principally endowed assets, based on an annual spending rate applied to a 12-quarter moving average market value of the fund. The annual spending rate is currently 4.0 percent. Distributions from the RegentFund, principally quasi-endowments and unspent income distributions, consist of interest earnings distributed quarterly. Spending rate and interest distributions from both of these funds are transferred to the State Investment Fund, pending near-term expenditures. At June 30, 2020, net appreciation of the endowment accounts was $153.7 million which was available to meet spending rate distributions, of which $17.5 million was actually authorized for expenditure.
For University of Wisconsin System-controlled, donor-restricted endowments, the Uniform Prudent Management of Institutional Funds Act as adopted, permits the Board of Regents of the University of Wisconsin System to appropriate for current spending, an amount of realized and unrealized endowment appreciation as they determine to be prudent. Realized and unrealized appreciation in excess of that amount appropriated for current spending is retained by the endowments.
University of Wisconsin System investment policies and guidelines are governed and authorized by the Board of Regents. The approved asset allocation for the new SWIB-managed Long Term Fund has a target to public markets of the following: 57.0 percent public equities, 20.0 percent fixed income, and 23.0 percent inflation sensitive securities. Private markets are not included in the target asset allocation. The legacy private markets investments will self-liquidate as distributions are made from existing funds with no new commitments intended.
The fair value of Endowments as of June 30, 2020 was $470.4 million including an unrealized gain of $10.2 million when fair values as of June 30, 2020 are compared to asset acquisition costs.
The calculation of realized gains and losses is independent of a calculation of the net change in the fair value of investments since realized gains and losses are based on the difference between the selling price and the acquisition cost of the asset. Therefore, when assets are reported at fair value much of the realized gain or loss may have already been included in prior years as part of the overall change in the fair value of investments.
At June 30, 2020, the book value and fair value of principal funds under control of the University of Wisconsin System was (in millions):
Original Contributions and Distributed Net Gains $ 312.9
Realized Gains – Undistributed 147.3
Book Value 460.2
Unrealized Net Gains/Losses – Undistributed 10.2
Fair Value $ 470.4
On June 30, 2020, the portfolio at market, for the Long Term Fund, contained 42.7 percent in global equities, 16.1 percent in Treasury Inflation Protection Securities (TIPS), 16.3 percent in investment grade government/credit, 4.8 percent in hedged non-U.S. equities, 2.5 percent in real estate investment trusts, 2.7 percent in emerging markets equities, and 14.9 percent in private markets. The total return (loss) on the principal Long Term Fund including capital appreciation was 3.8 percent for the year.
On June 30, 2020, the portfolio at market, for the RegentFund, contained 94.9 percent in fixed income securities and 5.1 percent in cash and cash equivalents. The total return on the principal RegentFund including capital appreciation was 6.8 percent for the year.
State of Wisconsin Notes to The Financial Statements
For the Fiscal Year Ended June 30, 2020
108
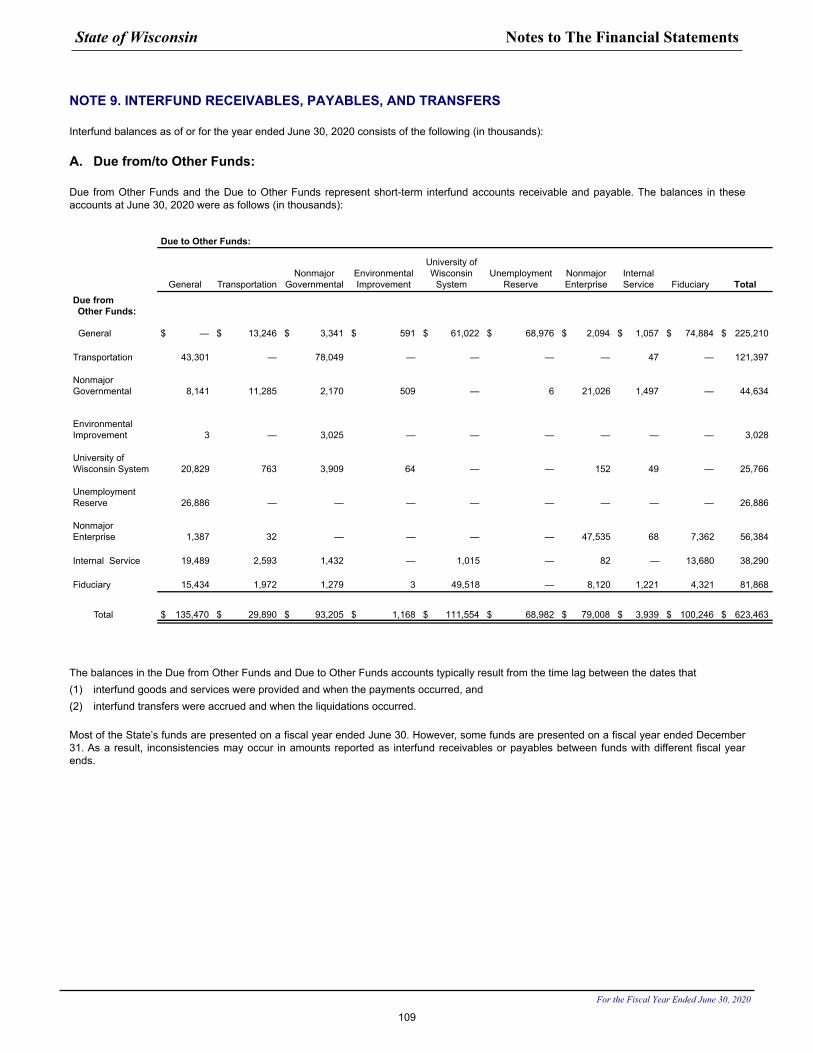
NOTE 9. INTERFUND RECEIVABLES, PAYABLES, AND TRANSFERS
Interfund balances as of or for the year ended June 30, 2020 consists of the following (in thousands):
A. Due from/to Other Funds:
Due from Other Funds and the Due to Other Funds represent short-term interfund accounts receivable and payable. The balances in these accounts at June 30, 2020 were as follows (in thousands):
Due to Other Funds:
General TransportationNonmajor
GovernmentalEnvironmentalImprovement
University of Wisconsin
SystemUnemployment
ReserveNonmajorEnterprise
Internal Service Fiduciary Total
Due fromOther Funds:
General $ — $ 13,246 $ 3,341 $ 591 $ 61,022 $ 68,976 $ 2,094 $ 1,057 $ 74,884 $ 225,210
Transportation 43,301 — 78,049 — — — — 47 — 121,397
Nonmajor Governmental 8,141 11,285 2,170 509 — 6 21,026 1,497 — 44,634
Environmental Improvement 3 — 3,025 — — — — — — 3,028
University of Wisconsin System 20,829 763 3,909 64 — — 152 49 — 25,766
Unemployment Reserve 26,886 — — — — — — — — 26,886
Nonmajor Enterprise 1,387 32 — — — — 47,535 68 7,362 56,384
Internal Service 19,489 2,593 1,432 — 1,015 — 82 — 13,680 38,290
Fiduciary 15,434 1,972 1,279 3 49,518 — 8,120 1,221 4,321 81,868
Total $ 135,470 $ 29,890 $ 93,205 $ 1,168 $ 111,554 $ 68,982 $ 79,008 $ 3,939 $ 100,246 $ 623,463
The balances in the Due from Other Funds and Due to Other Funds accounts typically result from the time lag between the dates that(1) interfund goods and services were provided and when the payments occurred, and(2) interfund transfers were accrued and when the liquidations occurred.
Most of the State’s funds are presented on a fiscal year ended June 30. However, some funds are presented on a fiscal year ended December 31. As a result, inconsistencies may occur in amounts reported as interfund receivables or payables between funds with different fiscal year ends.
State of Wisconsin Notes to The Financial Statements
For the Fiscal Year Ended June 30, 2020
109
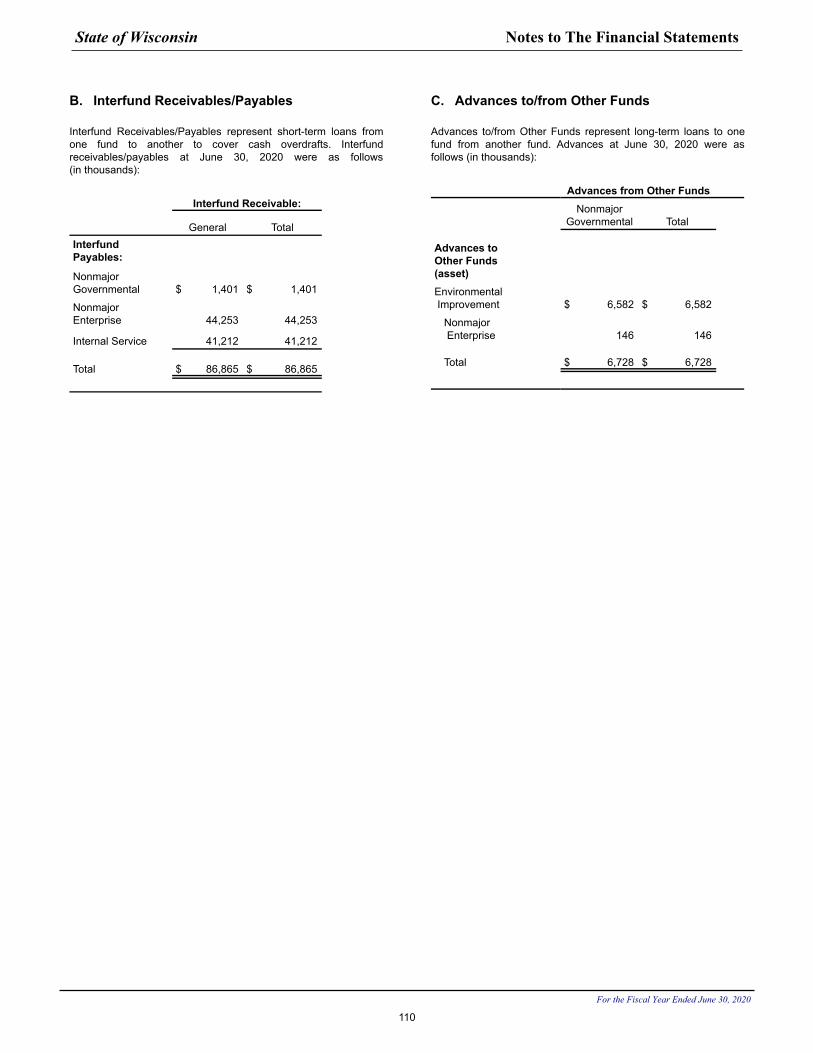
B. Interfund Receivables/Payables
Interfund Receivables/Payables represent short-term loans from one fund to another to cover cash overdrafts. Interfund receivables/payables at June 30, 2020 were as follows (in thousands):
Interfund Receivable:
General TotalInterfundPayables:
NonmajorGovernmental $ 1,401 $ 1,401
NonmajorEnterprise 44,253 44,253
Internal Service 41,212 41,212
Total $ 86,865 $ 86,865
C. Advances to/from Other Funds
Advances to/from Other Funds represent long-term loans to one fund from another fund. Advances at June 30, 2020 were as follows (in thousands):
Advances from Other Funds Nonmajor
Governmental Total
Advances toOther Funds(asset)Environmental Improvement $ 6,582 $ 6,582
Nonmajor Enterprise 146 146
Total $ 6,728 $ 6,728
State of Wisconsin Notes to The Financial Statements
For the Fiscal Year Ended June 30, 2020
110
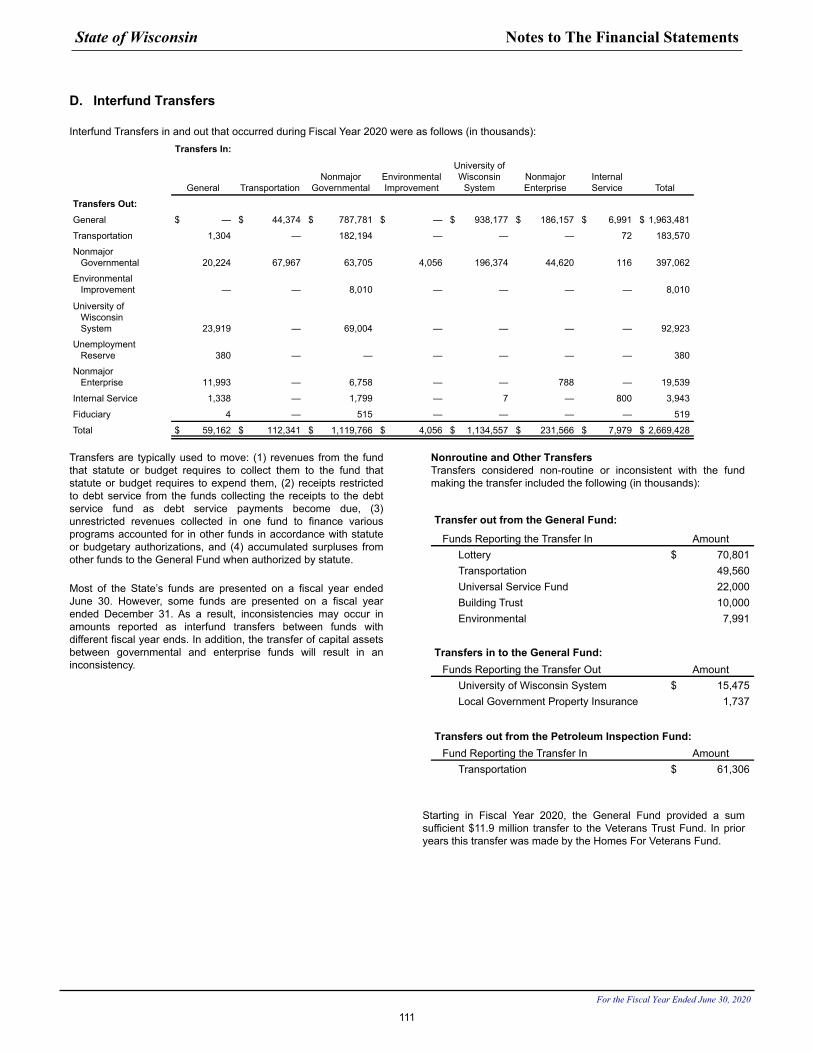
D. Interfund Transfers
Interfund Transfers in and out that occurred during Fiscal Year 2020 were as follows (in thousands):Transfers In:
General TransportationNonmajor
GovernmentalEnvironmental Improvement
University of Wisconsin
SystemNonmajorEnterprise
Internal Service Total
Transfers Out:General $ — $ 44,374 $ 787,781 $ — $ 938,177 $ 186,157 $ 6,991 $ 1,963,481
Transportation 1,304 — 182,194 — — — 72 183,570
Nonmajor Governmental 20,224 67,967 63,705 4,056 196,374 44,620 116 397,062
Environmental Improvement — — 8,010 — — — — 8,010
University of Wisconsin System 23,919 — 69,004 — — — — 92,923
Unemployment Reserve 380 — — — — — — 380
Nonmajor Enterprise 11,993 — 6,758 — — 788 — 19,539
Internal Service 1,338 — 1,799 — 7 — 800 3,943
Fiduciary 4 — 515 — — — — 519
Total $ 59,162 $ 112,341 $ 1,119,766 $ 4,056 $ 1,134,557 $ 231,566 $ 7,979 $ 2,669,428
Transfers are typically used to move: (1) revenues from the fund that statute or budget requires to collect them to the fund that statute or budget requires to expend them, (2) receipts restricted to debt service from the funds collecting the receipts to the debt service fund as debt service payments become due, (3) unrestricted revenues collected in one fund to finance various programs accounted for in other funds in accordance with statute or budgetary authorizations, and (4) accumulated surpluses from other funds to the General Fund when authorized by statute.
Most of the State’s funds are presented on a fiscal year ended June 30. However, some funds are presented on a fiscal year ended December 31. As a result, inconsistencies may occur in amounts reported as interfund transfers between funds with different fiscal year ends. In addition, the transfer of capital assets between governmental and enterprise funds will result in an inconsistency.
Nonroutine and Other TransfersTransfers considered non-routine or inconsistent with the fund making the transfer included the following (in thousands):
Transfer out from the General Fund:
Funds Reporting the Transfer In AmountLottery $ 70,801 Transportation 49,560 Universal Service Fund 22,000 Building Trust 10,000 Environmental 7,991
Transfers in to the General Fund:Funds Reporting the Transfer Out Amount
University of Wisconsin System $ 15,475 Local Government Property Insurance 1,737
Transfers out from the Petroleum Inspection Fund:Fund Reporting the Transfer In Amount
Transportation $ 61,306
Starting in Fiscal Year 2020, the General Fund provided a sum sufficient $11.9 million transfer to the Veterans Trust Fund. In prior years this transfer was made by the Homes For Veterans Fund.
State of Wisconsin Notes to The Financial Statements
For the Fiscal Year Ended June 30, 2020
111
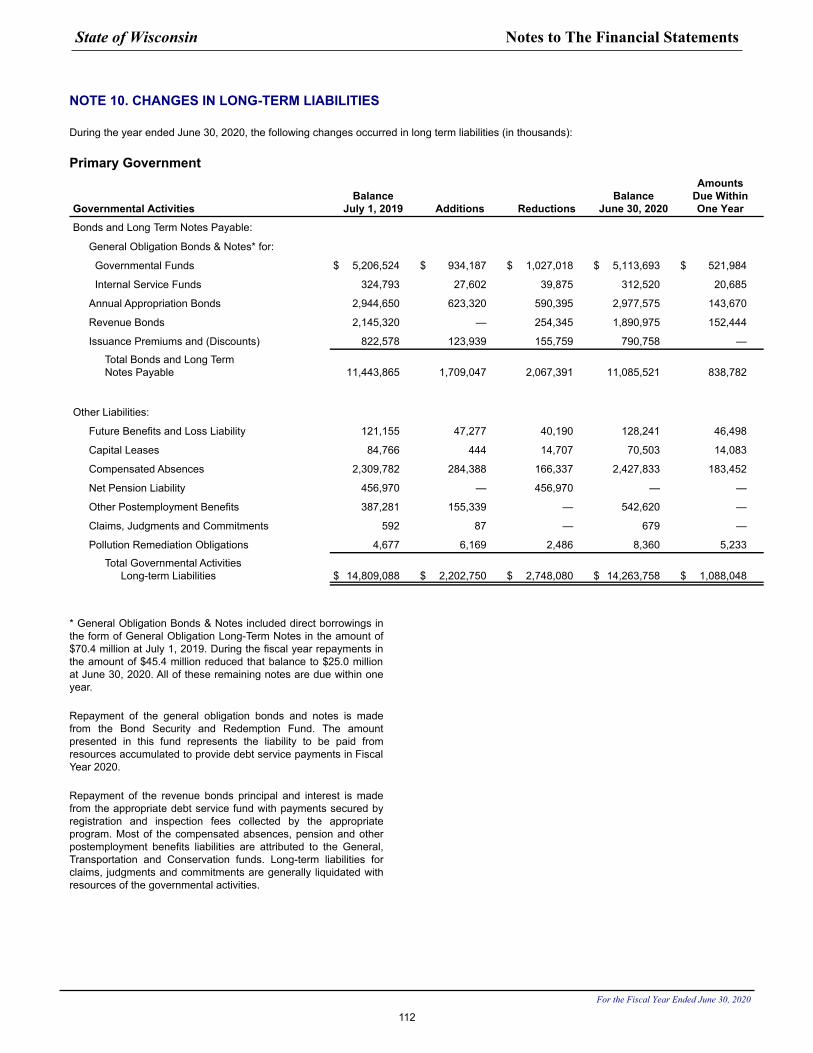
NOTE 10. CHANGES IN LONG-TERM LIABILITIES
During the year ended June 30, 2020, the following changes occurred in long term liabilities (in thousands):
Primary Government
Governmental ActivitiesBalance
July 1, 2019 Additions ReductionsBalance
June 30, 2020
AmountsDue WithinOne Year
Bonds and Long Term Notes Payable:
General Obligation Bonds & Notes* for:
Governmental Funds $ 5,206,524 $ 934,187 $ 1,027,018 $ 5,113,693 $ 521,984
Internal Service Funds 324,793 27,602 39,875 312,520 20,685
Annual Appropriation Bonds 2,944,650 623,320 590,395 2,977,575 143,670
Revenue Bonds 2,145,320 — 254,345 1,890,975 152,444
Issuance Premiums and (Discounts) 822,578 123,939 155,759 790,758 —
Total Bonds and Long TermNotes Payable 11,443,865 1,709,047 2,067,391 11,085,521 838,782
Other Liabilities:
Future Benefits and Loss Liability 121,155 47,277 40,190 128,241 46,498
Capital Leases 84,766 444 14,707 70,503 14,083
Compensated Absences 2,309,782 284,388 166,337 2,427,833 183,452
Net Pension Liability 456,970 — 456,970 — —
Other Postemployment Benefits 387,281 155,339 — 542,620 —
Claims, Judgments and Commitments 592 87 — 679 —
Pollution Remediation Obligations 4,677 6,169 2,486 8,360 5,233
Total Governmental ActivitiesLong-term Liabilities $ 14,809,088 $ 2,202,750 $ 2,748,080 $ 14,263,758 $ 1,088,048
* General Obligation Bonds & Notes included direct borrowings in the form of General Obligation Long-Term Notes in the amount of $70.4 million at July 1, 2019. During the fiscal year repayments in the amount of $45.4 million reduced that balance to $25.0 million at June 30, 2020. All of these remaining notes are due within one year.
Repayment of the general obligation bonds and notes is made from the Bond Security and Redemption Fund. The amount presented in this fund represents the liability to be paid from resources accumulated to provide debt service payments in Fiscal Year 2020.
Repayment of the revenue bonds principal and interest is made from the appropriate debt service fund with payments secured by registration and inspection fees collected by the appropriate program. Most of the compensated absences, pension and other postemployment benefits liabilities are attributed to the General, Transportation and Conservation funds. Long-term liabilities for claims, judgments and commitments are generally liquidated with resources of the governmental activities.
State of Wisconsin Notes to The Financial Statements
For the Fiscal Year Ended June 30, 2020
112
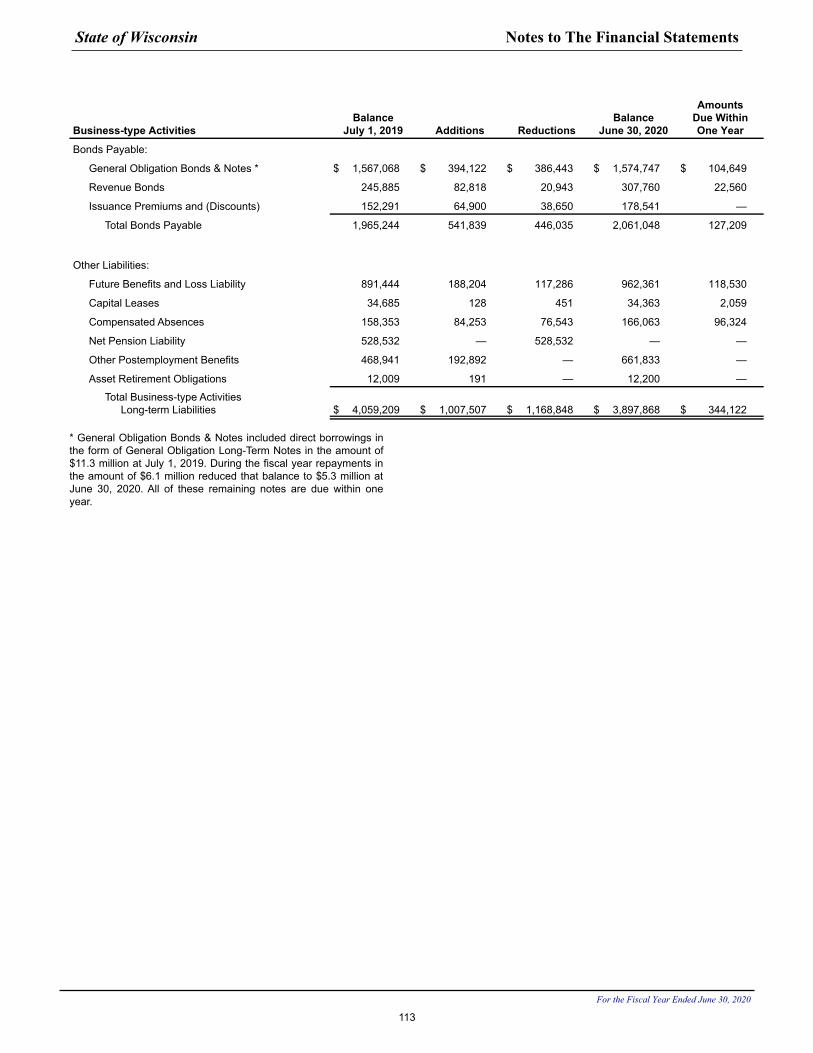
Business-type ActivitiesBalance
July 1, 2019 Additions ReductionsBalance
June 30, 2020
AmountsDue WithinOne Year
Bonds Payable:
General Obligation Bonds & Notes * $ 1,567,068 $ 394,122 $ 386,443 $ 1,574,747 $ 104,649
Revenue Bonds 245,885 82,818 20,943 307,760 22,560
Issuance Premiums and (Discounts) 152,291 64,900 38,650 178,541 —
Total Bonds Payable 1,965,244 541,839 446,035 2,061,048 127,209
Other Liabilities:
Future Benefits and Loss Liability 891,444 188,204 117,286 962,361 118,530
Capital Leases 34,685 128 451 34,363 2,059
Compensated Absences 158,353 84,253 76,543 166,063 96,324
Net Pension Liability 528,532 — 528,532 — —
Other Postemployment Benefits 468,941 192,892 — 661,833 —
Asset Retirement Obligations 12,009 191 — 12,200 —
Total Business-type ActivitiesLong-term Liabilities $ 4,059,209 $ 1,007,507 $ 1,168,848 $ 3,897,868 $ 344,122
* General Obligation Bonds & Notes included direct borrowings in the form of General Obligation Long-Term Notes in the amount of $11.3 million at July 1, 2019. During the fiscal year repayments in the amount of $6.1 million reduced that balance to $5.3 million at June 30, 2020. All of these remaining notes are due within one year.
State of Wisconsin Notes to The Financial Statements
For the Fiscal Year Ended June 30, 2020
113
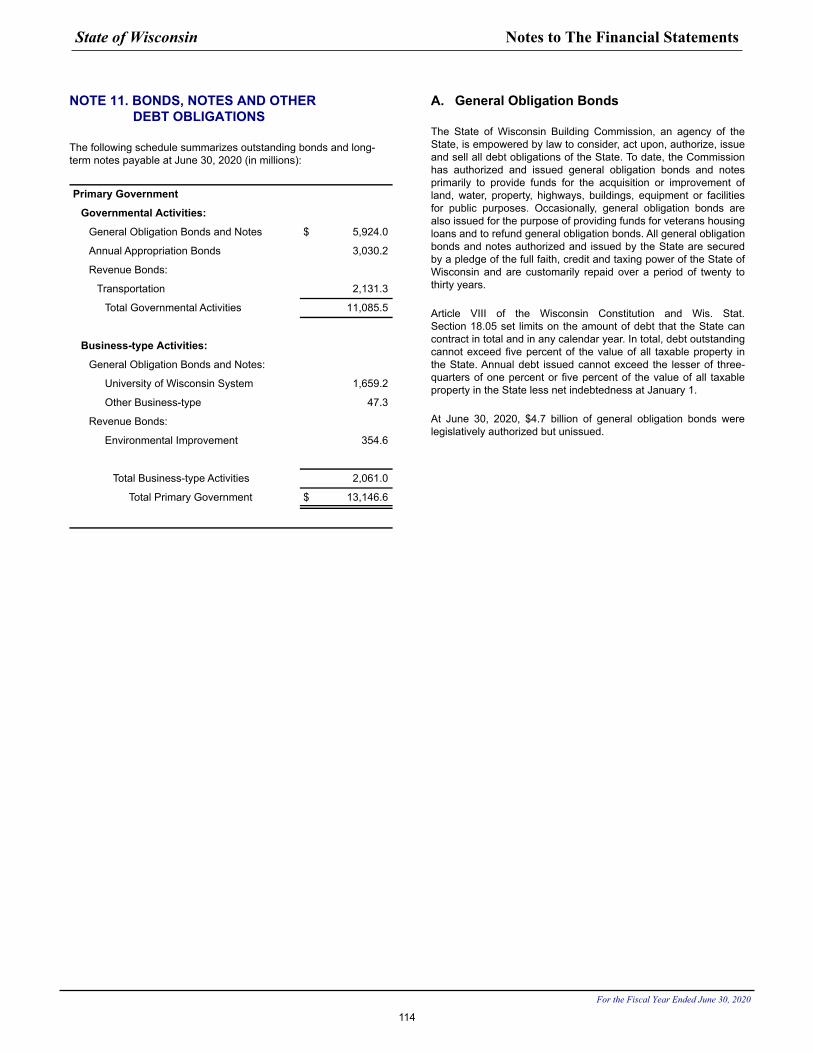
NOTE 11. BONDS, NOTES AND OTHER DEBT OBLIGATIONS
The following schedule summarizes outstanding bonds and long- term notes payable at June 30, 2020 (in millions):
Primary Government
Governmental Activities:
General Obligation Bonds and Notes $ 5,924.0
Annual Appropriation Bonds 3,030.2
Revenue Bonds:
Transportation 2,131.3
Total Governmental Activities 11,085.5
Business-type Activities:
General Obligation Bonds and Notes:
University of Wisconsin System 1,659.2
Other Business-type 47.3
Revenue Bonds:
Environmental Improvement 354.6
Total Business-type Activities 2,061.0
Total Primary Government $ 13,146.6
A. General Obligation Bonds
The State of Wisconsin Building Commission, an agency of the State, is empowered by law to consider, act upon, authorize, issue and sell all debt obligations of the State. To date, the Commission has authorized and issued general obligation bonds and notes primarily to provide funds for the acquisition or improvement of land, water, property, highways, buildings, equipment or facilities for public purposes. Occasionally, general obligation bonds are also issued for the purpose of providing funds for veterans housing loans and to refund general obligation bonds. All general obligation bonds and notes authorized and issued by the State are secured by a pledge of the full faith, credit and taxing power of the State of Wisconsin and are customarily repaid over a period of twenty to thirty years.
Article VIII of the Wisconsin Constitution and Wis. Stat. Section 18.05 set limits on the amount of debt that the State can contract in total and in any calendar year. In total, debt outstanding cannot exceed five percent of the value of all taxable property in the State. Annual debt issued cannot exceed the lesser of three- quarters of one percent or five percent of the value of all taxable property in the State less net indebtedness at January 1.
At June 30, 2020, $4.7 billion of general obligation bonds were legislatively authorized but unissued.
State of Wisconsin Notes to The Financial Statements
For the Fiscal Year Ended June 30, 2020
114
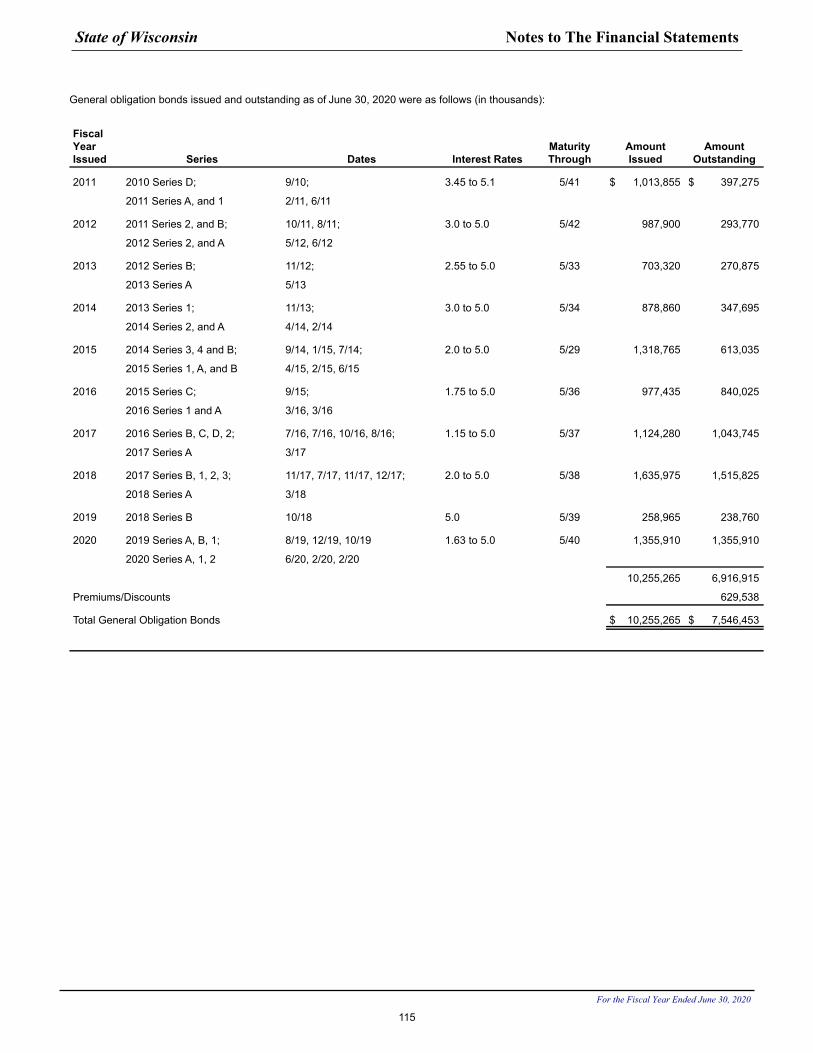
General obligation bonds issued and outstanding as of June 30, 2020 were as follows (in thousands):
FiscalYearIssued Series Dates Interest Rates
MaturityThrough
AmountIssued
AmountOutstanding
2011 2010 Series D; 9/10; 3.45 to 5.1 5/41 $ 1,013,855 $ 397,275
2011 Series A, and 1 2/11, 6/11
2012 2011 Series 2, and B; 10/11, 8/11; 3.0 to 5.0 5/42 987,900 293,770
2012 Series 2, and A 5/12, 6/12
2013 2012 Series B; 11/12; 2.55 to 5.0 5/33 703,320 270,875
2013 Series A 5/13
2014 2013 Series 1; 11/13; 3.0 to 5.0 5/34 878,860 347,695
2014 Series 2, and A 4/14, 2/14
2015 2014 Series 3, 4 and B; 9/14, 1/15, 7/14; 2.0 to 5.0 5/29 1,318,765 613,035
2015 Series 1, A, and B 4/15, 2/15, 6/15
2016 2015 Series C; 9/15; 1.75 to 5.0 5/36 977,435 840,025
2016 Series 1 and A 3/16, 3/16
2017 2016 Series B, C, D, 2; 7/16, 7/16, 10/16, 8/16; 1.15 to 5.0 5/37 1,124,280 1,043,745
2017 Series A 3/17
2018 2017 Series B, 1, 2, 3; 11/17, 7/17, 11/17, 12/17; 2.0 to 5.0 5/38 1,635,975 1,515,825
2018 Series A 3/18
2019 2018 Series B 10/18 5.0 5/39 258,965 238,760
2020 2019 Series A, B, 1; 8/19, 12/19, 10/19 1.63 to 5.0 5/40 1,355,910 1,355,910
2020 Series A, 1, 2 6/20, 2/20, 2/20
10,255,265 6,916,915
Premiums/Discounts 629,538
Total General Obligation Bonds $ 10,255,265 $ 7,546,453
State of Wisconsin Notes to The Financial Statements
For the Fiscal Year Ended June 30, 2020
115
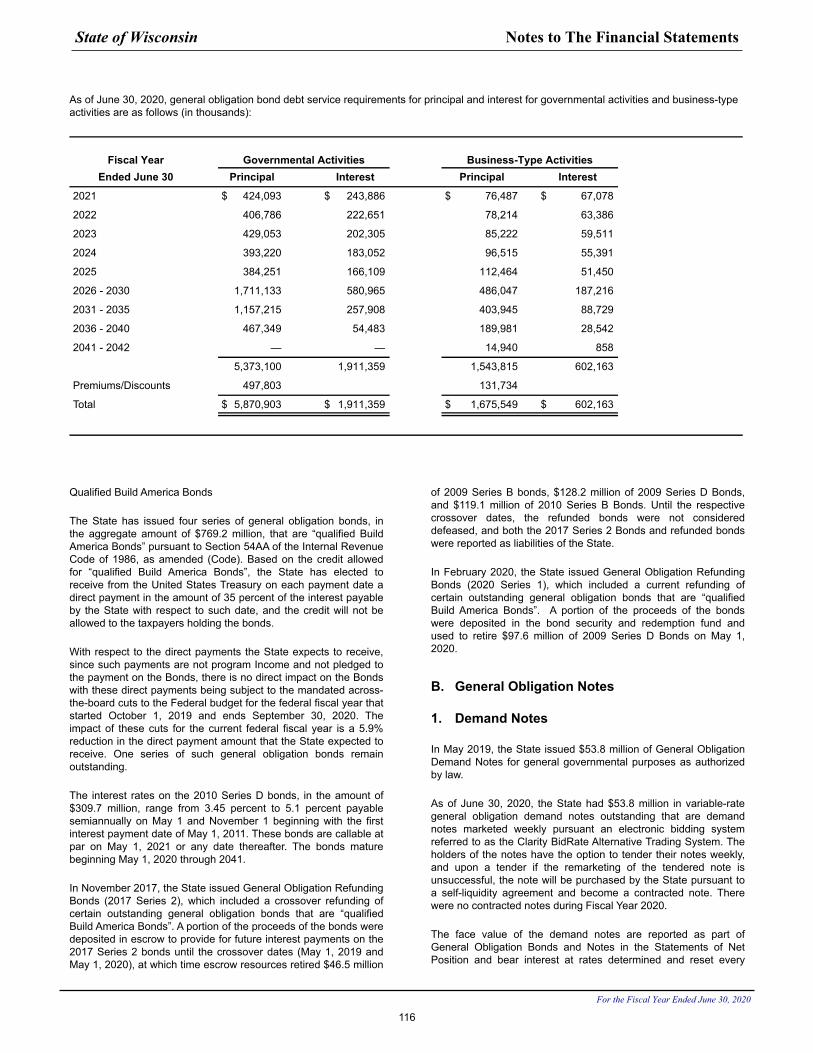
As of June 30, 2020, general obligation bond debt service requirements for principal and interest for governmental activities and business-type activities are as follows (in thousands):
Fiscal Year Governmental Activities Business-Type ActivitiesEnded June 30 Principal Interest Principal Interest
2021 $ 424,093 $ 243,886 $ 76,487 $ 67,078
2022 406,786 222,651 78,214 63,386
2023 429,053 202,305 85,222 59,511
2024 393,220 183,052 96,515 55,391
2025 384,251 166,109 112,464 51,450
2026 - 2030 1,711,133 580,965 486,047 187,216
2031 - 2035 1,157,215 257,908 403,945 88,729
2036 - 2040 467,349 54,483 189,981 28,542
2041 - 2042 — — 14,940 858
5,373,100 1,911,359 1,543,815 602,163
Premiums/Discounts 497,803 131,734
Total $ 5,870,903 $ 1,911,359 $ 1,675,549 $ 602,163
Qualified Build America Bonds
The State has issued four series of general obligation bonds, in the aggregate amount of $769.2 million, that are “qualified Build America Bonds” pursuant to Section 54AA of the Internal Revenue Code of 1986, as amended (Code). Based on the credit allowed for “qualified Build America Bonds”, the State has elected to receive from the United States Treasury on each payment date a direct payment in the amount of 35 percent of the interest payable by the State with respect to such date, and the credit will not be allowed to the taxpayers holding the bonds.
With respect to the direct payments the State expects to receive, since such payments are not program Income and not pledged to the payment on the Bonds, there is no direct impact on the Bonds with these direct payments being subject to the mandated across- the-board cuts to the Federal budget for the federal fiscal year that started October 1, 2019 and ends September 30, 2020. The impact of these cuts for the current federal fiscal year is a 5.9% reduction in the direct payment amount that the State expected to receive. One series of such general obligation bonds remain outstanding.
The interest rates on the 2010 Series D bonds, in the amount of $309.7 million, range from 3.45 percent to 5.1 percent payable semiannually on May 1 and November 1 beginning with the first interest payment date of May 1, 2011. These bonds are callable at par on May 1, 2021 or any date thereafter. The bonds mature beginning May 1, 2020 through 2041.
In November 2017, the State issued General Obligation Refunding Bonds (2017 Series 2), which included a crossover refunding of certain outstanding general obligation bonds that are “qualified Build America Bonds”. A portion of the proceeds of the bonds were deposited in escrow to provide for future interest payments on the 2017 Series 2 bonds until the crossover dates (May 1, 2019 and May 1, 2020), at which time escrow resources retired $46.5 million
of 2009 Series B bonds, $128.2 million of 2009 Series D Bonds, and $119.1 million of 2010 Series B Bonds. Until the respective crossover dates, the refunded bonds were not considered defeased, and both the 2017 Series 2 Bonds and refunded bonds were reported as liabilities of the State.
In February 2020, the State issued General Obligation Refunding Bonds (2020 Series 1), which included a current refunding of certain outstanding general obligation bonds that are “qualified Build America Bonds”. A portion of the proceeds of the bonds were deposited in the bond security and redemption fund and used to retire $97.6 million of 2009 Series D Bonds on May 1, 2020.
B. General Obligation Notes
1. Demand Notes
In May 2019, the State issued $53.8 million of General Obligation Demand Notes for general governmental purposes as authorized by law.
As of June 30, 2020, the State had $53.8 million in variable-rate general obligation demand notes outstanding that are demand notes marketed weekly pursuant an electronic bidding system referred to as the Clarity BidRate Alternative Trading System. The holders of the notes have the option to tender their notes weekly, and upon a tender if the remarketing of the tendered note is unsuccessful, the note will be purchased by the State pursuant to a self-liquidity agreement and become a contracted note. There were no contracted notes during Fiscal Year 2020.
The face value of the demand notes are reported as part of General Obligation Bonds and Notes in the Statements of Net Position and bear interest at rates determined and reset every
State of Wisconsin Notes to The Financial Statements
For the Fiscal Year Ended June 30, 2020
116
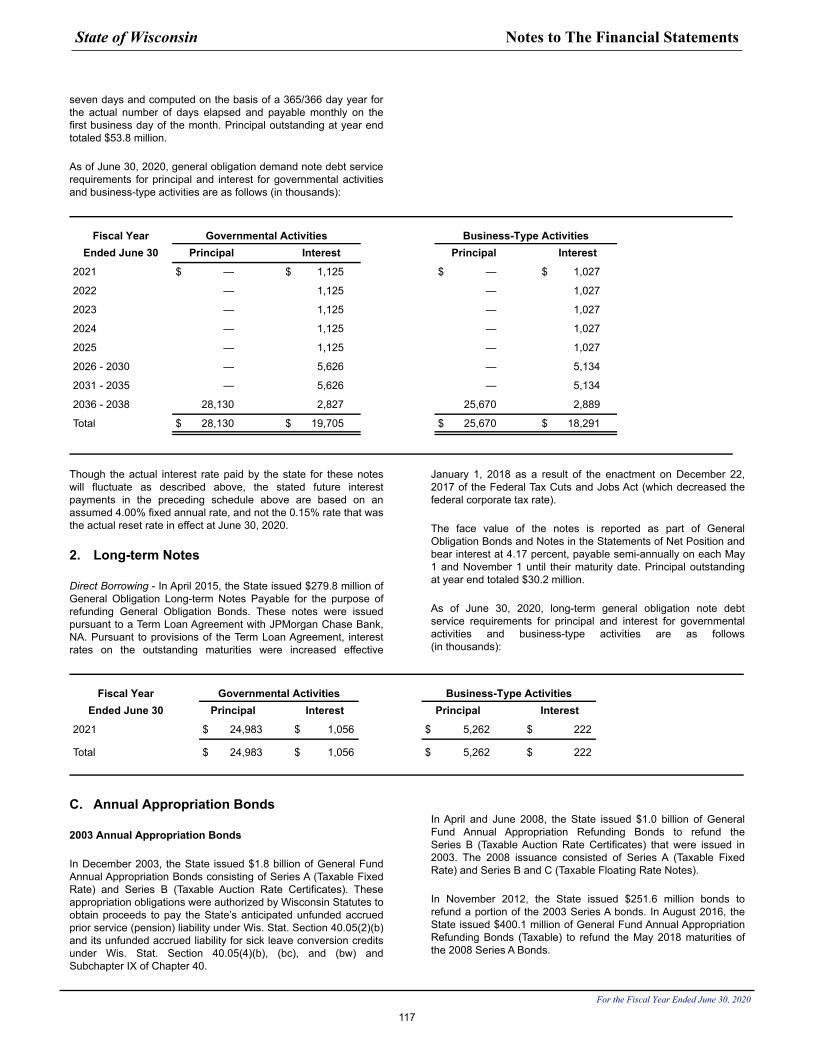
seven days and computed on the basis of a 365/366 day year for the actual number of days elapsed and payable monthly on the first business day of the month. Principal outstanding at year end totaled $53.8 million.
As of June 30, 2020, general obligation demand note debt service requirements for principal and interest for governmental activities and business-type activities are as follows (in thousands):
Fiscal Year Governmental Activities Business-Type ActivitiesEnded June 30 Principal Interest Principal Interest
2021 $ — $ 1,125 $ — $ 1,027
2022 — 1,125 — 1,027
2023 — 1,125 — 1,027
2024 — 1,125 — 1,027
2025 — 1,125 — 1,027
2026 - 2030 — 5,626 — 5,134
2031 - 2035 — 5,626 — 5,134
2036 - 2038 28,130 2,827 25,670 2,889
Total $ 28,130 $ 19,705 $ 25,670 $ 18,291
Though the actual interest rate paid by the state for these notes will fluctuate as described above, the stated future interest payments in the preceding schedule above are based on an assumed 4.00% fixed annual rate, and not the 0.15% rate that was the actual reset rate in effect at June 30, 2020.
2. Long-term Notes
Direct Borrowing - In April 2015, the State issued $279.8 million of General Obligation Long-term Notes Payable for the purpose of refunding General Obligation Bonds. These notes were issued pursuant to a Term Loan Agreement with JPMorgan Chase Bank, NA. Pursuant to provisions of the Term Loan Agreement, interest rates on the outstanding maturities were increased effective
January 1, 2018 as a result of the enactment on December 22, 2017 of the Federal Tax Cuts and Jobs Act (which decreased the federal corporate tax rate).
The face value of the notes is reported as part of General Obligation Bonds and Notes in the Statements of Net Position and bear interest at 4.17 percent, payable semi-annually on each May 1 and November 1 until their maturity date. Principal outstanding at year end totaled $30.2 million.
As of June 30, 2020, long-term general obligation note debt service requirements for principal and interest for governmental activities and business-type activities are as follows (in thousands):
Fiscal Year Governmental Activities Business-Type ActivitiesEnded June 30 Principal Interest Principal Interest
2021 $ 24,983 $ 1,056 $ 5,262 $ 222
Total $ 24,983 $ 1,056 $ 5,262 $ 222
C. Annual Appropriation Bonds
2003 Annual Appropriation Bonds
In December 2003, the State issued $1.8 billion of General Fund Annual Appropriation Bonds consisting of Series A (Taxable Fixed Rate) and Series B (Taxable Auction Rate Certificates). These appropriation obligations were authorized by Wisconsin Statutes to obtain proceeds to pay the State’s anticipated unfunded accrued prior service (pension) liability under Wis. Stat. Section 40.05(2)(b) and its unfunded accrued liability for sick leave conversion credits under Wis. Stat. Section 40.05(4)(b), (bc), and (bw) and Subchapter IX of Chapter 40.
In April and June 2008, the State issued $1.0 billion of General Fund Annual Appropriation Refunding Bonds to refund the Series B (Taxable Auction Rate Certificates) that were issued in 2003. The 2008 issuance consisted of Series A (Taxable Fixed Rate) and Series B and C (Taxable Floating Rate Notes).
In November 2012, the State issued $251.6 million bonds to refund a portion of the 2003 Series A bonds. In August 2016, the State issued $400.1 million of General Fund Annual Appropriation Refunding Bonds (Taxable) to refund the May 2018 maturities of the 2008 Series A Bonds.
State of Wisconsin Notes to The Financial Statements
For the Fiscal Year Ended June 30, 2020
117
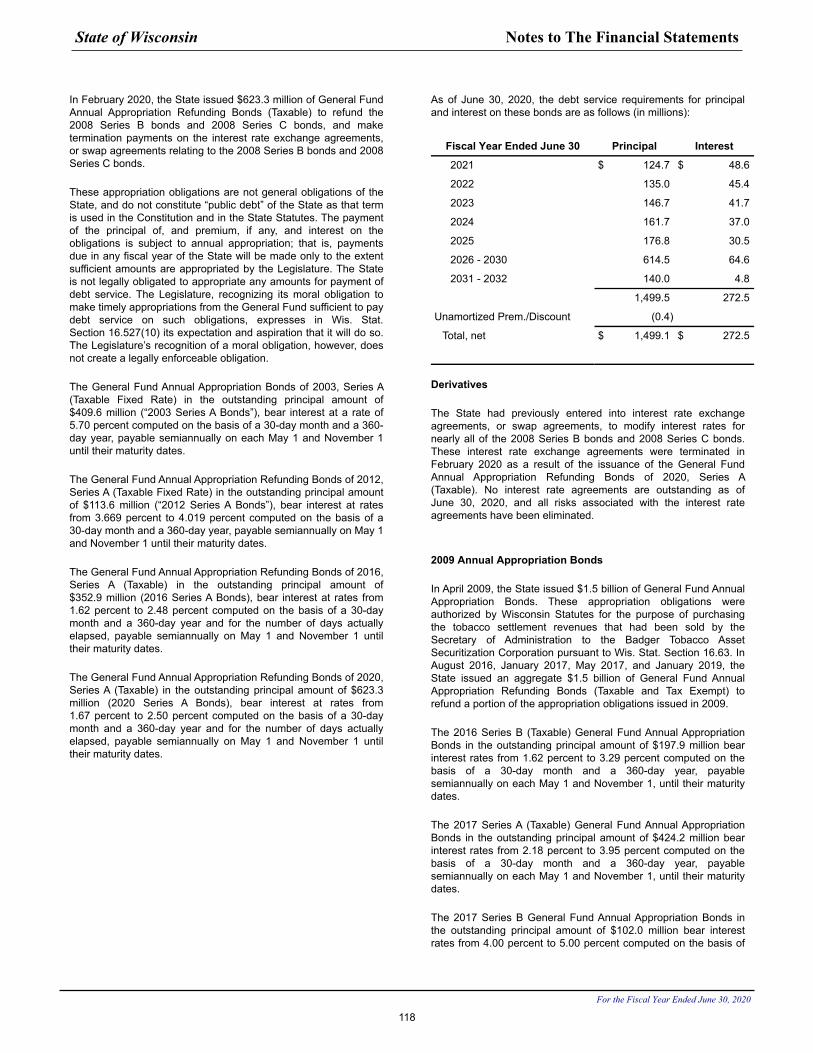
In February 2020, the State issued $623.3 million of General Fund Annual Appropriation Refunding Bonds (Taxable) to refund the 2008 Series B bonds and 2008 Series C bonds, and make termination payments on the interest rate exchange agreements, or swap agreements relating to the 2008 Series B bonds and 2008 Series C bonds.
These appropriation obligations are not general obligations of the State, and do not constitute “public debt” of the State as that term is used in the Constitution and in the State Statutes. The payment of the principal of, and premium, if any, and interest on the obligations is subject to annual appropriation; that is, payments due in any fiscal year of the State will be made only to the extent sufficient amounts are appropriated by the Legislature. The State is not legally obligated to appropriate any amounts for payment of debt service. The Legislature, recognizing its moral obligation to make timely appropriations from the General Fund sufficient to pay debt service on such obligations, expresses in Wis. Stat. Section 16.527(10) its expectation and aspiration that it will do so. The Legislature’s recognition of a moral obligation, however, does not create a legally enforceable obligation.
The General Fund Annual Appropriation Bonds of 2003, Series A (Taxable Fixed Rate) in the outstanding principal amount of $409.6 million (“2003 Series A Bonds”), bear interest at a rate of 5.70 percent computed on the basis of a 30-day month and a 360- day year, payable semiannually on each May 1 and November 1 until their maturity dates.
The General Fund Annual Appropriation Refunding Bonds of 2012, Series A (Taxable Fixed Rate) in the outstanding principal amount of $113.6 million (“2012 Series A Bonds”), bear interest at rates from 3.669 percent to 4.019 percent computed on the basis of a 30-day month and a 360-day year, payable semiannually on May 1 and November 1 until their maturity dates.
The General Fund Annual Appropriation Refunding Bonds of 2016, Series A (Taxable) in the outstanding principal amount of $352.9 million (2016 Series A Bonds), bear interest at rates from 1.62 percent to 2.48 percent computed on the basis of a 30-day month and a 360-day year and for the number of days actually elapsed, payable semiannually on May 1 and November 1 until their maturity dates.
The General Fund Annual Appropriation Refunding Bonds of 2020, Series A (Taxable) in the outstanding principal amount of $623.3 million (2020 Series A Bonds), bear interest at rates from 1.67 percent to 2.50 percent computed on the basis of a 30-day month and a 360-day year and for the number of days actually elapsed, payable semiannually on May 1 and November 1 until their maturity dates.
As of June 30, 2020, the debt service requirements for principal and interest on these bonds are as follows (in millions):
Fiscal Year Ended June 30 Principal Interest
2021 $ 124.7 $ 48.6
2022 135.0 45.4
2023 146.7 41.7
2024 161.7 37.0
2025 176.8 30.5
2026 - 2030 614.5 64.6
2031 - 2032 140.0 4.8
1,499.5 272.5
Unamortized Prem./Discount (0.4)
Total, net $ 1,499.1 $ 272.5
Derivatives
The State had previously entered into interest rate exchange agreements, or swap agreements, to modify interest rates for nearly all of the 2008 Series B bonds and 2008 Series C bonds. These interest rate exchange agreements were terminated in February 2020 as a result of the issuance of the General Fund Annual Appropriation Refunding Bonds of 2020, Series A (Taxable). No interest rate agreements are outstanding as of June 30, 2020, and all risks associated with the interest rate agreements have been eliminated.
2009 Annual Appropriation Bonds
In April 2009, the State issued $1.5 billion of General Fund Annual Appropriation Bonds. These appropriation obligations were authorized by Wisconsin Statutes for the purpose of purchasing the tobacco settlement revenues that had been sold by the Secretary of Administration to the Badger Tobacco Asset Securitization Corporation pursuant to Wis. Stat. Section 16.63. In August 2016, January 2017, May 2017, and January 2019, the State issued an aggregate $1.5 billion of General Fund Annual Appropriation Refunding Bonds (Taxable and Tax Exempt) to refund a portion of the appropriation obligations issued in 2009.
The 2016 Series B (Taxable) General Fund Annual Appropriation Bonds in the outstanding principal amount of $197.9 million bear interest rates from 1.62 percent to 3.29 percent computed on the basis of a 30-day month and a 360-day year, payable semiannually on each May 1 and November 1, until their maturity dates.
The 2017 Series A (Taxable) General Fund Annual Appropriation Bonds in the outstanding principal amount of $424.2 million bear interest rates from 2.18 percent to 3.95 percent computed on the basis of a 30-day month and a 360-day year, payable semiannually on each May 1 and November 1, until their maturity dates.
The 2017 Series B General Fund Annual Appropriation Bonds in the outstanding principal amount of $102.0 million bear interest rates from 4.00 percent to 5.00 percent computed on the basis of
State of Wisconsin Notes to The Financial Statements
For the Fiscal Year Ended June 30, 2020
118
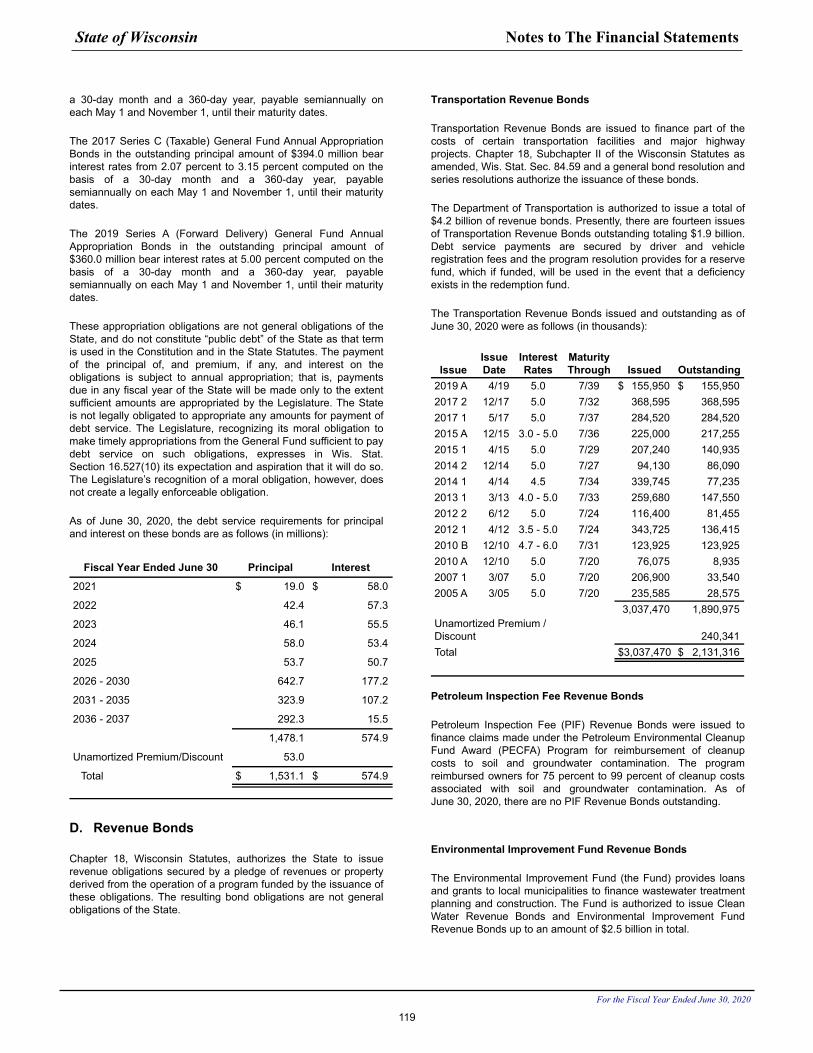
a 30-day month and a 360-day year, payable semiannually on each May 1 and November 1, until their maturity dates.
The 2017 Series C (Taxable) General Fund Annual Appropriation Bonds in the outstanding principal amount of $394.0 million bear interest rates from 2.07 percent to 3.15 percent computed on the basis of a 30-day month and a 360-day year, payable semiannually on each May 1 and November 1, until their maturity dates.
The 2019 Series A (Forward Delivery) General Fund Annual Appropriation Bonds in the outstanding principal amount of $360.0 million bear interest rates at 5.00 percent computed on the basis of a 30-day month and a 360-day year, payable semiannually on each May 1 and November 1, until their maturity dates.
These appropriation obligations are not general obligations of the State, and do not constitute “public debt” of the State as that term is used in the Constitution and in the State Statutes. The payment of the principal of, and premium, if any, and interest on the obligations is subject to annual appropriation; that is, payments due in any fiscal year of the State will be made only to the extent sufficient amounts are appropriated by the Legislature. The State is not legally obligated to appropriate any amounts for payment of debt service. The Legislature, recognizing its moral obligation to make timely appropriations from the General Fund sufficient to pay debt service on such obligations, expresses in Wis. Stat. Section 16.527(10) its expectation and aspiration that it will do so. The Legislature’s recognition of a moral obligation, however, does not create a legally enforceable obligation.
As of June 30, 2020, the debt service requirements for principal and interest on these bonds are as follows (in millions):
Fiscal Year Ended June 30 Principal Interest
2021 $ 19.0 $ 58.0
2022 42.4 57.3
2023 46.1 55.5
2024 58.0 53.4
2025 53.7 50.7
2026 - 2030 642.7 177.2
2031 - 2035 323.9 107.2
2036 - 2037 292.3 15.5
1,478.1 574.9
Unamortized Premium/Discount 53.0
Total $ 1,531.1 $ 574.9
D. Revenue Bonds
Chapter 18, Wisconsin Statutes, authorizes the State to issue revenue obligations secured by a pledge of revenues or property derived from the operation of a program funded by the issuance of these obligations. The resulting bond obligations are not general obligations of the State.
Transportation Revenue Bonds
Transportation Revenue Bonds are issued to finance part of the costs of certain transportation facilities and major highway projects. Chapter 18, Subchapter II of the Wisconsin Statutes as amended, Wis. Stat. Sec. 84.59 and a general bond resolution and series resolutions authorize the issuance of these bonds.
The Department of Transportation is authorized to issue a total of $4.2 billion of revenue bonds. Presently, there are fourteen issues of Transportation Revenue Bonds outstanding totaling $1.9 billion. Debt service payments are secured by driver and vehicle registration fees and the program resolution provides for a reserve fund, which if funded, will be used in the event that a deficiency exists in the redemption fund.
The Transportation Revenue Bonds issued and outstanding as of June 30, 2020 were as follows (in thousands):
IssueIssueDate
InterestRates
MaturityThrough Issued Outstanding
2019 A 4/19 5.0 7/39 $ 155,950 $ 155,950 2017 2 12/17 5.0 7/32 368,595 368,595 2017 1 5/17 5.0 7/37 284,520 284,520 2015 A 12/15 3.0 - 5.0 7/36 225,000 217,255 2015 1 4/15 5.0 7/29 207,240 140,935 2014 2 12/14 5.0 7/27 94,130 86,090 2014 1 4/14 4.5 7/34 339,745 77,235 2013 1 3/13 4.0 - 5.0 7/33 259,680 147,550 2012 2 6/12 5.0 7/24 116,400 81,455 2012 1 4/12 3.5 - 5.0 7/24 343,725 136,415 2010 B 12/10 4.7 - 6.0 7/31 123,925 123,925 2010 A 12/10 5.0 7/20 76,075 8,935 2007 1 3/07 5.0 7/20 206,900 33,540 2005 A 3/05 5.0 7/20 235,585 28,575
3,037,470 1,890,975 Unamortized Premium / Discount 240,341 Total $ 3,037,470 $ 2,131,316
Petroleum Inspection Fee Revenue Bonds
Petroleum Inspection Fee (PIF) Revenue Bonds were issued to finance claims made under the Petroleum Environmental Cleanup Fund Award (PECFA) Program for reimbursement of cleanup costs to soil and groundwater contamination. The program reimbursed owners for 75 percent to 99 percent of cleanup costs associated with soil and groundwater contamination. As of June 30, 2020, there are no PIF Revenue Bonds outstanding.
Environmental Improvement Fund Revenue Bonds
The Environmental Improvement Fund (the Fund) provides loans and grants to local municipalities to finance wastewater treatment planning and construction. The Fund is authorized to issue Clean Water Revenue Bonds and Environmental Improvement Fund Revenue Bonds up to an amount of $2.5 billion in total.
State of Wisconsin Notes to The Financial Statements
For the Fiscal Year Ended June 30, 2020
119
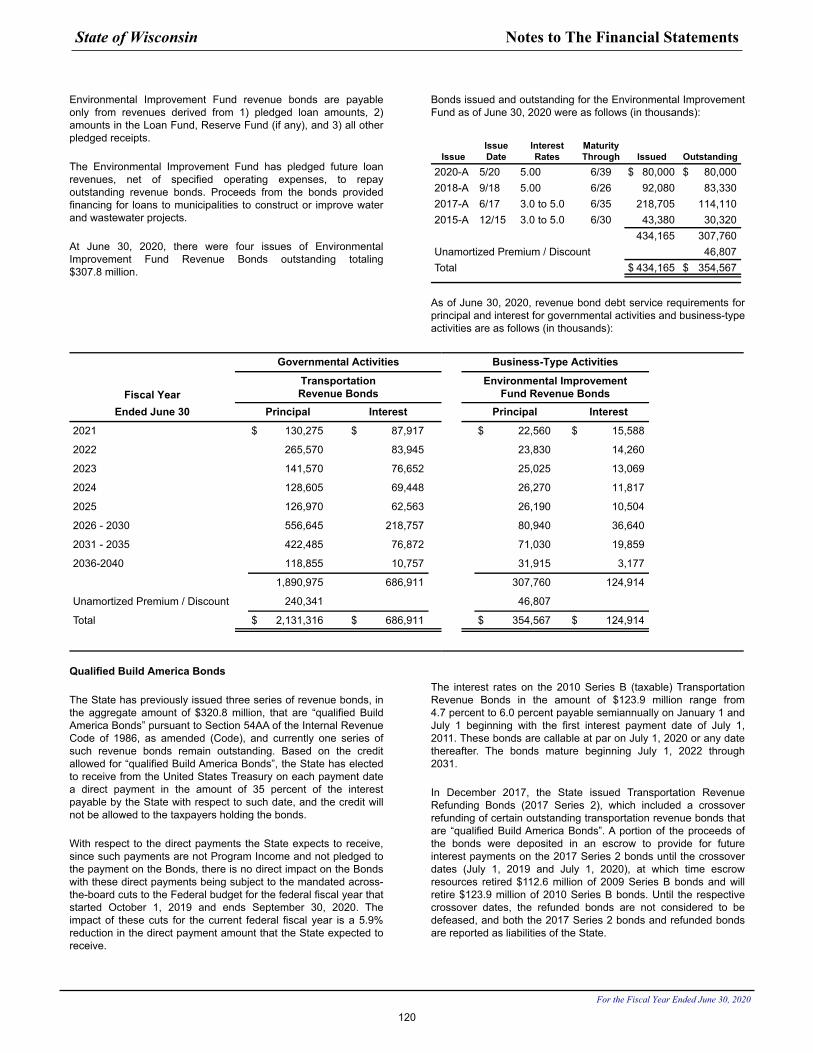
Environmental Improvement Fund revenue bonds are payable only from revenues derived from 1) pledged loan amounts, 2) amounts in the Loan Fund, Reserve Fund (if any), and 3) all other pledged receipts.
The Environmental Improvement Fund has pledged future loan revenues, net of specified operating expenses, to repay outstanding revenue bonds. Proceeds from the bonds provided financing for loans to municipalities to construct or improve water and wastewater projects.
At June 30, 2020, there were four issues of Environmental Improvement Fund Revenue Bonds outstanding totaling $307.8 million.
Bonds issued and outstanding for the Environmental Improvement Fund as of June 30, 2020 were as follows (in thousands):
IssueIssueDate
InterestRates
MaturityThrough Issued Outstanding
2020-A 5/20 5.00 6/39 $ 80,000 $ 80,000 2018-A 9/18 5.00 6/26 92,080 83,330 2017-A 6/17 3.0 to 5.0 6/35 218,705 114,110 2015-A 12/15 3.0 to 5.0 6/30 43,380 30,320
434,165 307,760 Unamortized Premium / Discount 46,807 Total $ 434,165 $ 354,567
As of June 30, 2020, revenue bond debt service requirements for principal and interest for governmental activities and business-type activities are as follows (in thousands):
Governmental Activities Business-Type Activities
Fiscal YearTransportationRevenue Bonds
Environmental ImprovementFund Revenue Bonds
Ended June 30 Principal Interest Principal Interest
2021 $ 130,275 $ 87,917 $ 22,560 $ 15,588
2022 265,570 83,945 23,830 14,260
2023 141,570 76,652 25,025 13,069
2024 128,605 69,448 26,270 11,817
2025 126,970 62,563 26,190 10,504
2026 - 2030 556,645 218,757 80,940 36,640
2031 - 2035 422,485 76,872 71,030 19,859
2036-2040 118,855 10,757 31,915 3,177
1,890,975 686,911 307,760 124,914
Unamortized Premium / Discount 240,341 46,807
Total $ 2,131,316 $ 686,911 $ 354,567 $ 124,914
Qualified Build America Bonds
The State has previously issued three series of revenue bonds, in the aggregate amount of $320.8 million, that are “qualified Build America Bonds” pursuant to Section 54AA of the Internal Revenue Code of 1986, as amended (Code), and currently one series of such revenue bonds remain outstanding. Based on the credit allowed for “qualified Build America Bonds”, the State has elected to receive from the United States Treasury on each payment date a direct payment in the amount of 35 percent of the interest payable by the State with respect to such date, and the credit will not be allowed to the taxpayers holding the bonds.
With respect to the direct payments the State expects to receive, since such payments are not Program Income and not pledged to the payment on the Bonds, there is no direct impact on the Bonds with these direct payments being subject to the mandated across- the-board cuts to the Federal budget for the federal fiscal year that started October 1, 2019 and ends September 30, 2020. The impact of these cuts for the current federal fiscal year is a 5.9% reduction in the direct payment amount that the State expected to receive.
The interest rates on the 2010 Series B (taxable) Transportation Revenue Bonds in the amount of $123.9 million range from 4.7 percent to 6.0 percent payable semiannually on January 1 and July 1 beginning with the first interest payment date of July 1, 2011. These bonds are callable at par on July 1, 2020 or any date thereafter. The bonds mature beginning July 1, 2022 through 2031.
In December 2017, the State issued Transportation Revenue Refunding Bonds (2017 Series 2), which included a crossover refunding of certain outstanding transportation revenue bonds that are “qualified Build America Bonds”. A portion of the proceeds of the bonds were deposited in an escrow to provide for future interest payments on the 2017 Series 2 bonds until the crossover dates (July 1, 2019 and July 1, 2020), at which time escrow resources retired $112.6 million of 2009 Series B bonds and will retire $123.9 million of 2010 Series B bonds. Until the respective crossover dates, the refunded bonds are not considered to be defeased, and both the 2017 Series 2 bonds and refunded bonds are reported as liabilities of the State.
State of Wisconsin Notes to The Financial Statements
For the Fiscal Year Ended June 30, 2020
120
E. Refundings, Exchanges and Early Extinguishments
Refunding Provisions of GASB Statement No. 23
The State implemented the provisions of GASB Statement No. 23. Accounting and Financial Reporting for Refunding of Debt Reported by Proprietary Activities beginning with Fiscal Year 1996. This Statement requires proprietary activities to adopt certain accounting and reporting changes for both current refunding and advance refunding resulting in defeasance of debt. GASB Statement No. 23 permits, but does not require, retroactive application of its provisions. The State has chosen not to apply the provisions retroactively to previously issued financial statements.
Current Fiscal Year Refundings/General Obligation Bonds
In October 2019, the State issued $329.7 million of general obligation refunding bonds (2019 Series 1), the proceeds of $327.9 million were deposited in an escrow account to provide for future debt service payments and redemption of $307.4 million of various general obligation bonds for which future debt service payments and redemption are paid from the escrow account are considered defeased and the associated liability removed from the financial statements. The refunding resulted in a decrease in total debt service payments by $34.7 million and an economic gain of $33.6 million.
In February 2020, the State issued $108.7 million of general obligation refunding bonds (2020 Series 1), the proceeds of $142.5 million were deposited in the bond security and redemption fund for the redemption of $138.6 million of various general obligation bonds for which redemption was paid from the bond security and redemption fund are considered defeased and the associated liability removed from the financial statements. The refunding resulted in a decrease in total debt service payments by $26.8 million and an economic gain of $22.8 million.
In February 2020, the State issued $218.3 million of general obligation refunding bonds (2020 Series 2), the proceeds of $217.2 million were deposited in an escrow account to provide for future debt service payments and redemption of $201.1 million of various general obligation bonds for which future debt service payments and redemption are paid from the escrow account are considered defeased and the associated liability removed from the financial statements. The refunding resulted in a decrease in total debt service payments by $12.9 million and an economic gain of $15.3 million.
Prior Year Refundings/General Obligation Bonds
Government Accounting Standards Board Statement No. 7, Advance Refundings Resulting in Defeasance of Debt, provides that refunded debt and assets placed in escrow for the payment of related debt service be excluded from the financial statements. At June 30, 2020, $1,917.7 million of general obligation bond principal has been defeased.
Current Year Refundings/Annual Appropriation Bonds
In February 2020, the State issued $623.3 million of General Fund Annual Appropriation Refunding Bonds (Taxable) to refund the 2008 Series B bonds and 2008 Series C bonds, and make termination payments on the interest rate exchange agreements, or swap agreements relating to the 2008 Series B bonds and 2008 Series C bonds. The refunding resulted in a decrease in total debt
service payments by $6.8 million and an economic gain of $7.9 million.
Current Fiscal Year Refundings/Revenue Bonds
No refunding revenue issues occurred in Fiscal Year 2020.
Prior Year Refundings/Revenue Bonds
For financial reporting purposes, the following primary government revenue bonds have been defeased, and therefore, removed as a liability from the balance sheet:
• Environmental Improvement Fund revenue bonds – At June 30, 2020, revenue bonds outstanding of $357.0 million have been defeased.
• Transportation Revenue Bonds – At June 30, 2020, revenue bonds outstanding of $307.9 million have been defeased.
F. Short-term Financing
The State of Wisconsin Building Commission, an agency of the State, is empowered by law to consider, authorize, issue, and sell debt obligations of the State. To date, the Commission has authorized the issuance of notes. When this short-term debt does not meet long-term financing criteria, it is classified among fund liabilities.
General Obligation Commercial Paper Notes
The State has authorized General Obligation Commercial Paper Notes for the acquisition, construction, development, extension, enlargement, or improvement of land, waters, property, highway, buildings, equipment or facilities. Periodically, additional commercial paper notes are issued to pay for maturing commercial paper notes.
The State intends to make annual May 1 payments on the outstanding commercial paper notes that reflect principal amortization of the notes. The State also intends to make regular payments to the issuing and paying agent that will be used to pay interest due on maturing notes. On June 30, 2020, the amount of commercial paper notes outstanding was $149.5 million which had interest rates ranging from 0.15 percent to 1.20 percent and maturities ranging from July 2, 2020 to August 6, 2020.
Short-term debt activity for the year ended June 30, 2020 for general obligation commercial paper notes was as follows (in millions):
Balance BalanceJuly 1, 2019 Additions Reductions June 30, 2020
$ 149.5 $ — $ — $ 149.5
General Obligation Extendible Municipal Commercial Paper
The State has authorized General Obligation extendible municipal commercial paper for the acquisition, construction, development, extension, enlargement, or improvement of land, waters, property, highway, buildings, equipment or facilities. Periodically, additional extendible municipal commercial papers are issued to pay for
State of Wisconsin Notes to The Financial Statements
For the Fiscal Year Ended June 30, 2020
121
maturing extendible municipal commercial paper. The State intends to make annual May 1 payments on the outstanding commercial paper notes that reflect principal amortization of the paper. The State also intends to make regular payments to the issuing and paying agent that will be used to pay the interest due on the maturing notes. At June 30, 2020, the amount of extendible municipal commercial paper outstanding was $171.1 million which had interest rates ranging from 0.22 percent to 1.11 percent and maturities from July 1, 2020, to September 2, 2020.
Short-term debt activity for the year ended June 30, 2020 for general obligation extendible municipal commercial paper was as follows (in millions):
Balance BalanceJuly 1, 2019 Additions Reductions June 30, 2020
$ 171.1 $ — $ — $ 171.1
G. Certificates of Participation
The State established a facility in 1992 that provides lease purchase financing for property and certain service items acquired by state agencies. This facility is the Third Amended and Restated Master Lease between the State acting by and through the Department of Administration and U.S. Bank National Association. Lease purchase obligations under the Master Lease are not general obligations of the State but are payable from appropriations of State agencies participating in the Master Lease Program, subject to annual appropriation. The interest component of each lease/purchase payment is subject to a separate determination.
Pursuant to the terms and conditions of this agreement, the trustee for the facility issues parity Master Lease certificates of participation that evidence proportionate interest of the owners thereof in lease payments. A common pool of collateral ratably secures all Master Lease certificates. Title in the property and service items purchased under the facility remains with the State and the State grants to the Trustee, for the benefit of all Master Lease certificate holders, a first security interest in the leased items.
The outstanding balance as of June 30, 2020 was as follows:
Average LifeBalance Due (Weighted Term)
$83.3 million 2.03 Years
At June 30, 2020, the following parity Master Lease certificates were outstanding:
• Master Lease Certificates of Participation of 2013, Series A (Revolving Credit Agreement – Taxable) in the amount of $11.5 million. This Master Lease certificate evidences the State's obligation to repay advances under a Revolving Credit Agreement, dated September 1, 2013, as amended between U.S. Bank National Association (as trustee), the State of Wisconsin, acting by and through its Department of Administration, as lessee, and PNC Bank National Association. The scheduled termination date under the Revolving Credit Agreement, as amended, is September 1, 2020. This Master Lease certificate shall bear interest at the
rates and mature on the dates provided for in the Revolving Credit Agreement. The balance of this Master Lease certificate may include some accrued interest that will be payable at the next semi-annual interest payment date.
• Master Lease Certificates of Participation of 2014, Series A, in the amount of $13.5 million. This series of Master Lease certificates has interest rates ranging from 2.75 percent to 5.0 percent and matures semi-annually through March 1, 2023.
• Master Lease Certificates of Participation of 2014, Series B in the amount of $13.8 million. This series of Master Lease certificates has interest rates ranging from 2.10 to 5.00 percent and matures semi-annually through March 1, 2023.
• Master Lease Certificates of Participation of 2015, Series A in the amount of $19.9 million. This series of Master Lease certificates has interest rates ranging from 3.0 to 5.0 percent and matures semi-annually through March 1, 2023.
• Master Lease Certificates of Participation of 2016, Series A in the amount of $7.0 million. This series of Master Lease certificates has interest rates ranging from 3.0 to 5.0 percent and matures semi-annually through March 1, 2023.
• Master Lease Certificates of Participation of 2018, Series A in the amount of $17.5 million. This series of Master Lease certificates has interest rates ranging from 3.0 to 5.0 percent and matures semi-annually through March 1, 2023,
The Third Amended and Restated Master Lease 1992-1 provides that certain lease schedules to the facility can be terminated if the State deposits with the Trustee an amount that is equal to the outstanding amount of the lease schedule, or in amounts that are sufficient to purchase investments that mature on dates and in amounts to make the lease payments when due. At June 30, 2020, the State has not deposited with the Trustee amounts, that when invested, will terminate lease schedules.
H. Arbitrage Rebate
The Tax Reform Act of 1986 requires that governmental entities issuing tax-exempt debt subsequent to August 1986, calculate and rebate arbitrage earnings to the federal government. Specifically, the excess of the aggregated amount earned on investments purchased with bond proceeds over the amount that would have been earned if the proceeds were invested at a rate equal to the bond yield, is to be rebated to the federal government. As of June 30, 2020, a liability for arbitrage rebate did not exist.
I. Moral Obligation DebtThrough legislation enacted in 1999, the State authorized the creation of local districts. These districts (Wisconsin Center District, Southeast Wisconsin Professional Baseball Park District, and the Green Bay/Brown County Professional Football Stadium District) are authorized to issue bonds for their respective purpose, and if the State determines that certain conditions are satisfied, the State may have a moral obligation to appropriate moneys to make up deficiencies in the districts' special debt service reserve funds. To date, the Wisconsin Center District has the authority for up to $300.0 million in bonds for this purpose, plus refunding bonds, and has two outstanding refunding series with an outstanding balance of $111.8 million that is subject to the moral
State of Wisconsin Notes to The Financial Statements
For the Fiscal Year Ended June 30, 2020
122
obligation. In addition, in April 2020 the Wisconsin Center District authorized up to an additional $300.0 million of bonds for this purpose that may, subject to State determination that certain conditions are met, be subject to the moral obligation.
In December 2020, The Wisconsin Center District issued $300 million in Junior Dedicated Tax Revenue Bonds Series 2020 D; and, the Secretary of Administration designated the State’s moral obligation pledge to appropriate moneys to make up deficiencies in the debt service reserve fund for $300.0 million of Wisconsin Center District Junior Dedicated Tax Revenue Bonds. This pledge does not exceed the amount provided for in law for such purpose.
The two other local districts each have authority to issue $160.0 million of revenue obligations that, subject to the Secretary of Administration’s determination that certain conditions have been met, could carry a moral obligation of the State. All the districts have issued revenue obligations that do not carry the moral obligation of the State.
Through legislation enacted in 1999, the State authorized the issuance of up to $170.0 million principal amount of bonds to finance the development or redevelopment of sites and facilities to be used for public schools. If certain conditions are satisfied, and if a special debt service reserve fund is created for the bonds, the State will provide a moral obligation pledge, which would restore the special debt reserve fund established for the bonds to an amount not to exceed the maximum annual debt service on the bonds. One bond issue with an outstanding balance of $29.1 million has been issued that have a special debt service reserve fund secured by the State’s moral obligation.
Through legislation enacted in 2017, subject to the Secretary of Administration’s designation and determination of certain conditions being met, the State may provide a moral obligation pledge for up to 40% of a local governmental unit’s aggregate municipal obligations issued to finance costs related to development occurring in, or for the benefit of, the electronics and information technology manufacturing zone. To date, one series of the Village of Mount Pleasant Tax Increment Revenue Bonds were issued in 2018 with an outstanding balance of $120.0 million that is subject to the moral obligation.
J. Credit Agreements
In March 2019, the State entered into a credit agreement that provides the State a line of credit for liquidity support for up to $185.0 million of general obligation commercial paper notes. In January 2020, the line of credit was reduced to $155.0 million. As of June 30, 2020, $155.0 million was unused and available. The line of credit expires in March 2021, but is subject to termination and renewal as provided for in the credit agreement. The cost of this line of credit is 0.180 percent per year.
State of Wisconsin Notes to The Financial Statements
For the Fiscal Year Ended June 30, 2020
123
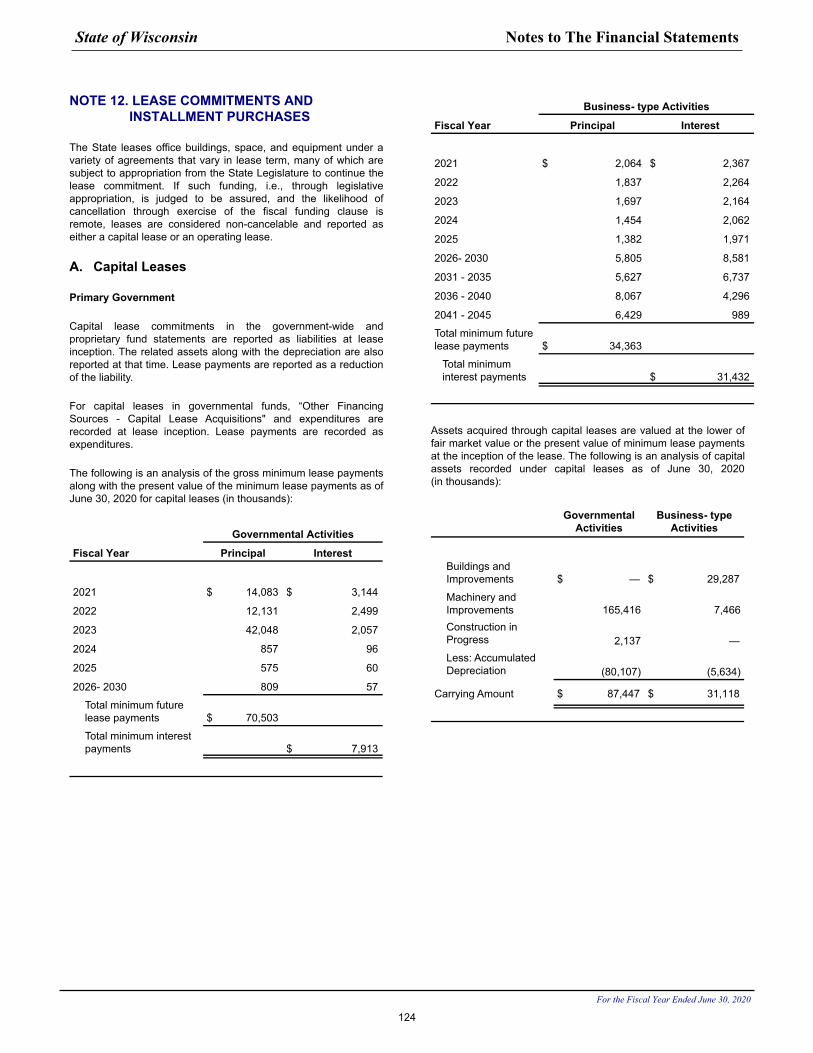
NOTE 12. LEASE COMMITMENTS AND INSTALLMENT PURCHASES
The State leases office buildings, space, and equipment under a variety of agreements that vary in lease term, many of which are subject to appropriation from the State Legislature to continue the lease commitment. If such funding, i.e., through legislative appropriation, is judged to be assured, and the likelihood of cancellation through exercise of the fiscal funding clause is remote, leases are considered non-cancelable and reported as either a capital lease or an operating lease.
A. Capital Leases
Primary Government
Capital lease commitments in the government-wide and proprietary fund statements are reported as liabilities at lease inception. The related assets along with the depreciation are also reported at that time. Lease payments are reported as a reduction of the liability.
For capital leases in governmental funds, “Other Financing Sources - Capital Lease Acquisitions" and expenditures are recorded at lease inception. Lease payments are recorded as expenditures.
The following is an analysis of the gross minimum lease payments along with the present value of the minimum lease payments as of June 30, 2020 for capital leases (in thousands):
Governmental Activities
Fiscal Year Principal Interest
2021 $ 14,083 $ 3,144
2022 12,131 2,499
2023 42,048 2,057
2024 857 96
2025 575 60
2026- 2030 809 57
Total minimum future lease payments $ 70,503
Total minimum interest payments $ 7,913
Business- type Activities
Fiscal Year Principal Interest
2021 $ 2,064 $ 2,367
2022 1,837 2,264
2023 1,697 2,164
2024 1,454 2,062
2025 1,382 1,971
2026- 2030 5,805 8,581
2031 - 2035 5,627 6,737
2036 - 2040 8,067 4,296
2041 - 2045 6,429 989
Total minimum future lease payments $ 34,363
Total minimum interest payments $ 31,432
Assets acquired through capital leases are valued at the lower of fair market value or the present value of minimum lease payments at the inception of the lease. The following is an analysis of capital assets recorded under capital leases as of June 30, 2020 (in thousands):
GovernmentalActivities
Business- type Activities
Buildings and Improvements $ — $ 29,287
Machinery and Improvements 165,416 7,466Construction in Progress 2,137 — Less: Accumulated Depreciation (80,107) (5,634)
Carrying Amount $ 87,447 $ 31,118
State of Wisconsin Notes to The Financial Statements
For the Fiscal Year Ended June 30, 2020
124
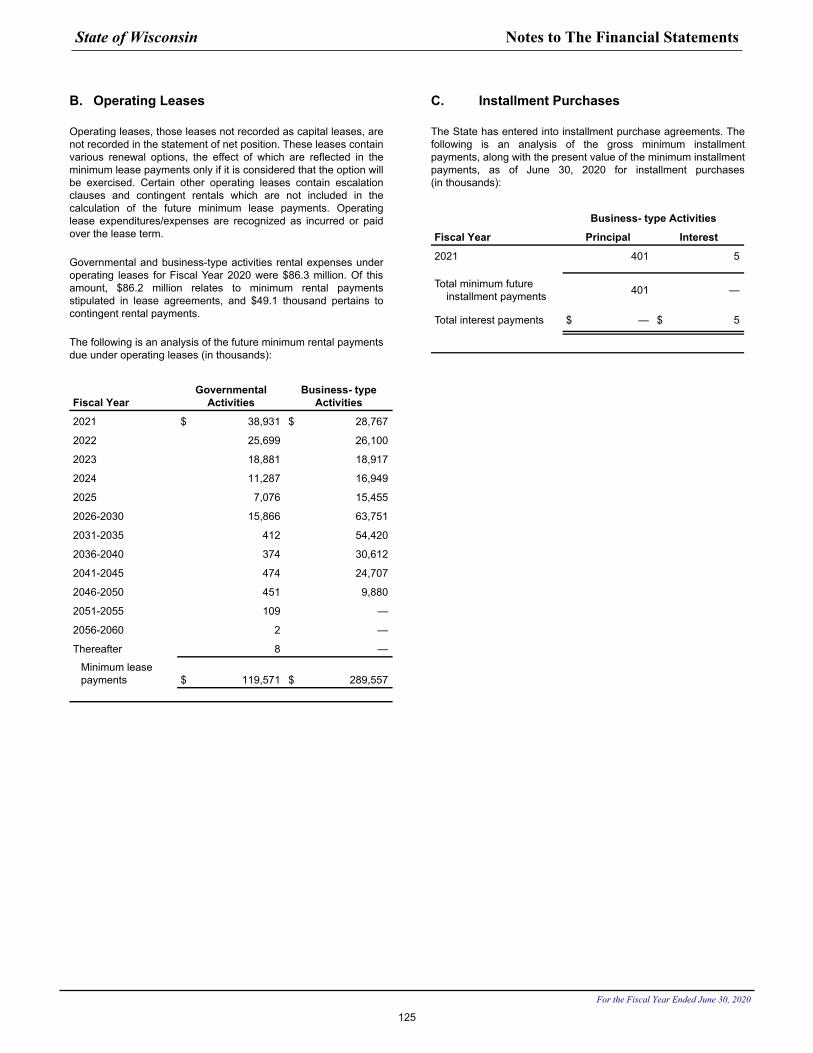
B. Operating Leases
Operating leases, those leases not recorded as capital leases, are not recorded in the statement of net position. These leases contain various renewal options, the effect of which are reflected in the minimum lease payments only if it is considered that the option will be exercised. Certain other operating leases contain escalation clauses and contingent rentals which are not included in the calculation of the future minimum lease payments. Operating lease expenditures/expenses are recognized as incurred or paid over the lease term.
Governmental and business-type activities rental expenses under operating leases for Fiscal Year 2020 were $86.3 million. Of this amount, $86.2 million relates to minimum rental payments stipulated in lease agreements, and $49.1 thousand pertains to contingent rental payments.
The following is an analysis of the future minimum rental payments due under operating leases (in thousands):
Fiscal YearGovernmental
ActivitiesBusiness- type
Activities
2021 $ 38,931 $ 28,767
2022 25,699 26,100
2023 18,881 18,917
2024 11,287 16,949
2025 7,076 15,455
2026-2030 15,866 63,751
2031-2035 412 54,420
2036-2040 374 30,612
2041-2045 474 24,707
2046-2050 451 9,880
2051-2055 109 —
2056-2060 2 —
Thereafter 8 —
Minimum lease payments $ 119,571 $ 289,557
C. Installment Purchases
The State has entered into installment purchase agreements. The following is an analysis of the gross minimum installment payments, along with the present value of the minimum installment payments, as of June 30, 2020 for installment purchases (in thousands):
Business- type Activities
Fiscal Year Principal Interest
2021 401 5
Total minimum future installment payments 401 —
Total interest payments $ — $ 5
State of Wisconsin Notes to The Financial Statements
For the Fiscal Year Ended June 30, 2020
125
NOTE 13. POLLUTION REMEDIATION AND ASSET RETIREMENT OBLIGATIONS
Pollution Remediation Obligations
Governmental Accounting Standards Board (GASB) Statement No. 49, Accounting and Financial Reporting for Pollution Remediation Obligations, establishes accounting and financial reporting standards for pollution remediation obligations. These are obligations to address the current or potential detrimental effects of existing pollution by participating in pollution remediation activities such as site assessments and cleanups. The scope of the standard excludes pollution prevention or control obligations with respect to current operations, and future pollution remediation obligations that are required upon retirement of an asset, such as landfill closure and post closure care and nuclear power plant decommissioning.
Measurement of Obligations
GASB Statement No. 49 requires the State to calculate pollution remediation obligations using the expected cash flow technique. These estimates are subject to change over time. Costs may vary due to price fluctuations, changes in technology, changes in potential responsible parties, results of environmental studies, changes to statutes or regulations and other factors. Recoveries from other responsible parties may reduce the State’s obligation. In accordance with the standard, if the State cannot reasonably estimate a pollution remediation obligation, it does not report a liability. Under specific circumstances capital assets may be created when pollution remediation is performed. The State has adopted a minimum reporting threshold of $1.0 million. Therefore, only remediation sites with outlays estimated to meet or exceed that amount are reported in the financial statements.
During the fiscal year, the State expended $0.3 million to clean up sites. Estimates of existing pollution remediation liabilities were also increased by $4.0 million. In total, the beginning liability of $4.7 million increased to $8.4 million. There were no recoveries received from other responsible parties during the fiscal year and none are expected for the identified obligations.
Identified Remediation Obligations
Pollution remediation liabilities are updated annually and are based on engineering studies and the judgment of agency officials. The following table shows liabilities included in the Statement of Net Position as of June 30, 2020 (in millions):
Nature and Sourceof Pollution
EstimatedLiability
EstimatedRecovery
Contract agreement with EPA to clean up Superfund site for former wood treatment facility
$ 0.5 $ —
Voluntary commencement by the State to clean up heavy metal contamination of canal near former industrial site
7.9 —
Total estimated obligations $ 8.4 $ —
In addition to the liability reported in the table above, the State expects to incur estimated costs of $27,000 per year indefinitely to pump and treat contamination at a former chrome plating facility. The State also expects to incur estimated costs of $70,000 per year indefinitely to operate and maintain a closed landfill. Both are Superfund sites and estimated total remediation costs for them cannot be reasonably determined. Therefore, a liability has not been reported in the Statement of Net Position for either site.
Asset Retirement Obligations
GASB Statement No. 83, Certain Asset Retirement Obligations (GASB 83), establishes criteria for determining the timing and pattern of recognition of a liability and a corresponding deferred outflow of resources for asset retirement obligations. In accordance with the statement, the University of Wisconsin System has recognized asset retirement obligations of $12.2 million as of June 30, 2020, related to decommissioning costs for a nuclear research reactor. This obligation was recognized based on the best estimate of the current value of outlays expected to be incurred. The corresponding deferred outflow of resources is amortized over the estimated remaining useful life of the associated tangible capital asset coinciding with a licensure period through the year 2031. The University of Wisconsin System has issued a statement to the U.S. Nuclear Regulatory Commission of intent to obtain funds necessary for decommissioning, when necessary. No restricted assets are set aside for payment of the asset retirement obligations.
State of Wisconsin Notes to The Financial Statements
For the Fiscal Year Ended June 30, 2020
126
NOTE 14. RETIREMENT PLAN
The Wisconsin Retirement System (WRS) was established and is administered by the State of Wisconsin to provide pension benefits for State and local government public employees. The WRS consists of the Core Retirement Investment Trust, the Variable Retirement Investment Trust, and the Police and Firefighters Trust. Although separated for accounting purposes, the assets of these trust funds can be used to pay benefits for any member of the WRS, and are reported as one pension plan.
The WRS is considered part of the State of Wisconsin’s financial reporting entity. Copies of the separately issued financial report that includes audited financial statements and required supplementary information for the year ending December 31, 2019, is available at www.etf.wi.gov.
Plan Description
The WRS, governed by Chapter 40 of the Wisconsin Statutes, is a cost-sharing multiple-employer defined benefit pension plan administered by the Department of Employee Trust Funds. Benefit terms may only be modified by the Legislature. It provides coverage to all eligible State of Wisconsin, local government and other public employees. All employees, initially employed by a participating WRS employer prior to July 1, 2011, expected to work at least 600 hours a year (440 hours for teachers and school district educational support employees) and expected to be employed for at least one year from employee’s date of hire are eligible to participate in the WRS. All employees, initially employed by a participating WRS employer on or after July 1, 2011, and expected to work at least 1200 hours a year (880 hours for teachers and school district educational support employees) and expected to be employed for at least one year from employee’s date of hire are eligible to participate in the WRS. Note: Employees hired to work nine or ten months per year, (e.g. teachers contracts), but expected to return year after year are considered to have met the one-year requirement.
As of December 31, 2019, the number of participating employers was:
State Agencies 56 Cities 188 Counties 71 Villages 274 Towns 272 School Districts 421 Wisconsin Technical College System Board Districts 16 Cooperative Educational Service Agencies 12 Other 206
Total Employers 1,516
For employees beginning participation on or after January 1, 1990 and no longer actively employed on or after April 24, 1998, creditable service in each of five years is required for eligibility for a retirement annuity. Participants employed prior to 1990 and on or after April 24, 1998 and prior to July 1, 2011 are immediately vested. Participants who initially became WRS eligible on or after July 1, 2011 must have five years of creditable service to be
vested. Employees who retire at or after age 65 (54 for protective occupation employees, 62 for elected officials and State executive participants) are entitled to receive an unreduced retirement benefit. The factors influencing the benefit are: (1) final average earnings, (2) years of creditable service, and (3) a formula factor.
Final average earnings is the average of the participant's three highest years' earnings. Creditable service is the creditable current and prior service expressed in years or decimal equivalents of partial years for which a participant receives earnings and makes contributions as required. The formula factor is a standard percentage based on employment category.
Vested employees may retire at age 55 (50 for protective occupation employees) and receive reduced benefits. Employees terminating covered employment before becoming eligible for a retirement benefit may withdraw their contributions and forfeit all rights to any subsequent benefits, or may leave contributions on deposit and defer application until eligible to receive a retirement benefit. The WRS also provides death and disability benefits for employees.
The Employee Trust Funds Board may periodically adjust annuity payments from the WRS based on annual investment performance in accordance with s. 40.27, Wis. Stat. An increase (or decrease) in annuity payment may result when investment gains (losses), together with other actuarial experience factors, create a surplus (shortfall) in the reserves, as determined by the WRS’ consulting actuary. Annuity increases are not based on cost of living or other similar factors. For Core Retirement Investment Trust annuities, decreases may be applied only to previously granted increases. By law, Core Retirement Investment Trust fund annuities cannot be reduced to an amount below the original, guaranteed amount set at retirement.
Accounting Policies and Plan Asset Matters
The financial statements of the WRS have been prepared in accordance with generally accepted accounting principles, using the flow of economic resources measurement focus and a full accrual basis of accounting. Under the accrual basis of accounting, revenues are recorded when earned and expenses are recorded at the time the liabilities are incurred. Plan member contributions are recognized in the period in which contributions are paid. Employer contributions to the plan are recognized in the accounting period in which the underlying earnings on which the contributions are based are paid and the employer has made a formal commitment to provide contributions. Benefits and refunds are recognized when due and payable in accordance with the terms of the plan.
All assets of the WRS are invested by the State of Wisconsin Investment Board. The retirement fund assets consist of shares in the Variable Retirement Investment Trust and the Core Retirement Investment Trust. The Variable Retirement Investment Trust consists primarily of equity securities. The Core Retirement Investment Trust is a balanced investment fund made up of fixed income securities and equity securities. Shares in the Core Retirement Investment Trust are purchased as funds are made available from retirement contributions and investment income, and sold when funds for benefit payments and other expenses are needed.
The assets of the Core and Variable Retirement Investment Trusts are carried at fair value with all market value adjustments recognized in current operations. Investments are revalued monthly to current market value. The resulting valuation gains or
State of Wisconsin Notes to The Financial Statements
For the Fiscal Year Ended June 30, 2020
127
losses are recognized as income, although revenue has not been realized through a market-place transaction.
The WRS does not have any investments (other than those issued or guaranteed by the U.S. Government) in any one organization that represent 5.0 percent or more of plan net position.
Contributions Required
Required contributions are determined by an annual actuarial valuation in accordance with Chapter 40 of the Wisconsin Statutes. The employee required contribution is one-half of the actuarially determined contribution rate for general category employees, including teachers, and executives and elected officials. In 2016, executives & elected officials’ contributions rates were changed to match General. Required contributions for protective contributions are the same rate as general employees. Employers are required to contribute the remainder of the actuarially determined contribution rate. The employer may not pay the employee required contribution unless provided for by an existing collective bargaining agreement. Contribution rates as of June 30, 2020 are:
Employee Employer
General (including teachers) 6.75% 6.75%
Executives & Elected Officials 6.75% 6.75%
Protective with Social Security 6.75% 11.65%
Protective without Social Security 6.75% 16.25%
Employers are required to contribute an actuarially determined amount necessary to fund the remaining projected cost of future benefits.
State of Wisconsin Net Pension Asset, Pension Contributions, Pension Expenses, and Deferred Outflows and Inflows of Resources
At June 30, 2020 the State reported a net pension asset of $895.3 million for its proportionate share of the WRS’ net pension asset. It is presented as a net pension asset on the Statement of Net Position for proprietary funds and on the government-wide Statement of Net Position.
The net pension asset was measured as of December 31, 2019, and the total pension liability was based on an actuarial valuation as of December 31, 2018. Update procedures were used to roll forward the total pension liability to the measurement date. No material changes in assumptions or benefit terms occurred between the actuarial valuation date and the measurement date.
The State’s proportionate share of the net pension asset was determined based the State’s share of contributions to the WRS relative to the contributions of all participating employers. At December 31, 2019, the State’s proportionate share was 27.8 percent, which is an increase of 0.06 percent from its proportionate share as of December 31, 2018.
For calendar year 2019, State employers made $292.1 million in contributions recognized by the WRS.
For the year ended June 30, 2020, the State recognized pension expense of $337.4 million. At June 30, 2020, the State reported deferred outflows and inflows of resources related to pensions of $1.96 billion and $2.68 billion, respectively. Deferred outflows and inflows related to pensions, including the types and the amounts applicable to each type, can be found in table below (in thousands):
Deferred Outflows ofResources
Deferred Inflows ofResources
Differences Between Expected and Actual Pension Experience $ 1,699,463 $ (850,467)
Changes of Pension Assumptions 69,767 Net Difference Between Projected and Actual Earnings on Pension Investments (1,830,288)
Changes in Proportionate Share 5,711 (2,866) Pension Contributions Subsequent to the Measurement Date 176,976
Total $ 1,951,917 $ (2,683,621)
The $176,976 thousand in deferred outflows of resources resulting from contributions subsequent to the measurement date will be recognized as a decrease to the net pension liability or an increase to the net pension asset in the year ended June 30, 2021. Other amounts reported as deferred outflows and inflows of resources related to pensions will be recognized as pension expense as follows (in thousands):
Fiscal YearEnded June 30 Amount
2021 $ (269,786)
2022 (200,818)
2023 32,444
2024 (470,521)
2025 —
$ (908,681)
A schedule presenting multi-year trend information of the State’s proportionate share of the net pension liability or asset is presented as required supplementary information following the notes to the financial statements.
State of Wisconsin Notes to The Financial Statements
For the Fiscal Year Ended June 30, 2020
128
Actuarial Valuation
The pension measurements as of December 31, 2019 were based upon the following actuarial assumptions:
Actuarial Valuation Date December 31, 2018
Measurement Date of Net Pension Liability (Asset) December 31, 2019
Actuarial Cost Method Entry Age Normal
Asset Valuation Method Fair Value
Long-Term Expected Rate of Return 7.0%
Discount Rate 7.0%
Salary Increases
Inflation 3.0%
Seniority/Merit 0.1% - 5.6%
MortalityWisconsin 2018 Mortality Table
Post-retirement Adjustments* 1.9%
* No post-retirement adjustments are guaranteed. Actual adjustments are based on recognized investment return, actuarial experience, and other factors. The assumed annual adjustment is 1.9%, based on the investment return assumption and the post-retirement discount rate. This includes the impact of known Market Recognition Account deferred gains/losses on the liability for dividend payments.
Actuarial assumptions are based upon an experience study conducted in 2018 using experience from 2015-2017. The total pension liability for December 31, 2019 is based upon a roll- forward of the liability calculated from the December 31, 2018 actuarial valuation.
Long-Term Expected Return on Plan Assets
The long-term expected rate of return on WRS investments was determined using a building-block method in which best-estimate ranges of expected future real rates of return, net of WRS investment expense and inflation, are developed for each major asset class. The ranges are combined to produce the long-term expected rate of return by weighting the expected future real rates of return by the target asset allocation percentage and by adding expected inflation. The long-term expected rate of return is reviewed every three years in conjunction with the WRS experience study. For each major asset class that is included in the Core Retirement Investment Trust fund’s target asset allocation as of December 31, 2019, these best estimates of geometric long- term real rates of return were used:
Asset Class Target Allocation Rate of Return Global Equities 49.0% 5.1%Fixed Income 24.5 2.1Inflation Sensitive 15.5 1.2Real Estate 9.0 3.5Private Equity/Debt 8.0 7.6Multi-asset 4.0 4.0
For each major asset class that is included in the Variable Retirement Investment Trust fund’s target asset allocation as of
December 31, 2019, these best estimates of geometric long-term real rates of return were used:
Asset Class Target Allocation Rate of ReturnDomestic Equity 70.0% 4.6%International Equity 30.0 5.3
The money-weighted rates of return on pension plan investment for the Core and Variable funds for the calendar year ended 2019 were 19.49% and 28.80%, respectively. The money-weighted rate of return expresses investment performance, net of pension plan expenses, adjusted for the changing amount actually invested.
Discount Rate
A single discount rate of 7.0% was used to measure the total pension liability, which is the same as the prior year. This rate was based on the expected rate of return of 7.0% and a long-term bond rate of 2.75%. Because of the unique structure of the WRS, the 7.0% expected rate of return implies that a dividend of approximately 1.9% will always be paid. For purposes of the single discount rate, it was assumed that the dividend would always be paid. The projection of cash flows used to determine this single discount rate assumed that plan member contributions will be made at the current contribution rate and that employer contributions will be made at rates equal to the difference between actuarially determined contribution rates and the member rate. Based on these assumptions, the pension plan’s fiduciary net position was projected to be available to make all projected future benefit payments (including expected dividends) of current plan members. Therefore, the long-term expected rate of return on pension plan investments was applied to all periods of projected benefit payments to determine the total pension liability.
The following presents the State’s proportionate share of the net pension liability (asset), calculated using a single discount rate of 7.0%, as well as what the State’s net pension liability (asset) would be if it were calculated using a single discount rate that is 1% lower or 1% higher:
State’s share of the net pensionliability (asset)
1% Decrease (6.0%) $ 2,305,528,244 Current Rate (7.0%) $ (895,288,646) 1% Increase (8.0%) $ (3,288,267,364)
State of Wisconsin Notes to The Financial Statements
For the Fiscal Year Ended June 30, 2020
129
NOTE 15. MILWAUKEE RETIREMENT SYSTEM
The Milwaukee Retirement System (MRS) is reported as an Investment Trust Fund. MRS participants provide assets to the State of Wisconsin, Department of Employee Trust Funds (DETF) for investing in the Core Retirement Investment Trust Fund (Core Fund) and the Variable Retirement Investment Trust Fund (Variable Fund) of the Wisconsin Retirement System. Participation of the MRS in the Core Fund and Variable Fund is described in the DETF Administrative Code, Chapter 10.12. The State of Wisconsin Investment Board (SWIB) manages the Core Fund and Variable Fund with oversight by a Board of Trustees as authorized in Wis. Stat. 25.14 and 25.17. SWIB is not registered with the Securities and Exchange Commission as an investment company.
The investments of the Core Fund and Variable Fund consist of a highly diversified portfolio of securities. Wis. Stat. 25.17(3)(a) allows investments in loans, securities and any other investments as authorized by Wis. Stat. 620.22. Permitted classes of investments include bonds of governmental units or of private corporations, loans secured by mortgages, preferred or common stock, real property and other investments not specifically prohibited by statute.
Investments are revalued monthly to fair value, with unrealized gains and losses reflected in income.
Monthly, the DETF distributes a pro-rata share of the total Core Fund and Variable Fund earnings less administrative expenses to the MRS accounts. The MRS accounts are adjusted to fair value and gains/losses are recorded directly in the accounts per DETF Administrative Code, Chapter 10.12(2). Neither State statute, a legal provision nor a legally binding guarantee exists to support the value of shares.
Copies of the separately issued financial report that includes audited financial statements along with the accompanying footnote disclosures and supplementary information for the Core Fund and the Variable Fund is available at www.swib.state.wi.us or may be obtained upon request from:
State of Wisconsin Investment BoardP.O. Box 7842Madison, Wisconsin 53707-7842
State of Wisconsin Notes to The Financial Statements
For the Fiscal Year Ended June 30, 2020
130
NOTE 16. OTHER POSTEMPLOYMENT BENEFIT (OPEB) PROGRAMS
Governmental Accounting Standards Board (GASB) Statement No. 75, Accounting and Financial Reporting for Postemployment Benefits Other Than Pensions establishes standards for recognizing and measuring liabilities, deferred outflows of resources, deferred inflows of resources, and expense/expenditures in financial reports of state and local governmental employers. GASB statement 74, Financial Reporting for Postemployment Benefit Plans Other than Pension Plans, establishes reporting standards for other postemployment benefits included in the general purpose external financial reports of state and local governmental OPEB plans.
Under Chapter 40 of Wisconsin Statutes, the Department of Employee Trust Funds (ETF) and Group Insurance Board (GIB) have statutory authority for program administration and oversight of post-employment benefits. ETF administers postemployment benefit plans other than pension plans for the Retiree Health Insurance and Retiree Life Insurance plans, along with the Supplemental Health Insurance Conversion Credit Program (for retired state employees). ETF also administers the Local Retiree Health Insurance and the Local Retiree Life Insurance plans (for retired local government employees). The plans are reported as fiduciary funds in the State’s CAFR.
ETF’s separately issued financial statements contain further information. ETF’s report may be obtained at www.etf.wi.gov and on request from:
The Department of Employee Trust FundsPO Box 7931Madison, Wisconsin 53707-7931
Basis of Accounting
The OPEB plans are reported in accordance with GASB standards and accounted for using the flow of economic resources measurement focus and the accrual basis of accounting. The OPEB liability, deferred outflows of resources and deferred inflows of resources, OPEB expense, and fiduciary net position, if any, have been determined on the same basis. Benefit payments (including refunds of employee contributions) are recognized when due and payable in accordance with the benefit terms. Investments, if any, are reported at fair value.
Retiree Health Insurance Funds
The Retiree Health Insurance plans offer group health insurance to retired State of Wisconsin and local government employees. Retirees pay the full premium amount. The State Retiree Health Insurance Fund includes the State, the University of Wisconsin, and other component units of the State. The Local Government Retiree Health Insurance Fund includes 363 local government employers. The plans are not administered through a trust. The Retiree Health Insurance Funds contain certain non-OPEB components relating to post-Medicare pharmacy and health insurance benefits. ETF and the GIB have statutory authority for program administration and oversight under Wisconsin Statutes Chapters 15.165 (2) and 40.03 (6).
State of Wisconsin and local government employees participating in the State Health Insurance Plan or the Wisconsin Public Employers Insurance Plan (local government plans) are eligible to continue their health insurance coverage after leaving covered
employment. Membership as of December 31, 2019, included 27,350 former state employees or their beneficiaries and 1,862 former local government employees and beneficiaries.
Retirees may choose between several health plans with specific provider networks (i.e., Health Maintenance Organizations (HMO’s), Preferred Provider Organizations (PPO’s) or Medicare Advantage). The health plans must follow GIB guidelines for eligibility and program requirements. All health plans offer a prescribed benefit package called Uniform Benefits and participate in a yearly competitive premium rate bid process. The pharmacy benefit is self-insured by the GIB and administered by Navitus Health Solutions.
Effective January 1, 2012, prescription drug coverage for Medicare eligible retirees enrolled in the State group health insurance program is provided by a self-funded Medicare Part D Employer Group Waiver Plan (EGWP). A Medicare “Wrap” product is also included to provide full coverage to members, as required by Uniform Benefits, when they reach the Medicare coverage gap, also known as the “donut hole."
Retiree Life Insurance Funds
The State Retiree Life Insurance Fund includes the State, the University of Wisconsin, and other component units of the State, and is considered a single-employer defined benefit OPEB plan. The Local Government Retiree Life Insurance Fund included 721 local government employers as of December 31, 2019 and is considered a cost-sharing multiple-employer defined benefit OPEB plan. The plans are administered through a trust.
The plans provide post-employment life insurance coverage to all eligible employees of participating employers. The plans are established by Wisconsin Statutes Chapter 40.70. ETF contracts with Securian Financial Group, Inc (Securian) as a third party administrator for the Retiree Life Insurance plans. Benefit terms may be modified by the GIB, subject to state and federal legislative constraints.
Generally, members may enroll during a 30-day enrollment period after their date of hire. Members may also enroll after the initial 30- day enrollment period with evidence of insurability. Members under evidence of insurability enrollment must enroll in group life insurance coverage before age 55 to be eligible for Basic or Supplemental coverage.
State of Wisconsin Notes to The Financial Statements
For the Fiscal Year Ended June 30, 2020
131
Contributions
The GIB approves contribution rates annually, based on recommendations from the insurance carrier. Recommended rates are based on an annual valuation, taking into consideration an estimate of the present value of future benefits and the present value of future contributions. A portion of employer contributions made during a member’s working lifetime funds a post-retirement benefit.
Employers are required to pay the following contributions for active members to provide them with basic coverage after age 65. There are no employer contributions for pre-65 annuitant coverage. All contributions are actuarially determined.
Coverage Type State Local
50 percent post retirement coverage
28 percent of theemployee premium
40 percent of theemployee premium
25 percent post retirement coverage N/A
20 percent ofemployee premium
Employee contributions are based upon nine age bands through age 69 and an additional eight age bands for those age 70 and over. Participating employees must pay monthly contribution rates per $1,000 of coverage until the age of 65 (age 70 if active). The employee contribution rates in effect for the year ended December 31, 2019 are as listed below:
AttainedAge
StateBasic
StateSupple- mental
LocalBasic
LocalSupple- mental
Under 30 $ 0.04 $ 0.04 $ 0.05 $ 0.05
30-34 0.04 0.04 0.06 0.06
35-39 0.04 0.04 0.07 0.07
40-44 0.06 0.06 0.08 0.08
45-49 0.11 0.11 0.12 0.12
50-54 0.17 0.17 0.22 0.22
55-59 0.23 0.23 0.39 0.39
60-64 0.32 0.32 0.49 0.49
65-69 0.41 0.41 0.57 0.57
*Disabled members under age 70 receive a waiver-of-premium benefit.
At retirement, the member must have active group life insurance coverage and satisfy one of the following:
• Wisconsin Retirement System (WRS) coverage prior to January 1, 1990, or
• At least one month of group life insurance coverage in each of five calendar years after 1989 and one of the following:
• Eligible for an immediate WRS benefit, or• At least 20 years from their WRS creditable service as of
January 1, 1990, plus their years of group life insurance coverage after 1989, or
• At least 20 years on the payroll of their last employer.
In addition, terminating members and retirees must continue to pay the employee premiums until age 65 (age 70 if active).
Benefits and Membership
After retirement, basic coverage is continued for life in amounts for the insurance in force before retirement:
Age State LocalBefore age 65 100% 100%While age 65 75% 75%While age 66 50% 50%After age 66 50% 50% / 25%
Employer Election
After retirement, supplemental and additional coverage may be continued until age 65 at 100 percent of the amount of the insurance in force before retirement at the employee’s expense, and spouse and dependent coverage is terminated.
Membership as of December 31, 2019, included:
State Local Total
Active* 51,674 76,305 127,979
Inactive Pre-Age 65 Annuitants 6,600 9,918 16,518
Inactive Post-Age 64 Annuitants 27,092 37,034 64,126
Totals 85,366 123,257 208,623
* Active membership includes disabled
Supplemental Health Insurance Conversion Credit (SHICC) Program
The SHICC program includes the State, the University of Wisconsin, and other component units of the State and is considered a single-employer defined benefit OPEB plan. The SHICC program is reported as an Other Post-Employment Benefit Trust Fund. The SHICC program was established by Wisconsin Statute 40.95 and is defined in the state compensation plan (Wis. Stat. 230.12(9)).
The SHICC program allows members with more than 15 years of eligible service to convert unused sick leave balances into credits to pay for post-retirement health insurance premiums. The SHICC benefit provides a limited match of the members credits earned through the Accumulated Sick Leave Conversion Credit (ASLCC) program. ASLCC program credits are computed at the time of retirement, layoff, or death by multiplying the number of hours of unused sick leave by the highest hourly pay rate at which the employee accrued sick leave that is eligible for conversion. Employment category and number of years of service are also factored into the calculation. The SHICC program also includes a provision for the restoration of 500 hours of credits upon retirement, layoff or death provided at least 500 hours or accrued sick leave were used for a single injury or illness during the three years immediately preceding the retirement, layoff or death while in state service.
State of Wisconsin Notes to The Financial Statements
For the Fiscal Year Ended June 30, 2020
132
All ASLCC program credits must be used before the SHICC program credits. Unused ASLCC and SHICC credits have no cash value, are carried forward from year to year without interest, and when total health insurance premiums paid on behalf of the retired employee equal or exceed the conversion credits, no further payments are made under the ASLCC and SHICC programs. ASLCC and SHICC credits may be escrowed indefinitely after retirement for participants who provide evidence of comparable health insurance coverage from another source.
Eligibility and Membership
Generally to be eligible to use SHICC credits to pay post-retirement health insurance premiums, members with 15 years of adjusted continuous service (or their insured surviving spouse and/or dependents) must be covered under the State of Wisconsin Group Health Insurance Program. If a member with 20 years of service leaves eligible service prior to retirement, the benefit is vested.
Membership as of December 31, 2019, included:
Employment Status CountRetirees and Beneficiaries 24,625 Inactive, Non-retired Members 328 Active Members 73,317
Totals 98,270
At retirement, the member must have State of Wisconsin Group Health Insurance Program coverage and satisfy the following:
• Retire on an immediate annuity; or• Retire and receive a lump-sum benefit; or • Qualify for a Wisconsin Retirement System (WRS)
disability retirement benefit, long-term disability benefit or a protective occupation duty disability benefit under Wisconsin Statute 40.65; or
• Have 20 years of WRS creditable service and are eligible for an immediate retirement benefit, but have chosen not to apply for retirement or disability benefit immediately
Eligible members may elect to escrow their SHICC credits (to be used at a later date) if they have comparable health insurance coverage through another source. If SHICC eligible members are not immediately eligible for an annuity, they must satisfy the following to defer vested (preserved) SHICC credits to pay health premiums when becoming a WRS annuitant:
• Terminate with 20 years of WRS creditable service (providing they do not elect a WRS separation benefit) or
• State constitutional officer, a member or an officer of the legislature of the head of a state department or agency who was appointed by the governor with senate confirmation and are not eligible for an immediate annuity when terminating from state employment (providing they do not elect a WRS separation benefit).
If not eligible for an immediate annuity and the member is permanently laid off from State employment, the member must have at least 15 years of adjusted continuous service to use SHICC credits to pay health premiums for up to five years after the layoff begins.
Contributions and Benefits
The ETF Board approves contribution rates annually, based on recommendations from the actuary. Recommended rates are based on an annual valuation, taking into consideration an estimate of the present value of future benefits and the present value of future contributions, in accordance with Wis. Stat. § 40.05 (4) (by). Employer contributions made during a member’s working lifetime funds a post-retirement benefit. Employers made contributions totaling $14.4 million based upon a percentage of active member earnings for the year ending December 31, 2019.
The SHICC program provides matching sick leave hours, that are in addition to, but generally not to exceed the unused sick leave balances that are used to calculate benefits provided under the ASLCC program, to participants retiring (or terminating employment) with 15 or more years of eligible service, as follows:
Employment Category Benefit Eligible Hours*
ProtectiveMatch up to 78 hours (9.75 days) per full year of service through 24 years, plus 104 hours (13 days) per full year of service over 24 years.
OthersMatch up to 52 hours (6.5 days) per full year of service through 24 years, plus up to 104 hours (13 days) per full year of service over 24 years.
*The SHICC program also includes a restoration benefit of up to 500 hours when certain criteria are met.
The SHICC program also provides benefits after a member’s death. The member’s surviving spouse and/or dependents may be eligible to use SHICC credits to pay State of Wisconsin Group Health Insurance premiums under the following conditions:
• Member was covered by the State of Wisconsin Group Health Insurance Program under a family policy on the member’s date of death or the member is receiving a retirement disability benefit; or
• Member has preserved SHICC credits and the member dies before becoming a WRS annuitant; or
• Member has escrowed SHICC credits and the member dies.
All Plans Total OPEB Expense
For the year ended June 30, 2020, OPEB expense for all plans combined was $49.9 million by participating employers:
Primary Government
State of Wisconsin $ 23,206,328
University of WI System 19,746,196
Component Units
UW Hospital and Clinics Authority 6,524,712
WI Housing & Economic Development Authority 265,356
WI Economic Development Corp 162,280
Total $ 49,904,872
A detailed OPEB expense (revenue) by plan can be found in note 17.
State of Wisconsin Notes to The Financial Statements
For the Fiscal Year Ended June 30, 2020
133
NOTE 17. OTHER POSTEMPLOYMENT BENEFIT PLANS
A. State Retiree Health Insurance OPEB
The State Retiree Health Insurance program provides postemployment health insurance coverage to all eligible retired employees of the State, the University of Wisconsin, University of Wisconsin Hospital and Clinics Authority, Wisconsin Housing and Economic Development Authority and Wisconsin Economic Development Corporation. The employers do not directly pay any portion of the premium for participating retirees. However, because retirees pay the same premium rate set for active employees, an implicit rate subsidy exists for employers. This implicit rate subsidy is reported as an OPEB liability. At age 65, when eligible, retirees are required to enroll in Medicare. No assets have accumulated because there is no trust.
Retiree Health Insurance Plan Description
GASB standards classify the State Retiree Health Insurance program as a single employer defined benefit OPEB plan with multiple participating employers. Medical, prescription drug and dental benefits are provided to eligible retirees.
Retirees pay the full premium until age 65 directly to the plan either through “out-of-pocket” or from unused accumulated sick leave conversion credits or supplemental health insurance conversion credits. The value of the sick leave benefit is defined as compensated absences and reported under the provisions of GASB Statement No. 16, Accounting for Compensated Absences.
Contribution requirements are established and may be amended by the GIB. Premiums for non-Medicare retirees are based on an effective rate structure for the health care service provider selected. Monthly rates range from $537 to $1,311 for single coverage and $1,536 to $3,810 for family coverage.
As of January 1, 2019 (most recent actuarial valuation date), membership consisted of:
Member Type NumberRetired members or beneficiaries receiving OPEB benefits 7,934 Vested terminated members not yet receivingOPEB benefits 1,442
Active members 62,047
Total 71,423
Inclusion of OPEB Information for Component Units
GASB standards require the presentation of OPEB related amounts and information in the State’s financial statements for both the State of Wisconsin (the primary government) and the component units. The component units are responsible for their share of the OPEB liabilities. Reported amounts related to the OPEB liability, OPEB expense and related deferred inflows and outflows for the OPEB plans may vary by an immaterial amount from the final amounts due to the timing of available information.
Total Retiree Health OPEB Liability
The actuarial valuation was based on the plan of retiree benefits and was made for purposes of fulfilling GASB accounting standards which require recognition of the employer cost of postemployment benefits over an employee’s career. The total cost of providing postemployment benefits is projected, considering relevant assumptions, then discounted to determine the total OPEB liability.
To determine the total OPEB liability for the program, the actuary performed an actuarial valuation as of January 1, 2019 and adjusted for changes such as interest earned, contributions paid, and benefits paid through June 30, 2019. Based on this, the actuary determined the OPEB liability totaled $682.5 million.
The total OPEB liability was allocated to participating employers based on their proportionate share of health insurance premiums contributed for active employees. Amounts by participating employers as of a June 30, 2020 reporting date, are indicated in the table below (in millions):
Participating EmployerOPEB
Liability
Primary Government
State of Wisconsin $ 303.9
University of Wisconsin System 302.8
Component Units
UW Hospital and Clinics Authority 73.4
WI Housing & Economic Development Authority 1.4
WI Economic Development Corp. 1.0
Total OPEB Liability $ 682.5
Changes in the Total OPEB Liability
Changes to the total OPEB plan liability during the fiscal year include the following (in millions):
Total OPEB Liability June 30, 2018 $ 539.7
Changes for the Year
Service cost 40.3
Interest 21.7
Difference between expected & actual experience 65.1
Changes of assumptions 56.6
Benefit payments* (40.9)
Net Change in Total OPEB Liability 142.8
Total OPEB Liability June 30, 2019 $ 682.5
* Employer benefit payments of $40.9 million were actuarially determined and pertain to the implicit rate subsidy.
State of Wisconsin Notes to The Financial Statements
For the Fiscal Year Ended June 30, 2020
134
Actuarial Methods and Assumptions
Projections of benefits for financial reporting purposes are based on the substantive plan (the plan as understood by the employer and plan members) and include the types of benefits provided at the time of each valuation and the historical pattern of sharing of benefit costs between the employer and plan members to that point. The actuarial methods and assumptions used include techniques that are designed to reduce short-term volatility in actuarial accrued liabilities and the actuarial value of assets, consistent with the long- term perspective of the calculations.
The total OPEB liability in the January 1, 2019 actuarial valuation was determined using the following actuarial assumptions and other inputs, applied to all periods included in the measurement unless otherwise specified:
Actuarial Valuation Date January 1, 2019Measurement Date of Total OPEB Liability: June 30, 2019 Actuarial cost method Entry Age Normal
Asset Valuation Method N/A
Inflation 3.0%
Salary increases Separate merit and longevity increase rates by employer and service, plus 3%
Discount Rate Discount rate was changed to 3.50% for the June 30, 2019 measurement from 3.87% for the June 30, 2018 measurement
Healthcare Cost Trend Rates:Medical 4.00% for first year then 5.5%
grading down 0.25% per year to 4.50%
Prescription drug 2.10% for first year then 7.5% grading down 0.25% per year to 4.50%
Dental 0.00% for first year then 3.00% thereafter
Administrative Costs 7.30% for first year then 3.00% thereafter
Mortality Rates Wisconsin 2017 Mortality Table
Benefit Changes None
Participation Rate Active: 80% are assumed to elect coverage at retirement, 20% that defer are assumed to be covered over the next 8 years (2.5% per year), so 100% assumed to be covered after 8 years
Deferred: 12.5% per year over 8 years
Assumed Claims Per capita claims costs were based on premium equivalent rates for plan year 2019 and actuarial factors applied to weighted average premium rates to estimate costs
Termination Rates Rates for General, Executive and Elected employees matched the 2015-2017 experience study for the pension valuation
Disability Rates Rates for General, Executive and Elected employees matched the 2015-2017 experience study for the pension valuation
Normal Retirement Rates
Rates for General, Executive and Elected employees matched the 2015-2017 experience study for the pension valuation
Withdrawal Rate Rates matched the 2015-2017 experience study for the pension valuation
Lapse Rate 10% per year after the later of assumed commencement or the valuation date
Excise Tax Excise tax was repealed effective December 2019 and has been removed from the valuation
In the prior year, the excise tax on high cost health plans began in 2022
Gross Average Claims were trended using the Plan Blended Medical and Prescription Drug Trend Rate, offset by the 2018 threshold trended at 2.6% for 2018 and the assumed rate of inflation for subsequent periods
The tax was assumed to be 40% of this difference, beginning in 2022
Benefit End Date Benefits end when participants turn 65 years old
Actuarial assumptions are based on the Wisconsin Retirement System experience study conducted in 2018 using experience from 2015 to 2017. An actuarial experience loss of $65.1 million increased the liability, due to demographic changes and benefit payments that were different form expected and actuals contributions being less than expected. A valuation assumption change of $56.7 million also increased the liability due to a decrease in the discount rate, a net increase due to projecting the valuation-year per capita health costs and future trend on such costs and a decrease due to the repeal of the excise tax on high cost health plans in December 2019.
State of Wisconsin Notes to The Financial Statements
For the Fiscal Year Ended June 30, 2020
135
Sensitivity of the Total OPEB Liability to Changes in the Discount Rate
The following presents each employer’s proportionate share of the total liability and what it would be if it were calculated using a discount rate that is 1-percentage-point lower or higher than the current discount rate (in millions):
1% Decrease in Discount
Rate(2.50%)
Current Discount
Rate(3.50%)
1% Increase in Discount
Rate(4.50%)
Primary Government $ 647.4 $ 606.7 $ 568.0
Component Units 80.9 75.8 70.9
Total OPEB Liability $ 728.3 $ 682.5 $ 639.0
Sensitivity of the Total OPEB Liability to Changes in the Healthcare Cost Trend Rates
The following presents each employer’s proportionate share of the total liability and what it would be if it were calculated using a healthcare trend rate that is 1-percentage-point lower or higher than the current healthcare trend rate (in millions):
1% Decrease in
HealthcareTrend Rate
Current Healthcare Trend Rate
1% Increase in
HealthcareTrend Rate
Primary Government $ 542.1 $ 606.7 $ 683.2
Component Units 67.7 75.8 85.3
Total OPEB Liability $ 609.8 $ 682.5 $ 768.6
OPEB Expense/(Revenue) and Deferred Outflows of Resources and Deferred Inflows of Resources Related to OPEB
For the year ended June 30, 2020, OPEB expense/(revenue) of $(16.5) million was recognized by participating employers:
Primary Government
State of Wisconsin $ (7,815,266)
University of WI System (7,612,620)
Component Units
UW Hospital and Clinics Authority (1,030,018)
WI Housing & Economic Development Authority (24,283)
WI Economic Development Corp (18,747)
Total $ (16,500,934)
At June 30, 2020, deferred outflows of resources and deferred inflows of resources for both the state and component units were reported from the following sources:
DeferredOutflows of Resources
DeferredInflows of Resources
Difference between Expected and Actual Experience $ 59,827,229 $ (2,950,336)
Changes of Assumptions 51,523,191 (259,301,024)
Changes in Proportion 10,601,306 (10,601,306)
Amounts Paid Subsequent to the Measurement Date 56,801,784 —
Total $ 178,753,510 $ (272,852,666)
Deferred outflows of resources and deferred inflows of resources for the state (primary government) as of a June 30, 2020 reporting date were as follows:
DeferredOutflows of Resources
DeferredInflows of Resources
Difference between Expected and Actual Experience $ 53,185,527 $ (2,622,805)
Changes of Assumptions 45,803,360 (230,514,767)
Changes in Proportion 4,030,184 (9,428,098)
Amounts Paid Subsequent to the Measurement Date 50,495,944 —
Total $ 153,515,015 $ (242,565,670)
Deferred outflows of resources and deferred inflows of resources for component units as of a June 30, 2020 reporting date were as follows:
DeferredOutflows of Resources
Deferred Inflows of Resources
Difference between Expected and Actual Experience $ 6,641,702 $ (327,531)
Changes of Assumptions 5,719,831 (28,786,257)
Changes in Proportion 6,571,122 (1,173,208)
Amounts Paid Subsequent to the Measurement Date 6,305,840 —
Total $ 25,238,495 $ (30,286,996)
State of Wisconsin Notes to The Financial Statements
For the Fiscal Year Ended June 30, 2020
136
The $56,801,784 in deferred outflows of resources resulting from amounts paid subsequent to the measurement date will be recognized as a decrease to the total OPEB liability in the year ended June 30, 2021 for the state and component units. Other amounts reported as deferred outflows of resources and deferred inflows of resources for the state and component units will be recognized in future OPEB expense/(revenue) as follows:
FY 2021 $ (21,629,468)
FY 2022 (21,629,468)
FY 2023 (21,629,468)
FY 2024 (21,629,468)
FY 2025 (21,629,468)
Thereafter (42,753,602)
The $50,495,944 in deferred outflows of resources resulting from amounts paid subsequent to the measurement date will be recognized as a decrease to the total OPEB liability in the year ended June 30, 2021 for the state (primary government). Other amounts reported as deferred outflows of resources and deferred inflows of resources for the state will be recognized in future OPEB expense/(revenue) as follows:
FY 2021 $ (19,929,628)
FY 2022 (19,929,628)
FY 2023 (19,929,628)
FY 2024 (19,929,628)
FY 2025 (19,929,628)
Thereafter (39,898,460)
The $6,305,840 in deferred outflows of resources resulting from amounts paid subsequent to the measurement date will be recognized as a decrease to the total OPEB liability in the year ended June 30, 2021 for component units. Other amounts reported as deferred outflows of resources and deferred inflows of resources for component units will be recognized in future OPEB expense/(revenue) as follows:
FY 2021 $ (1,699,840)
FY 2022 (1,699,840)
FY 2023 (1,699,840)
FY 2024 (1,699,840)
FY 2025 (1,699,840)
Thereafter (2,855,142)
The Schedule of Changes in the Total OPEB Liability and Related Ratios is presented as required supplementary information following the notes to the financial statements.
State of Wisconsin Notes to The Financial Statements
For the Fiscal Year Ended June 30, 2020
137
B. State Retiree Life Insurance OPEB
The State Retiree Life Insurance program provides postemployment life insurance coverage to all eligible retired employees of the State, the University of Wisconsin, University of Wisconsin Hospital and Clinics Authority, Wisconsin Housing and Economic Development Authority and Wisconsin Economic Development Corporation. Each employer’s proportionate share of the net OPEB liability and collective OPEB expense, deferred inflows and outflows is based on the employer’s contribution for the most recent calendar year compared to the total contributions of all employers.
Inclusion of OPEB Information for Component Units
GASB standards require the presentation of OPEB related amounts and information in the State’s financial statements for both the State of Wisconsin (the primary government) and the component units. The component units are responsible for their share of the OPEB liabilities. Reported amounts related to the OPEB liability, OPEB expense and related deferred inflows and outflows for the OPEB plans may vary by an immaterial amount from the final amounts due to the timing of available information.
OPEB Liabilities, OPEB Expense, and Deferred Outflows of Resources and Deferred Inflows of Resources Related to OPEB
At June 30, 2020, the State, including the University of Wisconsin System, reported a liability of $603.6 million for its proportionate share of the net OPEB liability. The net OPEB liability was measured as of December 31, 2019 and the total OPEB liability used to calculate the net OPEB liability was determined by an actuarial valuation as January 1, 2019 rolled forward to December 31, 2019. The State’s proportion of the net OPEB liability was based on the State’s share of contributions to the OPEB plan relative to the contributions of all participating employers. At December 31, 2019, the State’s proportion was 88.4 percent which was an increase of 0.1 percent from its proportion of 88.3 percent measured as of December 31, 2018.
Net OPEB liability amounts, by participating employers as of a June 30, 2020 reporting date, are indicated in the table below (in millions):
Participating Employer
NetOPEB
Liability
Primary Government
State of Wisconsin $ 316.0
University of Wisconsin System 287.5
Component Units
UW Hospital and Clinics Authority 76.0
WI Housing & Economic Development Authority 2.4
Wisconsin Economic Development Corporation 1.2
Total Net OPEB Liability $ 683.1
For the year ended June 30, 2020, OPEB expense of $68.3 million was recognized by participating employers:
Primary Government
State of Wisconsin $ 31,817,911
University of WI System 28,196,075
Component Units
UW Hospital and Clinics Authority 7,785,094
WI Housing & Economic Development Authority 294,046
WI Economic Development Corp 181,027
Total $ 68,274,153
For the year ended June 30, 2020, contributions of $1.1 million were recognized by the plan from participating employers:
Primary GovernmentState of Wisconsin $ 531,755 University of WI System 483,771 Component UnitsUW Hospital and Clinics Authority 127,804 WI Housing & Economic Development Authority 3,956 WI Economic Development Corp 2,074 Total $ 1,149,360
State of Wisconsin Notes to The Financial Statements
For the Fiscal Year Ended June 30, 2020
138
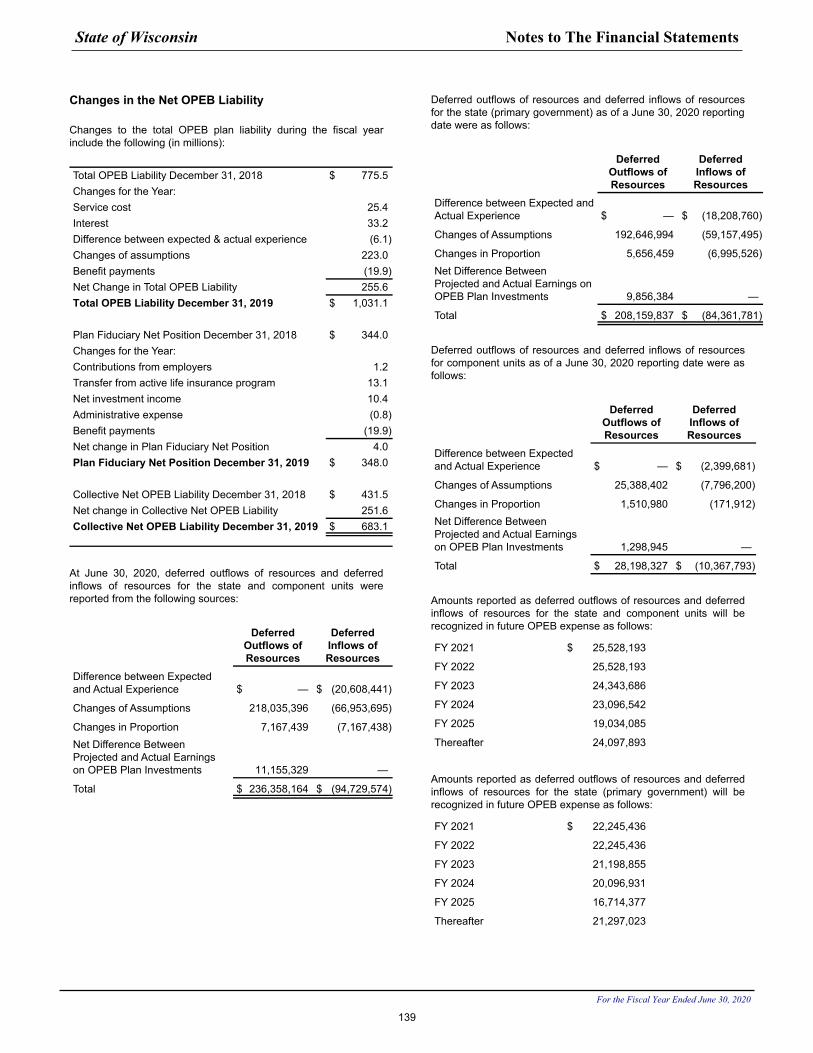
Changes in the Net OPEB Liability
Changes to the total OPEB plan liability during the fiscal year include the following (in millions):
Total OPEB Liability December 31, 2018 $ 775.5 Changes for the Year:Service cost 25.4 Interest 33.2 Difference between expected & actual experience (6.1) Changes of assumptions 223.0 Benefit payments (19.9) Net Change in Total OPEB Liability 255.6 Total OPEB Liability December 31, 2019 $ 1,031.1
Plan Fiduciary Net Position December 31, 2018 $ 344.0 Changes for the Year:Contributions from employers 1.2 Transfer from active life insurance program 13.1 Net investment income 10.4 Administrative expense (0.8) Benefit payments (19.9) Net change in Plan Fiduciary Net Position 4.0 Plan Fiduciary Net Position December 31, 2019 $ 348.0
Collective Net OPEB Liability December 31, 2018 $ 431.5 Net change in Collective Net OPEB Liability 251.6 Collective Net OPEB Liability December 31, 2019 $ 683.1
At June 30, 2020, deferred outflows of resources and deferred inflows of resources for the state and component units were reported from the following sources:
Deferred Outflows of Resources
Deferred Inflows of Resources
Difference between Expected and Actual Experience $ — $ (20,608,441)
Changes of Assumptions 218,035,396 (66,953,695)
Changes in Proportion 7,167,439 (7,167,438) Net Difference Between Projected and Actual Earnings on OPEB Plan Investments 11,155,329 —
Total $ 236,358,164 $ (94,729,574)
Deferred outflows of resources and deferred inflows of resources for the state (primary government) as of a June 30, 2020 reporting date were as follows:
Deferred Outflows of Resources
Deferred Inflows of Resources
Difference between Expected and Actual Experience $ — $ (18,208,760)
Changes of Assumptions 192,646,994 (59,157,495)
Changes in Proportion 5,656,459 (6,995,526) Net Difference Between Projected and Actual Earnings on OPEB Plan Investments 9,856,384 —
Total $ 208,159,837 $ (84,361,781)
Deferred outflows of resources and deferred inflows of resources for component units as of a June 30, 2020 reporting date were as follows:
Deferred Outflows of Resources
Deferred Inflows of Resources
Difference between Expected and Actual Experience $ — $ (2,399,681)
Changes of Assumptions 25,388,402 (7,796,200)
Changes in Proportion 1,510,980 (171,912) Net Difference Between Projected and Actual Earnings on OPEB Plan Investments 1,298,945 —
Total $ 28,198,327 $ (10,367,793)
Amounts reported as deferred outflows of resources and deferred inflows of resources for the state and component units will be recognized in future OPEB expense as follows:
FY 2021 $ 25,528,193
FY 2022 25,528,193
FY 2023 24,343,686
FY 2024 23,096,542
FY 2025 19,034,085
Thereafter 24,097,893
Amounts reported as deferred outflows of resources and deferred inflows of resources for the state (primary government) will be recognized in future OPEB expense as follows:
FY 2021 $ 22,245,436
FY 2022 22,245,436
FY 2023 21,198,855
FY 2024 20,096,931
FY 2025 16,714,377
Thereafter 21,297,023
State of Wisconsin Notes to The Financial Statements
For the Fiscal Year Ended June 30, 2020
139
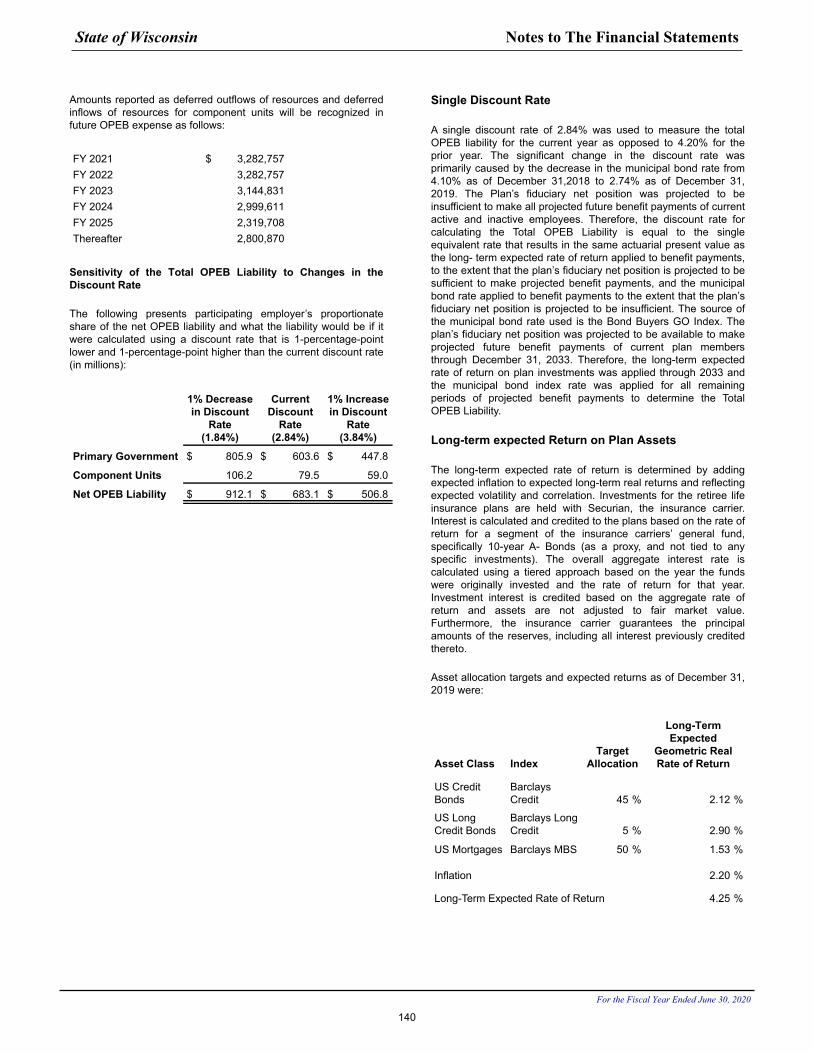
Amounts reported as deferred outflows of resources and deferred inflows of resources for component units will be recognized in future OPEB expense as follows:
FY 2021 $ 3,282,757 FY 2022 3,282,757 FY 2023 3,144,831 FY 2024 2,999,611 FY 2025 2,319,708 Thereafter 2,800,870
Sensitivity of the Total OPEB Liability to Changes in the Discount Rate
The following presents participating employer’s proportionate share of the net OPEB liability and what the liability would be if it were calculated using a discount rate that is 1-percentage-point lower and 1-percentage-point higher than the current discount rate (in millions):
1% Decreasein Discount
Rate(1.84%)
CurrentDiscount
Rate(2.84%)
1% Increasein Discount
Rate(3.84%)
Primary Government $ 805.9 $ 603.6 $ 447.8
Component Units 106.2 79.5 59.0
Net OPEB Liability $ 912.1 $ 683.1 $ 506.8
Single Discount Rate
A single discount rate of 2.84% was used to measure the total OPEB liability for the current year as opposed to 4.20% for the prior year. The significant change in the discount rate was primarily caused by the decrease in the municipal bond rate from 4.10% as of December 31,2018 to 2.74% as of December 31, 2019. The Plan’s fiduciary net position was projected to be insufficient to make all projected future benefit payments of current active and inactive employees. Therefore, the discount rate for calculating the Total OPEB Liability is equal to the single equivalent rate that results in the same actuarial present value as the long- term expected rate of return applied to benefit payments, to the extent that the plan’s fiduciary net position is projected to be sufficient to make projected benefit payments, and the municipal bond rate applied to benefit payments to the extent that the plan’s fiduciary net position is projected to be insufficient. The source of the municipal bond rate used is the Bond Buyers GO Index. The plan’s fiduciary net position was projected to be available to make projected future benefit payments of current plan members through December 31, 2033. Therefore, the long-term expected rate of return on plan investments was applied through 2033 and the municipal bond index rate was applied for all remaining periods of projected benefit payments to determine the Total OPEB Liability.
Long-term expected Return on Plan Assets
The long-term expected rate of return is determined by adding expected inflation to expected long-term real returns and reflecting expected volatility and correlation. Investments for the retiree life insurance plans are held with Securian, the insurance carrier. Interest is calculated and credited to the plans based on the rate of return for a segment of the insurance carriers’ general fund, specifically 10-year A- Bonds (as a proxy, and not tied to any specific investments). The overall aggregate interest rate is calculated using a tiered approach based on the year the funds were originally invested and the rate of return for that year. Investment interest is credited based on the aggregate rate of return and assets are not adjusted to fair market value. Furthermore, the insurance carrier guarantees the principal amounts of the reserves, including all interest previously credited thereto.
Asset allocation targets and expected returns as of December 31, 2019 were:
Asset Class IndexTarget
Allocation
Long-Term Expected
Geometric Real Rate of Return
US Credit Bonds
Barclays Credit 45 % 2.12 %
US Long Credit Bonds
Barclays Long Credit 5 % 2.90 %
US Mortgages Barclays MBS 50 % 1.53 %
Inflation 2.20 %
Long-Term Expected Rate of Return 4.25 %
State of Wisconsin Notes to The Financial Statements
For the Fiscal Year Ended June 30, 2020
140
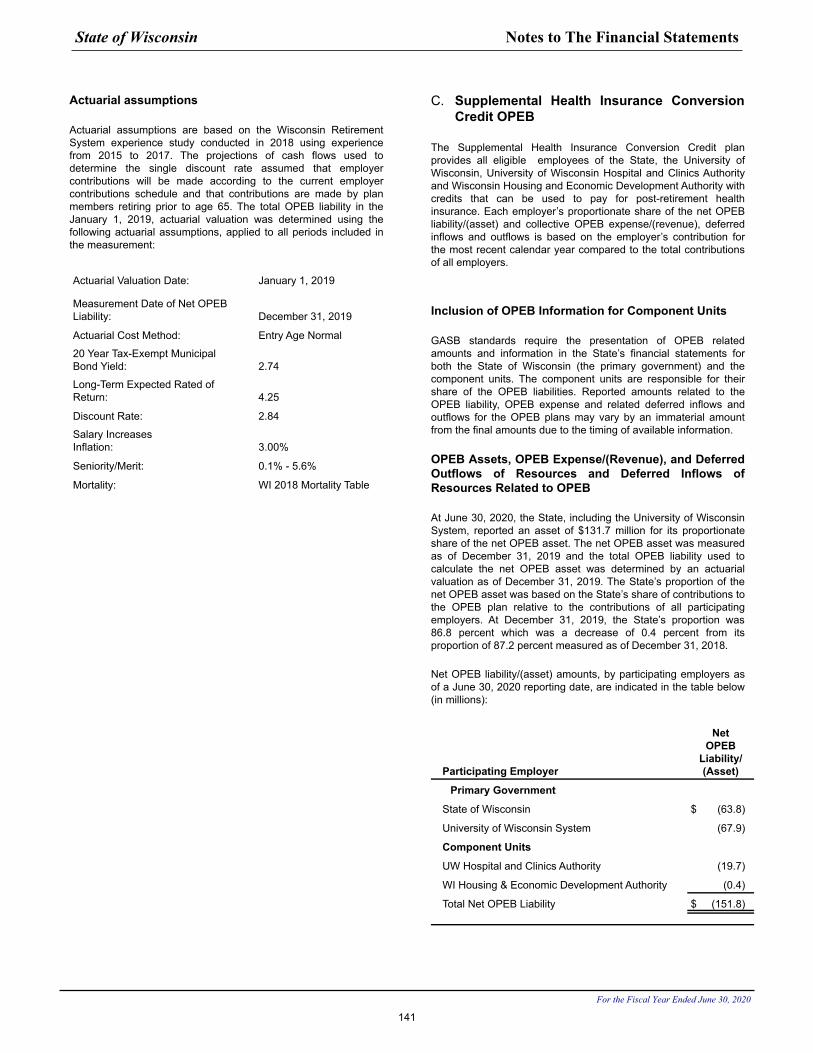
Actuarial assumptions
Actuarial assumptions are based on the Wisconsin Retirement System experience study conducted in 2018 using experience from 2015 to 2017. The projections of cash flows used to determine the single discount rate assumed that employer contributions will be made according to the current employer contributions schedule and that contributions are made by plan members retiring prior to age 65. The total OPEB liability in the January 1, 2019, actuarial valuation was determined using the following actuarial assumptions, applied to all periods included in the measurement:
Actuarial Valuation Date: January 1, 2019
Measurement Date of Net OPEB Liability: December 31, 2019
Actuarial Cost Method: Entry Age Normal
20 Year Tax-Exempt MunicipalBond Yield: 2.74
Long-Term Expected Rated ofReturn: 4.25
Discount Rate: 2.84
Salary IncreasesInflation: 3.00%
Seniority/Merit: 0.1% - 5.6%
Mortality: WI 2018 Mortality Table
C. Supplemental Health Insurance Conversion Credit OPEB
The Supplemental Health Insurance Conversion Credit plan provides all eligible employees of the State, the University of Wisconsin, University of Wisconsin Hospital and Clinics Authority and Wisconsin Housing and Economic Development Authority with credits that can be used to pay for post-retirement health insurance. Each employer’s proportionate share of the net OPEB liability/(asset) and collective OPEB expense/(revenue), deferred inflows and outflows is based on the employer’s contribution for the most recent calendar year compared to the total contributions of all employers.
Inclusion of OPEB Information for Component Units
GASB standards require the presentation of OPEB related amounts and information in the State’s financial statements for both the State of Wisconsin (the primary government) and the component units. The component units are responsible for their share of the OPEB liabilities. Reported amounts related to the OPEB liability, OPEB expense and related deferred inflows and outflows for the OPEB plans may vary by an immaterial amount from the final amounts due to the timing of available information.
OPEB Assets, OPEB Expense/(Revenue), and Deferred Outflows of Resources and Deferred Inflows of Resources Related to OPEB
At June 30, 2020, the State, including the University of Wisconsin System, reported an asset of $131.7 million for its proportionate share of the net OPEB asset. The net OPEB asset was measured as of December 31, 2019 and the total OPEB liability used to calculate the net OPEB asset was determined by an actuarial valuation as of December 31, 2019. The State’s proportion of the net OPEB asset was based on the State’s share of contributions to the OPEB plan relative to the contributions of all participating employers. At December 31, 2019, the State’s proportion was 86.8 percent which was a decrease of 0.4 percent from its proportion of 87.2 percent measured as of December 31, 2018.
Net OPEB liability/(asset) amounts, by participating employers as of a June 30, 2020 reporting date, are indicated in the table below (in millions):
Participating Employer
NetOPEB
Liability/(Asset)
Primary Government
State of Wisconsin $ (63.8)
University of Wisconsin System (67.9)
Component Units
UW Hospital and Clinics Authority (19.7)
WI Housing & Economic Development Authority (0.4)
Total Net OPEB Liability $ (151.8)
State of Wisconsin Notes to The Financial Statements
For the Fiscal Year Ended June 30, 2020
141
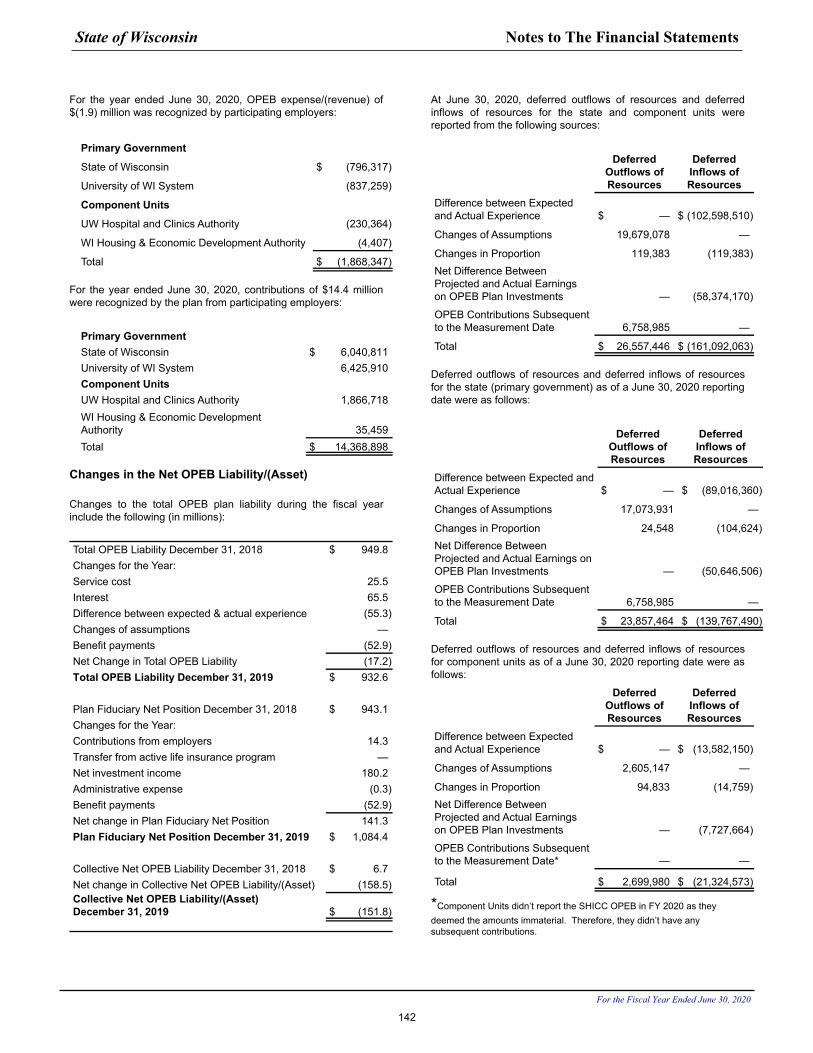
For the year ended June 30, 2020, OPEB expense/(revenue) of $(1.9) million was recognized by participating employers:
Primary Government
State of Wisconsin $ (796,317)
University of WI System (837,259)
Component Units
UW Hospital and Clinics Authority (230,364)
WI Housing & Economic Development Authority (4,407)
Total $ (1,868,347)
For the year ended June 30, 2020, contributions of $14.4 million were recognized by the plan from participating employers:
Primary GovernmentState of Wisconsin $ 6,040,811 University of WI System 6,425,910 Component UnitsUW Hospital and Clinics Authority 1,866,718 WI Housing & Economic Development Authority 35,459 Total $ 14,368,898
Changes in the Net OPEB Liability/(Asset)
Changes to the total OPEB plan liability during the fiscal year include the following (in millions):
Total OPEB Liability December 31, 2018 $ 949.8 Changes for the Year:Service cost 25.5 Interest 65.5 Difference between expected & actual experience (55.3) Changes of assumptions — Benefit payments (52.9) Net Change in Total OPEB Liability (17.2) Total OPEB Liability December 31, 2019 $ 932.6
Plan Fiduciary Net Position December 31, 2018 $ 943.1 Changes for the Year:Contributions from employers 14.3 Transfer from active life insurance program — Net investment income 180.2 Administrative expense (0.3) Benefit payments (52.9) Net change in Plan Fiduciary Net Position 141.3 Plan Fiduciary Net Position December 31, 2019 $ 1,084.4
Collective Net OPEB Liability December 31, 2018 $ 6.7 Net change in Collective Net OPEB Liability/(Asset) (158.5) Collective Net OPEB Liability/(Asset) December 31, 2019 $ (151.8)
At June 30, 2020, deferred outflows of resources and deferred inflows of resources for the state and component units were reported from the following sources:
Deferred Outflows of Resources
Deferred Inflows of Resources
Difference between Expected and Actual Experience $ — $ (102,598,510)
Changes of Assumptions 19,679,078 —
Changes in Proportion 119,383 (119,383) Net Difference Between Projected and Actual Earnings on OPEB Plan Investments — (58,374,170)
OPEB Contributions Subsequent to the Measurement Date 6,758,985 —
Total $ 26,557,446 $ (161,092,063)
Deferred outflows of resources and deferred inflows of resources for the state (primary government) as of a June 30, 2020 reporting date were as follows:
Deferred Outflows of Resources
Deferred Inflows of Resources
Difference between Expected and Actual Experience $ — $ (89,016,360)
Changes of Assumptions 17,073,931 —
Changes in Proportion 24,548 (104,624) Net Difference Between Projected and Actual Earnings on OPEB Plan Investments — (50,646,506)
OPEB Contributions Subsequent to the Measurement Date 6,758,985 —
Total $ 23,857,464 $ (139,767,490)
Deferred outflows of resources and deferred inflows of resources for component units as of a June 30, 2020 reporting date were as follows:
Deferred Outflows of Resources
Deferred Inflows of Resources
Difference between Expected and Actual Experience $ — $ (13,582,150)
Changes of Assumptions 2,605,147 —
Changes in Proportion 94,833 (14,759) Net Difference Between Projected and Actual Earnings on OPEB Plan Investments — (7,727,664)
OPEB Contributions Subsequent to the Measurement Date* — —
Total $ 2,699,980 $ (21,324,573)
*Component Units didn’t report the SHICC OPEB in FY 2020 as they deemed the amounts immaterial. Therefore, they didn’t have any subsequent contributions.
State of Wisconsin Notes to The Financial Statements
For the Fiscal Year Ended June 30, 2020
142
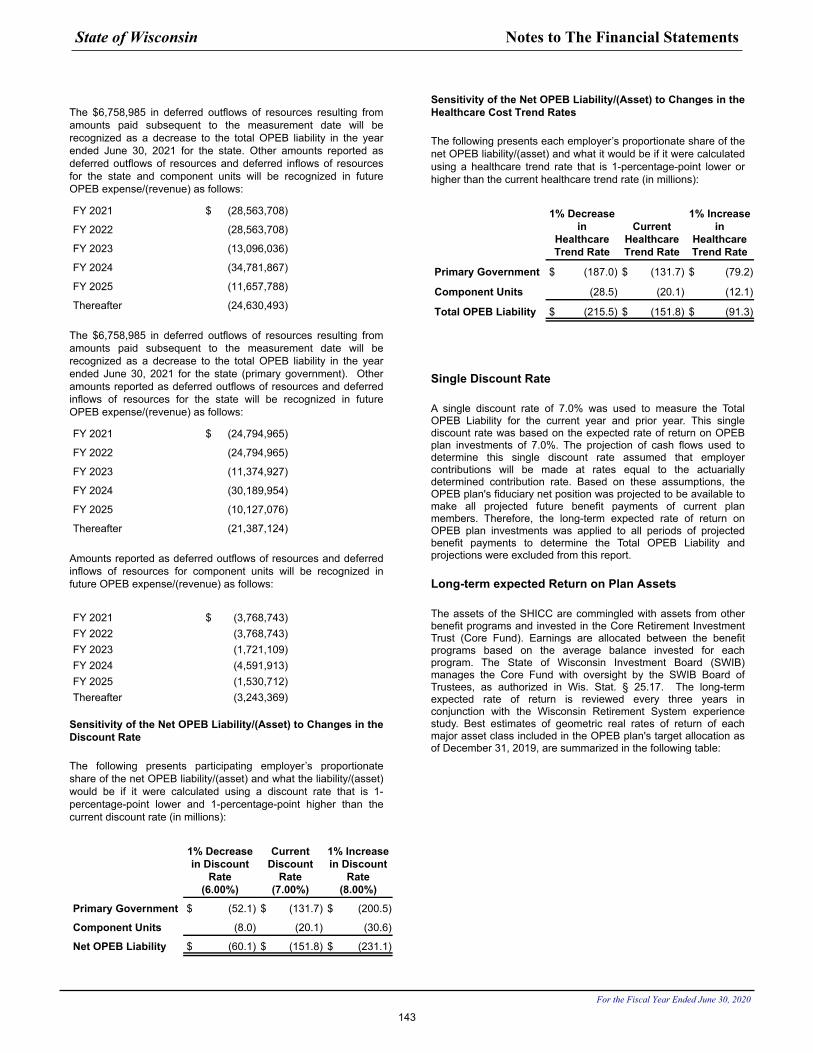
The $6,758,985 in deferred outflows of resources resulting from amounts paid subsequent to the measurement date will be recognized as a decrease to the total OPEB liability in the year ended June 30, 2021 for the state. Other amounts reported as deferred outflows of resources and deferred inflows of resources for the state and component units will be recognized in future OPEB expense/(revenue) as follows:
FY 2021 $ (28,563,708)
FY 2022 (28,563,708)
FY 2023 (13,096,036)
FY 2024 (34,781,867)
FY 2025 (11,657,788)
Thereafter (24,630,493)
The $6,758,985 in deferred outflows of resources resulting from amounts paid subsequent to the measurement date will be recognized as a decrease to the total OPEB liability in the year ended June 30, 2021 for the state (primary government). Other amounts reported as deferred outflows of resources and deferred inflows of resources for the state will be recognized in future OPEB expense/(revenue) as follows:
FY 2021 $ (24,794,965)
FY 2022 (24,794,965)
FY 2023 (11,374,927)
FY 2024 (30,189,954)
FY 2025 (10,127,076)
Thereafter (21,387,124)
Amounts reported as deferred outflows of resources and deferred inflows of resources for component units will be recognized in future OPEB expense/(revenue) as follows:
FY 2021 $ (3,768,743) FY 2022 (3,768,743) FY 2023 (1,721,109) FY 2024 (4,591,913) FY 2025 (1,530,712) Thereafter (3,243,369)
Sensitivity of the Net OPEB Liability/(Asset) to Changes in the Discount Rate
The following presents participating employer’s proportionate share of the net OPEB liability/(asset) and what the liability/(asset) would be if it were calculated using a discount rate that is 1-percentage-point lower and 1-percentage-point higher than the current discount rate (in millions):
1% Decreasein Discount
Rate(6.00%)
CurrentDiscount
Rate(7.00%)
1% Increasein Discount
Rate(8.00%)
Primary Government $ (52.1) $ (131.7) $ (200.5)
Component Units (8.0) (20.1) (30.6)
Net OPEB Liability $ (60.1) $ (151.8) $ (231.1)
Sensitivity of the Net OPEB Liability/(Asset) to Changes in the Healthcare Cost Trend Rates
The following presents each employer’s proportionate share of the net OPEB liability/(asset) and what it would be if it were calculated using a healthcare trend rate that is 1-percentage-point lower or higher than the current healthcare trend rate (in millions):
1% Decrease in
HealthcareTrend Rate
Current Healthcare Trend Rate
1% Increase in
HealthcareTrend Rate
Primary Government $ (187.0) $ (131.7) $ (79.2)
Component Units (28.5) (20.1) (12.1)
Total OPEB Liability $ (215.5) $ (151.8) $ (91.3)
Single Discount Rate
A single discount rate of 7.0% was used to measure the Total OPEB Liability for the current year and prior year. This single discount rate was based on the expected rate of return on OPEB plan investments of 7.0%. The projection of cash flows used to determine this single discount rate assumed that employer contributions will be made at rates equal to the actuarially determined contribution rate. Based on these assumptions, the OPEB plan's fiduciary net position was projected to be available to make all projected future benefit payments of current plan members. Therefore, the long-term expected rate of return on OPEB plan investments was applied to all periods of projected benefit payments to determine the Total OPEB Liability and projections were excluded from this report.
Long-term expected Return on Plan Assets
The assets of the SHICC are commingled with assets from other benefit programs and invested in the Core Retirement Investment Trust (Core Fund). Earnings are allocated between the benefit programs based on the average balance invested for each program. The State of Wisconsin Investment Board (SWIB) manages the Core Fund with oversight by the SWIB Board of Trustees, as authorized in Wis. Stat. § 25.17. The long-term expected rate of return is reviewed every three years in conjunction with the Wisconsin Retirement System experience study. Best estimates of geometric real rates of return of each major asset class included in the OPEB plan's target allocation as of December 31, 2019, are summarized in the following table:
State of Wisconsin Notes to The Financial Statements
For the Fiscal Year Ended June 30, 2020
143
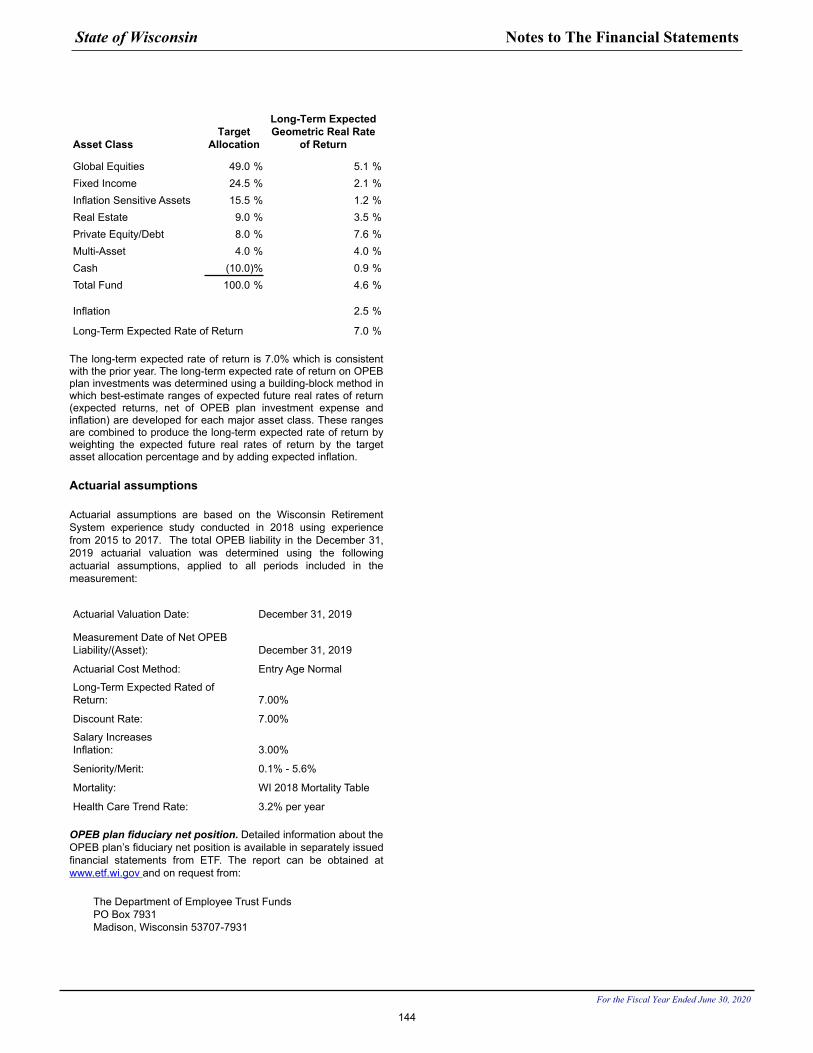
Asset ClassTarget
Allocation
Long-Term Expected Geometric Real Rate
of Return
Global Equities 49.0 % 5.1 %Fixed Income 24.5 % 2.1 %Inflation Sensitive Assets 15.5 % 1.2 %Real Estate 9.0 % 3.5 %Private Equity/Debt 8.0 % 7.6 %Multi-Asset 4.0 % 4.0 %Cash (10.0) % 0.9 %Total Fund 100.0 % 4.6 %
Inflation 2.5 %
Long-Term Expected Rate of Return 7.0 %
The long-term expected rate of return is 7.0% which is consistent with the prior year. The long-term expected rate of return on OPEB plan investments was determined using a building-block method in which best-estimate ranges of expected future real rates of return (expected returns, net of OPEB plan investment expense and inflation) are developed for each major asset class. These ranges are combined to produce the long-term expected rate of return by weighting the expected future real rates of return by the target asset allocation percentage and by adding expected inflation.
Actuarial assumptions
Actuarial assumptions are based on the Wisconsin Retirement System experience study conducted in 2018 using experience from 2015 to 2017. The total OPEB liability in the December 31, 2019 actuarial valuation was determined using the following actuarial assumptions, applied to all periods included in the measurement:
Actuarial Valuation Date: December 31, 2019
Measurement Date of Net OPEB Liability/(Asset): December 31, 2019
Actuarial Cost Method: Entry Age Normal
Long-Term Expected Rated ofReturn: 7.00%
Discount Rate: 7.00%
Salary IncreasesInflation: 3.00%
Seniority/Merit: 0.1% - 5.6%
Mortality: WI 2018 Mortality Table
Health Care Trend Rate: 3.2% per year
OPEB plan fiduciary net position. Detailed information about the OPEB plan’s fiduciary net position is available in separately issued financial statements from ETF. The report can be obtained at www.etf.wi.gov and on request from:
The Department of Employee Trust FundsPO Box 7931Madison, Wisconsin 53707-7931
State of Wisconsin Notes to The Financial Statements
For the Fiscal Year Ended June 30, 2020
144
NOTE 18. PUBLIC ENTITY RISK POOLS ADMINISTERED BY THE DEPARTMENT OF EMPLOYEE TRUST FUNDS
The Department of Employee Trust Funds operates three public entity risk pools: group health insurance, group income continuation insurance and duty disability insurance. ETF’s separately issued financial statements, which contain historical trend, revenue, and claims development information, are available at www.etf.wi.gov and on request from:
Wisconsin Department of Employee Trust Funds PO Box 7931Madison, WI 53707-79311-877-533-5020
The information provided in this note applies to the period ending December 31, 2019.
A. Description of Funds
The Health Insurance Fund offers group health insurance for current employees of the State government and of participating local public employers. All public employers in the State are eligible to participate. The State and 363 local employers currently participate. The State and local government portions of the fund are accounted for separately and have separate contribution rates, benefits, and actuarial valuations. The fund includes both a self-insured, fee-for-service plan as well as various prepaid plans, primarily Health Maintenance Organizations (HMO's) and a self-insured plan that provides for pharmacy benefits of covered members.
The Income Continuation Insurance Fund offers both long-term and short-term disability benefits (up to 75% of the average monthly earnings) for current employees of the State and of participating local public employers. All public employers in the State are eligible to participate. The State and 250 local employers currently participate in the plan and it is self-insured. The State and local government portions of the fund are accounted for separately and have separate contribution rates, benefits, and actuarial valuations. Since March 2012, premiums have been suspended for the local employers as a result of the funded status of the local employer program.
The Duty Disability Fund offers special disability insurance for State of Wisconsin and local WRS participants in protective occupations. Participation in the program is mandatory for all WRS employers with protective occupation employees. The State of Wisconsin and 501 local employers currently participate. The plan is self-insured, and the risk is shared between the State of Wisconsin and local government employers in the plan. Contributions are actuarially determined and are employer paid. Contributions are based on a graduated, experience-rated formula. During 2019, contribution rates ranged from 0.17% to 4.42% of covered payroll based on employer experience.
B. Accounting Policies for Risk Pools
Basis of Accounting - All Public Entity Risk Pools are accounted for in enterprise funds using the full accrual basis of accounting and the flow of economic resources measurement focus.
Valuation of Investments - Assets of the Health Insurance Fund Income Continuation Insurance and Duty Disability Insurance funds are invested in the Core Retirement Investment Trust. Investments are valued at fair value.
Unpaid Claims Liabilities - Claims liabilities are based on estimates of the ultimate cost of claims that have been reported but not settled, and of claims that have been incurred but not reported. The estimate includes the effects of inflation and other societal and economic factors. Adjustments to claims liabilities are charged or credited to expense in the periods in which they are made. Unpaid claims liability is presented at face value and is not discounted for health insurance. It is discounted using an interest rate of 7.0 percent for income continuation and duty disability insurance, as face value of the liability for these programs is not available. The liabilities for income continuation, duty disability, and health insurance were determined by actuarial methods.
Administrative Expenses - All maintenance expenses are expensed in the period in which they are incurred. Acquisition costs are immaterial and are treated as maintenance expenses.
Reinsurance - Health insurance plans provided by HMO's and health insurance for local government annuitants are fully insured by outside insurers. All remaining risk is self-insured with no reinsurance coverage.
Risk Transfer - Participating employers are not subject to supplemental assessments in the event of deficiencies. If the assets of the fund were exhausted, participating employers would not be responsible for the fund's liabilities.
Premium Setting - Premiums are established by the GIB (Health Insurance and ICI) and ETF Board for Duty Disability in consultation with actuaries.
Statutory Authority: All programs are operated under the authority of Chapter 40, Wisconsin Statutes.
State of Wisconsin Notes to The Financial Statements
For the Fiscal Year Ended June 30, 2020
145
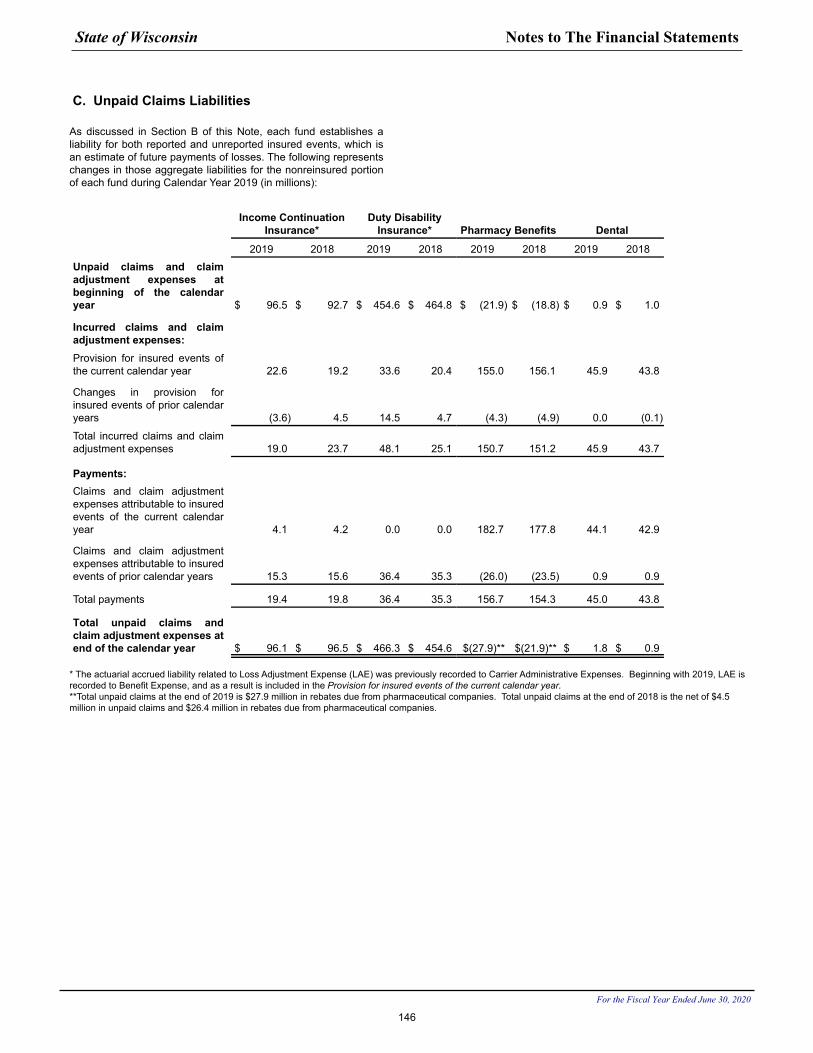
C. Unpaid Claims Liabilities
As discussed in Section B of this Note, each fund establishes a liability for both reported and unreported insured events, which is an estimate of future payments of losses. The following represents changes in those aggregate liabilities for the nonreinsured portion of each fund during Calendar Year 2019 (in millions):
Income Continuation Insurance*
Duty Disability Insurance* Pharmacy Benefits Dental
2019 2018 2019 2018 2019 2018 2019 2018Unpaid claims and claim adjustment expenses at beginning of the calendar year $ 96.5 $ 92.7 $ 454.6 $ 464.8 $ (21.9) $ (18.8) $ 0.9 $ 1.0
Incurred claims and claim adjustment expenses:Provision for insured events of the current calendar year 22.6 19.2 33.6 20.4 155.0 156.1 45.9 43.8
Changes in provision for insured events of prior calendar years (3.6) 4.5 14.5 4.7 (4.3) (4.9) 0.0 (0.1)
Total incurred claims and claim adjustment expenses 19.0 23.7 48.1 25.1 150.7 151.2 45.9 43.7
Payments:Claims and claim adjustment expenses attributable to insured events of the current calendar year 4.1 4.2 0.0 0.0 182.7 177.8 44.1 42.9
Claims and claim adjustment expenses attributable to insured events of prior calendar years 15.3 15.6 36.4 35.3 (26.0) (23.5) 0.9 0.9
Total payments 19.4 19.8 36.4 35.3 156.7 154.3 45.0 43.8
Total unpaid claims and claim adjustment expenses at end of the calendar year $ 96.1 $ 96.5 $ 466.3 $ 454.6 $(27.9)** $(21.9)** $ 1.8 $ 0.9
* The actuarial accrued liability related to Loss Adjustment Expense (LAE) was previously recorded to Carrier Administrative Expenses. Beginning with 2019, LAE is recorded to Benefit Expense, and as a result is included in the Provision for insured events of the current calendar year.**Total unpaid claims at the end of 2019 is $27.9 million in rebates due from pharmaceutical companies. Total unpaid claims at the end of 2018 is the net of $4.5 million in unpaid claims and $26.4 million in rebates due from pharmaceutical companies.
State of Wisconsin Notes to The Financial Statements
For the Fiscal Year Ended June 30, 2020
146
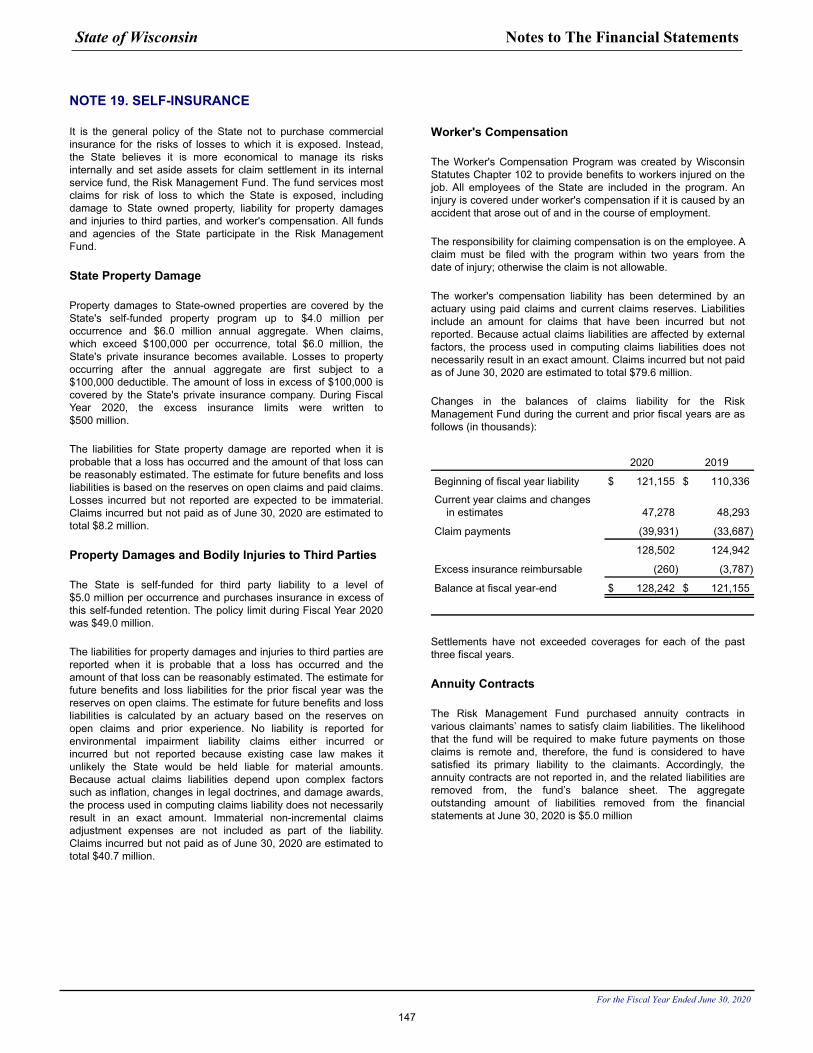
NOTE 19. SELF-INSURANCE
It is the general policy of the State not to purchase commercial insurance for the risks of losses to which it is exposed. Instead, the State believes it is more economical to manage its risks internally and set aside assets for claim settlement in its internal service fund, the Risk Management Fund. The fund services most claims for risk of loss to which the State is exposed, including damage to State owned property, liability for property damages and injuries to third parties, and worker's compensation. All funds and agencies of the State participate in the Risk Management Fund.
State Property Damage
Property damages to State-owned properties are covered by the State's self-funded property program up to $4.0 million per occurrence and $6.0 million annual aggregate. When claims, which exceed $100,000 per occurrence, total $6.0 million, the State's private insurance becomes available. Losses to property occurring after the annual aggregate are first subject to a $100,000 deductible. The amount of loss in excess of $100,000 is covered by the State's private insurance company. During Fiscal Year 2020, the excess insurance limits were written to $500 million.
The liabilities for State property damage are reported when it is probable that a loss has occurred and the amount of that loss can be reasonably estimated. The estimate for future benefits and loss liabilities is based on the reserves on open claims and paid claims. Losses incurred but not reported are expected to be immaterial. Claims incurred but not paid as of June 30, 2020 are estimated to total $8.2 million.
Property Damages and Bodily Injuries to Third Parties
The State is self-funded for third party liability to a level of $5.0 million per occurrence and purchases insurance in excess of this self-funded retention. The policy limit during Fiscal Year 2020 was $49.0 million.
The liabilities for property damages and injuries to third parties are reported when it is probable that a loss has occurred and the amount of that loss can be reasonably estimated. The estimate for future benefits and loss liabilities for the prior fiscal year was the reserves on open claims. The estimate for future benefits and loss liabilities is calculated by an actuary based on the reserves on open claims and prior experience. No liability is reported for environmental impairment liability claims either incurred or incurred but not reported because existing case law makes it unlikely the State would be held liable for material amounts. Because actual claims liabilities depend upon complex factors such as inflation, changes in legal doctrines, and damage awards, the process used in computing claims liability does not necessarily result in an exact amount. Immaterial non-incremental claims adjustment expenses are not included as part of the liability. Claims incurred but not paid as of June 30, 2020 are estimated to total $40.7 million.
Worker's Compensation
The Worker's Compensation Program was created by Wisconsin Statutes Chapter 102 to provide benefits to workers injured on the job. All employees of the State are included in the program. An injury is covered under worker's compensation if it is caused by an accident that arose out of and in the course of employment.
The responsibility for claiming compensation is on the employee. A claim must be filed with the program within two years from the date of injury; otherwise the claim is not allowable.
The worker's compensation liability has been determined by an actuary using paid claims and current claims reserves. Liabilities include an amount for claims that have been incurred but not reported. Because actual claims liabilities are affected by external factors, the process used in computing claims liabilities does not necessarily result in an exact amount. Claims incurred but not paid as of June 30, 2020 are estimated to total $79.6 million.
Changes in the balances of claims liability for the Risk Management Fund during the current and prior fiscal years are as follows (in thousands):
2020 2019
Beginning of fiscal year liability $ 121,155 $ 110,336
Current year claims and changes in estimates 47,278 48,293
Claim payments (39,931) (33,687)
128,502 124,942
Excess insurance reimbursable (260) (3,787)
Balance at fiscal year-end $ 128,242 $ 121,155
Settlements have not exceeded coverages for each of the past three fiscal years.
Annuity Contracts
The Risk Management Fund purchased annuity contracts in various claimants’ names to satisfy claim liabilities. The likelihood that the fund will be required to make future payments on those claims is remote and, therefore, the fund is considered to have satisfied its primary liability to the claimants. Accordingly, the annuity contracts are not reported in, and the related liabilities are removed from, the fund’s balance sheet. The aggregate outstanding amount of liabilities removed from the financial statements at June 30, 2020 is $5.0 million
State of Wisconsin Notes to The Financial Statements
For the Fiscal Year Ended June 30, 2020
147
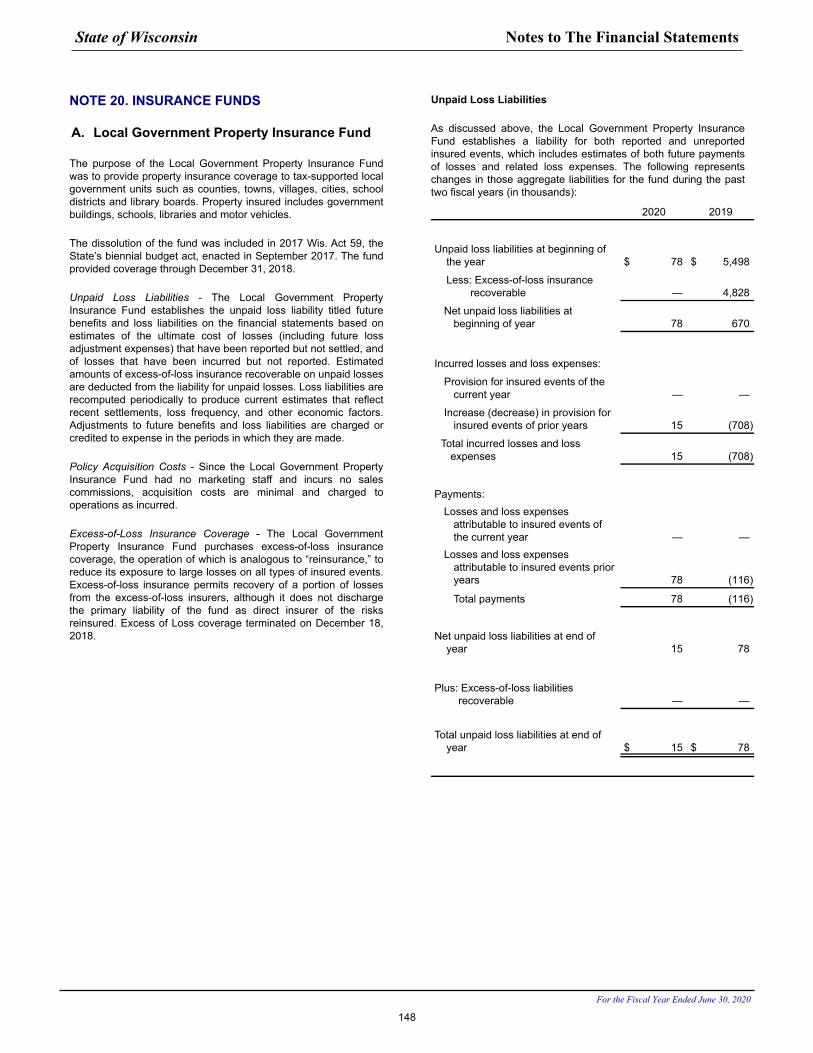
NOTE 20. INSURANCE FUNDS
A. Local Government Property Insurance Fund
The purpose of the Local Government Property Insurance Fund was to provide property insurance coverage to tax-supported local government units such as counties, towns, villages, cities, school districts and library boards. Property insured includes government buildings, schools, libraries and motor vehicles.
The dissolution of the fund was included in 2017 Wis. Act 59, the State’s biennial budget act, enacted in September 2017. The fund provided coverage through December 31, 2018.
Unpaid Loss Liabilities - The Local Government Property Insurance Fund establishes the unpaid loss liability titled future benefits and loss liabilities on the financial statements based on estimates of the ultimate cost of losses (including future loss adjustment expenses) that have been reported but not settled, and of losses that have been incurred but not reported. Estimated amounts of excess-of-loss insurance recoverable on unpaid losses are deducted from the liability for unpaid losses. Loss liabilities are recomputed periodically to produce current estimates that reflect recent settlements, loss frequency, and other economic factors. Adjustments to future benefits and loss liabilities are charged or credited to expense in the periods in which they are made.
Policy Acquisition Costs - Since the Local Government Property Insurance Fund had no marketing staff and incurs no sales commissions, acquisition costs are minimal and charged to operations as incurred.
Excess-of-Loss Insurance Coverage - The Local Government Property Insurance Fund purchases excess-of-loss insurance coverage, the operation of which is analogous to “reinsurance,” to reduce its exposure to large losses on all types of insured events. Excess-of-loss insurance permits recovery of a portion of losses from the excess-of-loss insurers, although it does not discharge the primary liability of the fund as direct insurer of the risks reinsured. Excess of Loss coverage terminated on December 18, 2018.
Unpaid Loss Liabilities
As discussed above, the Local Government Property Insurance Fund establishes a liability for both reported and unreported insured events, which includes estimates of both future payments of losses and related loss expenses. The following represents changes in those aggregate liabilities for the fund during the past two fiscal years (in thousands):
2020 2019
Unpaid loss liabilities at beginning of the year $ 78 $ 5,498
Less: Excess-of-loss insurance recoverable — 4,828
Net unpaid loss liabilities at beginning of year 78 670
Incurred losses and loss expenses:
Provision for insured events of the current year — —
Increase (decrease) in provision for insured events of prior years 15 (708)
Total incurred losses and loss expenses 15 (708)
Payments:Losses and loss expenses
attributable to insured events of the current year — —
Losses and loss expenses attributable to insured events prior years 78 (116)
Total payments 78 (116)
Net unpaid loss liabilities at end of year 15 78
Plus: Excess-of-loss liabilities recoverable — —
Total unpaid loss liabilities at end of year $ 15 $ 78
State of Wisconsin Notes to The Financial Statements
For the Fiscal Year Ended June 30, 2020
148
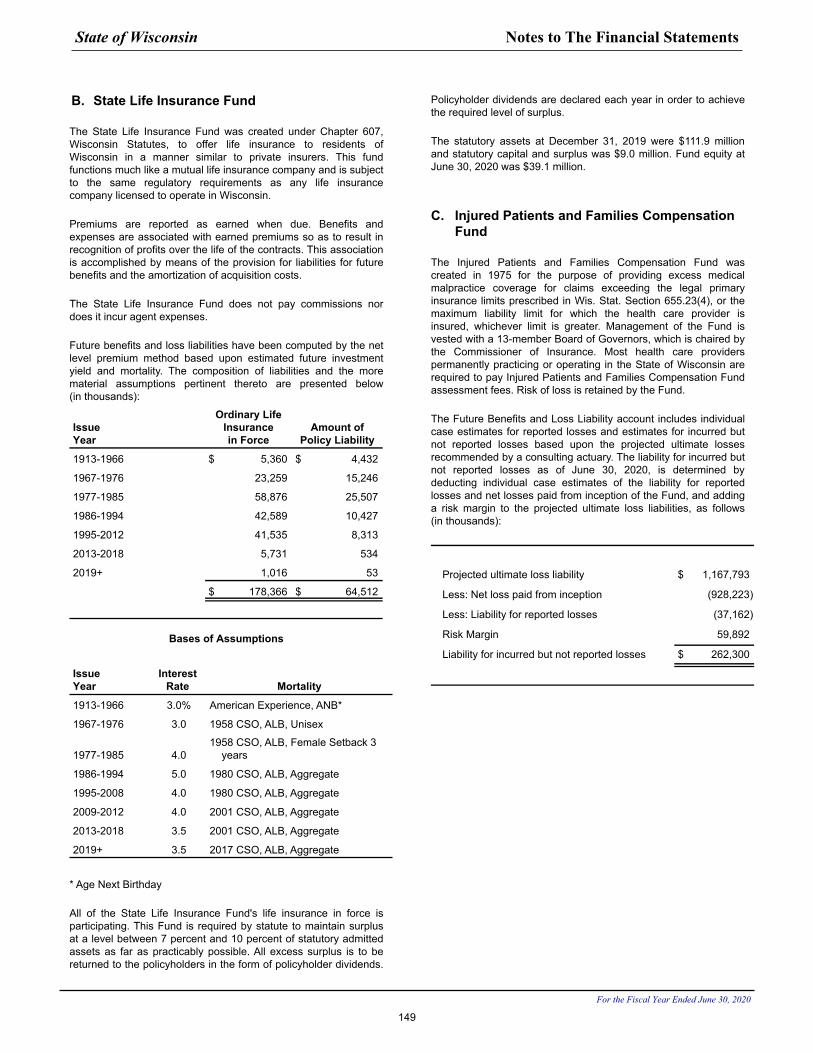
B. State Life Insurance Fund
The State Life Insurance Fund was created under Chapter 607, Wisconsin Statutes, to offer life insurance to residents of Wisconsin in a manner similar to private insurers. This fund functions much like a mutual life insurance company and is subject to the same regulatory requirements as any life insurance company licensed to operate in Wisconsin.
Premiums are reported as earned when due. Benefits and expenses are associated with earned premiums so as to result in recognition of profits over the life of the contracts. This association is accomplished by means of the provision for liabilities for future benefits and the amortization of acquisition costs.
The State Life Insurance Fund does not pay commissions nor does it incur agent expenses.
Future benefits and loss liabilities have been computed by the net level premium method based upon estimated future investment yield and mortality. The composition of liabilities and the more material assumptions pertinent thereto are presented below (in thousands):
IssueYear
Ordinary LifeInsurancein Force
Amount ofPolicy Liability
1913-1966 $ 5,360 $ 4,432
1967-1976 23,259 15,246
1977-1985 58,876 25,507
1986-1994 42,589 10,427
1995-2012 41,535 8,313
2013-2018 5,731 534
2019+ 1,016 53
$ 178,366 $ 64,512
Bases of Assumptions
IssueYear
InterestRate Mortality
1913-1966 3.0% American Experience, ANB*
1967-1976 3.0 1958 CSO, ALB, Unisex
1977-1985 4.01958 CSO, ALB, Female Setback 3
years
1986-1994 5.0 1980 CSO, ALB, Aggregate
1995-2008 4.0 1980 CSO, ALB, Aggregate
2009-2012 4.0 2001 CSO, ALB, Aggregate
2013-2018 3.5 2001 CSO, ALB, Aggregate
2019+ 3.5 2017 CSO, ALB, Aggregate
* Age Next Birthday
All of the State Life Insurance Fund's life insurance in force is participating. This Fund is required by statute to maintain surplus at a level between 7 percent and 10 percent of statutory admitted assets as far as practicably possible. All excess surplus is to be returned to the policyholders in the form of policyholder dividends.
Policyholder dividends are declared each year in order to achieve the required level of surplus.
The statutory assets at December 31, 2019 were $111.9 million and statutory capital and surplus was $9.0 million. Fund equity at June 30, 2020 was $39.1 million.
C. Injured Patients and Families Compensation Fund
The Injured Patients and Families Compensation Fund was created in 1975 for the purpose of providing excess medical malpractice coverage for claims exceeding the legal primary insurance limits prescribed in Wis. Stat. Section 655.23(4), or the maximum liability limit for which the health care provider is insured, whichever limit is greater. Management of the Fund is vested with a 13-member Board of Governors, which is chaired by the Commissioner of Insurance. Most health care providers permanently practicing or operating in the State of Wisconsin are required to pay Injured Patients and Families Compensation Fund assessment fees. Risk of loss is retained by the Fund.
The Future Benefits and Loss Liability account includes individual case estimates for reported losses and estimates for incurred but not reported losses based upon the projected ultimate losses recommended by a consulting actuary. The liability for incurred but not reported losses as of June 30, 2020, is determined by deducting individual case estimates of the liability for reported losses and net losses paid from inception of the Fund, and adding a risk margin to the projected ultimate loss liabilities, as follows (in thousands):
Projected ultimate loss liability $ 1,167,793
Less: Net loss paid from inception (928,223)
Less: Liability for reported losses (37,162)
Risk Margin 59,892
Liability for incurred but not reported losses $ 262,300
State of Wisconsin Notes to The Financial Statements
For the Fiscal Year Ended June 30, 2020
149
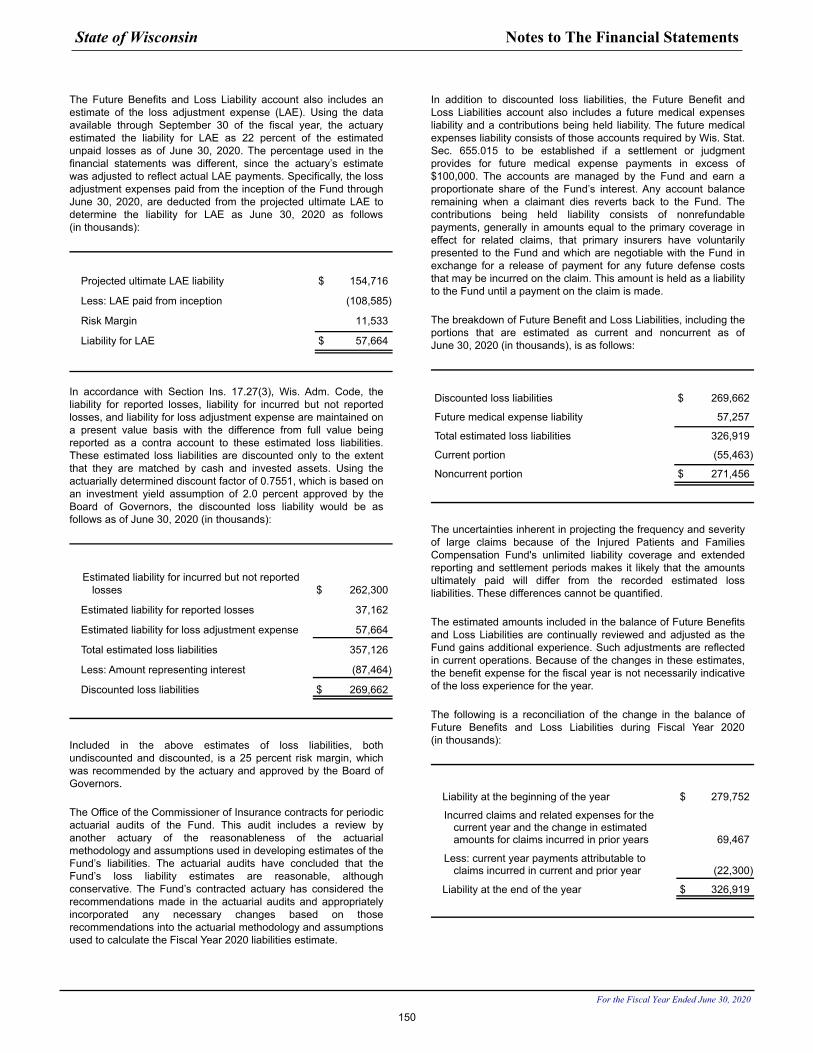
The Future Benefits and Loss Liability account also includes an estimate of the loss adjustment expense (LAE). Using the data available through September 30 of the fiscal year, the actuary estimated the liability for LAE as 22 percent of the estimated unpaid losses as of June 30, 2020. The percentage used in the financial statements was different, since the actuary’s estimate was adjusted to reflect actual LAE payments. Specifically, the loss adjustment expenses paid from the inception of the Fund through June 30, 2020, are deducted from the projected ultimate LAE to determine the liability for LAE as June 30, 2020 as follows (in thousands):
Projected ultimate LAE liability $ 154,716
Less: LAE paid from inception (108,585)
Risk Margin 11,533
Liability for LAE $ 57,664
In accordance with Section Ins. 17.27(3), Wis. Adm. Code, the liability for reported losses, liability for incurred but not reported losses, and liability for loss adjustment expense are maintained on a present value basis with the difference from full value being reported as a contra account to these estimated loss liabilities. These estimated loss liabilities are discounted only to the extent that they are matched by cash and invested assets. Using the actuarially determined discount factor of 0.7551, which is based on an investment yield assumption of 2.0 percent approved by the Board of Governors, the discounted loss liability would be as follows as of June 30, 2020 (in thousands):
Estimated liability for incurred but not reported losses $ 262,300
Estimated liability for reported losses 37,162
Estimated liability for loss adjustment expense 57,664
Total estimated loss liabilities 357,126
Less: Amount representing interest (87,464)
Discounted loss liabilities $ 269,662
Included in the above estimates of loss liabilities, both undiscounted and discounted, is a 25 percent risk margin, which was recommended by the actuary and approved by the Board of Governors.
The Office of the Commissioner of Insurance contracts for periodic actuarial audits of the Fund. This audit includes a review by another actuary of the reasonableness of the actuarial methodology and assumptions used in developing estimates of the Fund’s liabilities. The actuarial audits have concluded that the Fund’s loss liability estimates are reasonable, although conservative. The Fund’s contracted actuary has considered the recommendations made in the actuarial audits and appropriately incorporated any necessary changes based on those recommendations into the actuarial methodology and assumptions used to calculate the Fiscal Year 2020 liabilities estimate.
In addition to discounted loss liabilities, the Future Benefit and Loss Liabilities account also includes a future medical expenses liability and a contributions being held liability. The future medical expenses liability consists of those accounts required by Wis. Stat. Sec. 655.015 to be established if a settlement or judgment provides for future medical expense payments in excess of $100,000. The accounts are managed by the Fund and earn a proportionate share of the Fund’s interest. Any account balance remaining when a claimant dies reverts back to the Fund. The contributions being held liability consists of nonrefundable payments, generally in amounts equal to the primary coverage in effect for related claims, that primary insurers have voluntarily presented to the Fund and which are negotiable with the Fund in exchange for a release of payment for any future defense costs that may be incurred on the claim. This amount is held as a liability to the Fund until a payment on the claim is made.
The breakdown of Future Benefit and Loss Liabilities, including the portions that are estimated as current and noncurrent as of June 30, 2020 (in thousands), is as follows:
Discounted loss liabilities $ 269,662
Future medical expense liability 57,257
Total estimated loss liabilities 326,919
Current portion (55,463)
Noncurrent portion $ 271,456
The uncertainties inherent in projecting the frequency and severity of large claims because of the Injured Patients and Families Compensation Fund's unlimited liability coverage and extended reporting and settlement periods makes it likely that the amounts ultimately paid will differ from the recorded estimated loss liabilities. These differences cannot be quantified.
The estimated amounts included in the balance of Future Benefits and Loss Liabilities are continually reviewed and adjusted as the Fund gains additional experience. Such adjustments are reflected in current operations. Because of the changes in these estimates, the benefit expense for the fiscal year is not necessarily indicative of the loss experience for the year.
The following is a reconciliation of the change in the balance of Future Benefits and Loss Liabilities during Fiscal Year 2020 (in thousands):
Liability at the beginning of the year $ 279,752
Incurred claims and related expenses for the current year and the change in estimated amounts for claims incurred in prior years 69,467
Less: current year payments attributable to claims incurred in current and prior year (22,300)
Liability at the end of the year $ 326,919
State of Wisconsin Notes to The Financial Statements
For the Fiscal Year Ended June 30, 2020
150
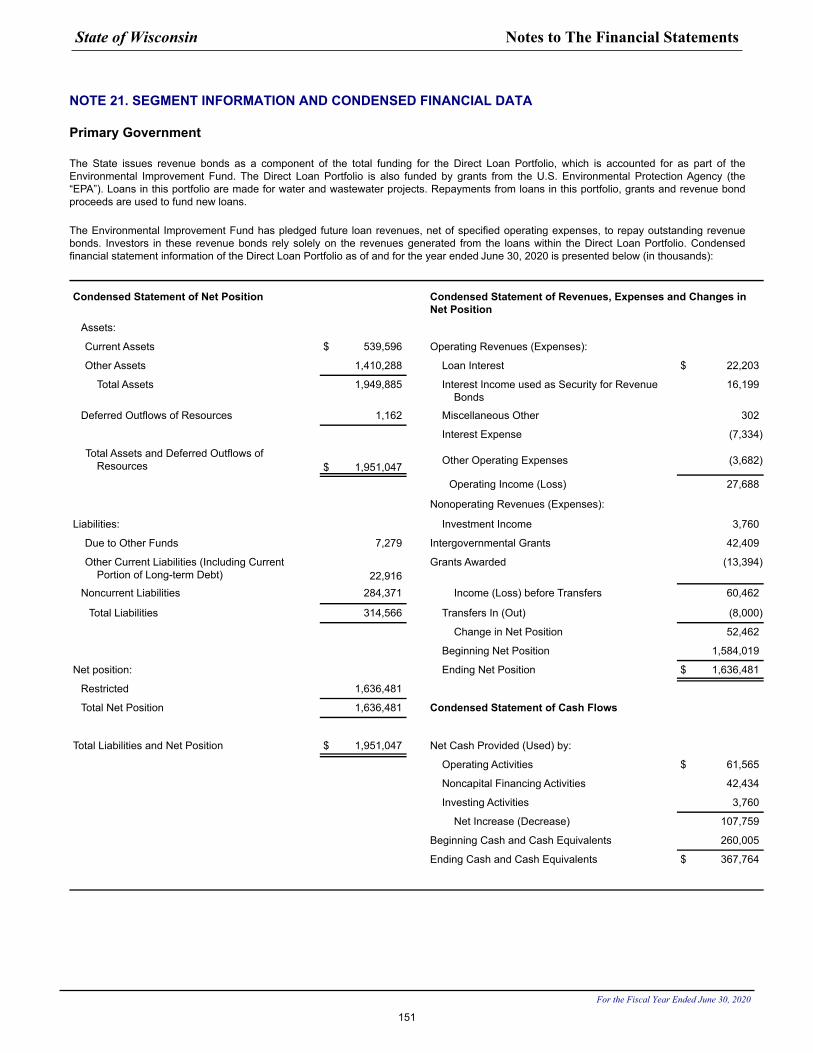
NOTE 21. SEGMENT INFORMATION AND CONDENSED FINANCIAL DATA
Primary Government
The State issues revenue bonds as a component of the total funding for the Direct Loan Portfolio, which is accounted for as part of the Environmental Improvement Fund. The Direct Loan Portfolio is also funded by grants from the U.S. Environmental Protection Agency (the “EPA”). Loans in this portfolio are made for water and wastewater projects. Repayments from loans in this portfolio, grants and revenue bond proceeds are used to fund new loans.
The Environmental Improvement Fund has pledged future loan revenues, net of specified operating expenses, to repay outstanding revenue bonds. Investors in these revenue bonds rely solely on the revenues generated from the loans within the Direct Loan Portfolio. Condensed financial statement information of the Direct Loan Portfolio as of and for the year ended June 30, 2020 is presented below (in thousands):
Condensed Statement of Net Position Condensed Statement of Revenues, Expenses and Changes in Net Position
Assets:
Current Assets $ 539,596 Operating Revenues (Expenses):
Other Assets 1,410,288 Loan Interest $ 22,203
Total Assets 1,949,885 Interest Income used as Security for Revenue Bonds
16,199
Deferred Outflows of Resources 1,162 Miscellaneous Other 302
Interest Expense (7,334)
Total Assets and Deferred Outflows of Resources $ 1,951,047 Other Operating Expenses (3,682)
Operating Income (Loss) 27,688
Nonoperating Revenues (Expenses):
Liabilities: Investment Income 3,760
Due to Other Funds 7,279 Intergovernmental Grants 42,409
Other Current Liabilities (Including Current Portion of Long-term Debt) 22,916
Grants Awarded (13,394)
Noncurrent Liabilities 284,371 Income (Loss) before Transfers 60,462
Total Liabilities 314,566 Transfers In (Out) (8,000)
Change in Net Position 52,462
Beginning Net Position 1,584,019
Net position: Ending Net Position $ 1,636,481
Restricted 1,636,481
Total Net Position 1,636,481 Condensed Statement of Cash Flows
Total Liabilities and Net Position $ 1,951,047 Net Cash Provided (Used) by:
Operating Activities $ 61,565
Noncapital Financing Activities 42,434
Investing Activities 3,760
Net Increase (Decrease) 107,759
Beginning Cash and Cash Equivalents 260,005
Ending Cash and Cash Equivalents $ 367,764
State of Wisconsin Notes to The Financial Statements
For the Fiscal Year Ended June 30, 2020
151
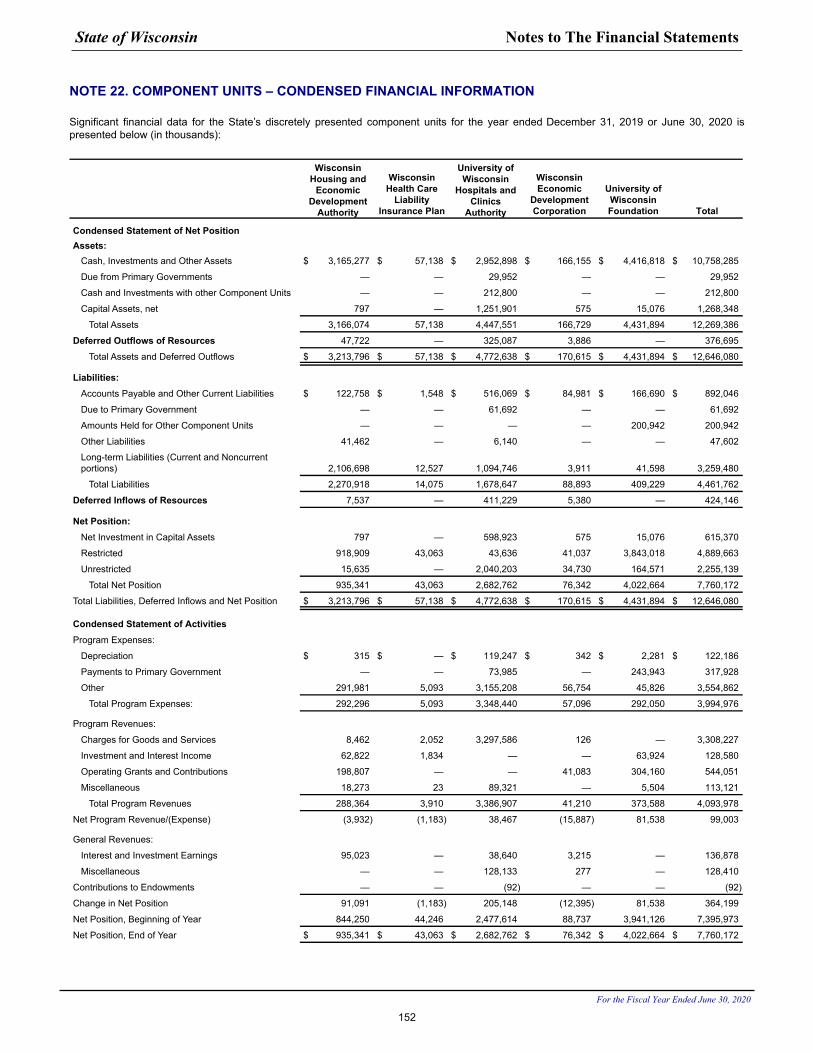
NOTE 22. COMPONENT UNITS – CONDENSED FINANCIAL INFORMATION
Significant financial data for the State’s discretely presented component units for the year ended December 31, 2019 or June 30, 2020 is presented below (in thousands):
Wisconsin Housing and
Economic Development
Authority
Wisconsin Health Care
Liability Insurance Plan
University of Wisconsin
Hospitals and Clinics
Authority
Wisconsin Economic
Development Corporation
University of Wisconsin Foundation Total
Condensed Statement of Net PositionAssets:
Cash, Investments and Other Assets $ 3,165,277 $ 57,138 $ 2,952,898 $ 166,155 $ 4,416,818 $ 10,758,285
Due from Primary Governments — — 29,952 — — 29,952
Cash and Investments with other Component Units — — 212,800 — — 212,800
Capital Assets, net 797 — 1,251,901 575 15,076 1,268,348
Total Assets 3,166,074 57,138 4,447,551 166,729 4,431,894 12,269,386
Deferred Outflows of Resources 47,722 — 325,087 3,886 — 376,695
Total Assets and Deferred Outflows $ 3,213,796 $ 57,138 $ 4,772,638 $ 170,615 $ 4,431,894 $ 12,646,080
Liabilities: Accounts Payable and Other Current Liabilities $ 122,758 $ 1,548 $ 516,069 $ 84,981 $ 166,690 $ 892,046
Due to Primary Government — — 61,692 — — 61,692
Amounts Held for Other Component Units — — — — 200,942 200,942
Other Liabilities 41,462 — 6,140 — — 47,602
Long-term Liabilities (Current and Noncurrent portions) 2,106,698 12,527 1,094,746 3,911 41,598 3,259,480
Total Liabilities 2,270,918 14,075 1,678,647 88,893 409,229 4,461,762
Deferred Inflows of Resources 7,537 — 411,229 5,380 — 424,146
Net Position:Net Investment in Capital Assets 797 — 598,923 575 15,076 615,370
Restricted 918,909 43,063 43,636 41,037 3,843,018 4,889,663
Unrestricted 15,635 — 2,040,203 34,730 164,571 2,255,139
Total Net Position 935,341 43,063 2,682,762 76,342 4,022,664 7,760,172
Total Liabilities, Deferred Inflows and Net Position $ 3,213,796 $ 57,138 $ 4,772,638 $ 170,615 $ 4,431,894 $ 12,646,080
Condensed Statement of ActivitiesProgram Expenses:
Depreciation $ 315 $ — $ 119,247 $ 342 $ 2,281 $ 122,186
Payments to Primary Government — — 73,985 — 243,943 317,928
Other 291,981 5,093 3,155,208 56,754 45,826 3,554,862
Total Program Expenses: 292,296 5,093 3,348,440 57,096 292,050 3,994,976
Program Revenues:
Charges for Goods and Services 8,462 2,052 3,297,586 126 — 3,308,227
Investment and Interest Income 62,822 1,834 — — 63,924 128,580
Operating Grants and Contributions 198,807 — — 41,083 304,160 544,051
Miscellaneous 18,273 23 89,321 — 5,504 113,121
Total Program Revenues 288,364 3,910 3,386,907 41,210 373,588 4,093,978
Net Program Revenue/(Expense) (3,932) (1,183) 38,467 (15,887) 81,538 99,003
General Revenues:
Interest and Investment Earnings 95,023 — 38,640 3,215 — 136,878
Miscellaneous — — 128,133 277 — 128,410
Contributions to Endowments — — (92) — — (92)
Change in Net Position 91,091 (1,183) 205,148 (12,395) 81,538 364,199
Net Position, Beginning of Year 844,250 44,246 2,477,614 88,737 3,941,126 7,395,973
Net Position, End of Year $ 935,341 $ 43,063 $ 2,682,762 $ 76,342 $ 4,022,664 $ 7,760,172
State of Wisconsin Notes to The Financial Statements
For the Fiscal Year Ended June 30, 2020
152
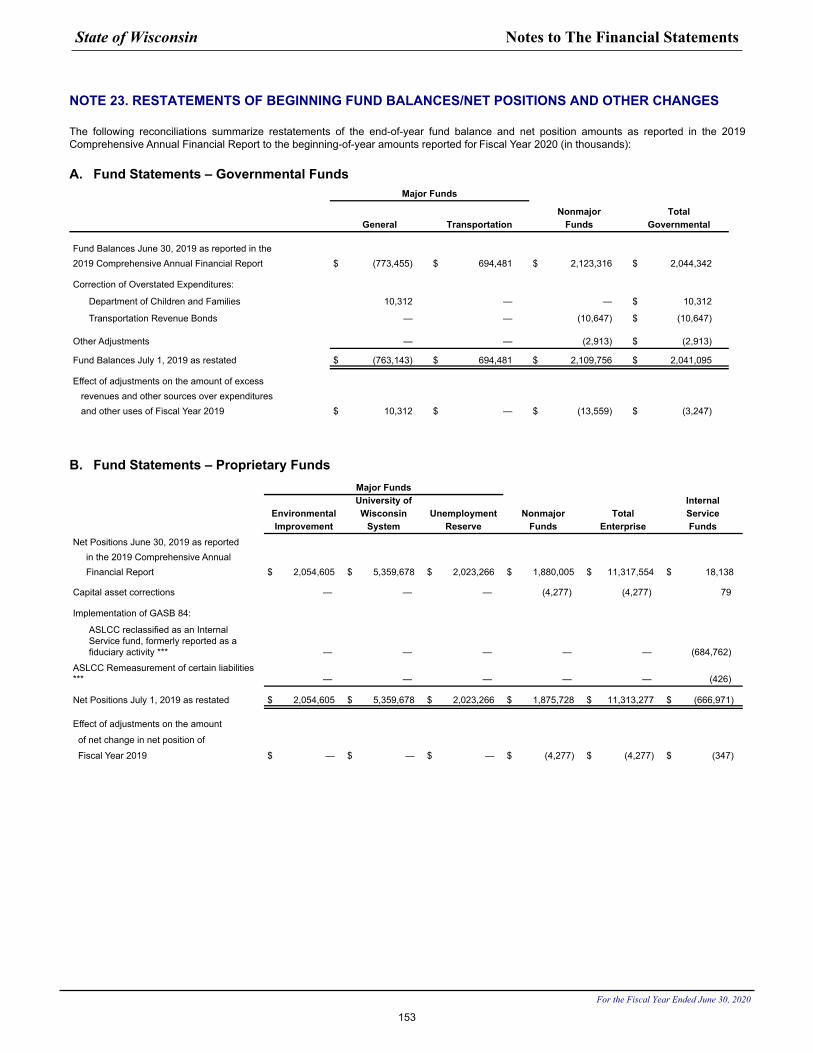
NOTE 23. RESTATEMENTS OF BEGINNING FUND BALANCES/NET POSITIONS AND OTHER CHANGES
The following reconciliations summarize restatements of the end-of-year fund balance and net position amounts as reported in the 2019 Comprehensive Annual Financial Report to the beginning-of-year amounts reported for Fiscal Year 2020 (in thousands):
A. Fund Statements – Governmental FundsMajor Funds
Nonmajor TotalGeneral Transportation Funds Governmental
Fund Balances June 30, 2019 as reported in the2019 Comprehensive Annual Financial Report $ (773,455) $ 694,481 $ 2,123,316 $ 2,044,342
Correction of Overstated Expenditures:
Department of Children and Families 10,312 — — $ 10,312
Transportation Revenue Bonds — — (10,647) $ (10,647)
Other Adjustments — — (2,913) $ (2,913)
Fund Balances July 1, 2019 as restated $ (763,143) $ 694,481 $ 2,109,756 $ 2,041,095
Effect of adjustments on the amount of excessrevenues and other sources over expendituresand other uses of Fiscal Year 2019 $ 10,312 $ — $ (13,559) $ (3,247)
B. Fund Statements – Proprietary FundsMajor FundsUniversity of Internal
Environmental Wisconsin Unemployment Nonmajor Total ServiceImprovement System Reserve Funds Enterprise Funds
Net Positions June 30, 2019 as reported in the 2019 Comprehensive Annual Financial Report $ 2,054,605 $ 5,359,678 $ 2,023,266 $ 1,880,005 $ 11,317,554 $ 18,138
Capital asset corrections — — — (4,277) (4,277) 79
Implementation of GASB 84:
ASLCC reclassified as an Internal Service fund, formerly reported as a fiduciary activity *** — — — — — (684,762)
ASLCC Remeasurement of certain liabilities *** — — — — — (426)
Net Positions July 1, 2019 as restated $ 2,054,605 $ 5,359,678 $ 2,023,266 $ 1,875,728 $ 11,313,277 $ (666,971)
Effect of adjustments on the amount
of net change in net position of
Fiscal Year 2019 $ — $ — $ — $ (4,277) $ (4,277) $ (347)
State of Wisconsin Notes to The Financial Statements
For the Fiscal Year Ended June 30, 2020
153
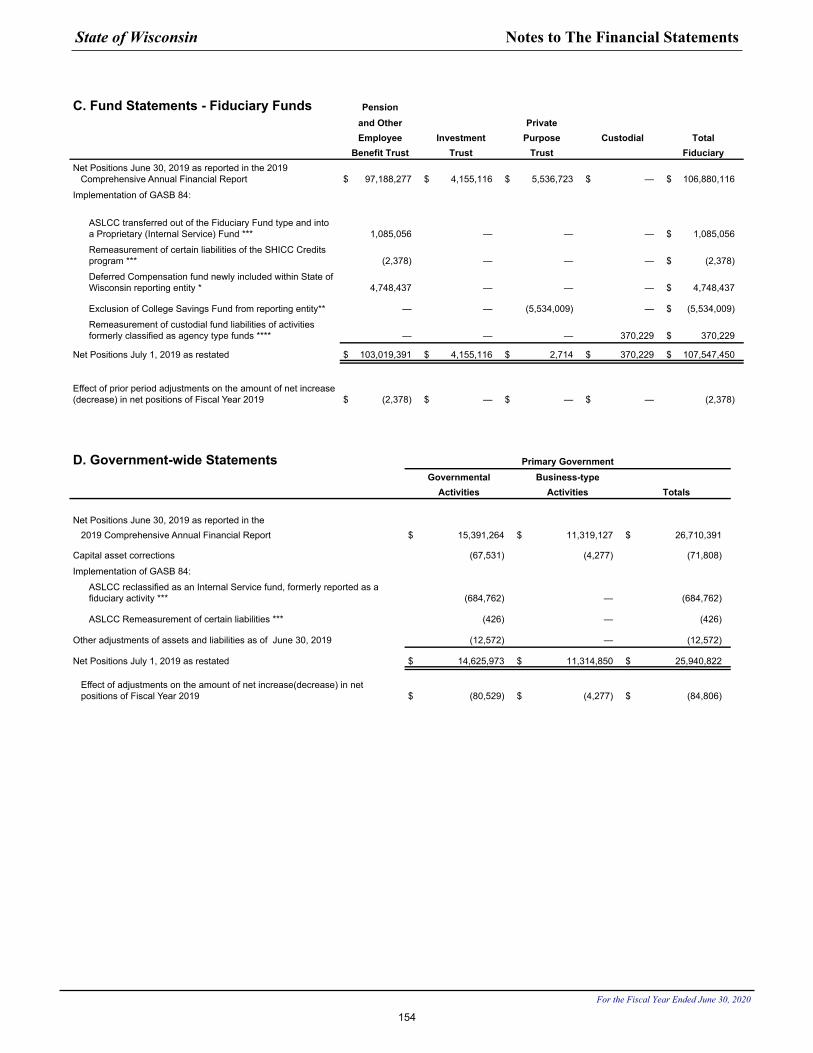
C. Fund Statements - Fiduciary Funds Pensionand Other PrivateEmployee Investment Purpose Custodial Total
Benefit Trust Trust Trust FiduciaryNet Positions June 30, 2019 as reported in the 2019 Comprehensive Annual Financial Report $ 97,188,277 $ 4,155,116 $ 5,536,723 $ — $ 106,880,116
Implementation of GASB 84:
ASLCC transferred out of the Fiduciary Fund type and into a Proprietary (Internal Service) Fund *** 1,085,056 — — — $ 1,085,056
Remeasurement of certain liabilities of the SHICC Credits program *** (2,378) — — — $ (2,378)
Deferred Compensation fund newly included within State of Wisconsin reporting entity * 4,748,437 — — — $ 4,748,437
Exclusion of College Savings Fund from reporting entity** — — (5,534,009) — $ (5,534,009)
Remeasurement of custodial fund liabilities of activities formerly classified as agency type funds **** — — — 370,229 $ 370,229
Net Positions July 1, 2019 as restated $ 103,019,391 $ 4,155,116 $ 2,714 $ 370,229 $ 107,547,450
Effect of prior period adjustments on the amount of net increase (decrease) in net positions of Fiscal Year 2019 $ (2,378) $ — $ — $ — (2,378)
D. Government-wide Statements Primary GovernmentGovernmental Business-type
Activities Activities Totals
Net Positions June 30, 2019 as reported in the2019 Comprehensive Annual Financial Report $ 15,391,264 $ 11,319,127 $ 26,710,391
Capital asset corrections (67,531) (4,277) (71,808)
Implementation of GASB 84:
ASLCC reclassified as an Internal Service fund, formerly reported as a fiduciary activity *** (684,762) — (684,762)
ASLCC Remeasurement of certain liabilities *** (426) — (426)
Other adjustments of assets and liabilities as of June 30, 2019 (12,572) — (12,572)
Net Positions July 1, 2019 as restated $ 14,625,973 $ 11,314,850 $ 25,940,822
Effect of adjustments on the amount of net increase(decrease) in net positions of Fiscal Year 2019 $ (80,529) $ (4,277) $ (84,806)
State of Wisconsin Notes to The Financial Statements
For the Fiscal Year Ended June 30, 2020
154
Accounting Changes - GASB Statement No. 84
Governmental Accounting Standards Board Statement No. 84 establishes criteria for identifying and classifying fiduciary activities of state and local governments. It describes four fiduciary funds that should be reported, if applicable: 1) pension (and other employee benefit) trust funds, 2) investment trust funds, 3) private-purpose trust funds, and 4) custodial funds, which generally should report fiduciary activities that are not required to be reported in pension trust funds, investment trust funds, or private-purpose trust funds. Several fund and program classification changes reflected above were necessary to present the funds within the state’s reporting entity according to the requirements of GASB 84.
Deferred Compensation *
The Deferred Compensation Fund was previously not included with the state of Wisconsin reporting entity. Implementation of GASB 84 requires Deferred Compensation to be reported as a fund within the category “Pension and Other Employee Benefit Trust”.
The restated beginning net position for Pension and Other Employee Benefit Trusts increased by $4.7 billion as a result of the addition of Deferred Compensation into the reporting entity.
Implementation of GASB 84 also required Deferred Compensation to separately identify investment expenses in the Statements of Changes in Fiduciary Net Position. The changes to reporting of investment expenses had no impact to net position.
College Savings Program Trust **
The College Savings Program Trust previously was included with the State of Wisconsin reporting entity as a Private-Purpose Trust. GASB 84 clarified that this program does not meet the requirements to include within the State of Wisconsin reporting entity and so it is henceforth excluded from presentation as a fund in the CAFR. The College Savings Program Board continues to carry on the college savings program. Financial reports for the College Savings program can be obtained by contacting the State of Wisconsin Department of Financial Institutions or via http://529.wi.gov.
The restated beginning net position for Private Purpose type funds decreased by $5.5 billion as a result of the exclusion of the College Savings Program Trust from the reporting entity.
Accumulated Sick Leave ***
The entirety of the Accumulated Sick Leave program (ASL) was previously included within the State of Wisconsin reporting entity as a single fund within ‘Pension and Other Employee Benefit Trust Funds’. Implementation of GASB 84 clarified that components within the ASL program should be divided into two separate funds. An internal service fund, Accumulated Sick Leave Conversion Credit (ASLCC) is used to account for the base portion of the credits; An employee benefit trust fund is used to account for the Supplemental Health Insurance Conversion Credit (SHICC) portion of the program.
In total, the ASL program reported a deficit net position of $139.6 million in the 2019 State of Wisconsin CAFR. The combined, restated net position (deficit) of $257.9 million is
composed of a positive net position in the amount of $943.1 million for the SHICC fund, and a negative (deficit) net position in the amount of ($685.2 million) for the internal service component. The restatements, in effect, transferred a net deficit of ($685.2 million) out of the fiduciary funds and into the internal service type funds (and the governmental component of the government-wide statements).
State Retiree Health Fund
The State Retiree Health Fund was previously presented as an agency (fiduciary) fund but is now accounted for as a proprietary fund. The fund’s beginning net position (zero) did not change and so the change in reporting did not impact the beginning net position of either fund type category.
Custodial Funds (various) ****
In general, most funds formerly classified as agency type funds are now reported under the new custodial fund classification. As agency type funds, amounts now classified as ‘Net Position Held in Custody” had been reported as payables, deposits, or other liabilities. To implement GASB 84, $370 million in liabilities were reclassified, increasing net position by the same amount. The majority of the increase ($343 million) is attributable to the Bank and Insurance Company Deposits fund. For this fund, amounts previously reported as “Deposits” (a liability) are now reported as “Net Position Held in Custody.”
The remaining restated custodial fund beginning Net Position balance in the amount of $27 million is attributable to the Inmate & Resident fund ($25 million) and the Insurance Company Liquidation Account ($2 million).
Implementation of GASB 84 also necessitated the presentation of Local Government Tax Collections under the custodial classification. This fund is used to present collections of certain taxes made by the state on behalf of other governmental units, and the subsequent remittance of those amounts to the taxing authorities. Activities reported under this fund had previously been reported under the General Fund.
Because amounts collected by the Local Government Tax Collections fund are immediately payable to the taxing authorities, this fund would not be expected to ordinarily report a net position held in custody. Therefore, incorporating this fund along with the custodial funds had no impact on their beginning net position.
State of Wisconsin Notes to The Financial Statements
For the Fiscal Year Ended June 30, 2020
155
NOTE 24. LITIGATION, CONTINGENCIES AND COMMITMENTS
A. Litigation and Contingencies
The State is a participant in various legal proceedings pertaining to matters incidental to the performance of routine governmental operations.
The State accrues liabilities related to legal proceedings, if a loss is probable and reasonably estimable. Such losses, totaling $30.7 million on June 30, 2020 reported in the governmental activities, are discussed below:
The Work Injury Supplemental Benefit Fund, administered by the Department of Workforce Development, provides compensatory payments to survivors of fatally injured employees or disabled employees with work-related injuries. The liability for annuities to be paid totaled $0.7 million at June 30, 2020.
In September 2008, the Internal Revenue Service (IRS) provided the State of Wisconsin Investment Board (SWIB) a Notice of Transferee Liability. This claim seeks taxes, penalties and interest relating to the sale of Shockley Communications Corporation (SCC) stock in 2001.
The IRS asserts that the shareholders’ sale of SCC stock in 2001 should have been characterized as a sale of assets by SCC, on which SCC should have paid income taxes. SWIB filed a petition in the United States Tax Court contesting the proposed IRS assessment for the taxes, plus penalties and interest. In 2015, the Tax Court found that the principal shareholders of SCC were liable as putative transferees for the tax, penalties and interest owed by SCC related to its sale. In October 2017 the 11th Circuit Court of Appeals upheld the 2015 opinion with respect to the principal shareholders of SCC; concluding its litigation. Because SWIB has separate and distinct arguments from the principal shareholders of SCC, the Tax Court granted SWIB the opportunity to pursue its case with the Court. In 2018, SWIB’s tax counsel and the IRS filed briefs with the Tax Court. In January 2020, SWIB was informed that the Tax Court had ruled in favor of the IRS. While SWIB has the option to appeal, as well as the ability to negotiate the final payment with the IRS, the adverse ruling from the Tax Court makes it more likely that SWIB’s liability exposure will be higher than previously estimated.
Although SWIB’s case is still ongoing, SWIB determined it was prudent to accrue a potential loss from the SCC transaction based on the Tax Court’s adverse opinions against the principal shareholders and SWIB. SWIB’s potential liability, as a putative transferee of SCC assets, is reasonably estimated to be between $30.0 million and $59.6 million as of December 31, 2019. Although results may differ, this estimated range of loss is based on a possible settlement strategy with the IRS and the maximum potential to the IRS for the taxes, interest and potential penalties of SCC based on the Tax Court’s decision against the principal shareholders and SWIB. Accordingly, since calendar year 2015, SWIB has accrued a loss of $30.0 million, of which $10.0 million was accrued in calendar year 2019 to account for the Tax Court’s most recent adverse ruling. The total $30.0 million accrued loss represents the estimated minimum amount of possible loss to which SWIB believes it may be exposed.
Other Claims, Judgments, and Contingencies
The State is also named as a party in other legal proceedings where the ultimate disposition and consequence are not presently determinable. The potential loss amount relating to an unfavorable outcome for certain of these proceedings could not be reasonably determined at this time. However, the ultimate dispositions and consequences of any single legal proceeding or all legal proceedings collectively should not have a material adverse effect on the State's financial position.
In August 2018, the Department of Health Services (DHS) received notification from the U.S. Department of Health and Human Services (DHHS) recommending a $27.6 million disallowance related to the Medicaid program. DHHS concluded DHS did not refund the full federal share of Medicaid-related settlements and judgements from October 2008 through September 2016. DHS partially disagreed with the report. The Centers for Medicare and Medicaid Services (CMS) reviewed the report and determined that DHHS underreported the settlement and requested that DHS refund $31.0 million to the federal government. In November 2020, DHS communicated its disagreement to CMS and DHS will provide a formal objection letter to CMS in January 2021.
Mercy Health Systems filed a just compensation appeal against the Department of Transportation under Wis. Stat. section 32.05(11). The issue is the amount of compensation to Mercy Health Systems for DOT’s partial acquisition of Mercy’s property in Janesville. Depending upon the verdict, DOT may be liable statutorily for the payment of Mercy’s attorney’s fees and other litigation costs. It is believed that the maximum total liability would not exceed $10.0 million. It is DOT’s position that it is not liable for the payment of any new compensation or fees and costs of Mercy. The State is vigorously defending this case, with adjourned trial set for April 2021.
In April 2020, the State requested assistance from the Federal Emergency Management Agency (FEMA) to design/build/upgrade Pandemic Response and Recovery Critical Public Facilities Disaster Alternative Care Facility (ACF) for acute patience care. As directed by the State and FEMA and in coordination with DHHS, the US Army Corp of Engineers provided facility assessments, planning, engineering, design, contracting, and construction support to address medical facility shortages arising for the COVID-19 situation in Wisconsin.
FEMA originally estimated the cost to complete the ACF at $25 million, with the State being responsible for 25% of the costs. Although this work was completed in FY 2020, FEMA has not provided the State with a detailed listing of the overall costs and has not billed the State for our portion of the costs. Therefore, the State is unable to determine a liability related to these costs at this time but does not believe the amount would have a material effect on the statements.
At the end of FY 2020, the Unemployment Reserve Fund, administered by the Department of Workforce Development (DWD), had a backlog related to weekly claims filed. DWD accrued a liability in the Unemployment Reserve Fund for benefits paid through November 30, 2020 that were related to weeks prior to June 30, 2020. However, an estimate of payments related to the remaining backlog, totaling 52,694 weekly claims as of December 7, 2020, cannot be estimated and therefore a liability for these claims has not been reported.
State of Wisconsin Notes to The Financial Statements
For the Fiscal Year Ended June 30, 2020
156
During FY 2020, Intersystems Corporation filed a claim against the Department of Revenue (DOR) asserting that DOR owed Intersystems Corporation a refund of $73.9 million plus interest for 2010-2017. The issue is whether or not fees from sublicensing software sold to Epic, who is domiciled in Wisconsin, may be treated as Wisconsin sales in the sales factor. The case is currently being appealed to the Wisconsin Tax Appeals Commission, but DOR believes that its position is meritorious and will defend the matter vigorously.
B. Commitments
Primary Government
As of June 30, 2020, encumbrances of the General Fund totaled $513.6 million, encumbrances of the Transportation Fund totaled $1.6 billion, and encumbrances of other non-major governmental funds totaled $225.1 million. Obligations at June 30, 2020 representing multi-year, long-term commitments included (in thousands):
Transportation Fund $ 355,503
Capital Improvement Fund – WisDOT Harbors, Rails and Highway Programs
27,855
Transportation Revenue Bonds Capital Projects Fund
23,453
General Fund – Housing Programs 32,391
The Environmental Improvement Fund (the Fund) was established to administer the Clean Water Fund Loan Program. Loans and grants are made to local units of government for wastewater treatment projects for terms of up to 20 years. Loans are made at a number of prescribed interest rates based on environmental priority. The loans contractually are revenue obligations or general obligations of the local governmental units. Additionally, various statutory provisions exist which provide further security for payment. The Fund has made financial assistance commitments of $299.9 million as of June 30, 2020. These loan and grant commitments are expected to be met through proceeds from issuance of revenue obligations and additional federal grants.
The Injured Patients and Families Compensation Fund may be required to purchase an annuity as a result of a claim settlement. Under specific annuity arrangements, the Fund may have ultimate responsibility for annuity payments if the annuity company defaults on annuity payments. The total estimated replacement value of the Fund’s annuities as of June 30, 2020 was $32.8 million. The replacement value calculation includes only annuities where the Fund remains the owner. Annuities with qualified assignments are no longer included. The Fund reserves the right to pursue collection from State guarantee funds.
State Public Deposit Guarantee - As required by Wis. Stat. Sec. 34.08, the State is to make payments to public depositors for proofs of loss (e.g., loss resulting from a bank failure) up to $400 thousand per depositor above the amount of federal insurance. This statutory requirement guarantees that the State will make payments in favor of the public depositor that has submitted a proof of loss. Payments would be made in the order in which satisfactory proofs of loss are received by the State's Department of Financial Institutions, until the designated appropriation is exhausted. At June 30, 2020, the appropriation available totaled $68.4 million. Losses become fixed as of the date
of the loss. A public depositor experiencing a loss must assign its interest in the deposit, to the extent of the amount paid, to the Department of Financial Institutions. Any recovery made by the Department of Financial Institutions under the assignment is to be repaid to the appropriation. The possibility of a material loss resulting from payments to and recovery from public depositors is remote.
State of Wisconsin Notes to The Financial Statements
For the Fiscal Year Ended June 30, 2020
157
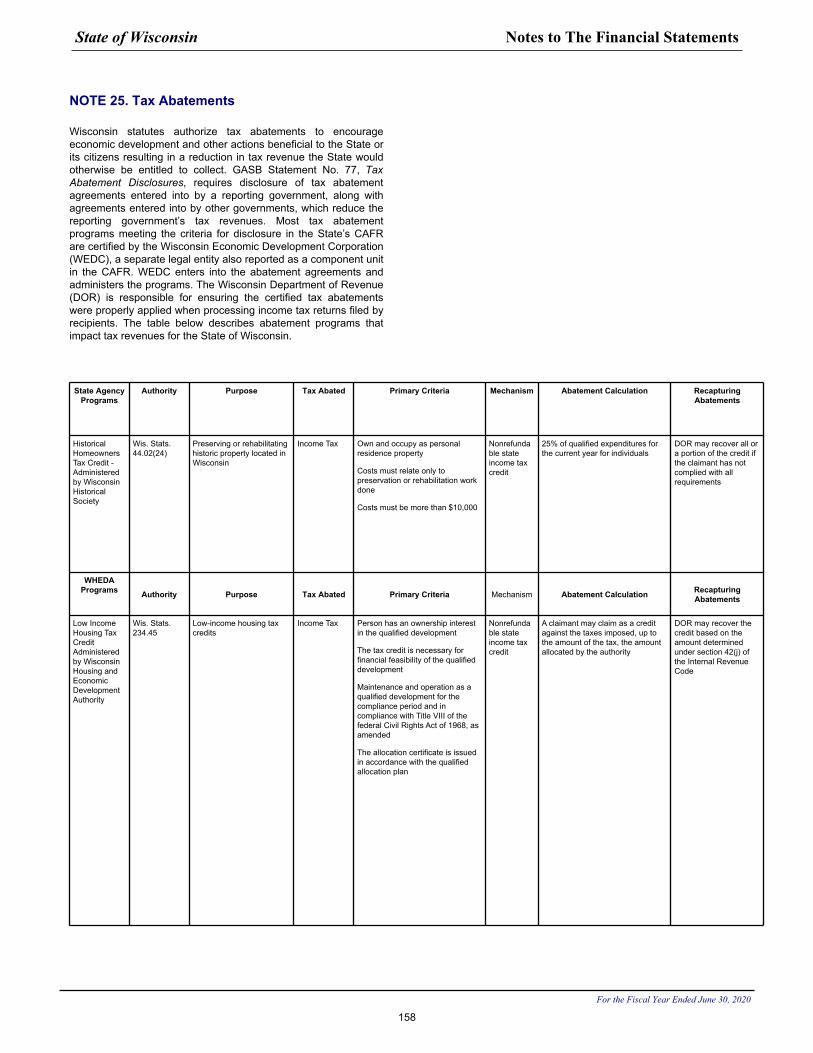
NOTE 25. Tax Abatements
Wisconsin statutes authorize tax abatements to encourage economic development and other actions beneficial to the State or its citizens resulting in a reduction in tax revenue the State would otherwise be entitled to collect. GASB Statement No. 77, Tax Abatement Disclosures, requires disclosure of tax abatement agreements entered into by a reporting government, along with agreements entered into by other governments, which reduce the reporting government’s tax revenues. Most tax abatement programs meeting the criteria for disclosure in the State’s CAFR are certified by the Wisconsin Economic Development Corporation (WEDC), a separate legal entity also reported as a component unit in the CAFR. WEDC enters into the abatement agreements and administers the programs. The Wisconsin Department of Revenue (DOR) is responsible for ensuring the certified tax abatements were properly applied when processing income tax returns filed by recipients. The table below describes abatement programs that impact tax revenues for the State of Wisconsin.
State Agency Programs
Authority Purpose Tax Abated Primary Criteria Mechanism Abatement Calculation Recapturing Abatements
Historical Homeowners Tax Credit - Administered by Wisconsin Historical Society
Wis. Stats. 44.02(24)
Preserving or rehabilitating historic property located in Wisconsin
Income Tax Own and occupy as personal residence property
Costs must relate only to preservation or rehabilitation work done
Costs must be more than $10,000
Nonrefundable state income tax credit
25% of qualified expenditures for the current year for individuals
DOR may recover all or a portion of the credit if the claimant has not complied with all requirements
WHEDA Programs Authority Purpose Tax Abated Primary Criteria Mechanism Abatement Calculation Recapturing
Abatements
Low Income Housing Tax Credit Administered by Wisconsin Housing and Economic Development Authority
Wis. Stats. 234.45
Low-income housing tax credits
Income Tax Person has an ownership interest in the qualified development
The tax credit is necessary for financial feasibility of the qualified development
Maintenance and operation as a qualified development for the compliance period and in compliance with Title VIII of the federal Civil Rights Act of 1968, as amended
The allocation certificate is issued in accordance with the qualified allocation plan
Nonrefundable state income tax credit
A claimant may claim as a credit against the taxes imposed, up to the amount of the tax, the amount allocated by the authority
DOR may recover the credit based on the amount determined under section 42(j) of the Internal Revenue Code
State of Wisconsin Notes to The Financial Statements
For the Fiscal Year Ended June 30, 2020
158
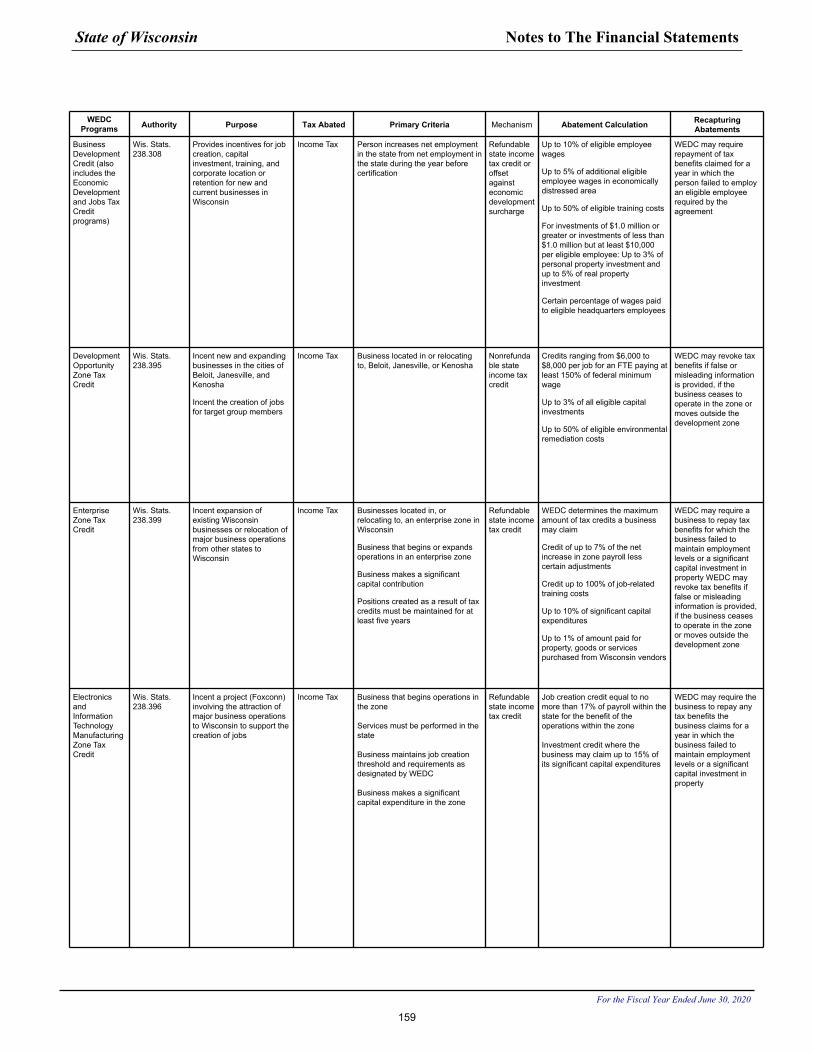
WEDC Programs Authority Purpose Tax Abated Primary Criteria Mechanism Abatement Calculation Recapturing
Abatements
Business Development Credit (also includes the Economic Development and Jobs Tax Credit programs)
Wis. Stats. 238.308
Provides incentives for job creation, capital investment, training, and corporate location or retention for new and current businesses in Wisconsin
Income Tax Person increases net employment in the state from net employment in the state during the year before certification
Refundable state income tax credit or offset against economic development surcharge
Up to 10% of eligible employee wages
Up to 5% of additional eligible employee wages in economically distressed area
Up to 50% of eligible training costs
For investments of $1.0 million or greater or investments of less than $1.0 million but at least $10,000 per eligible employee: Up to 3% of personal property investment and up to 5% of real property investment
Certain percentage of wages paid to eligible headquarters employees
WEDC may require repayment of tax benefits claimed for a year in which the person failed to employ an eligible employee required by the agreement
Development Opportunity Zone Tax Credit
Wis. Stats. 238.395
Incent new and expanding businesses in the cities of Beloit, Janesville, and Kenosha
Incent the creation of jobs for target group members
Income Tax Business located in or relocating to, Beloit, Janesville, or Kenosha
Nonrefundable state income tax credit
Credits ranging from $6,000 to $8,000 per job for an FTE paying at least 150% of federal minimum wage
Up to 3% of all eligible capital investments
Up to 50% of eligible environmental remediation costs
WEDC may revoke tax benefits if false or misleading information is provided, if the business ceases to operate in the zone or moves outside the development zone
Enterprise Zone Tax Credit
Wis. Stats. 238.399
Incent expansion of existing Wisconsin businesses or relocation of major business operations from other states to Wisconsin
Income Tax Businesses located in, or relocating to, an enterprise zone in Wisconsin
Business that begins or expands operations in an enterprise zone
Business makes a significant capital contribution
Positions created as a result of tax credits must be maintained for at least five years
Refundable state income tax credit
WEDC determines the maximum amount of tax credits a business may claim
Credit of up to 7% of the net increase in zone payroll less certain adjustments
Credit up to 100% of job-related training costs
Up to 10% of significant capital expenditures
Up to 1% of amount paid for property, goods or services purchased from Wisconsin vendors
WEDC may require a business to repay tax benefits for which the business failed to maintain employment levels or a significant capital investment in property WEDC may revoke tax benefits if false or misleading information is provided, if the business ceases to operate in the zone or moves outside the development zone
Electronics and Information Technology Manufacturing Zone Tax Credit
Wis. Stats. 238.396
Incent a project (Foxconn) involving the attraction of major business operations to Wisconsin to support the creation of jobs
Income Tax Business that begins operations in the zone
Services must be performed in the state
Business maintains job creation threshold and requirements as designated by WEDC
Business makes a significant capital expenditure in the zone
Refundable state income tax credit
Job creation credit equal to no more than 17% of payroll within the state for the benefit of the operations within the zone
Investment credit where the business may claim up to 15% of its significant capital expenditures
WEDC may require the business to repay any tax benefits the business claims for a year in which the business failed to maintain employment levels or a significant capital investment in property
State of Wisconsin Notes to The Financial Statements
For the Fiscal Year Ended June 30, 2020
159
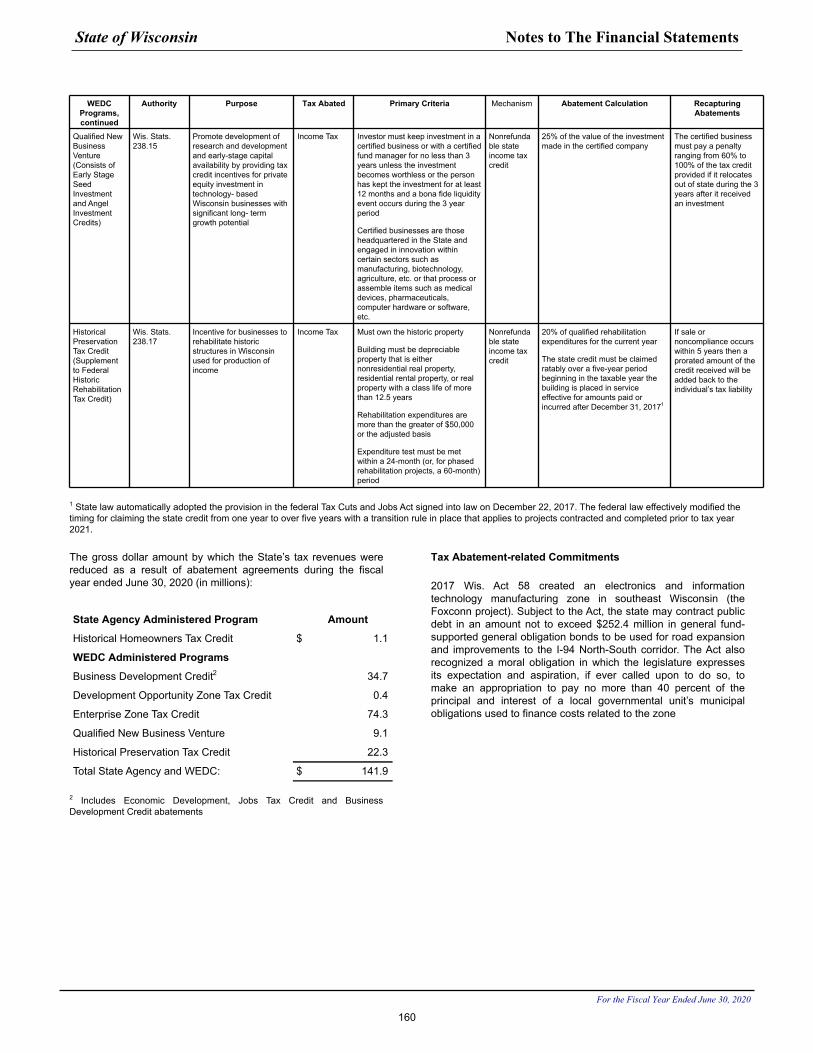
WEDC Programs,continued
Authority Purpose Tax Abated Primary Criteria Mechanism Abatement Calculation Recapturing Abatements
Qualified New Business Venture (Consists of Early Stage Seed Investment and Angel Investment Credits)
Wis. Stats. 238.15
Promote development of research and development and early-stage capital availability by providing tax credit incentives for private equity investment in technology- based Wisconsin businesses with significant long- term growth potential
Income Tax Investor must keep investment in a certified business or with a certified fund manager for no less than 3 years unless the investment becomes worthless or the person has kept the investment for at least 12 months and a bona fide liquidity event occurs during the 3 year period
Certified businesses are those headquartered in the State and engaged in innovation within certain sectors such as manufacturing, biotechnology, agriculture, etc. or that process or assemble items such as medical devices, pharmaceuticals, computer hardware or software, etc.
Nonrefundable state income tax credit
25% of the value of the investment made in the certified company
The certified business must pay a penalty ranging from 60% to 100% of the tax credit provided if it relocates out of state during the 3 years after it received an investment
Historical Preservation Tax Credit (Supplement to Federal Historic Rehabilitation Tax Credit)
Wis. Stats. 238.17
Incentive for businesses to rehabilitate historic structures in Wisconsin used for production of income
Income Tax Must own the historic property
Building must be depreciable property that is either nonresidential real property, residential rental property, or real property with a class life of more than 12.5 years
Rehabilitation expenditures are more than the greater of $50,000 or the adjusted basis
Expenditure test must be met within a 24-month (or, for phased rehabilitation projects, a 60-month) period
Nonrefundable state income tax credit
20% of qualified rehabilitation expenditures for the current year
The state credit must be claimed ratably over a five-year period beginning in the taxable year the building is placed in service effective for amounts paid or incurred after December 31, 20171
If sale or noncompliance occurs within 5 years then a prorated amount of the credit received will be added back to the individual’s tax liability
1 State law automatically adopted the provision in the federal Tax Cuts and Jobs Act signed into law on December 22, 2017. The federal law effectively modified the timing for claiming the state credit from one year to over five years with a transition rule in place that applies to projects contracted and completed prior to tax year 2021.
The gross dollar amount by which the State’s tax revenues were reduced as a result of abatement agreements during the fiscal year ended June 30, 2020 (in millions):
State Agency Administered Program Amount
Historical Homeowners Tax Credit $ 1.1
WEDC Administered Programs
Business Development Credit2 34.7
Development Opportunity Zone Tax Credit 0.4
Enterprise Zone Tax Credit 74.3
Qualified New Business Venture 9.1
Historical Preservation Tax Credit 22.3
Total State Agency and WEDC: $ 141.9
2 Includes Economic Development, Jobs Tax Credit and Business Development Credit abatements
Tax Abatement-related Commitments
2017 Wis. Act 58 created an electronics and information technology manufacturing zone in southeast Wisconsin (the Foxconn project). Subject to the Act, the state may contract public debt in an amount not to exceed $252.4 million in general fund- supported general obligation bonds to be used for road expansion and improvements to the I-94 North-South corridor. The Act also recognized a moral obligation in which the legislature expresses its expectation and aspiration, if ever called upon to do so, to make an appropriation to pay no more than 40 percent of the principal and interest of a local governmental unit’s municipal obligations used to finance costs related to the zone
State of Wisconsin Notes to The Financial Statements
For the Fiscal Year Ended June 30, 2020
160
NOTE 26. SUBSEQUENT EVENTS
Primary Government
Long-term Debt
General Obligation Bonds – In July 2020, the State issued $164.0 million of 2020 Series 3 general obligation refunding bonds (taxable) to be used for the advanced refunding of certain principal of previously issued general obligation bonds. The interest rates associated with these bonds were set at 0.2 percent to 2.3 percent payable semiannually beginning November 1, 2020. The bonds mature annually beginning May 1, 2022 through May 1, 2035 along with term bonds maturing May 1, 2038 and May 1, 2042.
In June 2020, the State entered into a forward delivery bond purchase agreement for the issuance of general obligation refunding bonds and a preliminary closing for those bonds occurred in July 2020. Subject to the forward delivery agreement, the State expects to issue $133.8 million of 2021 Series 1 general obligation refunding bonds in February 2021 to be used for the current refunding of certain principal of previously issued general obligation bonds. When issued, the interest rates are expected to be 5.0 percent payable semiannually beginning November 1, 2021. The bonds mature annually beginning May 1, 2026 through May 1, 2031.
In October 2020, the State entered into a forward delivery bond purchase agreement for the issuance of general obligation refunding bonds and a preliminary closing for those bonds occurred in November 2020. Subject to the forward delivery agreement, the State expects to issue $236.6 million of 2021 Series 2 general obligation refunding bonds in February 2021 to be used for the current refunding of certain principal of previously issued general obligation bonds. When issued, the interest rates are expected to be 5.0 percent payable semiannually beginning November 1, 2021. The bonds mature annually beginning May 1, 2022 through May 1, 2041.
In November 2020, the State issued $224.5 million of 2020 Series B general obligation bonds to be used for the acquisition, construction, development, extension, enlargement or improvement of land, water, property, highways, buildings, equipment or facilities for public purposes. The interest rates associated with these bonds were set at 4.0 to 5.0 percent payable semiannually beginning May 1, 2021. The bonds mature annually beginning May 1, 2022 through May 1, 2041.
Transportation Revenue Bonds – In July 2020, the State issued $315.8 million of 2020 Series 1 transportation revenue refunding bonds (taxable) to be used for the to be used for advance refunding of certain principal of previously issued transportation revenue bonds. The interest rates associated with these bonds were set at 0.3 percent to 1.9 percent payable semiannually beginning January 1, 2021. The bonds mature annually beginning July 1, 2022 through July 1, 2034.
State of Wisconsin Notes to The Financial Statements
For the Fiscal Year Ended June 30, 2020
161
This page left intentionally blank.
State of Wisconsin Notes to The Financial Statements
For the Fiscal Year Ended June 30, 2020
162
Required Supplementary Information
163
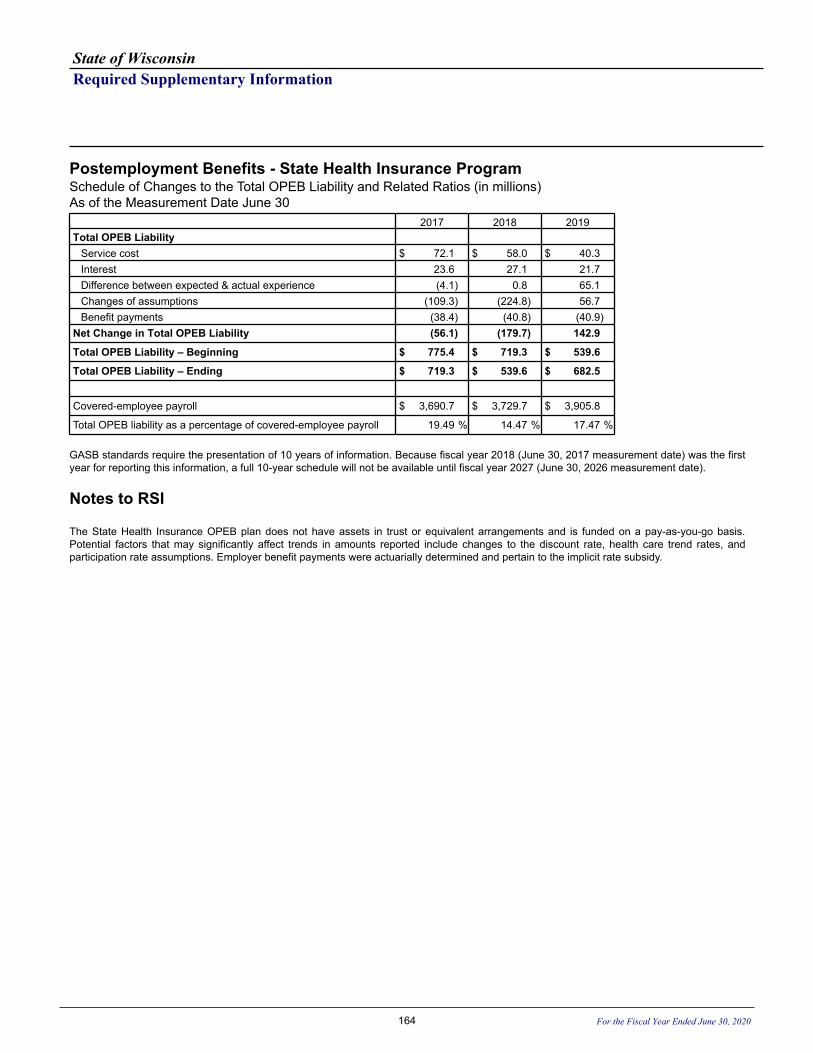
State of WisconsinRequired Supplementary Information
Postemployment Benefits - State Health Insurance ProgramSchedule of Changes to the Total OPEB Liability and Related Ratios (in millions)As of the Measurement Date June 30
2017 2018 2019Total OPEB Liability
Service cost $ 72.1 $ 58.0 $ 40.3 Interest 23.6 27.1 21.7 Difference between expected & actual experience (4.1) 0.8 65.1 Changes of assumptions (109.3) (224.8) 56.7 Benefit payments (38.4) (40.8) (40.9)
Net Change in Total OPEB Liability (56.1) (179.7) 142.9
Total OPEB Liability – Beginning $ 775.4 $ 719.3 $ 539.6
Total OPEB Liability – Ending $ 719.3 $ 539.6 $ 682.5
Covered-employee payroll $ 3,690.7 $ 3,729.7 $ 3,905.8
Total OPEB liability as a percentage of covered-employee payroll 19.49 % 14.47 % 17.47 %
GASB standards require the presentation of 10 years of information. Because fiscal year 2018 (June 30, 2017 measurement date) was the first year for reporting this information, a full 10-year schedule will not be available until fiscal year 2027 (June 30, 2026 measurement date).
Notes to RSI
The State Health Insurance OPEB plan does not have assets in trust or equivalent arrangements and is funded on a pay-as-you-go basis. Potential factors that may significantly affect trends in amounts reported include changes to the discount rate, health care trend rates, and participation rate assumptions. Employer benefit payments were actuarially determined and pertain to the implicit rate subsidy.
164 For the Fiscal Year Ended June 30, 2020
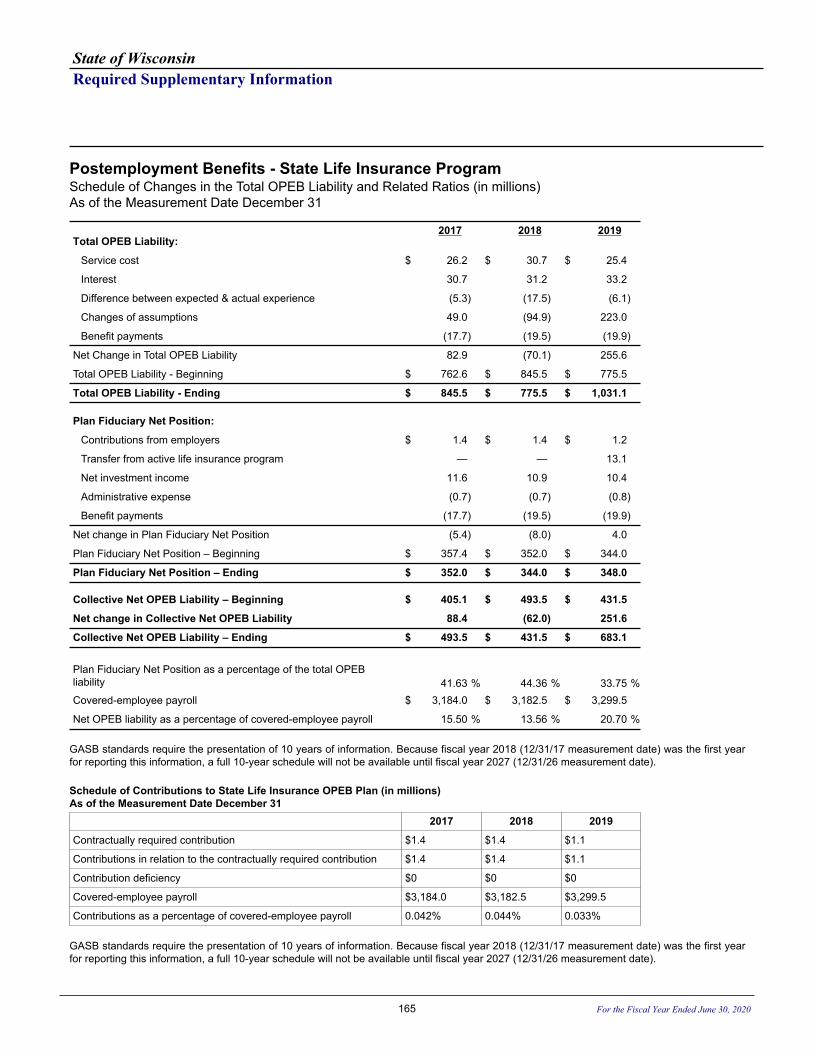
State of WisconsinRequired Supplementary Information
Postemployment Benefits - State Life Insurance ProgramSchedule of Changes in the Total OPEB Liability and Related Ratios (in millions)As of the Measurement Date December 31
2017 2018 2019Total OPEB Liability:
Service cost $ 26.2 $ 30.7 $ 25.4
Interest 30.7 31.2 33.2
Difference between expected & actual experience (5.3) (17.5) (6.1)
Changes of assumptions 49.0 (94.9) 223.0
Benefit payments (17.7) (19.5) (19.9)
Net Change in Total OPEB Liability 82.9 (70.1) 255.6
Total OPEB Liability - Beginning $ 762.6 $ 845.5 $ 775.5
Total OPEB Liability - Ending $ 845.5 $ 775.5 $ 1,031.1
Plan Fiduciary Net Position:
Contributions from employers $ 1.4 $ 1.4 $ 1.2
Transfer from active life insurance program — — 13.1
Net investment income 11.6 10.9 10.4
Administrative expense (0.7) (0.7) (0.8)
Benefit payments (17.7) (19.5) (19.9)
Net change in Plan Fiduciary Net Position (5.4) (8.0) 4.0
Plan Fiduciary Net Position – Beginning $ 357.4 $ 352.0 $ 344.0
Plan Fiduciary Net Position – Ending $ 352.0 $ 344.0 $ 348.0
Collective Net OPEB Liability – Beginning $ 405.1 $ 493.5 $ 431.5
Net change in Collective Net OPEB Liability 88.4 (62.0) 251.6
Collective Net OPEB Liability – Ending $ 493.5 $ 431.5 $ 683.1
Plan Fiduciary Net Position as a percentage of the total OPEB liability 41.63 % 44.36 % 33.75 %Covered-employee payroll $ 3,184.0 $ 3,182.5 $ 3,299.5
Net OPEB liability as a percentage of covered-employee payroll 15.50 % 13.56 % 20.70 %
GASB standards require the presentation of 10 years of information. Because fiscal year 2018 (12/31/17 measurement date) was the first year for reporting this information, a full 10-year schedule will not be available until fiscal year 2027 (12/31/26 measurement date).
Schedule of Contributions to State Life Insurance OPEB Plan (in millions) As of the Measurement Date December 31
2017 2018 2019
Contractually required contribution $1.4 $1.4 $1.1
Contributions in relation to the contractually required contribution $1.4 $1.4 $1.1
Contribution deficiency $0 $0 $0
Covered-employee payroll $3,184.0 $3,182.5 $3,299.5
Contributions as a percentage of covered-employee payroll 0.042% 0.044% 0.033%
GASB standards require the presentation of 10 years of information. Because fiscal year 2018 (12/31/17 measurement date) was the first year for reporting this information, a full 10-year schedule will not be available until fiscal year 2027 (12/31/26 measurement date).
165 For the Fiscal Year Ended June 30, 2020
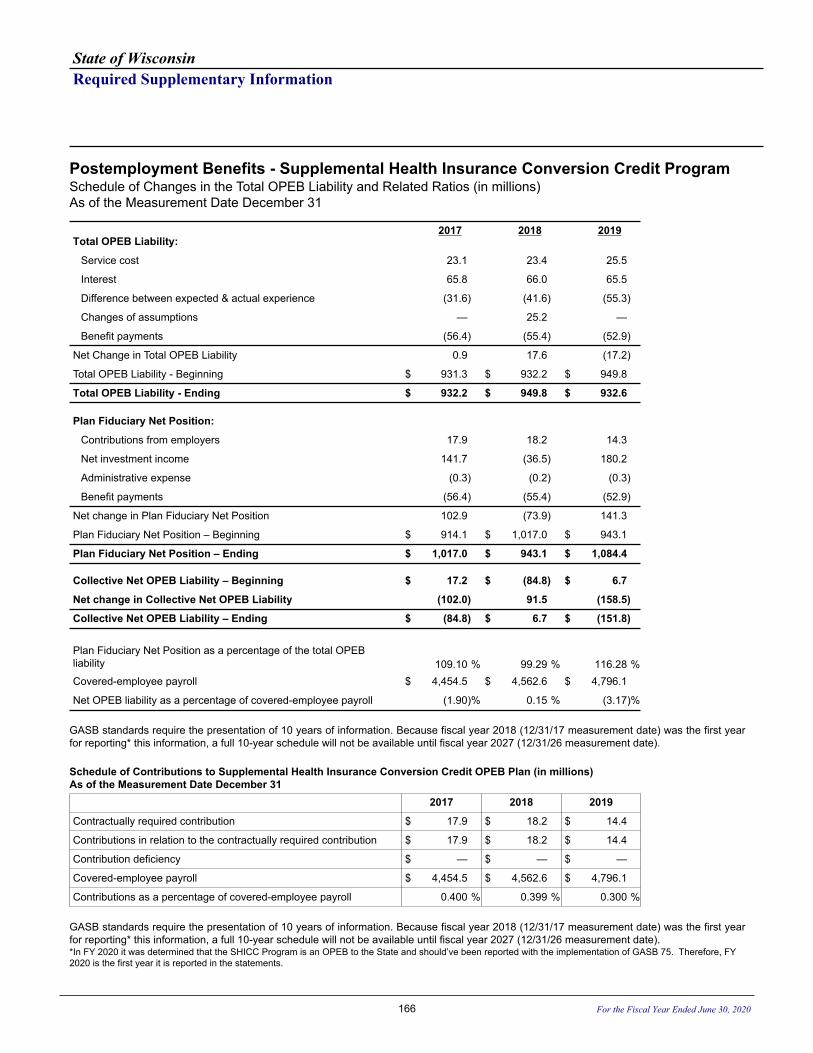
State of WisconsinRequired Supplementary Information
Postemployment Benefits - Supplemental Health Insurance Conversion Credit ProgramSchedule of Changes in the Total OPEB Liability and Related Ratios (in millions)As of the Measurement Date December 31
2017 2018 2019Total OPEB Liability:
Service cost 23.1 23.4 25.5
Interest 65.8 66.0 65.5
Difference between expected & actual experience (31.6) (41.6) (55.3)
Changes of assumptions — 25.2 —
Benefit payments (56.4) (55.4) (52.9)
Net Change in Total OPEB Liability 0.9 17.6 (17.2)
Total OPEB Liability - Beginning $ 931.3 $ 932.2 $ 949.8
Total OPEB Liability - Ending $ 932.2 $ 949.8 $ 932.6
Plan Fiduciary Net Position:
Contributions from employers 17.9 18.2 14.3
Net investment income 141.7 (36.5) 180.2
Administrative expense (0.3) (0.2) (0.3)
Benefit payments (56.4) (55.4) (52.9)
Net change in Plan Fiduciary Net Position 102.9 (73.9) 141.3
Plan Fiduciary Net Position – Beginning $ 914.1 $ 1,017.0 $ 943.1
Plan Fiduciary Net Position – Ending $ 1,017.0 $ 943.1 $ 1,084.4
Collective Net OPEB Liability – Beginning $ 17.2 $ (84.8) $ 6.7
Net change in Collective Net OPEB Liability (102.0) 91.5 (158.5)
Collective Net OPEB Liability – Ending $ (84.8) $ 6.7 $ (151.8)
Plan Fiduciary Net Position as a percentage of the total OPEB liability 109.10 % 99.29 % 116.28 %Covered-employee payroll $ 4,454.5 $ 4,562.6 $ 4,796.1
Net OPEB liability as a percentage of covered-employee payroll (1.90) % 0.15 % (3.17) %
GASB standards require the presentation of 10 years of information. Because fiscal year 2018 (12/31/17 measurement date) was the first year for reporting* this information, a full 10-year schedule will not be available until fiscal year 2027 (12/31/26 measurement date).
Schedule of Contributions to Supplemental Health Insurance Conversion Credit OPEB Plan (in millions) As of the Measurement Date December 31
2017 2018 2019
Contractually required contribution $ 17.9 $ 18.2 $ 14.4
Contributions in relation to the contractually required contribution $ 17.9 $ 18.2 $ 14.4
Contribution deficiency $ — $ — $ —
Covered-employee payroll $ 4,454.5 $ 4,562.6 $ 4,796.1
Contributions as a percentage of covered-employee payroll 0.400 % 0.399 % 0.300 %
GASB standards require the presentation of 10 years of information. Because fiscal year 2018 (12/31/17 measurement date) was the first year for reporting* this information, a full 10-year schedule will not be available until fiscal year 2027 (12/31/26 measurement date).*In FY 2020 it was determined that the SHICC Program is an OPEB to the State and should’ve been reported with the implementation of GASB 75. Therefore, FY 2020 is the first year it is reported in the statements.
166 For the Fiscal Year Ended June 30, 2020
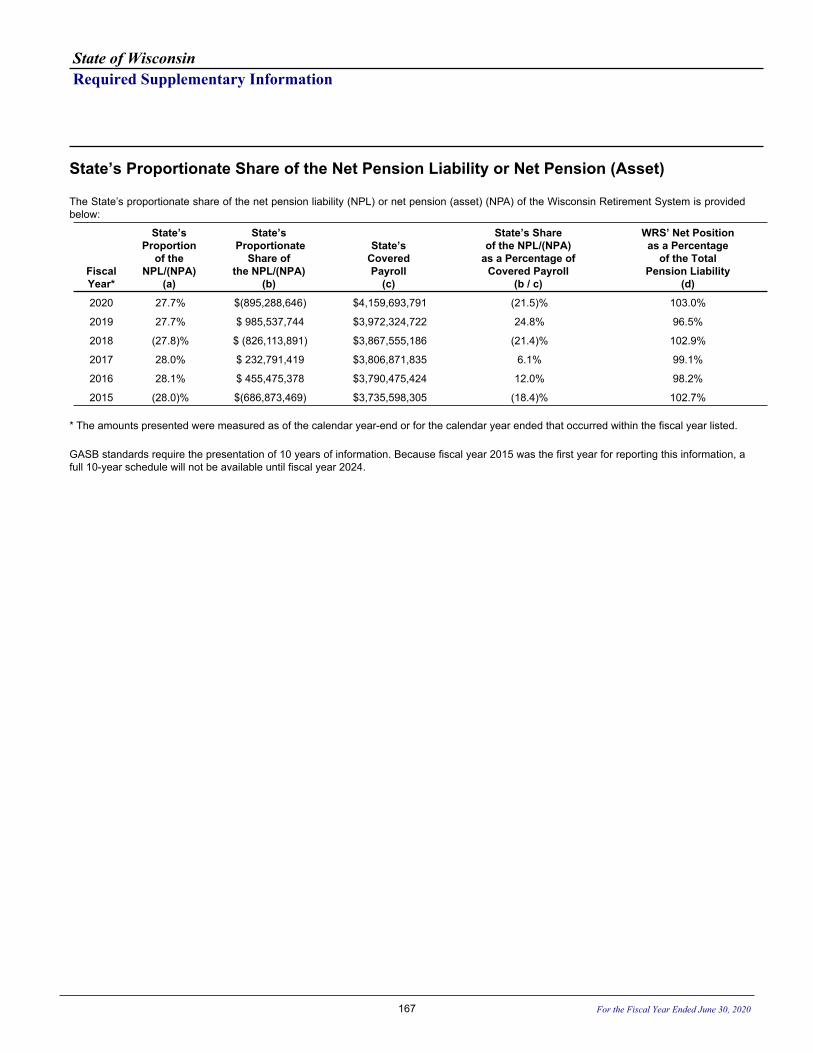
State of WisconsinRequired Supplementary Information
State’s Proportionate Share of the Net Pension Liability or Net Pension (Asset)
The State’s proportionate share of the net pension liability (NPL) or net pension (asset) (NPA) of the Wisconsin Retirement System is provided below:
Fiscal Year*
State’s Proportion
of the NPL/(NPA)
(a)
State’s Proportionate
Share of the NPL/(NPA)
(b)
State’s Covered Payroll
(c)
State’s Share of the NPL/(NPA)
as a Percentage of Covered Payroll
(b / c)
WRS’ Net Position as a Percentage
of the TotalPension Liability
(d)
2020 27.7% $(895,288,646) $4,159,693,791 (21.5)% 103.0%
2019 27.7% $ 985,537,744 $3,972,324,722 24.8% 96.5%
2018 (27.8)% $ (826,113,891) $3,867,555,186 (21.4)% 102.9%
2017 28.0% $ 232,791,419 $3,806,871,835 6.1% 99.1%
2016 28.1% $ 455,475,378 $3,790,475,424 12.0% 98.2%
2015 (28.0)% $(686,873,469) $3,735,598,305 (18.4)% 102.7%
* The amounts presented were measured as of the calendar year-end or for the calendar year ended that occurred within the fiscal year listed.
GASB standards require the presentation of 10 years of information. Because fiscal year 2015 was the first year for reporting this information, a full 10-year schedule will not be available until fiscal year 2024.
167 For the Fiscal Year Ended June 30, 2020
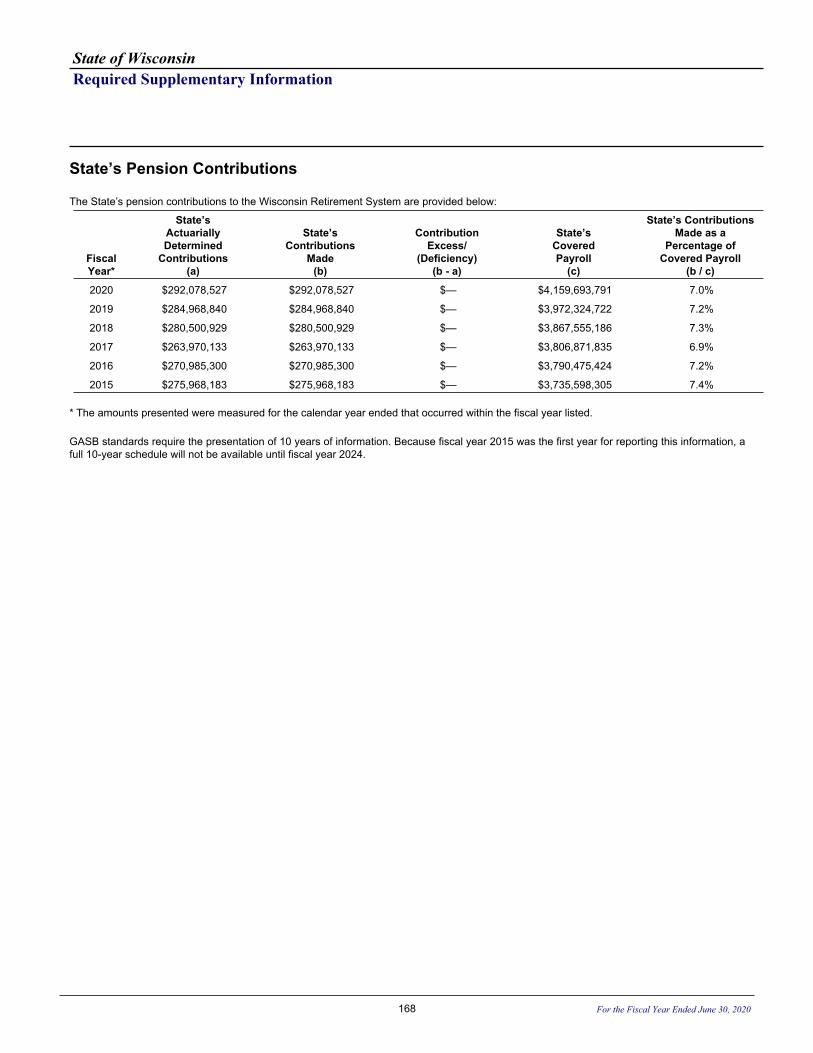
State of WisconsinRequired Supplementary Information
State’s Pension Contributions
The State’s pension contributions to the Wisconsin Retirement System are provided below:
Fiscal Year*
State’s Actuarially Determined
Contributions(a)
State’s Contributions
Made(b)
Contribution Excess/
(Deficiency)(b - a)
State’s Covered Payroll
(c)
State’s ContributionsMade as a
Percentage ofCovered Payroll
(b / c)
2020 $292,078,527 $292,078,527 $— $4,159,693,791 7.0%
2019 $284,968,840 $284,968,840 $— $3,972,324,722 7.2%
2018 $280,500,929 $280,500,929 $— $3,867,555,186 7.3%
2017 $263,970,133 $263,970,133 $— $3,806,871,835 6.9%
2016 $270,985,300 $270,985,300 $— $3,790,475,424 7.2%
2015 $275,968,183 $275,968,183 $— $3,735,598,305 7.4%
* The amounts presented were measured for the calendar year ended that occurred within the fiscal year listed.
GASB standards require the presentation of 10 years of information. Because fiscal year 2015 was the first year for reporting this information, a full 10-year schedule will not be available until fiscal year 2024.
168 For the Fiscal Year Ended June 30, 2020
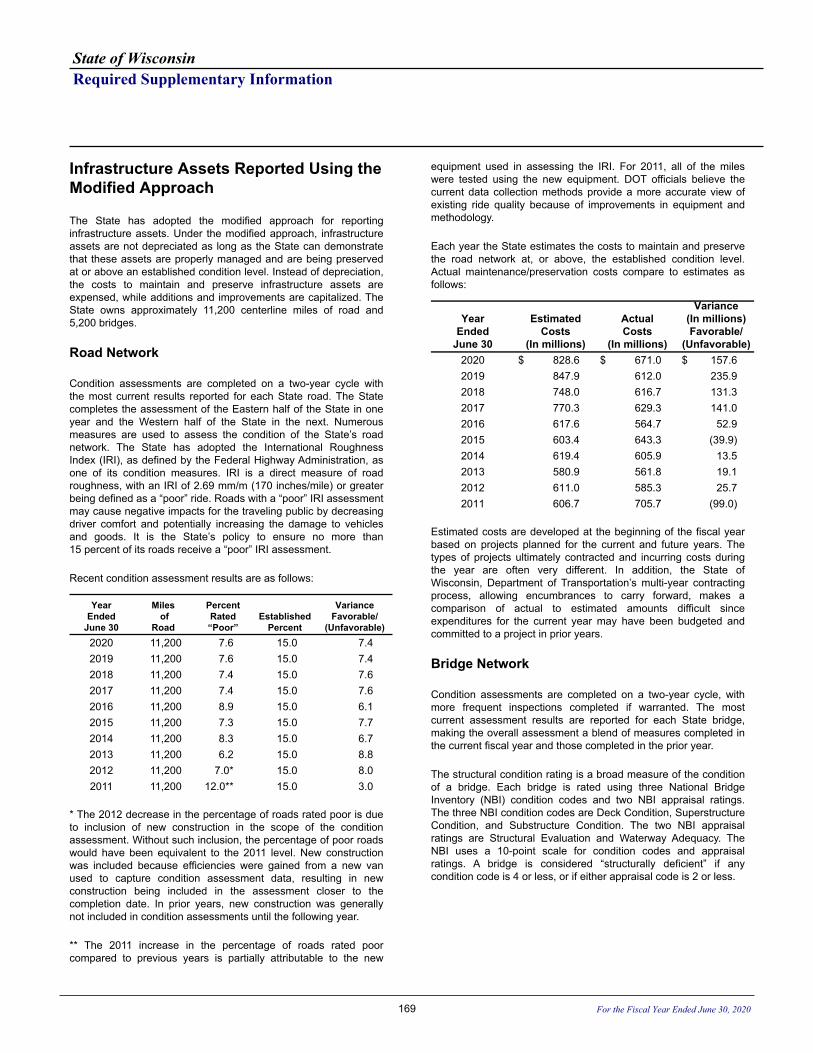
State of WisconsinRequired Supplementary Information
Infrastructure Assets Reported Using the Modified Approach
The State has adopted the modified approach for reporting infrastructure assets. Under the modified approach, infrastructure assets are not depreciated as long as the State can demonstrate that these assets are properly managed and are being preserved at or above an established condition level. Instead of depreciation, the costs to maintain and preserve infrastructure assets are expensed, while additions and improvements are capitalized. The State owns approximately 11,200 centerline miles of road and 5,200 bridges.
Road Network
Condition assessments are completed on a two-year cycle with the most current results reported for each State road. The State completes the assessment of the Eastern half of the State in one year and the Western half of the State in the next. Numerous measures are used to assess the condition of the State’s road network. The State has adopted the International Roughness Index (IRI), as defined by the Federal Highway Administration, as one of its condition measures. IRI is a direct measure of road roughness, with an IRI of 2.69 mm/m (170 inches/mile) or greater being defined as a “poor” ride. Roads with a “poor” IRI assessment may cause negative impacts for the traveling public by decreasing driver comfort and potentially increasing the damage to vehicles and goods. It is the State’s policy to ensure no more than 15 percent of its roads receive a “poor” IRI assessment.
Recent condition assessment results are as follows:
Year Ended
June 30
Miles of
Road
Percent Rated “Poor”
Established Percent
VarianceFavorable/
(Unfavorable)2020 11,200 7.6 15.0 7.42019 11,200 7.6 15.0 7.42018 11,200 7.4 15.0 7.62017 11,200 7.4 15.0 7.62016 11,200 8.9 15.0 6.12015 11,200 7.3 15.0 7.72014 11,200 8.3 15.0 6.72013 11,200 6.2 15.0 8.82012 11,200 7.0* 15.0 8.02011 11,200 12.0** 15.0 3.0
* The 2012 decrease in the percentage of roads rated poor is due to inclusion of new construction in the scope of the condition assessment. Without such inclusion, the percentage of poor roads would have been equivalent to the 2011 level. New construction was included because efficiencies were gained from a new van used to capture condition assessment data, resulting in new construction being included in the assessment closer to the completion date. In prior years, new construction was generally not included in condition assessments until the following year.
** The 2011 increase in the percentage of roads rated poor compared to previous years is partially attributable to the new
equipment used in assessing the IRI. For 2011, all of the miles were tested using the new equipment. DOT officials believe the current data collection methods provide a more accurate view of existing ride quality because of improvements in equipment and methodology.
Each year the State estimates the costs to maintain and preserve the road network at, or above, the established condition level. Actual maintenance/preservation costs compare to estimates as follows:
Year Ended
June 30
Estimated Costs
(In millions)
Actual Costs
(In millions)
Variance (In millions)Favorable/
(Unfavorable) 2020 $ 828.6 $ 671.0 $ 157.6 2019 847.9 612.0 235.9 2018 748.0 616.7 131.3 2017 770.3 629.3 141.0 2016 617.6 564.7 52.9 2015 603.4 643.3 (39.9) 2014 619.4 605.9 13.5 2013 580.9 561.8 19.1 2012 611.0 585.3 25.7 2011 606.7 705.7 (99.0)
Estimated costs are developed at the beginning of the fiscal year based on projects planned for the current and future years. The types of projects ultimately contracted and incurring costs during the year are often very different. In addition, the State of Wisconsin, Department of Transportation’s multi-year contracting process, allowing encumbrances to carry forward, makes a comparison of actual to estimated amounts difficult since expenditures for the current year may have been budgeted and committed to a project in prior years.
Bridge Network
Condition assessments are completed on a two-year cycle, with more frequent inspections completed if warranted. The most current assessment results are reported for each State bridge, making the overall assessment a blend of measures completed in the current fiscal year and those completed in the prior year.
The structural condition rating is a broad measure of the condition of a bridge. Each bridge is rated using three National Bridge Inventory (NBI) condition codes and two NBI appraisal ratings. The three NBI condition codes are Deck Condition, Superstructure Condition, and Substructure Condition. The two NBI appraisal ratings are Structural Evaluation and Waterway Adequacy. The NBI uses a 10-point scale for condition codes and appraisal ratings. A bridge is considered “structurally deficient” if any condition code is 4 or less, or if either appraisal code is 2 or less.
169 For the Fiscal Year Ended June 30, 2020
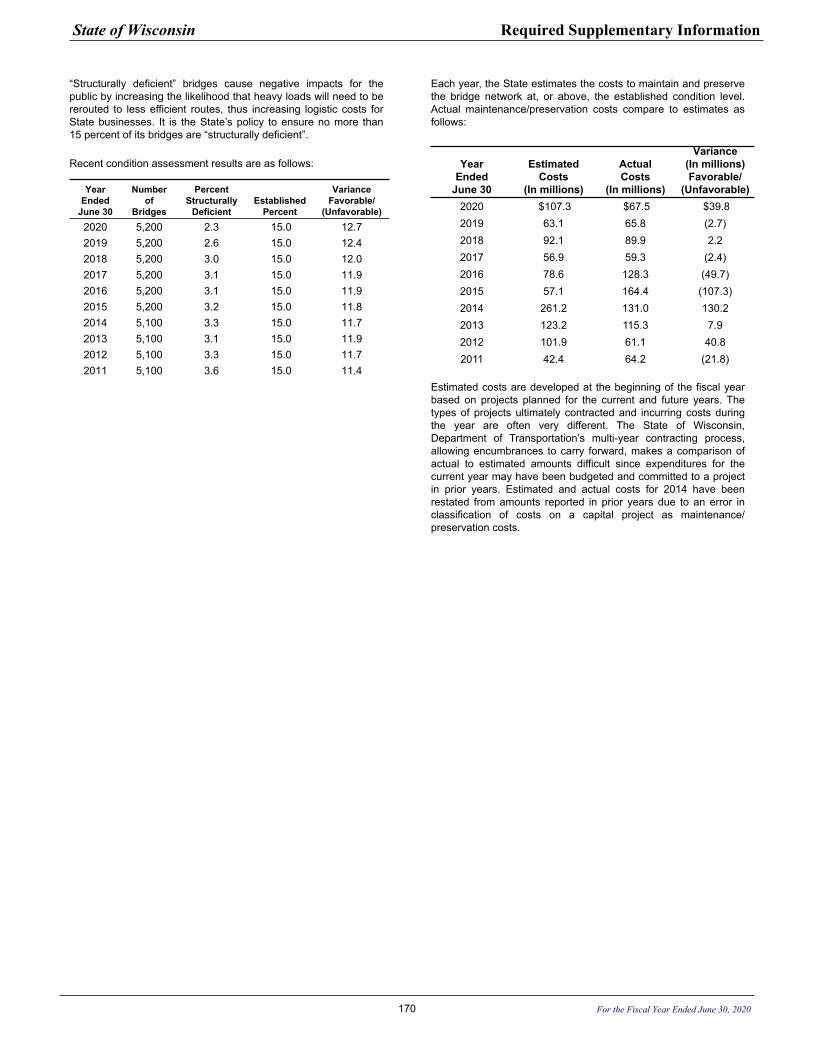
“Structurally deficient” bridges cause negative impacts for the public by increasing the likelihood that heavy loads will need to be rerouted to less efficient routes, thus increasing logistic costs for State businesses. It is the State’s policy to ensure no more than 15 percent of its bridges are “structurally deficient”.
Recent condition assessment results are as follows:
Year Ended
June 30
Number of
Bridges
Percent Structurally
DeficientEstablished
Percent
Variance Favorable/
(Unfavorable)2020 5,200 2.3 15.0 12.72019 5,200 2.6 15.0 12.42018 5,200 3.0 15.0 12.02017 5,200 3.1 15.0 11.92016 5,200 3.1 15.0 11.92015 5,200 3.2 15.0 11.82014 5,100 3.3 15.0 11.72013 5,100 3.1 15.0 11.92012 5,100 3.3 15.0 11.72011 5,100 3.6 15.0 11.4
Each year, the State estimates the costs to maintain and preserve the bridge network at, or above, the established condition level. Actual maintenance/preservation costs compare to estimates as follows:
Year Ended
June 30
Estimated Costs
(In millions)
Actual Costs
(In millions)
Variance (In millions) Favorable/
(Unfavorable)2020 $107.3 $67.5 $39.82019 63.1 65.8 (2.7)2018 92.1 89.9 2.22017 56.9 59.3 (2.4)2016 78.6 128.3 (49.7)2015 57.1 164.4 (107.3)2014 261.2 131.0 130.22013 123.2 115.3 7.92012 101.9 61.1 40.82011 42.4 64.2 (21.8)
Estimated costs are developed at the beginning of the fiscal year based on projects planned for the current and future years. The types of projects ultimately contracted and incurring costs during the year are often very different. The State of Wisconsin, Department of Transportation’s multi-year contracting process, allowing encumbrances to carry forward, makes a comparison of actual to estimated amounts difficult since expenditures for the current year may have been budgeted and committed to a project in prior years. Estimated and actual costs for 2014 have been restated from amounts reported in prior years due to an error in classification of costs on a capital project as maintenance/preservation costs.
State of Wisconsin Required Supplementary Information
170 For the Fiscal Year Ended June 30, 2020
This page left intentionally blank.
State of Wisconsin Required Supplementary Information
171 For the Fiscal Year Ended June 30, 2020
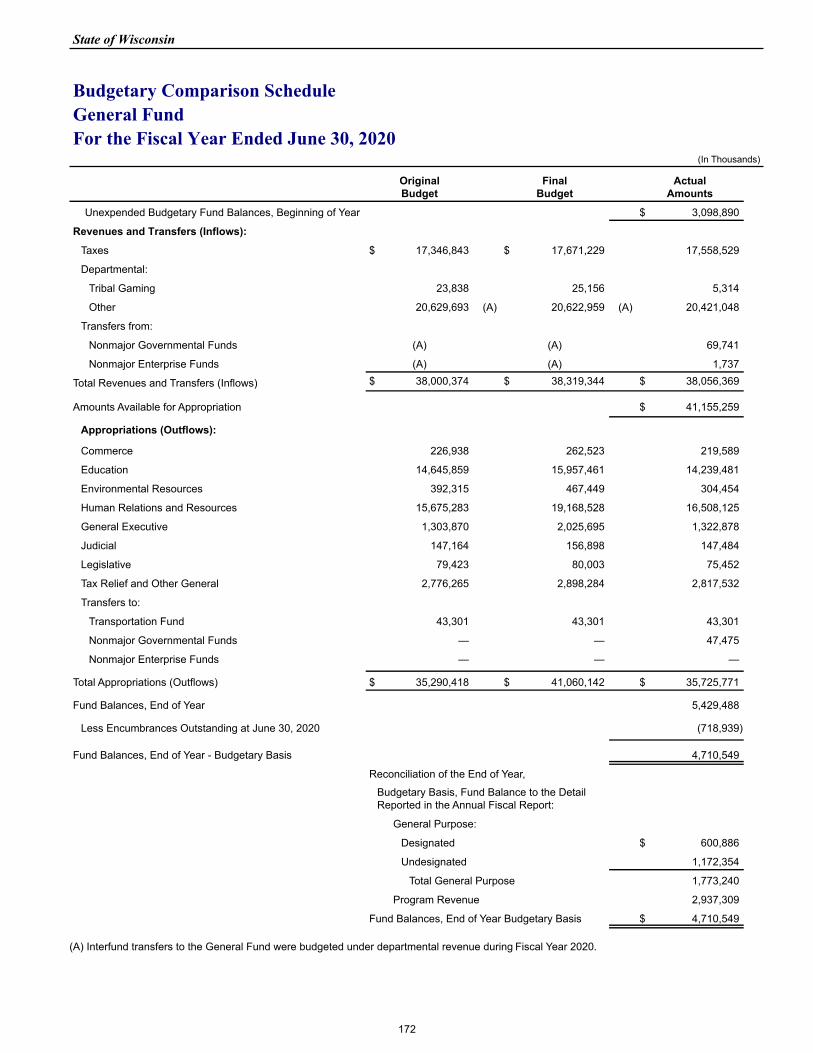
Budgetary Comparison ScheduleGeneral FundFor the Fiscal Year Ended June 30, 2020
(In Thousands)
Original Budget
Final Budget
Actual Amounts
Unexpended Budgetary Fund Balances, Beginning of Year $ 3,098,890
Revenues and Transfers (Inflows):
Taxes $ 17,346,843 $ 17,671,229 17,558,529
Departmental:
Tribal Gaming 23,838 25,156 5,314
Other 20,629,693 (A) 20,622,959 (A) 20,421,048
Transfers from:
Nonmajor Governmental Funds (A) (A) 69,741
Nonmajor Enterprise Funds (A) (A) 1,737
Total Revenues and Transfers (Inflows) $ 38,000,374 $ 38,319,344 $ 38,056,369
Amounts Available for Appropriation $ 41,155,259
Appropriations (Outflows):
Commerce 226,938 262,523 219,589
Education 14,645,859 15,957,461 14,239,481
Environmental Resources 392,315 467,449 304,454
Human Relations and Resources 15,675,283 19,168,528 16,508,125
General Executive 1,303,870 2,025,695 1,322,878
Judicial 147,164 156,898 147,484
Legislative 79,423 80,003 75,452
Tax Relief and Other General 2,776,265 2,898,284 2,817,532
Transfers to:
Transportation Fund 43,301 43,301 43,301
Nonmajor Governmental Funds — — 47,475
Nonmajor Enterprise Funds — — —
Total Appropriations (Outflows) $ 35,290,418 $ 41,060,142 $ 35,725,771
Fund Balances, End of Year 5,429,488
Less Encumbrances Outstanding at June 30, 2020 (718,939)
Fund Balances, End of Year - Budgetary Basis 4,710,549
Reconciliation of the End of Year,
Budgetary Basis, Fund Balance to the Detail Reported in the Annual Fiscal Report:
General Purpose:
Designated $ 600,886
Undesignated 1,172,354
Total General Purpose 1,773,240
Program Revenue 2,937,309
Fund Balances, End of Year Budgetary Basis $ 4,710,549
(A) Interfund transfers to the General Fund were budgeted under departmental revenue during Fiscal Year 2020.
State of Wisconsin
172
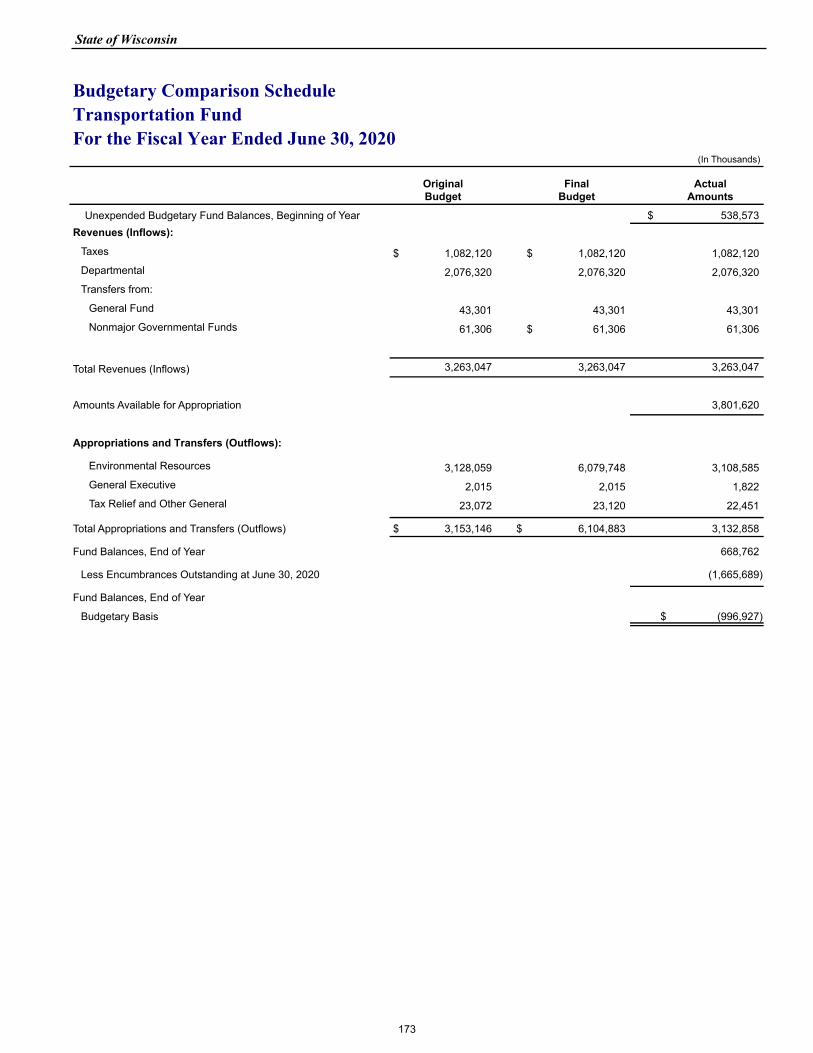
Budgetary Comparison ScheduleTransportation Fund For the Fiscal Year Ended June 30, 2020
(In Thousands)
Original Budget
Final Budget
Actual Amounts
Unexpended Budgetary Fund Balances, Beginning of Year $ 538,573 Revenues (Inflows):
Taxes $ 1,082,120 $ 1,082,120 1,082,120 Departmental 2,076,320 2,076,320 2,076,320 Transfers from:
General Fund 43,301 43,301 43,301 Nonmajor Governmental Funds 61,306 $ 61,306 61,306
Total Revenues (Inflows) 3,263,047 3,263,047 3,263,047
Amounts Available for Appropriation 3,801,620
Appropriations and Transfers (Outflows):
Environmental Resources 3,128,059 6,079,748 3,108,585 General Executive 2,015 2,015 1,822 Tax Relief and Other General 23,072 23,120 22,451
Total Appropriations and Transfers (Outflows) $ 3,153,146 $ 6,104,883 3,132,858
Fund Balances, End of Year 668,762
Less Encumbrances Outstanding at June 30, 2020 (1,665,689)
Fund Balances, End of Year
Budgetary Basis $ (996,927)
State of Wisconsin
173

174
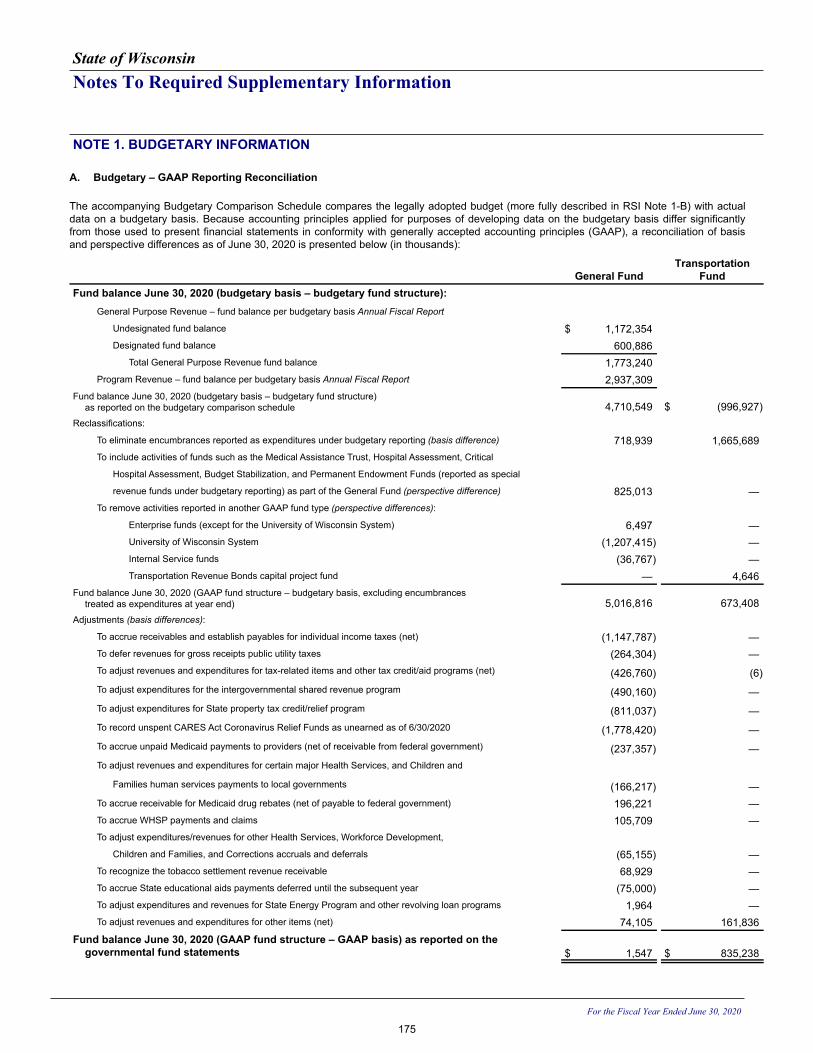
State of WisconsinNotes To Required Supplementary Information
NOTE 1. BUDGETARY INFORMATION
A. Budgetary – GAAP Reporting Reconciliation
The accompanying Budgetary Comparison Schedule compares the legally adopted budget (more fully described in RSI Note 1-B) with actual data on a budgetary basis. Because accounting principles applied for purposes of developing data on the budgetary basis differ significantly from those used to present financial statements in conformity with generally accepted accounting principles (GAAP), a reconciliation of basis and perspective differences as of June 30, 2020 is presented below (in thousands):
General FundTransportation
FundFund balance June 30, 2020 (budgetary basis – budgetary fund structure):
General Purpose Revenue – fund balance per budgetary basis Annual Fiscal Report
Undesignated fund balance $ 1,172,354 Designated fund balance 600,886
Total General Purpose Revenue fund balance 1,773,240 Program Revenue – fund balance per budgetary basis Annual Fiscal Report 2,937,309
Fund balance June 30, 2020 (budgetary basis – budgetary fund structure) as reported on the budgetary comparison schedule 4,710,549 $ (996,927)
Reclassifications:
To eliminate encumbrances reported as expenditures under budgetary reporting (basis difference) 718,939 1,665,689 To include activities of funds such as the Medical Assistance Trust, Hospital Assessment, Critical
Hospital Assessment, Budget Stabilization, and Permanent Endowment Funds (reported as special
revenue funds under budgetary reporting) as part of the General Fund (perspective difference) 825,013 — To remove activities reported in another GAAP fund type (perspective differences):
Enterprise funds (except for the University of Wisconsin System) 6,497 — University of Wisconsin System (1,207,415) — Internal Service funds (36,767) — Transportation Revenue Bonds capital project fund — 4,646
Fund balance June 30, 2020 (GAAP fund structure – budgetary basis, excluding encumbrances treated as expenditures at year end) 5,016,816 673,408
Adjustments (basis differences):
To accrue receivables and establish payables for individual income taxes (net) (1,147,787) — To defer revenues for gross receipts public utility taxes (264,304) — To adjust revenues and expenditures for tax-related items and other tax credit/aid programs (net) (426,760) (6) To adjust expenditures for the intergovernmental shared revenue program (490,160) — To adjust expenditures for State property tax credit/relief program (811,037) — To record unspent CARES Act Coronavirus Relief Funds as unearned as of 6/30/2020 (1,778,420) — To accrue unpaid Medicaid payments to providers (net of receivable from federal government) (237,357) — To adjust revenues and expenditures for certain major Health Services, and Children and
Families human services payments to local governments (166,217) — To accrue receivable for Medicaid drug rebates (net of payable to federal government) 196,221 — To accrue WHSP payments and claims 105,709 — To adjust expenditures/revenues for other Health Services, Workforce Development,
Children and Families, and Corrections accruals and deferrals (65,155) — To recognize the tobacco settlement revenue receivable 68,929 — To accrue State educational aids payments deferred until the subsequent year (75,000) — To adjust expenditures and revenues for State Energy Program and other revolving loan programs 1,964 — To adjust revenues and expenditures for other items (net) 74,105 161,836
Fund balance June 30, 2020 (GAAP fund structure – GAAP basis) as reported on the governmental fund statements $ 1,547 $ 835,238
For the Fiscal Year Ended June 30, 2020
175
B. Budgetary Basis of Accounting
The State's biennial budget is prepared using a modified cash basis of accounting. The final budget is primarily a general purpose revenue and expenditure budget. General purpose revenues consist of general taxes and miscellaneous receipts which are paid into the General Fund, lose their identity, and are then available for appropriation by the Legislature. The remaining revenues consist of program revenues, which are credited by law to an appropriation to finance a specified program or State agency, and segregated revenues which are paid into separate identifiable funds.
While State departments and agencies are required to submit estimates of expected revenues for program revenue and segregated revenue categories, these estimates are not formally incorporated into the adopted budget except for revenue estimates of the Lottery Fund. As a result, legally budgeted revenues for these categories are not available and, consequently, actual amounts are reported in the budget column of the Budgetary Comparison Schedules.
Expenditure budgeting differs for the various types of appropriations. For most appropriations, budgeted expenditures equal the amount from the adopted budget plus any subsequent legislative or administrative revisions. Various supplemental appropriations were approved during the year and have been incorporated into the budget figures.
While State statutes prohibit spending beyond budgetary authority, a provision is made to include the value of accounts receivable, inventories and work in process in identifying available revenues. The State also utilizes nonbudget accounts for which no budget is established but expenditures may be incurred. As a result, actual expenditures may exceed budgeted amounts in certain categories.
The budgetary basis of accounting required by State law differs materially from the basis used to report revenues and expenditures in accordance with GAAP. Other variances arise because the State's biennial budget is developed according to the statutory required fund structure which differs extensively from the fund structure used in the GAAP basis financial statements. This difference is primarily caused by the elimination of the University of Wisconsin System, and various fiduciary, proprietary and other governmental fund activities from the statutory General and Transportation funds. In addition, funds such as the Medical Assistance Trust, Hospital Assessment, Budget Stabilization and Permanent Endowment, special revenue funds under statutory reporting, are included as part of the General Fund under GAAP reporting. As a consequence of these differences, a reconciliation between budgetary basis and GAAP basis is provided in Note 1-A of the notes to the required supplementary information.
The Budgetary Comparison Schedules for the General and the Transportation Fund present both the original and final appropriated budgets, as well as the actual inflows, outflows, and fund balance on the budgetary basis. The supplementary budget comparison schedule provides this same information (with the exception of the original budget data) for the nonmajor governmental funds with annual budgets. The capital project and debt service funds are excluded from this schedule because no comprehensive budget is approved for these funds. One special revenue fund, the Wisconsin Public Broadcasting Foundation, has been excluded from reporting because it is a blended component unit that is neither budgeted nor included under statutory reporting. Of the permanent funds, only the Historical Society Fund and a portion of the Common School and Normal School funds are budgeted.
The State’s biennial budget was enacted on July 3, 2019 and published on July 4, 2019. This legislation is recognized by State officials as the original budget and is treated as such on the Budgetary Comparison Schedules.
While the legal level of budgetary control for the reported funds is maintained at the appropriation line as specified by the Legislature in Chapter 20 of the Wisconsin Statutes, this level of detail is impractical for inclusion in the Comprehensive Annual Financial Report. Accordingly, a supplementary report is available upon request which provides budgetary comparisons at the legal level of control.
Appropriation unexpended balances lapse at year-end or forward to the subsequent fiscal year depending on the type of appropriation involved:
• Continuing - unexpended balances automatically forward to ensuing years until fully depleted or repealed by subsequent action of the Legislature.
• Annual:▪ General Purpose Revenue - unencumbered balances lapse at
year end.▪ Program Revenue - unexpended cash balances may be
forwarded to the next fiscal year.• Biennial - unexpended balances or deficits automatically forward to
the second year. At the end of the second year all unencumbered general purpose revenue balances lapse.
• Sum sufficient - moneys are appropriated and expended in the amounts necessary to accomplish the purpose specified.
Encumbrances may be carried over to the next fiscal year as a revision to the budgetary appropriation with Department of Administration approval. Under budgetary reporting, encumbrances are treated like expenditures and are shown as a reduction of fund balance.
State of Wisconsin Notes to Required Supplementary Information
For the Fiscal Year Ended June 30, 2020
176

Supplementary Information
177

178
State of Wisconsin
Nonmajor Governmental Funds
SPECIAL REVENUE: Special revenue funds account for the proceeds of specific revenue sources that are legally restricted to expenditures for a specified purpose. The State's special revenue funds are described below:
The Conservation Fund accounts for the management of the State's fish, wildlife, parks and other natural resources with funds provided from hunting and fishing licenses, recreational fees and forestry taxes.
The Police and Fire Protection Fund accounts for the distribution of fees collected by communication providers and retailers for distribution to counties and municipalities as State shared revenue.
The Utility Public Benefits Fund accounts for voluntary contributions and public benefits fees collected from customers by utilities to assist in funding low income assistance grants and energy conservation and efficiency grants.
The Petroleum Inspection Fund accounts for revenues received from inspection fees on petroleum products shipped into Wisconsin and proceeds received from revenue bonds. These resources are used for petroleum inspection programs, environmental cleanup awards, clean air and water administration and other environmental programs in the State.
The Wisconsin Public Broadcasting Foundation Fund accounts for financial resources generated to support the activities of the Educational Communications Board. The primary revenue sources of the fund are from gifts, grants and contributions.
The Economic Development Fund accounts for economic development surcharges collected from Wisconsin businesses for the privilege of doing business in the state. Resources of the fund are provided to the Wisconsin Economic Development Corporation.
The Other Environmental Special Revenue Funds, in conjunction with the Conservation Fund, account for resources used to provide for the preservation of the State’s parks, forests and environment, and includes the following:
• The Heritage State Parks and Forests Fund accounts for the funding for operations and maintenance of State parks, southern State forests, and recreation areas either by making partial matching grants to "friends groups" or by accepting expenditure transfers from park and forest programs in the Conservation Fund.
• The Waste Management Fund accounts for the closure and long-term care of approved landfills from fees imposed on landfill operators.
• The Environmental Fund accounts for the development and enforcement of groundwater standards, as well as assistance in the emergency response, investigation, and cleanup of contamination. This assistance is funded by fees on activities or substances which may contaminate groundwater and fees for solid waste tipping, pesticide licenses and oil inspections.
• The Dry Cleaner Environmental Response Fund accounts for the financial assistance for the remediation of environmental contamination caused by the spillage of dry cleaning solvents. Revenues used to fund this program are dry cleaning facility license and solvent fees.
The Other Special Revenue Funds account for resources that must be used for specific purposes and include the following:
• The Unemployment Interest Payment Fund accounts for assessments collected on employers in the state. Revenues are used to pay interest due on outstanding advances from the federal government that were used to pay unemployment claims.
• The Investment and Local Impact Fund accounts for grants and loans to municipalities where metalliferous minerals exist to offset the negative effects of mining projects. These grants and loans are funded with taxes which have been imposed on mining activities.
• The Election Administration Fund accounts for federal and State moneys provided to develop, administer and manage a statewide voter registration system, enabling all qualified electors, including those with disabilities, the opportunity to vote while maintaining uniform standards within the voting process and safeguarding the vote of all electors.
• The Self-insured Employers Liability Fund collects fees assessed from employers who self-insure for workers compensation purposes. The reserve is used to pay judgements owed to employees of insolvent self-insured employers.
• The Work Injury Supplemental Benefit Fund accounts for compensatory payments to survivors of fatally injured employees or disabled employees with work-related injuries. This compensation is provided with funds collected from State employers and insurance carriers.
• The Workers Compensation Fund accounts for the expenditures related to administering the worker’s compensation laws in Wisconsin. These expenditures are funded by annual assessments of insurers and self-insured employers doing business in the State.
(Continued)
179
State of Wisconsin
Nonmajor Governmental Funds
• The Uninsured Employers Fund accounts for the administration of insurance enforcement activities and compensation to injured employees of uninsured employers. The revenue is primarily provided by funds collected from uninsured employers.
• The Mediation Fund accounts for the resolution of disputes regarding medical malpractice. Primary revenue sources are dispute filing fees and fees charged to health care providers.
• The Working Lands Fund accounts for the deposit of farmland preservation conversion fees, gifts and grants. Proceeds are used to purchase agriculture conservation easements and to provide grants to counties for farmland preservation plan costs.
• The State Capitol Restoration Fund accounts for moneys from private donations used to offset the costs of restoration work at the State Capitol.
• The Agricultural Chemical Cleanup Fund accounts for the portion of the costs responsible persons pay to clean up fertilizer and pesticide spills and historical handling areas. Fertilizer and pesticide licenses and registration fees primarily provide the revenue.
• The Agrichemical Management Fund accounts for the regulation and enforcement of pesticide, feed and fertilizer industries. The revenue is generated by licenses and fees assessed to these industries.
• The Agricultural Producer Security Fund accounts for fees, surcharges, assessments, reimbursements and bond proceeds of surety bonds collected from contractors doing business with agricultural producers. Payments are made to producers from the fund if contractors default on amounts owed to producers.
• The Historical Legacy Trust Fund accounts for gifts, grants and bequests given to commemorate the 200th anniversary of statehood. The fund also reports all moneys received by the State Sesquicentennial Commission after September 30, 1998.
• The History Preservation Partnership Trust Fund accounts for moneys received from admissions, sales, and other receipts of the Historical Society. The fund is supported primarily by program revenues from daily receipts, site deposits and other generated income from goods and services.
• The Wireless 911 Fund accounts for residual assets from the wireless 911 program that provided grants to local governments. 2009 Wisconsin Act 28 ended the program.
• The Military Family Relief Fund accounts for donations received via designation on Wisconsin state income tax returns, gifts, and bequests. Resources are used to provide financial assistance to the spouse and dependent children of service members who are residents of this state and serving on active duty in the U.S. armed forces.
• The Universal Service Fund accounts for programs that ensure that all State residents receive essential telecommunication services at reasonable prices. Assessment of entities in the telecommunications industry is the primary source of revenues.
• The Land Information Fund receives a portion of fees counties collect pertaining to legal documents filed with the county register of deeds. The revenues are used to make grants to the counties to develop and operate a basic land information system.
• The Children's Trust Fund accounts for the program which provides information and encourages the development of child abuse and neglect prevention programs. This fund is supported primarily with investment income and moneys received as contributions, grants, gifts and bequests.
(Continued)
180
State of Wisconsin
Nonmajor Governmental Funds
DEBT SERVICE: Debt service funds account for the accumulation of resources for, and the payment of, principal, interest and related costs of general long-term obligations.
The Bond Security and Redemption Fund accounts for the accumulation of resources for, and the payment of principal, interest and related costs of, general obligation bond debt.
The Annual Appropriation Bonds Fund accounts for the accumulation of resources for, and the payment of principal, interest and related costs of, the appropriation obligations issued in Fiscal Year 2004 to pay the State’s unfunded accrued prior service (pension) liability and its unfunded accrued liability for sick leave conversion credits.
The 2009 Annual Appropriation Bonds Fund accounts for the accumulation of resources for, and the payment of principal, interest and related costs of, the appropriation obligations issued in Fiscal Year 2009 to purchase tobacco settlement revenues that were previously sold by the State to the Badger Tobacco Asset Securitization Corporation.
The Petroleum Inspection Revenue Bonds Fund accounts for the accumulation of resources for, and the payment of principal, interest and related costs of, petroleum inspection fee revenue bond obligations.
The Transportation Revenue Bonds Fund accounts for the accumulation of resources for, and the payment of principal, interest and related costs of, transportation revenue bond obligations.
CAPITAL PROJECTS: Capital projects funds account for financial resources used for the acquisition, construction, renovation or repair of major capital facilities (other than those financed by proprietary funds and trust funds). The State's capital projects funds are described below:
The Capital Improvement Fund accounts for the proceeds received from general obligation bonds and notes, and associated interest earnings. Resources of the fund are used for the acquisition or construction of major capital facilities and for repair and maintenance projects.
The Building Trust Fund accounts for repair projects of major capital facilities which are funded primarily through General Fund and agency transfers.
The Transportation Revenue Bonds Fund accounts for the accumulation of financing resources for the construction, maintenance, and repair of certain major highway projects and administrative facilities.
PERMANENT: Permanent funds are used to report resources that are legally restricted to the extent that only earnings, not principal, may be used to support the State’s programs.
The Common School Fund accounts for proceeds from the sale of land granted by the federal government to Wisconsin when it became a state. The fund also receives fines and forfeitures from penal law breaches and proceeds from the disposal of escheated property. The fund provides low cost loans to municipalities and school districts for public purposes. Earnings are distributed to aid local school districts as required by the state constitution.
The Other Permanent Funds account for various resources with legal restrictions requiring that principal remain intact and that only earnings be spent and includes the following:
• The Historical Society Fund accounts for investment income and donations received by the Wisconsin Historical Society to assist in the operations of the State's archives, research and library services, museums, historic preservation, and executive and administrative services.
• The Agricultural College and University statutory funds account for federal land grant revenues used as public purpose loans for municipalities and school districts.
• The Normal School statutory fund accounts for public purpose loans to municipalities and school districts. These loans are financed with revenues derived from the sale of federally granted land and timber. The interest generated from this fund is used to support and maintain State universities.
• The Benevolent statutory fund accounts for investment income used for the care, custody and education of residents committed to the Lincoln Hills School.
181
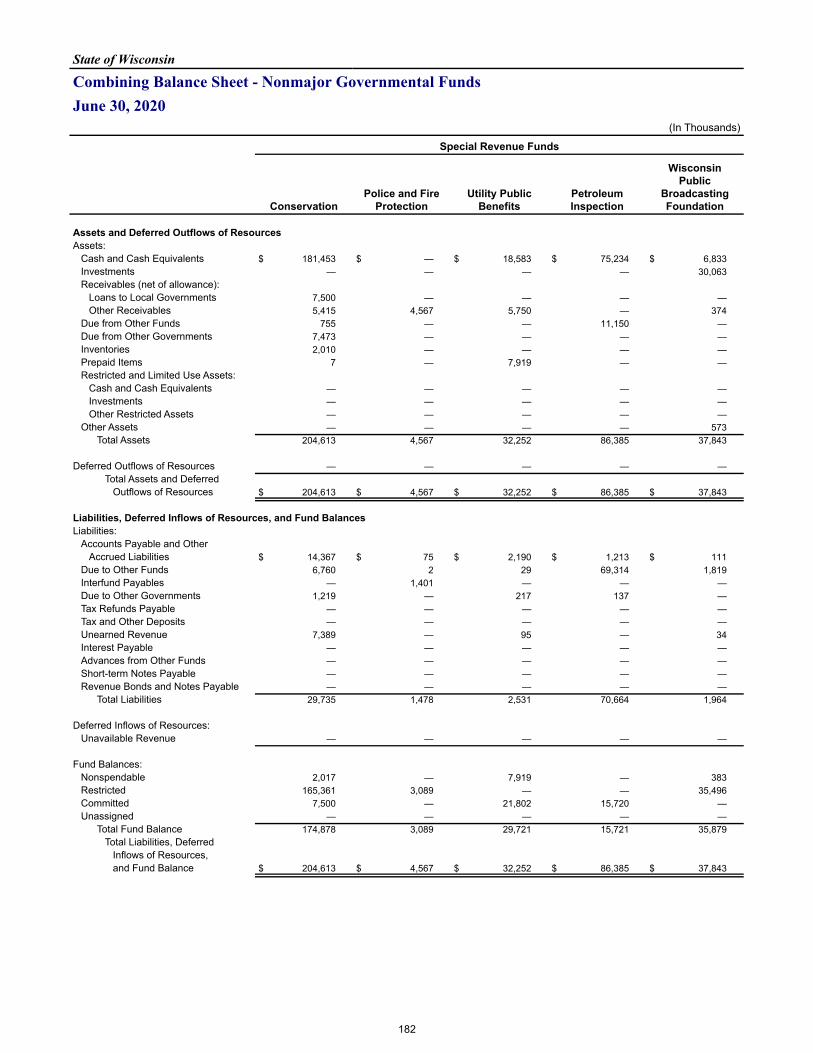
State of Wisconsin
Combining Balance Sheet - Nonmajor Governmental Funds June 30, 2020
(In Thousands)
Special Revenue Funds
ConservationPolice and Fire
ProtectionUtility Public
BenefitsPetroleum Inspection
WisconsinPublic
Broadcasting Foundation
Assets and Deferred Outflows of ResourcesAssets:
Cash and Cash Equivalents $ 181,453 $ — $ 18,583 $ 75,234 $ 6,833 Investments — — — — 30,063 Receivables (net of allowance):
Loans to Local Governments 7,500 — — — — Other Receivables 5,415 4,567 5,750 — 374
Due from Other Funds 755 — — 11,150 — Due from Other Governments 7,473 — — — — Inventories 2,010 — — — — Prepaid Items 7 — 7,919 — — Restricted and Limited Use Assets:
Cash and Cash Equivalents — — — — — Investments — — — — — Other Restricted Assets — — — — —
Other Assets — — — — 573 Total Assets 204,613 4,567 32,252 86,385 37,843
Deferred Outflows of Resources — — — — — Total Assets and Deferred
Outflows of Resources $ 204,613 $ 4,567 $ 32,252 $ 86,385 $ 37,843
Liabilities, Deferred Inflows of Resources, and Fund BalancesLiabilities:
Accounts Payable and OtherAccrued Liabilities $ 14,367 $ 75 $ 2,190 $ 1,213 $ 111
Due to Other Funds 6,760 2 29 69,314 1,819 Interfund Payables — 1,401 — — — Due to Other Governments 1,219 — 217 137 — Tax Refunds Payable — — — — — Tax and Other Deposits — — — — — Unearned Revenue 7,389 — 95 — 34 Interest Payable — — — — — Advances from Other Funds — — — — — Short-term Notes Payable — — — — — Revenue Bonds and Notes Payable — — — — —
Total Liabilities 29,735 1,478 2,531 70,664 1,964
Deferred Inflows of Resources:Unavailable Revenue — — — — —
Fund Balances:Nonspendable 2,017 — 7,919 — 383 Restricted 165,361 3,089 — — 35,496 Committed 7,500 — 21,802 15,720 — Unassigned — — — — —
Total Fund Balance 174,878 3,089 29,721 15,721 35,879 Total Liabilities, Deferred
Inflows of Resources,and Fund Balance $ 204,613 $ 4,567 $ 32,252 $ 86,385 $ 37,843
182
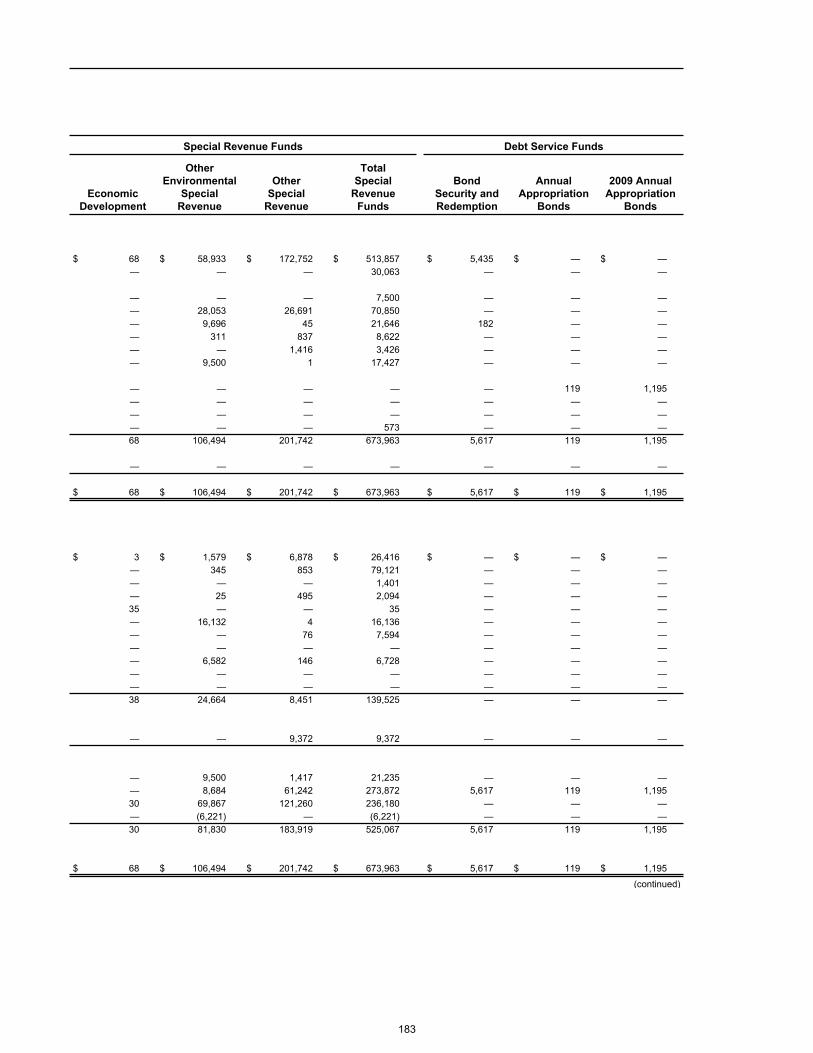
Special Revenue Funds Debt Service Funds
EconomicDevelopment
OtherEnvironmental
SpecialRevenue
OtherSpecial
Revenue
TotalSpecial
RevenueFunds
BondSecurity andRedemption
AnnualAppropriation
Bonds
2009 AnnualAppropriation
Bonds
$ 68 $ 58,933 $ 172,752 $ 513,857 $ 5,435 $ — $ — — — — 30,063 — — —
— — — 7,500 — — — — 28,053 26,691 70,850 — — — — 9,696 45 21,646 182 — — — 311 837 8,622 — — — — — 1,416 3,426 — — — — 9,500 1 17,427 — — —
— — — — — 119 1,195 — — — — — — — — — — — — — — — — — 573 — — — 68 106,494 201,742 673,963 5,617 119 1,195
— — — — — — —
$ 68 $ 106,494 $ 201,742 $ 673,963 $ 5,617 $ 119 $ 1,195
$ 3 $ 1,579 $ 6,878 $ 26,416 $ — $ — $ — — 345 853 79,121 — — — — — — 1,401 — — — — 25 495 2,094 — — — 35 — — 35 — — — — 16,132 4 16,136 — — — — — 76 7,594 — — — — — — — — — — — 6,582 146 6,728 — — — — — — — — — — — — — — — — — 38 24,664 8,451 139,525 — — —
— — 9,372 9,372 — — —
— 9,500 1,417 21,235 — — — — 8,684 61,242 273,872 5,617 119 1,195 30 69,867 121,260 236,180 — — — — (6,221) — (6,221) — — — 30 81,830 183,919 525,067 5,617 119 1,195
$ 68 $ 106,494 $ 201,742 $ 673,963 $ 5,617 $ 119 $ 1,195
(continued)
183
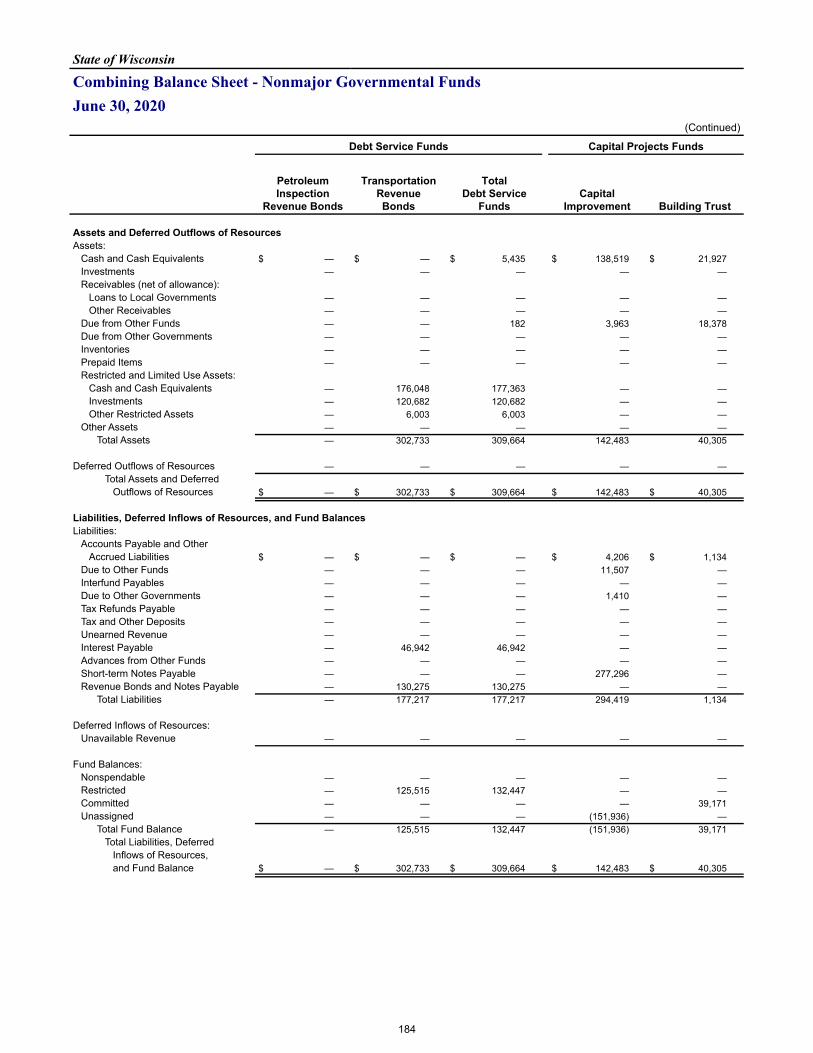
State of Wisconsin
Combining Balance Sheet - Nonmajor Governmental Funds June 30, 2020
(Continued)
Debt Service Funds Capital Projects Funds
PetroleumInspection
Revenue Bonds
TransportationRevenueBonds
TotalDebt Service
FundsCapital
Improvement Building Trust
Assets and Deferred Outflows of ResourcesAssets:
Cash and Cash Equivalents $ — $ — $ 5,435 $ 138,519 $ 21,927 Investments — — — — — Receivables (net of allowance):
Loans to Local Governments — — — — — Other Receivables — — — — —
Due from Other Funds — — 182 3,963 18,378 Due from Other Governments — — — — — Inventories — — — — — Prepaid Items — — — — — Restricted and Limited Use Assets:
Cash and Cash Equivalents — 176,048 177,363 — — Investments — 120,682 120,682 — — Other Restricted Assets — 6,003 6,003 — —
Other Assets — — — — — Total Assets — 302,733 309,664 142,483 40,305
Deferred Outflows of Resources — — — — — Total Assets and Deferred
Outflows of Resources $ — $ 302,733 $ 309,664 $ 142,483 $ 40,305
Liabilities, Deferred Inflows of Resources, and Fund BalancesLiabilities:
Accounts Payable and OtherAccrued Liabilities $ — $ — $ — $ 4,206 $ 1,134
Due to Other Funds — — — 11,507 — Interfund Payables — — — — — Due to Other Governments — — — 1,410 — Tax Refunds Payable — — — — — Tax and Other Deposits — — — — — Unearned Revenue — — — — — Interest Payable — 46,942 46,942 — — Advances from Other Funds — — — — — Short-term Notes Payable — — — 277,296 — Revenue Bonds and Notes Payable — 130,275 130,275 — —
Total Liabilities — 177,217 177,217 294,419 1,134
Deferred Inflows of Resources:Unavailable Revenue — — — — —
Fund Balances:Nonspendable — — — — — Restricted — 125,515 132,447 — — Committed — — — — 39,171 Unassigned — — — (151,936) —
Total Fund Balance — 125,515 132,447 (151,936) 39,171 Total Liabilities, Deferred
Inflows of Resources,and Fund Balance $ — $ 302,733 $ 309,664 $ 142,483 $ 40,305
184
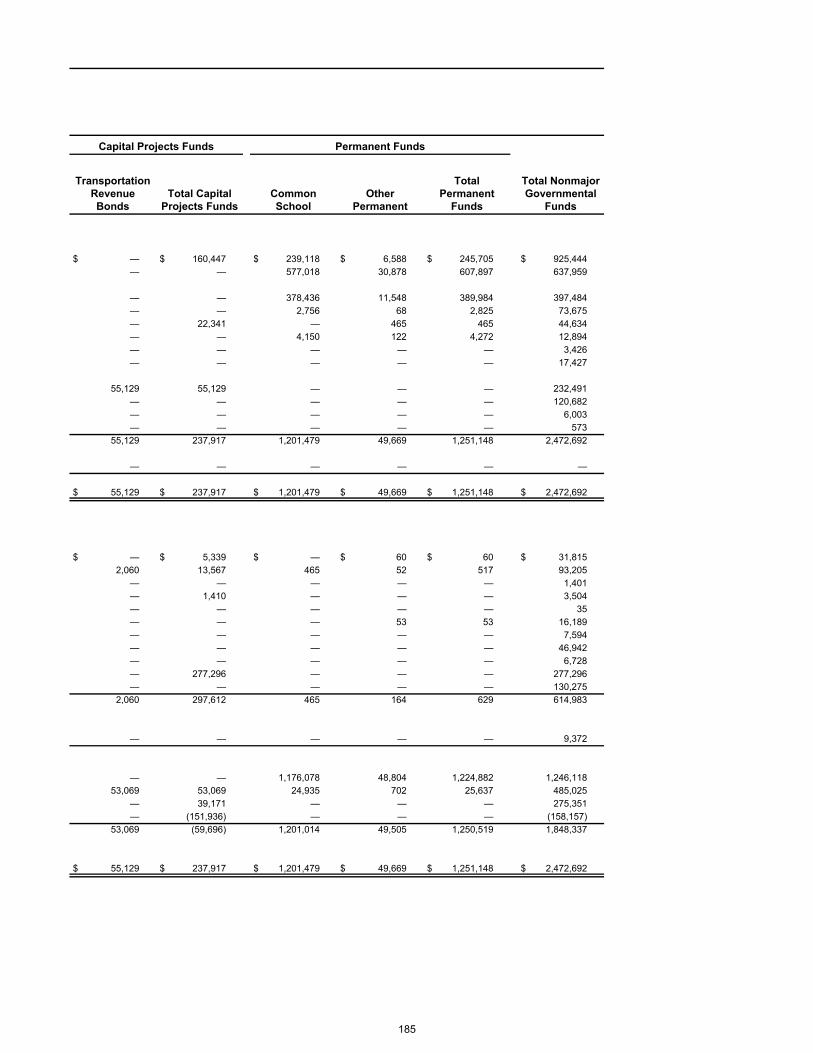
Capital Projects Funds Permanent Funds
Transportation Revenue Bonds
Total Capital Projects Funds
Common School
Other Permanent
Total Permanent
Funds
Total Nonmajor Governmental
Funds
$ — $ 160,447 $ 239,118 $ 6,588 $ 245,705 $ 925,444 — — 577,018 30,878 607,897 637,959
— — 378,436 11,548 389,984 397,484 — — 2,756 68 2,825 73,675 — 22,341 — 465 465 44,634 — — 4,150 122 4,272 12,894 — — — — — 3,426 — — — — — 17,427
55,129 55,129 — — — 232,491 — — — — — 120,682 — — — — — 6,003 — — — — — 573 55,129 237,917 1,201,479 49,669 1,251,148 2,472,692
— — — — — —
$ 55,129 $ 237,917 $ 1,201,479 $ 49,669 $ 1,251,148 $ 2,472,692
$ — $ 5,339 $ — $ 60 $ 60 $ 31,815 2,060 13,567 465 52 517 93,205 — — — — — 1,401 — 1,410 — — — 3,504 — — — — — 35 — — — 53 53 16,189 — — — — — 7,594 — — — — — 46,942 — — — — — 6,728 — 277,296 — — — 277,296 — — — — — 130,275 2,060 297,612 465 164 629 614,983
— — — — — 9,372
— — 1,176,078 48,804 1,224,882 1,246,118 53,069 53,069 24,935 702 25,637 485,025 — 39,171 — — — 275,351 — (151,936) — — — (158,157) 53,069 (59,696) 1,201,014 49,505 1,250,519 1,848,337
$ 55,129 $ 237,917 $ 1,201,479 $ 49,669 $ 1,251,148 $ 2,472,692
185
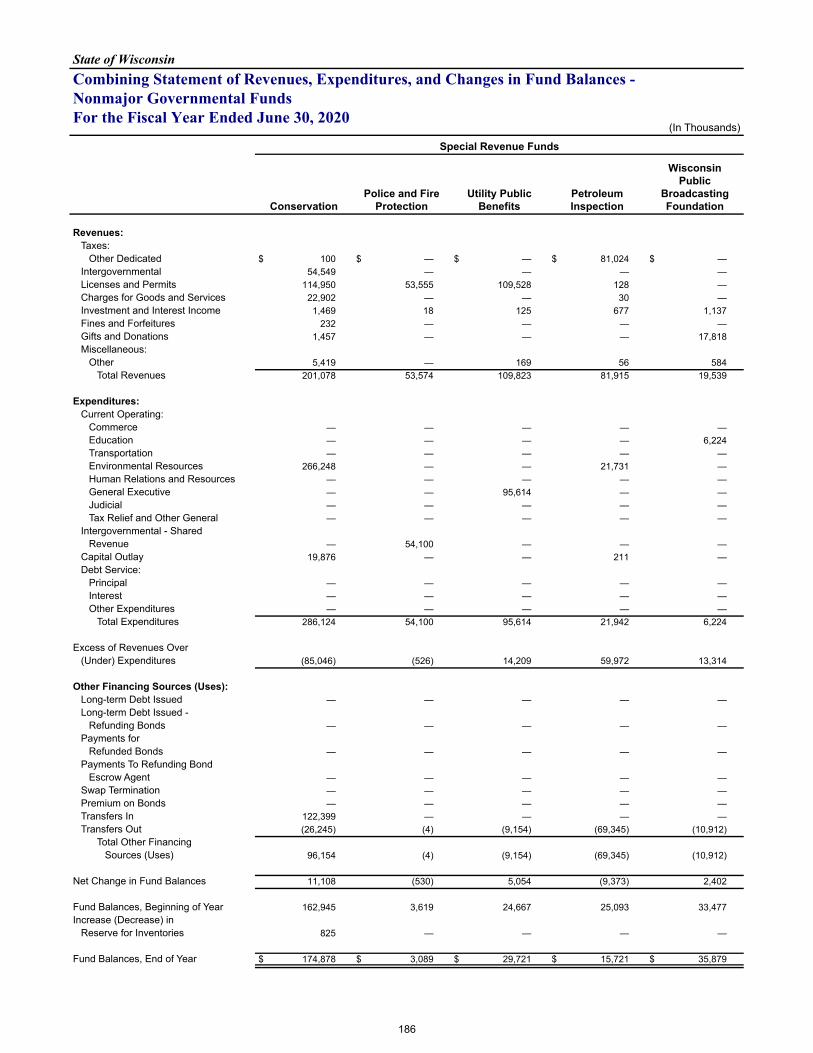
State of WisconsinCombining Statement of Revenues, Expenditures, and Changes in Fund Balances -Nonmajor Governmental FundsFor the Fiscal Year Ended June 30, 2020
(In Thousands)
Special Revenue Funds
ConservationPolice and Fire
ProtectionUtility Public
BenefitsPetroleum Inspection
WisconsinPublic
Broadcasting Foundation
Revenues:Taxes:
Other Dedicated $ 100 $ — $ — $ 81,024 $ — Intergovernmental 54,549 — — — — Licenses and Permits 114,950 53,555 109,528 128 — Charges for Goods and Services 22,902 — — 30 — Investment and Interest Income 1,469 18 125 677 1,137 Fines and Forfeitures 232 — — — — Gifts and Donations 1,457 — — — 17,818 Miscellaneous:
Other 5,419 — 169 56 584 Total Revenues 201,078 53,574 109,823 81,915 19,539
Expenditures:Current Operating:
Commerce — — — — — Education — — — — 6,224 Transportation — — — — — Environmental Resources 266,248 — — 21,731 — Human Relations and Resources — — — — — General Executive — — 95,614 — — Judicial — — — — — Tax Relief and Other General — — — — —
Intergovernmental - SharedRevenue — 54,100 — — —
Capital Outlay 19,876 — — 211 — Debt Service:
Principal — — — — — Interest — — — — — Other Expenditures — — — — —
Total Expenditures 286,124 54,100 95,614 21,942 6,224
Excess of Revenues Over(Under) Expenditures (85,046) (526) 14,209 59,972 13,314
Other Financing Sources (Uses):Long-term Debt Issued — — — — — Long-term Debt Issued -
Refunding Bonds — — — — — Payments for
Refunded Bonds — — — — — Payments To Refunding Bond
Escrow Agent — — — — — Swap Termination — — — — — Premium on Bonds — — — — — Transfers In 122,399 — — — — Transfers Out (26,245) (4) (9,154) (69,345) (10,912)
Total Other FinancingSources (Uses) 96,154 (4) (9,154) (69,345) (10,912)
Net Change in Fund Balances 11,108 (530) 5,054 (9,373) 2,402
Fund Balances, Beginning of Year 162,945 3,619 24,667 25,093 33,477 Increase (Decrease) in
Reserve for Inventories 825 — — — —
Fund Balances, End of Year $ 174,878 $ 3,089 $ 29,721 $ 15,721 $ 35,879
186
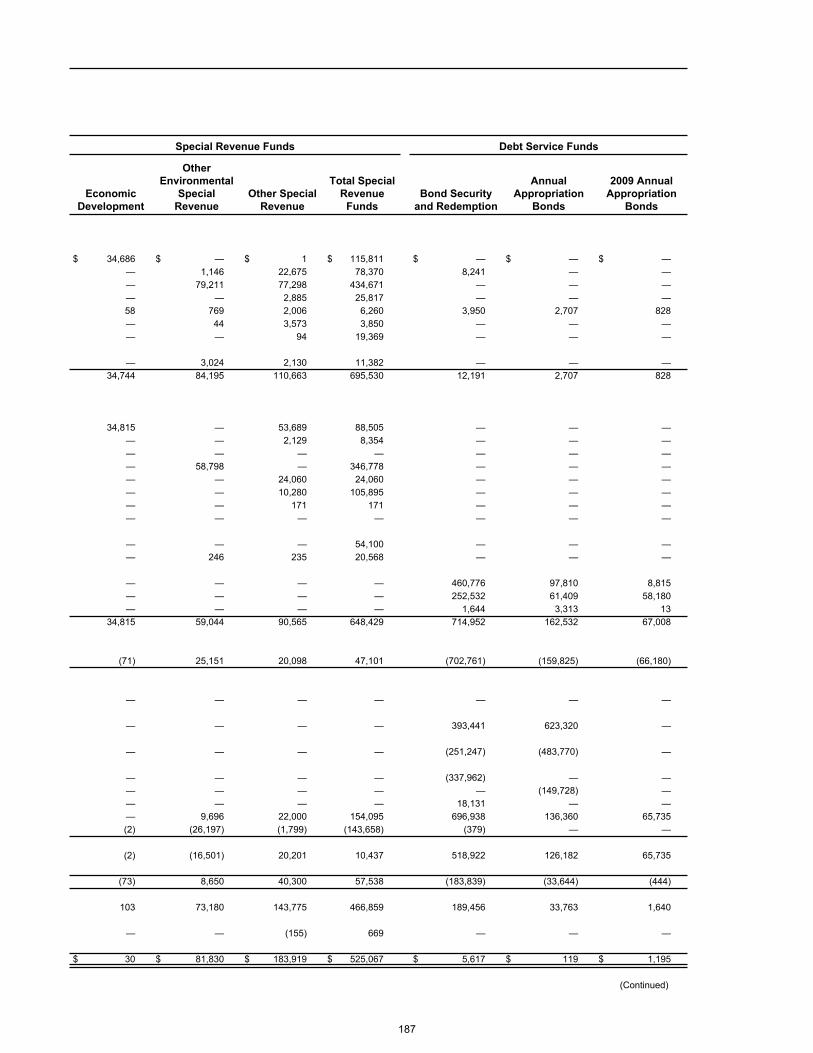
Special Revenue Funds Debt Service Funds
Economic Development
Other Environmental
Special Revenue
Other Special Revenue
Total Special Revenue
FundsBond Security
and Redemption
Annual Appropriation
Bonds
2009 Annual Appropriation
Bonds
$ 34,686 $ — $ 1 $ 115,811 $ — $ — $ — — 1,146 22,675 78,370 8,241 — — — 79,211 77,298 434,671 — — — — — 2,885 25,817 — — — 58 769 2,006 6,260 3,950 2,707 828 — 44 3,573 3,850 — — — — — 94 19,369 — — —
— 3,024 2,130 11,382 — — — 34,744 84,195 110,663 695,530 12,191 2,707 828
34,815 — 53,689 88,505 — — — — — 2,129 8,354 — — — — — — — — — — — 58,798 — 346,778 — — — — — 24,060 24,060 — — — — — 10,280 105,895 — — — — — 171 171 — — — — — — — — — —
— — — 54,100 — — — — 246 235 20,568 — — —
— — — — 460,776 97,810 8,815 — — — — 252,532 61,409 58,180 — — — — 1,644 3,313 13 34,815 59,044 90,565 648,429 714,952 162,532 67,008
(71) 25,151 20,098 47,101 (702,761) (159,825) (66,180)
— — — — — — —
— — — — 393,441 623,320 —
— — — — (251,247) (483,770) —
— — — — (337,962) — — — — — — — (149,728) — — — — — 18,131 — — — 9,696 22,000 154,095 696,938 136,360 65,735 (2) (26,197) (1,799) (143,658) (379) — —
(2) (16,501) 20,201 10,437 518,922 126,182 65,735
(73) 8,650 40,300 57,538 (183,839) (33,644) (444)
103 73,180 143,775 466,859 189,456 33,763 1,640
— — (155) 669 — — —
$ 30 $ 81,830 $ 183,919 $ 525,067 $ 5,617 $ 119 $ 1,195
(Continued)
187
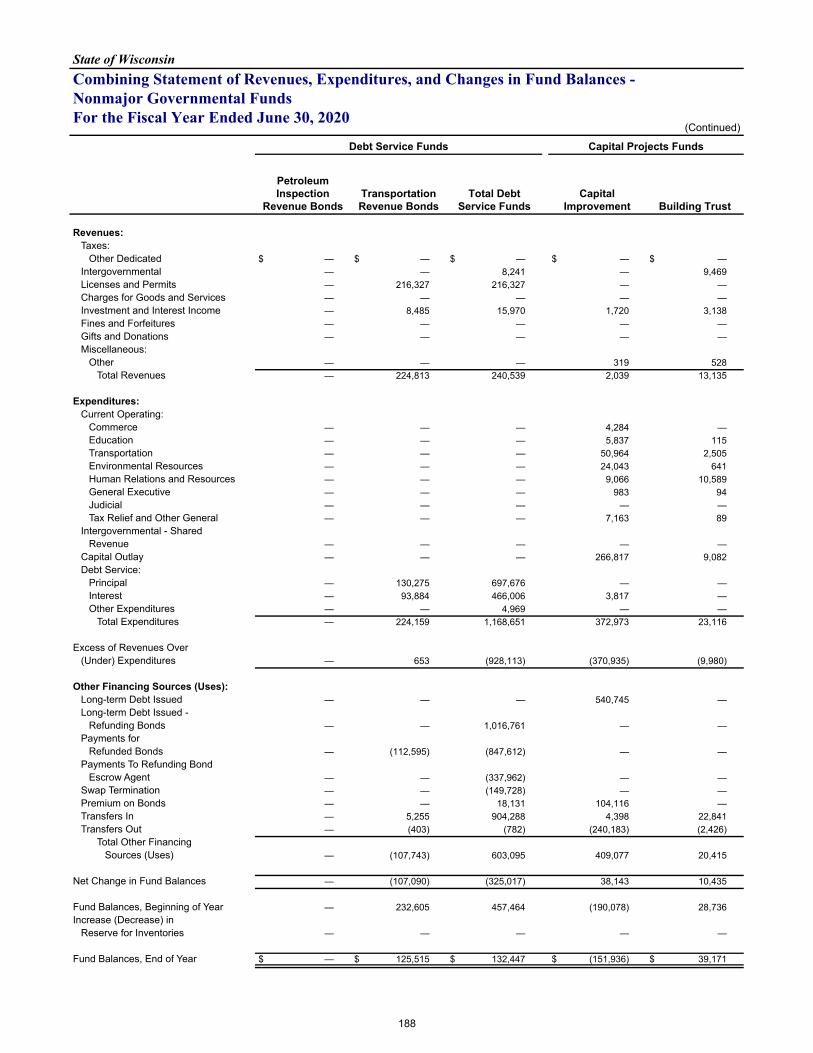
State of WisconsinCombining Statement of Revenues, Expenditures, and Changes in Fund Balances -Nonmajor Governmental FundsFor the Fiscal Year Ended June 30, 2020
(Continued)
Debt Service Funds Capital Projects Funds
Petroleum Inspection
Revenue BondsTransportation Revenue Bonds
Total Debt Service Funds
Capital Improvement Building Trust
Revenues:Taxes:
Other Dedicated $ — $ — $ — $ — $ — Intergovernmental — — 8,241 — 9,469 Licenses and Permits — 216,327 216,327 — — Charges for Goods and Services — — — — — Investment and Interest Income — 8,485 15,970 1,720 3,138 Fines and Forfeitures — — — — — Gifts and Donations — — — — — Miscellaneous:
Other — — — 319 528 Total Revenues — 224,813 240,539 2,039 13,135
Expenditures:Current Operating:
Commerce — — — 4,284 — Education — — — 5,837 115 Transportation — — — 50,964 2,505 Environmental Resources — — — 24,043 641 Human Relations and Resources — — — 9,066 10,589 General Executive — — — 983 94 Judicial — — — — — Tax Relief and Other General — — — 7,163 89
Intergovernmental - SharedRevenue — — — — —
Capital Outlay — — — 266,817 9,082 Debt Service:
Principal — 130,275 697,676 — — Interest — 93,884 466,006 3,817 — Other Expenditures — — 4,969 — —
Total Expenditures — 224,159 1,168,651 372,973 23,116
Excess of Revenues Over(Under) Expenditures — 653 (928,113) (370,935) (9,980)
Other Financing Sources (Uses):Long-term Debt Issued — — — 540,745 — Long-term Debt Issued -
Refunding Bonds — — 1,016,761 — — Payments for
Refunded Bonds — (112,595) (847,612) — — Payments To Refunding Bond
Escrow Agent — — (337,962) — — Swap Termination — — (149,728) — — Premium on Bonds — — 18,131 104,116 — Transfers In — 5,255 904,288 4,398 22,841 Transfers Out — (403) (782) (240,183) (2,426)
Total Other FinancingSources (Uses) — (107,743) 603,095 409,077 20,415
Net Change in Fund Balances — (107,090) (325,017) 38,143 10,435
Fund Balances, Beginning of Year — 232,605 457,464 (190,078) 28,736 Increase (Decrease) in
Reserve for Inventories — — — — —
Fund Balances, End of Year $ — $ 125,515 $ 132,447 $ (151,936) $ 39,171
188
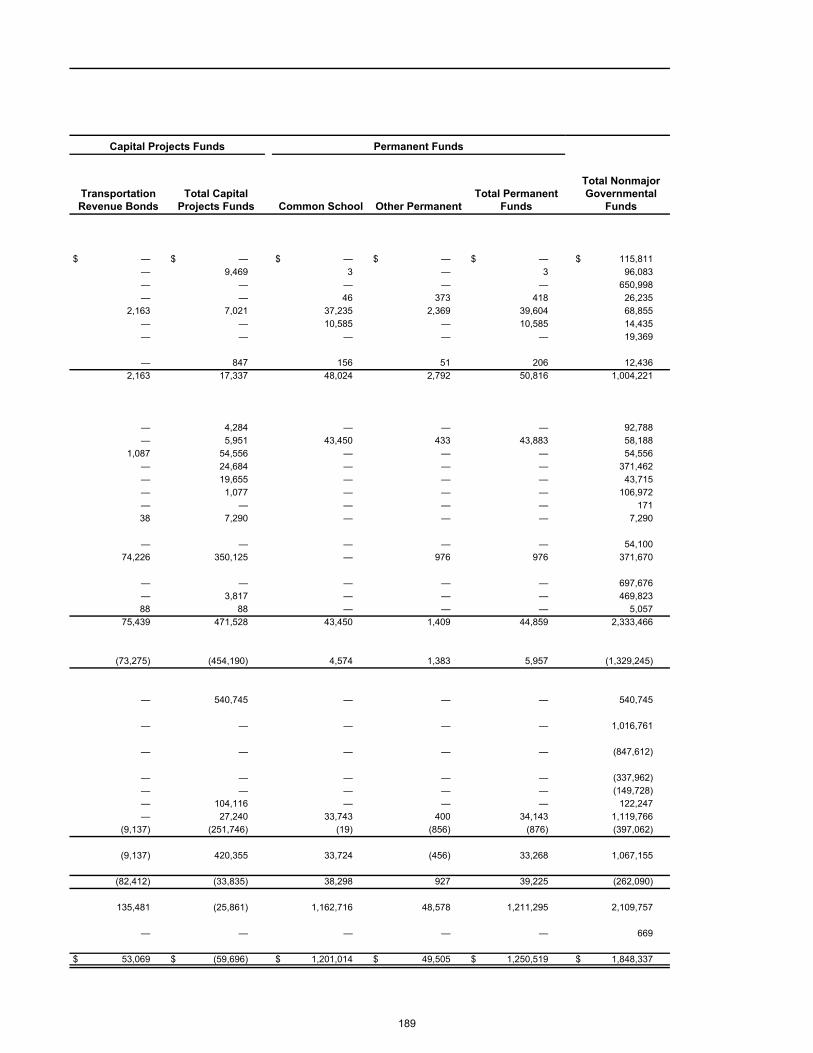
Capital Projects Funds Permanent Funds
Transportation Revenue Bonds
Total Capital Projects Funds Common School Other Permanent
Total Permanent Funds
Total Nonmajor Governmental
Funds
$ — $ — $ — $ — $ — $ 115,811 — 9,469 3 — 3 96,083 — — — — — 650,998 — — 46 373 418 26,235 2,163 7,021 37,235 2,369 39,604 68,855 — — 10,585 — 10,585 14,435 — — — — — 19,369
— 847 156 51 206 12,436 2,163 17,337 48,024 2,792 50,816 1,004,221
— 4,284 — — — 92,788 — 5,951 43,450 433 43,883 58,188 1,087 54,556 — — — 54,556 — 24,684 — — — 371,462 — 19,655 — — — 43,715 — 1,077 — — — 106,972 — — — — — 171 38 7,290 — — — 7,290
— — — — — 54,100 74,226 350,125 — 976 976 371,670
— — — — — 697,676 — 3,817 — — — 469,823 88 88 — — — 5,057 75,439 471,528 43,450 1,409 44,859 2,333,466
(73,275) (454,190) 4,574 1,383 5,957 (1,329,245)
— 540,745 — — — 540,745
— — — — — 1,016,761
— — — — — (847,612)
— — — — — (337,962) — — — — — (149,728) — 104,116 — — — 122,247 — 27,240 33,743 400 34,143 1,119,766 (9,137) (251,746) (19) (856) (876) (397,062)
(9,137) 420,355 33,724 (456) 33,268 1,067,155
(82,412) (33,835) 38,298 927 39,225 (262,090)
135,481 (25,861) 1,162,716 48,578 1,211,295 2,109,757
— — — — — 669
$ 53,069 $ (59,696) $ 1,201,014 $ 49,505 $ 1,250,519 $ 1,848,337
189
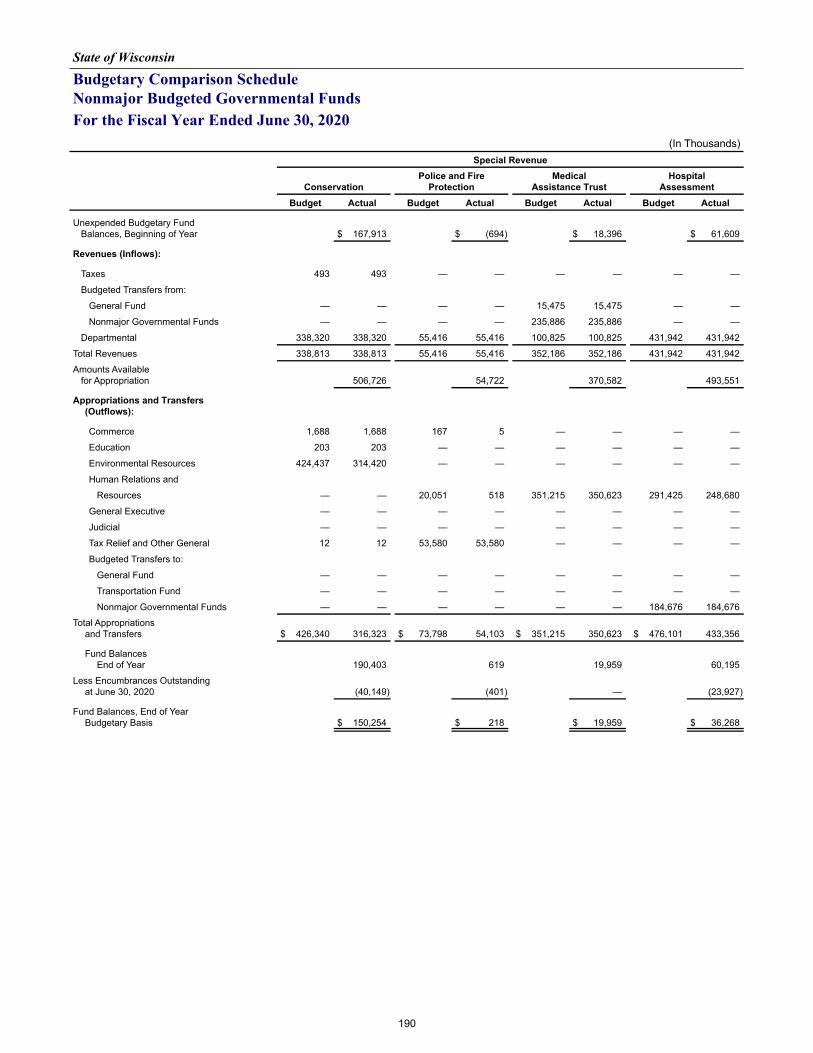
State of Wisconsin
Budgetary Comparison ScheduleNonmajor Budgeted Governmental FundsFor the Fiscal Year Ended June 30, 2020
(In Thousands)Special Revenue
ConservationPolice and Fire
ProtectionMedical
Assistance TrustHospital
AssessmentBudget Actual Budget Actual Budget Actual Budget Actual
Unexpended Budgetary Fund Balances, Beginning of Year $ 167,913 $ (694) $ 18,396 $ 61,609
Revenues (Inflows):
Taxes 493 493 — — — — — —
Budgeted Transfers from:
General Fund — — — — 15,475 15,475 — —
Nonmajor Governmental Funds — — — — 235,886 235,886 — —
Departmental 338,320 338,320 55,416 55,416 100,825 100,825 431,942 431,942
Total Revenues 338,813 338,813 55,416 55,416 352,186 352,186 431,942 431,942
Amounts Available for Appropriation 506,726 54,722 370,582 493,551
Appropriations and Transfers (Outflows):
Commerce 1,688 1,688 167 5 — — — —
Education 203 203 — — — — — —
Environmental Resources 424,437 314,420 — — — — — —
Human Relations and
Resources — — 20,051 518 351,215 350,623 291,425 248,680
General Executive — — — — — — — —
Judicial — — — — — — — —
Tax Relief and Other General 12 12 53,580 53,580 — — — —
Budgeted Transfers to:
General Fund — — — — — — — —
Transportation Fund — — — — — — — —
Nonmajor Governmental Funds — — — — — — 184,676 184,676
Total Appropriations and Transfers $ 426,340 316,323 $ 73,798 54,103 $ 351,215 350,623 $ 476,101 433,356
Fund BalancesEnd of Year 190,403 619 19,959 60,195
Less Encumbrances Outstanding at June 30, 2020 (40,149) (401) — (23,927)
Fund Balances, End of Year Budgetary Basis $ 150,254 $ 218 $ 19,959 $ 36,268
190
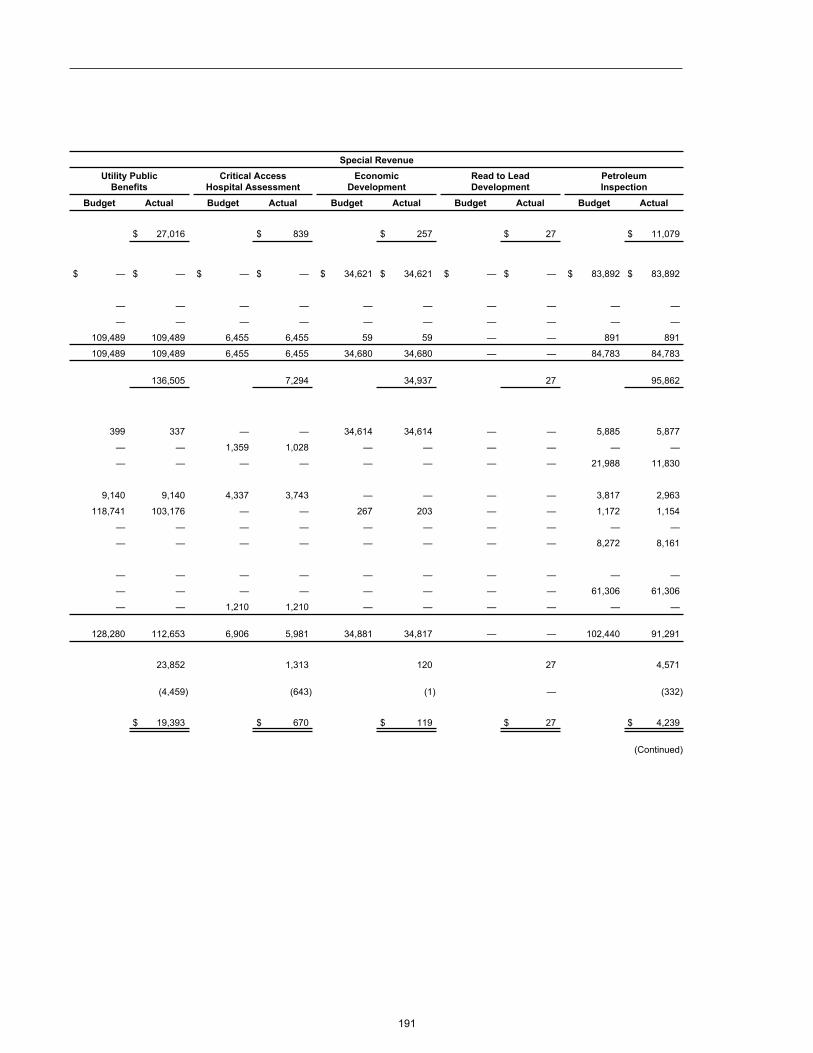
Special RevenueUtility Public
BenefitsCritical Access
Hospital AssessmentEconomic
DevelopmentRead to Lead Development
Petroleum Inspection
Budget Actual Budget Actual Budget Actual Budget Actual Budget Actual
$ 27,016 $ 839 $ 257 $ 27 $ 11,079
$ — $ — $ — $ — $ 34,621 $ 34,621 $ — $ — $ 83,892 $ 83,892
— — — — — — — — — —
— — — — — — — — — —
109,489 109,489 6,455 6,455 59 59 — — 891 891
109,489 109,489 6,455 6,455 34,680 34,680 — — 84,783 84,783
136,505 7,294 34,937 27 95,862
399 337 — — 34,614 34,614 — — 5,885 5,877
— — 1,359 1,028 — — — — — —
— — — — — — — — 21,988 11,830
9,140 9,140 4,337 3,743 — — — — 3,817 2,963
118,741 103,176 — — 267 203 — — 1,172 1,154
— — — — — — — — — —
— — — — — — — — 8,272 8,161
— — — — — — — — — —
— — — — — — — — 61,306 61,306
— — 1,210 1,210 — — — — — —
128,280 112,653 6,906 5,981 34,881 34,817 — — 102,440 91,291
23,852 1,313 120 27 4,571
(4,459) (643) (1) — (332)
$ 19,393 $ 670 $ 119 $ 27 $ 4,239
(Continued)
191
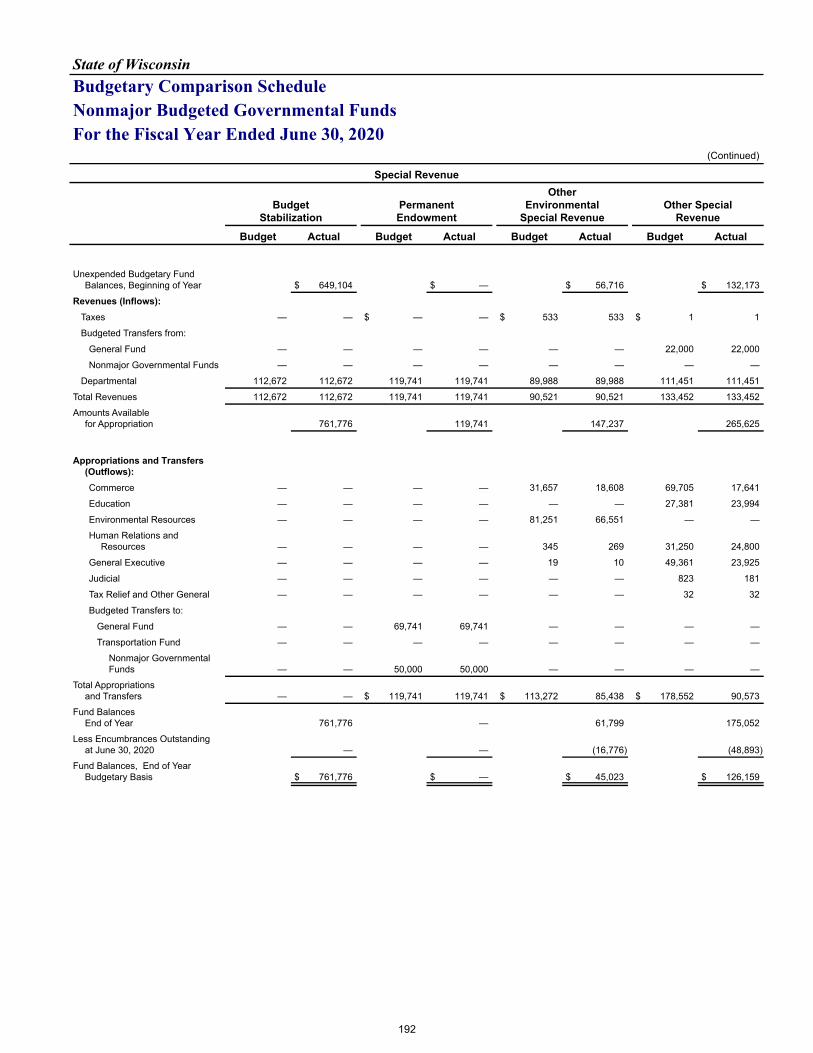
State of WisconsinBudgetary Comparison ScheduleNonmajor Budgeted Governmental FundsFor the Fiscal Year Ended June 30, 2020
(Continued)
Special Revenue
Budget Stabilization
Permanent Endowment
OtherEnvironmental
Special RevenueOther Special
Revenue
Budget Actual Budget Actual Budget Actual Budget Actual
Unexpended Budgetary Fund Balances, Beginning of Year $ 649,104 $ — $ 56,716 $ 132,173
Revenues (Inflows):Taxes — — $ — — $ 533 533 $ 1 1
Budgeted Transfers from:
General Fund — — — — — — 22,000 22,000
Nonmajor Governmental Funds — — — — — — — —
Departmental 112,672 112,672 119,741 119,741 89,988 89,988 111,451 111,451
Total Revenues 112,672 112,672 119,741 119,741 90,521 90,521 133,452 133,452
Amounts Available for Appropriation 761,776 119,741 147,237 265,625
Appropriations and Transfers (Outflows):Commerce — — — — 31,657 18,608 69,705 17,641
Education — — — — — — 27,381 23,994
Environmental Resources — — — — 81,251 66,551 — —
Human Relations and Resources — — — — 345 269 31,250 24,800
General Executive — — — — 19 10 49,361 23,925
Judicial — — — — — — 823 181
Tax Relief and Other General — — — — — — 32 32
Budgeted Transfers to:
General Fund — — 69,741 69,741 — — — —
Transportation Fund — — — — — — — —
Nonmajor Governmental Funds — — 50,000 50,000 — — — —
Total Appropriations and Transfers — — $ 119,741 119,741 $ 113,272 85,438 $ 178,552 90,573
Fund Balances End of Year 761,776 — 61,799 175,052
Less Encumbrances Outstanding at June 30, 2020 — — (16,776) (48,893)
Fund Balances, End of Year Budgetary Basis $ 761,776 $ — $ 45,023 $ 126,159
192
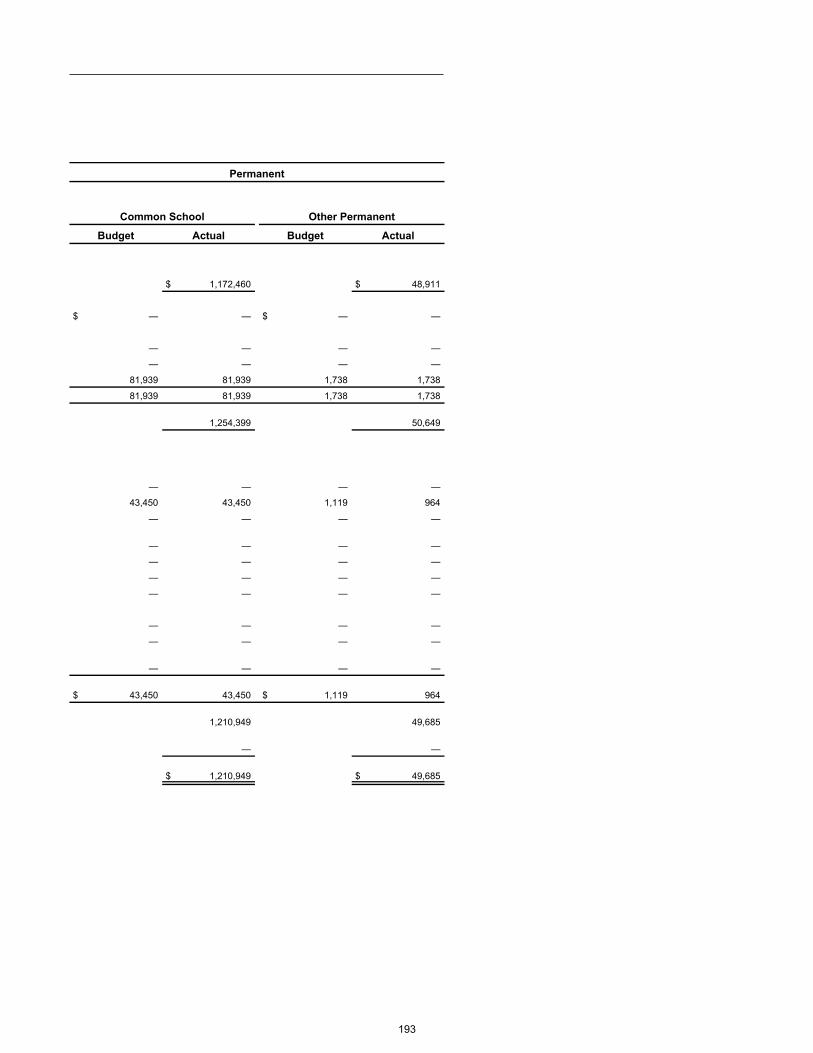
Permanent
Common School Other Permanent
Budget Actual Budget Actual
$ 1,172,460 $ 48,911
$ — — $ — —
— — — —
— — — —
81,939 81,939 1,738 1,738
81,939 81,939 1,738 1,738
1,254,399 50,649
— — — —
43,450 43,450 1,119 964
— — — —
— — — —
— — — —
— — — —
— — — —
— — — —
— — — —
— — — —
$ 43,450 43,450 $ 1,119 964
1,210,949 49,685
— —
$ 1,210,949 $ 49,685
193

194
State of Wisconsin
Nonmajor Enterprise Funds
ENTERPRISE: Enterprise funds account for business-like State activities that provide goods and/or services to the public and are financed primarily through user charges. The State's enterprise funds are described below:
The Injured Patients and Families Compensation Fund accounts for the program to provide excess medical malpractice insurance for Wisconsin health care providers. The revenues to finance this insurance are primarily derived from assessments charged to health care providers.
The Lottery Fund accounts for State managed lottery activities used to provide property tax relief to taxpayers. Revenues from ticket sales are used to pay winners, commissions to retailers, operating expenses and property tax relief.
The Income Continuation Insurance Fund accounts for long- term and short-term disability benefits for employees of the State and of participating local public employers and operates on a self- insured basis. Contributions and investment activity provide funding for the benefits.
The Duty Disability Fund accounts for the compensation of protective category employees of the Wisconsin Retirement System for duty-related disabilities, as well as the collection of contributions and investment activity providing funding for the benefits.
The Health Insurance Fund accounts for group health insurance plans provided on a self-insured, fee for service basis or prepaid basis to current employees of the State and of participating local public employers.
The State Retiree Health Insurance Fund accounts for the accumulation of premiums for group health insurance plans provided on a self-insured, fee for service basis or prepaid basis to retired employees of the State.
The Veterans Trust Fund accounts for various programs for veterans, including loans and grants to individuals and organizations and the operations of the State Veterans Museum. Revenues to finance this program are primarily derived from veteran loan payments and investment income.
The Veterans Mortgage Loan Repayment Fund accounts for the issuance and administration of veterans’ first mortgage loans. Funding sources are primarily derived from bond proceeds, mortgage payments, and investment income.
The Care and Treatment Facilities Funds, account for various resident facilities including:
• The Mendota Mental Health Institute Fund and the Winnebago Mental Health Institute Fund account for the diagnosis, care and treatment of individuals with mental and emotional disturbances. The services are provided with funds collected from third parties and contributions from the State.
• The Homes For Veterans Fund accounts for nursing home and assisted living facilities for veterans and their spouses.
The costs associated with providing this care are funded by private pay charges, the U.S. Department of Veterans Affairs and Medical Assistance.
• The Northern, Central, and Southern Developmental Disabilities Center Funds account for services provided to developmentally disabled citizens with the goal of ultimately returning such persons to the community if possible. These services are provided with funds collected from third parties and contributions from the State.
The Other Enterprise Funds account for the following programs:
• The State Fair Park Fund accounts for the annual State Fair, and various year round major sports events, agricultural and industrial expositions, and other programs of civic interest. Its revenues are derived from admissions, fees, rents and sales, with no contributions from the State.
• The Institutional Farm Operations Fund accounts for the revenues and expenses associated with employing inmates in agricultural and other work activities. The associated costs are funded from farm product sales and a General Fund supplement.
• The Correctional Canteen Operations Fund accounts for the program which provides goods for the education, recreation, and convenience of inmates. Charges made to inmates are the primary source of funds for these activities.
• The Local Government Property Insurance Fund accounts for property insurance coverage provided to local governments. This insurance is financed with premiums collected from policyholders and income on investments.
• The State Life Insurance Fund accounts for the program to provide State sponsored life insurance to residents in a manner consistent with private insurers. This insurance is financed with premiums collected from policyholders and investment earnings.
• The Transportation Infrastructure Loan Fund accounts for the development of innovative financing mechanisms that will more effectively use federal financial transportation resources. Federal Highway Administration funds, and interest from the fund balance and from loan recipients, are the primary revenues for this fund.
195
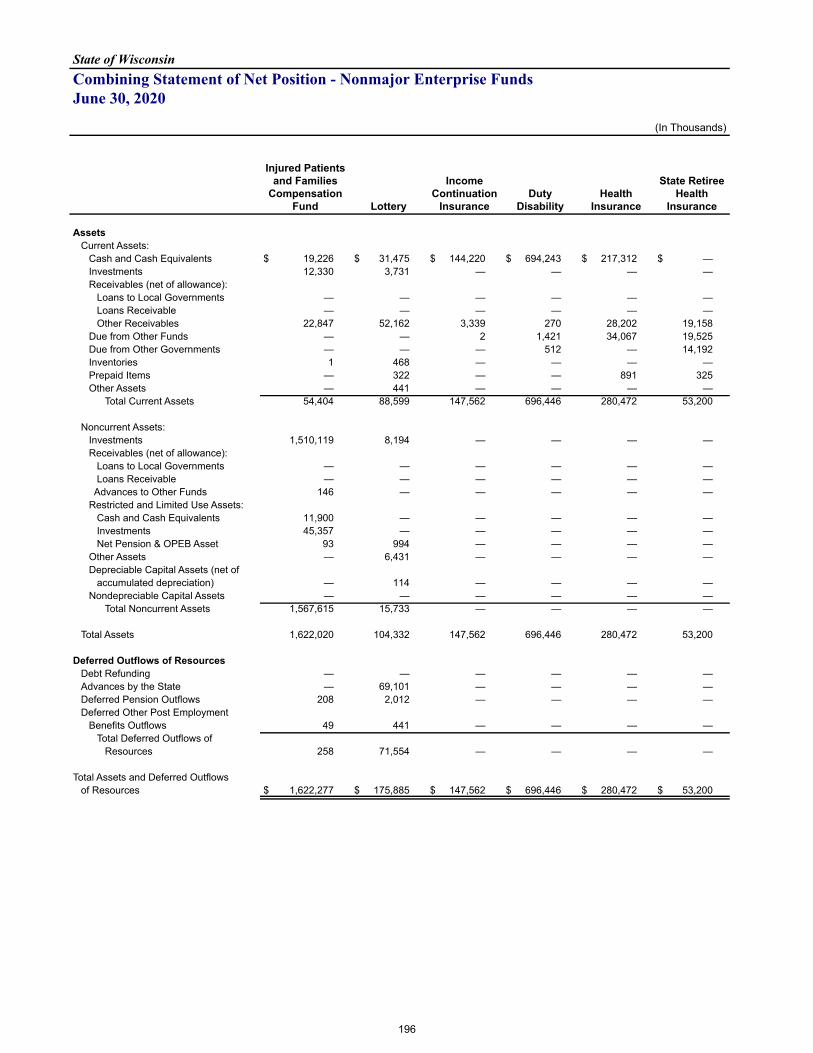
State of WisconsinCombining Statement of Net Position - Nonmajor Enterprise FundsJune 30, 2020
(In Thousands)
Injured Patients and Families
Compensation Fund Lottery
Income Continuation
InsuranceDuty
DisabilityHealth
Insurance
State Retiree Health
Insurance
AssetsCurrent Assets:
Cash and Cash Equivalents $ 19,226 $ 31,475 $ 144,220 $ 694,243 $ 217,312 $ — Investments 12,330 3,731 — — — — Receivables (net of allowance):
Loans to Local Governments — — — — — — Loans Receivable — — — — — — Other Receivables 22,847 52,162 3,339 270 28,202 19,158
Due from Other Funds — — 2 1,421 34,067 19,525 Due from Other Governments — — — 512 — 14,192 Inventories 1 468 — — — — Prepaid Items — 322 — — 891 325 Other Assets — 441 — — — —
Total Current Assets 54,404 88,599 147,562 696,446 280,472 53,200
Noncurrent Assets:Investments 1,510,119 8,194 — — — — Receivables (net of allowance):
Loans to Local Governments — — — — — — Loans Receivable — — — — — —
Advances to Other Funds 146 — — — — — Restricted and Limited Use Assets:
Cash and Cash Equivalents 11,900 — — — — — Investments 45,357 — — — — — Net Pension & OPEB Asset 93 994 — — — —
Other Assets — 6,431 — — — — Depreciable Capital Assets (net of
accumulated depreciation) — 114 — — — — Nondepreciable Capital Assets — — — — — —
Total Noncurrent Assets 1,567,615 15,733 — — — —
Total Assets 1,622,020 104,332 147,562 696,446 280,472 53,200
Deferred Outflows of ResourcesDebt Refunding — — — — — — Advances by the State — 69,101 — — — — Deferred Pension Outflows 208 2,012 — — — — Deferred Other Post Employment
Benefits Outflows 49 441 — — — — Total Deferred Outflows of
Resources 258 71,554 — — — —
Total Assets and Deferred Outflowsof Resources $ 1,622,277 $ 175,885 $ 147,562 $ 696,446 $ 280,472 $ 53,200
196
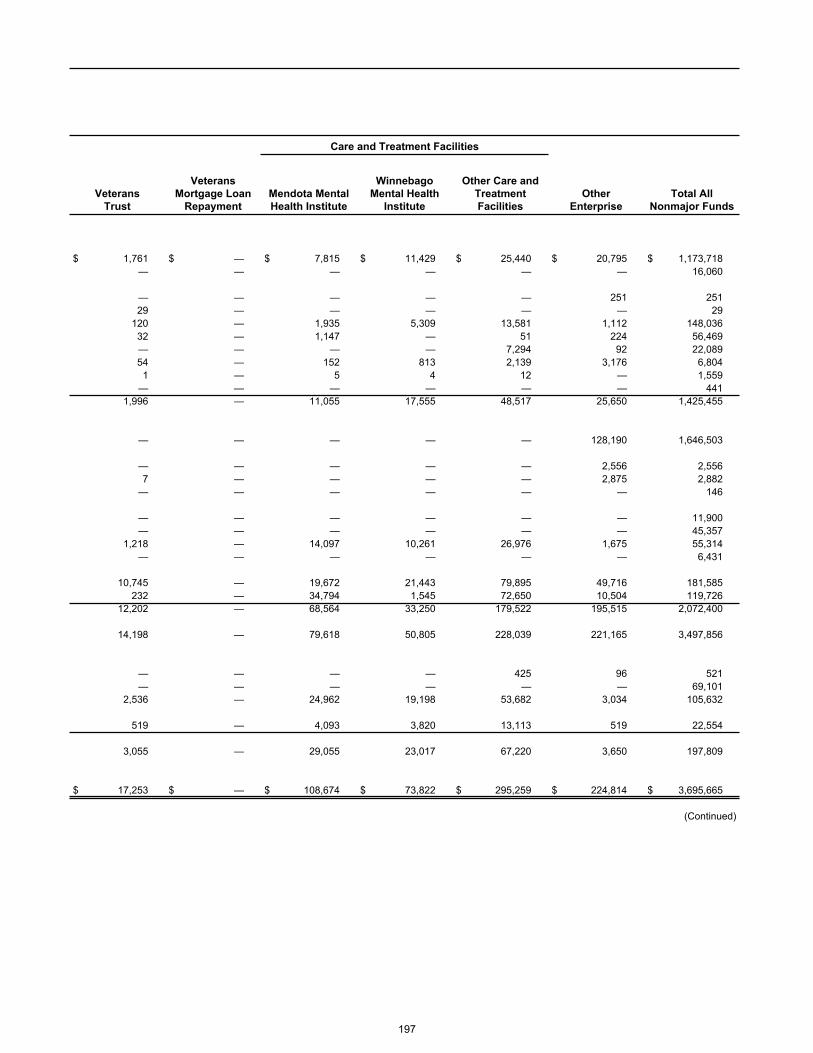
Care and Treatment Facilities
VeteransTrust
Veterans Mortgage Loan
RepaymentMendota Mental Health Institute
Winnebago Mental Health
Institute
Other Care and Treatment Facilities
OtherEnterprise
Total All Nonmajor Funds
$ 1,761 $ — $ 7,815 $ 11,429 $ 25,440 $ 20,795 $ 1,173,718 — — — — — — 16,060
— — — — — 251 251 29 — — — — — 29 120 — 1,935 5,309 13,581 1,112 148,036 32 — 1,147 — 51 224 56,469 — — — — 7,294 92 22,089 54 — 152 813 2,139 3,176 6,804 1 — 5 4 12 — 1,559 — — — — — — 441 1,996 — 11,055 17,555 48,517 25,650 1,425,455
— — — — — 128,190 1,646,503
— — — — — 2,556 2,556 7 — — — — 2,875 2,882 — — — — — — 146
— — — — — — 11,900 — — — — — — 45,357 1,218 — 14,097 10,261 26,976 1,675 55,314 — — — — — — 6,431
10,745 — 19,672 21,443 79,895 49,716 181,585 232 — 34,794 1,545 72,650 10,504 119,726 12,202 — 68,564 33,250 179,522 195,515 2,072,400
14,198 — 79,618 50,805 228,039 221,165 3,497,856
— — — — 425 96 521 — — — — — — 69,101 2,536 — 24,962 19,198 53,682 3,034 105,632
519 — 4,093 3,820 13,113 519 22,554
3,055 — 29,055 23,017 67,220 3,650 197,809
$ 17,253 $ — $ 108,674 $ 73,822 $ 295,259 $ 224,814 $ 3,695,665
(Continued)
197
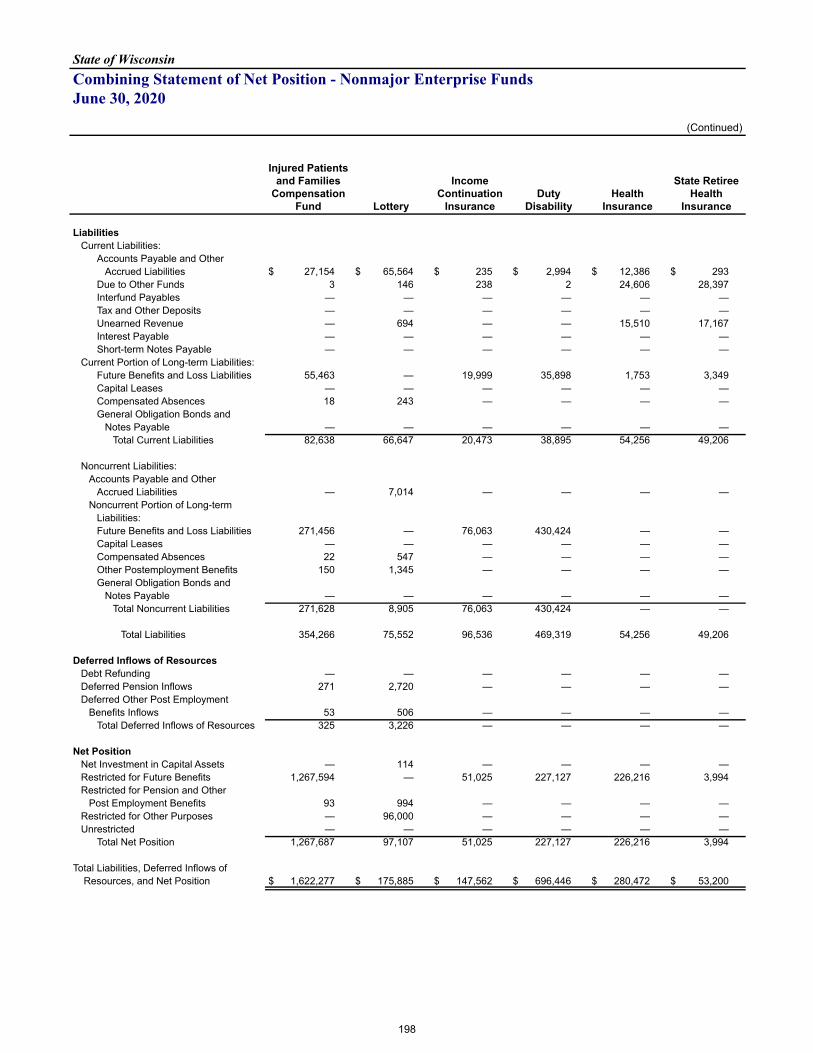
State of WisconsinCombining Statement of Net Position - Nonmajor Enterprise FundsJune 30, 2020
(Continued)
Injured Patients and Families
Compensation Fund Lottery
Income Continuation
InsuranceDuty
DisabilityHealth
Insurance
State Retiree Health
Insurance
LiabilitiesCurrent Liabilities:
Accounts Payable and OtherAccrued Liabilities $ 27,154 $ 65,564 $ 235 $ 2,994 $ 12,386 $ 293
Due to Other Funds 3 146 238 2 24,606 28,397 Interfund Payables — — — — — — Tax and Other Deposits — — — — — — Unearned Revenue — 694 — — 15,510 17,167 Interest Payable — — — — — — Short-term Notes Payable — — — — — —
Current Portion of Long-term Liabilities:Future Benefits and Loss Liabilities 55,463 — 19,999 35,898 1,753 3,349 Capital Leases — — — — — — Compensated Absences 18 243 — — — — General Obligation Bonds and
Notes Payable — — — — — — Total Current Liabilities 82,638 66,647 20,473 38,895 54,256 49,206
Noncurrent Liabilities:Accounts Payable and Other
Accrued Liabilities — 7,014 — — — — Noncurrent Portion of Long-term
Liabilities:Future Benefits and Loss Liabilities 271,456 — 76,063 430,424 — — Capital Leases — — — — — — Compensated Absences 22 547 — — — — Other Postemployment Benefits 150 1,345 — — — — General Obligation Bonds and
Notes Payable — — — — — — Total Noncurrent Liabilities 271,628 8,905 76,063 430,424 — —
Total Liabilities 354,266 75,552 96,536 469,319 54,256 49,206
Deferred Inflows of ResourcesDebt Refunding — — — — — — Deferred Pension Inflows 271 2,720 — — — — Deferred Other Post Employment
Benefits Inflows 53 506 — — — — Total Deferred Inflows of Resources 325 3,226 — — — —
Net PositionNet Investment in Capital Assets — 114 — — — — Restricted for Future Benefits 1,267,594 — 51,025 227,127 226,216 3,994 Restricted for Pension and Other
Post Employment Benefits 93 994 — — — — Restricted for Other Purposes — 96,000 — — — — Unrestricted — — — — — —
Total Net Position 1,267,687 97,107 51,025 227,127 226,216 3,994
Total Liabilities, Deferred Inflows of Resources, and Net Position $ 1,622,277 $ 175,885 $ 147,562 $ 696,446 $ 280,472 $ 53,200
198
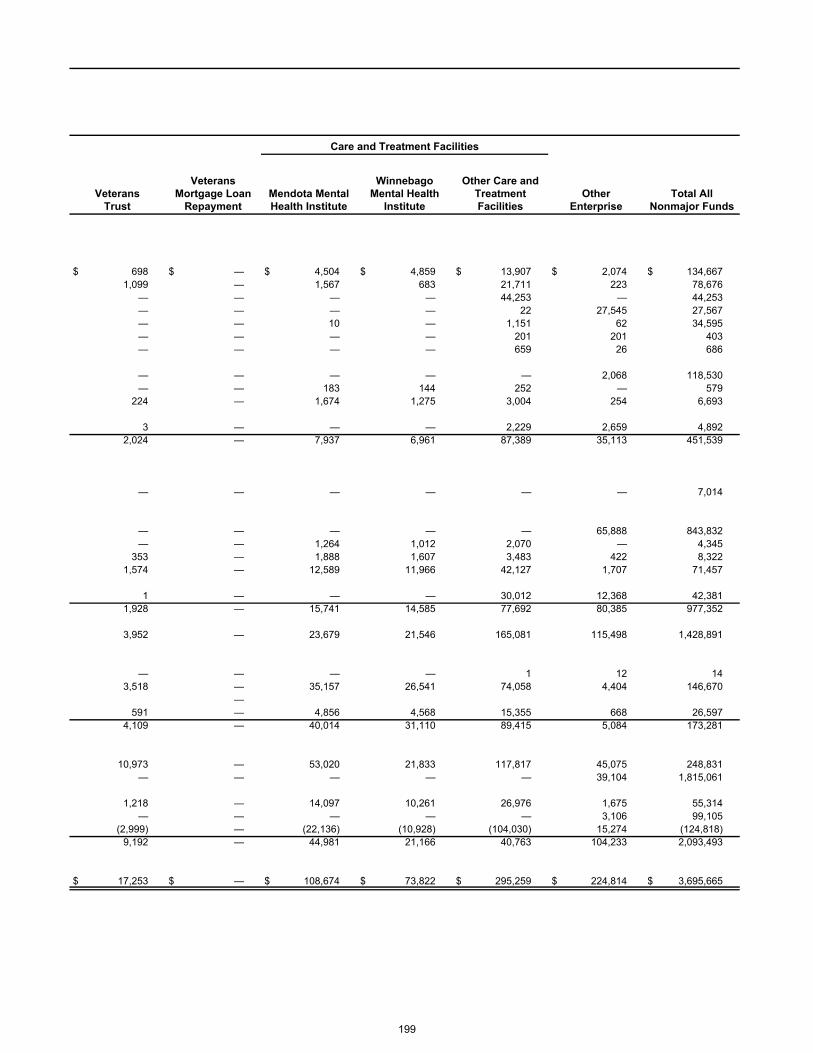
Care and Treatment Facilities
VeteransTrust
Veterans Mortgage Loan
RepaymentMendota Mental Health Institute
Winnebago Mental Health
Institute
Other Care and Treatment Facilities
OtherEnterprise
Total All Nonmajor Funds
$ 698 $ — $ 4,504 $ 4,859 $ 13,907 $ 2,074 $ 134,667 1,099 — 1,567 683 21,711 223 78,676 — — — — 44,253 — 44,253 — — — — 22 27,545 27,567 — — 10 — 1,151 62 34,595 — — — — 201 201 403 — — — — 659 26 686
— — — — — 2,068 118,530 — — 183 144 252 — 579 224 — 1,674 1,275 3,004 254 6,693
3 — — — 2,229 2,659 4,892 2,024 — 7,937 6,961 87,389 35,113 451,539
— — — — — — 7,014
— — — — — 65,888 843,832 — — 1,264 1,012 2,070 — 4,345 353 — 1,888 1,607 3,483 422 8,322 1,574 — 12,589 11,966 42,127 1,707 71,457
1 — — — 30,012 12,368 42,381 1,928 — 15,741 14,585 77,692 80,385 977,352
3,952 — 23,679 21,546 165,081 115,498 1,428,891
— — — — 1 12 14 3,518 — 35,157 26,541 74,058 4,404 146,670
— 591 — 4,856 4,568 15,355 668 26,597 4,109 — 40,014 31,110 89,415 5,084 173,281
10,973 — 53,020 21,833 117,817 45,075 248,831 — — — — — 39,104 1,815,061
1,218 — 14,097 10,261 26,976 1,675 55,314 — — — — — 3,106 99,105 (2,999) — (22,136) (10,928) (104,030) 15,274 (124,818) 9,192 — 44,981 21,166 40,763 104,233 2,093,493
$ 17,253 $ — $ 108,674 $ 73,822 $ 295,259 $ 224,814 $ 3,695,665
199
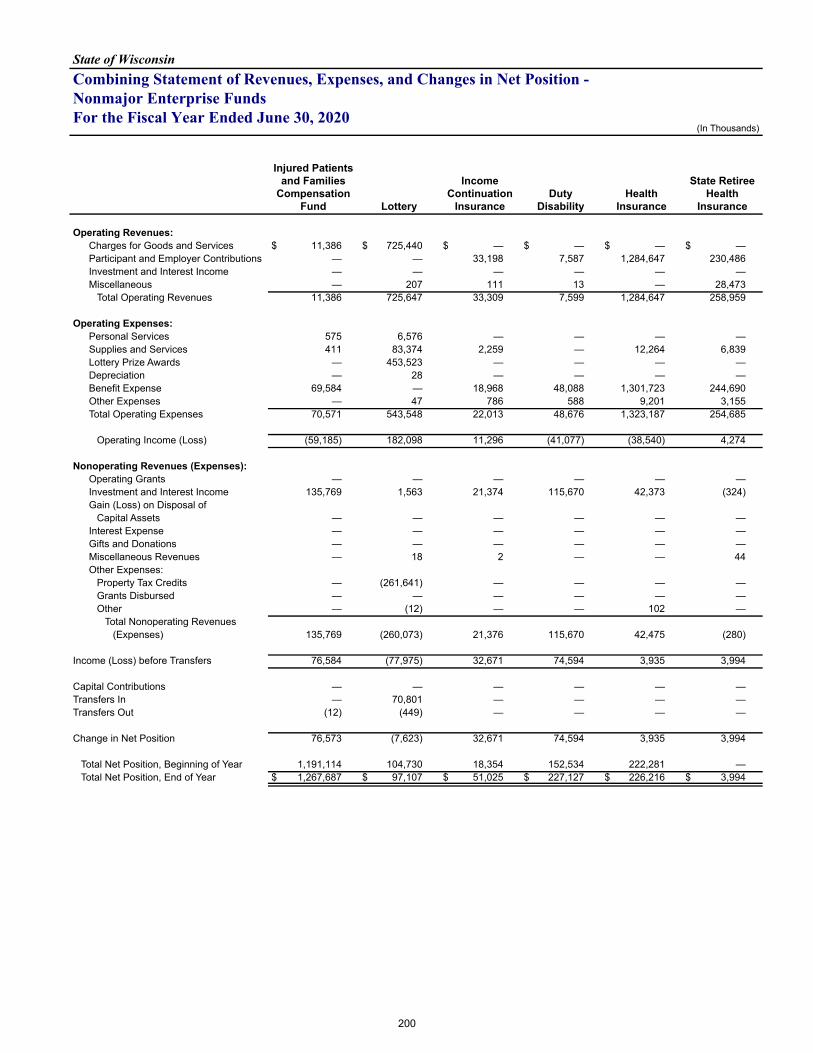
State of WisconsinCombining Statement of Revenues, Expenses, and Changes in Net Position - Nonmajor Enterprise FundsFor the Fiscal Year Ended June 30, 2020
(In Thousands)
Injured Patients and Families
Compensation Fund Lottery
Income Continuation
InsuranceDuty
DisabilityHealth
Insurance
State Retiree Health
Insurance
Operating Revenues:Charges for Goods and Services $ 11,386 $ 725,440 $ — $ — $ — $ — Participant and Employer Contributions — — 33,198 7,587 1,284,647 230,486 Investment and Interest Income — — — — — — Miscellaneous — 207 111 13 — 28,473
Total Operating Revenues 11,386 725,647 33,309 7,599 1,284,647 258,959
Operating Expenses:Personal Services 575 6,576 — — — — Supplies and Services 411 83,374 2,259 — 12,264 6,839 Lottery Prize Awards — 453,523 — — — — Depreciation — 28 — — — — Benefit Expense 69,584 — 18,968 48,088 1,301,723 244,690 Other Expenses — 47 786 588 9,201 3,155 Total Operating Expenses 70,571 543,548 22,013 48,676 1,323,187 254,685
Operating Income (Loss) (59,185) 182,098 11,296 (41,077) (38,540) 4,274
Nonoperating Revenues (Expenses):Operating Grants — — — — — — Investment and Interest Income 135,769 1,563 21,374 115,670 42,373 (324) Gain (Loss) on Disposal of
Capital Assets — — — — — — Interest Expense — — — — — — Gifts and Donations — — — — — — Miscellaneous Revenues — 18 2 — — 44 Other Expenses:
Property Tax Credits — (261,641) — — — — Grants Disbursed — — — — — — Other — (12) — — 102 —
Total Nonoperating Revenues (Expenses) 135,769 (260,073) 21,376 115,670 42,475 (280)
Income (Loss) before Transfers 76,584 (77,975) 32,671 74,594 3,935 3,994
Capital Contributions — — — — — — Transfers In — 70,801 — — — — Transfers Out (12) (449) — — — —
Change in Net Position 76,573 (7,623) 32,671 74,594 3,935 3,994
Total Net Position, Beginning of Year 1,191,114 104,730 18,354 152,534 222,281 — Total Net Position, End of Year $ 1,267,687 $ 97,107 $ 51,025 $ 227,127 $ 226,216 $ 3,994
200
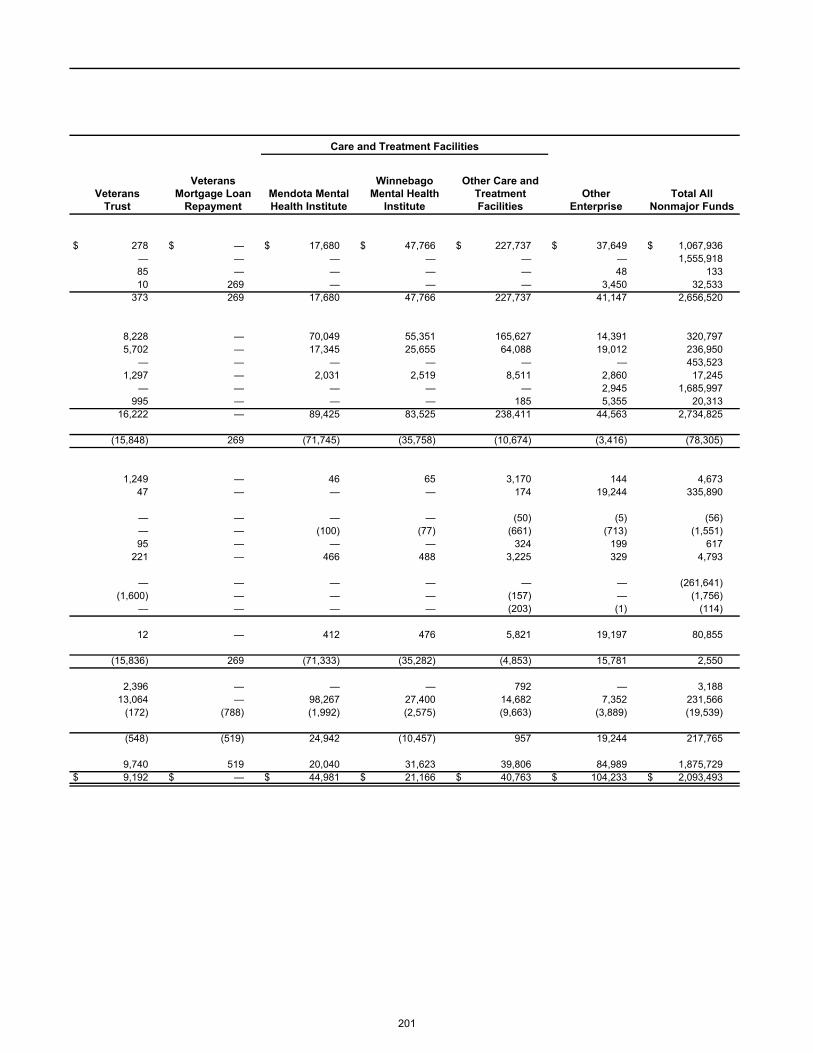
Care and Treatment Facilities
VeteransTrust
Veterans Mortgage Loan
RepaymentMendota Mental Health Institute
Winnebago Mental Health
Institute
Other Care and Treatment Facilities
OtherEnterprise
Total All Nonmajor Funds
$ 278 $ — $ 17,680 $ 47,766 $ 227,737 $ 37,649 $ 1,067,936 — — — — — — 1,555,918 85 — — — — 48 133 10 269 — — — 3,450 32,533 373 269 17,680 47,766 227,737 41,147 2,656,520
8,228 — 70,049 55,351 165,627 14,391 320,797 5,702 — 17,345 25,655 64,088 19,012 236,950 — — — — — — 453,523 1,297 — 2,031 2,519 8,511 2,860 17,245 — — — — — 2,945 1,685,997 995 — — — 185 5,355 20,313 16,222 — 89,425 83,525 238,411 44,563 2,734,825
(15,848) 269 (71,745) (35,758) (10,674) (3,416) (78,305)
1,249 — 46 65 3,170 144 4,673 47 — — — 174 19,244 335,890
— — — — (50) (5) (56) — — (100) (77) (661) (713) (1,551) 95 — — — 324 199 617 221 — 466 488 3,225 329 4,793
— — — — — — (261,641) (1,600) — — — (157) — (1,756) — — — — (203) (1) (114)
12 — 412 476 5,821 19,197 80,855
(15,836) 269 (71,333) (35,282) (4,853) 15,781 2,550
2,396 — — — 792 — 3,188 13,064 — 98,267 27,400 14,682 7,352 231,566 (172) (788) (1,992) (2,575) (9,663) (3,889) (19,539)
(548) (519) 24,942 (10,457) 957 19,244 217,765
9,740 519 20,040 31,623 39,806 84,989 1,875,729 $ 9,192 $ — $ 44,981 $ 21,166 $ 40,763 $ 104,233 $ 2,093,493
201
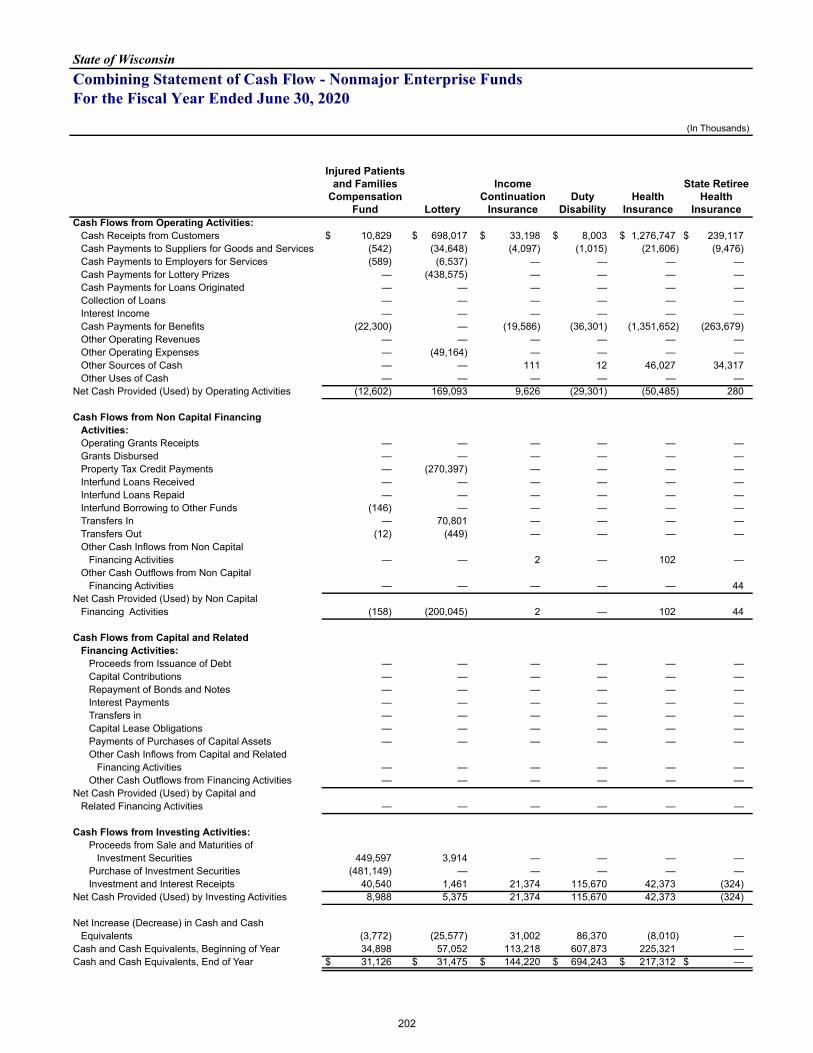
State of WisconsinCombining Statement of Cash Flow - Nonmajor Enterprise FundsFor the Fiscal Year Ended June 30, 2020
(In Thousands)
Injured Patients and Families
Compensation Fund Lottery
Income Continuation
InsuranceDuty
DisabilityHealth
Insurance
State Retiree Health
InsuranceCash Flows from Operating Activities:
Cash Receipts from Customers $ 10,829 $ 698,017 $ 33,198 $ 8,003 $ 1,276,747 $ 239,117 Cash Payments to Suppliers for Goods and Services (542) (34,648) (4,097) (1,015) (21,606) (9,476) Cash Payments to Employers for Services (589) (6,537) — — — — Cash Payments for Lottery Prizes — (438,575) — — — — Cash Payments for Loans Originated — — — — — — Collection of Loans — — — — — — Interest Income — — — — — — Cash Payments for Benefits (22,300) — (19,586) (36,301) (1,351,652) (263,679) Other Operating Revenues — — — — — — Other Operating Expenses — (49,164) — — — — Other Sources of Cash — — 111 12 46,027 34,317 Other Uses of Cash — — — — — —
Net Cash Provided (Used) by Operating Activities (12,602) 169,093 9,626 (29,301) (50,485) 280
Cash Flows from Non Capital FinancingActivities:Operating Grants Receipts — — — — — — Grants Disbursed — — — — — — Property Tax Credit Payments — (270,397) — — — — Interfund Loans Received — — — — — — Interfund Loans Repaid — — — — — — Interfund Borrowing to Other Funds (146) — — — — — Transfers In — 70,801 — — — — Transfers Out (12) (449) — — — — Other Cash Inflows from Non Capital
Financing Activities — — 2 — 102 — Other Cash Outflows from Non Capital
Financing Activities — — — — — 44 Net Cash Provided (Used) by Non Capital
Financing Activities (158) (200,045) 2 — 102 44
Cash Flows from Capital and RelatedFinancing Activities:
Proceeds from Issuance of Debt — — — — — — Capital Contributions — — — — — — Repayment of Bonds and Notes — — — — — — Interest Payments — — — — — — Transfers in — — — — — — Capital Lease Obligations — — — — — — Payments of Purchases of Capital Assets — — — — — — Other Cash Inflows from Capital and Related
Financing Activities — — — — — — Other Cash Outflows from Financing Activities — — — — — —
Net Cash Provided (Used) by Capital andRelated Financing Activities — — — — — —
Cash Flows from Investing Activities:Proceeds from Sale and Maturities of
Investment Securities 449,597 3,914 — — — — Purchase of Investment Securities (481,149) — — — — — Investment and Interest Receipts 40,540 1,461 21,374 115,670 42,373 (324)
Net Cash Provided (Used) by Investing Activities 8,988 5,375 21,374 115,670 42,373 (324)
Net Increase (Decrease) in Cash and CashEquivalents (3,772) (25,577) 31,002 86,370 (8,010) —
Cash and Cash Equivalents, Beginning of Year 34,898 57,052 113,218 607,873 225,321 — Cash and Cash Equivalents, End of Year $ 31,126 $ 31,475 $ 144,220 $ 694,243 $ 217,312 $ —
202
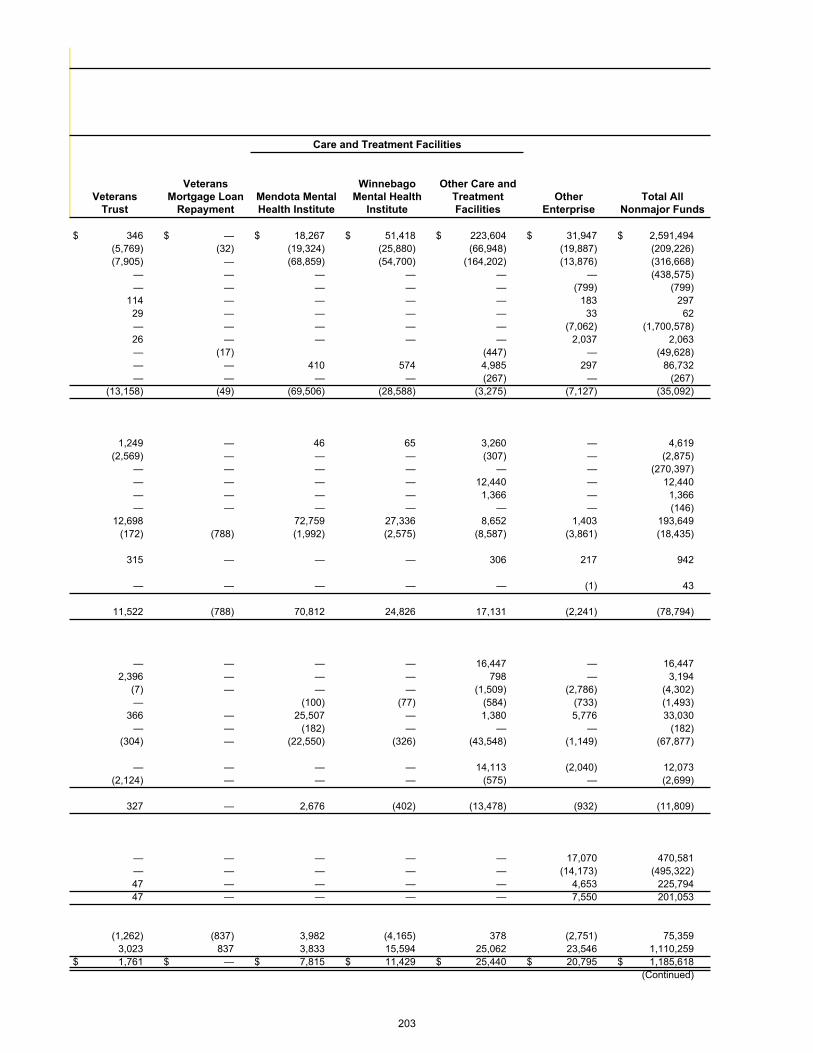
Care and Treatment Facilities
VeteransTrust
Veterans Mortgage Loan
RepaymentMendota Mental Health Institute
Winnebago Mental Health
Institute
Other Care and Treatment Facilities
OtherEnterprise
Total All Nonmajor Funds
$ 346 $ — $ 18,267 $ 51,418 $ 223,604 $ 31,947 $ 2,591,494 (5,769) (32) (19,324) (25,880) (66,948) (19,887) (209,226) (7,905) — (68,859) (54,700) (164,202) (13,876) (316,668) — — — — — — (438,575) — — — — — (799) (799) 114 — — — — 183 297 29 — — — — 33 62 — — — — — (7,062) (1,700,578) 26 — — — — 2,037 2,063 — (17) (447) — (49,628) — — 410 574 4,985 297 86,732 — — — — (267) — (267) (13,158) (49) (69,506) (28,588) (3,275) (7,127) (35,092)
1,249 — 46 65 3,260 — 4,619 (2,569) — — — (307) — (2,875) — — — — — — (270,397) — — — — 12,440 — 12,440 — — — — 1,366 — 1,366 — — — — — — (146) 12,698 72,759 27,336 8,652 1,403 193,649 (172) (788) (1,992) (2,575) (8,587) (3,861) (18,435)
315 — — — 306 217 942
— — — — — (1) 43
11,522 (788) 70,812 24,826 17,131 (2,241) (78,794)
— — — — 16,447 — 16,447 2,396 — — — 798 — 3,194 (7) — — — (1,509) (2,786) (4,302) — (100) (77) (584) (733) (1,493) 366 — 25,507 — 1,380 5,776 33,030 — — (182) — — — (182) (304) — (22,550) (326) (43,548) (1,149) (67,877)
— — — — 14,113 (2,040) 12,073 (2,124) — — — (575) — (2,699)
327 — 2,676 (402) (13,478) (932) (11,809)
— — — — — 17,070 470,581 — — — — — (14,173) (495,322) 47 — — — — 4,653 225,794 47 — — — — 7,550 201,053
(1,262) (837) 3,982 (4,165) 378 (2,751) 75,359 3,023 837 3,833 15,594 25,062 23,546 1,110,259 $ 1,761 $ — $ 7,815 $ 11,429 $ 25,440 $ 20,795 $ 1,185,618
(Continued)
203
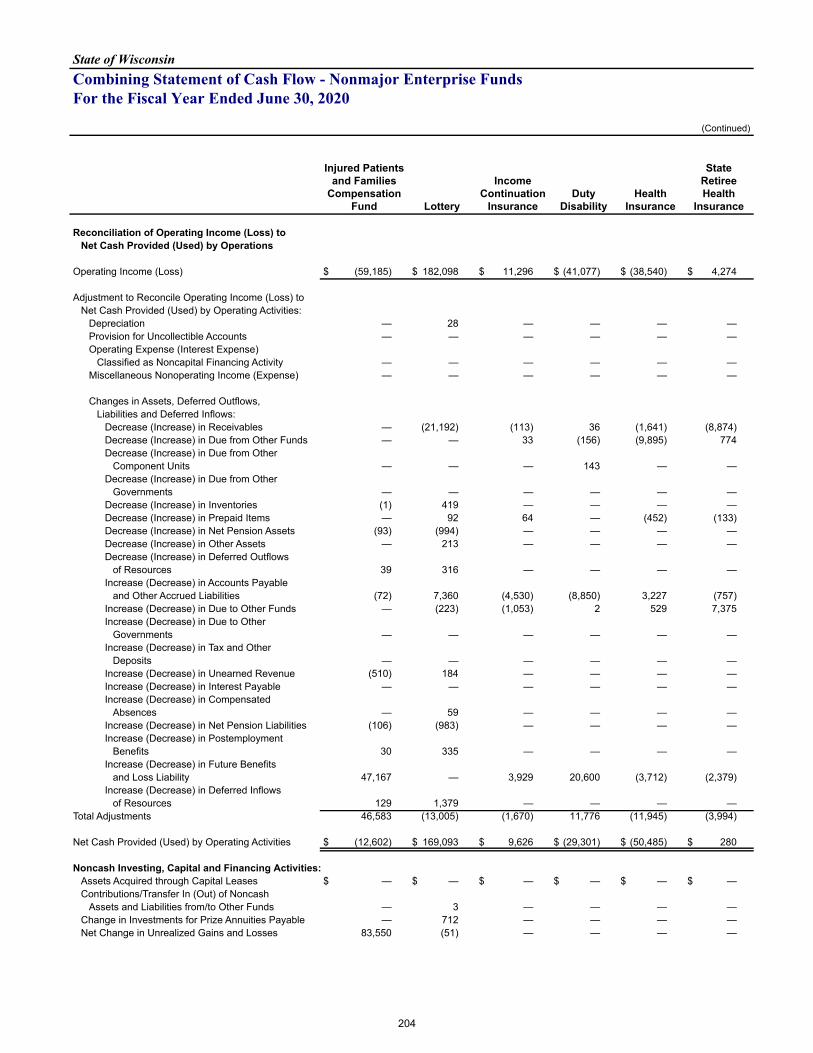
State of WisconsinCombining Statement of Cash Flow - Nonmajor Enterprise FundsFor the Fiscal Year Ended June 30, 2020
(Continued)
Injured Patients and Families
Compensation Fund Lottery
Income Continuation
InsuranceDuty
DisabilityHealth
Insurance
State Retiree Health
Insurance
Reconciliation of Operating Income (Loss) toNet Cash Provided (Used) by Operations
Operating Income (Loss) $ (59,185) $ 182,098 $ 11,296 $ (41,077) $ (38,540) $ 4,274
Adjustment to Reconcile Operating Income (Loss) toNet Cash Provided (Used) by Operating Activities:
Depreciation — 28 — — — — Provision for Uncollectible Accounts — — — — — — Operating Expense (Interest Expense)
Classified as Noncapital Financing Activity — — — — — — Miscellaneous Nonoperating Income (Expense) — — — — — —
Changes in Assets, Deferred Outflows, Liabilities and Deferred Inflows:
Decrease (Increase) in Receivables — (21,192) (113) 36 (1,641) (8,874) Decrease (Increase) in Due from Other Funds — — 33 (156) (9,895) 774 Decrease (Increase) in Due from Other
Component Units — — — 143 — — Decrease (Increase) in Due from Other
Governments — — — — — — Decrease (Increase) in Inventories (1) 419 — — — — Decrease (Increase) in Prepaid Items — 92 64 — (452) (133) Decrease (Increase) in Net Pension Assets (93) (994) — — — — Decrease (Increase) in Other Assets — 213 — — — — Decrease (Increase) in Deferred Outflows
of Resources 39 316 — — — — Increase (Decrease) in Accounts Payable
and Other Accrued Liabilities (72) 7,360 (4,530) (8,850) 3,227 (757) Increase (Decrease) in Due to Other Funds — (223) (1,053) 2 529 7,375 Increase (Decrease) in Due to Other
Governments — — — — — — Increase (Decrease) in Tax and Other
Deposits — — — — — — Increase (Decrease) in Unearned Revenue (510) 184 — — — — Increase (Decrease) in Interest Payable — — — — — — Increase (Decrease) in Compensated
Absences — 59 — — — — Increase (Decrease) in Net Pension Liabilities (106) (983) — — — — Increase (Decrease) in Postemployment
Benefits 30 335 — — — — Increase (Decrease) in Future Benefits
and Loss Liability 47,167 — 3,929 20,600 (3,712) (2,379) Increase (Decrease) in Deferred Inflows
of Resources 129 1,379 — — — — Total Adjustments 46,583 (13,005) (1,670) 11,776 (11,945) (3,994)
Net Cash Provided (Used) by Operating Activities $ (12,602) $ 169,093 $ 9,626 $ (29,301) $ (50,485) $ 280
Noncash Investing, Capital and Financing Activities:Assets Acquired through Capital Leases $ — $ — $ — $ — $ — $ — Contributions/Transfer In (Out) of Noncash
Assets and Liabilities from/to Other Funds — 3 — — — — Change in Investments for Prize Annuities Payable — 712 — — — — Net Change in Unrealized Gains and Losses 83,550 (51) — — — —
204
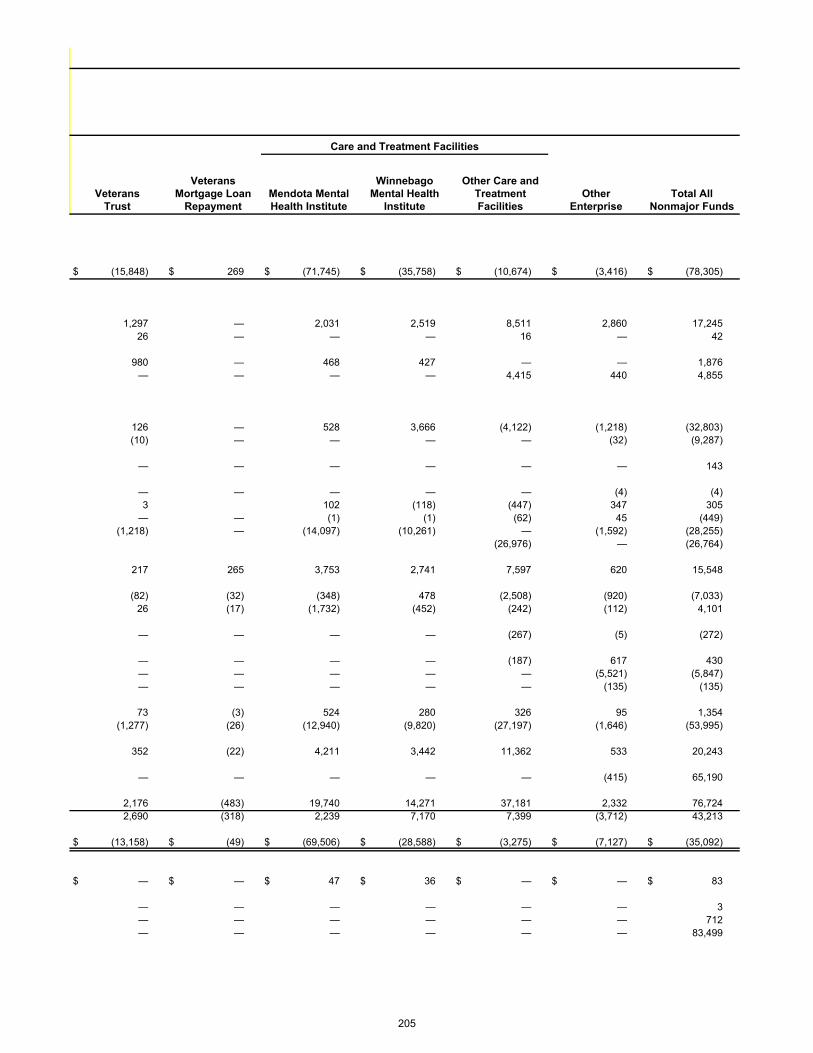
Care and Treatment Facilities
VeteransTrust
Veterans Mortgage Loan
RepaymentMendota Mental Health Institute
Winnebago Mental Health
Institute
Other Care and Treatment Facilities
OtherEnterprise
Total All Nonmajor Funds
$ (15,848) $ 269 $ (71,745) $ (35,758) $ (10,674) $ (3,416) $ (78,305)
1,297 — 2,031 2,519 8,511 2,860 17,245 26 — — — 16 — 42
980 — 468 427 — — 1,876 — — — — 4,415 440 4,855
126 — 528 3,666 (4,122) (1,218) (32,803) (10) — — — — (32) (9,287)
— — — — — — 143
— — — — — (4) (4) 3 102 (118) (447) 347 305 — — (1) (1) (62) 45 (449) (1,218) — (14,097) (10,261) — (1,592) (28,255)
(26,976) — (26,764)
217 265 3,753 2,741 7,597 620 15,548
(82) (32) (348) 478 (2,508) (920) (7,033) 26 (17) (1,732) (452) (242) (112) 4,101
— — — — (267) (5) (272)
— — — — (187) 617 430 — — — — — (5,521) (5,847) — — — — — (135) (135)
73 (3) 524 280 326 95 1,354 (1,277) (26) (12,940) (9,820) (27,197) (1,646) (53,995)
352 (22) 4,211 3,442 11,362 533 20,243
— — — — — (415) 65,190
2,176 (483) 19,740 14,271 37,181 2,332 76,724 2,690 (318) 2,239 7,170 7,399 (3,712) 43,213
$ (13,158) $ (49) $ (69,506) $ (28,588) $ (3,275) $ (7,127) $ (35,092)
$ — $ — $ 47 $ 36 $ — $ — $ 83
— — — — — — 3 — — — — — — 712 — — — — — — 83,499
205

206
State of Wisconsin
Internal Service Funds
INTERNAL SERVICE: Internal service funds account for the operations of State agencies which render services to other State agencies, institutions, or other governmental units on a cost- reimbursement basis. The State's internal service funds are described below:
The Accumulated Sick Leave Conversion Credit Fund allows retirees of the State of Wisconsin (including the UW System), the UW Hospitals and Clinics Authority, and other state authorities, at the time of their retirement, to convert the value of their unused sick leave accumulation into an account to be used to pay for post-retirement health insurance.
The Technology Services Fund accounts for computer and telephone services provided to State and local governmental agencies and school systems. The moneys to finance these services come from computing service charges and telephone and data network charges.
The Fleet Services Fund accounts for the costs associated with providing vehicle and aircraft services to State agencies. Moneys to finance these services come from user fees and the sale of used vehicles.
The Financial Services Fund accounts for the costs associated with providing accounting, auditing, payroll and other financial services to State agencies. Moneys to finance these services come from State agency user fees.
The Facilities Operations and Maintenance Fund accounts for the costs of operating State-owned facilities including utilities, heat, protective services, custodial and maintenance services and minor repair projects. The moneys to finance these costs are supplied from rents charged for facility and parking use and a general purpose revenue supplement for maintenance of the capitol and executive residence.
The Risk Management Fund accounts for the costs of losses for damage to property owned by agencies, personal injury or property damage liabilities incurred by a State officer, agent or employee, and workers' compensation costs for State employees. Moneys to finance these costs come from charges to State agencies.
The Badger State Industries Fund accounts for the program which gives inmates work experience in manufacturing goods and providing services. The sale of goods and services provides the moneys necessary to run the program.
The Human Resources Services Fund accounts for the provision of personnel management services to state agencies. Agencies are charged for payroll and management services and support as well as general human resource services received.
207
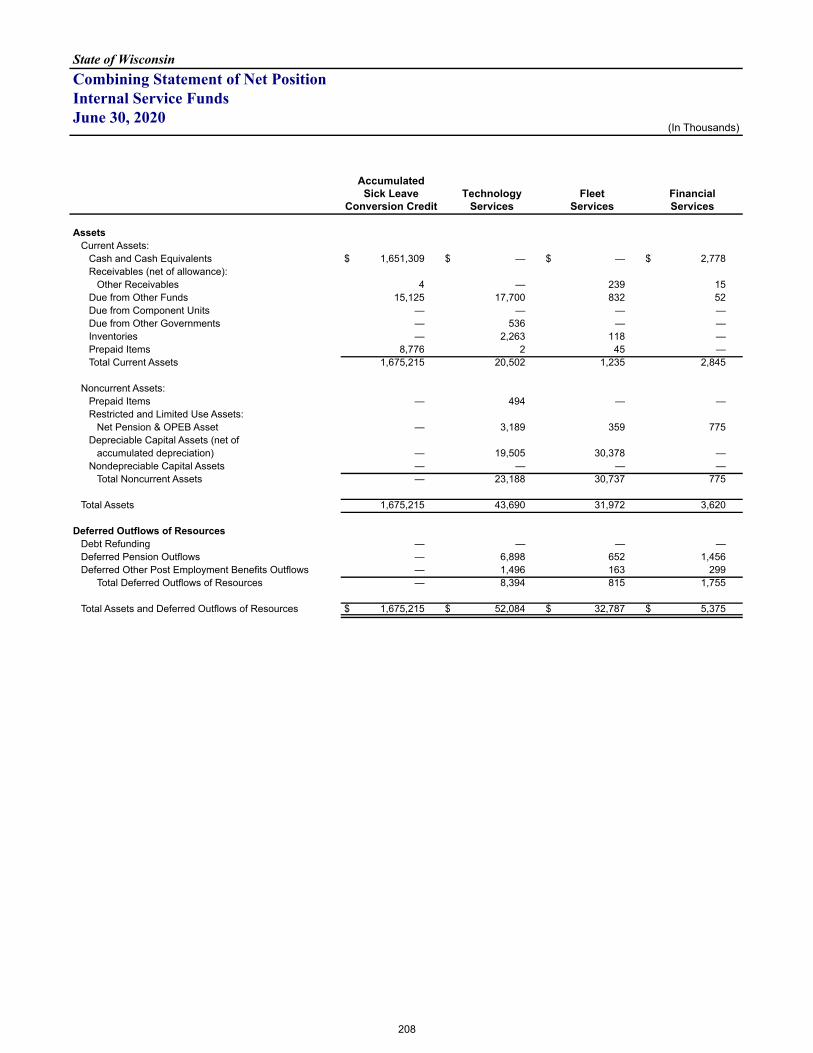
State of WisconsinCombining Statement of Net PositionInternal Service FundsJune 30, 2020
(In Thousands)
Accumulated Sick Leave
Conversion CreditTechnology
ServicesFleet
ServicesFinancialServices
AssetsCurrent Assets:
Cash and Cash Equivalents $ 1,651,309 $ — $ — $ 2,778 Receivables (net of allowance):
Other Receivables 4 — 239 15 Due from Other Funds 15,125 17,700 832 52 Due from Component Units — — — — Due from Other Governments — 536 — — Inventories — 2,263 118 — Prepaid Items 8,776 2 45 — Total Current Assets 1,675,215 20,502 1,235 2,845
Noncurrent Assets:Prepaid Items — 494 — — Restricted and Limited Use Assets:
Net Pension & OPEB Asset — 3,189 359 775 Depreciable Capital Assets (net of
accumulated depreciation) — 19,505 30,378 — Nondepreciable Capital Assets — — — —
Total Noncurrent Assets — 23,188 30,737 775
Total Assets 1,675,215 43,690 31,972 3,620
Deferred Outflows of ResourcesDebt Refunding — — — — Deferred Pension Outflows — 6,898 652 1,456 Deferred Other Post Employment Benefits Outflows — 1,496 163 299
Total Deferred Outflows of Resources — 8,394 815 1,755
Total Assets and Deferred Outflows of Resources $ 1,675,215 $ 52,084 $ 32,787 $ 5,375
208
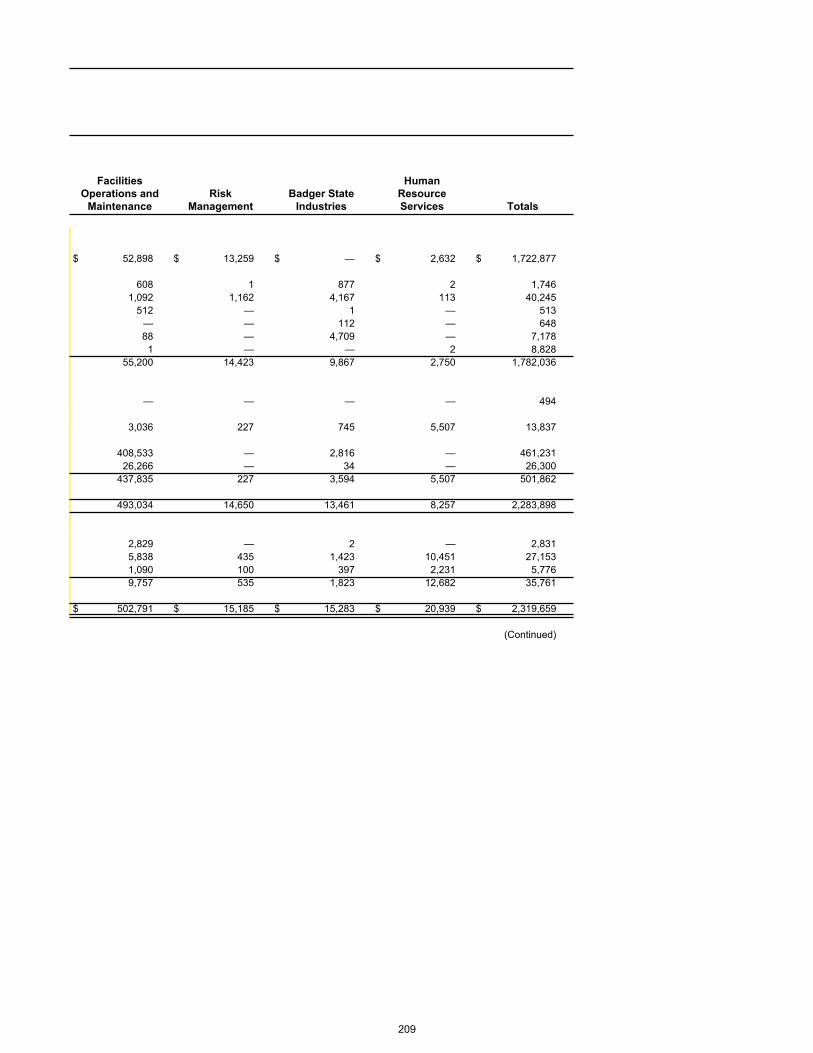
Facilities Operations and
MaintenanceRisk
ManagementBadger State
Industries
HumanResource Services Totals
$ 52,898 $ 13,259 $ — $ 2,632 $ 1,722,877
608 1 877 2 1,746 1,092 1,162 4,167 113 40,245 512 — 1 — 513 — — 112 — 648 88 — 4,709 — 7,178 1 — — 2 8,828 55,200 14,423 9,867 2,750 1,782,036
— — — — 494
3,036 227 745 5,507 13,837
408,533 — 2,816 — 461,231 26,266 — 34 — 26,300 437,835 227 3,594 5,507 501,862
493,034 14,650 13,461 8,257 2,283,898
2,829 — 2 — 2,831 5,838 435 1,423 10,451 27,153 1,090 100 397 2,231 5,776 9,757 535 1,823 12,682 35,761
$ 502,791 $ 15,185 $ 15,283 $ 20,939 $ 2,319,659
(Continued)
209
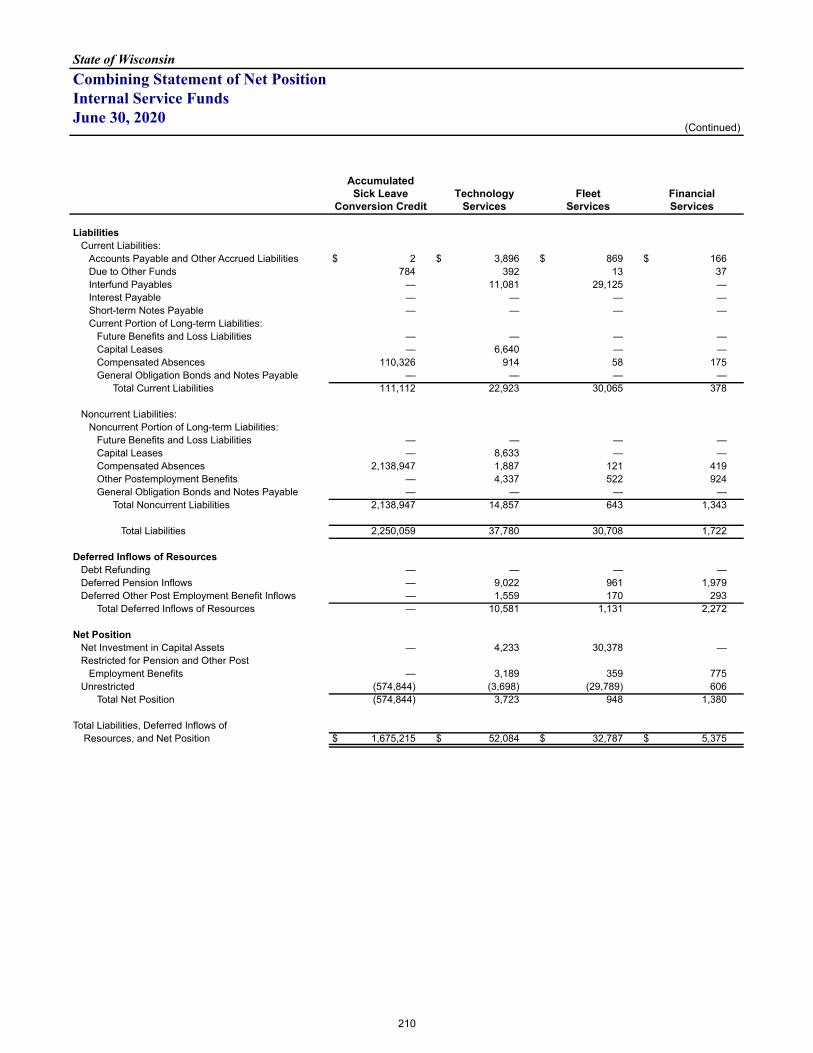
State of WisconsinCombining Statement of Net PositionInternal Service FundsJune 30, 2020
(Continued)
Accumulated Sick Leave
Conversion CreditTechnology
ServicesFleet
ServicesFinancialServices
LiabilitiesCurrent Liabilities:
Accounts Payable and Other Accrued Liabilities $ 2 $ 3,896 $ 869 $ 166 Due to Other Funds 784 392 13 37 Interfund Payables — 11,081 29,125 — Interest Payable — — — — Short-term Notes Payable — — — — Current Portion of Long-term Liabilities:
Future Benefits and Loss Liabilities — — — — Capital Leases — 6,640 — — Compensated Absences 110,326 914 58 175 General Obligation Bonds and Notes Payable — — — —
Total Current Liabilities 111,112 22,923 30,065 378
Noncurrent Liabilities:Noncurrent Portion of Long-term Liabilities:
Future Benefits and Loss Liabilities — — — — Capital Leases — 8,633 — — Compensated Absences 2,138,947 1,887 121 419 Other Postemployment Benefits — 4,337 522 924 General Obligation Bonds and Notes Payable — — — —
Total Noncurrent Liabilities 2,138,947 14,857 643 1,343
Total Liabilities 2,250,059 37,780 30,708 1,722
Deferred Inflows of ResourcesDebt Refunding — — — — Deferred Pension Inflows — 9,022 961 1,979 Deferred Other Post Employment Benefit Inflows — 1,559 170 293
Total Deferred Inflows of Resources — 10,581 1,131 2,272
Net PositionNet Investment in Capital Assets — 4,233 30,378 — Restricted for Pension and Other Post
Employment Benefits — 3,189 359 775 Unrestricted (574,844) (3,698) (29,789) 606
Total Net Position (574,844) 3,723 948 1,380
Total Liabilities, Deferred Inflows of Resources, and Net Position $ 1,675,215 $ 52,084 $ 32,787 $ 5,375
210
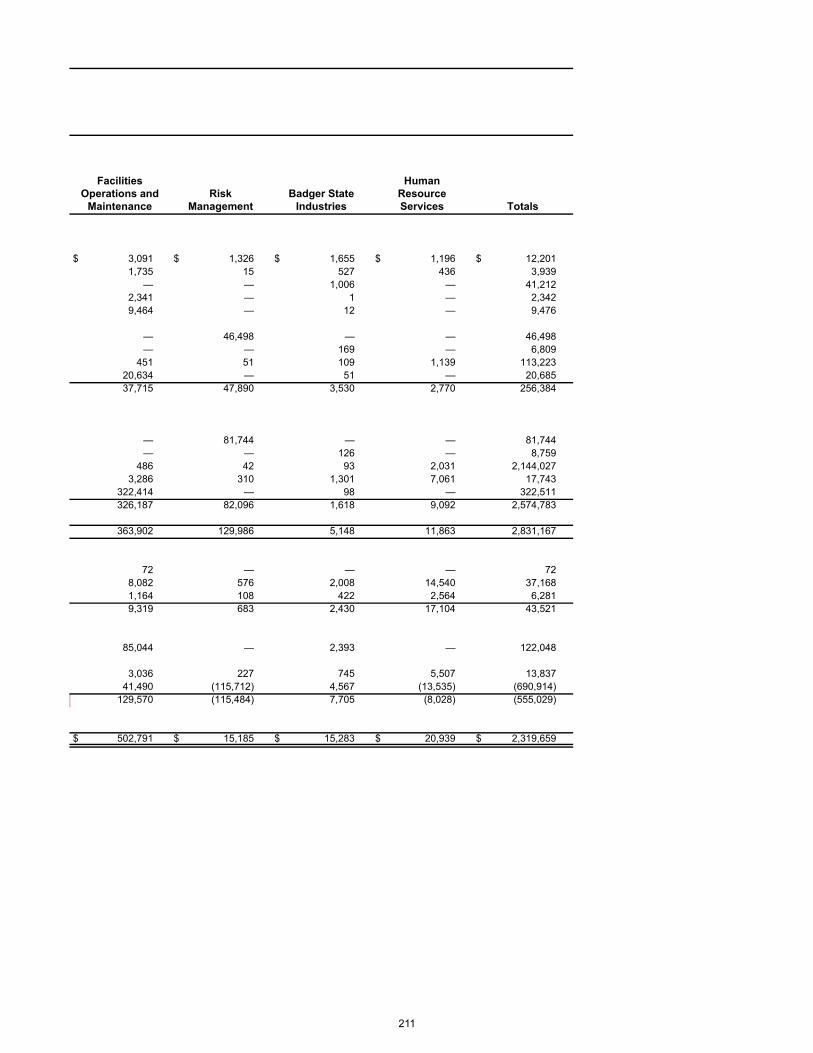
Facilities Operations and
MaintenanceRisk
ManagementBadger State
Industries
HumanResource Services Totals
$ 3,091 $ 1,326 $ 1,655 $ 1,196 $ 12,201 1,735 15 527 436 3,939 — — 1,006 — 41,212 2,341 — 1 — 2,342 9,464 — 12 — 9,476
— 46,498 — — 46,498 — — 169 — 6,809 451 51 109 1,139 113,223 20,634 — 51 — 20,685 37,715 47,890 3,530 2,770 256,384
— 81,744 — — 81,744 — — 126 — 8,759 486 42 93 2,031 2,144,027 3,286 310 1,301 7,061 17,743 322,414 — 98 — 322,511 326,187 82,096 1,618 9,092 2,574,783
363,902 129,986 5,148 11,863 2,831,167
72 — — — 72 8,082 576 2,008 14,540 37,168 1,164 108 422 2,564 6,281 9,319 683 2,430 17,104 43,521
85,044 — 2,393 — 122,048
3,036 227 745 5,507 13,837 41,490 (115,712) 4,567 (13,535) (690,914) 129,570 (115,484) 7,705 (8,028) (555,029)
$ 502,791 $ 15,185 $ 15,283 $ 20,939 $ 2,319,659
211
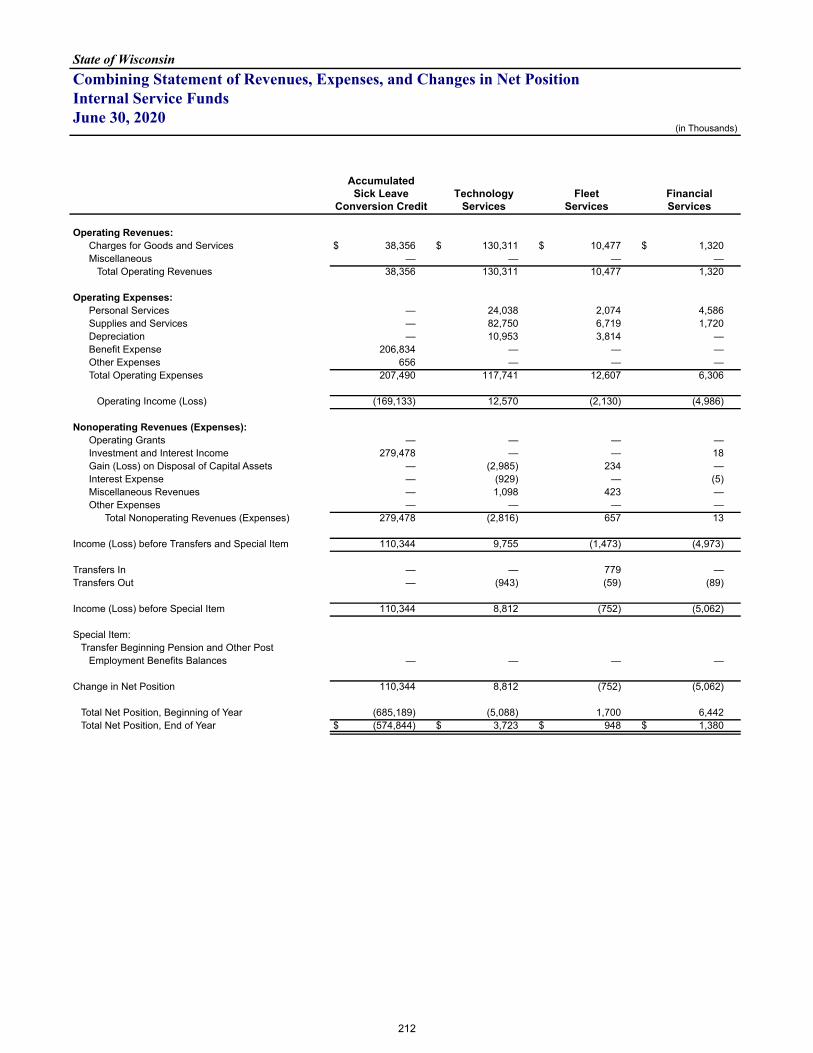
State of WisconsinCombining Statement of Revenues, Expenses, and Changes in Net PositionInternal Service FundsJune 30, 2020
(in Thousands)
Accumulated Sick Leave
Conversion CreditTechnology
ServicesFleet
ServicesFinancialServices
Operating Revenues:Charges for Goods and Services $ 38,356 $ 130,311 $ 10,477 $ 1,320 Miscellaneous — — — —
Total Operating Revenues 38,356 130,311 10,477 1,320
Operating Expenses:Personal Services — 24,038 2,074 4,586 Supplies and Services — 82,750 6,719 1,720 Depreciation — 10,953 3,814 — Benefit Expense 206,834 — — — Other Expenses 656 — — — Total Operating Expenses 207,490 117,741 12,607 6,306
Operating Income (Loss) (169,133) 12,570 (2,130) (4,986)
Nonoperating Revenues (Expenses):Operating Grants — — — — Investment and Interest Income 279,478 — — 18 Gain (Loss) on Disposal of Capital Assets — (2,985) 234 — Interest Expense — (929) — (5) Miscellaneous Revenues — 1,098 423 — Other Expenses — — — —
Total Nonoperating Revenues (Expenses) 279,478 (2,816) 657 13
Income (Loss) before Transfers and Special Item 110,344 9,755 (1,473) (4,973)
Transfers In — — 779 — Transfers Out — (943) (59) (89)
Income (Loss) before Special Item 110,344 8,812 (752) (5,062)
Special Item:Transfer Beginning Pension and Other Post
Employment Benefits Balances — — — —
Change in Net Position 110,344 8,812 (752) (5,062)
Total Net Position, Beginning of Year (685,189) (5,088) 1,700 6,442 Total Net Position, End of Year $ (574,844) $ 3,723 $ 948 $ 1,380
212
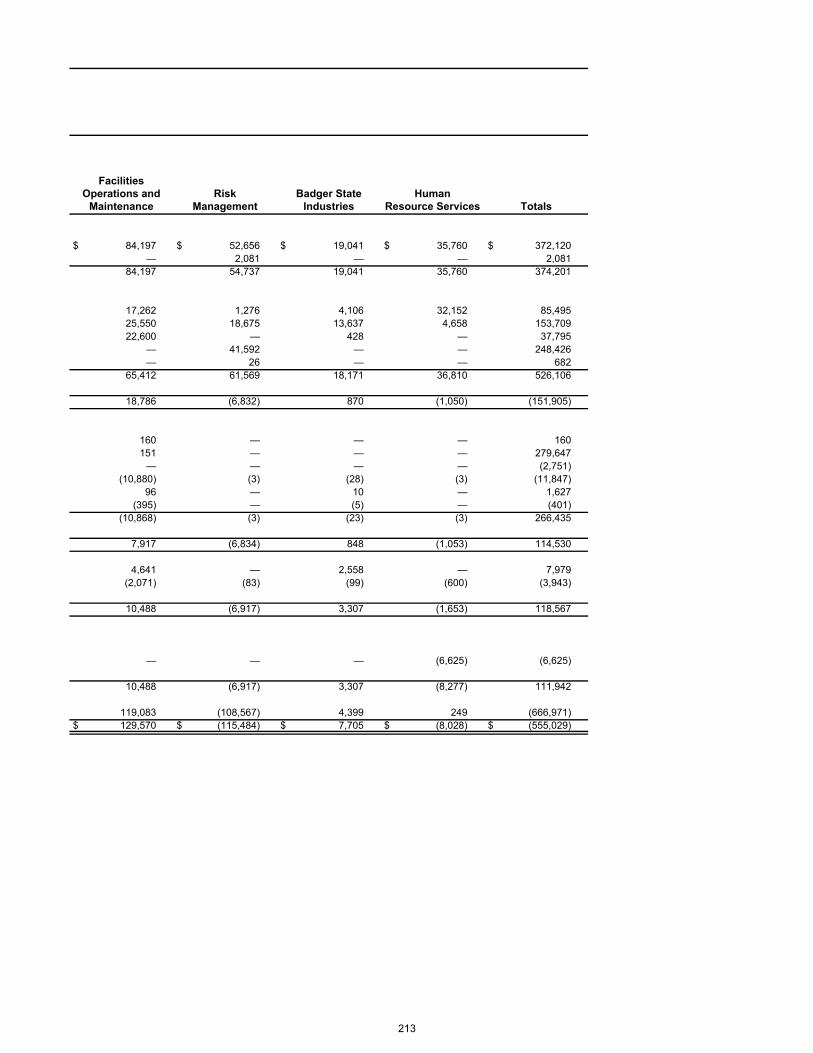
Facilities Operations and
MaintenanceRisk
ManagementBadger State
IndustriesHuman
Resource Services Totals
$ 84,197 $ 52,656 $ 19,041 $ 35,760 $ 372,120 — 2,081 — — 2,081 84,197 54,737 19,041 35,760 374,201
17,262 1,276 4,106 32,152 85,495 25,550 18,675 13,637 4,658 153,709 22,600 — 428 — 37,795 — 41,592 — — 248,426 — 26 — — 682 65,412 61,569 18,171 36,810 526,106
18,786 (6,832) 870 (1,050) (151,905)
160 — — — 160 151 — — — 279,647 — — — — (2,751) (10,880) (3) (28) (3) (11,847) 96 — 10 — 1,627 (395) — (5) — (401) (10,868) (3) (23) (3) 266,435
7,917 (6,834) 848 (1,053) 114,530
4,641 — 2,558 — 7,979 (2,071) (83) (99) (600) (3,943)
10,488 (6,917) 3,307 (1,653) 118,567
— — — (6,625) (6,625)
10,488 (6,917) 3,307 (8,277) 111,942
119,083 (108,567) 4,399 249 (666,971) $ 129,570 $ (115,484) $ 7,705 $ (8,028) $ (555,029)
213
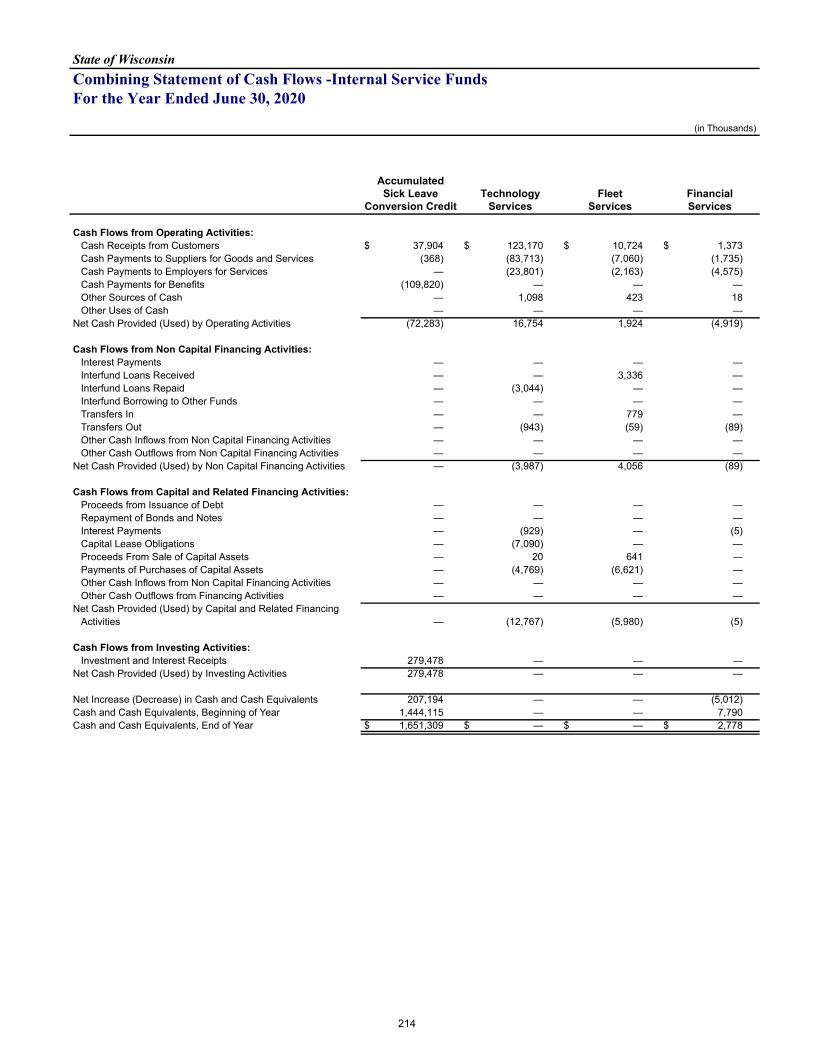
State of WisconsinCombining Statement of Cash Flows -Internal Service FundsFor the Year Ended June 30, 2020
(in Thousands)
Accumulated Sick Leave
Conversion CreditTechnology
ServicesFleet
ServicesFinancialServices
Cash Flows from Operating Activities:Cash Receipts from Customers $ 37,904 $ 123,170 $ 10,724 $ 1,373 Cash Payments to Suppliers for Goods and Services (368) (83,713) (7,060) (1,735) Cash Payments to Employers for Services — (23,801) (2,163) (4,575) Cash Payments for Benefits (109,820) — — — Other Sources of Cash — 1,098 423 18 Other Uses of Cash — — — —
Net Cash Provided (Used) by Operating Activities (72,283) 16,754 1,924 (4,919)
Cash Flows from Non Capital Financing Activities:Interest Payments — — — — Interfund Loans Received — — 3,336 — Interfund Loans Repaid — (3,044) — — Interfund Borrowing to Other Funds — — — — Transfers In — — 779 — Transfers Out — (943) (59) (89) Other Cash Inflows from Non Capital Financing Activities — — — — Other Cash Outflows from Non Capital Financing Activities — — — —
Net Cash Provided (Used) by Non Capital Financing Activities — (3,987) 4,056 (89)
Cash Flows from Capital and Related Financing Activities:Proceeds from Issuance of Debt — — — — Repayment of Bonds and Notes — — — — Interest Payments — (929) — (5) Capital Lease Obligations — (7,090) — — Proceeds From Sale of Capital Assets — 20 641 — Payments of Purchases of Capital Assets — (4,769) (6,621) — Other Cash Inflows from Non Capital Financing Activities — — — — Other Cash Outflows from Financing Activities — — — —
Net Cash Provided (Used) by Capital and Related FinancingActivities — (12,767) (5,980) (5)
Cash Flows from Investing Activities:Investment and Interest Receipts 279,478 — — —
Net Cash Provided (Used) by Investing Activities 279,478 — — —
Net Increase (Decrease) in Cash and Cash Equivalents 207,194 — — (5,012) Cash and Cash Equivalents, Beginning of Year 1,444,115 — — 7,790 Cash and Cash Equivalents, End of Year $ 1,651,309 $ — $ — $ 2,778
214
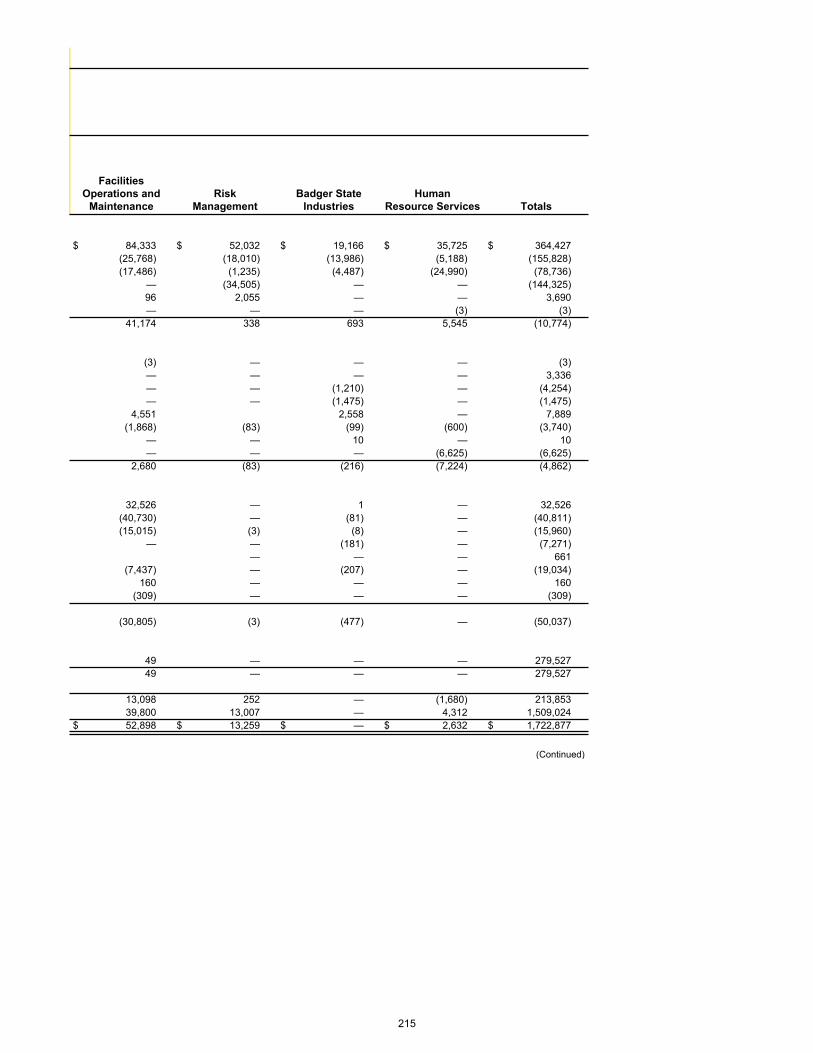
Facilities Operations and
MaintenanceRisk
ManagementBadger State
IndustriesHuman
Resource Services Totals
$ 84,333 $ 52,032 $ 19,166 $ 35,725 $ 364,427 (25,768) (18,010) (13,986) (5,188) (155,828) (17,486) (1,235) (4,487) (24,990) (78,736) — (34,505) — — (144,325) 96 2,055 — — 3,690 — — — (3) (3) 41,174 338 693 5,545 (10,774)
(3) — — — (3) — — — — 3,336 — — (1,210) — (4,254) — — (1,475) — (1,475) 4,551 2,558 — 7,889 (1,868) (83) (99) (600) (3,740) — — 10 — 10 — — — (6,625) (6,625) 2,680 (83) (216) (7,224) (4,862)
32,526 — 1 — 32,526 (40,730) — (81) — (40,811) (15,015) (3) (8) — (15,960) — — (181) — (7,271)
— — — 661 (7,437) — (207) — (19,034) 160 — — — 160 (309) — — — (309)
(30,805) (3) (477) — (50,037)
49 — — — 279,527 49 — — — 279,527
13,098 252 — (1,680) 213,853 39,800 13,007 — 4,312 1,509,024 $ 52,898 $ 13,259 $ — $ 2,632 $ 1,722,877
(Continued)
215
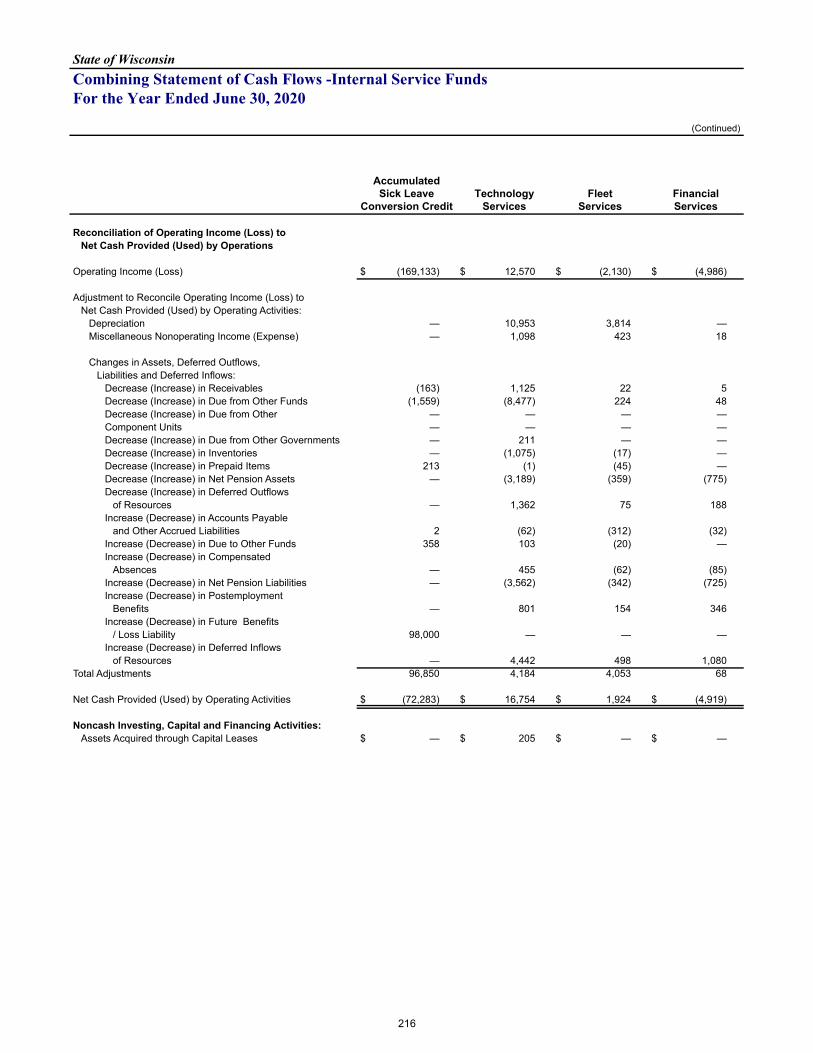
State of WisconsinCombining Statement of Cash Flows -Internal Service FundsFor the Year Ended June 30, 2020
(Continued)
Accumulated Sick Leave
Conversion CreditTechnology
ServicesFleet
ServicesFinancialServices
Reconciliation of Operating Income (Loss) toNet Cash Provided (Used) by Operations
Operating Income (Loss) $ (169,133) $ 12,570 $ (2,130) $ (4,986)
Adjustment to Reconcile Operating Income (Loss) toNet Cash Provided (Used) by Operating Activities:
Depreciation — 10,953 3,814 — Miscellaneous Nonoperating Income (Expense) — 1,098 423 18
Changes in Assets, Deferred Outflows,Liabilities and Deferred Inflows:
Decrease (Increase) in Receivables (163) 1,125 22 5 Decrease (Increase) in Due from Other Funds (1,559) (8,477) 224 48 Decrease (Increase) in Due from Other — — — — Component Units — — — — Decrease (Increase) in Due from Other Governments — 211 — — Decrease (Increase) in Inventories — (1,075) (17) — Decrease (Increase) in Prepaid Items 213 (1) (45) — Decrease (Increase) in Net Pension Assets — (3,189) (359) (775) Decrease (Increase) in Deferred Outflows
of Resources — 1,362 75 188 Increase (Decrease) in Accounts Payable
and Other Accrued Liabilities 2 (62) (312) (32) Increase (Decrease) in Due to Other Funds 358 103 (20) — Increase (Decrease) in Compensated
Absences — 455 (62) (85) Increase (Decrease) in Net Pension Liabilities — (3,562) (342) (725) Increase (Decrease) in Postemployment
Benefits — 801 154 346 Increase (Decrease) in Future Benefits
/ Loss Liability 98,000 — — — Increase (Decrease) in Deferred Inflows
of Resources — 4,442 498 1,080 Total Adjustments 96,850 4,184 4,053 68
Net Cash Provided (Used) by Operating Activities $ (72,283) $ 16,754 $ 1,924 $ (4,919)
Noncash Investing, Capital and Financing Activities:Assets Acquired through Capital Leases $ — $ 205 $ — $ —
216
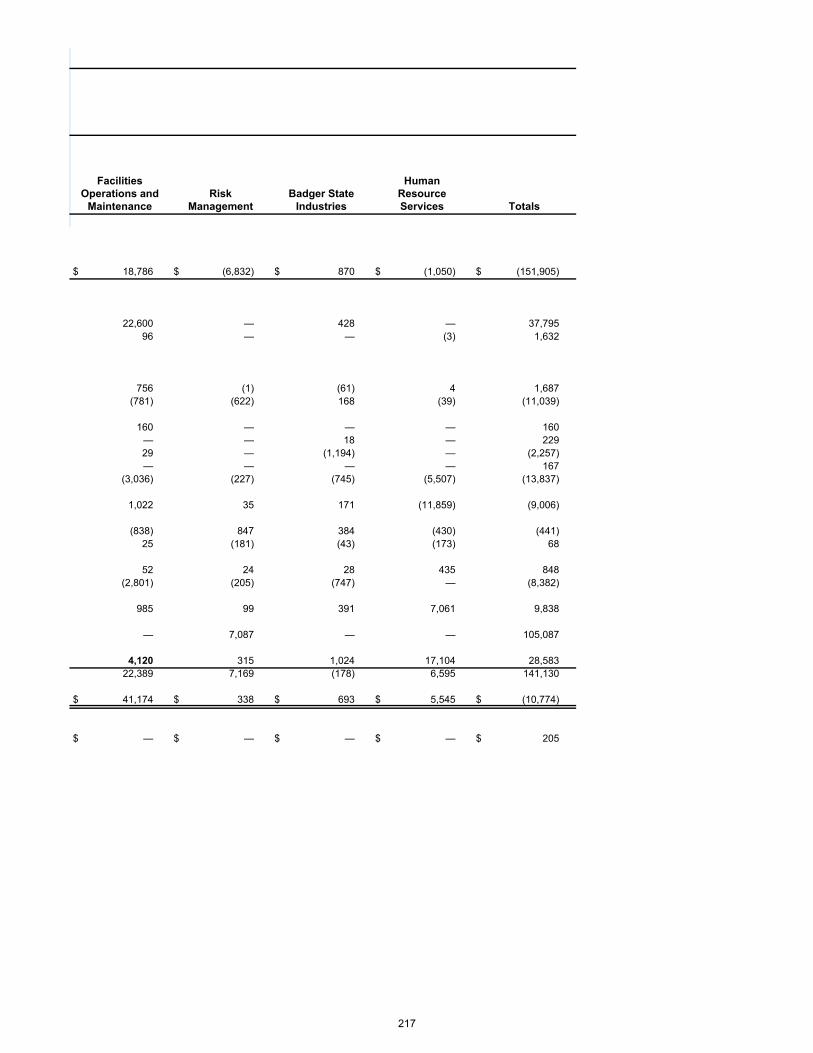
Facilities Operations and
MaintenanceRisk
ManagementBadger State
Industries
HumanResource Services Totals
$ 18,786 $ (6,832) $ 870 $ (1,050) $ (151,905)
22,600 — 428 — 37,795 96 — — (3) 1,632
756 (1) (61) 4 1,687 (781) (622) 168 (39) (11,039)
160 — — — 160 — — 18 — 229 29 — (1,194) — (2,257) — — — — 167 (3,036) (227) (745) (5,507) (13,837)
1,022 35 171 (11,859) (9,006)
(838) 847 384 (430) (441) 25 (181) (43) (173) 68
52 24 28 435 848 (2,801) (205) (747) — (8,382)
985 99 391 7,061 9,838
— 7,087 — — 105,087
4,120 315 1,024 17,104 28,583 22,389 7,169 (178) 6,595 141,130
$ 41,174 $ 338 $ 693 $ 5,545 $ (10,774)
$ — $ — $ — $ — $ 205
217

218
State of Wisconsin
Fiduciary Funds
FIDUCIARY: Fiduciary funds are maintained to account for assets held by the State acting in the capacity as a trustee or agent. The State's fiduciary funds, consisting of pension and other employee benefit trust, investment trust, private-purpose trust, and custodial funds, are described below:
PENSION AND OTHER EMPLOYEE BENEFIT TRUST FUNDS: Pension and other employee benefit trust funds are used to report resources that are required to be held in trust for members and beneficiaries of the public employee retirement system or other employee benefit plans.
The Wisconsin Retirement System Fund accounts for the collection of employee and employer contributions, the investment of assets, and the payment of retirement, disability, and death benefits to current and former employees of the State and participating local Wisconsin governments and their beneficiaries.
The Supplemental Health Insurance Conversion Credit Fund provides additional sick leave credits to eligible employees with at least 15 years of service, which increases their sick leave account balance that can be used to pay for post-retirement health insurance premiums.
The Deferred Compensation Fund accounts for the collection of voluntary payroll deferrals and rollovers from IRAs and other qualified plans, the investment of assets, and distributions to employees of the State and participating local governments. The Fund is governed by Section 457 of the Internal Revenue Code.
The Reimbursed Employee Expense Fund accounts for the collection of voluntary payroll deferrals, the investment of assets, and the reimbursement of qualifying medical, dependent care, and transportation expenses of State employees, in compliance with Internal Revenue Code Sections 132 and 425.
The Local Retiree Life Insurance Fund accounts for the accumulation of employer contributions, during the course of local government employees working lifetimes, for postretirement life insurance coverage for retired participants.
The Retiree Life Insurance Fund accounts for the accumulation of employer contributions, during the course of State employees working lifetimes, for postretirement life insurance coverage for retired participants.
INVESTMENT TRUST FUNDS: Investment trust funds account for assets invested on a commingled basis by the State on behalf of other governmental entities. The State's investment trust funds are described below:
The Local Government Pooled Investment Fund was established to enable local governments in the State to voluntarily invest any idle local moneys. The sources of this fund are local government investment deposits and their share of the investment earnings of the fund. Deductions occur as withdrawals are requested by local governments.
The Milwaukee Retirement System Fund accounts for funds of the Milwaukee Public Schools invested as part of the fixed and variable investment trusts of the Wisconsin Retirement System.
PRIVATE-PURPOSE TRUST: Private-purpose trust funds are used to report all other trust arrangements under which principal and income benefit individuals, private organizations, or other governments.
The Tuition Trust Fund accounts for the program that allows participants to invest in order to meet the cost of future tuition expenses.
CUSTODIAL FUNDS: Custodial funds are used to report fiduciary activities for assets held by the State, but do not fall under Pension and Other Employee Benefit Trust Funds, Investment Trust Funds or Private-Purpose Trust Funds. The State's custodial funds are described below:
The Local Government Tax Collections Fund accounts for the collection and distribution of sales and use taxes levied by other governments including counties and special districts.
The Insurance Company Liquidation Account Fund accounts for the assets of insurance companies that are liquidated. These assets are used to pay claims and administrative costs associated with the liquidation.
The Local Retiree Health Insurance Fund accounts for the accumulation of premiums for group health insurance plans provided on a self-insured, fee for service basis or prepaid basis to retired employees of participating local public employers.
The Inmate and Resident Fund accounts for the assets of inmates and residents in State institutions.
The Bank and Insurance Company Deposits Fund accounts for the statutorily required deposits of securities with the State by banks and insurance companies doing business in the State.
The Support Collection Trust Fund accounts for the centralized receipt and disbursement of court ordered temporary or permanent maintenance, child support or family support and related fees.
219
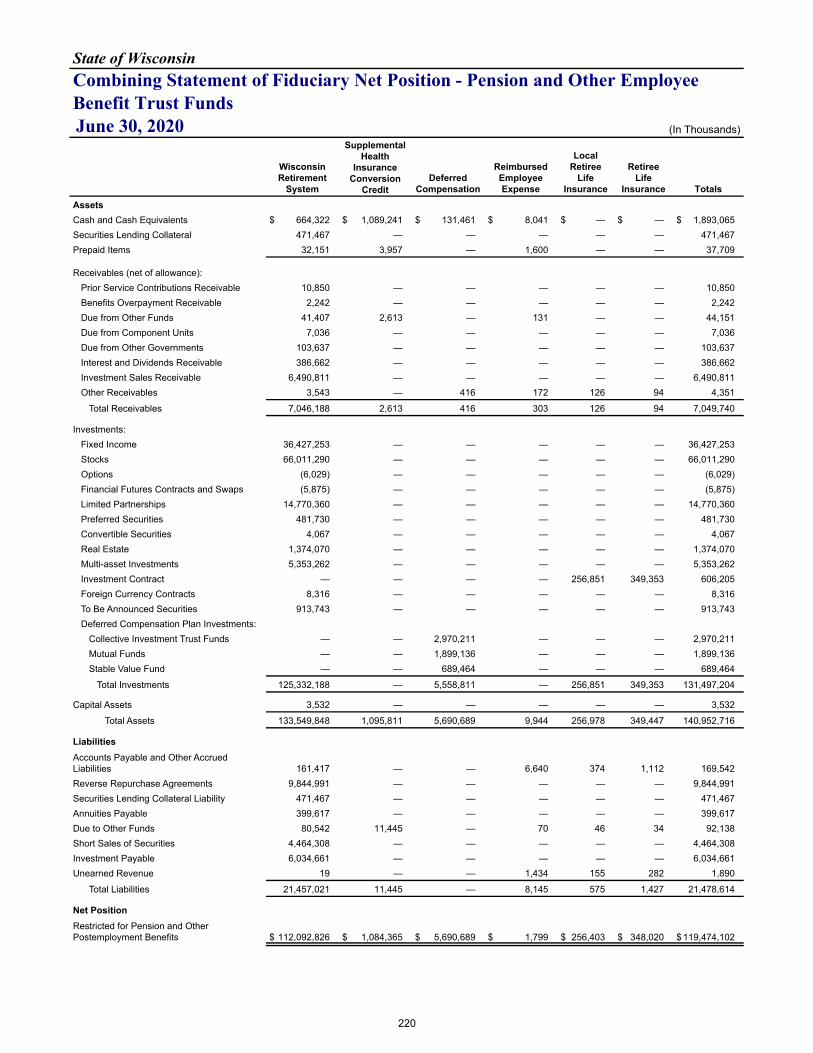
State of WisconsinCombining Statement of Fiduciary Net Position - Pension and Other EmployeeBenefit Trust FundsJune 30, 2020 (In Thousands)
WisconsinRetirement
System
Supplemental Health
Insurance Conversion
CreditDeferred
Compensation
ReimbursedEmployeeExpense
LocalRetiree
LifeInsurance
RetireeLife
Insurance TotalsAssetsCash and Cash Equivalents $ 664,322 $ 1,089,241 $ 131,461 $ 8,041 $ — $ — $ 1,893,065 Securities Lending Collateral 471,467 — — — — — 471,467 Prepaid Items 32,151 3,957 — 1,600 — — 37,709
Receivables (net of allowance):Prior Service Contributions Receivable 10,850 — — — — — 10,850 Benefits Overpayment Receivable 2,242 — — — — — 2,242 Due from Other Funds 41,407 2,613 — 131 — — 44,151 Due from Component Units 7,036 — — — — — 7,036 Due from Other Governments 103,637 — — — — — 103,637 Interest and Dividends Receivable 386,662 — — — — — 386,662 Investment Sales Receivable 6,490,811 — — — — — 6,490,811 Other Receivables 3,543 — 416 172 126 94 4,351
Total Receivables 7,046,188 2,613 416 303 126 94 7,049,740
Investments:Fixed Income 36,427,253 — — — — — 36,427,253 Stocks 66,011,290 — — — — — 66,011,290 Options (6,029) — — — — — (6,029) Financial Futures Contracts and Swaps (5,875) — — — — — (5,875) Limited Partnerships 14,770,360 — — — — — 14,770,360 Preferred Securities 481,730 — — — — — 481,730 Convertible Securities 4,067 — — — — — 4,067 Real Estate 1,374,070 — — — — — 1,374,070 Multi-asset Investments 5,353,262 — — — — — 5,353,262 Investment Contract — — — — 256,851 349,353 606,205 Foreign Currency Contracts 8,316 — — — — — 8,316 To Be Announced Securities 913,743 — — — — — 913,743 Deferred Compensation Plan Investments:
Collective Investment Trust Funds — — 2,970,211 — — — 2,970,211 Mutual Funds — — 1,899,136 — — — 1,899,136 Stable Value Fund — — 689,464 — — — 689,464
Total Investments 125,332,188 — 5,558,811 — 256,851 349,353 131,497,204
Capital Assets 3,532 — — — — — 3,532
Total Assets 133,549,848 1,095,811 5,690,689 9,944 256,978 349,447 140,952,716
LiabilitiesAccounts Payable and Other Accrued Liabilities 161,417 — — 6,640 374 1,112 169,542 Reverse Repurchase Agreements 9,844,991 — — — — — 9,844,991 Securities Lending Collateral Liability 471,467 — — — — — 471,467 Annuities Payable 399,617 — — — — — 399,617 Due to Other Funds 80,542 11,445 — 70 46 34 92,138 Short Sales of Securities 4,464,308 — — — — — 4,464,308 Investment Payable 6,034,661 — — — — — 6,034,661 Unearned Revenue 19 — — 1,434 155 282 1,890
Total Liabilities 21,457,021 11,445 — 8,145 575 1,427 21,478,614
Net PositionRestricted for Pension and Other Postemployment Benefits $ 112,092,826 $ 1,084,365 $ 5,690,689 $ 1,799 $ 256,403 $ 348,020 $ 119,474,102
220
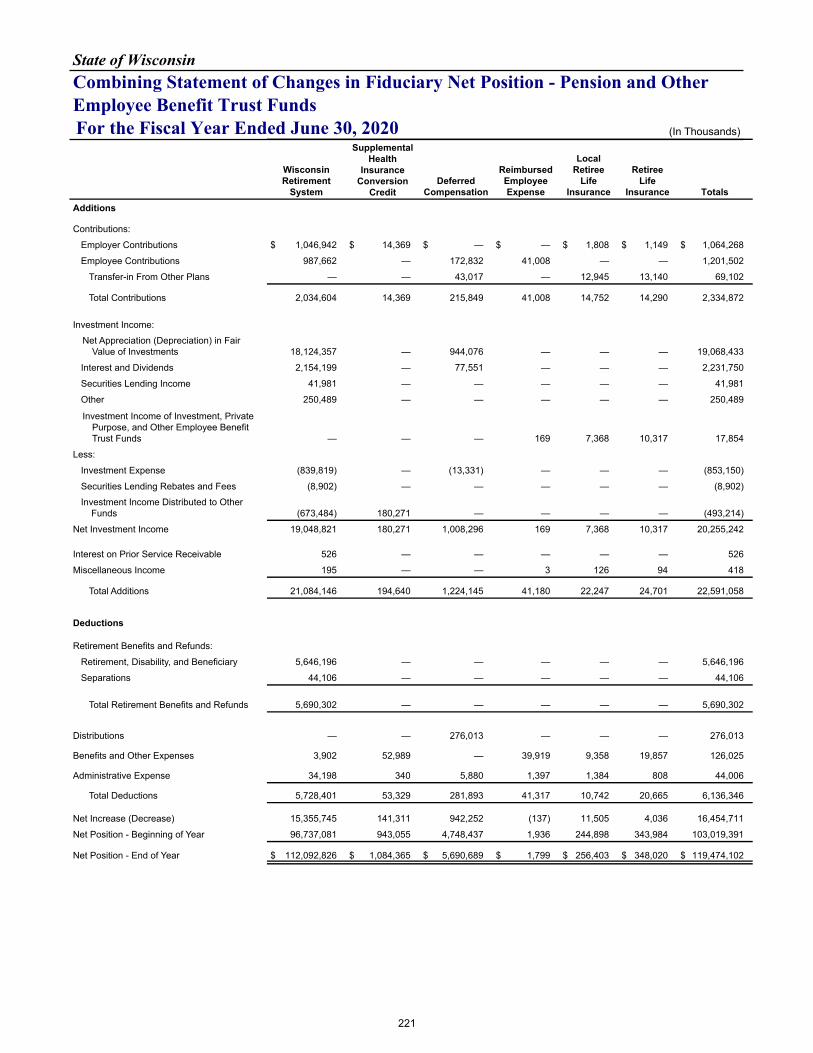
State of WisconsinCombining Statement of Changes in Fiduciary Net Position - Pension and OtherEmployee Benefit Trust FundsFor the Fiscal Year Ended June 30, 2020 (In Thousands)
WisconsinRetirement
System
Supplemental Health
Insurance Conversion
CreditDeferred
Compensation
ReimbursedEmployeeExpense
LocalRetiree
LifeInsurance
RetireeLife
Insurance TotalsAdditions
Contributions:
Employer Contributions $ 1,046,942 $ 14,369 $ — $ — $ 1,808 $ 1,149 $ 1,064,268
Employee Contributions 987,662 — 172,832 41,008 — — 1,201,502
Transfer-in From Other Plans — — 43,017 — 12,945 13,140 69,102
Total Contributions 2,034,604 14,369 215,849 41,008 14,752 14,290 2,334,872
Investment Income:
Net Appreciation (Depreciation) in Fair Value of Investments 18,124,357 — 944,076 — — — 19,068,433
Interest and Dividends 2,154,199 — 77,551 — — — 2,231,750
Securities Lending Income 41,981 — — — — — 41,981
Other 250,489 — — — — — 250,489
Investment Income of Investment, Private Purpose, and Other Employee Benefit Trust Funds — — — 169 7,368 10,317 17,854
Less:
Investment Expense (839,819) — (13,331) — — — (853,150)
Securities Lending Rebates and Fees (8,902) — — — — — (8,902)
Investment Income Distributed to Other Funds (673,484) 180,271 — — — — (493,214)
Net Investment Income 19,048,821 180,271 1,008,296 169 7,368 10,317 20,255,242
Interest on Prior Service Receivable 526 — — — — — 526
Miscellaneous Income 195 — — 3 126 94 418
Total Additions 21,084,146 194,640 1,224,145 41,180 22,247 24,701 22,591,058
Deductions
Retirement Benefits and Refunds:
Retirement, Disability, and Beneficiary 5,646,196 — — — — — 5,646,196
Separations 44,106 — — — — — 44,106
Total Retirement Benefits and Refunds 5,690,302 — — — — — 5,690,302
Distributions — — 276,013 — — — 276,013
Benefits and Other Expenses 3,902 52,989 — 39,919 9,358 19,857 126,025
Administrative Expense 34,198 340 5,880 1,397 1,384 808 44,006
Total Deductions 5,728,401 53,329 281,893 41,317 10,742 20,665 6,136,346
Net Increase (Decrease) 15,355,745 141,311 942,252 (137) 11,505 4,036 16,454,711
Net Position - Beginning of Year 96,737,081 943,055 4,748,437 1,936 244,898 343,984 103,019,391
Net Position - End of Year $ 112,092,826 $ 1,084,365 $ 5,690,689 $ 1,799 $ 256,403 $ 348,020 $ 119,474,102
221
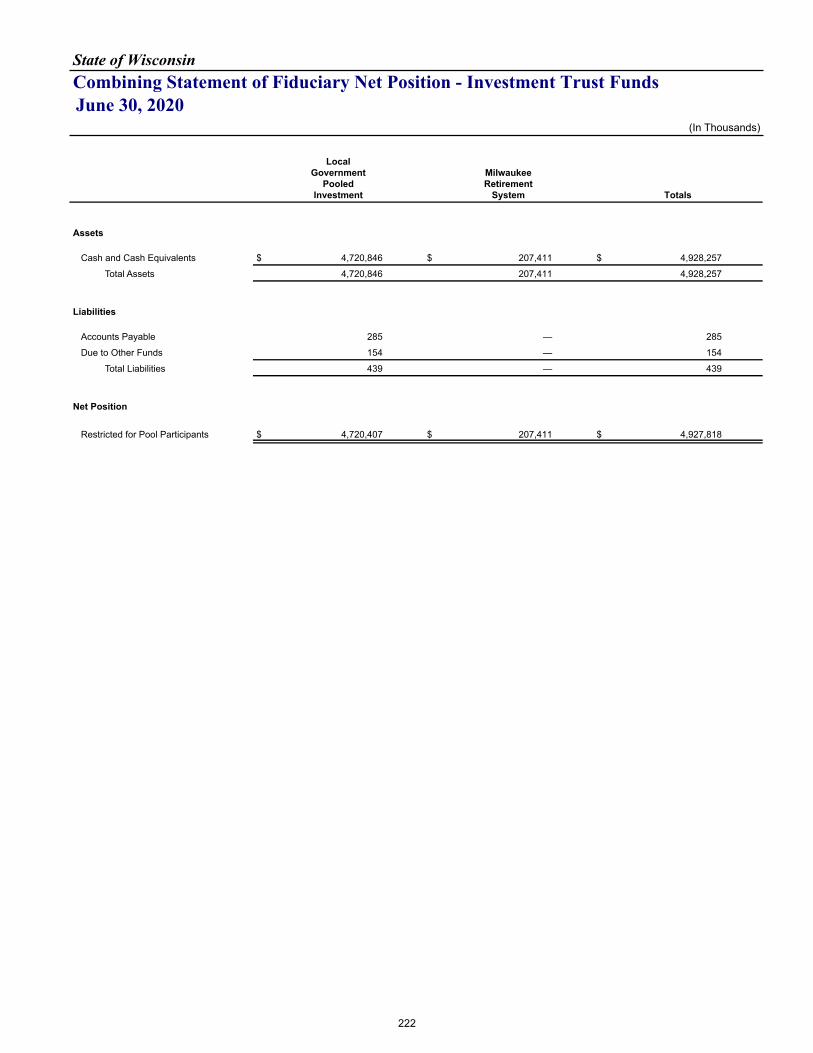
State of WisconsinCombining Statement of Fiduciary Net Position - Investment Trust FundsJune 30, 2020
(In Thousands)
LocalGovernment
PooledInvestment
MilwaukeeRetirement
System Totals
Assets
Cash and Cash Equivalents $ 4,720,846 $ 207,411 $ 4,928,257
Total Assets 4,720,846 207,411 4,928,257
Liabilities
Accounts Payable 285 — 285
Due to Other Funds 154 — 154
Total Liabilities 439 — 439
Net Position
Restricted for Pool Participants $ 4,720,407 $ 207,411 $ 4,927,818
222
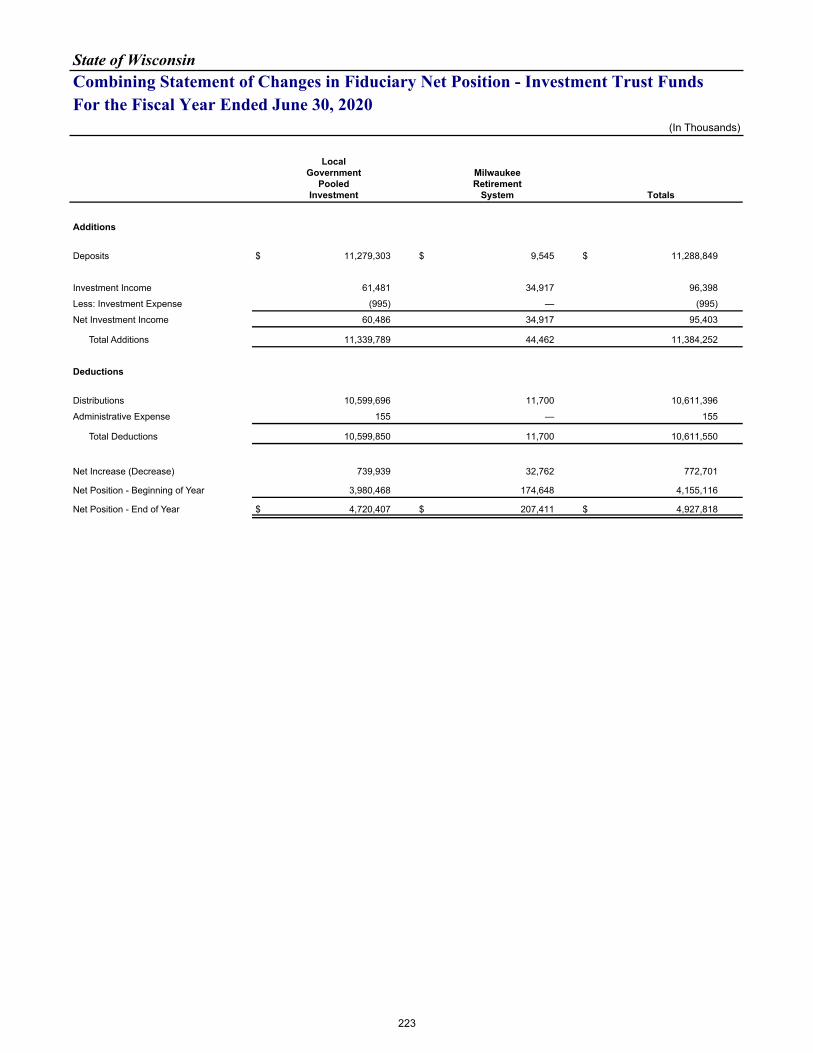
State of WisconsinCombining Statement of Changes in Fiduciary Net Position - Investment Trust FundsFor the Fiscal Year Ended June 30, 2020
(In Thousands)
LocalGovernment
PooledInvestment
MilwaukeeRetirement
System Totals
Additions
Deposits $ 11,279,303 $ 9,545 $ 11,288,849
Investment Income 61,481 34,917 96,398
Less: Investment Expense (995) — (995)
Net Investment Income 60,486 34,917 95,403
Total Additions 11,339,789 44,462 11,384,252
Deductions
Distributions 10,599,696 11,700 10,611,396
Administrative Expense 155 — 155
Total Deductions 10,599,850 11,700 10,611,550
Net Increase (Decrease) 739,939 32,762 772,701
Net Position - Beginning of Year 3,980,468 174,648 4,155,116
Net Position - End of Year $ 4,720,407 $ 207,411 $ 4,927,818
223
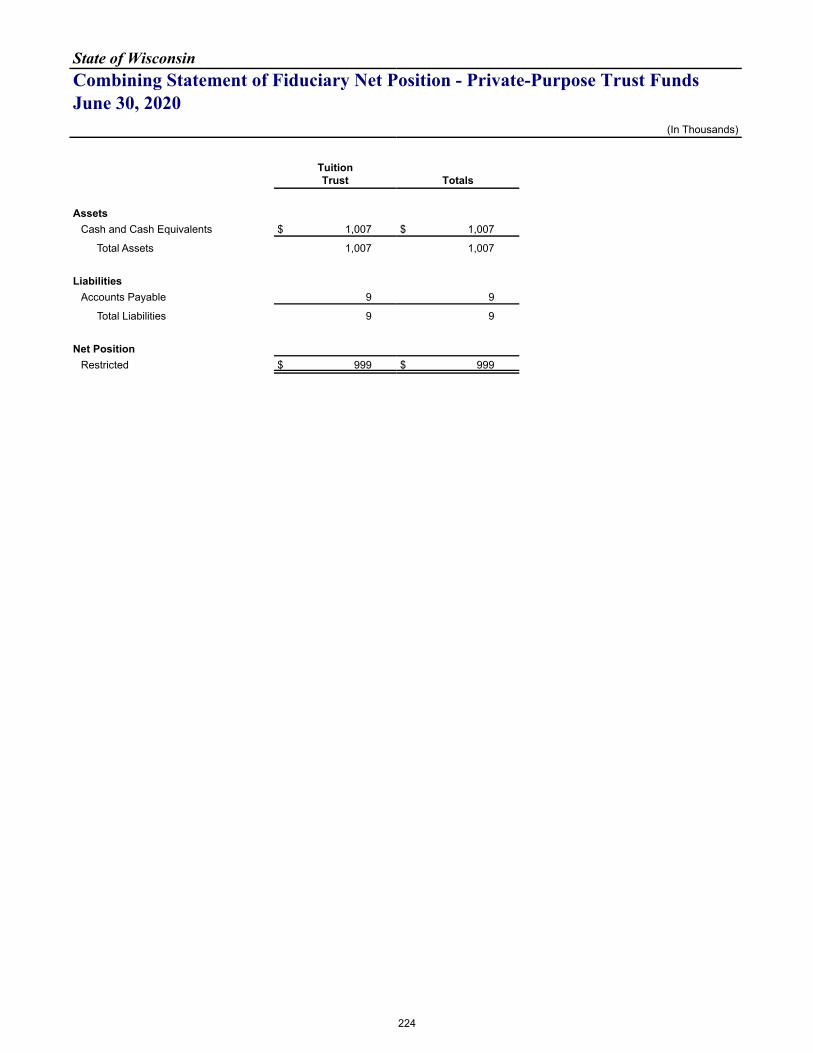
State of WisconsinCombining Statement of Fiduciary Net Position - Private-Purpose Trust FundsJune 30, 2020
(In Thousands)
TuitionTrust Totals
AssetsCash and Cash Equivalents $ 1,007 $ 1,007
Total Assets 1,007 1,007
LiabilitiesAccounts Payable 9 9
Total Liabilities 9 9
Net PositionRestricted $ 999 $ 999
224
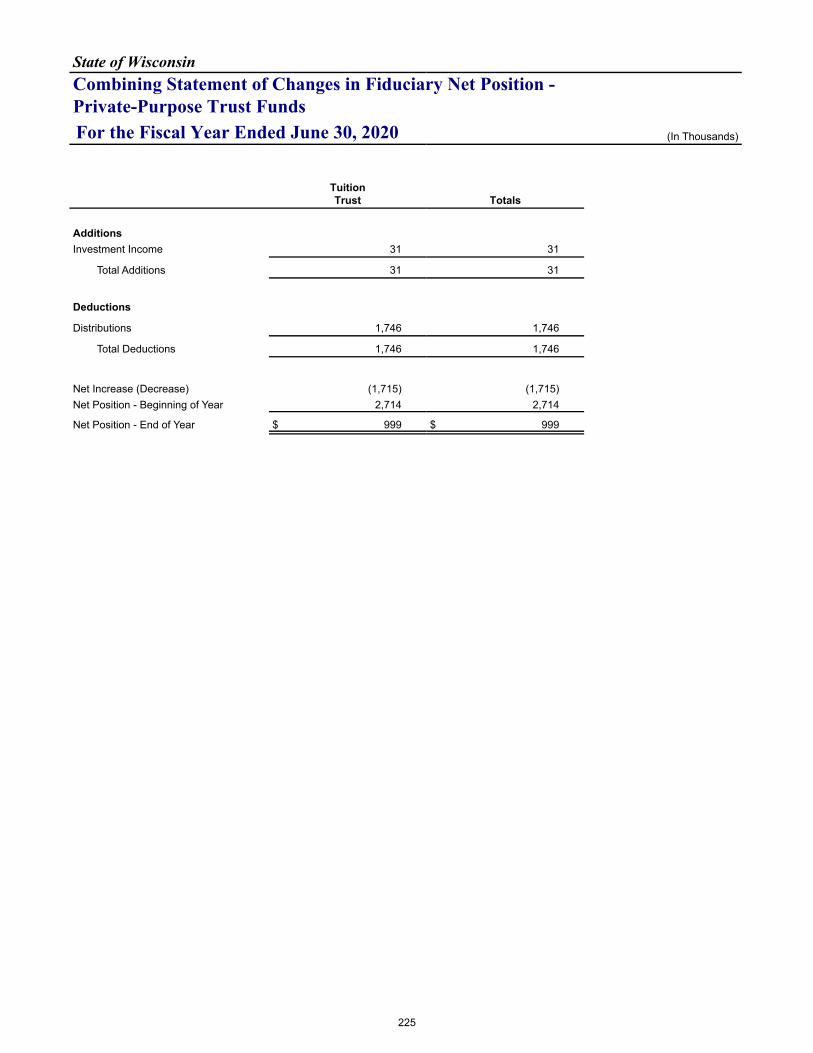
State of WisconsinCombining Statement of Changes in Fiduciary Net Position - Private-Purpose Trust FundsFor the Fiscal Year Ended June 30, 2020 (In Thousands)
TuitionTrust Totals
AdditionsInvestment Income 31 31
Total Additions 31 31
Deductions
Distributions 1,746 1,746
Total Deductions 1,746 1,746
Net Increase (Decrease) (1,715) (1,715) Net Position - Beginning of Year 2,714 2,714
Net Position - End of Year $ 999 $ 999
225
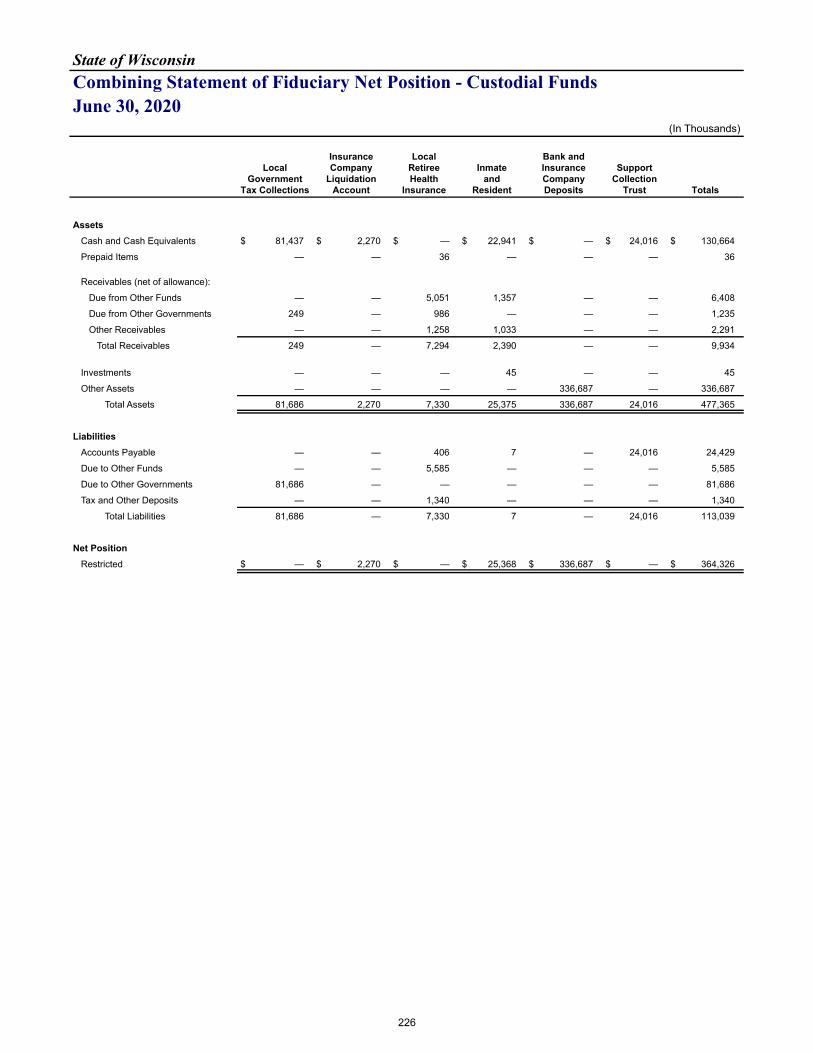
State of WisconsinCombining Statement of Fiduciary Net Position - Custodial FundsJune 30, 2020
(In Thousands)
Local Government
Tax Collections
InsuranceCompany
LiquidationAccount
LocalRetireeHealth
Insurance
Inmateand
Resident
Bank andInsuranceCompanyDeposits
SupportCollection
Trust Totals
AssetsCash and Cash Equivalents $ 81,437 $ 2,270 $ — $ 22,941 $ — $ 24,016 $ 130,664
Prepaid Items — — 36 — — — 36
Receivables (net of allowance):
Due from Other Funds — — 5,051 1,357 — — 6,408
Due from Other Governments 249 — 986 — — — 1,235
Other Receivables — — 1,258 1,033 — — 2,291
Total Receivables 249 — 7,294 2,390 — — 9,934
Investments — — — 45 — — 45
Other Assets — — — — 336,687 — 336,687
Total Assets 81,686 2,270 7,330 25,375 336,687 24,016 477,365
LiabilitiesAccounts Payable — — 406 7 — 24,016 24,429
Due to Other Funds — — 5,585 — — — 5,585
Due to Other Governments 81,686 — — — — — 81,686
Tax and Other Deposits — — 1,340 — — — 1,340
Total Liabilities 81,686 — 7,330 7 — 24,016 113,039
Net PositionRestricted $ — $ 2,270 $ — $ 25,368 $ 336,687 $ — $ 364,326
226
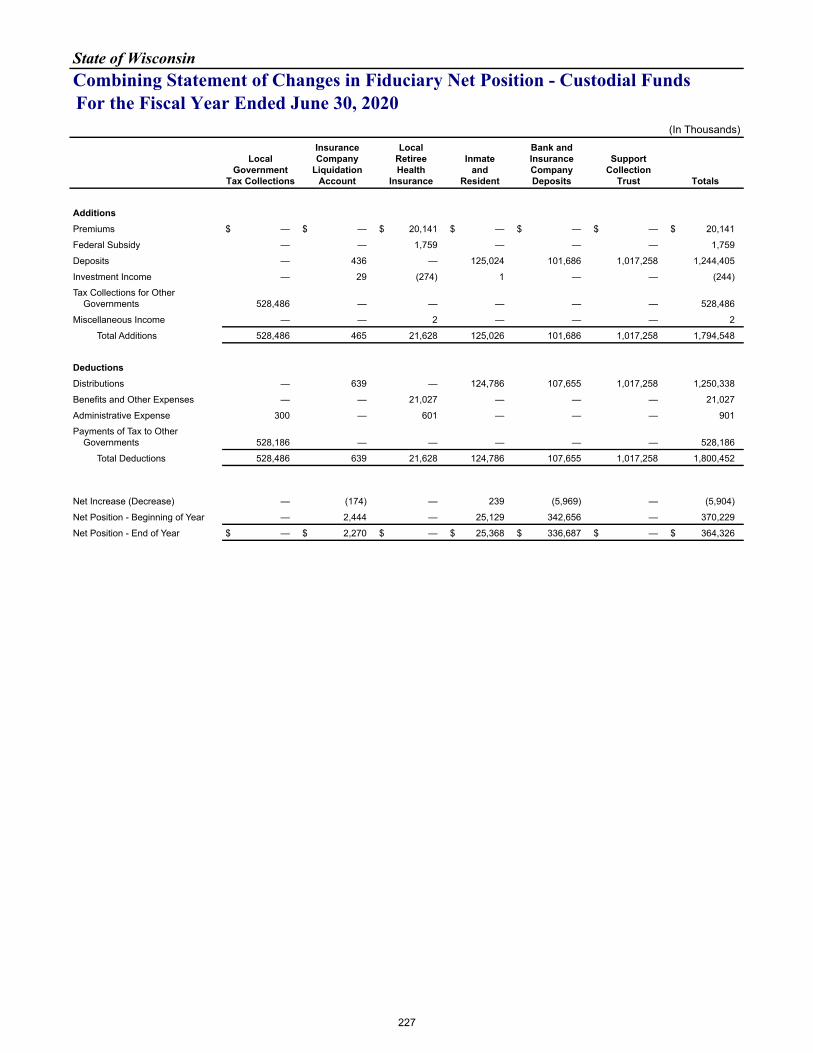
State of WisconsinCombining Statement of Changes in Fiduciary Net Position - Custodial FundsFor the Fiscal Year Ended June 30, 2020
(In Thousands)
Local Government
Tax Collections
InsuranceCompany
LiquidationAccount
LocalRetireeHealth
Insurance
Inmateand
Resident
Bank andInsuranceCompanyDeposits
SupportCollection
Trust Totals
AdditionsPremiums $ — $ — $ 20,141 $ — $ — $ — $ 20,141
Federal Subsidy — — 1,759 — — — 1,759
Deposits — 436 — 125,024 101,686 1,017,258 1,244,405
Investment Income — 29 (274) 1 — — (244)
Tax Collections for Other Governments 528,486 — — — — — 528,486
Miscellaneous Income — — 2 — — — 2
Total Additions 528,486 465 21,628 125,026 101,686 1,017,258 1,794,548
DeductionsDistributions — 639 — 124,786 107,655 1,017,258 1,250,338
Benefits and Other Expenses — — 21,027 — — — 21,027
Administrative Expense 300 — 601 — — — 901
Payments of Tax to Other Governments 528,186 — — — — — 528,186
Total Deductions 528,486 639 21,628 124,786 107,655 1,017,258 1,800,452
Net Increase (Decrease) — (174) — 239 (5,969) — (5,904)
Net Position - Beginning of Year — 2,444 — 25,129 342,656 — 370,229
Net Position - End of Year $ — $ 2,270 $ — $ 25,368 $ 336,687 $ — $ 364,326
227
State of Wisconsin
This page left intentionally blank.
228
STATISTICAL SECTION
229
State of WisconsinStatistical Section Narrative and Table of Contents
Narrative
Page
The statistical section of Wisconsin's Comprehensive Annual Financial Report provides additional historical perspective, context, and detail to assist financial statement users in understanding the government's economic condition. The State's financial trends, revenue capacity, debt capacity, demographic and economic information, and operating information are presented in the following sections:
Financial Trends Information
The following schedules are intended to assist users in understanding and assessing how the State's financial position has changed over time. Information is presented at both the entity wide and fund level perspective.
Entity-Wide Perspective (Accrual Basis of Accounting)Schedule A-1 Net Position by Component...................................................................................................................................... 232Schedule A-2 Changes in Net Position............................................................................................................................................ 234
Fund-Level Perspective (Modified Accrual Basis of Accounting)Schedule A-3 Fund Balances of Governmental Funds.................................................................................................................... 238Schedule A-4 Changes in Fund Balances of Governmental Funds................................................................................................ 240
Revenue Capacity Information
The following information is intended to assist users in understanding and assessing the factors affecting the State's ability to generate tax revenues to finance its continued operations.
Schedule B-1 Personal Income by Industry..................................................................................................................................... 242
Schedule B-2 Personal Income Tax Rates...................................................................................................................................... 243
Schedule B-3 Personal Income Filers and Liability by Income Level.............................................................................................. 244
Debt Capacity Information
The following information is presented to assist the user in understanding and assessing the State's debt burden and its ability to issue additional debt.
Schedule C-1 Ratio of Outstanding Debt by Type........................................................................................................................... 245
Schedule C-2 Ratio of General Obligation Bonded Debt and Appropriation Bonds to Personal Income and Per Capita............... 246
Schedule C-3 Legal Debt Margin..................................................................................................................................................... 248
Schedule C-4 Department of Transportation Revenue Bond Coverage.......................................................................................... 249
Schedule C-5 Environmental Improvement Fund Revenue Bond Coverage................................................................................... 250
Schedule C-6 Petroleum Inspection Fee Revenue Bond Coverage................................................................................................ 251
Demographic and Economic Information
The following information provides demographic and economic indicators to assist the reader in understanding the socioeconomic environment within which the State's financial activities takes place.
Schedule D-1 Demographic and Economic Statistics...................................................................................................................... 252
230
State of WisconsinStatistical Section Narrative and Table of Contents
Page
Operating Information
The following information relates to the operations, services and resources provided within the State's financial environment.
Schedule E-1 Full Time Equivalent State Government Employees by Function/Program.............................................................. 254
Schedule E-2 Operating Indicators by Function.............................................................................................................................. 256
Schedule E-3 Capital Asset Statistics by Function.......................................................................................................................... 258
Schedule E-4 Local Government Property Insurance Fund Ten-Year Claims Development Information........................................ 260
Schedule E-5 Income Continuation Insurance Risk Pool Ten-Year Claims Development Information............................................ 262
Schedule E-6 Health Insurance Risk Pool (Pharmacy Benefit) Ten-Year Claims Development Information................................... 263
Schedule E-7 Health Insurance Risk Pool (Dental Benefit) Ten-Year Claims Development Information........................................ 264
Schedule E-8 Duty Disability Ten-Year Claims Development Information....................................................................................... 265
231
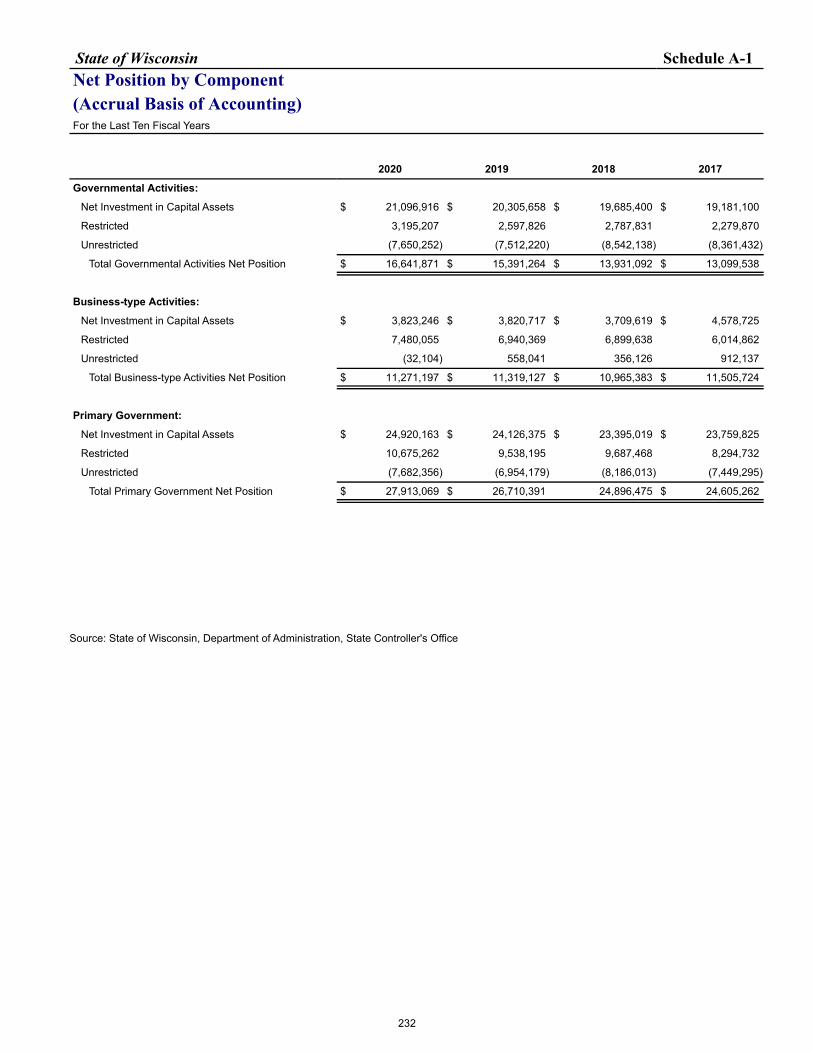
State of Wisconsin Schedule A-1Net Position by Component(Accrual Basis of Accounting)For the Last Ten Fiscal Years
2020 2019 2018 2017
Governmental Activities:
Net Investment in Capital Assets $ 21,096,916 $ 20,305,658 $ 19,685,400 $ 19,181,100
Restricted 3,195,207 2,597,826 2,787,831 2,279,870
Unrestricted (7,650,252) (7,512,220) (8,542,138) (8,361,432)
Total Governmental Activities Net Position $ 16,641,871 $ 15,391,264 $ 13,931,092 $ 13,099,538
Business-type Activities:
Net Investment in Capital Assets $ 3,823,246 $ 3,820,717 $ 3,709,619 $ 4,578,725
Restricted 7,480,055 6,940,369 6,899,638 6,014,862
Unrestricted (32,104) 558,041 356,126 912,137
Total Business-type Activities Net Position $ 11,271,197 $ 11,319,127 $ 10,965,383 $ 11,505,724
Primary Government:
Net Investment in Capital Assets $ 24,920,163 $ 24,126,375 $ 23,395,019 $ 23,759,825
Restricted 10,675,262 9,538,195 9,687,468 8,294,732
Unrestricted (7,682,356) (6,954,179) (8,186,013) (7,449,295)
Total Primary Government Net Position $ 27,913,069 $ 26,710,391 24,896,475 $ 24,605,262
Source: State of Wisconsin, Department of Administration, State Controller's Office
232
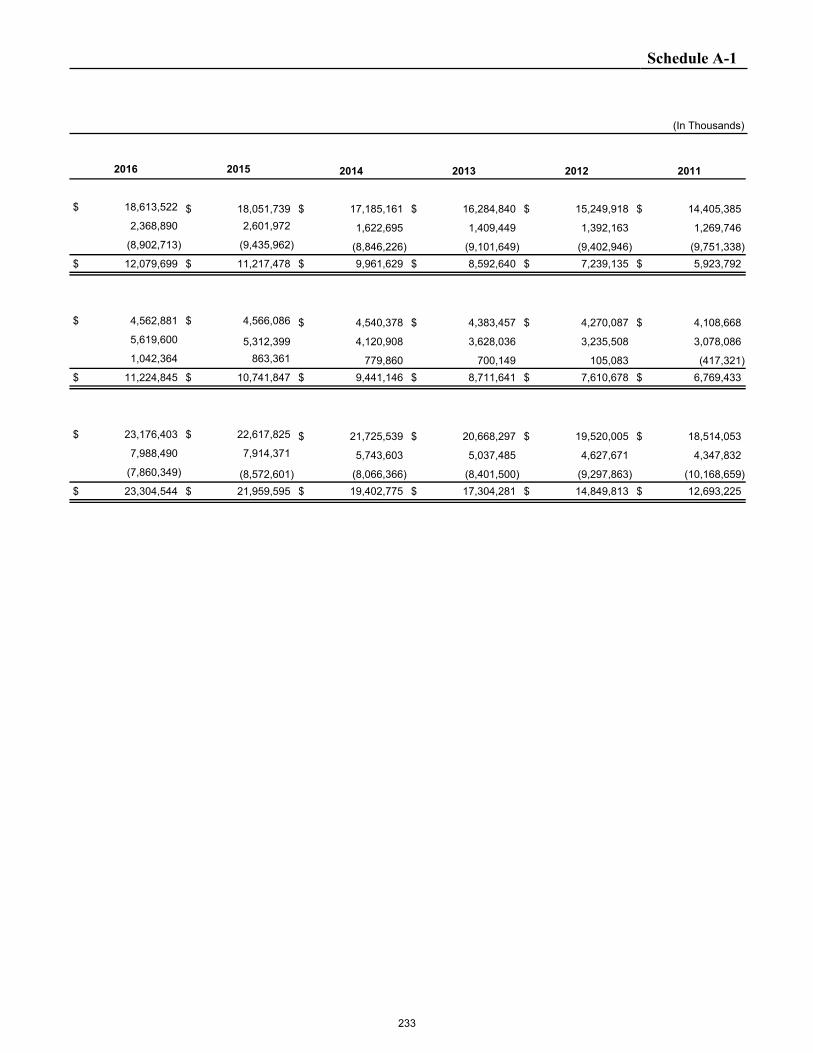
Schedule A-1
(In Thousands)
2016 2015 2014 2013 2012 2011
$ 18,613,522 $ 18,051,739 $ 17,185,161 $ 16,284,840 $ 15,249,918 $ 14,405,385 2,368,890 2,601,972 1,622,695 1,409,449 1,392,163 1,269,746 (8,902,713) (9,435,962) (8,846,226) (9,101,649) (9,402,946) (9,751,338) $ 12,079,699 $ 11,217,478 $ 9,961,629 $ 8,592,640 $ 7,239,135 $ 5,923,792
$ 4,562,881 $ 4,566,086 $ 4,540,378 $ 4,383,457 $ 4,270,087 $ 4,108,668 5,619,600 5,312,399 4,120,908 3,628,036 3,235,508 3,078,086 1,042,364 863,361 779,860 700,149 105,083 (417,321) $ 11,224,845 $ 10,741,847 $ 9,441,146 $ 8,711,641 $ 7,610,678 $ 6,769,433
$ 23,176,403 $ 22,617,825 $ 21,725,539 $ 20,668,297 $ 19,520,005 $ 18,514,053 7,988,490 7,914,371 5,743,603 5,037,485 4,627,671 4,347,832 (7,860,349) (8,572,601) (8,066,366) (8,401,500) (9,297,863) (10,168,659) $ 23,304,544 $ 21,959,595 $ 19,402,775 $ 17,304,281 $ 14,849,813 $ 12,693,225
233
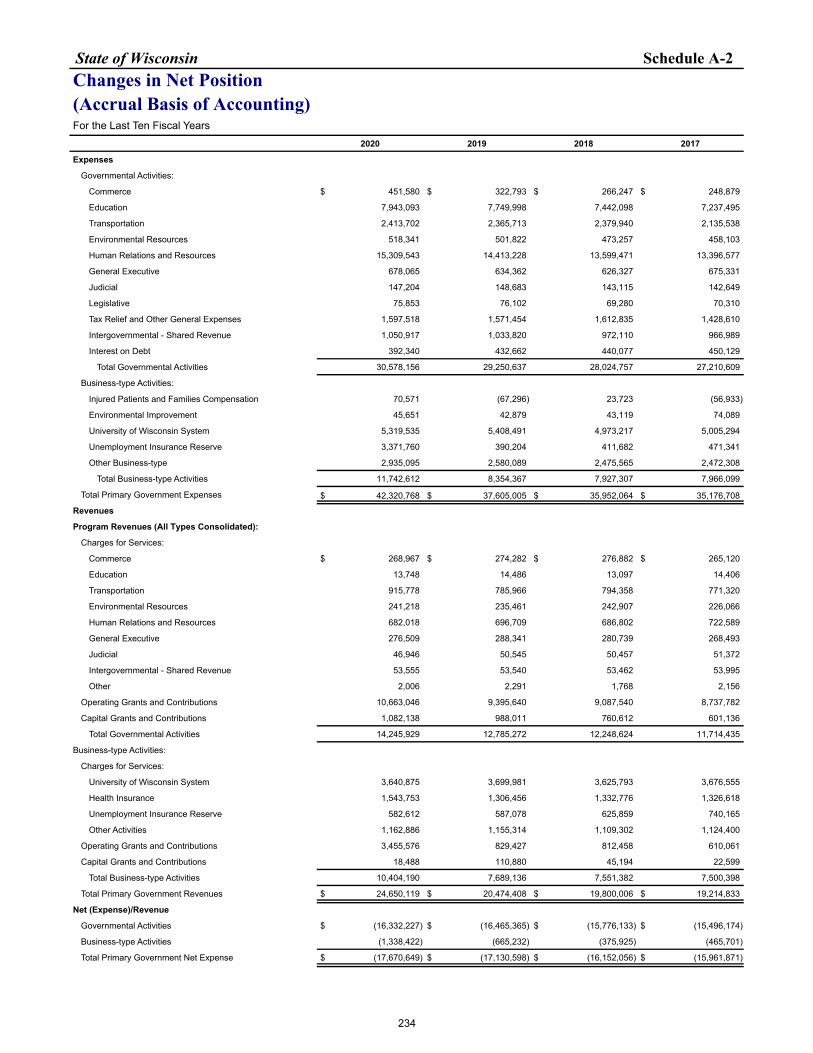
State of Wisconsin Schedule A-2Changes in Net Position(Accrual Basis of Accounting)For the Last Ten Fiscal Years
2020 2019 2018 2017
Expenses
Governmental Activities:
Commerce $ 451,580 $ 322,793 $ 266,247 $ 248,879
Education 7,943,093 7,749,998 7,442,098 7,237,495
Transportation 2,413,702 2,365,713 2,379,940 2,135,538
Environmental Resources 518,341 501,822 473,257 458,103
Human Relations and Resources 15,309,543 14,413,228 13,599,471 13,396,577
General Executive 678,065 634,362 626,327 675,331
Judicial 147,204 148,683 143,115 142,649
Legislative 75,853 76,102 69,280 70,310
Tax Relief and Other General Expenses 1,597,518 1,571,454 1,612,835 1,428,610
Intergovernmental - Shared Revenue 1,050,917 1,033,820 972,110 966,989
Interest on Debt 392,340 432,662 440,077 450,129
Total Governmental Activities 30,578,156 29,250,637 28,024,757 27,210,609
Business-type Activities:
Injured Patients and Families Compensation 70,571 (67,296) 23,723 (56,933)
Environmental Improvement 45,651 42,879 43,119 74,089
University of Wisconsin System 5,319,535 5,408,491 4,973,217 5,005,294
Unemployment Insurance Reserve 3,371,760 390,204 411,682 471,341
Other Business-type 2,935,095 2,580,089 2,475,565 2,472,308
Total Business-type Activities 11,742,612 8,354,367 7,927,307 7,966,099
Total Primary Government Expenses $ 42,320,768 $ 37,605,005 $ 35,952,064 $ 35,176,708
Revenues
Program Revenues (All Types Consolidated):
Charges for Services:
Commerce $ 268,967 $ 274,282 $ 276,882 $ 265,120
Education 13,748 14,486 13,097 14,406
Transportation 915,778 785,966 794,358 771,320
Environmental Resources 241,218 235,461 242,907 226,066
Human Relations and Resources 682,018 696,709 686,802 722,589
General Executive 276,509 288,341 280,739 268,493
Judicial 46,946 50,545 50,457 51,372
Intergovernmental - Shared Revenue 53,555 53,540 53,462 53,995
Other 2,006 2,291 1,768 2,156
Operating Grants and Contributions 10,663,046 9,395,640 9,087,540 8,737,782
Capital Grants and Contributions 1,082,138 988,011 760,612 601,136
Total Governmental Activities 14,245,929 12,785,272 12,248,624 11,714,435
Business-type Activities:
Charges for Services:
University of Wisconsin System 3,640,875 3,699,981 3,625,793 3,676,555
Health Insurance 1,543,753 1,306,456 1,332,776 1,326,618
Unemployment Insurance Reserve 582,612 587,078 625,859 740,165
Other Activities 1,162,886 1,155,314 1,109,302 1,124,400
Operating Grants and Contributions 3,455,576 829,427 812,458 610,061
Capital Grants and Contributions 18,488 110,880 45,194 22,599
Total Business-type Activities 10,404,190 7,689,136 7,551,382 7,500,398
Total Primary Government Revenues $ 24,650,119 $ 20,474,408 $ 19,800,006 $ 19,214,833
Net (Expense)/Revenue
Governmental Activities $ (16,332,227) $ (16,465,365) $ (15,776,133) $ (15,496,174)
Business-type Activities (1,338,422) (665,232) (375,925) (465,701)
Total Primary Government Net Expense $ (17,670,649) $ (17,130,598) $ (16,152,056) $ (15,961,871)
234
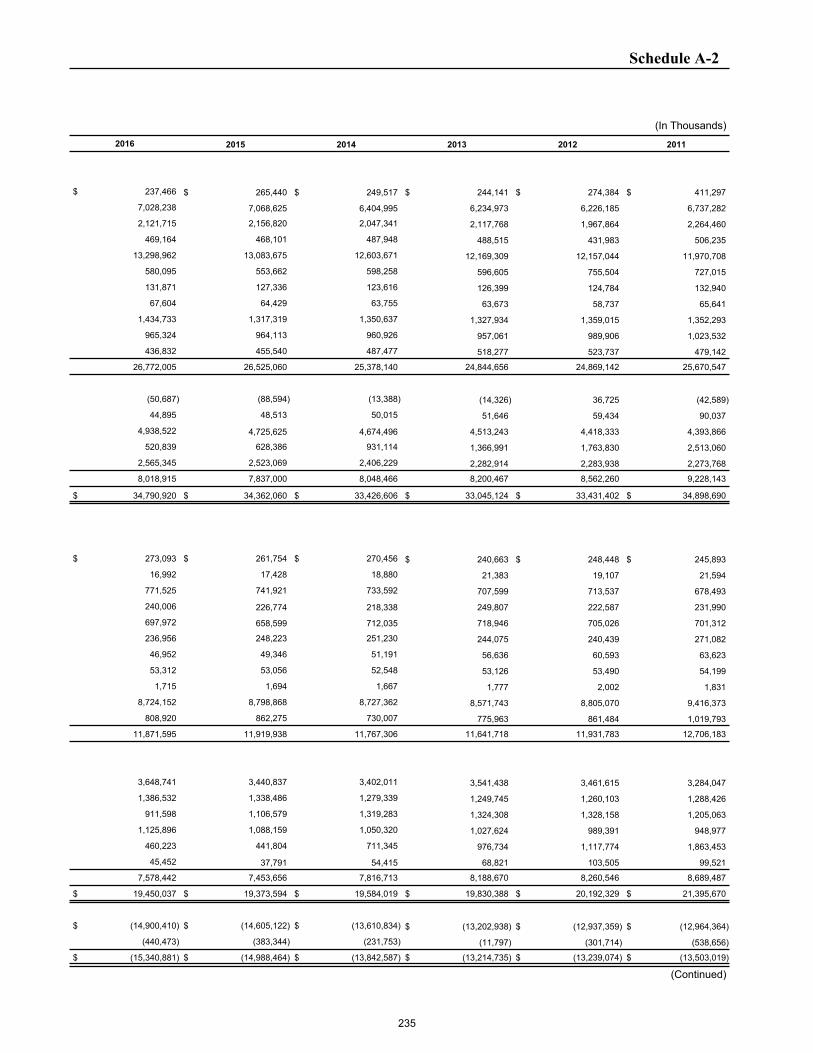
Schedule A-2
(In Thousands)2016 2015 2014 2013 2012 2011
$ 237,466 $ 265,440 $ 249,517 $ 244,141 $ 274,384 $ 411,297
7,028,238 7,068,625 6,404,995 6,234,973 6,226,185 6,737,282
2,121,715 2,156,820 2,047,341 2,117,768 1,967,864 2,264,460
469,164 468,101 487,948 488,515 431,983 506,235
13,298,962 13,083,675 12,603,671 12,169,309 12,157,044 11,970,708
580,095 553,662 598,258 596,605 755,504 727,015
131,871 127,336 123,616 126,399 124,784 132,940
67,604 64,429 63,755 63,673 58,737 65,641
1,434,733 1,317,319 1,350,637 1,327,934 1,359,015 1,352,293
965,324 964,113 960,926 957,061 989,906 1,023,532
436,832 455,540 487,477 518,277 523,737 479,142
26,772,005 26,525,060 25,378,140 24,844,656 24,869,142 25,670,547
(50,687) (88,594) (13,388) (14,326) 36,725 (42,589)
44,895 48,513 50,015 51,646 59,434 90,037
4,938,522 4,725,625 4,674,496 4,513,243 4,418,333 4,393,866
520,839 628,386 931,114 1,366,991 1,763,830 2,513,060
2,565,345 2,523,069 2,406,229 2,282,914 2,283,938 2,273,768
8,018,915 7,837,000 8,048,466 8,200,467 8,562,260 9,228,143
$ 34,790,920 $ 34,362,060 $ 33,426,606 $ 33,045,124 $ 33,431,402 $ 34,898,690
$ 273,093 $ 261,754 $ 270,456 $ 240,663 $ 248,448 $ 245,893
16,992 17,428 18,880 21,383 19,107 21,594
771,525 741,921 733,592 707,599 713,537 678,493
240,006 226,774 218,338 249,807 222,587 231,990
697,972 658,599 712,035 718,946 705,026 701,312
236,956 248,223 251,230 244,075 240,439 271,082
46,952 49,346 51,191 56,636 60,593 63,623
53,312 53,056 52,548 53,126 53,490 54,199
1,715 1,694 1,667 1,777 2,002 1,831
8,724,152 8,798,868 8,727,362 8,571,743 8,805,070 9,416,373
808,920 862,275 730,007 775,963 861,484 1,019,793
11,871,595 11,919,938 11,767,306 11,641,718 11,931,783 12,706,183
3,648,741 3,440,837 3,402,011 3,541,438 3,461,615 3,284,047
1,386,532 1,338,486 1,279,339 1,249,745 1,260,103 1,288,426
911,598 1,106,579 1,319,283 1,324,308 1,328,158 1,205,063
1,125,896 1,088,159 1,050,320 1,027,624 989,391 948,977
460,223 441,804 711,345 976,734 1,117,774 1,863,453
45,452 37,791 54,415 68,821 103,505 99,521
7,578,442 7,453,656 7,816,713 8,188,670 8,260,546 8,689,487
$ 19,450,037 $ 19,373,594 $ 19,584,019 $ 19,830,388 $ 20,192,329 $ 21,395,670
$ (14,900,410) $ (14,605,122) $ (13,610,834) $ (13,202,938) $ (12,937,359) $ (12,964,364)
(440,473) (383,344) (231,753) (11,797) (301,714) (538,656)
$ (15,340,881) $ (14,988,464) $ (13,842,587) $ (13,214,735) $ (13,239,074) $ (13,503,019)
(Continued)
235
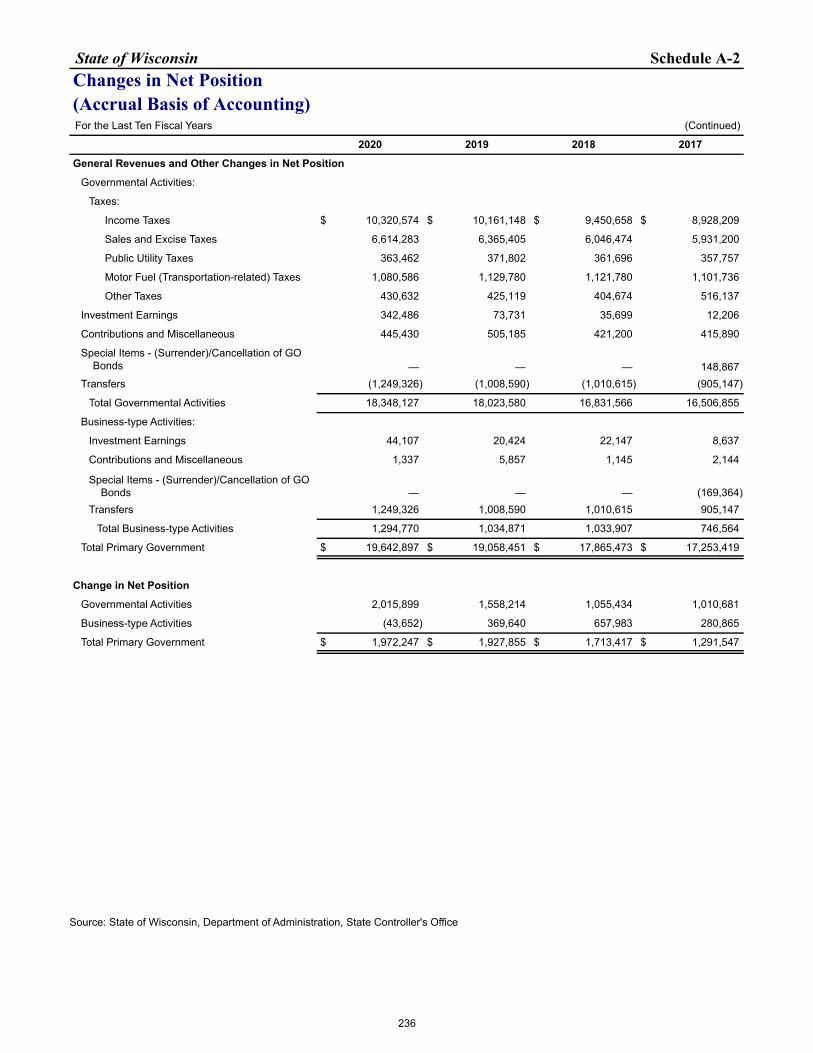
State of Wisconsin Schedule A-2Changes in Net Position(Accrual Basis of Accounting)For the Last Ten Fiscal Years (Continued)
2020 2019 2018 2017
General Revenues and Other Changes in Net Position
Governmental Activities:
Taxes:
Income Taxes $ 10,320,574 $ 10,161,148 $ 9,450,658 $ 8,928,209
Sales and Excise Taxes 6,614,283 6,365,405 6,046,474 5,931,200
Public Utility Taxes 363,462 371,802 361,696 357,757
Motor Fuel (Transportation-related) Taxes 1,080,586 1,129,780 1,121,780 1,101,736
Other Taxes 430,632 425,119 404,674 516,137
Investment Earnings 342,486 73,731 35,699 12,206
Contributions and Miscellaneous 445,430 505,185 421,200 415,890
Special Items - (Surrender)/Cancellation of GO Bonds — — — 148,867
Transfers (1,249,326) (1,008,590) (1,010,615) (905,147)
Total Governmental Activities 18,348,127 18,023,580 16,831,566 16,506,855
Business-type Activities:
Investment Earnings 44,107 20,424 22,147 8,637
Contributions and Miscellaneous 1,337 5,857 1,145 2,144
Special Items - (Surrender)/Cancellation of GO Bonds — — — (169,364)
Transfers 1,249,326 1,008,590 1,010,615 905,147
Total Business-type Activities 1,294,770 1,034,871 1,033,907 746,564
Total Primary Government $ 19,642,897 $ 19,058,451 $ 17,865,473 $ 17,253,419
Change in Net Position
Governmental Activities 2,015,899 1,558,214 1,055,434 1,010,681
Business-type Activities (43,652) 369,640 657,983 280,865
Total Primary Government $ 1,972,247 $ 1,927,855 $ 1,713,417 $ 1,291,547
Source: State of Wisconsin, Department of Administration, State Controller's Office
236
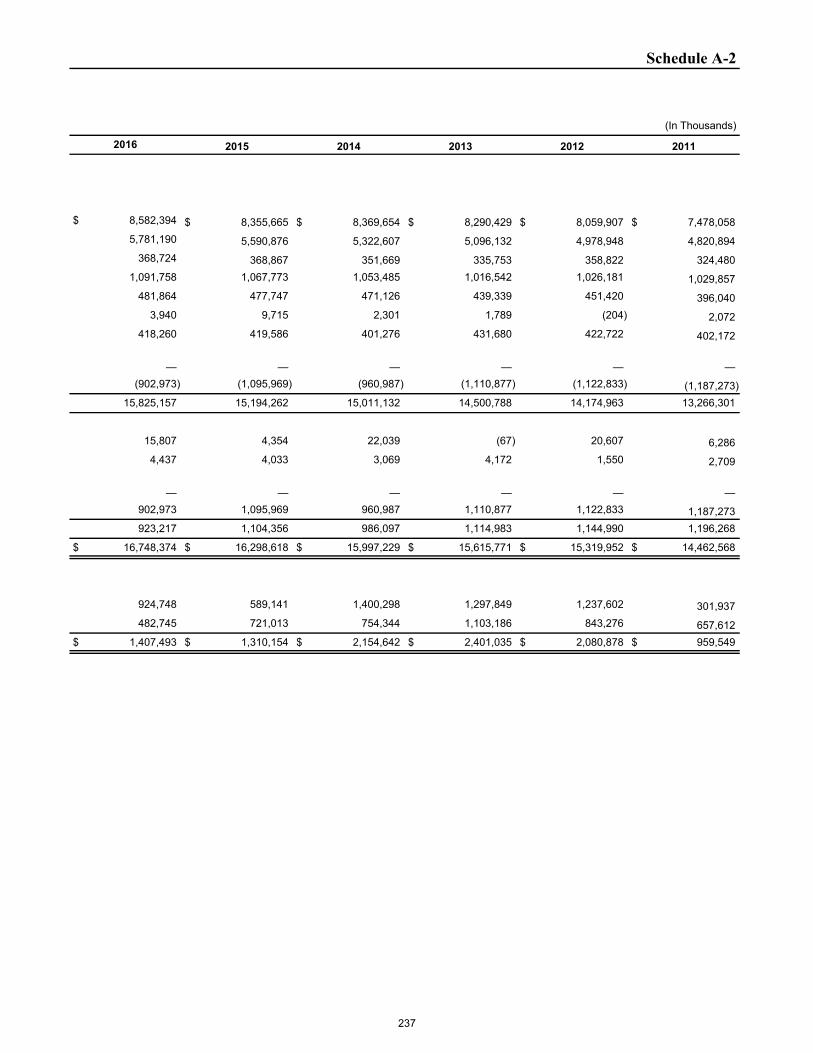
Schedule A-2
(In Thousands)
2016 2015 2014 2013 2012 2011
$ 8,582,394 $ 8,355,665 $ 8,369,654 $ 8,290,429 $ 8,059,907 $ 7,478,058 5,781,190 5,590,876 5,322,607 5,096,132 4,978,948 4,820,894 368,724 368,867 351,669 335,753 358,822 324,480 1,091,758 1,067,773 1,053,485 1,016,542 1,026,181 1,029,857 481,864 477,747 471,126 439,339 451,420 396,040 3,940 9,715 2,301 1,789 (204) 2,072 418,260 419,586 401,276 431,680 422,722 402,172
— — — — — — (902,973) (1,095,969) (960,987) (1,110,877) (1,122,833) (1,187,273) 15,825,157 15,194,262 15,011,132 14,500,788 14,174,963 13,266,301
15,807 4,354 22,039 (67) 20,607 6,286 4,437 4,033 3,069 4,172 1,550 2,709
— — — — — — 902,973 1,095,969 960,987 1,110,877 1,122,833 1,187,273 923,217 1,104,356 986,097 1,114,983 1,144,990 1,196,268
$ 16,748,374 $ 16,298,618 $ 15,997,229 $ 15,615,771 $ 15,319,952 $ 14,462,568
924,748 589,141 1,400,298 1,297,849 1,237,602 301,937 482,745 721,013 754,344 1,103,186 843,276 657,612 $ 1,407,493 $ 1,310,154 $ 2,154,642 $ 2,401,035 $ 2,080,878 $ 959,549
237
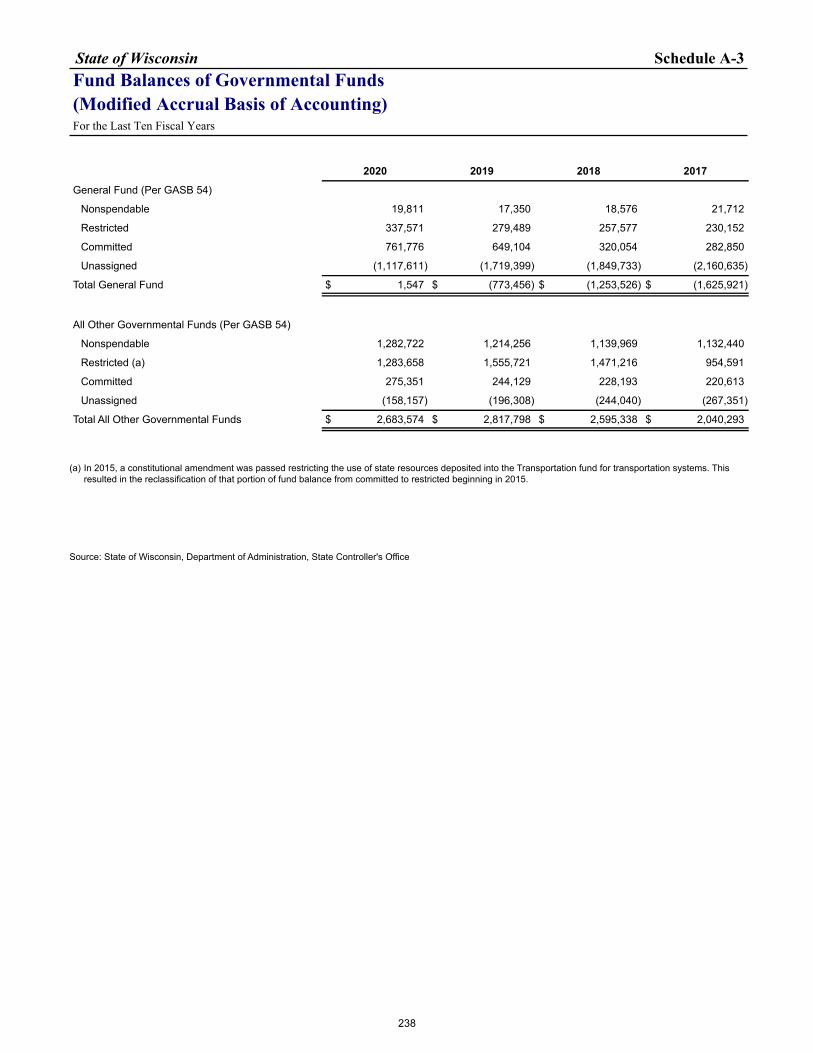
State of Wisconsin Schedule A-3Fund Balances of Governmental Funds(Modified Accrual Basis of Accounting)For the Last Ten Fiscal Years
2020 2019 2018 2017
General Fund (Per GASB 54)
Nonspendable 19,811 17,350 18,576 21,712
Restricted 337,571 279,489 257,577 230,152
Committed 761,776 649,104 320,054 282,850
Unassigned (1,117,611) (1,719,399) (1,849,733) (2,160,635)
Total General Fund $ 1,547 $ (773,456) $ (1,253,526) $ (1,625,921)
All Other Governmental Funds (Per GASB 54)
Nonspendable 1,282,722 1,214,256 1,139,969 1,132,440
Restricted (a) 1,283,658 1,555,721 1,471,216 954,591
Committed 275,351 244,129 228,193 220,613
Unassigned (158,157) (196,308) (244,040) (267,351)
Total All Other Governmental Funds $ 2,683,574 $ 2,817,798 $ 2,595,338 $ 2,040,293
(a) In 2015, a constitutional amendment was passed restricting the use of state resources deposited into the Transportation fund for transportation systems. This resulted in the reclassification of that portion of fund balance from committed to restricted beginning in 2015.
Source: State of Wisconsin, Department of Administration, State Controller's Office
238
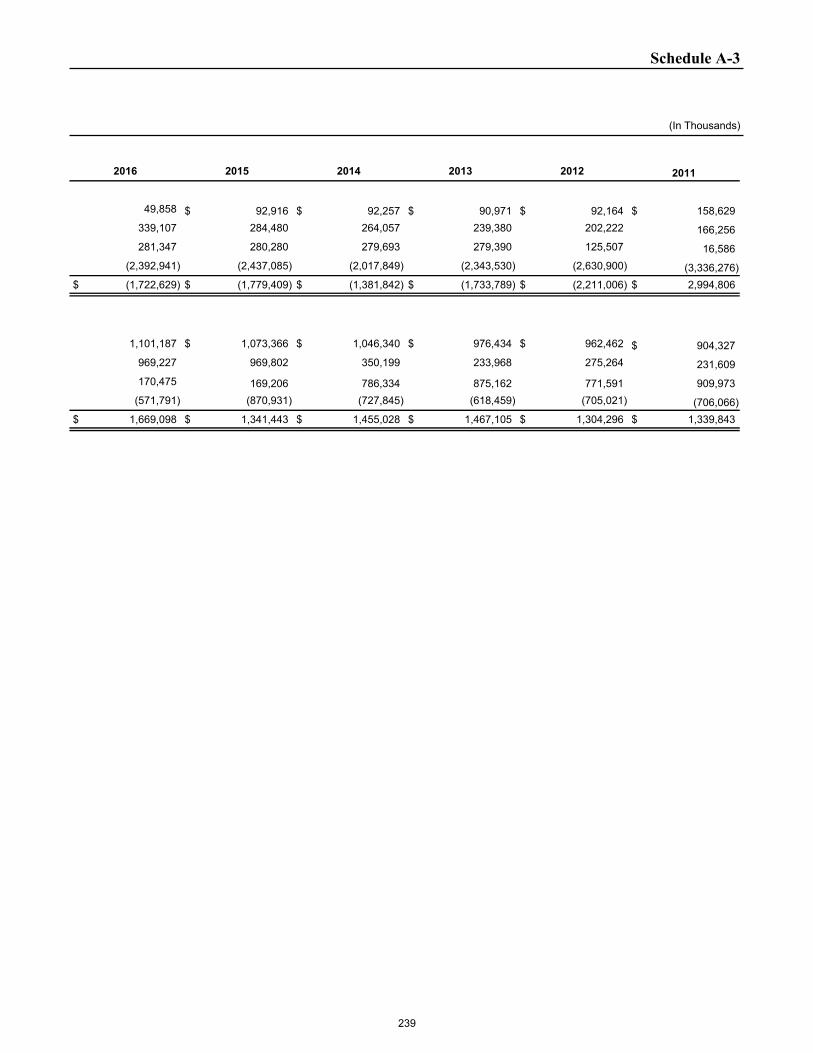
Schedule A-3
(In Thousands)
2016 2015 2014 2013 2012 2011
49,858 $ 92,916 $ 92,257 $ 90,971 $ 92,164 $ 158,629 339,107 284,480 264,057 239,380 202,222 166,256 281,347 280,280 279,693 279,390 125,507 16,586 (2,392,941) (2,437,085) (2,017,849) (2,343,530) (2,630,900) (3,336,276) $ (1,722,629) $ (1,779,409) $ (1,381,842) $ (1,733,789) $ (2,211,006) $ 2,994,806
1,101,187 $ 1,073,366 $ 1,046,340 $ 976,434 $ 962,462 $ 904,327 969,227 969,802 350,199 233,968 275,264 231,609 170,475 169,206 786,334 875,162 771,591 909,973 (571,791) (870,931) (727,845) (618,459) (705,021) (706,066) $ 1,669,098 $ 1,341,443 $ 1,455,028 $ 1,467,105 $ 1,304,296 $ 1,339,843
239
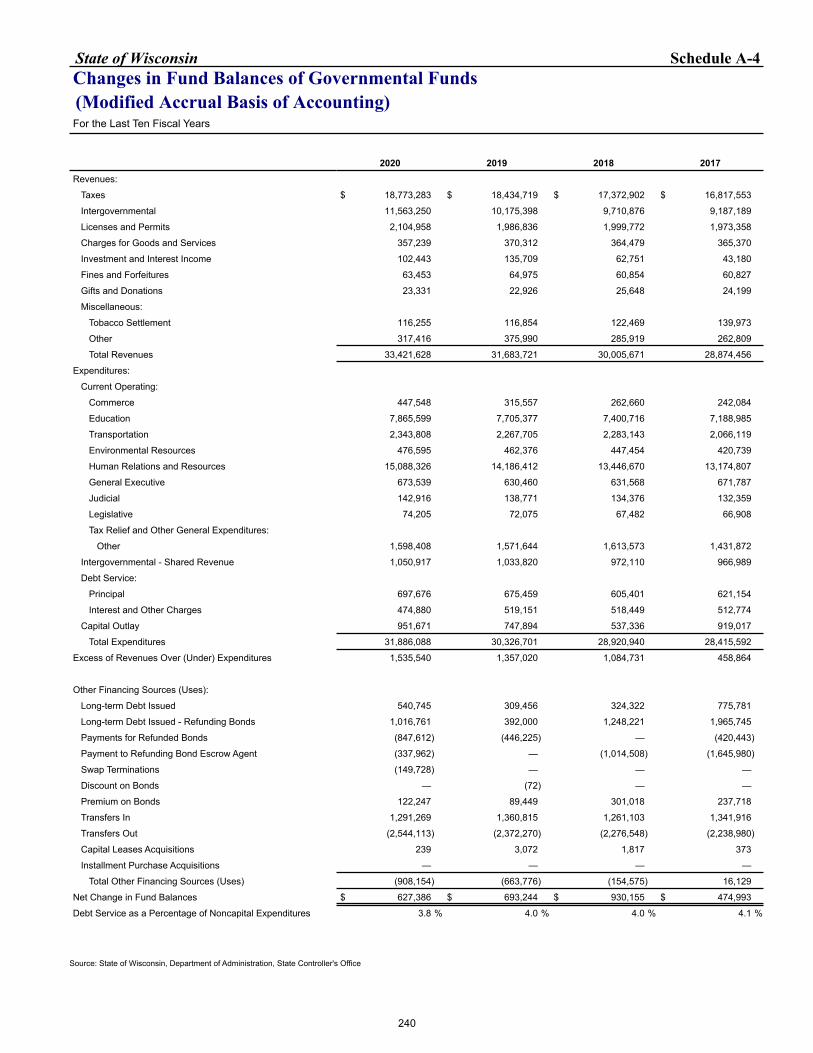
State of Wisconsin Schedule A-4Changes in Fund Balances of Governmental Funds(Modified Accrual Basis of Accounting)For the Last Ten Fiscal Years
2020 2019 2018 2017Revenues:
Taxes $ 18,773,283 $ 18,434,719 $ 17,372,902 $ 16,817,553
Intergovernmental 11,563,250 10,175,398 9,710,876 9,187,189
Licenses and Permits 2,104,958 1,986,836 1,999,772 1,973,358
Charges for Goods and Services 357,239 370,312 364,479 365,370
Investment and Interest Income 102,443 135,709 62,751 43,180
Fines and Forfeitures 63,453 64,975 60,854 60,827
Gifts and Donations 23,331 22,926 25,648 24,199
Miscellaneous:
Tobacco Settlement 116,255 116,854 122,469 139,973
Other 317,416 375,990 285,919 262,809
Total Revenues 33,421,628 31,683,721 30,005,671 28,874,456
Expenditures:
Current Operating:
Commerce 447,548 315,557 262,660 242,084
Education 7,865,599 7,705,377 7,400,716 7,188,985
Transportation 2,343,808 2,267,705 2,283,143 2,066,119
Environmental Resources 476,595 462,376 447,454 420,739
Human Relations and Resources 15,088,326 14,186,412 13,446,670 13,174,807
General Executive 673,539 630,460 631,568 671,787
Judicial 142,916 138,771 134,376 132,359
Legislative 74,205 72,075 67,482 66,908
Tax Relief and Other General Expenditures:
Other 1,598,408 1,571,644 1,613,573 1,431,872
Intergovernmental - Shared Revenue 1,050,917 1,033,820 972,110 966,989
Debt Service:
Principal 697,676 675,459 605,401 621,154
Interest and Other Charges 474,880 519,151 518,449 512,774
Capital Outlay 951,671 747,894 537,336 919,017
Total Expenditures 31,886,088 30,326,701 28,920,940 28,415,592
Excess of Revenues Over (Under) Expenditures 1,535,540 1,357,020 1,084,731 458,864
Other Financing Sources (Uses):
Long-term Debt Issued 540,745 309,456 324,322 775,781
Long-term Debt Issued - Refunding Bonds 1,016,761 392,000 1,248,221 1,965,745
Payments for Refunded Bonds (847,612) (446,225) — (420,443)
Payment to Refunding Bond Escrow Agent (337,962) — (1,014,508) (1,645,980)
Swap Terminations (149,728) — — —
Discount on Bonds — (72) — —
Premium on Bonds 122,247 89,449 301,018 237,718
Transfers In 1,291,269 1,360,815 1,261,103 1,341,916
Transfers Out (2,544,113) (2,372,270) (2,276,548) (2,238,980)
Capital Leases Acquisitions 239 3,072 1,817 373
Installment Purchase Acquisitions — — — —
Total Other Financing Sources (Uses) (908,154) (663,776) (154,575) 16,129
Net Change in Fund Balances $ 627,386 $ 693,244 $ 930,155 $ 474,993
Debt Service as a Percentage of Noncapital Expenditures 3.8 % 4.0 % 4.0 % 4.1 %
Source: State of Wisconsin, Department of Administration, State Controller's Office
240
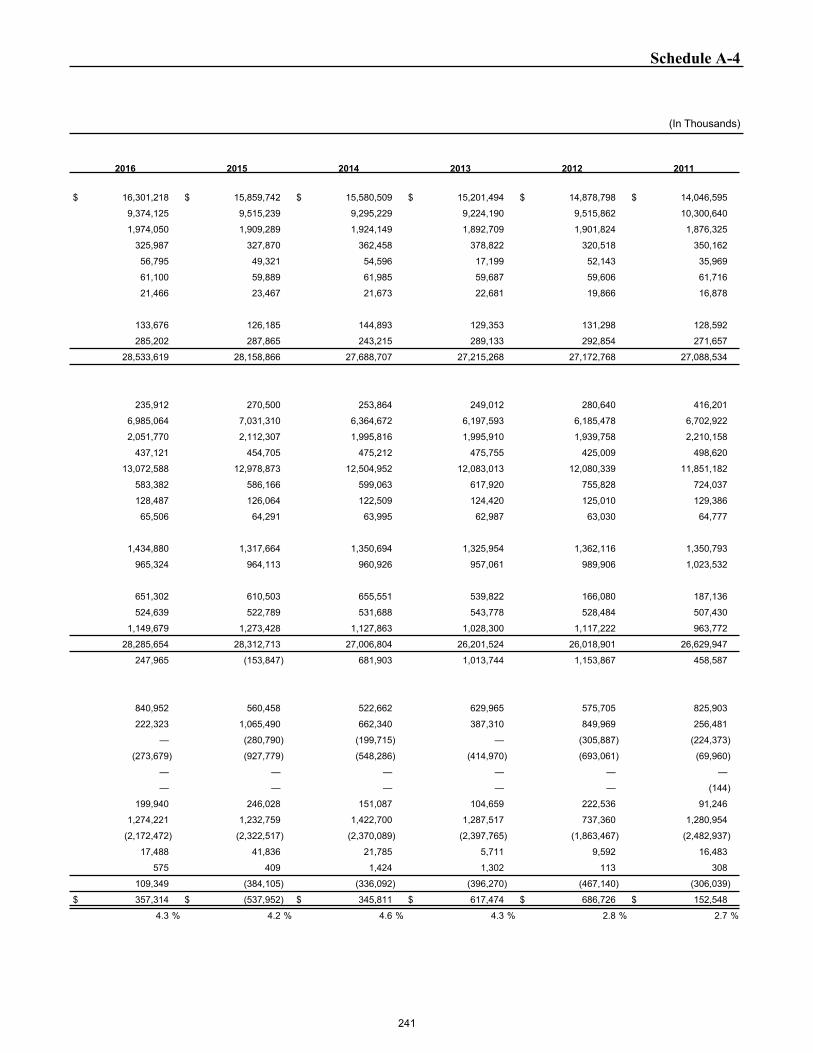
Schedule A-4
(In Thousands)
2016 2015 2014 2013 2012 2011
$ 16,301,218 $ 15,859,742 $ 15,580,509 $ 15,201,494 $ 14,878,798 $ 14,046,595
9,374,125 9,515,239 9,295,229 9,224,190 9,515,862 10,300,640
1,974,050 1,909,289 1,924,149 1,892,709 1,901,824 1,876,325
325,987 327,870 362,458 378,822 320,518 350,162
56,795 49,321 54,596 17,199 52,143 35,969
61,100 59,889 61,985 59,687 59,606 61,716
21,466 23,467 21,673 22,681 19,866 16,878
133,676 126,185 144,893 129,353 131,298 128,592
285,202 287,865 243,215 289,133 292,854 271,657
28,533,619 28,158,866 27,688,707 27,215,268 27,172,768 27,088,534
235,912 270,500 253,864 249,012 280,640 416,201
6,985,064 7,031,310 6,364,672 6,197,593 6,185,478 6,702,922
2,051,770 2,112,307 1,995,816 1,995,910 1,939,758 2,210,158
437,121 454,705 475,212 475,755 425,009 498,620
13,072,588 12,978,873 12,504,952 12,083,013 12,080,339 11,851,182
583,382 586,166 599,063 617,920 755,828 724,037
128,487 126,064 122,509 124,420 125,010 129,386
65,506 64,291 63,995 62,987 63,030 64,777
1,434,880 1,317,664 1,350,694 1,325,954 1,362,116 1,350,793
965,324 964,113 960,926 957,061 989,906 1,023,532
651,302 610,503 655,551 539,822 166,080 187,136
524,639 522,789 531,688 543,778 528,484 507,430
1,149,679 1,273,428 1,127,863 1,028,300 1,117,222 963,772
28,285,654 28,312,713 27,006,804 26,201,524 26,018,901 26,629,947
247,965 (153,847) 681,903 1,013,744 1,153,867 458,587
840,952 560,458 522,662 629,965 575,705 825,903
222,323 1,065,490 662,340 387,310 849,969 256,481
— (280,790) (199,715) — (305,887) (224,373)
(273,679) (927,779) (548,286) (414,970) (693,061) (69,960)
— — — — — —
— — — — — (144)
199,940 246,028 151,087 104,659 222,536 91,246
1,274,221 1,232,759 1,422,700 1,287,517 737,360 1,280,954
(2,172,472) (2,322,517) (2,370,089) (2,397,765) (1,863,467) (2,482,937)
17,488 41,836 21,785 5,711 9,592 16,483
575 409 1,424 1,302 113 308
109,349 (384,105) (336,092) (396,270) (467,140) (306,039)
$ 357,314 $ (537,952) $ 345,811 $ 617,474 $ 686,726 $ 152,548
4.3 % 4.2 % 4.6 % 4.3 % 2.8 % 2.7 %
241
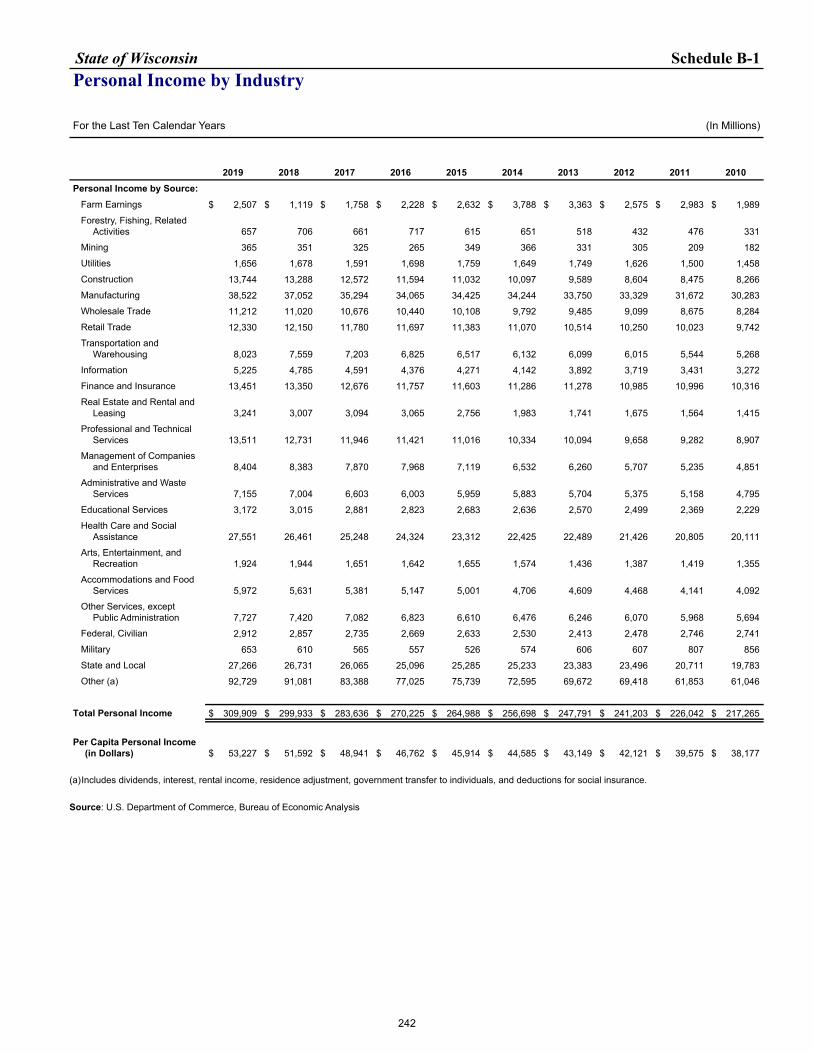
State of Wisconsin Schedule B-1Personal Income by Industry
For the Last Ten Calendar Years (In Millions)
2019 2018 2017 2016 2015 2014 2013 2012 2011 2010Personal Income by Source:
Farm Earnings $ 2,507 $ 1,119 $ 1,758 $ 2,228 $ 2,632 $ 3,788 $ 3,363 $ 2,575 $ 2,983 $ 1,989
Forestry, Fishing, Related Activities 657 706 661 717 615 651 518 432 476 331
Mining 365 351 325 265 349 366 331 305 209 182
Utilities 1,656 1,678 1,591 1,698 1,759 1,649 1,749 1,626 1,500 1,458
Construction 13,744 13,288 12,572 11,594 11,032 10,097 9,589 8,604 8,475 8,266
Manufacturing 38,522 37,052 35,294 34,065 34,425 34,244 33,750 33,329 31,672 30,283
Wholesale Trade 11,212 11,020 10,676 10,440 10,108 9,792 9,485 9,099 8,675 8,284
Retail Trade 12,330 12,150 11,780 11,697 11,383 11,070 10,514 10,250 10,023 9,742
Transportation and Warehousing 8,023 7,559 7,203 6,825 6,517 6,132 6,099 6,015 5,544 5,268
Information 5,225 4,785 4,591 4,376 4,271 4,142 3,892 3,719 3,431 3,272
Finance and Insurance 13,451 13,350 12,676 11,757 11,603 11,286 11,278 10,985 10,996 10,316
Real Estate and Rental and Leasing 3,241 3,007 3,094 3,065 2,756 1,983 1,741 1,675 1,564 1,415
Professional and Technical Services 13,511 12,731 11,946 11,421 11,016 10,334 10,094 9,658 9,282 8,907
Management of Companies and Enterprises 8,404 8,383 7,870 7,968 7,119 6,532 6,260 5,707 5,235 4,851
Administrative and Waste Services 7,155 7,004 6,603 6,003 5,959 5,883 5,704 5,375 5,158 4,795
Educational Services 3,172 3,015 2,881 2,823 2,683 2,636 2,570 2,499 2,369 2,229
Health Care and Social Assistance 27,551 26,461 25,248 24,324 23,312 22,425 22,489 21,426 20,805 20,111
Arts, Entertainment, and Recreation 1,924 1,944 1,651 1,642 1,655 1,574 1,436 1,387 1,419 1,355
Accommodations and Food Services 5,972 5,631 5,381 5,147 5,001 4,706 4,609 4,468 4,141 4,092
Other Services, except Public Administration 7,727 7,420 7,082 6,823 6,610 6,476 6,246 6,070 5,968 5,694
Federal, Civilian 2,912 2,857 2,735 2,669 2,633 2,530 2,413 2,478 2,746 2,741
Military 653 610 565 557 526 574 606 607 807 856
State and Local 27,266 26,731 26,065 25,096 25,285 25,233 23,383 23,496 20,711 19,783
Other (a) 92,729 91,081 83,388 77,025 75,739 72,595 69,672 69,418 61,853 61,046
Total Personal Income $ 309,909 $ 299,933 $ 283,636 $ 270,225 $ 264,988 $ 256,698 $ 247,791 $ 241,203 $ 226,042 $ 217,265
Per Capita Personal Income (in Dollars) $ 53,227 $ 51,592 $ 48,941 $ 46,762 $ 45,914 $ 44,585 $ 43,149 $ 42,121 $ 39,575 $ 38,177
(a)Includes dividends, interest, rental income, residence adjustment, government transfer to individuals, and deductions for social insurance.
Source: U.S. Department of Commerce, Bureau of Economic Analysis
242
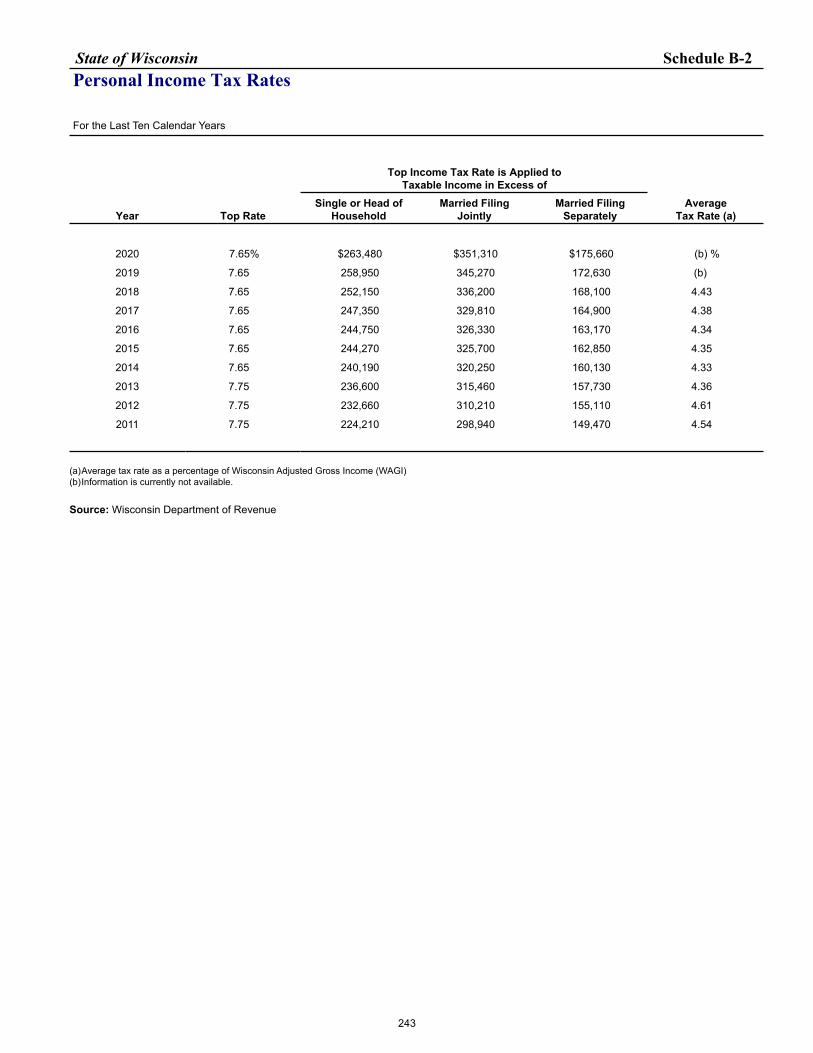
State of Wisconsin Schedule B-2Personal Income Tax Rates
For the Last Ten Calendar Years
Year Top Rate
Top Income Tax Rate is Applied to Taxable Income in Excess of
AverageTax Rate (a)
Single or Head of Household
Married Filing Jointly
Married Filing Separately
2020 7.65% $263,480 $351,310 $175,660 (b) %
2019 7.65 258,950 345,270 172,630 (b)
2018 7.65 252,150 336,200 168,100 4.43
2017 7.65 247,350 329,810 164,900 4.38
2016 7.65 244,750 326,330 163,170 4.34
2015 7.65 244,270 325,700 162,850 4.35
2014 7.65 240,190 320,250 160,130 4.33
2013 7.75 236,600 315,460 157,730 4.36
2012 7.75 232,660 310,210 155,110 4.61
2011 7.75 224,210 298,940 149,470 4.54
(a)Average tax rate as a percentage of Wisconsin Adjusted Gross Income (WAGI)(b)Information is currently not available.
Source: Wisconsin Department of Revenue
243
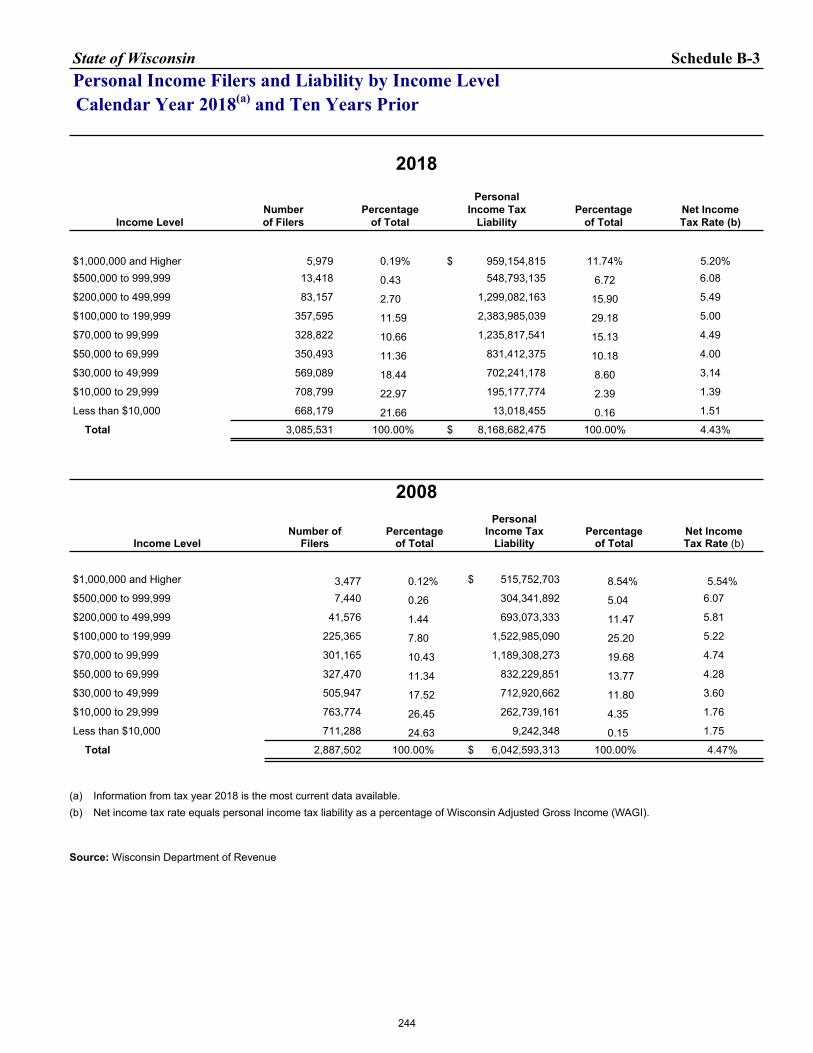
State of Wisconsin Schedule B-3Personal Income Filers and Liability by Income LevelCalendar Year 2018(a) and Ten Years Prior
2018
Income LevelNumber of Filers
Percentage of Total
PersonalIncome Tax
LiabilityPercentage
of TotalNet Income Tax Rate (b)
$1,000,000 and Higher 5,979 0.19% $ 959,154,815 11.74% 5.20%$500,000 to 999,999 13,418 0.43 548,793,135 6.72 6.08
$200,000 to 499,999 83,157 2.70 1,299,082,163 15.90 5.49
$100,000 to 199,999 357,595 11.59 2,383,985,039 29.18 5.00
$70,000 to 99,999 328,822 10.66 1,235,817,541 15.13 4.49
$50,000 to 69,999 350,493 11.36 831,412,375 10.18 4.00
$30,000 to 49,999 569,089 18.44 702,241,178 8.60 3.14
$10,000 to 29,999 708,799 22.97 195,177,774 2.39 1.39
Less than $10,000 668,179 21.66 13,018,455 0.16 1.51
Total 3,085,531 100.00% $ 8,168,682,475 100.00% 4.43%
2008
Income LevelNumber of
FilersPercentage
of Total
PersonalIncome Tax
LiabilityPercentage
of TotalNet Income Tax Rate (b)
$1,000,000 and Higher 3,477 0.12% $ 515,752,703 8.54% 5.54%$500,000 to 999,999 7,440 0.26 304,341,892 5.04 6.07
$200,000 to 499,999 41,576 1.44 693,073,333 11.47 5.81
$100,000 to 199,999 225,365 7.80 1,522,985,090 25.20 5.22
$70,000 to 99,999 301,165 10.43 1,189,308,273 19.68 4.74
$50,000 to 69,999 327,470 11.34 832,229,851 13.77 4.28
$30,000 to 49,999 505,947 17.52 712,920,662 11.80 3.60
$10,000 to 29,999 763,774 26.45 262,739,161 4.35 1.76
Less than $10,000 711,288 24.63 9,242,348 0.15 1.75
Total 2,887,502 100.00% $ 6,042,593,313 100.00% 4.47%
(a) Information from tax year 2018 is the most current data available.(b) Net income tax rate equals personal income tax liability as a percentage of Wisconsin Adjusted Gross Income (WAGI).
Source: Wisconsin Department of Revenue
244
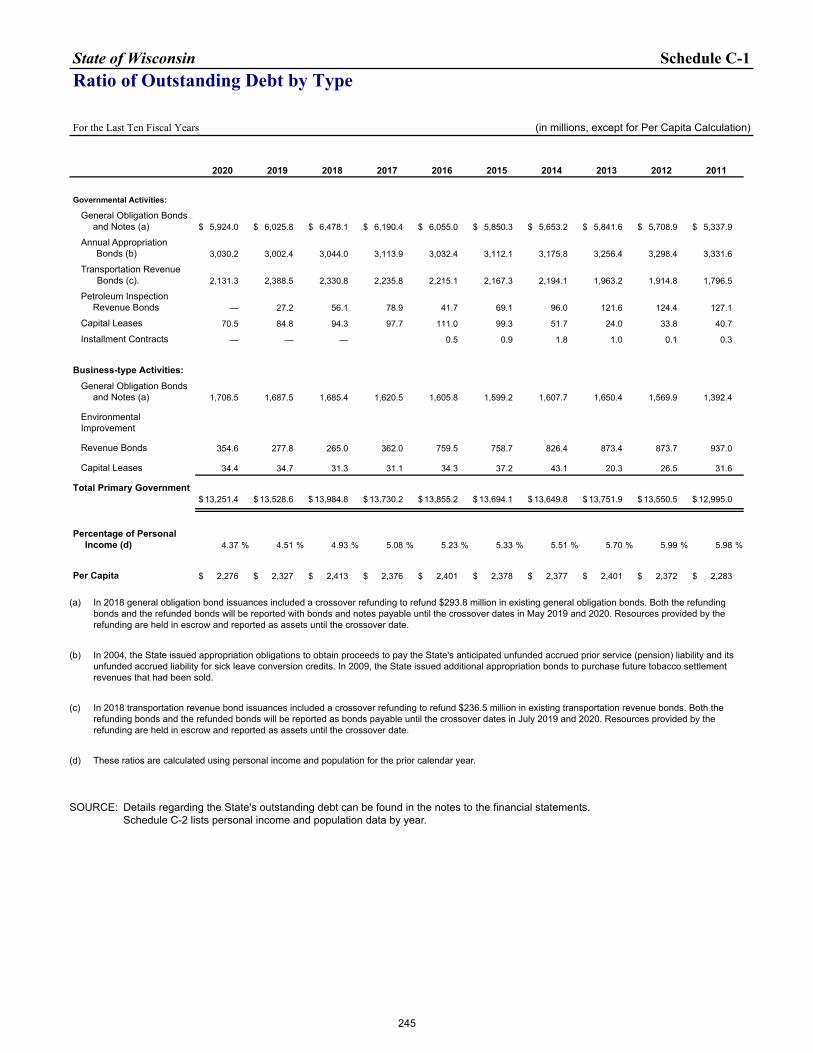
State of Wisconsin Schedule C-1Ratio of Outstanding Debt by Type
For the Last Ten Fiscal Years (in millions, except for Per Capita Calculation)
2020 2019 2018 2017 2016 2015 2014 2013 2012 2011
Governmental Activities:
General Obligation Bonds and Notes (a) $ 5,924.0 $ 6,025.8 $ 6,478.1 $ 6,190.4 $ 6,055.0 $ 5,850.3 $ 5,653.2 $ 5,841.6 $ 5,708.9 $ 5,337.9
Annual Appropriation Bonds (b) 3,030.2 3,002.4 3,044.0 3,113.9 3,032.4 3,112.1 3,175.8 3,256.4 3,298.4 3,331.6
Transportation Revenue Bonds (c). 2,131.3 2,388.5 2,330.8 2,235.8 2,215.1 2,167.3 2,194.1 1,963.2 1,914.8 1,796.5
Petroleum Inspection Revenue Bonds — 27.2 56.1 78.9 41.7 69.1 96.0 121.6 124.4 127.1
Capital Leases 70.5 84.8 94.3 97.7 111.0 99.3 51.7 24.0 33.8 40.7
Installment Contracts — — — 0.5 0.9 1.8 1.0 0.1 0.3
Business-type Activities:General Obligation Bonds
and Notes (a) 1,706.5 1,687.5 1,685.4 1,620.5 1,605.8 1,599.2 1,607.7 1,650.4 1,569.9 1,392.4
Environmental Improvement
Revenue Bonds 354.6 277.8 265.0 362.0 759.5 758.7 826.4 873.4 873.7 937.0
Capital Leases 34.4 34.7 31.3 31.1 34.3 37.2 43.1 20.3 26.5 31.6
Total Primary Government$ 13,251.4 $ 13,528.6 $ 13,984.8 $ 13,730.2 $ 13,855.2 $ 13,694.1 $ 13,649.8 $ 13,751.9 $ 13,550.5 $ 12,995.0
Percentage of PersonalIncome (d) 4.37 % 4.51 % 4.93 % 5.08 % 5.23 % 5.33 % 5.51 % 5.70 % 5.99 % 5.98 %
Per Capita $ 2,276 $ 2,327 $ 2,413 $ 2,376 $ 2,401 $ 2,378 $ 2,377 $ 2,401 $ 2,372 $ 2,283
(a) In 2018 general obligation bond issuances included a crossover refunding to refund $293.8 million in existing general obligation bonds. Both the refunding bonds and the refunded bonds will be reported with bonds and notes payable until the crossover dates in May 2019 and 2020. Resources provided by the refunding are held in escrow and reported as assets until the crossover date.
(b) In 2004, the State issued appropriation obligations to obtain proceeds to pay the State's anticipated unfunded accrued prior service (pension) liability and its unfunded accrued liability for sick leave conversion credits. In 2009, the State issued additional appropriation bonds to purchase future tobacco settlement revenues that had been sold.
(c) In 2018 transportation revenue bond issuances included a crossover refunding to refund $236.5 million in existing transportation revenue bonds. Both the refunding bonds and the refunded bonds will be reported as bonds payable until the crossover dates in July 2019 and 2020. Resources provided by the refunding are held in escrow and reported as assets until the crossover date.
(d) These ratios are calculated using personal income and population for the prior calendar year.
SOURCE: Details regarding the State's outstanding debt can be found in the notes to the financial statements.Schedule C-2 lists personal income and population data by year.
245
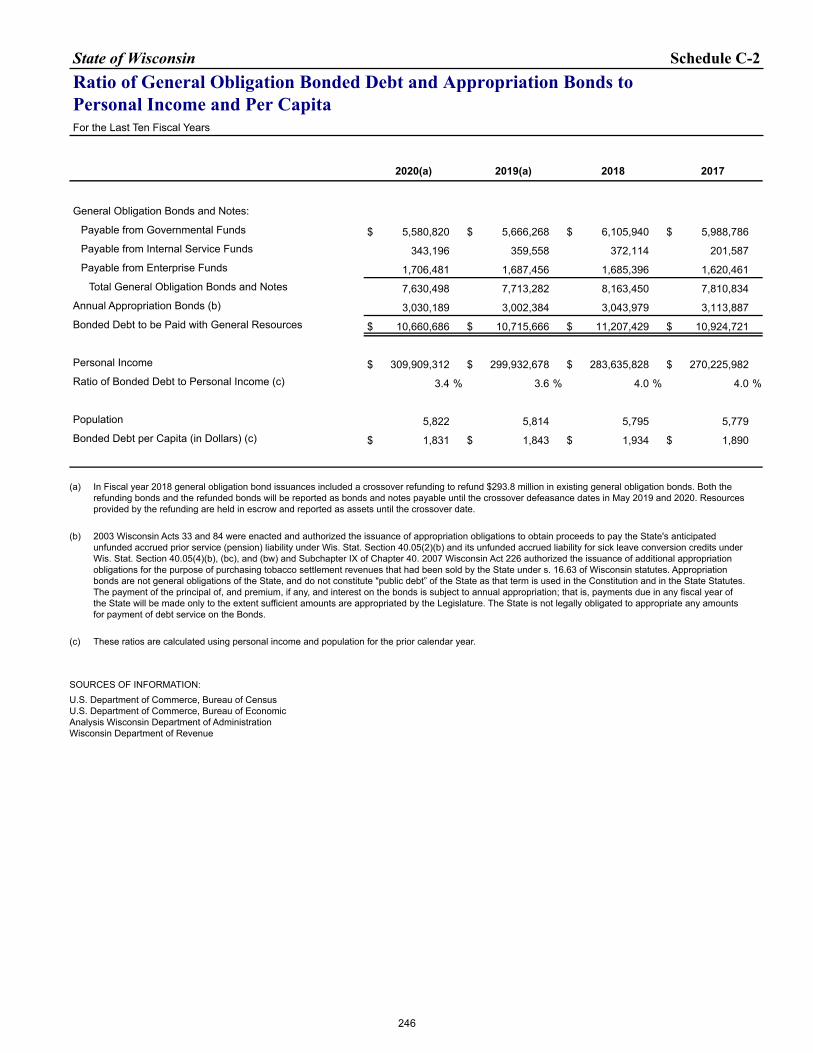
State of Wisconsin Schedule C-2Ratio of General Obligation Bonded Debt and Appropriation Bonds to Personal Income and Per CapitaFor the Last Ten Fiscal Years
2020(a) 2019(a) 2018 2017
General Obligation Bonds and Notes:
Payable from Governmental Funds $ 5,580,820 $ 5,666,268 $ 6,105,940 $ 5,988,786 Payable from Internal Service Funds 343,196 359,558 372,114 201,587 Payable from Enterprise Funds 1,706,481 1,687,456 1,685,396 1,620,461
Total General Obligation Bonds and Notes 7,630,498 7,713,282 8,163,450 7,810,834 Annual Appropriation Bonds (b) 3,030,189 3,002,384 3,043,979 3,113,887 Bonded Debt to be Paid with General Resources $ 10,660,686 $ 10,715,666 $ 11,207,429 $ 10,924,721
Personal Income $ 309,909,312 $ 299,932,678 $ 283,635,828 $ 270,225,982 Ratio of Bonded Debt to Personal Income (c) 3.4 % 3.6 % 4.0 % 4.0 %
Population 5,822 5,814 5,795 5,779 Bonded Debt per Capita (in Dollars) (c) $ 1,831 $ 1,843 $ 1,934 $ 1,890
(a) In Fiscal year 2018 general obligation bond issuances included a crossover refunding to refund $293.8 million in existing general obligation bonds. Both the refunding bonds and the refunded bonds will be reported as bonds and notes payable until the crossover defeasance dates in May 2019 and 2020. Resources provided by the refunding are held in escrow and reported as assets until the crossover date.
(b) 2003 Wisconsin Acts 33 and 84 were enacted and authorized the issuance of appropriation obligations to obtain proceeds to pay the State's anticipated unfunded accrued prior service (pension) liability under Wis. Stat. Section 40.05(2)(b) and its unfunded accrued liability for sick leave conversion credits under Wis. Stat. Section 40.05(4)(b), (bc), and (bw) and Subchapter IX of Chapter 40. 2007 Wisconsin Act 226 authorized the issuance of additional appropriation obligations for the purpose of purchasing tobacco settlement revenues that had been sold by the State under s. 16.63 of Wisconsin statutes. Appropriation bonds are not general obligations of the State, and do not constitute "public debt” of the State as that term is used in the Constitution and in the State Statutes. The payment of the principal of, and premium, if any, and interest on the bonds is subject to annual appropriation; that is, payments due in any fiscal year of the State will be made only to the extent sufficient amounts are appropriated by the Legislature. The State is not legally obligated to appropriate any amounts for payment of debt service on the Bonds.
(c) These ratios are calculated using personal income and population for the prior calendar year.
SOURCES OF INFORMATION:U.S. Department of Commerce, Bureau of CensusU.S. Department of Commerce, Bureau of EconomicAnalysis Wisconsin Department of AdministrationWisconsin Department of Revenue
246
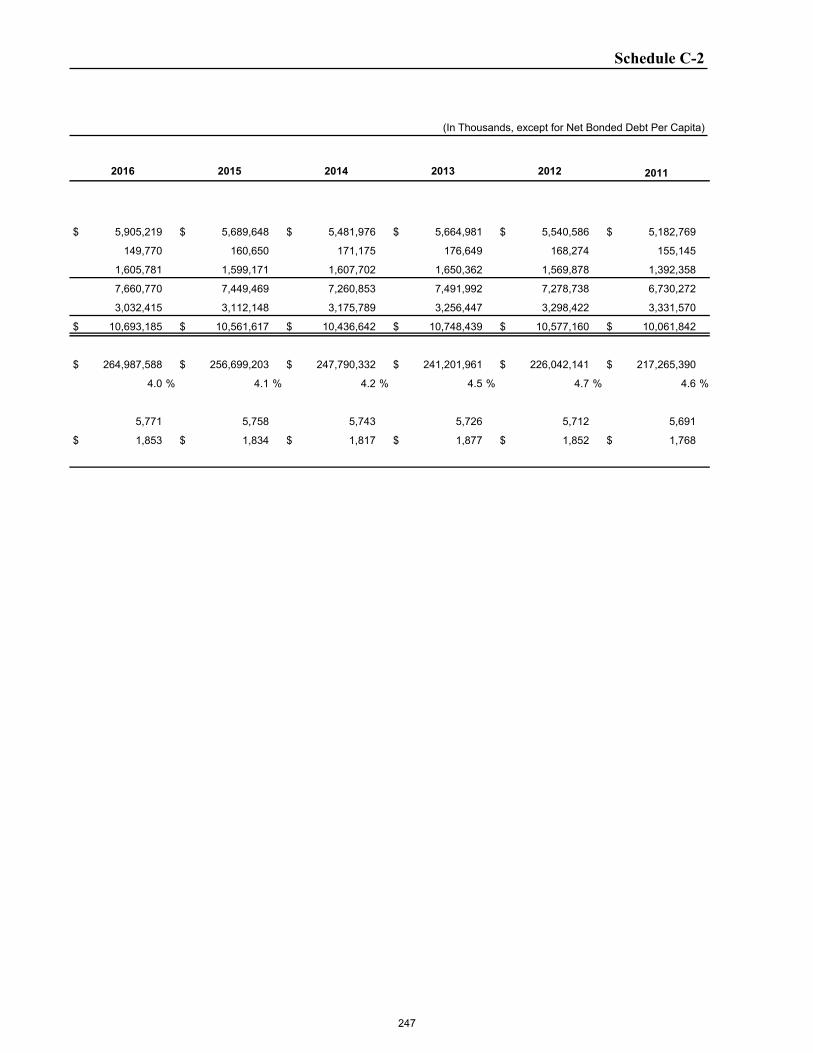
Schedule C-2
(In Thousands, except for Net Bonded Debt Per Capita)
2016 2015 2014 2013 2012 2011
$ 5,905,219 $ 5,689,648 $ 5,481,976 $ 5,664,981 $ 5,540,586 $ 5,182,769
149,770 160,650 171,175 176,649 168,274 155,145
1,605,781 1,599,171 1,607,702 1,650,362 1,569,878 1,392,358
7,660,770 7,449,469 7,260,853 7,491,992 7,278,738 6,730,272
3,032,415 3,112,148 3,175,789 3,256,447 3,298,422 3,331,570
$ 10,693,185 $ 10,561,617 $ 10,436,642 $ 10,748,439 $ 10,577,160 $ 10,061,842
$ 264,987,588 $ 256,699,203 $ 247,790,332 $ 241,201,961 $ 226,042,141 $ 217,265,390
4.0 % 4.1 % 4.2 % 4.5 % 4.7 % 4.6 %
5,771 5,758 5,743 5,726 5,712 5,691
$ 1,853 $ 1,834 $ 1,817 $ 1,877 $ 1,852 $ 1,768
247
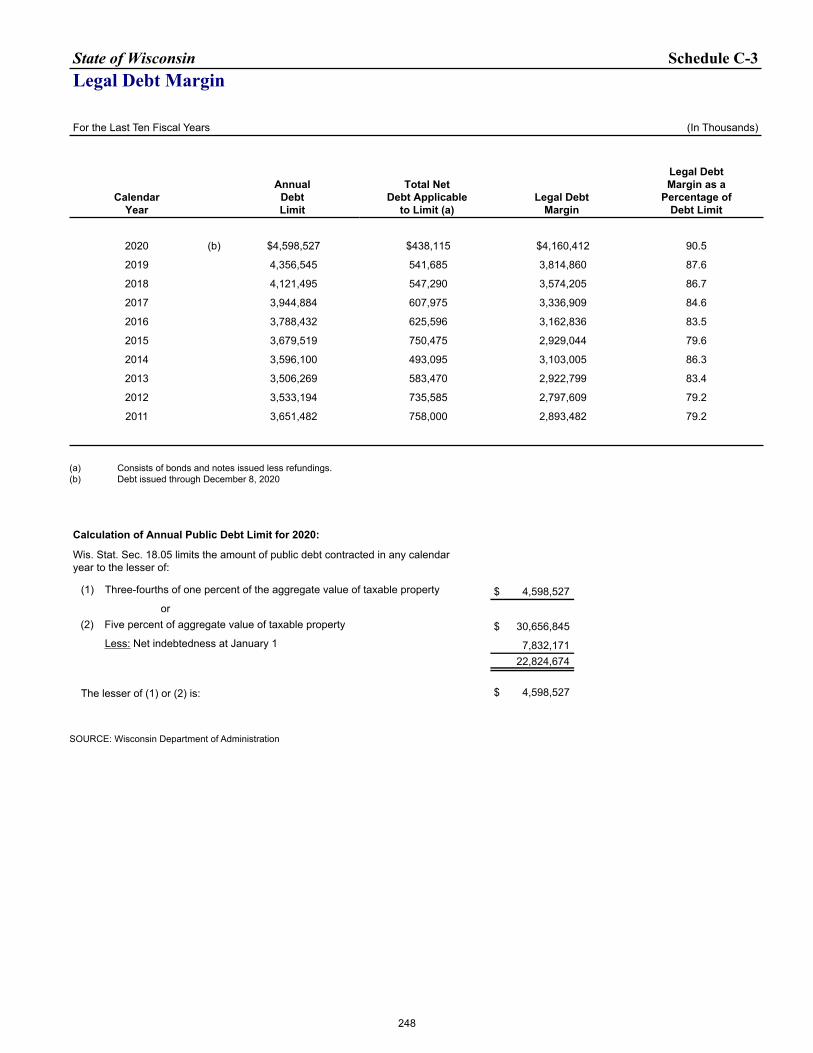
State of Wisconsin Schedule C-3Legal Debt Margin
For the Last Ten Fiscal Years (In Thousands)
CalendarYear
AnnualDebtLimit
Total NetDebt Applicable
to Limit (a)Legal Debt
Margin
Legal DebtMargin as a
Percentage ofDebt Limit
2020 (b) $4,598,527 $438,115 $4,160,412 90.5
2019 4,356,545 541,685 3,814,860 87.6
2018 4,121,495 547,290 3,574,205 86.7
2017 3,944,884 607,975 3,336,909 84.6
2016 3,788,432 625,596 3,162,836 83.5
2015 3,679,519 750,475 2,929,044 79.6
2014 3,596,100 493,095 3,103,005 86.3
2013 3,506,269 583,470 2,922,799 83.4
2012 3,533,194 735,585 2,797,609 79.2
2011 3,651,482 758,000 2,893,482 79.2
(a) Consists of bonds and notes issued less refundings.(b) Debt issued through December 8, 2020
Calculation of Annual Public Debt Limit for 2020:
Wis. Stat. Sec. 18.05 limits the amount of public debt contracted in any calendar year to the lesser of:
(1) Three-fourths of one percent of the aggregate value of taxable property $ 4,598,527 or
(2) Five percent of aggregate value of taxable property $ 30,656,845 Less: Net indebtedness at January 1 7,832,171
22,824,674
The lesser of (1) or (2) is: $ 4,598,527
SOURCE: Wisconsin Department of Administration
248
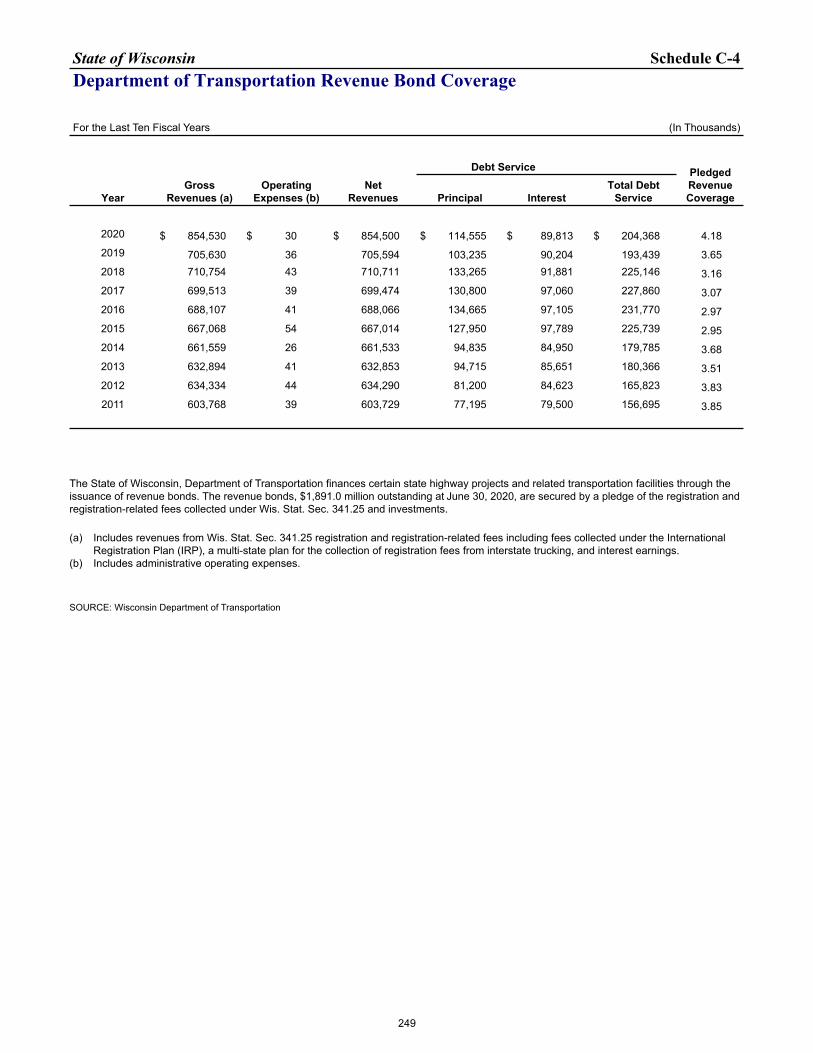
State of Wisconsin Schedule C-4Department of Transportation Revenue Bond Coverage
For the Last Ten Fiscal Years (In Thousands)
YearGross
Revenues (a)Operating
Expenses (b)Net
Revenues
Debt Service PledgedRevenueCoveragePrincipal Interest
Total Debt Service
2020 $ 854,530 $ 30 $ 854,500 $ 114,555 $ 89,813 $ 204,368 4.182019 705,630 36 705,594 103,235 90,204 193,439 3.652018 710,754 43 710,711 133,265 91,881 225,146 3.162017 699,513 39 699,474 130,800 97,060 227,860 3.072016 688,107 41 688,066 134,665 97,105 231,770 2.972015 667,068 54 667,014 127,950 97,789 225,739 2.952014 661,559 26 661,533 94,835 84,950 179,785 3.682013 632,894 41 632,853 94,715 85,651 180,366 3.512012 634,334 44 634,290 81,200 84,623 165,823 3.832011 603,768 39 603,729 77,195 79,500 156,695 3.85
The State of Wisconsin, Department of Transportation finances certain state highway projects and related transportation facilities through the issuance of revenue bonds. The revenue bonds, $1,891.0 million outstanding at June 30, 2020, are secured by a pledge of the registration and registration-related fees collected under Wis. Stat. Sec. 341.25 and investments.
(a) Includes revenues from Wis. Stat. Sec. 341.25 registration and registration-related fees including fees collected under the International Registration Plan (IRP), a multi-state plan for the collection of registration fees from interstate trucking, and interest earnings.
(b) Includes administrative operating expenses.
SOURCE: Wisconsin Department of Transportation
249
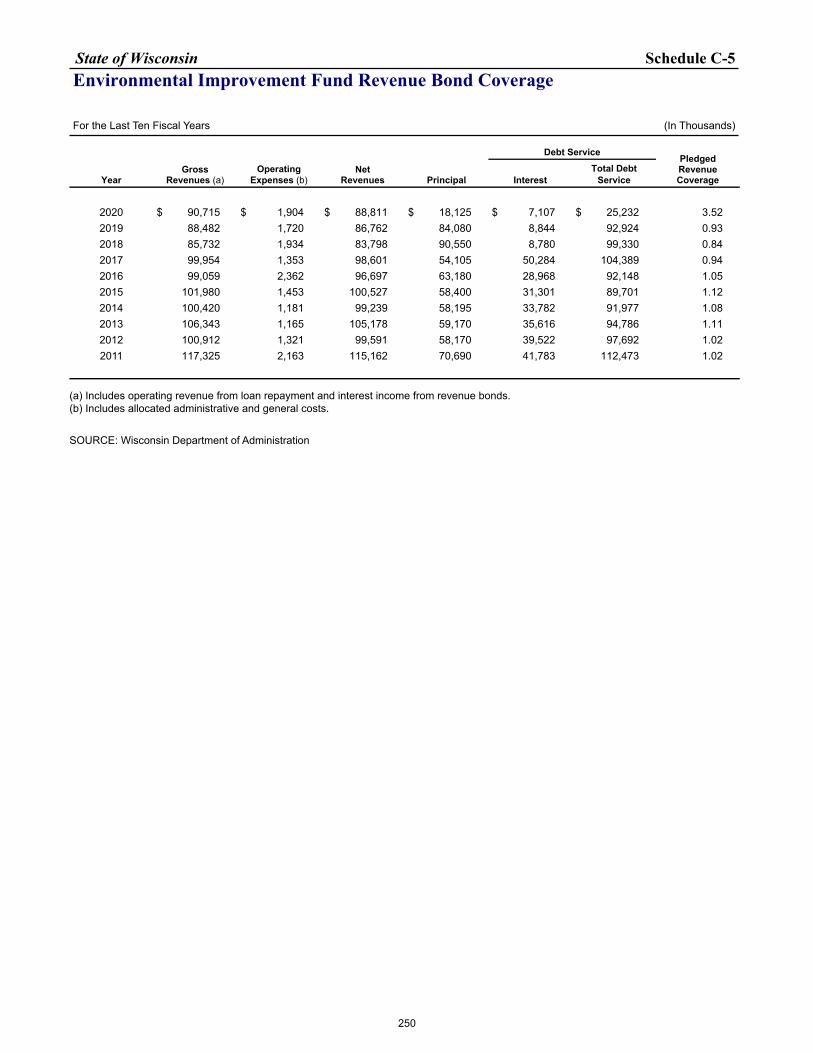
State of Wisconsin Schedule C-5Environmental Improvement Fund Revenue Bond Coverage
For the Last Ten Fiscal Years (In Thousands)
YearGross
Revenues (a)Operating
Expenses (b)Net
Revenues Principal
Debt ServicePledgedRevenueCoverageInterest
Total Debt Service
2020 $ 90,715 $ 1,904 $ 88,811 $ 18,125 $ 7,107 $ 25,232 3.52 2019 88,482 1,720 86,762 84,080 8,844 92,924 0.93 2018 85,732 1,934 83,798 90,550 8,780 99,330 0.84 2017 99,954 1,353 98,601 54,105 50,284 104,389 0.94 2016 99,059 2,362 96,697 63,180 28,968 92,148 1.05 2015 101,980 1,453 100,527 58,400 31,301 89,701 1.12 2014 100,420 1,181 99,239 58,195 33,782 91,977 1.08 2013 106,343 1,165 105,178 59,170 35,616 94,786 1.11 2012 100,912 1,321 99,591 58,170 39,522 97,692 1.02 2011 117,325 2,163 115,162 70,690 41,783 112,473 1.02
(a) Includes operating revenue from loan repayment and interest income from revenue bonds.(b) Includes allocated administrative and general costs.
SOURCE: Wisconsin Department of Administration
250
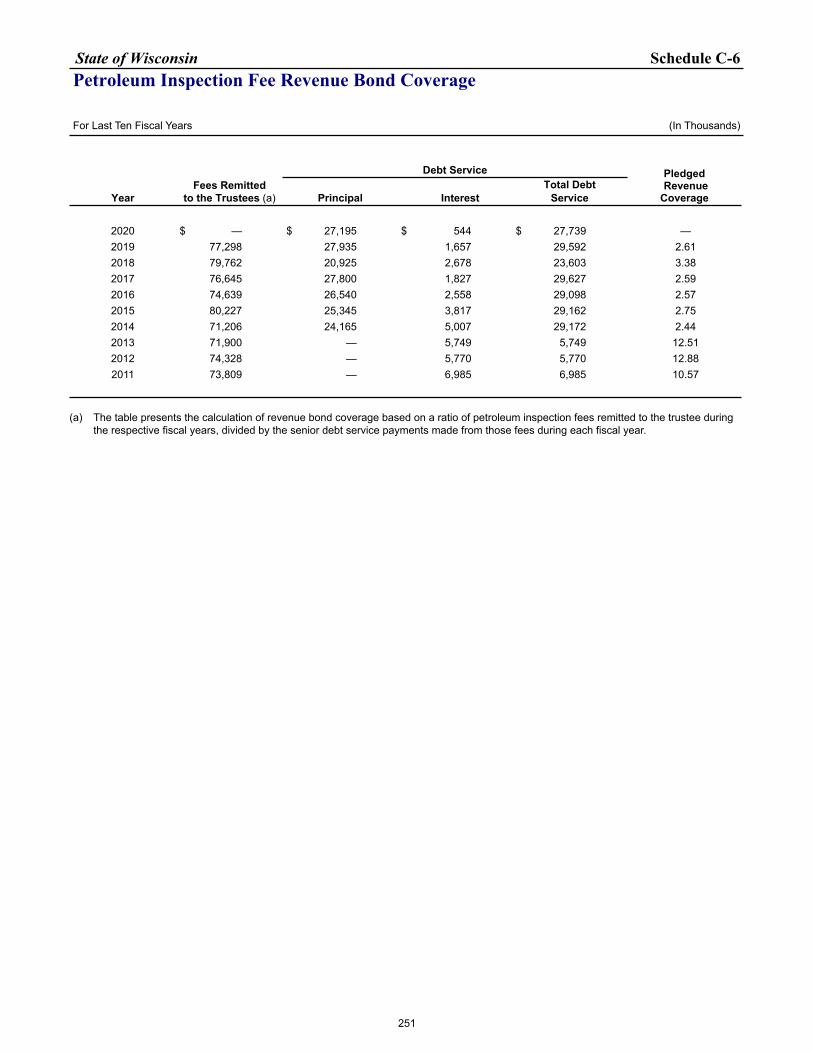
State of Wisconsin Schedule C-6Petroleum Inspection Fee Revenue Bond Coverage
For Last Ten Fiscal Years (In Thousands)
Debt Service Pledged Revenue CoverageYear
Fees Remitted to the Trustees (a) Principal Interest
Total Debt Service
2020 $ — $ 27,195 $ 544 $ 27,739 —2019 77,298 27,935 1,657 29,592 2.612018 79,762 20,925 2,678 23,603 3.382017 76,645 27,800 1,827 29,627 2.592016 74,639 26,540 2,558 29,098 2.572015 80,227 25,345 3,817 29,162 2.752014 71,206 24,165 5,007 29,172 2.442013 71,900 — 5,749 5,749 12.512012 74,328 — 5,770 5,770 12.882011 73,809 — 6,985 6,985 10.57
(a) The table presents the calculation of revenue bond coverage based on a ratio of petroleum inspection fees remitted to the trustee during the respective fiscal years, divided by the senior debt service payments made from those fees during each fiscal year.
251
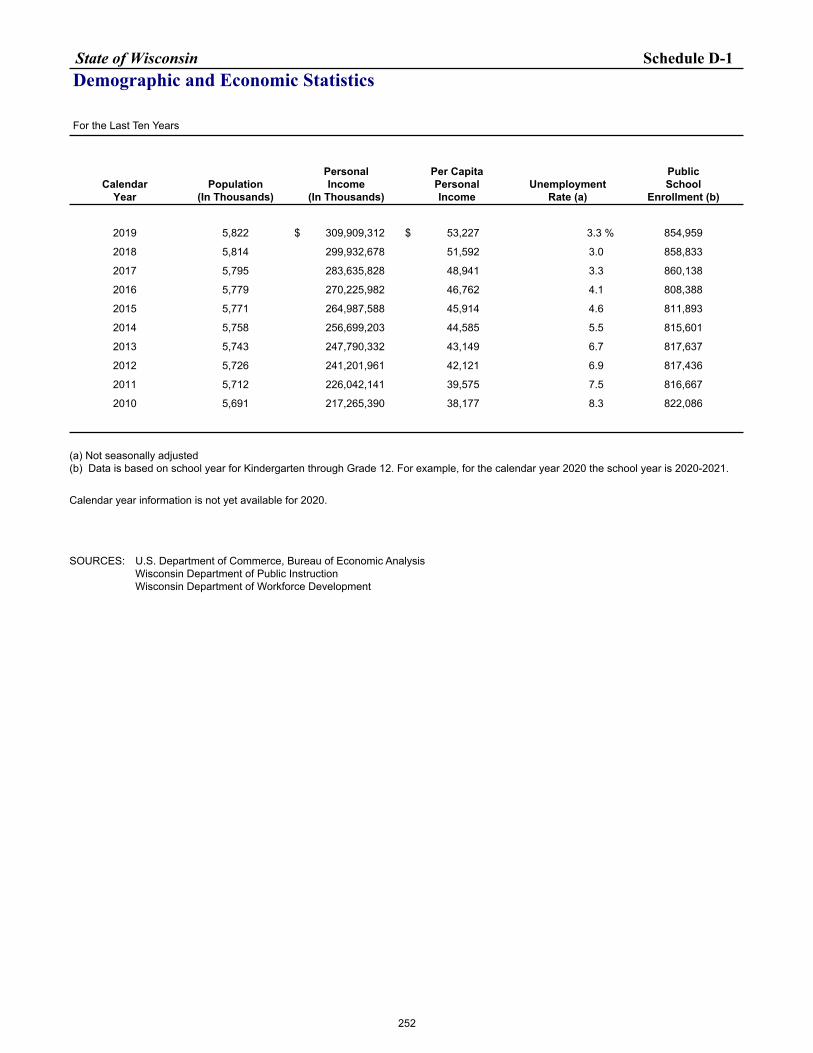
State of Wisconsin Schedule D-1Demographic and Economic Statistics
For the Last Ten Years
CalendarYear
Population (In Thousands)
PersonalIncome
(In Thousands)
Per Capita Personal Income
UnemploymentRate (a)
PublicSchool
Enrollment (b)
2019 5,822 $ 309,909,312 $ 53,227 3.3 % 854,959
2018 5,814 299,932,678 51,592 3.0 858,833
2017 5,795 283,635,828 48,941 3.3 860,138
2016 5,779 270,225,982 46,762 4.1 808,388
2015 5,771 264,987,588 45,914 4.6 811,893
2014 5,758 256,699,203 44,585 5.5 815,601
2013 5,743 247,790,332 43,149 6.7 817,637
2012 5,726 241,201,961 42,121 6.9 817,436
2011 5,712 226,042,141 39,575 7.5 816,667
2010 5,691 217,265,390 38,177 8.3 822,086
(a) Not seasonally adjusted(b) Data is based on school year for Kindergarten through Grade 12. For example, for the calendar year 2020 the school year is 2020-2021.
Calendar year information is not yet available for 2020.
SOURCES: U.S. Department of Commerce, Bureau of Economic AnalysisWisconsin Department of Public InstructionWisconsin Department of Workforce Development
252
State of Wisconsin
This page left intentionally blank.
253
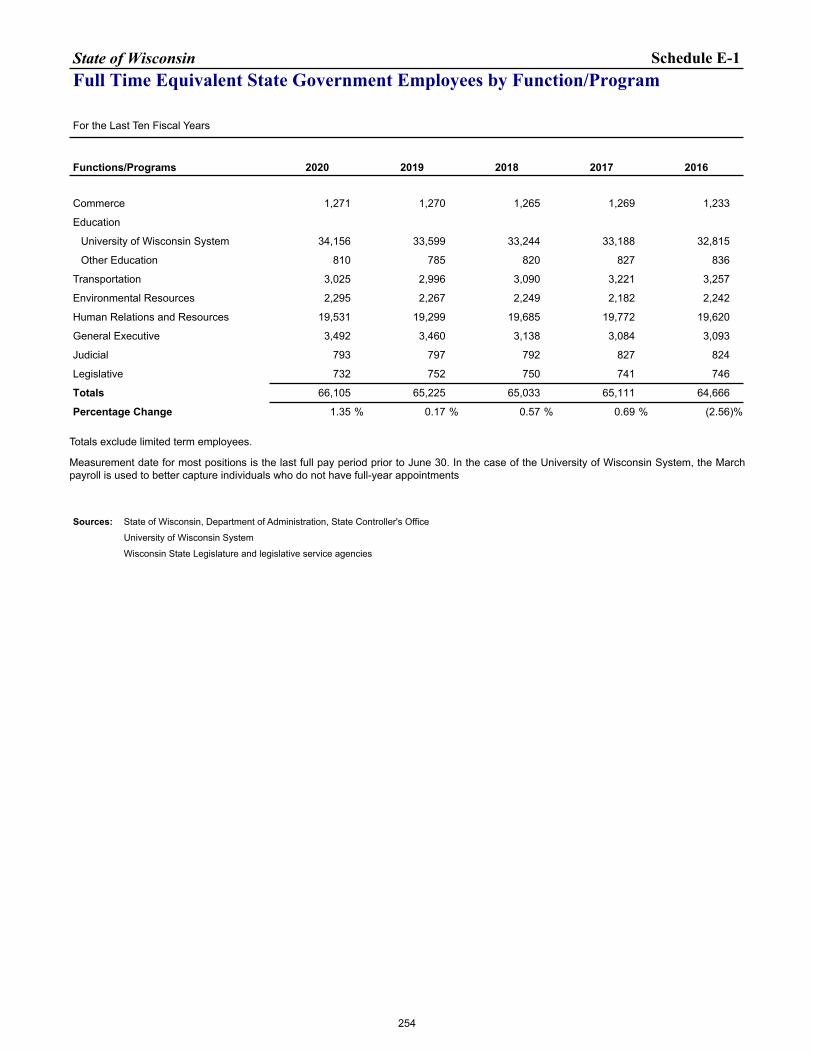
State of Wisconsin Schedule E-1Full Time Equivalent State Government Employees by Function/Program
For the Last Ten Fiscal Years
Functions/Programs 2020 2019 2018 2017 2016
Commerce 1,271 1,270 1,265 1,269 1,233
Education
University of Wisconsin System 34,156 33,599 33,244 33,188 32,815
Other Education 810 785 820 827 836
Transportation 3,025 2,996 3,090 3,221 3,257
Environmental Resources 2,295 2,267 2,249 2,182 2,242
Human Relations and Resources 19,531 19,299 19,685 19,772 19,620
General Executive 3,492 3,460 3,138 3,084 3,093
Judicial 793 797 792 827 824
Legislative 732 752 750 741 746
Totals 66,105 65,225 65,033 65,111 64,666
Percentage Change 1.35 % 0.17 % 0.57 % 0.69 % (2.56) %
Totals exclude limited term employees.
Measurement date for most positions is the last full pay period prior to June 30. In the case of the University of Wisconsin System, the March payroll is used to better capture individuals who do not have full-year appointments
Sources: State of Wisconsin, Department of Administration, State Controller's Office
University of Wisconsin System
Wisconsin State Legislature and legislative service agencies
254
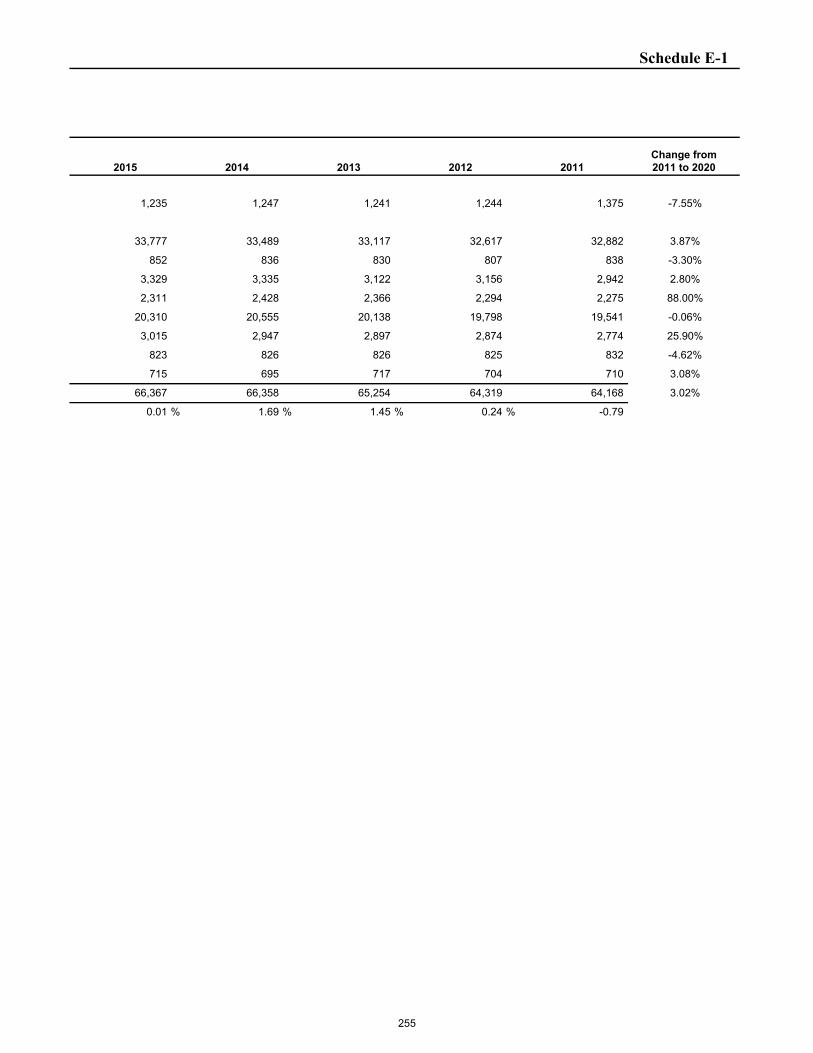
Schedule E-1
Change from2011 to 20202015 2014 2013 2012 2011
1,235 1,247 1,241 1,244 1,375 -7.55%
33,777 33,489 33,117 32,617 32,882 3.87%
852 836 830 807 838 -3.30%
3,329 3,335 3,122 3,156 2,942 2.80%
2,311 2,428 2,366 2,294 2,275 88.00%
20,310 20,555 20,138 19,798 19,541 -0.06%
3,015 2,947 2,897 2,874 2,774 25.90%
823 826 826 825 832 -4.62%
715 695 717 704 710 3.08%
66,367 66,358 65,254 64,319 64,168 3.02%
0.01 % 1.69 % 1.45 % 0.24 % -0.79
255
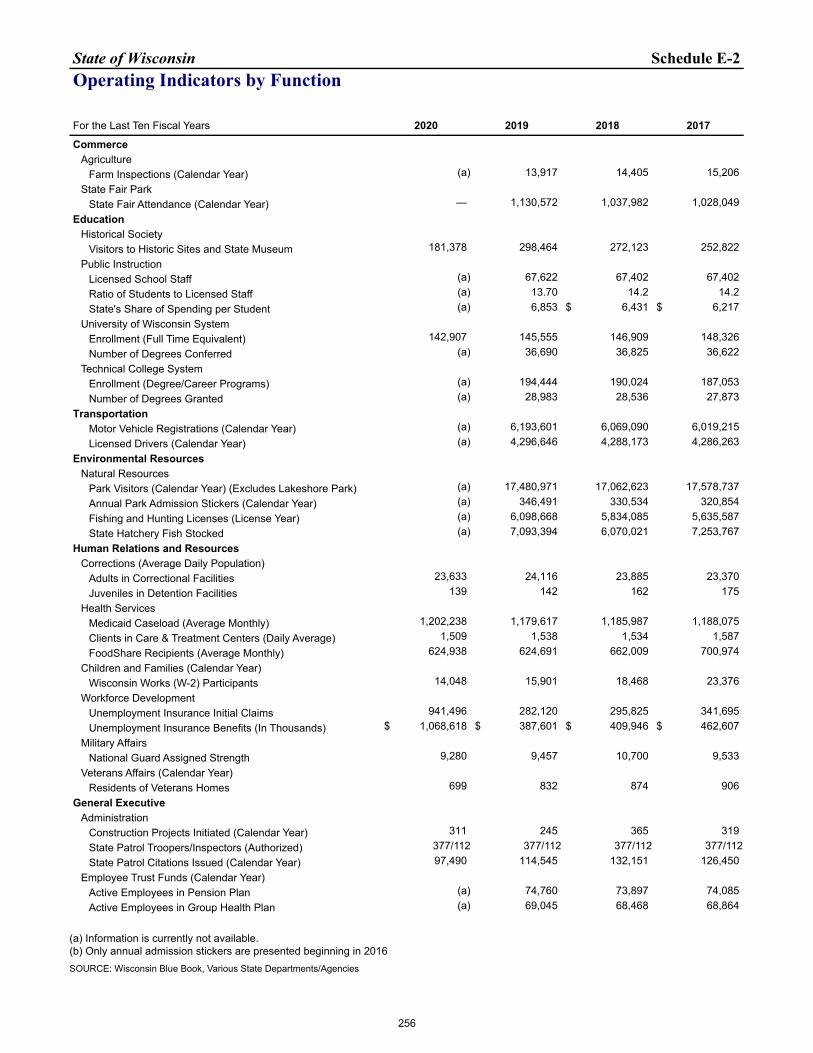
State of Wisconsin Schedule E-2Operating Indicators by Function
For the Last Ten Fiscal Years 2020 2019 2018 2017
CommerceAgriculture
Farm Inspections (Calendar Year) (a) 13,917 14,405 15,206 State Fair Park
State Fair Attendance (Calendar Year) — 1,130,572 1,037,982 1,028,049 Education
Historical SocietyVisitors to Historic Sites and State Museum 181,378 298,464 272,123 252,822
Public InstructionLicensed School Staff (a) 67,622 67,402 67,402 Ratio of Students to Licensed Staff (a) 13.70 14.2 14.2 State's Share of Spending per Student (a) 6,853 $ 6,431 $ 6,217
University of Wisconsin SystemEnrollment (Full Time Equivalent) 142,907 145,555 146,909 148,326 Number of Degrees Conferred (a) 36,690 36,825 36,622
Technical College SystemEnrollment (Degree/Career Programs) (a) 194,444 190,024 187,053 Number of Degrees Granted (a) 28,983 28,536 27,873
TransportationMotor Vehicle Registrations (Calendar Year) (a) 6,193,601 6,069,090 6,019,215 Licensed Drivers (Calendar Year) (a) 4,296,646 4,288,173 4,286,263
Environmental ResourcesNatural Resources
Park Visitors (Calendar Year) (Excludes Lakeshore Park) (a) 17,480,971 17,062,623 17,578,737 Annual Park Admission Stickers (Calendar Year) (a) 346,491 330,534 320,854 Fishing and Hunting Licenses (License Year) (a) 6,098,668 5,834,085 5,635,587 State Hatchery Fish Stocked (a) 7,093,394 6,070,021 7,253,767
Human Relations and ResourcesCorrections (Average Daily Population)
Adults in Correctional Facilities 23,633 24,116 23,885 23,370 Juveniles in Detention Facilities 139 142 162 175
Health ServicesMedicaid Caseload (Average Monthly) 1,202,238 1,179,617 1,185,987 1,188,075 Clients in Care & Treatment Centers (Daily Average) 1,509 1,538 1,534 1,587 FoodShare Recipients (Average Monthly) 624,938 624,691 662,009 700,974
Children and Families (Calendar Year)Wisconsin Works (W-2) Participants 14,048 15,901 18,468 23,376
Workforce DevelopmentUnemployment Insurance Initial Claims 941,496 282,120 295,825 341,695 Unemployment Insurance Benefits (In Thousands) $ 1,068,618 $ 387,601 $ 409,946 $ 462,607
Military AffairsNational Guard Assigned Strength 9,280 9,457 10,700 9,533
Veterans Affairs (Calendar Year)Residents of Veterans Homes 699 832 874 906
General ExecutiveAdministration
Construction Projects Initiated (Calendar Year) 311 245 365 319 State Patrol Troopers/Inspectors (Authorized) 377/112 377/112 377/112 377/112State Patrol Citations Issued (Calendar Year) 97,490 114,545 132,151 126,450
Employee Trust Funds (Calendar Year)Active Employees in Pension Plan (a) 74,760 73,897 74,085 Active Employees in Group Health Plan (a) 69,045 68,468 68,864
(a) Information is currently not available.(b) Only annual admission stickers are presented beginning in 2016SOURCE: Wisconsin Blue Book, Various State Departments/Agencies
256
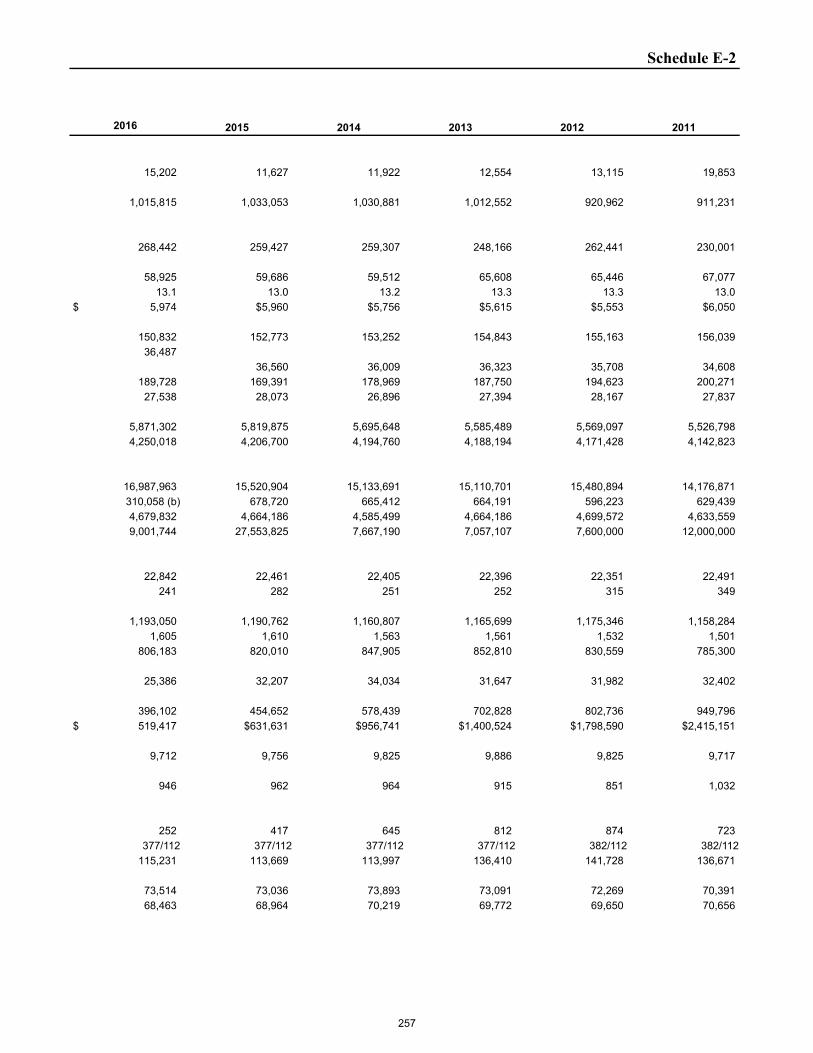
Schedule E-2
2016 2015 2014 2013 2012 2011
15,202 11,627 11,922 12,554 13,115 19,853
1,015,815 1,033,053 1,030,881 1,012,552 920,962 911,231
268,442 259,427 259,307 248,166 262,441 230,001
58,925 59,686 59,512 65,608 65,446 67,077 13.1 13.0 13.2 13.3 13.3 13.0 $ 5,974 $5,960 $5,756 $5,615 $5,553 $6,050
150,832 152,773 153,252 154,843 155,163 156,039 36,487
36,560 36,009 36,323 35,708 34,608 189,728 169,391 178,969 187,750 194,623 200,271 27,538 28,073 26,896 27,394 28,167 27,837
5,871,302 5,819,875 5,695,648 5,585,489 5,569,097 5,526,798 4,250,018 4,206,700 4,194,760 4,188,194 4,171,428 4,142,823
16,987,963 15,520,904 15,133,691 15,110,701 15,480,894 14,176,871 310,058 (b) 678,720 665,412 664,191 596,223 629,439
4,679,832 4,664,186 4,585,499 4,664,186 4,699,572 4,633,559 9,001,744 27,553,825 7,667,190 7,057,107 7,600,000 12,000,000
22,842 22,461 22,405 22,396 22,351 22,491 241 282 251 252 315 349
1,193,050 1,190,762 1,160,807 1,165,699 1,175,346 1,158,284 1,605 1,610 1,563 1,561 1,532 1,501 806,183 820,010 847,905 852,810 830,559 785,300
25,386 32,207 34,034 31,647 31,982 32,402
396,102 454,652 578,439 702,828 802,736 949,796 $ 519,417 $631,631 $956,741 $1,400,524 $1,798,590 $2,415,151
9,712 9,756 9,825 9,886 9,825 9,717
946 962 964 915 851 1,032
252 417 645 812 874 723 377/112 377/112 377/112 377/112 382/112 382/112
115,231 113,669 113,997 136,410 141,728 136,671
73,514 73,036 73,893 73,091 72,269 70,391 68,463 68,964 70,219 69,772 69,650 70,656
257
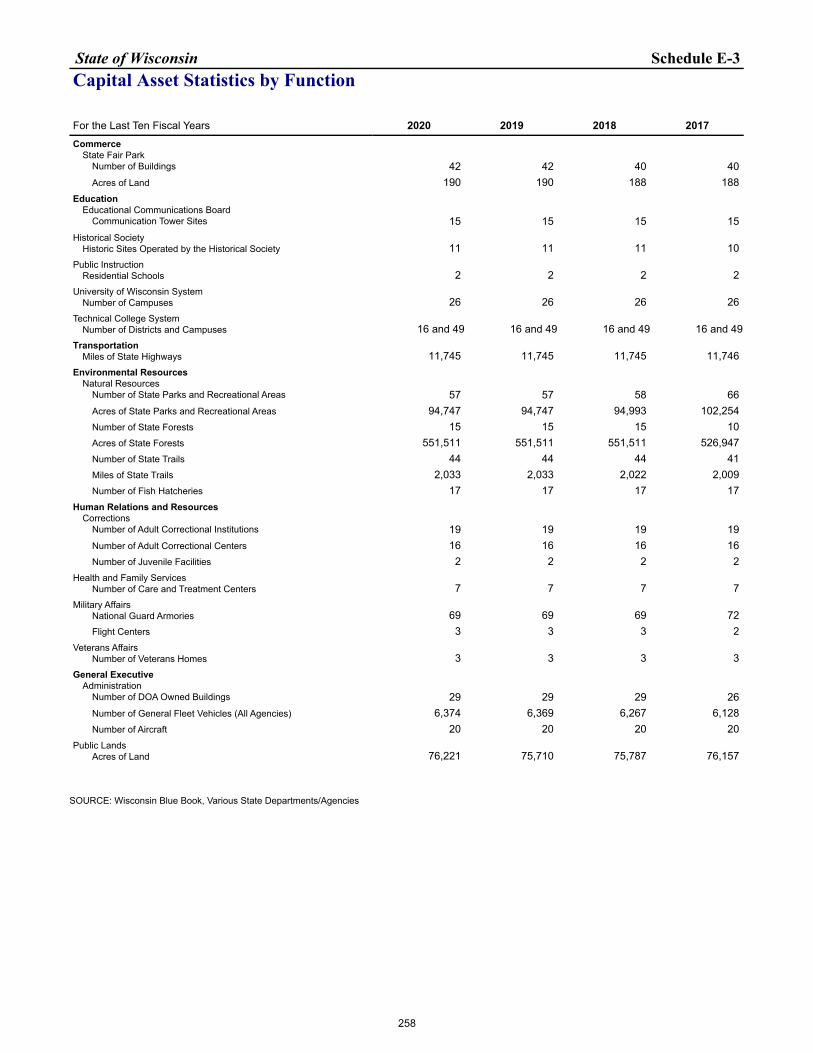
State of Wisconsin Schedule E-3Capital Asset Statistics by Function
For the Last Ten Fiscal Years 2020 2019 2018 2017Commerce
State Fair ParkNumber of Buildings 42 42 40 40 Acres of Land 190 190 188 188
EducationEducational Communications Board
Communication Tower Sites 15 15 15 15 Historical Society
Historic Sites Operated by the Historical Society 11 11 11 10 Public Instruction
Residential Schools 2 2 2 2 University of Wisconsin System
Number of Campuses 26 26 26 26 Technical College System
Number of Districts and Campuses 16 and 49 16 and 49 16 and 49 16 and 49Transportation
Miles of State Highways 11,745 11,745 11,745 11,746 Environmental Resources
Natural ResourcesNumber of State Parks and Recreational Areas 57 57 58 66 Acres of State Parks and Recreational Areas 94,747 94,747 94,993 102,254 Number of State Forests 15 15 15 10 Acres of State Forests 551,511 551,511 551,511 526,947 Number of State Trails 44 44 44 41 Miles of State Trails 2,033 2,033 2,022 2,009 Number of Fish Hatcheries 17 17 17 17
Human Relations and ResourcesCorrections
Number of Adult Correctional Institutions 19 19 19 19 Number of Adult Correctional Centers 16 16 16 16 Number of Juvenile Facilities 2 2 2 2
Health and Family ServicesNumber of Care and Treatment Centers 7 7 7 7
Military AffairsNational Guard Armories 69 69 69 72 Flight Centers 3 3 3 2
Veterans AffairsNumber of Veterans Homes 3 3 3 3
General ExecutiveAdministration
Number of DOA Owned Buildings 29 29 29 26 Number of General Fleet Vehicles (All Agencies) 6,374 6,369 6,267 6,128 Number of Aircraft 20 20 20 20
Public LandsAcres of Land 76,221 75,710 75,787 76,157
SOURCE: Wisconsin Blue Book, Various State Departments/Agencies
258
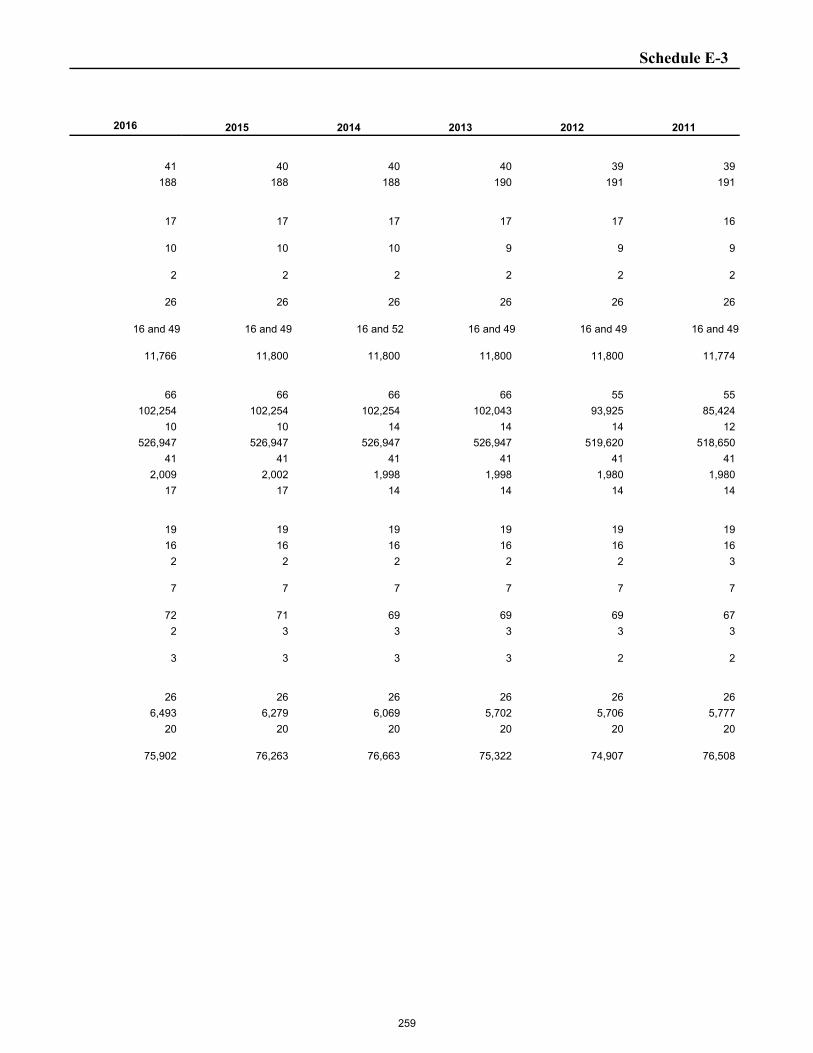
Schedule E-3
2016 2015 2014 2013 2012 2011
41 40 40 40 39 39 188 188 188 190 191 191
17 17 17 17 17 16
10 10 10 9 9 9
2 2 2 2 2 2
26 26 26 26 26 26
16 and 49 16 and 49 16 and 52 16 and 49 16 and 49 16 and 49
11,766 11,800 11,800 11,800 11,800 11,774
66 66 66 66 55 55 102,254 102,254 102,254 102,043 93,925 85,424 10 10 14 14 14 12 526,947 526,947 526,947 526,947 519,620 518,650 41 41 41 41 41 41 2,009 2,002 1,998 1,998 1,980 1,980 17 17 14 14 14 14
19 19 19 19 19 19 16 16 16 16 16 16 2 2 2 2 2 3
7 7 7 7 7 7
72 71 69 69 69 67 2 3 3 3 3 3
3 3 3 3 2 2
26 26 26 26 26 26 6,493 6,279 6,069 5,702 5,706 5,777 20 20 20 20 20 20
75,902 76,263 76,663 75,322 74,907 76,508
259
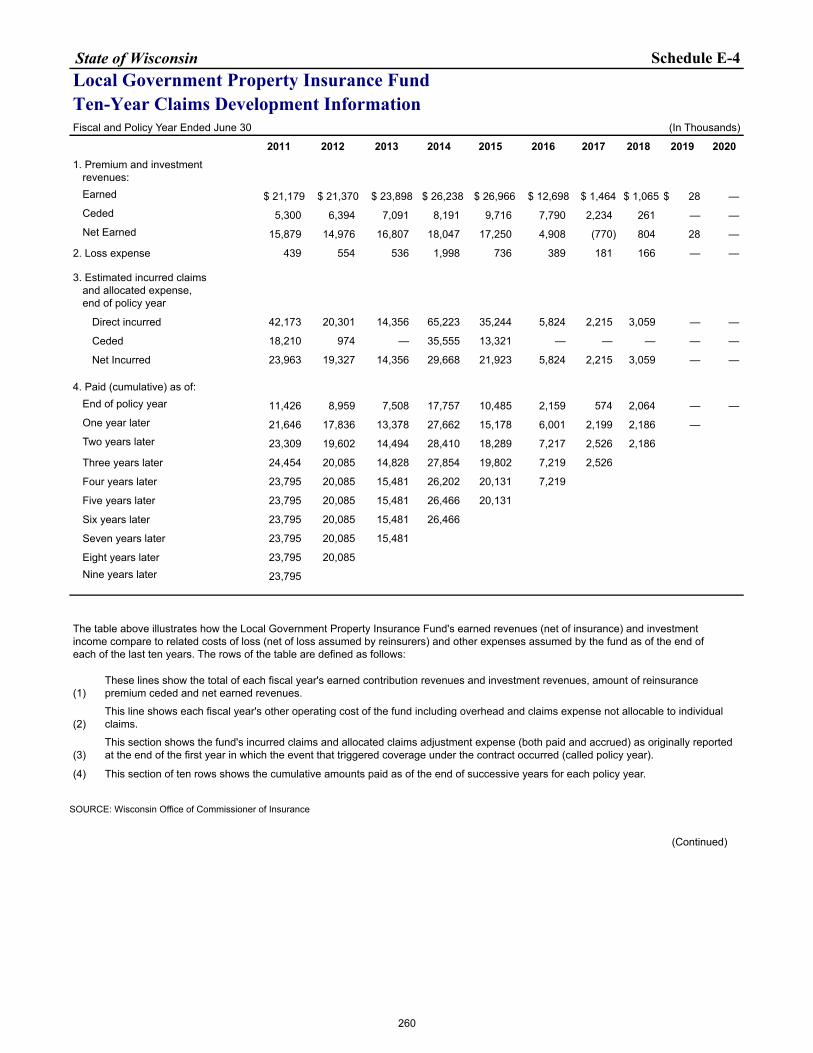
State of Wisconsin Schedule E-4Local Government Property Insurance FundTen-Year Claims Development InformationFiscal and Policy Year Ended June 30 (In Thousands)
2011 2012 2013 2014 2015 2016 2017 2018 2019 20201. Premium and investment
revenues:Earned $ 21,179 $ 21,370 $ 23,898 $ 26,238 $ 26,966 $ 12,698 $ 1,464 $ 1,065 $ 28 — Ceded 5,300 6,394 7,091 8,191 9,716 7,790 2,234 261 — — Net Earned 15,879 14,976 16,807 18,047 17,250 4,908 (770) 804 28 —
2. Loss expense 439 554 536 1,998 736 389 181 166 — —
3. Estimated incurred claimsand allocated expense,end of policy year
Direct incurred 42,173 20,301 14,356 65,223 35,244 5,824 2,215 3,059 — —
Ceded 18,210 974 — 35,555 13,321 — — — — —
Net Incurred 23,963 19,327 14,356 29,668 21,923 5,824 2,215 3,059 — —
4. Paid (cumulative) as of:End of policy year 11,426 8,959 7,508 17,757 10,485 2,159 574 2,064 — — One year later 21,646 17,836 13,378 27,662 15,178 6,001 2,199 2,186 — Two years later 23,309 19,602 14,494 28,410 18,289 7,217 2,526 2,186
Three years later 24,454 20,085 14,828 27,854 19,802 7,219 2,526
Four years later 23,795 20,085 15,481 26,202 20,131 7,219
Five years later 23,795 20,085 15,481 26,466 20,131
Six years later 23,795 20,085 15,481 26,466
Seven years later 23,795 20,085 15,481
Eight years later 23,795 20,085 Nine years later 23,795
The table above illustrates how the Local Government Property Insurance Fund's earned revenues (net of insurance) and investment income compare to related costs of loss (net of loss assumed by reinsurers) and other expenses assumed by the fund as of the end of each of the last ten years. The rows of the table are defined as follows:
(1)These lines show the total of each fiscal year's earned contribution revenues and investment revenues, amount of reinsurance premium ceded and net earned revenues.
(2)This line shows each fiscal year's other operating cost of the fund including overhead and claims expense not allocable to individual claims.
(3)This section shows the fund's incurred claims and allocated claims adjustment expense (both paid and accrued) as originally reported at the end of the first year in which the event that triggered coverage under the contract occurred (called policy year).
(4) This section of ten rows shows the cumulative amounts paid as of the end of successive years for each policy year.
SOURCE: Wisconsin Office of Commissioner of Insurance
(Continued)
260
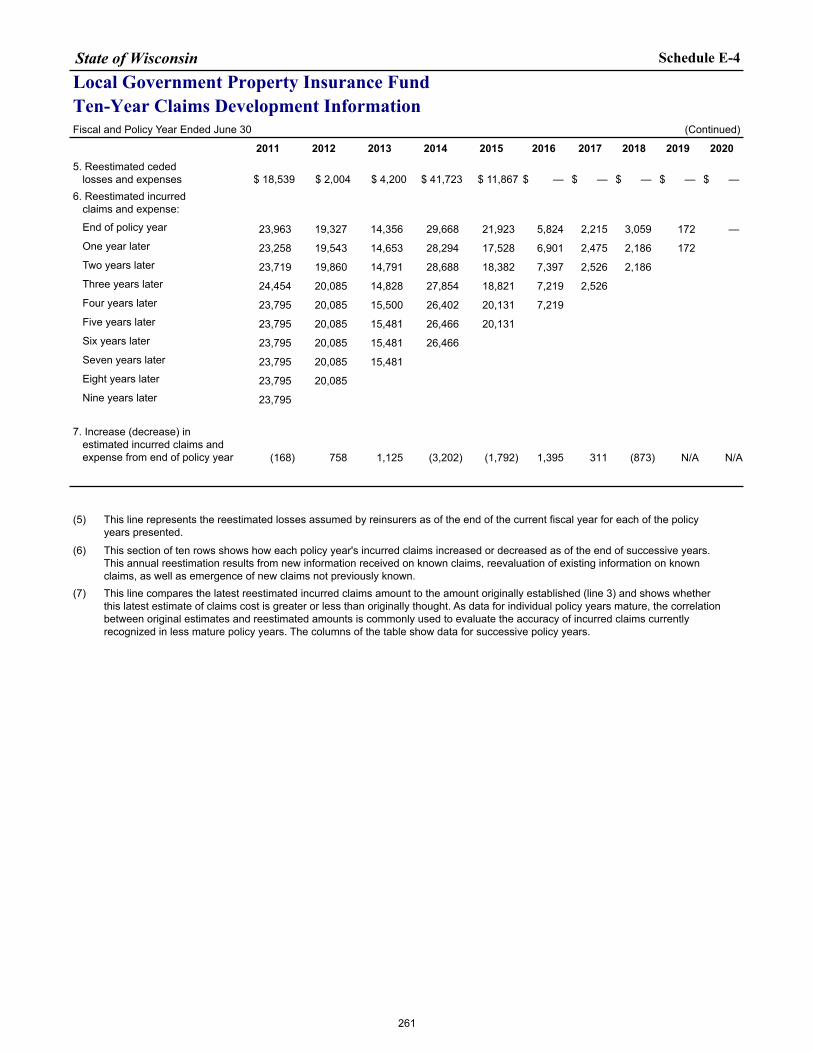
State of Wisconsin Schedule E-4
Local Government Property Insurance FundTen-Year Claims Development InformationFiscal and Policy Year Ended June 30 (Continued)
2011 2012 2013 2014 2015 2016 2017 2018 2019 20205. Reestimated ceded
losses and expenses $ 18,539 $ 2,004 $ 4,200 $ 41,723 $ 11,867 $ — $ — $ — $ — $ — 6. Reestimated incurred
claims and expense:
End of policy year 23,963 19,327 14,356 29,668 21,923 5,824 2,215 3,059 172 — One year later 23,258 19,543 14,653 28,294 17,528 6,901 2,475 2,186 172 Two years later 23,719 19,860 14,791 28,688 18,382 7,397 2,526 2,186 Three years later 24,454 20,085 14,828 27,854 18,821 7,219 2,526 Four years later 23,795 20,085 15,500 26,402 20,131 7,219 Five years later 23,795 20,085 15,481 26,466 20,131 Six years later 23,795 20,085 15,481 26,466 Seven years later 23,795 20,085 15,481 Eight years later 23,795 20,085 Nine years later 23,795
7. Increase (decrease) in estimated incurred claims and expense from end of policy year (168) 758 1,125 (3,202) (1,792) 1,395 311 (873) N/A N/A
(5) This line represents the reestimated losses assumed by reinsurers as of the end of the current fiscal year for each of the policy years presented.
(6) This section of ten rows shows how each policy year's incurred claims increased or decreased as of the end of successive years. This annual reestimation results from new information received on known claims, reevaluation of existing information on known claims, as well as emergence of new claims not previously known.
(7) This line compares the latest reestimated incurred claims amount to the amount originally established (line 3) and shows whether this latest estimate of claims cost is greater or less than originally thought. As data for individual policy years mature, the correlation between original estimates and reestimated amounts is commonly used to evaluate the accuracy of incurred claims currently recognized in less mature policy years. The columns of the table show data for successive policy years.
261
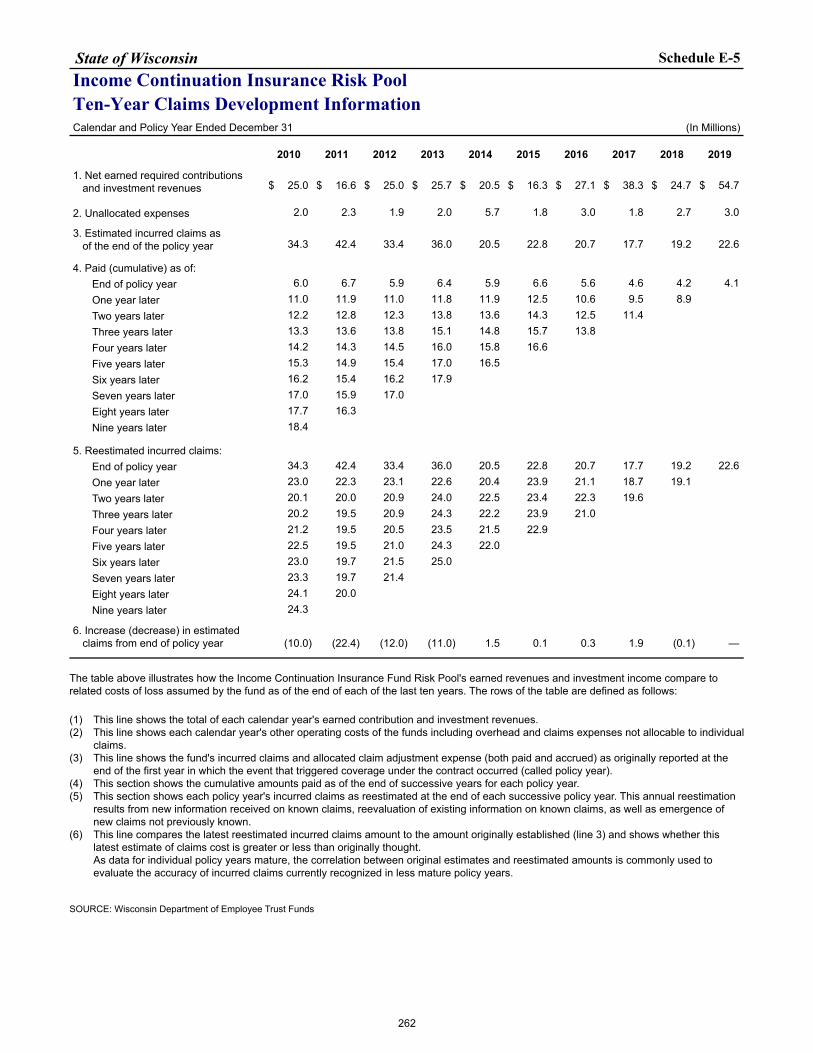
State of Wisconsin Schedule E-5Income Continuation Insurance Risk PoolTen-Year Claims Development InformationCalendar and Policy Year Ended December 31 (In Millions)
2010 2011 2012 2013 2014 2015 2016 2017 2018 2019
1. Net earned required contributionsand investment revenues $ 25.0 $ 16.6 $ 25.0 $ 25.7 $ 20.5 $ 16.3 $ 27.1 $ 38.3 $ 24.7 $ 54.7
2. Unallocated expenses 2.0 2.3 1.9 2.0 5.7 1.8 3.0 1.8 2.7 3.0
3. Estimated incurred claims asof the end of the policy year 34.3 42.4 33.4 36.0 20.5 22.8 20.7 17.7 19.2 22.6
4. Paid (cumulative) as of:End of policy year 6.0 6.7 5.9 6.4 5.9 6.6 5.6 4.6 4.2 4.1 One year later 11.0 11.9 11.0 11.8 11.9 12.5 10.6 9.5 8.9 Two years later 12.2 12.8 12.3 13.8 13.6 14.3 12.5 11.4 Three years later 13.3 13.6 13.8 15.1 14.8 15.7 13.8 Four years later 14.2 14.3 14.5 16.0 15.8 16.6 Five years later 15.3 14.9 15.4 17.0 16.5 Six years later 16.2 15.4 16.2 17.9 Seven years later 17.0 15.9 17.0 Eight years later 17.7 16.3 Nine years later 18.4
5. Reestimated incurred claims:End of policy year 34.3 42.4 33.4 36.0 20.5 22.8 20.7 17.7 19.2 22.6 One year later 23.0 22.3 23.1 22.6 20.4 23.9 21.1 18.7 19.1 Two years later 20.1 20.0 20.9 24.0 22.5 23.4 22.3 19.6 Three years later 20.2 19.5 20.9 24.3 22.2 23.9 21.0 Four years later 21.2 19.5 20.5 23.5 21.5 22.9 Five years later 22.5 19.5 21.0 24.3 22.0 Six years later 23.0 19.7 21.5 25.0 Seven years later 23.3 19.7 21.4 Eight years later 24.1 20.0 Nine years later 24.3
6. Increase (decrease) in estimated claims from end of policy year (10.0) (22.4) (12.0) (11.0) 1.5 0.1 0.3 1.9 (0.1) —
The table above illustrates how the Income Continuation Insurance Fund Risk Pool's earned revenues and investment income compare to related costs of loss assumed by the fund as of the end of each of the last ten years. The rows of the table are defined as follows:
(1) This line shows the total of each calendar year's earned contribution and investment revenues.(2) This line shows each calendar year's other operating costs of the funds including overhead and claims expenses not allocable to individual
claims.(3) This line shows the fund's incurred claims and allocated claim adjustment expense (both paid and accrued) as originally reported at the
end of the first year in which the event that triggered coverage under the contract occurred (called policy year).(4) This section shows the cumulative amounts paid as of the end of successive years for each policy year.(5) This section shows each policy year's incurred claims as reestimated at the end of each successive policy year. This annual reestimation
results from new information received on known claims, reevaluation of existing information on known claims, as well as emergence of new claims not previously known.
(6) This line compares the latest reestimated incurred claims amount to the amount originally established (line 3) and shows whether this latest estimate of claims cost is greater or less than originally thought.As data for individual policy years mature, the correlation between original estimates and reestimated amounts is commonly used to evaluate the accuracy of incurred claims currently recognized in less mature policy years.
SOURCE: Wisconsin Department of Employee Trust Funds
262
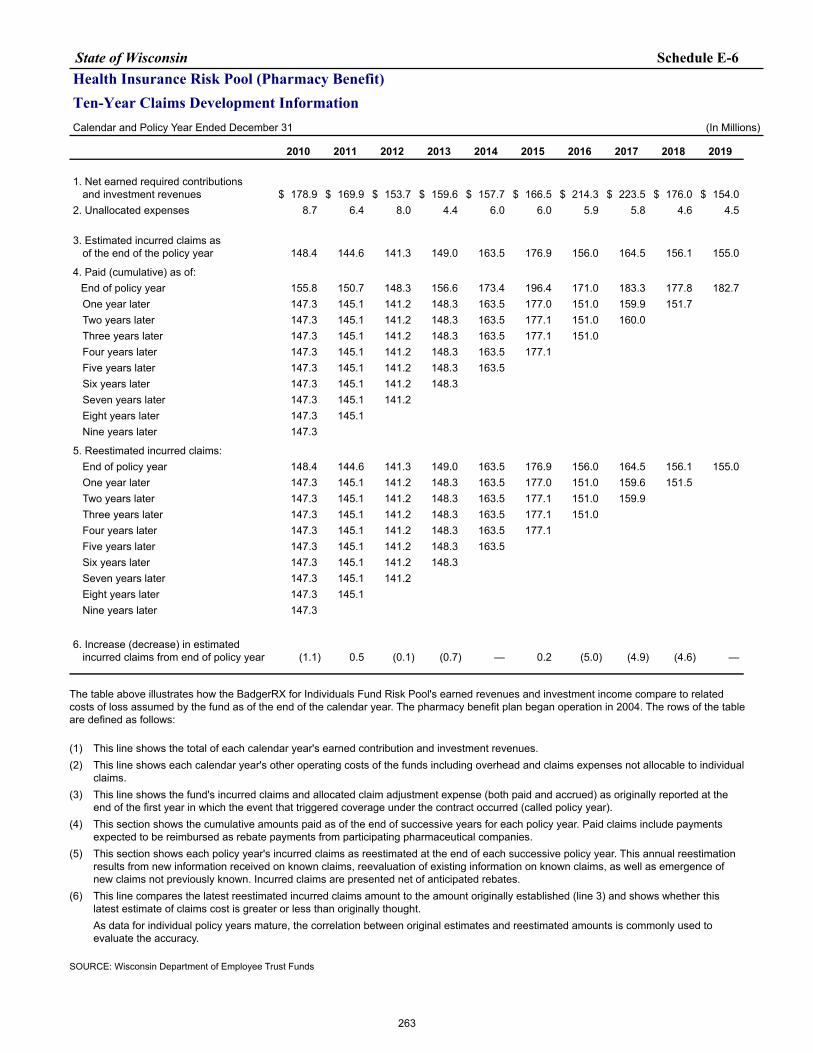
State of Wisconsin Schedule E-6Health Insurance Risk Pool (Pharmacy Benefit)Ten-Year Claims Development InformationCalendar and Policy Year Ended December 31 (In Millions)
2010 2011 2012 2013 2014 2015 2016 2017 2018 2019
1. Net earned required contributionsand investment revenues $ 178.9 $ 169.9 $ 153.7 $ 159.6 $ 157.7 $ 166.5 $ 214.3 $ 223.5 $ 176.0 $ 154.0
2. Unallocated expenses 8.7 6.4 8.0 4.4 6.0 6.0 5.9 5.8 4.6 4.5
3. Estimated incurred claims asof the end of the policy year 148.4 144.6 141.3 149.0 163.5 176.9 156.0 164.5 156.1 155.0
4. Paid (cumulative) as of:End of policy year 155.8 150.7 148.3 156.6 173.4 196.4 171.0 183.3 177.8 182.7 One year later 147.3 145.1 141.2 148.3 163.5 177.0 151.0 159.9 151.7 Two years later 147.3 145.1 141.2 148.3 163.5 177.1 151.0 160.0 Three years later 147.3 145.1 141.2 148.3 163.5 177.1 151.0 Four years later 147.3 145.1 141.2 148.3 163.5 177.1 Five years later 147.3 145.1 141.2 148.3 163.5 Six years later 147.3 145.1 141.2 148.3 Seven years later 147.3 145.1 141.2 Eight years later 147.3 145.1 Nine years later 147.3
5. Reestimated incurred claims:End of policy year 148.4 144.6 141.3 149.0 163.5 176.9 156.0 164.5 156.1 155.0 One year later 147.3 145.1 141.2 148.3 163.5 177.0 151.0 159.6 151.5 Two years later 147.3 145.1 141.2 148.3 163.5 177.1 151.0 159.9 Three years later 147.3 145.1 141.2 148.3 163.5 177.1 151.0 Four years later 147.3 145.1 141.2 148.3 163.5 177.1 Five years later 147.3 145.1 141.2 148.3 163.5 Six years later 147.3 145.1 141.2 148.3 Seven years later 147.3 145.1 141.2 Eight years later 147.3 145.1 Nine years later 147.3
6. Increase (decrease) in estimated incurred claims from end of policy year (1.1) 0.5 (0.1) (0.7) — 0.2 (5.0) (4.9) (4.6) —
The table above illustrates how the BadgerRX for Individuals Fund Risk Pool's earned revenues and investment income compare to related costs of loss assumed by the fund as of the end of the calendar year. The pharmacy benefit plan began operation in 2004. The rows of the table are defined as follows:
(1) This line shows the total of each calendar year's earned contribution and investment revenues.(2) This line shows each calendar year's other operating costs of the funds including overhead and claims expenses not allocable to individual
claims.(3) This line shows the fund's incurred claims and allocated claim adjustment expense (both paid and accrued) as originally reported at the
end of the first year in which the event that triggered coverage under the contract occurred (called policy year).(4) This section shows the cumulative amounts paid as of the end of successive years for each policy year. Paid claims include payments
expected to be reimbursed as rebate payments from participating pharmaceutical companies.(5) This section shows each policy year's incurred claims as reestimated at the end of each successive policy year. This annual reestimation
results from new information received on known claims, reevaluation of existing information on known claims, as well as emergence of new claims not previously known. Incurred claims are presented net of anticipated rebates.
(6) This line compares the latest reestimated incurred claims amount to the amount originally established (line 3) and shows whether this latest estimate of claims cost is greater or less than originally thought.As data for individual policy years mature, the correlation between original estimates and reestimated amounts is commonly used to evaluate the accuracy.
SOURCE: Wisconsin Department of Employee Trust Funds
263
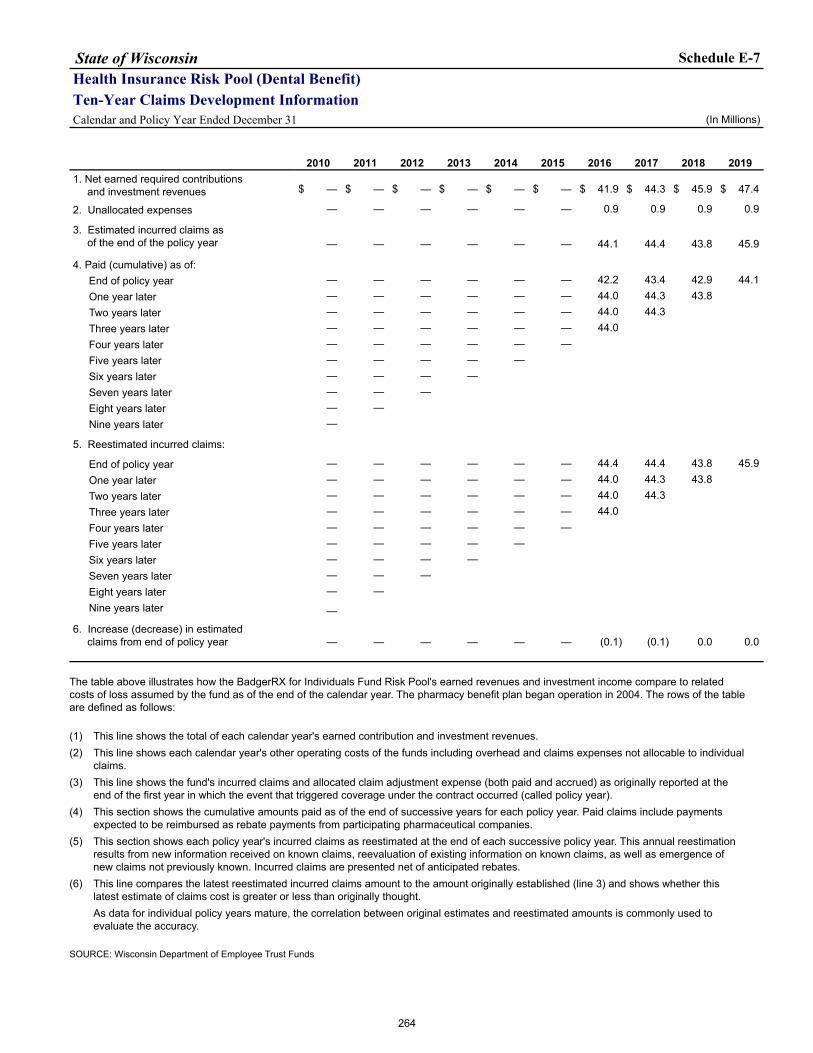
State of Wisconsin Schedule E-7Health Insurance Risk Pool (Dental Benefit)Ten-Year Claims Development InformationCalendar and Policy Year Ended December 31 (In Millions)
2010 2011 2012 2013 2014 2015 2016 2017 2018 20191. Net earned required contributions
and investment revenues $ — $ — $ — $ — $ — $ — $ 41.9 $ 44.3 $ 45.9 $ 47.4
2. Unallocated expenses — — — — — — 0.9 0.9 0.9 0.9
3. Estimated incurred claims asof the end of the policy year — — — — — — 44.1 44.4 43.8 45.9
4. Paid (cumulative) as of:End of policy year — — — — — — 42.2 43.4 42.9 44.1 One year later — — — — — — 44.0 44.3 43.8 Two years later — — — — — — 44.0 44.3 Three years later — — — — — — 44.0 Four years later — — — — — — Five years later — — — — — Six years later — — — — Seven years later — — — Eight years later — — Nine years later —
5. Reestimated incurred claims:
End of policy year — — — — — — 44.4 44.4 43.8 45.9 One year later — — — — — — 44.0 44.3 43.8 Two years later — — — — — — 44.0 44.3 Three years later — — — — — — 44.0 Four years later — — — — — — Five years later — — — — — Six years later — — — — Seven years later — — — Eight years later — — Nine years later —
6. Increase (decrease) in estimated claims from end of policy year — — — — — — (0.1) (0.1) 0.0 0.0
The table above illustrates how the BadgerRX for Individuals Fund Risk Pool's earned revenues and investment income compare to related costs of loss assumed by the fund as of the end of the calendar year. The pharmacy benefit plan began operation in 2004. The rows of the table are defined as follows:
(1) This line shows the total of each calendar year's earned contribution and investment revenues.(2) This line shows each calendar year's other operating costs of the funds including overhead and claims expenses not allocable to individual
claims.(3) This line shows the fund's incurred claims and allocated claim adjustment expense (both paid and accrued) as originally reported at the
end of the first year in which the event that triggered coverage under the contract occurred (called policy year).(4) This section shows the cumulative amounts paid as of the end of successive years for each policy year. Paid claims include payments
expected to be reimbursed as rebate payments from participating pharmaceutical companies.(5) This section shows each policy year's incurred claims as reestimated at the end of each successive policy year. This annual reestimation
results from new information received on known claims, reevaluation of existing information on known claims, as well as emergence of new claims not previously known. Incurred claims are presented net of anticipated rebates.
(6) This line compares the latest reestimated incurred claims amount to the amount originally established (line 3) and shows whether this latest estimate of claims cost is greater or less than originally thought.As data for individual policy years mature, the correlation between original estimates and reestimated amounts is commonly used to evaluate the accuracy.
SOURCE: Wisconsin Department of Employee Trust Funds
264
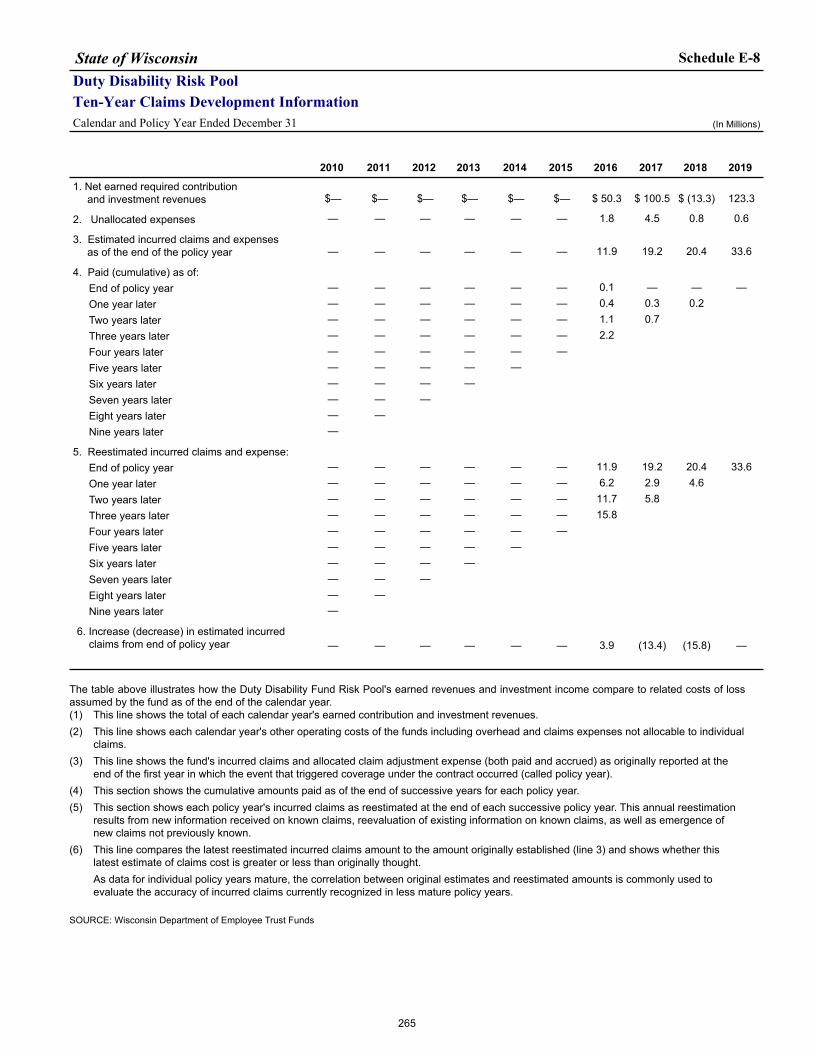
State of Wisconsin Schedule E-8Duty Disability Risk PoolTen-Year Claims Development InformationCalendar and Policy Year Ended December 31 (In Millions)
2010 2011 2012 2013 2014 2015 2016 2017 2018 2019
1. Net earned required contribution and investment revenues $— $— $— $— $— $— $ 50.3 $ 100.5 $ (13.3) 123.3
2. Unallocated expenses — — — — — — 1.8 4.5 0.8 0.6
3. Estimated incurred claims and expenses as of the end of the policy year — — — — — — 11.9 19.2 20.4 33.6
4. Paid (cumulative) as of:End of policy year — — — — — — 0.1 — — —One year later — — — — — — 0.4 0.3 0.2Two years later — — — — — — 1.1 0.7Three years later — — — — — — 2.2Four years later — — — — — —Five years later — — — — —Six years later — — — —Seven years later — — —Eight years later — —Nine years later —
5. Reestimated incurred claims and expense:End of policy year — — — — — — 11.9 19.2 20.4 33.6One year later — — — — — — 6.2 2.9 4.6Two years later — — — — — — 11.7 5.8Three years later — — — — — — 15.8Four years later — — — — — —Five years later — — — — —Six years later — — — —Seven years later — — —Eight years later — —Nine years later —
6. Increase (decrease) in estimated incurred claims from end of policy year — — — — — — 3.9 (13.4) (15.8) —
The table above illustrates how the Duty Disability Fund Risk Pool's earned revenues and investment income compare to related costs of loss assumed by the fund as of the end of the calendar year.(1) This line shows the total of each calendar year's earned contribution and investment revenues.(2) This line shows each calendar year's other operating costs of the funds including overhead and claims expenses not allocable to individual
claims.(3) This line shows the fund's incurred claims and allocated claim adjustment expense (both paid and accrued) as originally reported at the
end of the first year in which the event that triggered coverage under the contract occurred (called policy year).(4) This section shows the cumulative amounts paid as of the end of successive years for each policy year.(5) This section shows each policy year's incurred claims as reestimated at the end of each successive policy year. This annual reestimation
results from new information received on known claims, reevaluation of existing information on known claims, as well as emergence of new claims not previously known.
(6) This line compares the latest reestimated incurred claims amount to the amount originally established (line 3) and shows whether this latest estimate of claims cost is greater or less than originally thought.As data for individual policy years mature, the correlation between original estimates and reestimated amounts is commonly used to evaluate the accuracy of incurred claims currently recognized in less mature policy years.
SOURCE: Wisconsin Department of Employee Trust Funds
265
Acknowledgments
The Comprehensive Annual Financial Report was prepared by the Department of Administration, Division of Executive Budget and Finance, State Controller’s Office, Financial Reporting Section:
Justin Kennedy, CPADerik Bingner, CPABrandi Pellett, CPAWendy Powers
Special acknowledgement goes to all fiscal and accounting personnel throughout Wisconsin State government and in the State Controller’s Office, along with Legislative Audit Bureau staff, whose dedicated efforts and cooperation contributed to the compilation of financial information that appears in the report.
Cover photo of Wisconsin’s State Capitol courtesy of Man M. Le, photographer.
266