Embed Size (px)
Citation preview
844 | ICES SCIENTIFIC REPORTS 2:61 | ICES
17 Sole (Solea solea) in Subarea 27.4 (North Sea)
17.1 General
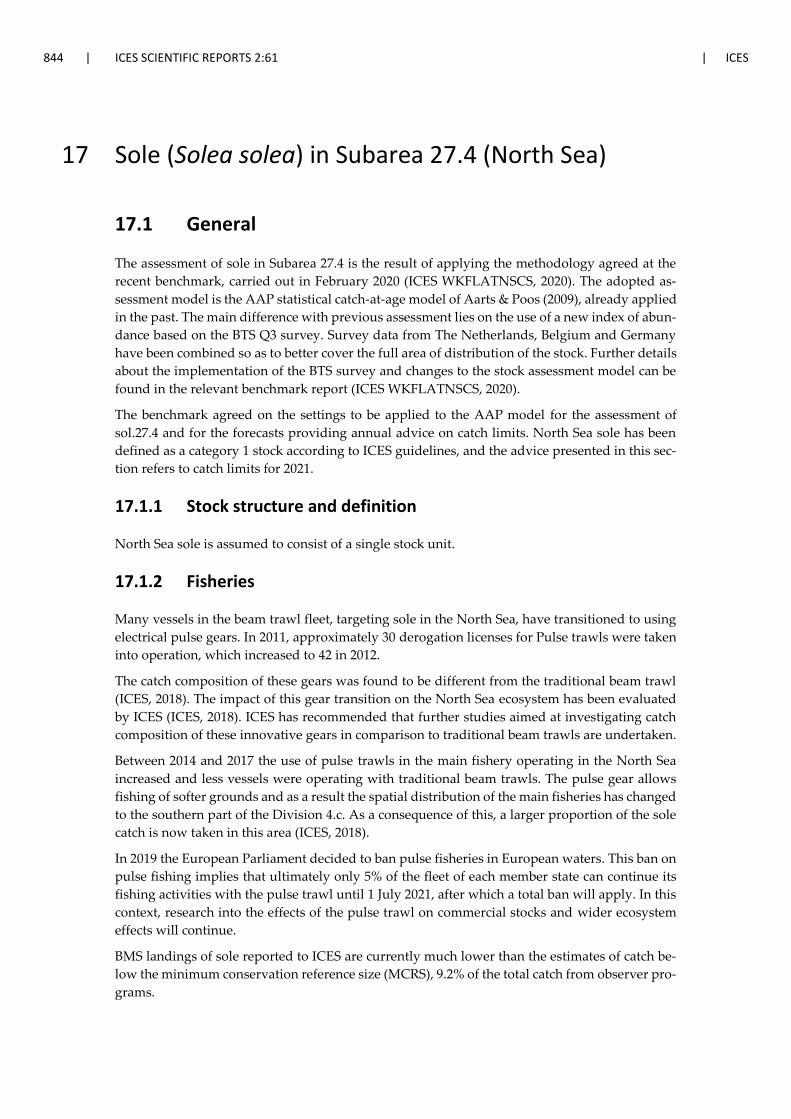
The assessment of sole in Subarea 27.4 is the result of applying the methodology agreed at the
recent benchmark, carried out in February 2020 (ICES WKFLATNSCS, 2020). The adopted as-
sessment model is the AAP statistical catch-at-age model of Aarts & Poos (2009), already applied
in the past. The main difference with previous assessment lies on the use of a new index of abun-
dance based on the BTS Q3 survey. Survey data from The Netherlands, Belgium and Germany
have been combined so as to better cover the full area of distribution of the stock. Further details
about the implementation of the BTS survey and changes to the stock assessment model can be
found in the relevant benchmark report (ICES WKFLATNSCS, 2020).
The benchmark agreed on the settings to be applied to the AAP model for the assessment of
sol.27.4 and for the forecasts providing annual advice on catch limits. North Sea sole has been
defined as a category 1 stock according to ICES guidelines, and the advice presented in this sec-
tion refers to catch limits for 2021.
17.1.1 Stock structure and definition
North Sea sole is assumed to consist of a single stock unit.
17.1.2 Fisheries
Many vessels in the beam trawl fleet, targeting sole in the North Sea, have transitioned to using
electrical pulse gears. In 2011, approximately 30 derogation licenses for Pulse trawls were taken
into operation, which increased to 42 in 2012.
The catch composition of these gears was found to be different from the traditional beam trawl
(ICES, 2018). The impact of this gear transition on the North Sea ecosystem has been evaluated
by ICES (ICES, 2018). ICES has recommended that further studies aimed at investigating catch
composition of these innovative gears in comparison to traditional beam trawls are undertaken.
Between 2014 and 2017 the use of pulse trawls in the main fishery operating in the North Sea
increased and less vessels were operating with traditional beam trawls. The pulse gear allows
fishing of softer grounds and as a result the spatial distribution of the main fisheries has changed
to the southern part of the Division 4.c. As a consequence of this, a larger proportion of the sole
catch is now taken in this area (ICES, 2018).
In 2019 the European Parliament decided to ban pulse fisheries in European waters. This ban on
pulse fishing implies that ultimately only 5% of the fleet of each member state can continue its
fishing activities with the pulse trawl until 1 July 2021, after which a total ban will apply. In this
context, research into the effects of the pulse trawl on commercial stocks and wider ecosystem
effects will continue.
BMS landings of sole reported to ICES are currently much lower than the estimates of catch be-
low the minimum conservation reference size (MCRS), 9.2% of the total catch from observer pro-
grams.
ICES | WGNSSK 2020 | 845
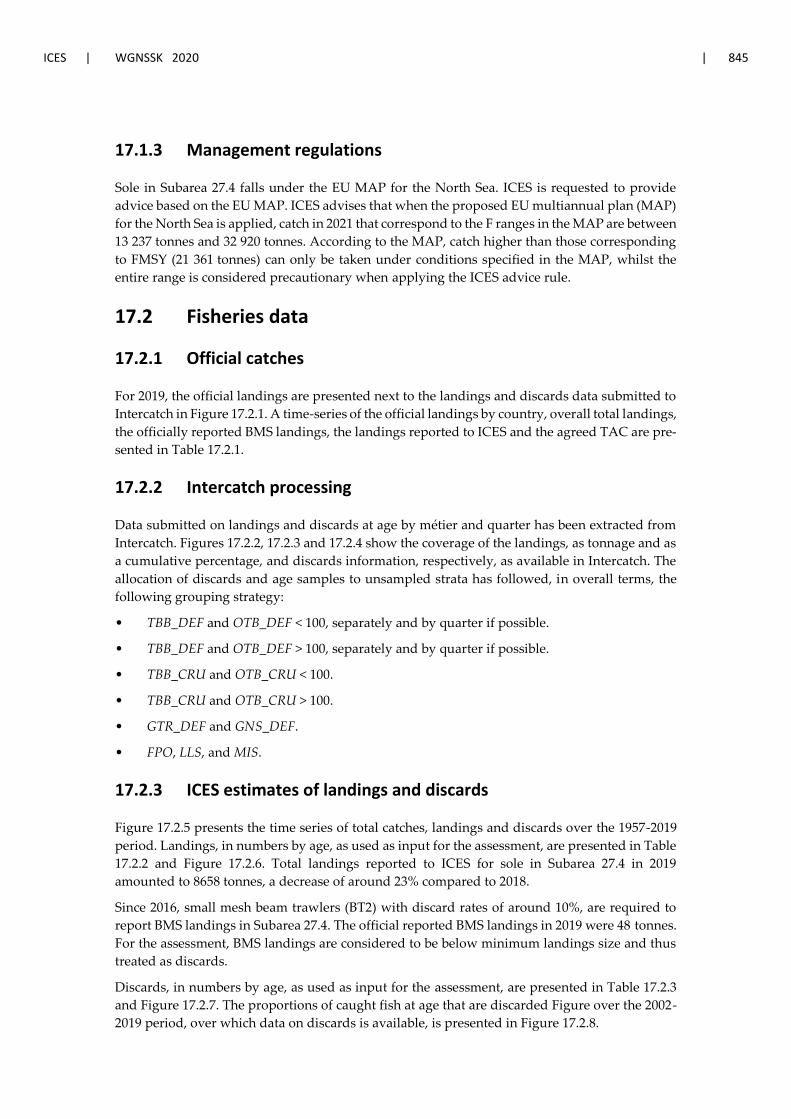
17.1.3 Management regulations
Sole in Subarea 27.4 falls under the EU MAP for the North Sea. ICES is requested to provide
advice based on the EU MAP. ICES advises that when the proposed EU multiannual plan (MAP)
for the North Sea is applied, catch in 2021 that correspond to the F ranges in the MAP are between
13 237 tonnes and 32 920 tonnes. According to the MAP, catch higher than those corresponding
to FMSY (21 361 tonnes) can only be taken under conditions specified in the MAP, whilst the
entire range is considered precautionary when applying the ICES advice rule.
17.2 Fisheries data
17.2.1 Official catches
For 2019, the official landings are presented next to the landings and discards data submitted to
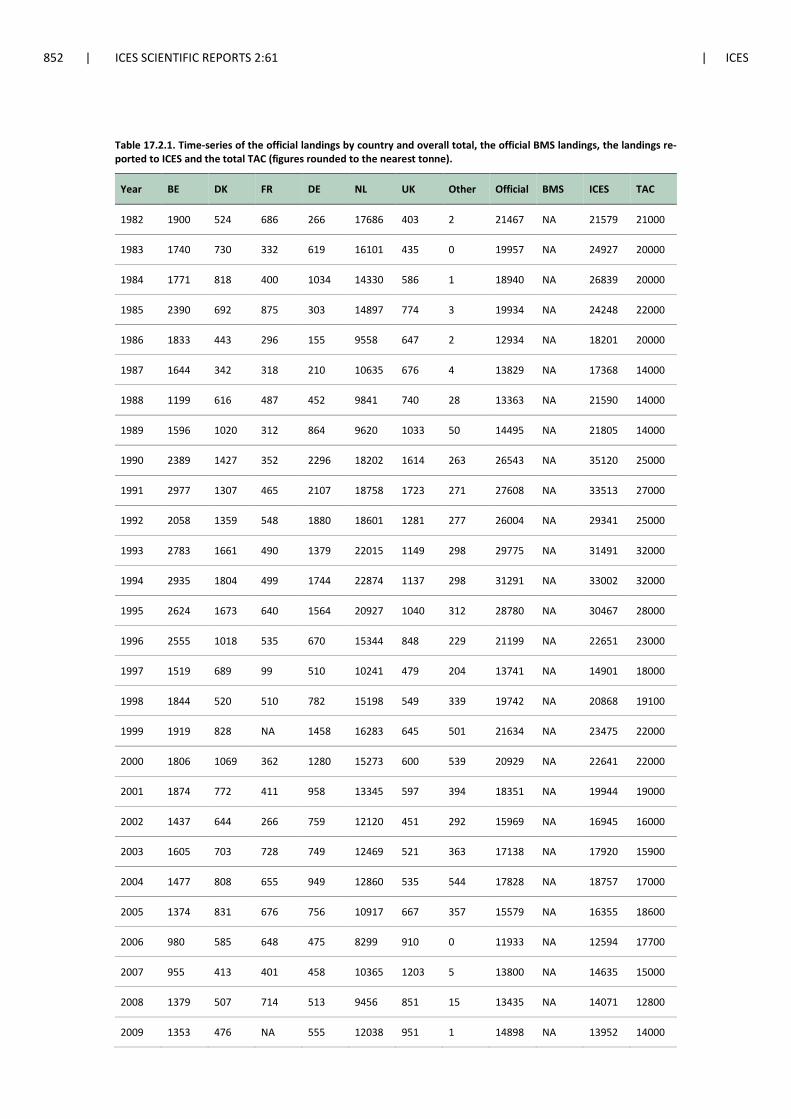
Intercatch in Figure 17.2.1. A time-series of the official landings by country, overall total landings,
the officially reported BMS landings, the landings reported to ICES and the agreed TAC are pre-
sented in Table 17.2.1.
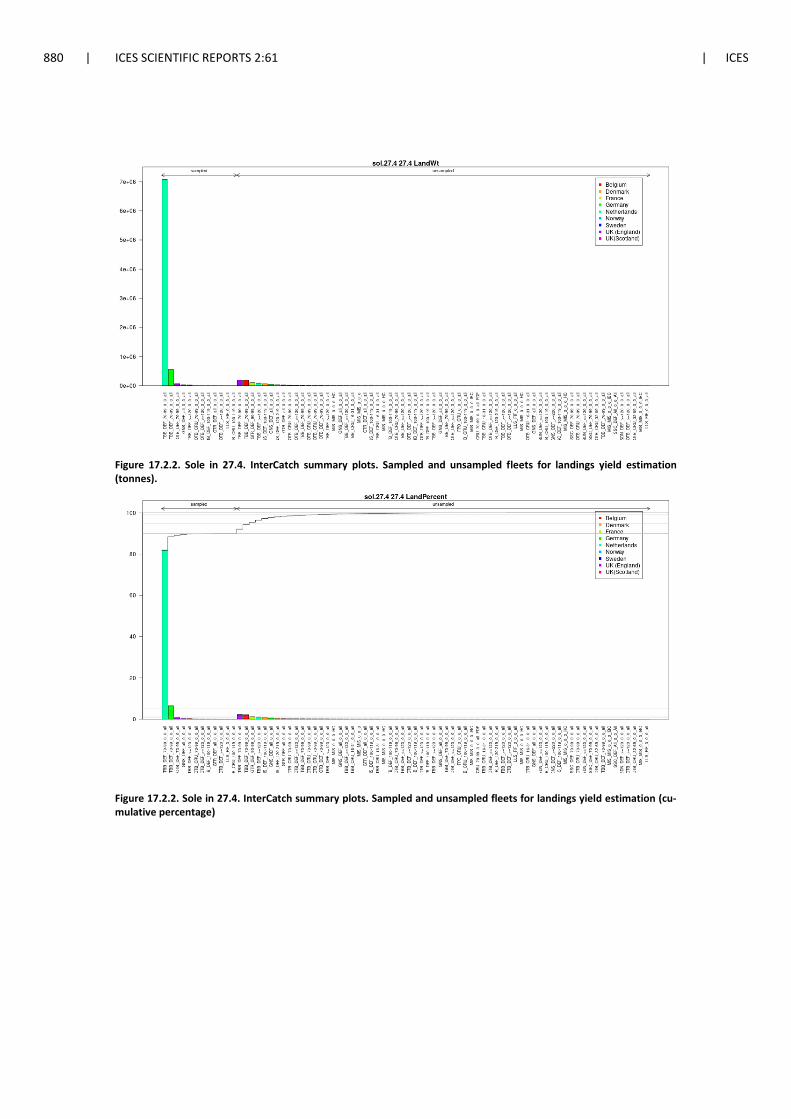
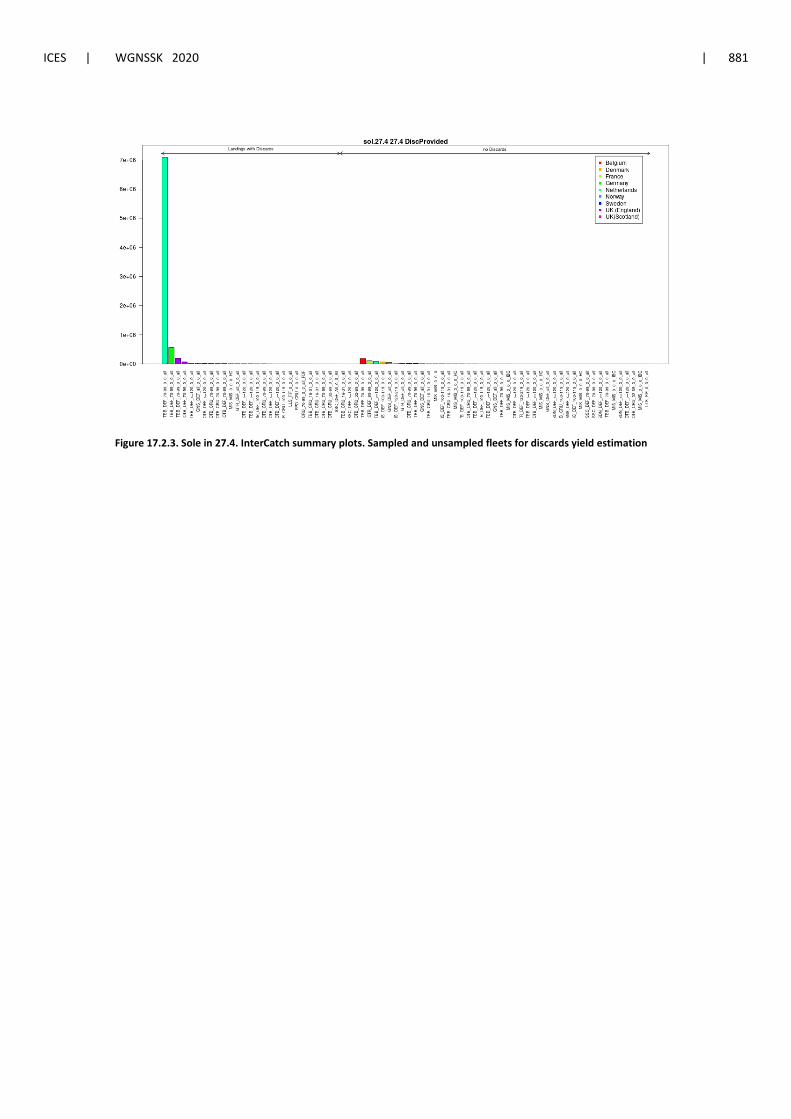
17.2.2 Intercatch processing
Data submitted on landings and discards at age by métier and quarter has been extracted from
Intercatch. Figures 17.2.2, 17.2.3 and 17.2.4 show the coverage of the landings, as tonnage and as
a cumulative percentage, and discards information, respectively, as available in Intercatch. The
allocation of discards and age samples to unsampled strata has followed, in overall terms, the
following grouping strategy:
• TBB_DEF and OTB_DEF < 100, separately and by quarter if possible.
• TBB_DEF and OTB_DEF > 100, separately and by quarter if possible.
• TBB_CRU and OTB_CRU < 100.
• TBB_CRU and OTB_CRU > 100.
• GTR_DEF and GNS_DEF.
• FPO, LLS, and MIS.
17.2.3 ICES estimates of landings and discards
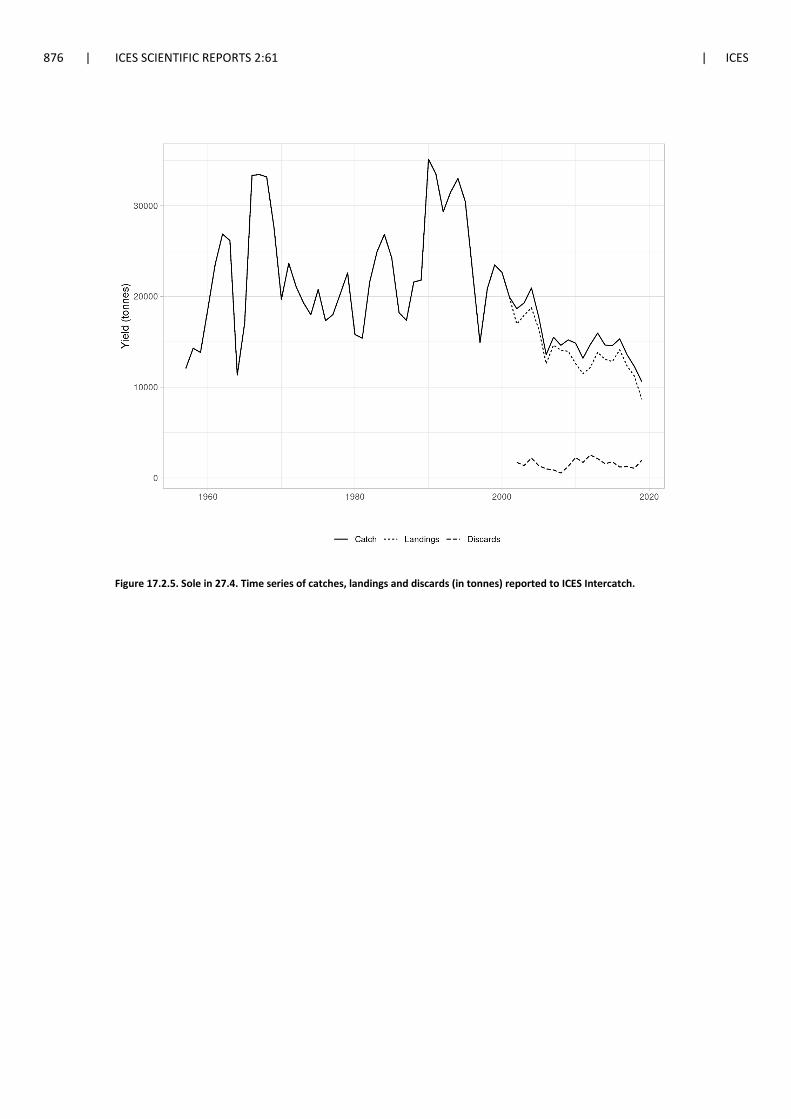
Figure 17.2.5 presents the time series of total catches, landings and discards over the 1957-2019
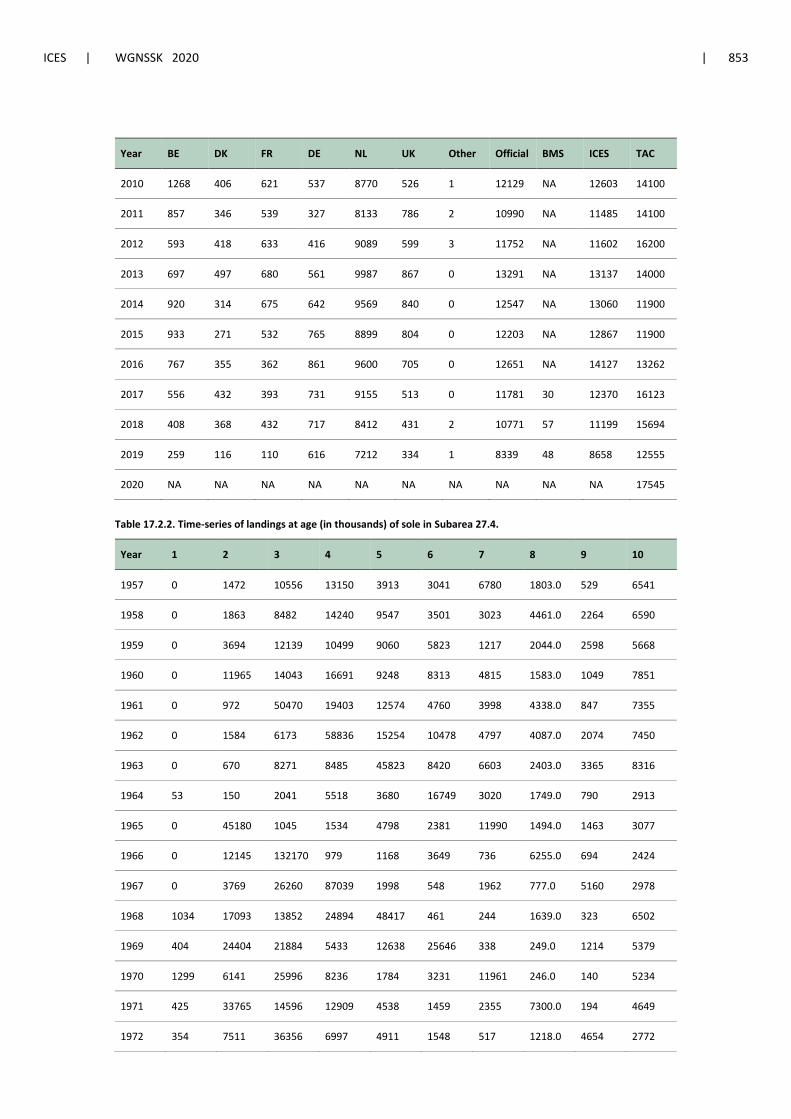
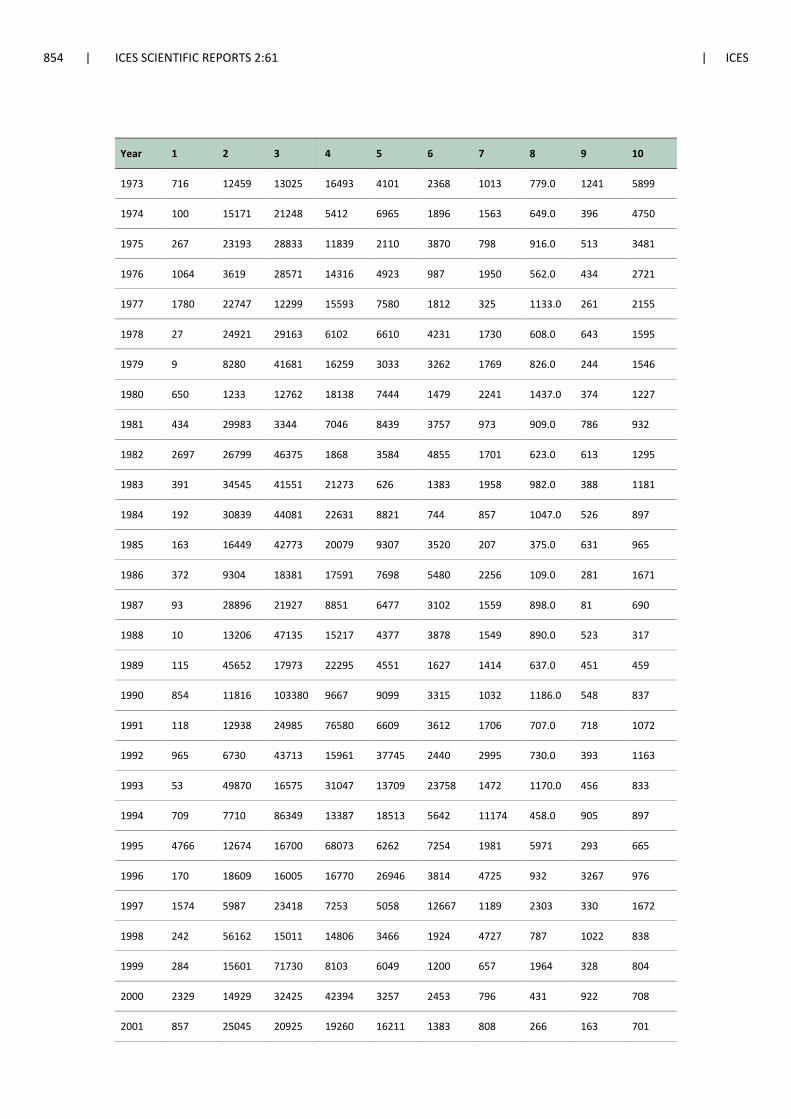
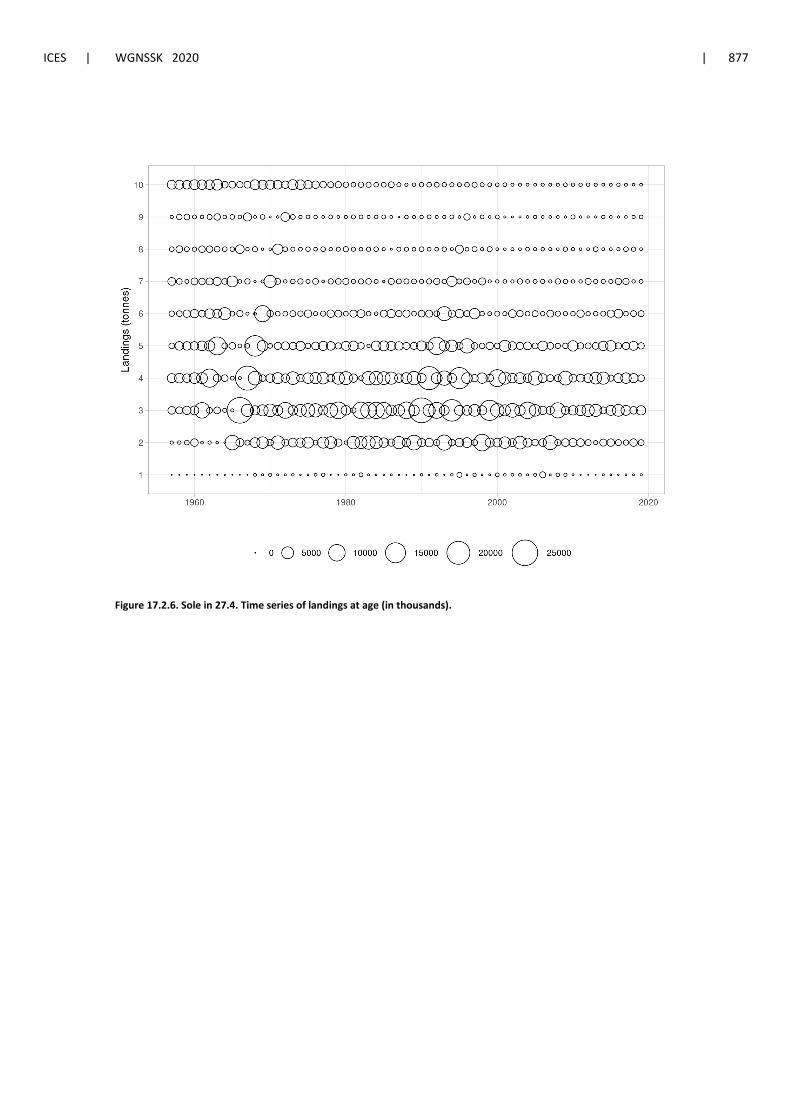
period. Landings, in numbers by age, as used as input for the assessment, are presented in Table
17.2.2 and Figure 17.2.6. Total landings reported to ICES for sole in Subarea 27.4 in 2019
amounted to 8658 tonnes, a decrease of around 23% compared to 2018.
Since 2016, small mesh beam trawlers (BT2) with discard rates of around 10%, are required to
report BMS landings in Subarea 27.4. The official reported BMS landings in 2019 were 48 tonnes.
For the assessment, BMS landings are considered to be below minimum landings size and thus
treated as discards.
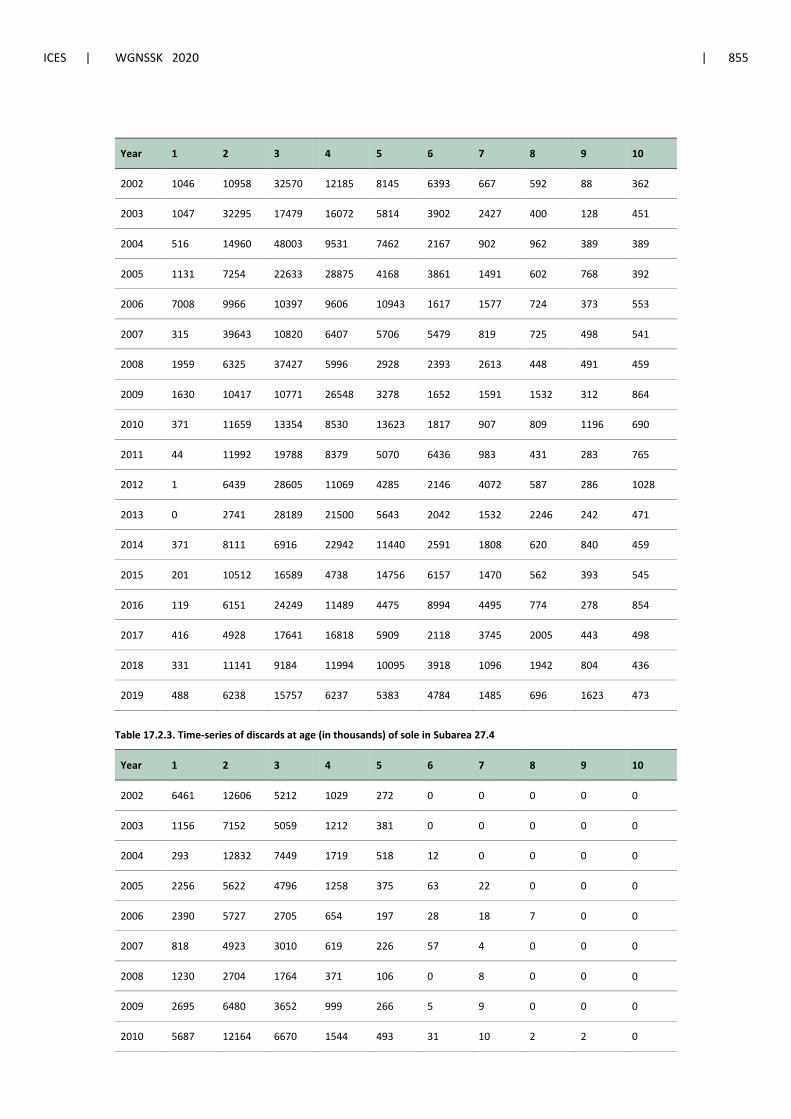
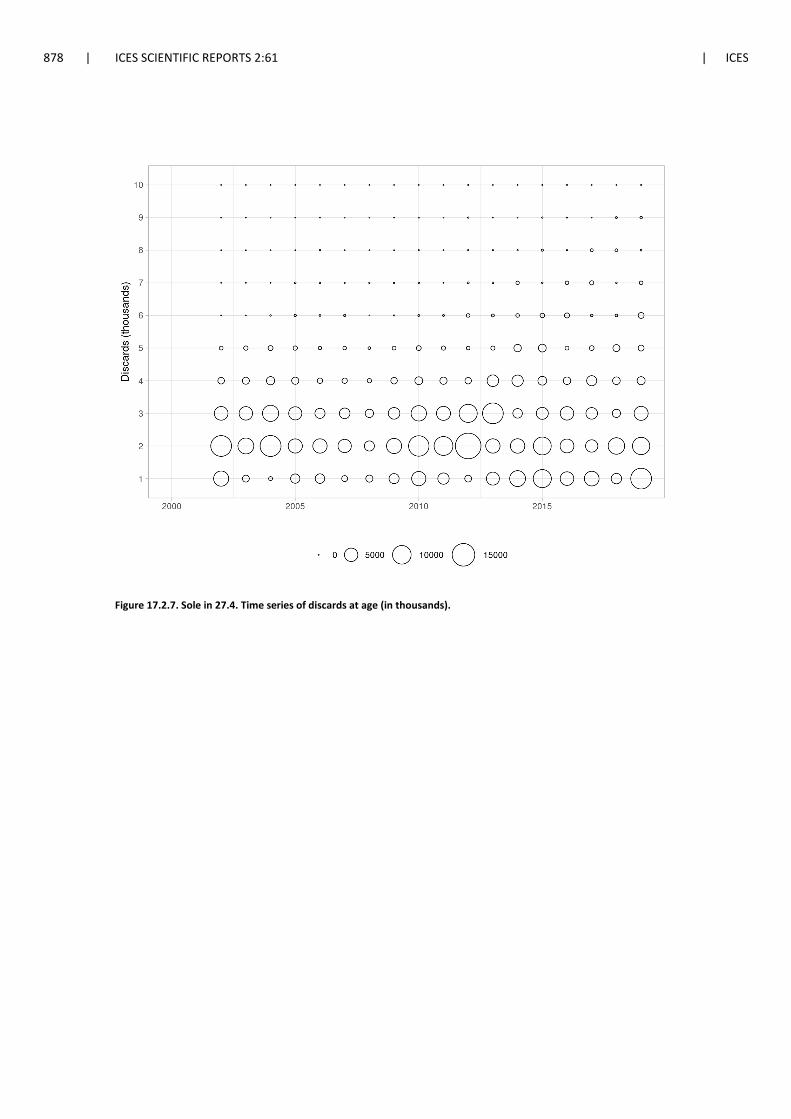
Discards, in numbers by age, as used as input for the assessment, are presented in Table 17.2.3
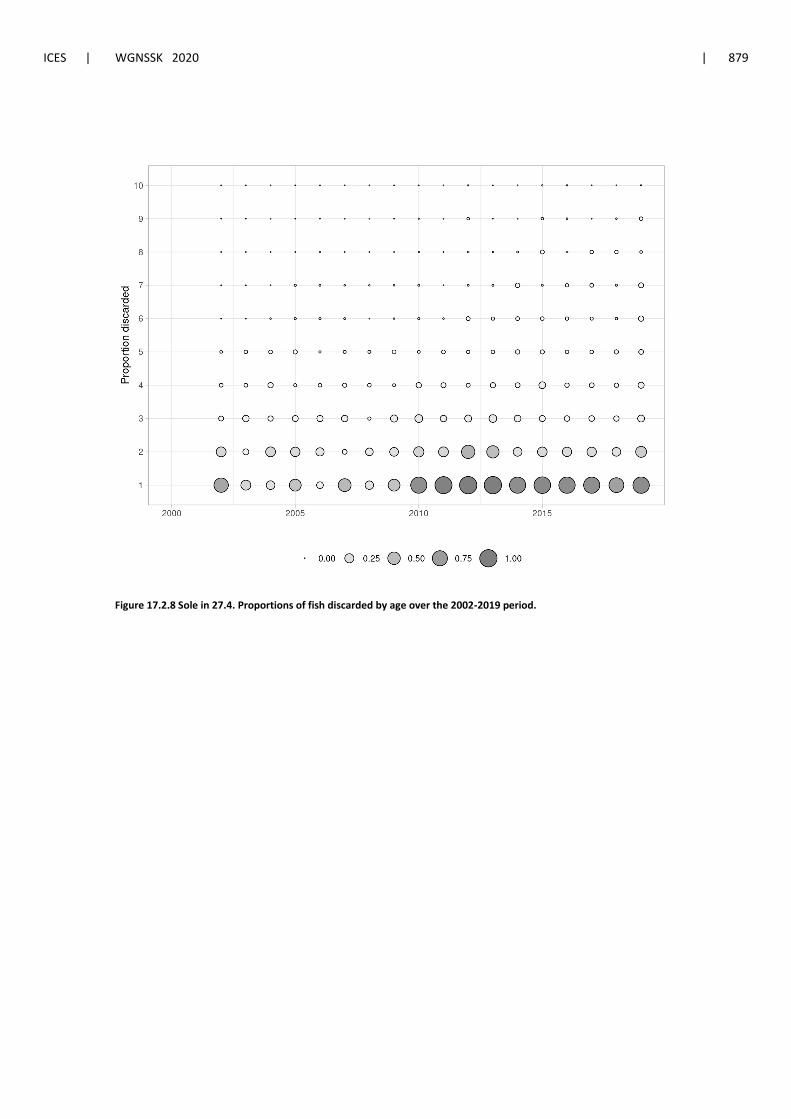
and Figure 17.2.7. The proportions of caught fish at age that are discarded Figure over the 2002-
2019 period, over which data on discards is available, is presented in Figure 17.2.8.
846 | ICES SCIENTIFIC REPORTS 2:61 | ICES
In 2019, official catches amounted to 66.4% of the TAC, while landings reported to ICES were
69% of the TAC. If both landings and discards estimates are used, total catch in 2019 was 84.5%
of the agreed TAC.
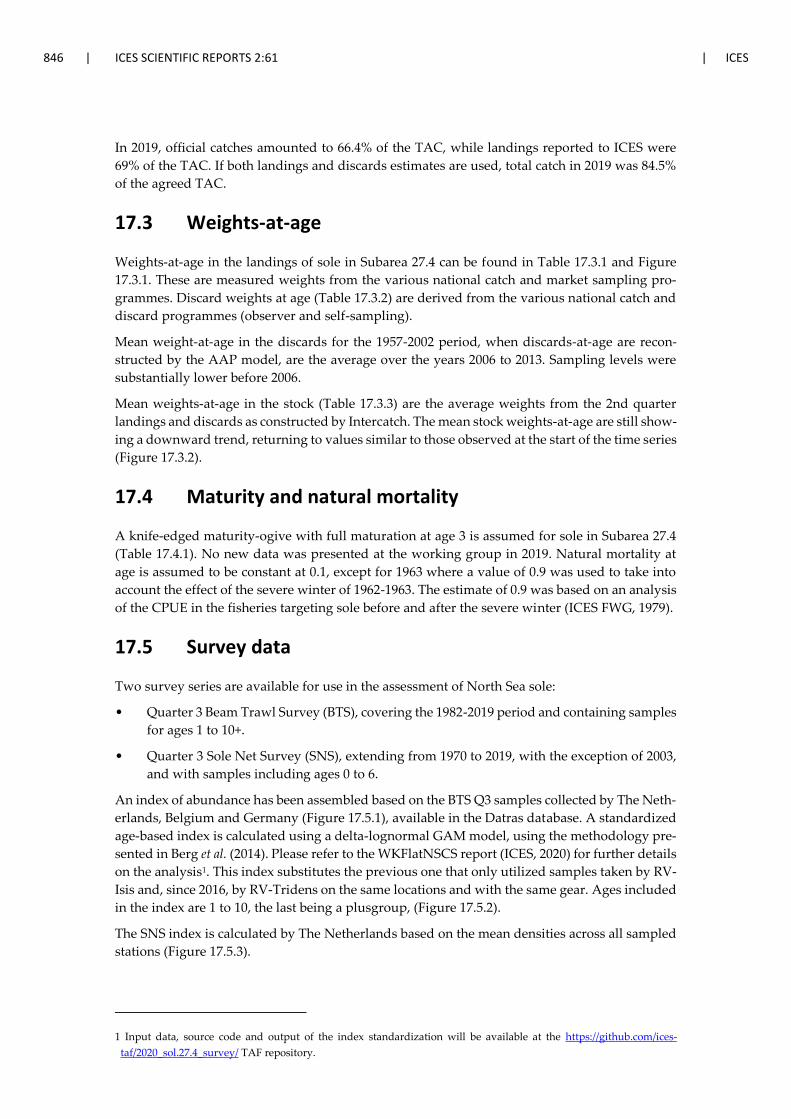
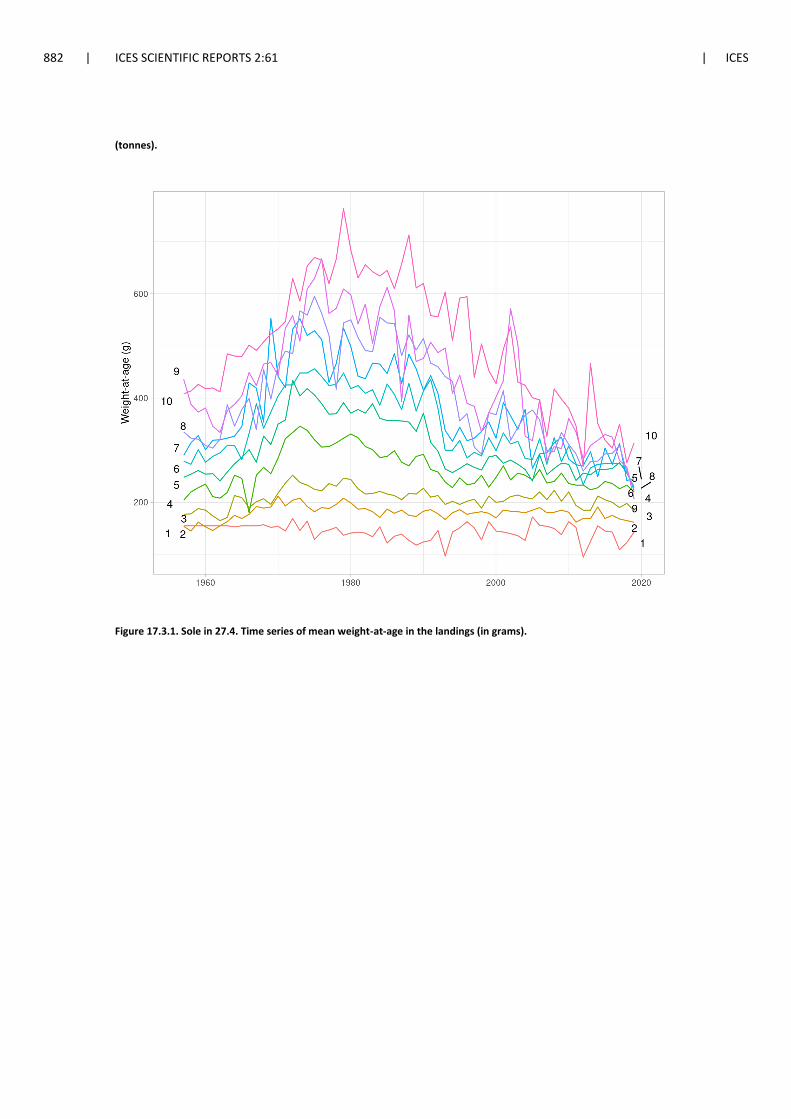
17.3 Weights-at-age
Weights-at-age in the landings of sole in Subarea 27.4 can be found in Table 17.3.1 and Figure
17.3.1. These are measured weights from the various national catch and market sampling pro-
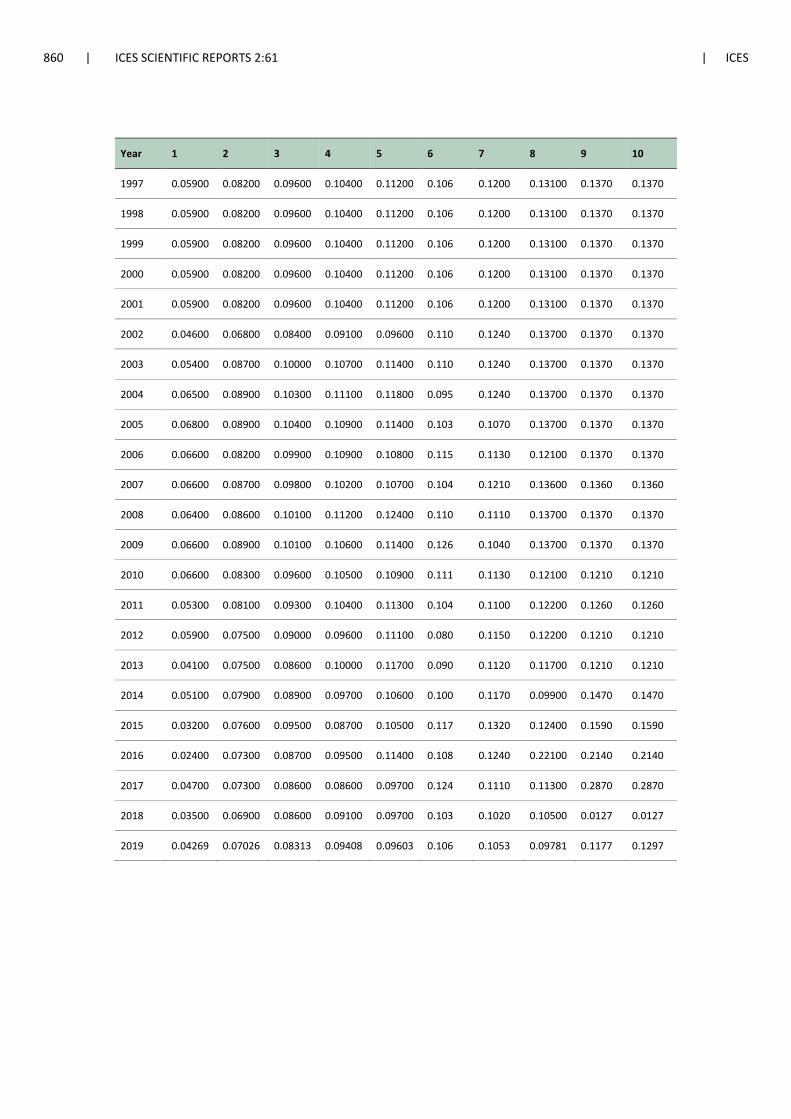
grammes. Discard weights at age (Table 17.3.2) are derived from the various national catch and
discard programmes (observer and self-sampling).
Mean weight-at-age in the discards for the 1957-2002 period, when discards-at-age are recon-
structed by the AAP model, are the average over the years 2006 to 2013. Sampling levels were
substantially lower before 2006.
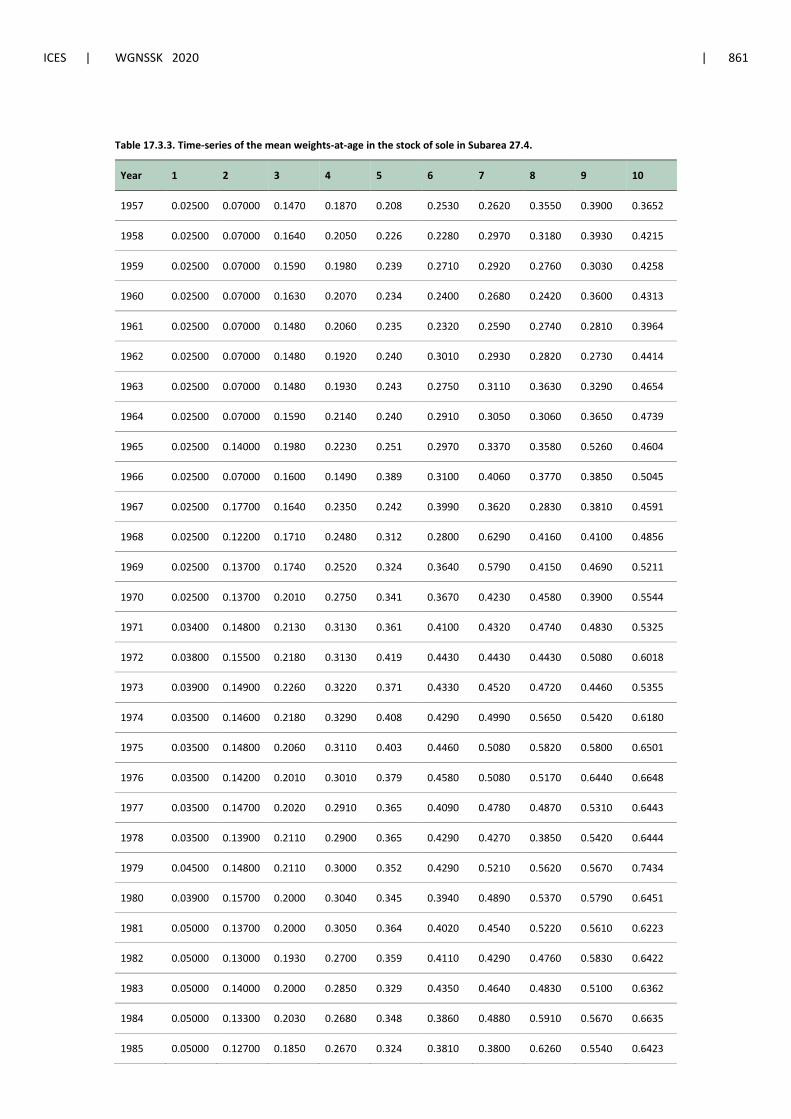
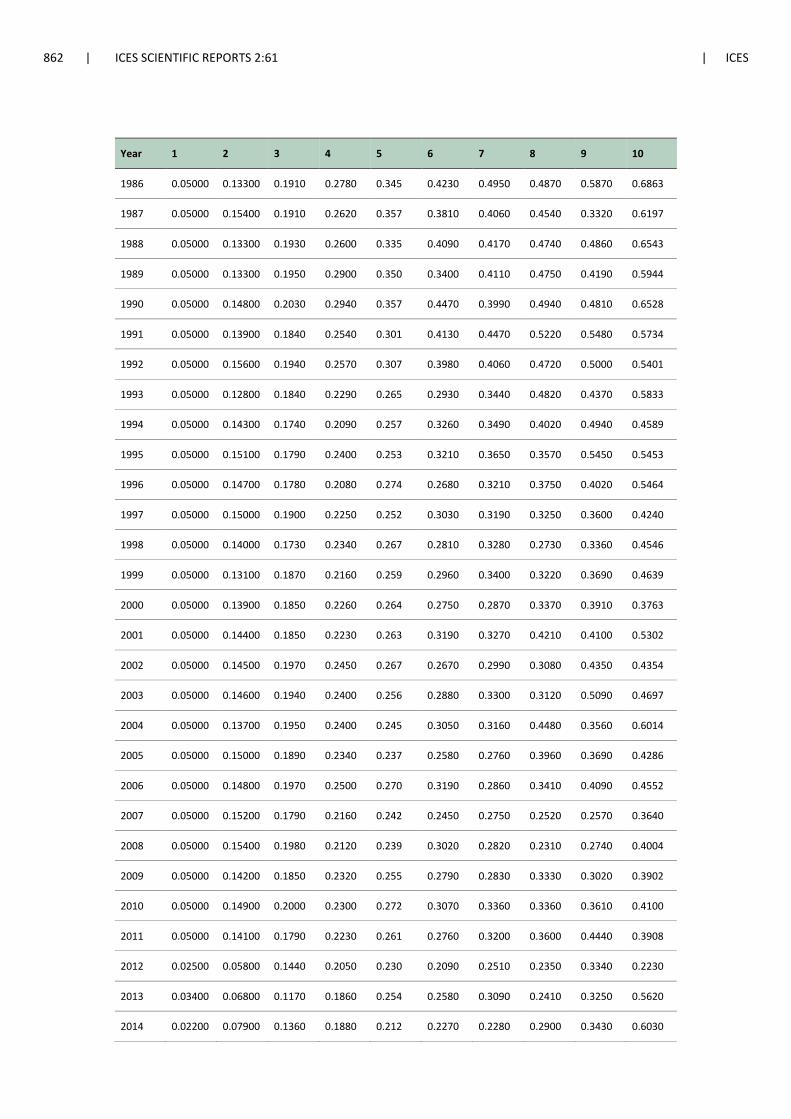
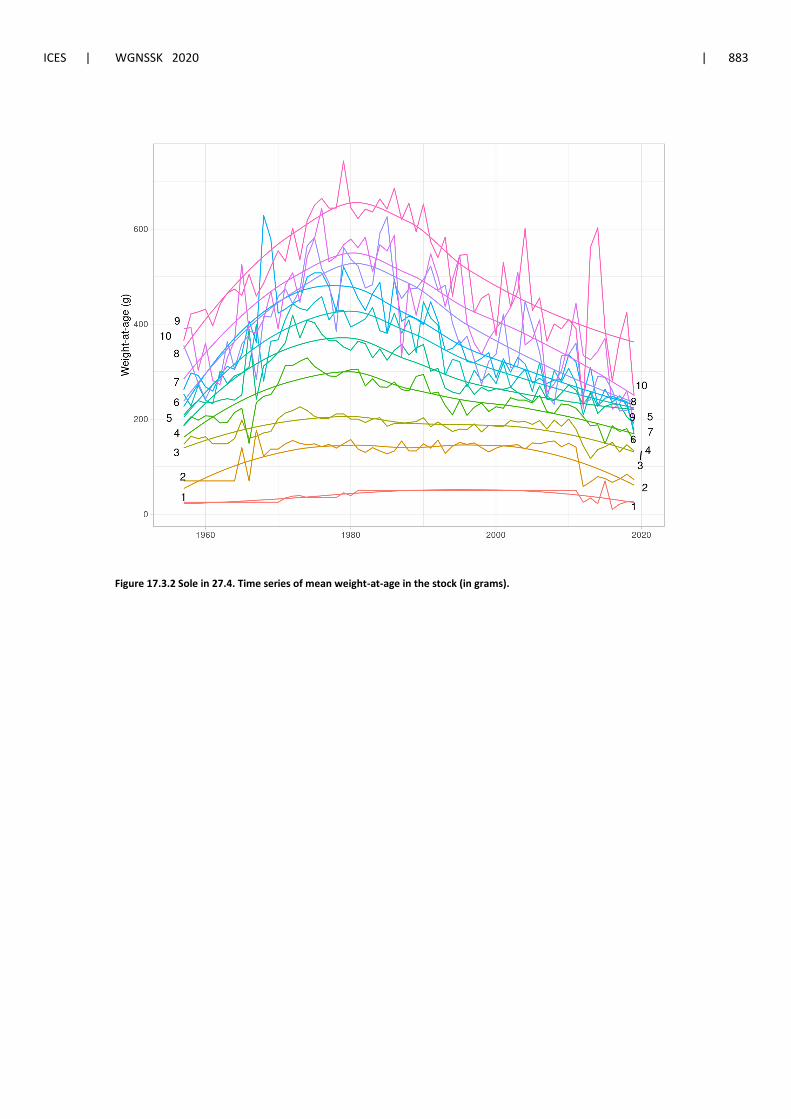
Mean weights-at-age in the stock (Table 17.3.3) are the average weights from the 2nd quarter
landings and discards as constructed by Intercatch. The mean stock weights-at-age are still show-
ing a downward trend, returning to values similar to those observed at the start of the time series
(Figure 17.3.2).
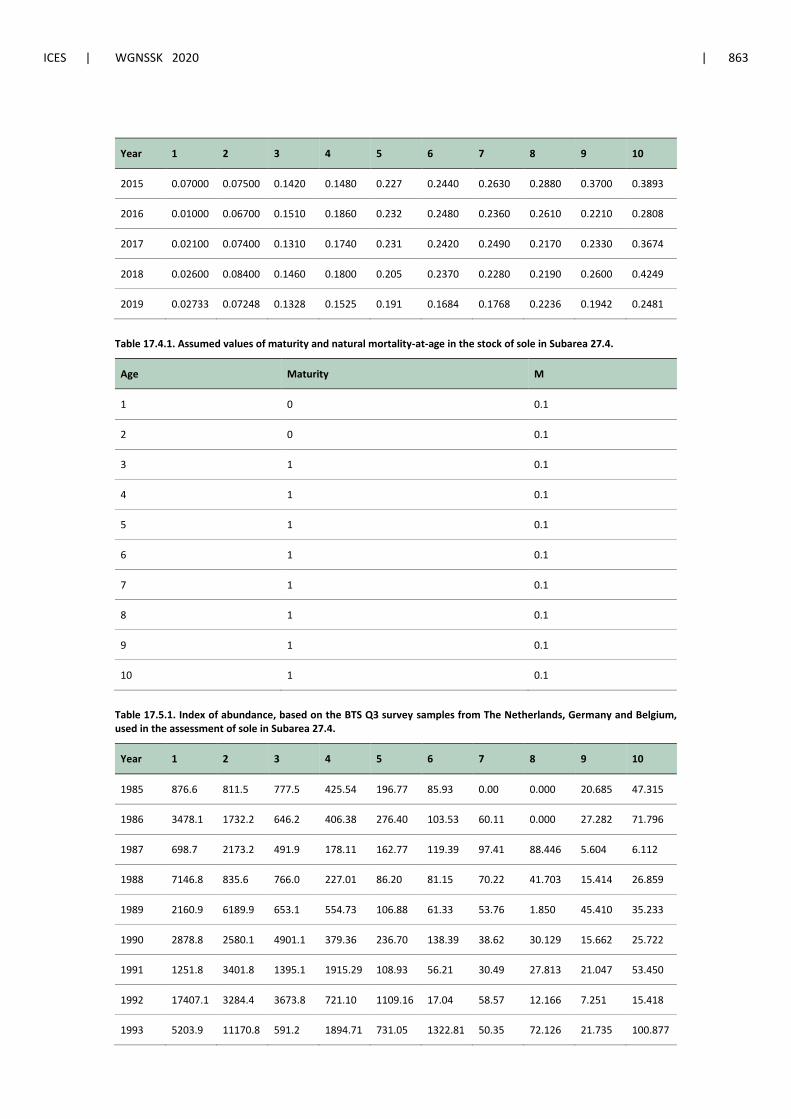
17.4 Maturity and natural mortality
A knife-edged maturity-ogive with full maturation at age 3 is assumed for sole in Subarea 27.4
(Table 17.4.1). No new data was presented at the working group in 2019. Natural mortality at
age is assumed to be constant at 0.1, except for 1963 where a value of 0.9 was used to take into
account the effect of the severe winter of 1962-1963. The estimate of 0.9 was based on an analysis
of the CPUE in the fisheries targeting sole before and after the severe winter (ICES FWG, 1979).
17.5 Survey data
Two survey series are available for use in the assessment of North Sea sole:
• Quarter 3 Beam Trawl Survey (BTS), covering the 1982-2019 period and containing samples
for ages 1 to 10+.
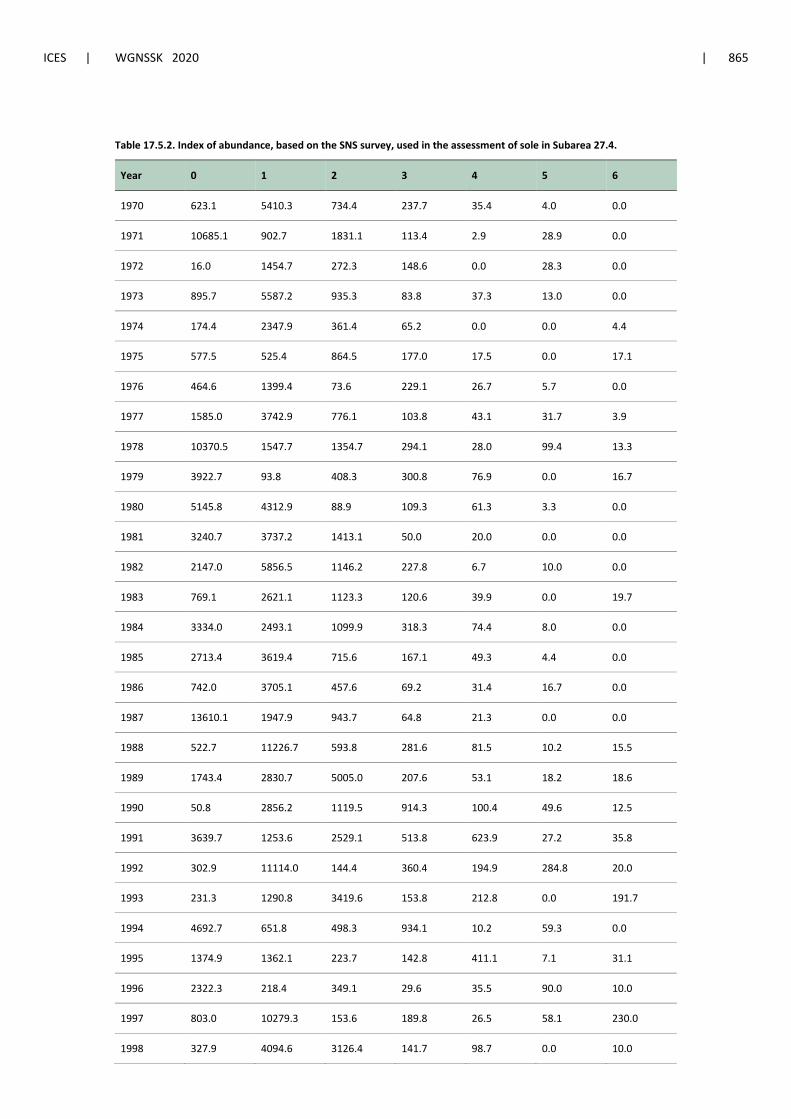
• Quarter 3 Sole Net Survey (SNS), extending from 1970 to 2019, with the exception of 2003,
and with samples including ages 0 to 6.
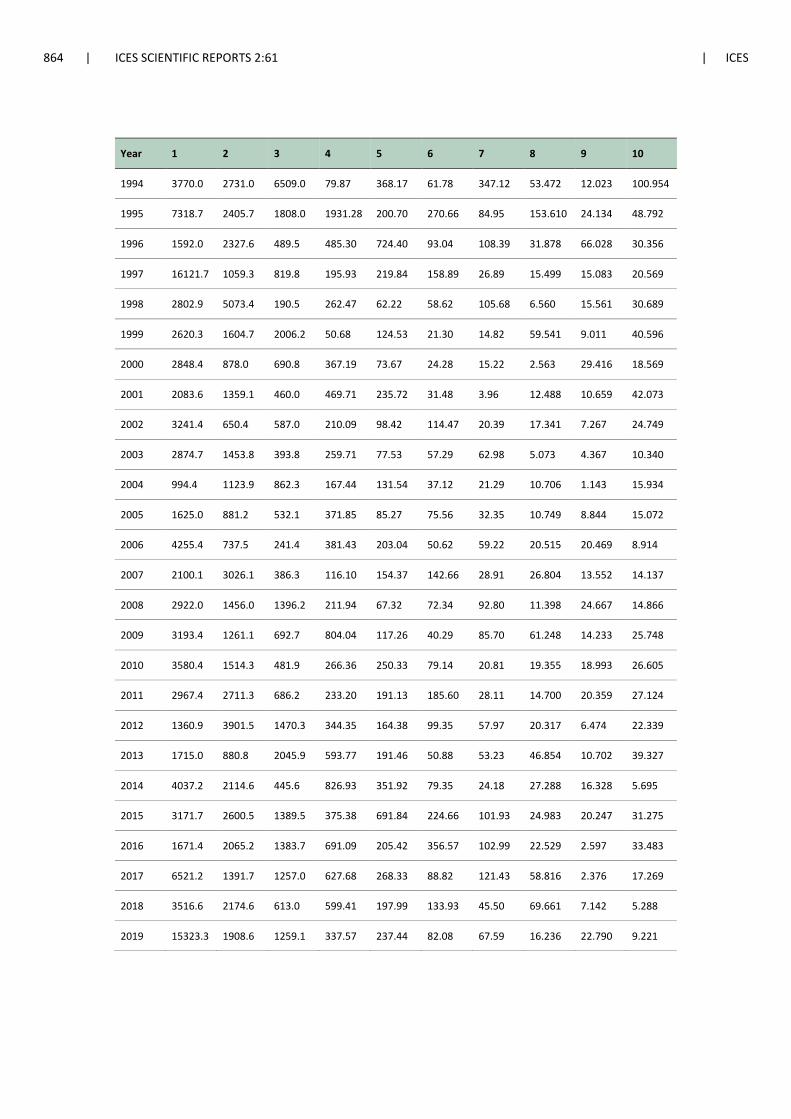
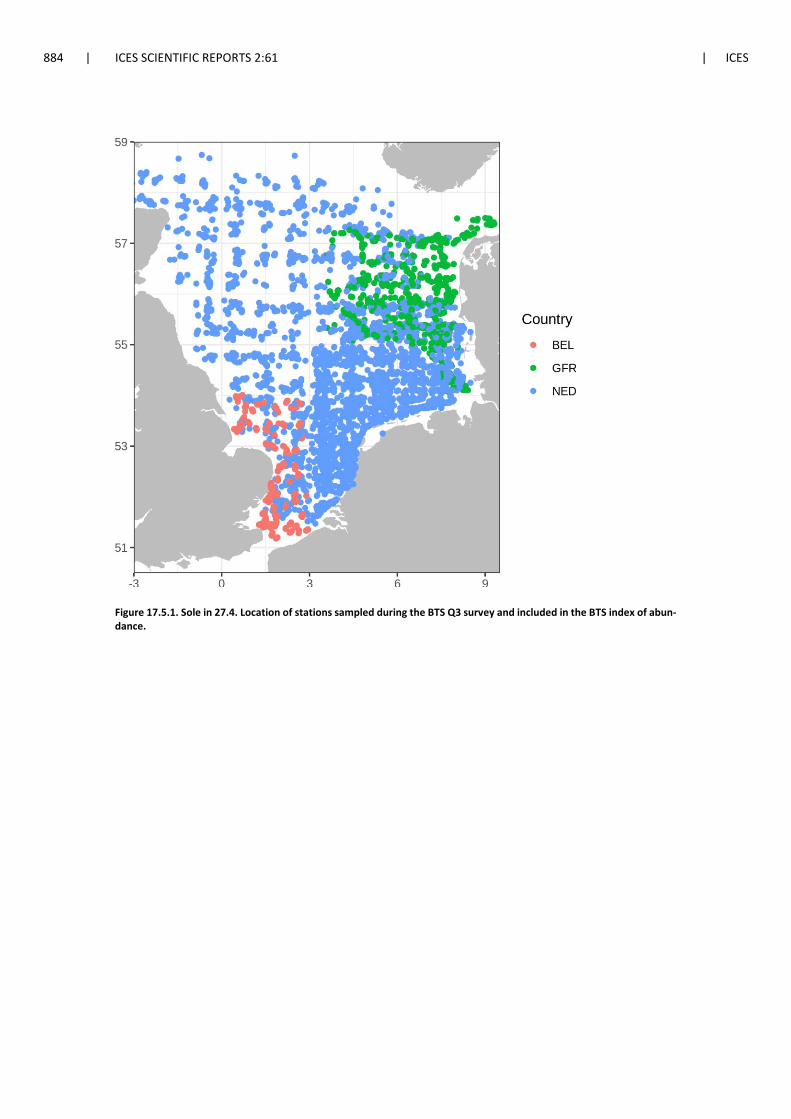
An index of abundance has been assembled based on the BTS Q3 samples collected by The Neth-
erlands, Belgium and Germany (Figure 17.5.1), available in the Datras database. A standardized
age-based index is calculated using a delta-lognormal GAM model, using the methodology pre-
sented in Berg et al. (2014). Please refer to the WKFlatNSCS report (ICES, 2020) for further details
on the analysis1. This index substitutes the previous one that only utilized samples taken by RV-
Isis and, since 2016, by RV-Tridens on the same locations and with the same gear. Ages included
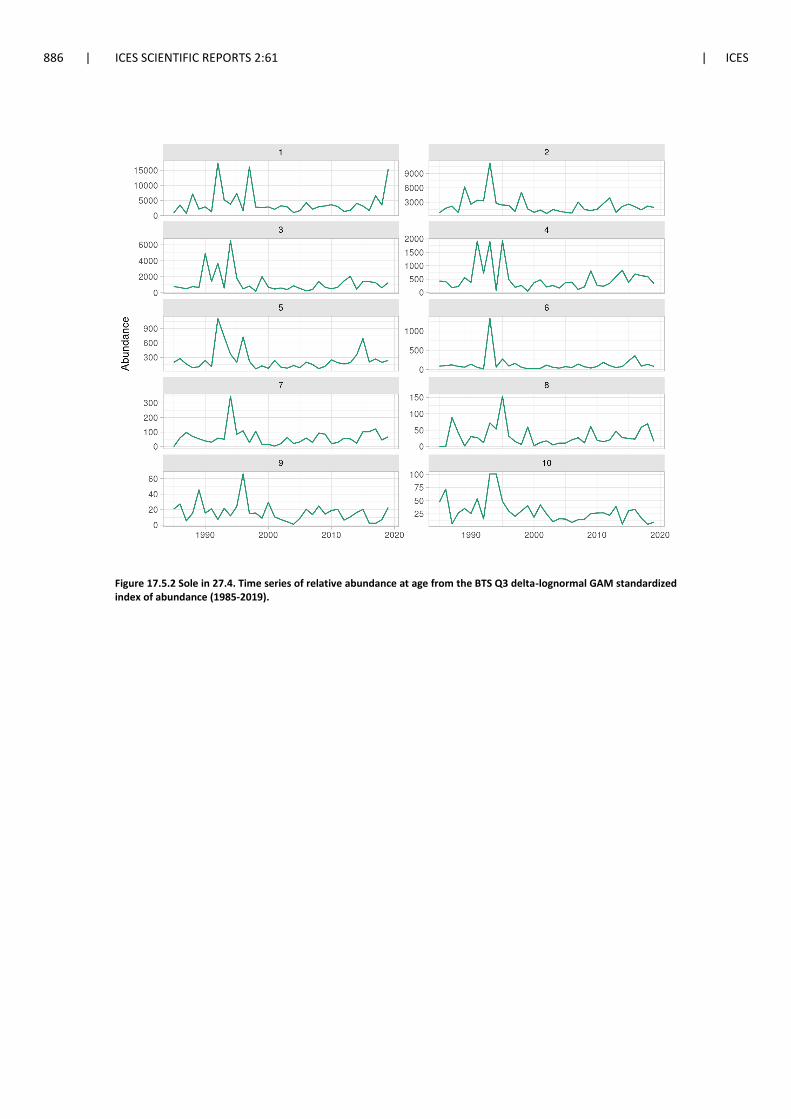
in the index are 1 to 10, the last being a plusgroup, (Figure 17.5.2).
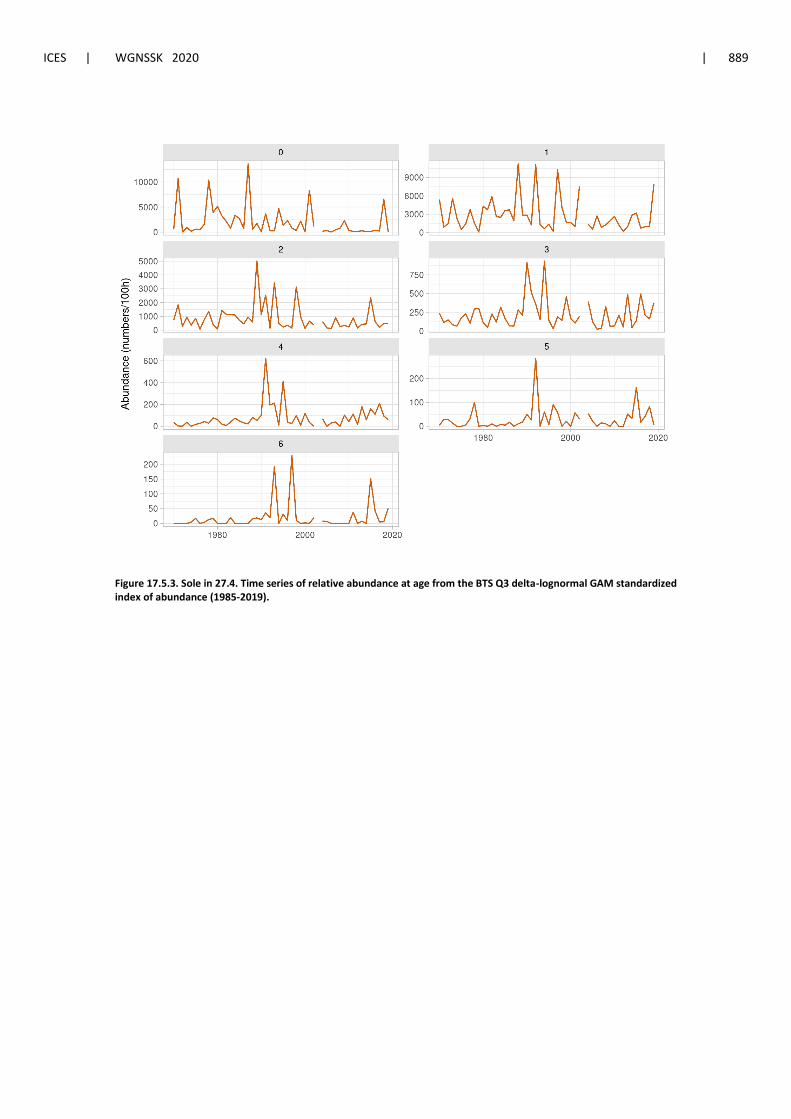
The SNS index is calculated by The Netherlands based on the mean densities across all sampled
stations (Figure 17.5.3).
1 Input data, source code and output of the index standardization will be available at the https://github.com/ices-
taf/2020_sol.27.4_survey/ TAF repository.
ICES | WGNSSK 2020 | 847
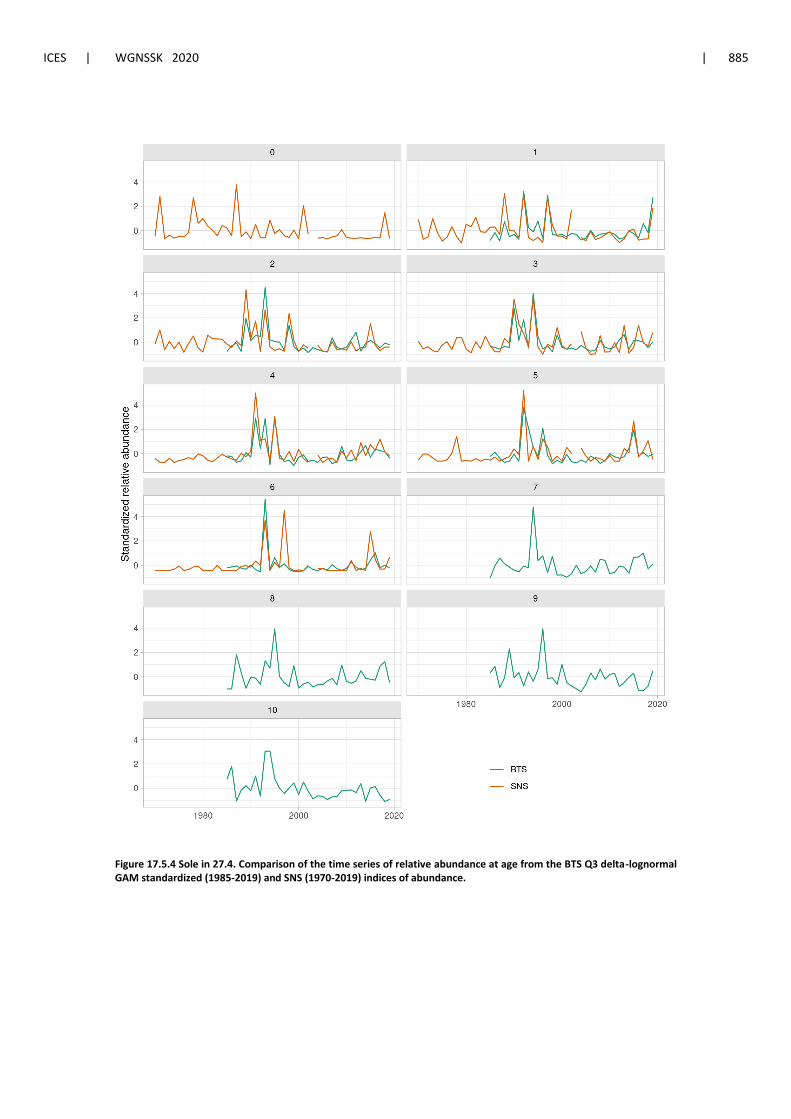
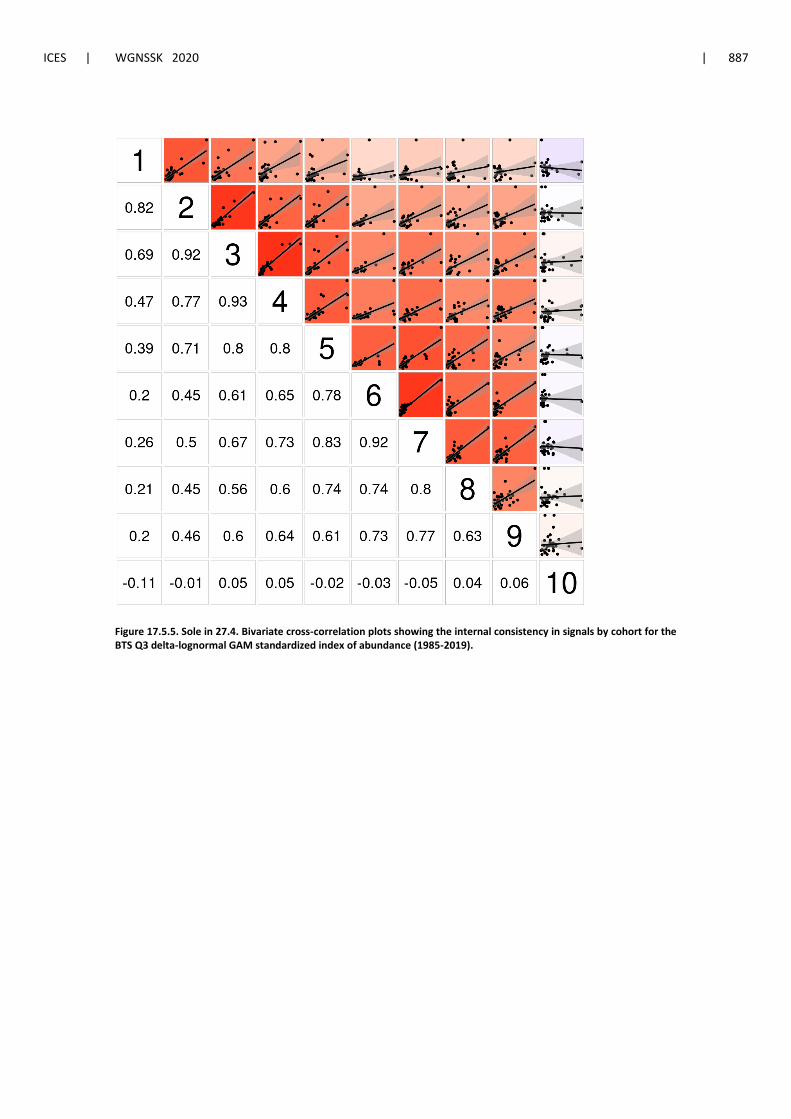
A standardized comparison of the two indices over the available time-series is presented in Fig-
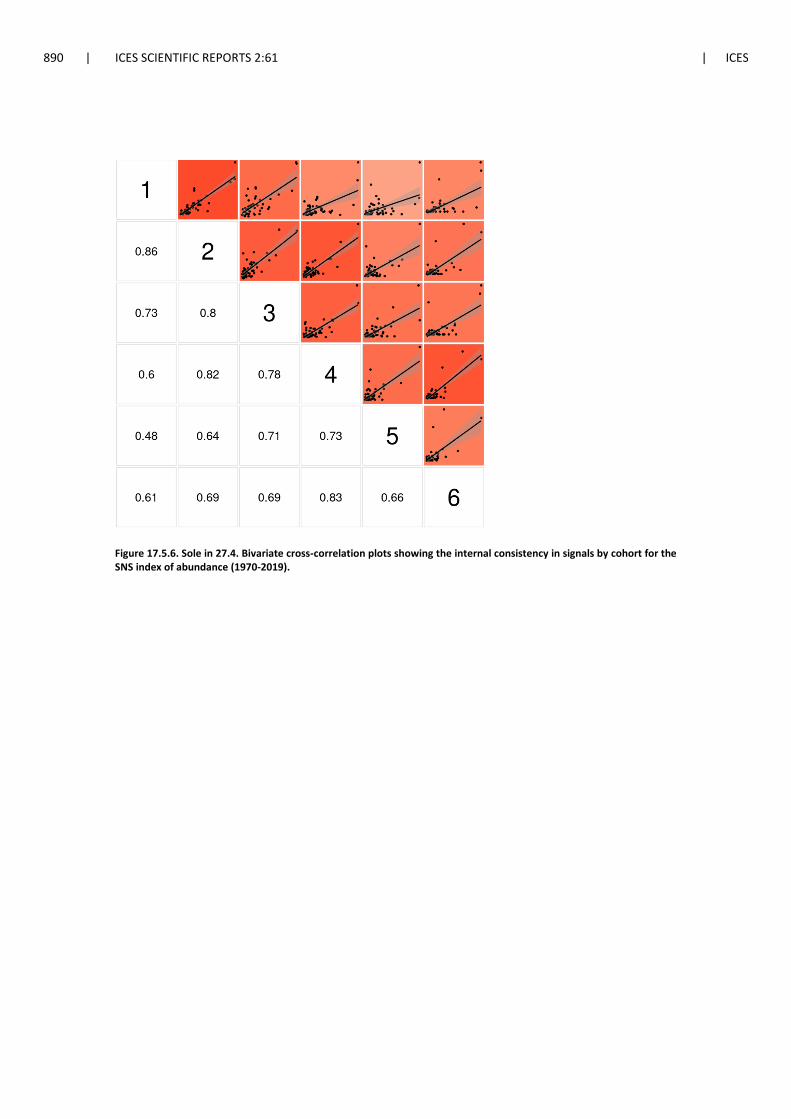
ure 17.5.4. The internal consistency plots of the year class cohorts of the two indices are presented
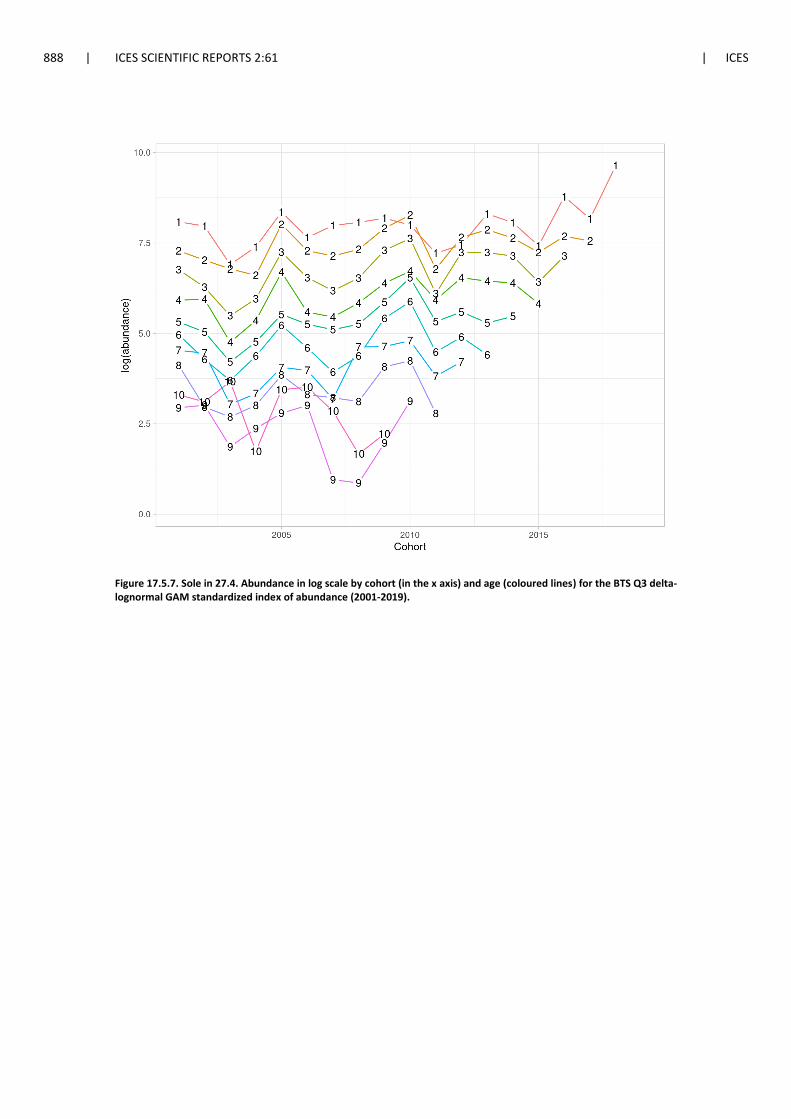
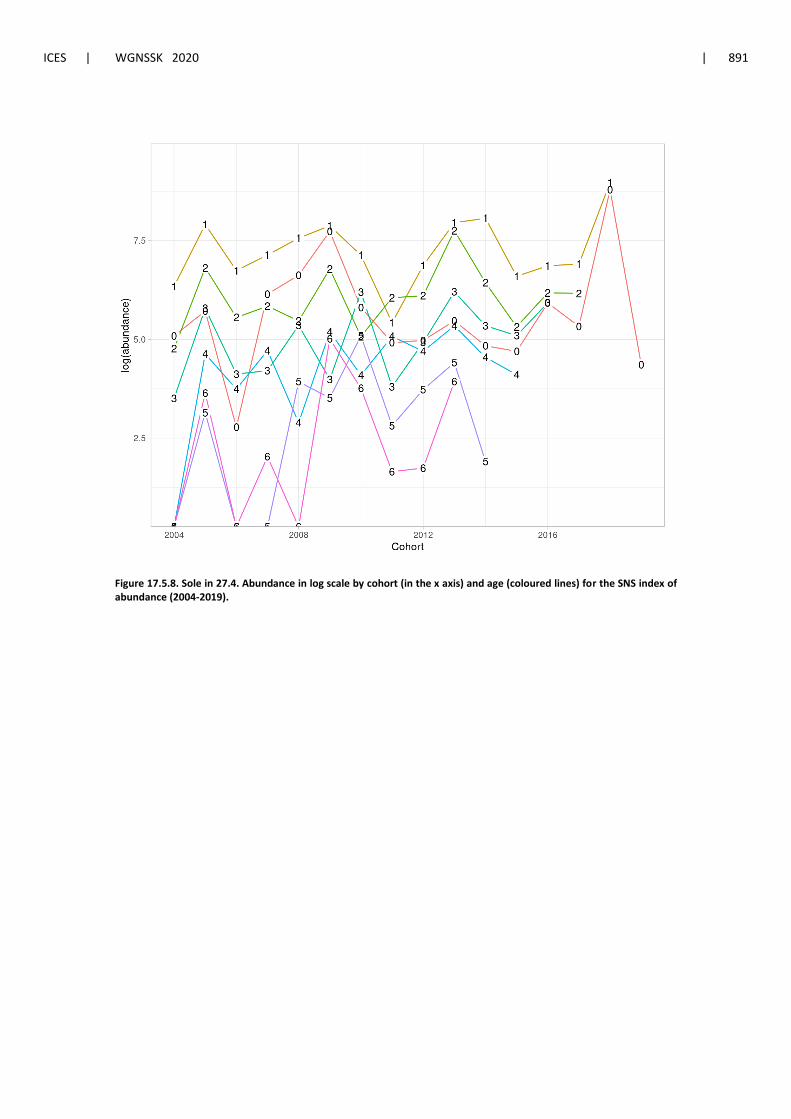
in Figures 17.5.5 and 17.5.6, while the mean standardized indices per cohort and by year are
shown on Figures 17.5.7 and 17.5.8. The two survey indices used in the assessment are presented
in Tables 17.5.1 and 17.5.2.
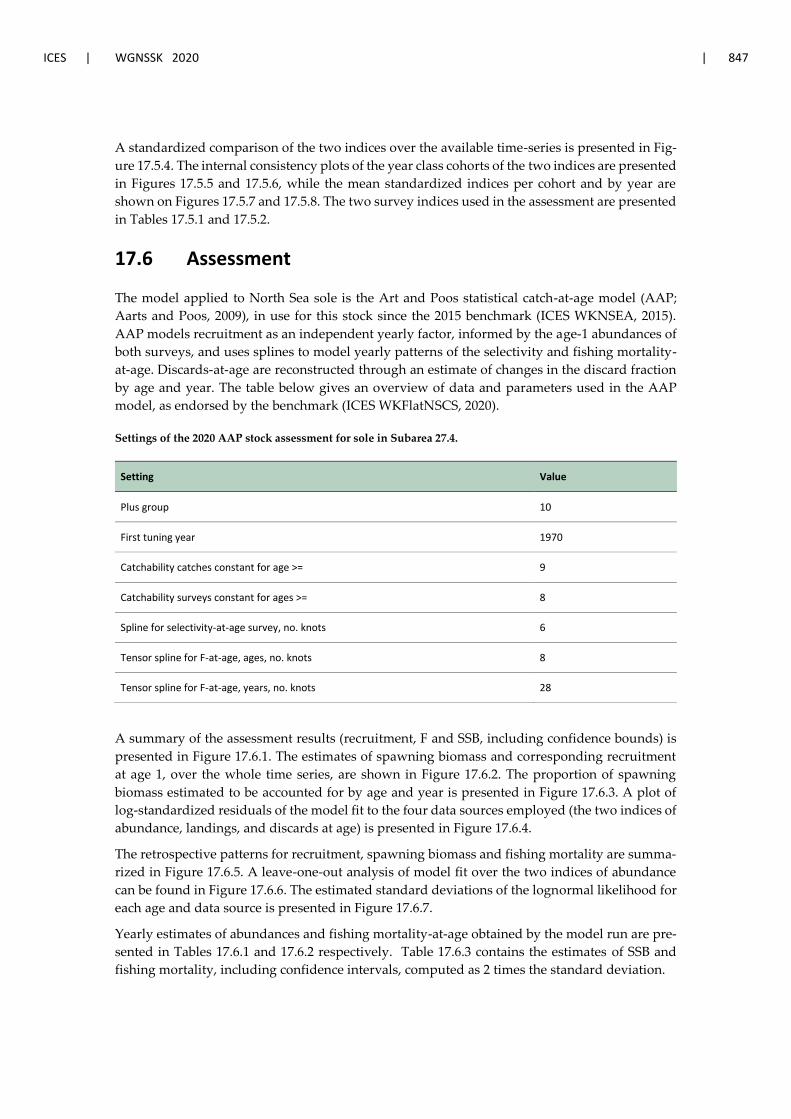
17.6 Assessment
The model applied to North Sea sole is the Art and Poos statistical catch-at-age model (AAP;
Aarts and Poos, 2009), in use for this stock since the 2015 benchmark (ICES WKNSEA, 2015).
AAP models recruitment as an independent yearly factor, informed by the age-1 abundances of
both surveys, and uses splines to model yearly patterns of the selectivity and fishing mortality-
at-age. Discards-at-age are reconstructed through an estimate of changes in the discard fraction
by age and year. The table below gives an overview of data and parameters used in the AAP
model, as endorsed by the benchmark (ICES WKFlatNSCS, 2020).
Settings of the 2020 AAP stock assessment for sole in Subarea 27.4.
Setting Value
Plus group 10
First tuning year 1970
Catchability catches constant for age >= 9
Catchability surveys constant for ages >= 8
Spline for selectivity-at-age survey, no. knots 6
Tensor spline for F-at-age, ages, no. knots 8
Tensor spline for F-at-age, years, no. knots 28
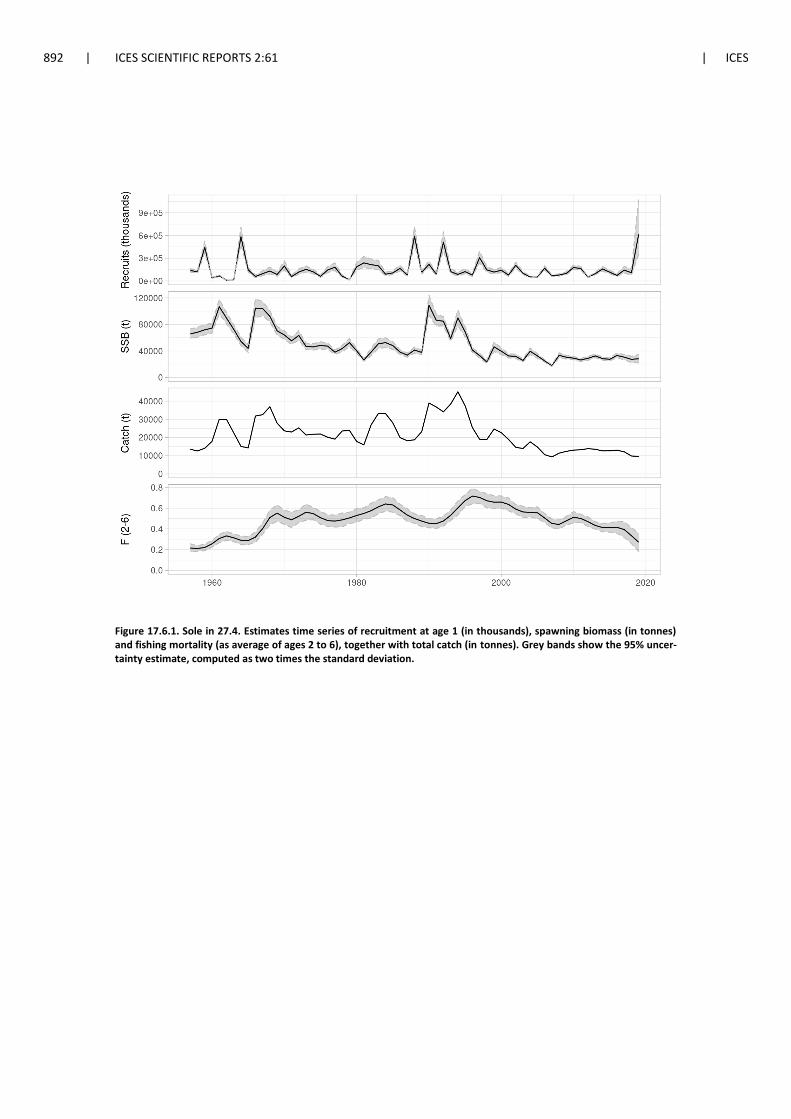
A summary of the assessment results (recruitment, F and SSB, including confidence bounds) is
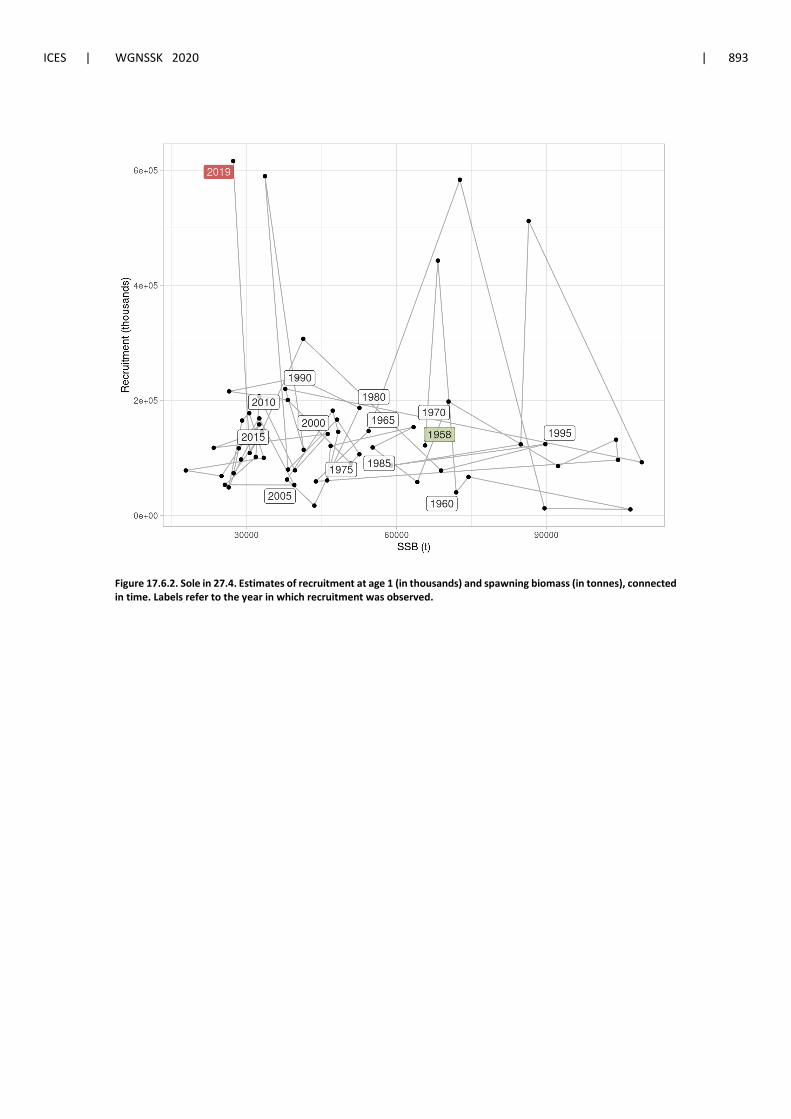
presented in Figure 17.6.1. The estimates of spawning biomass and corresponding recruitment
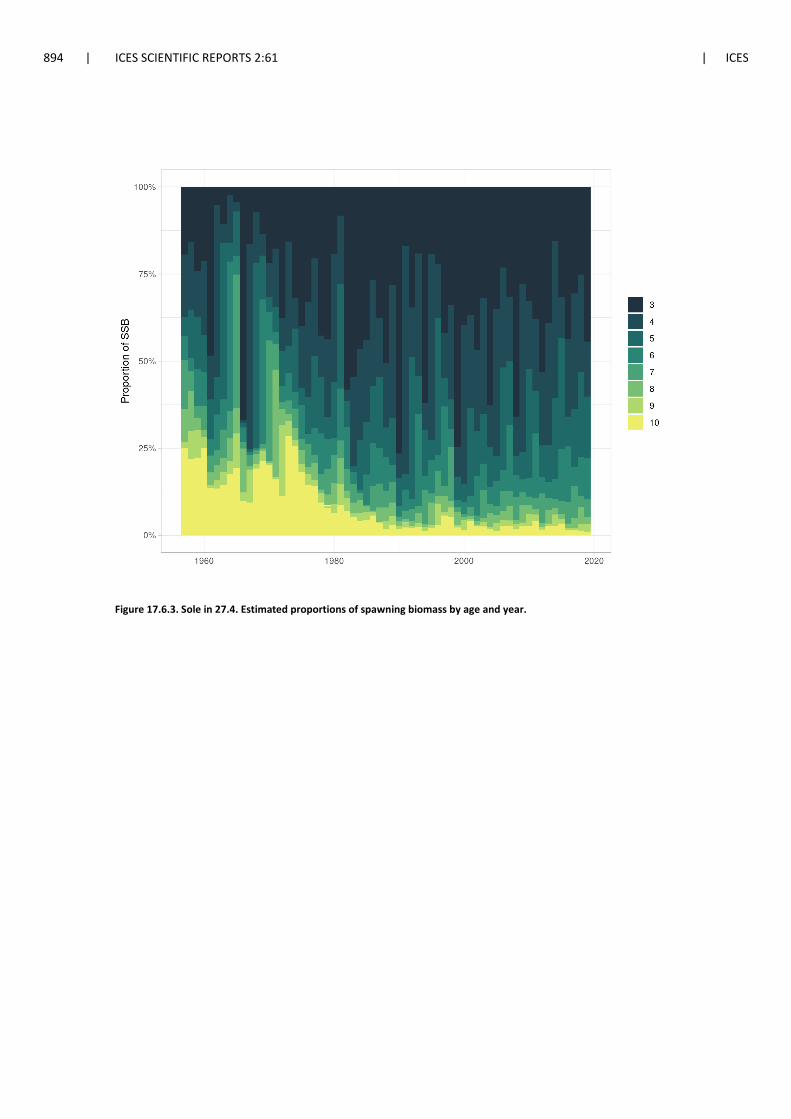
at age 1, over the whole time series, are shown in Figure 17.6.2. The proportion of spawning
biomass estimated to be accounted for by age and year is presented in Figure 17.6.3. A plot of
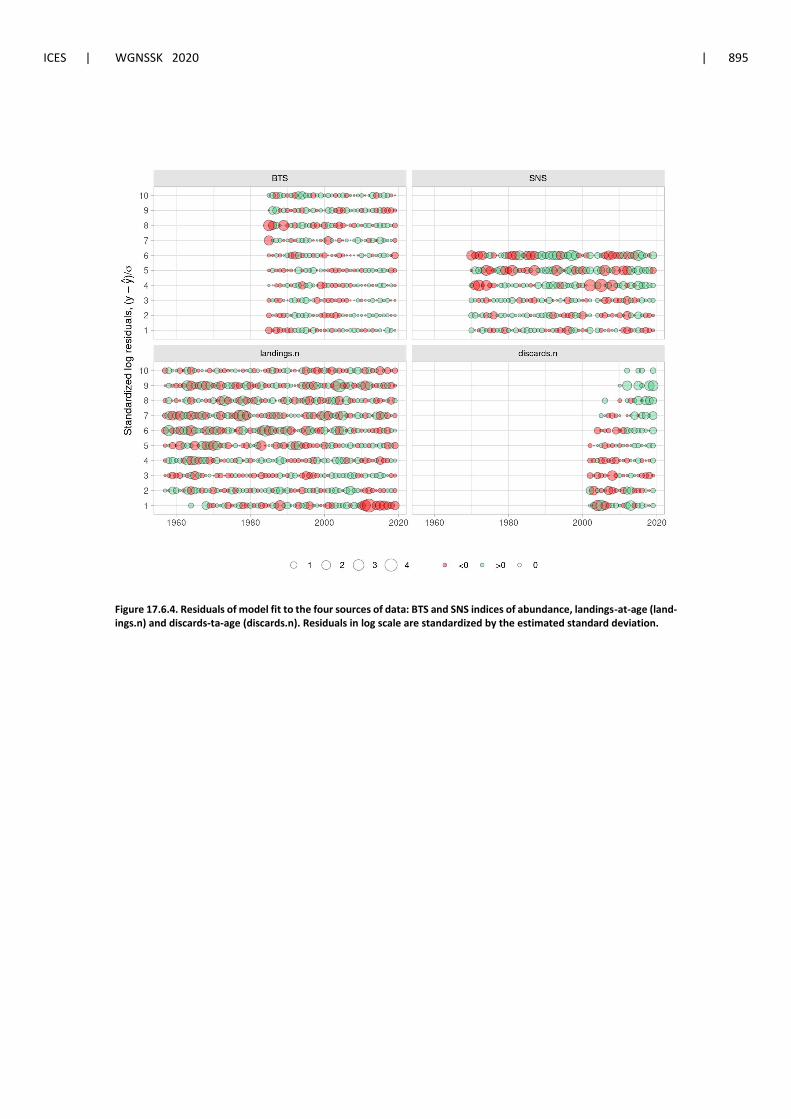
log-standardized residuals of the model fit to the four data sources employed (the two indices of
abundance, landings, and discards at age) is presented in Figure 17.6.4.
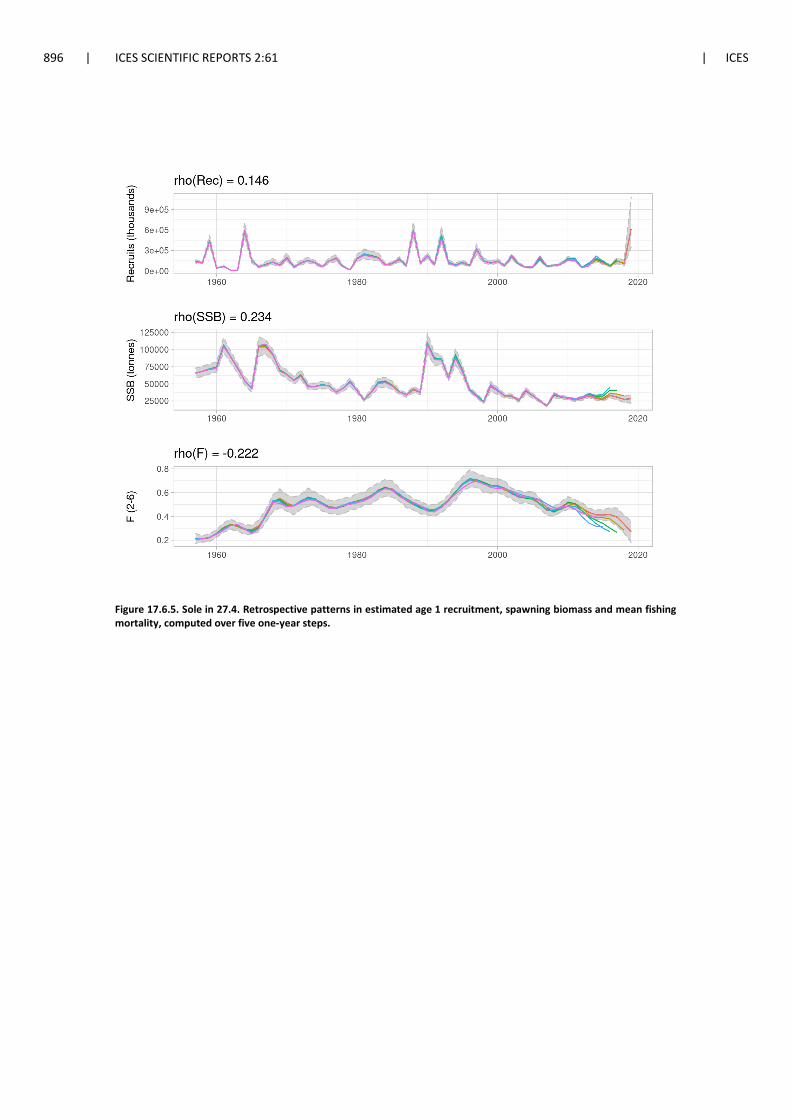
The retrospective patterns for recruitment, spawning biomass and fishing mortality are summa-
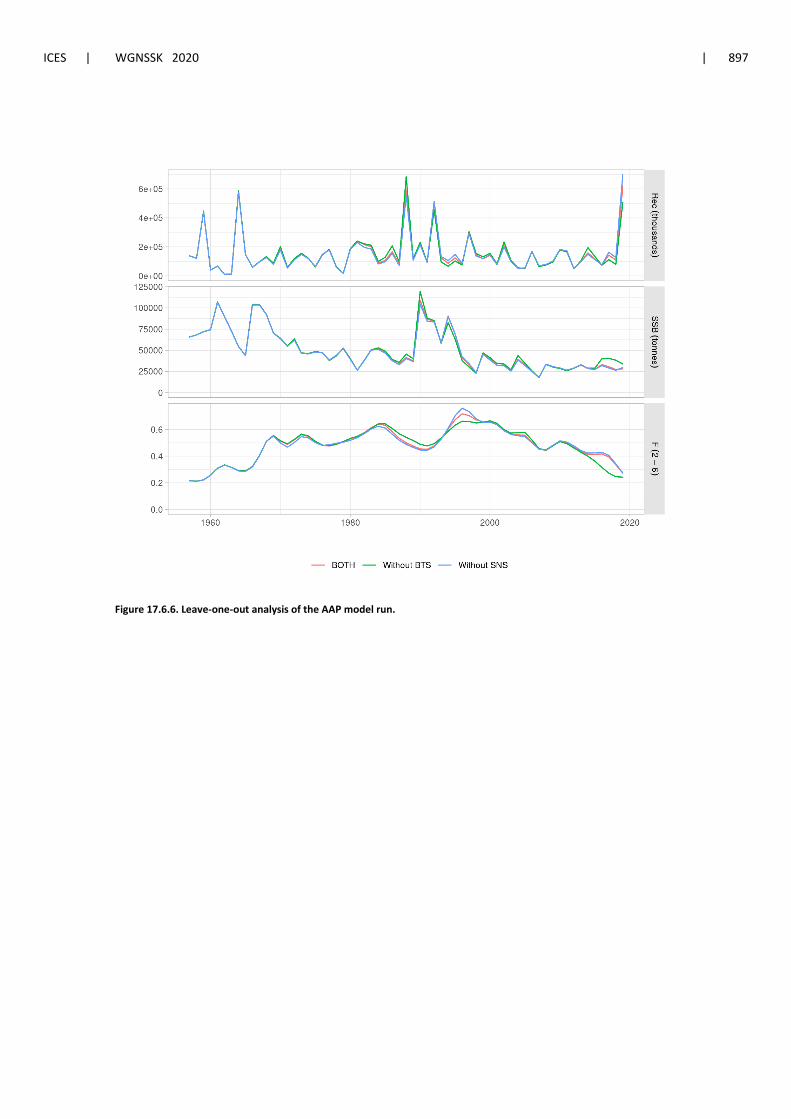
rized in Figure 17.6.5. A leave-one-out analysis of model fit over the two indices of abundance
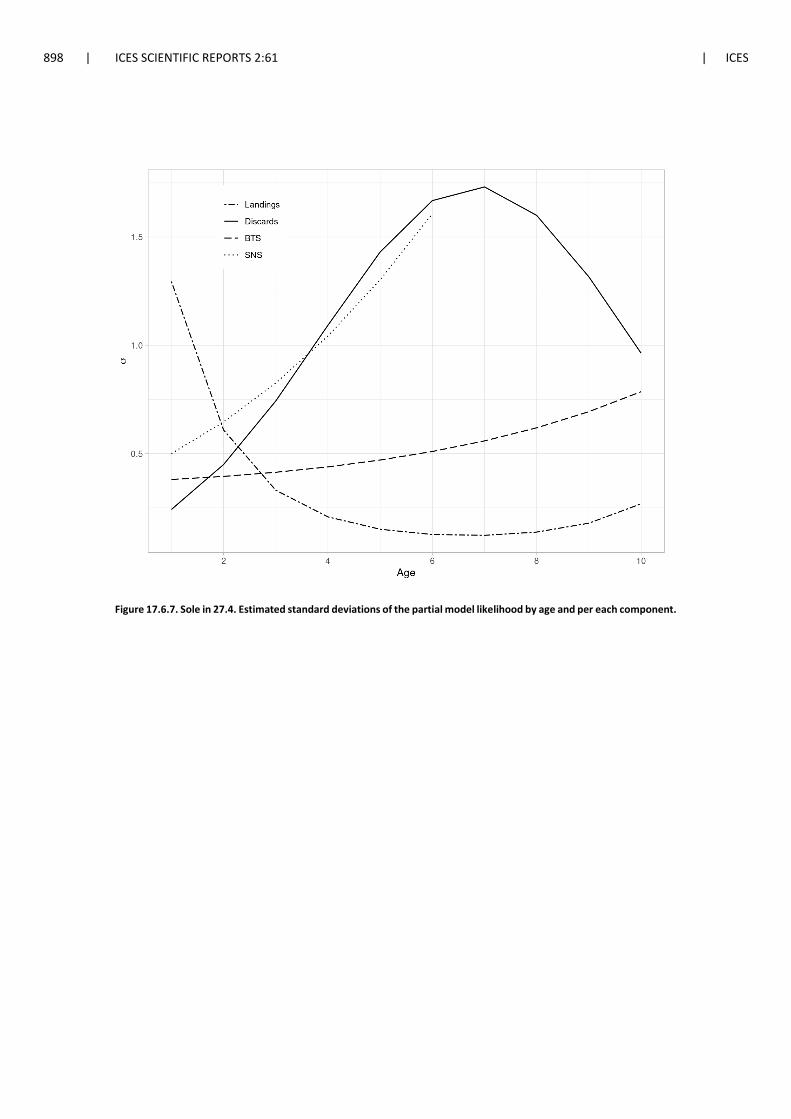
can be found in Figure 17.6.6. The estimated standard deviations of the lognormal likelihood for
each age and data source is presented in Figure 17.6.7.
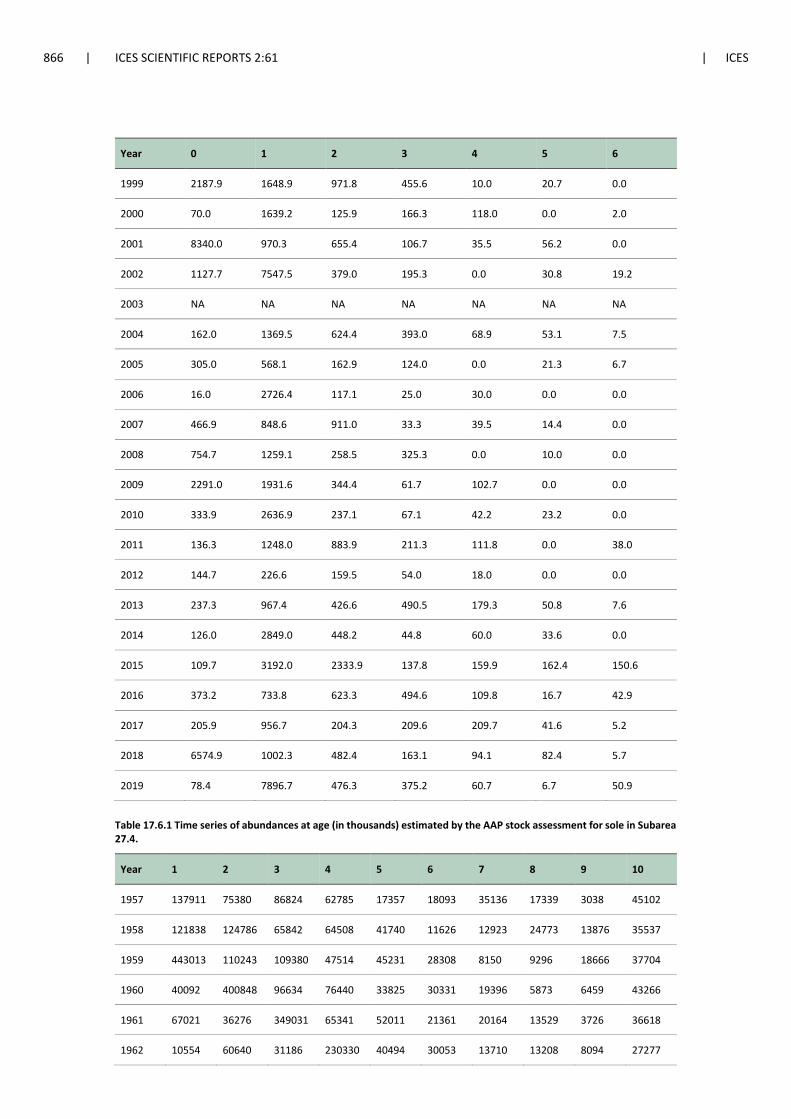
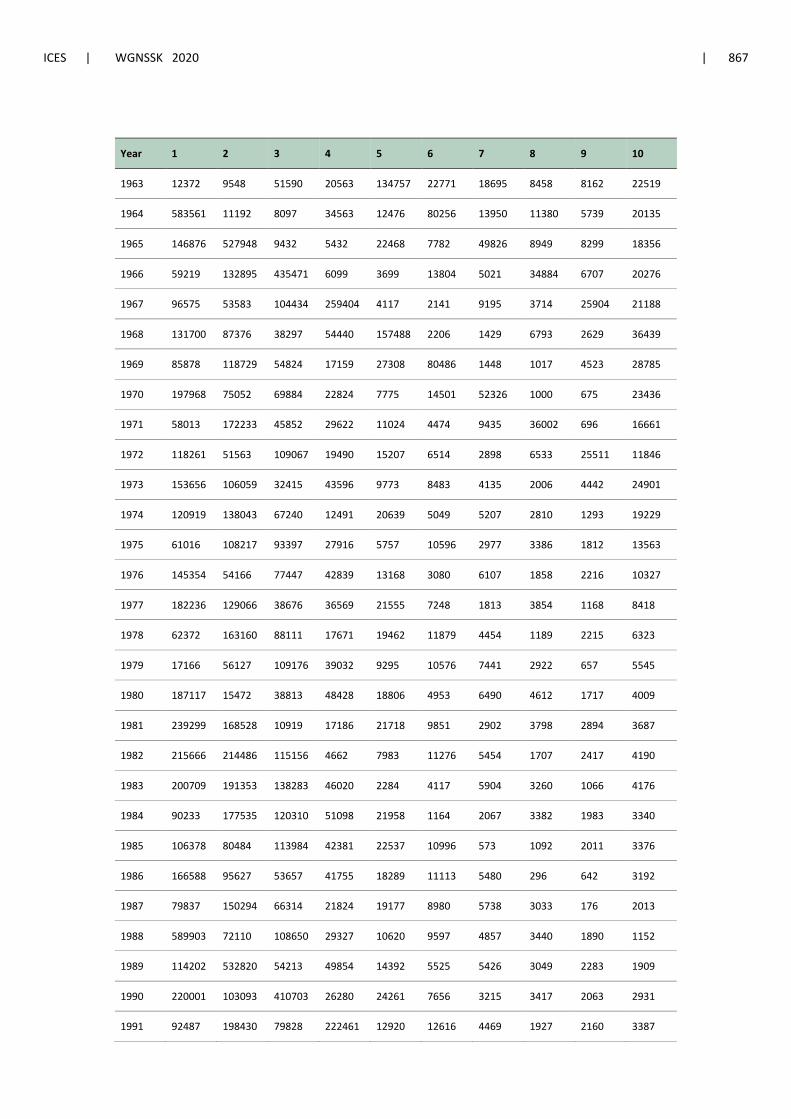
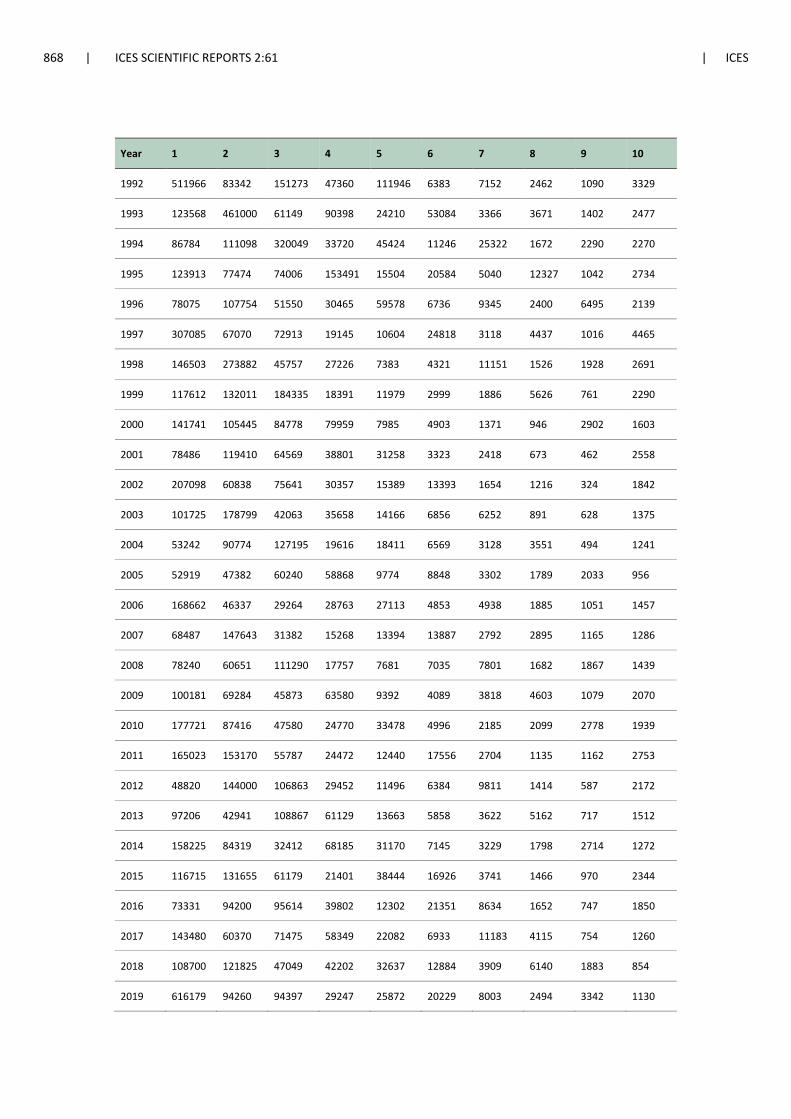
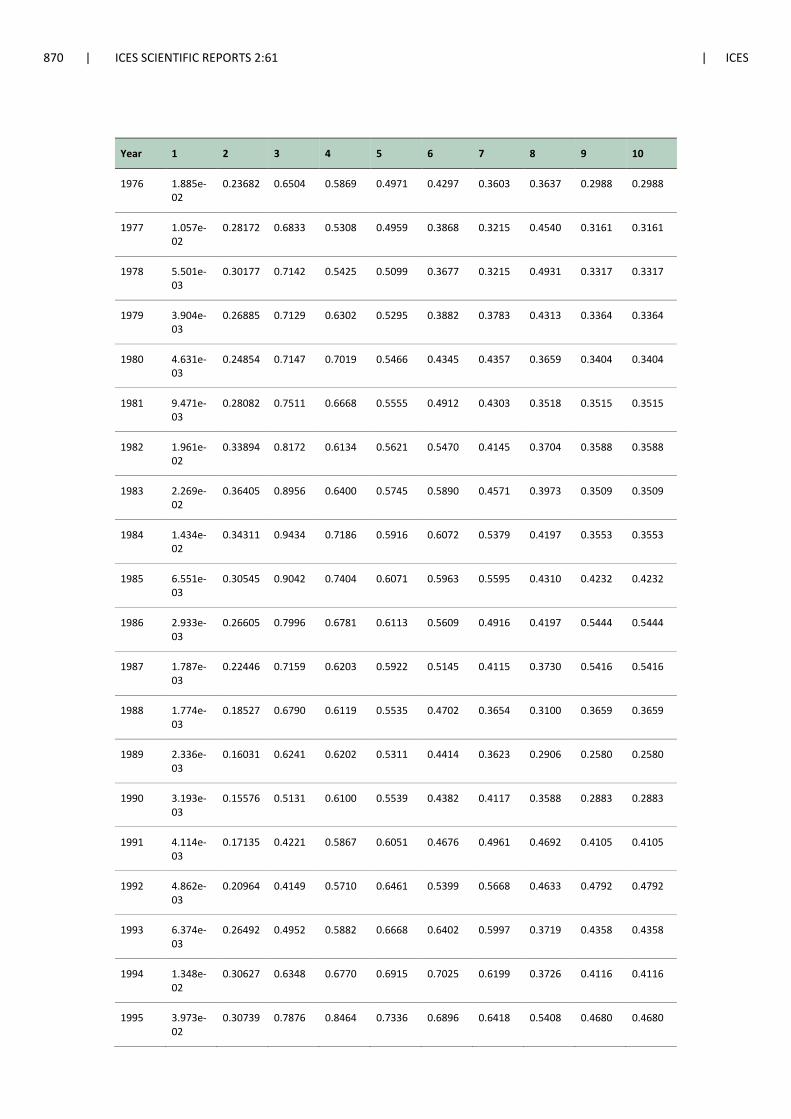
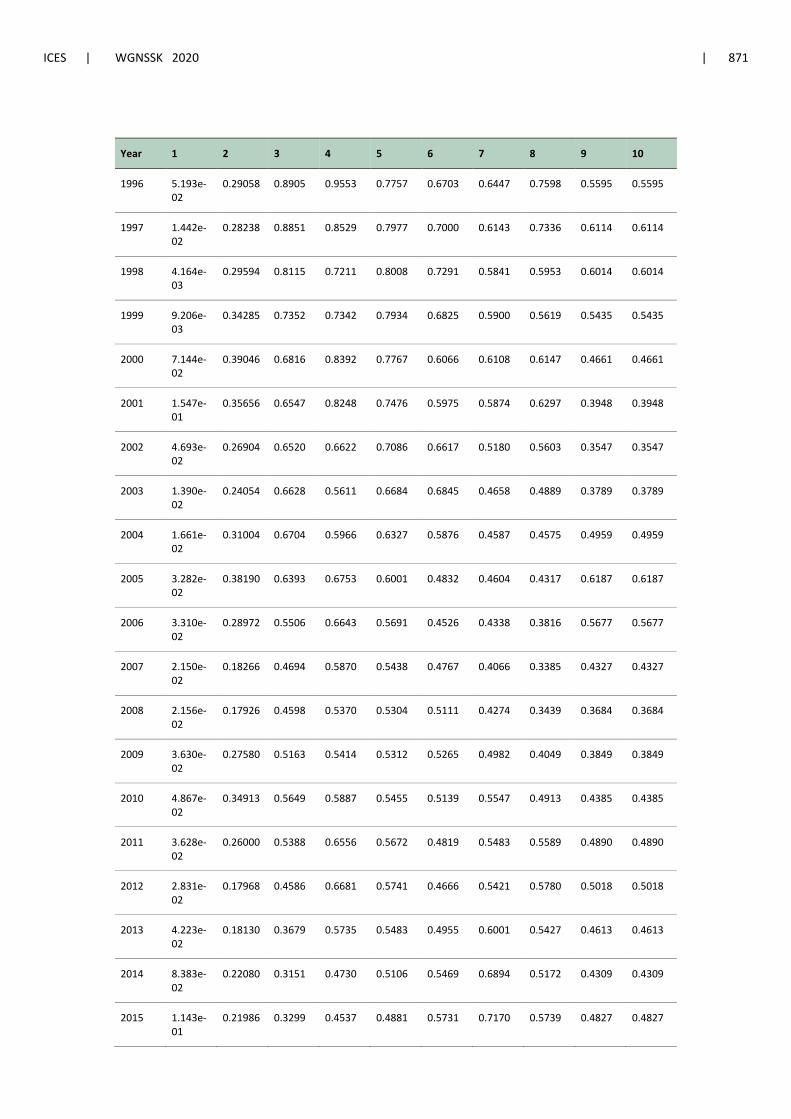
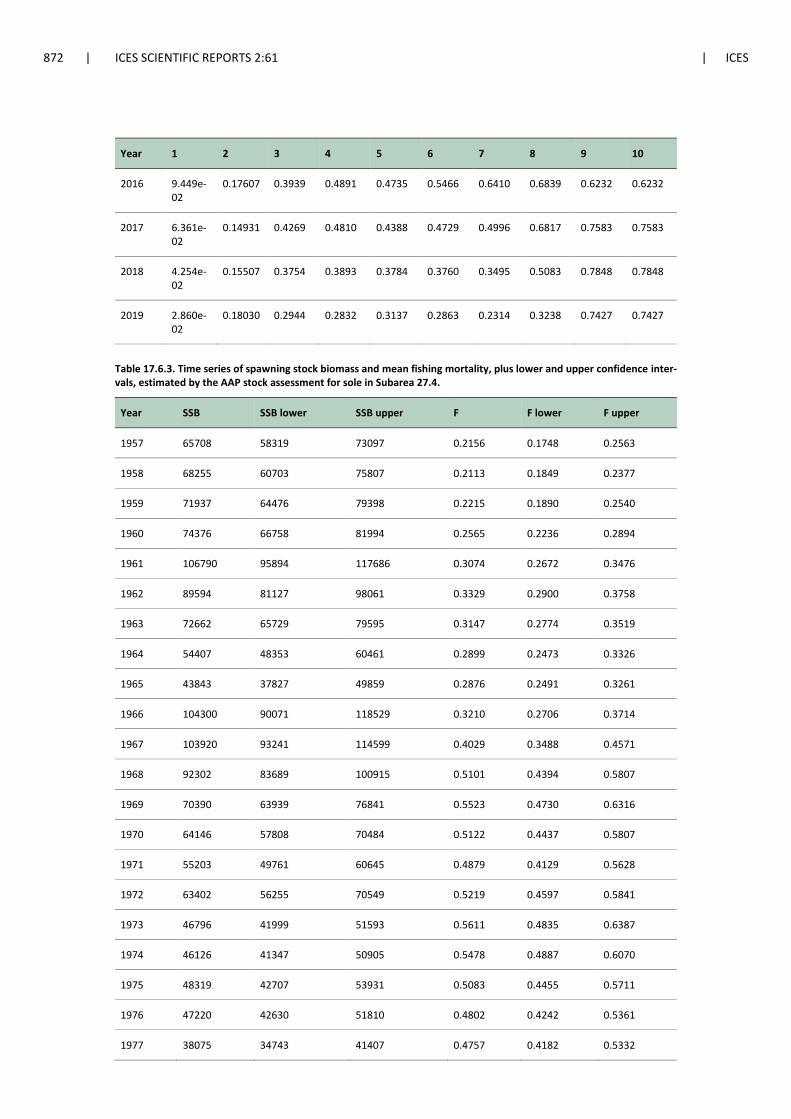
Yearly estimates of abundances and fishing mortality-at-age obtained by the model run are pre-
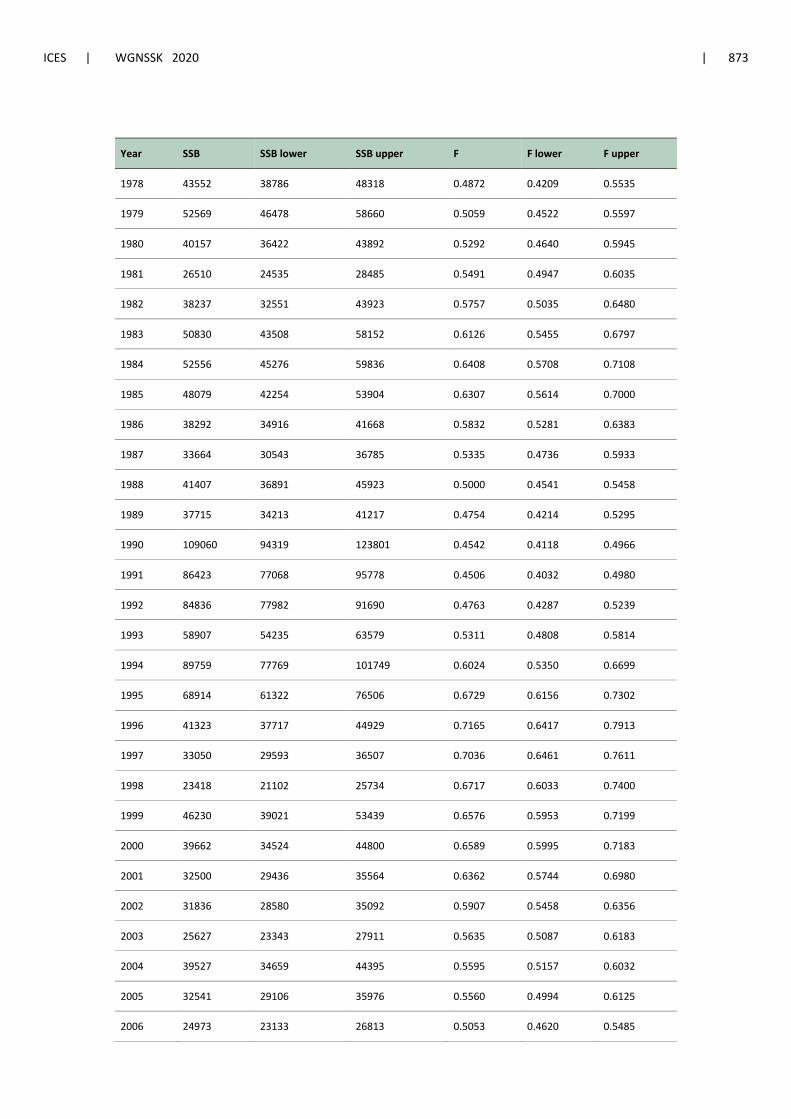
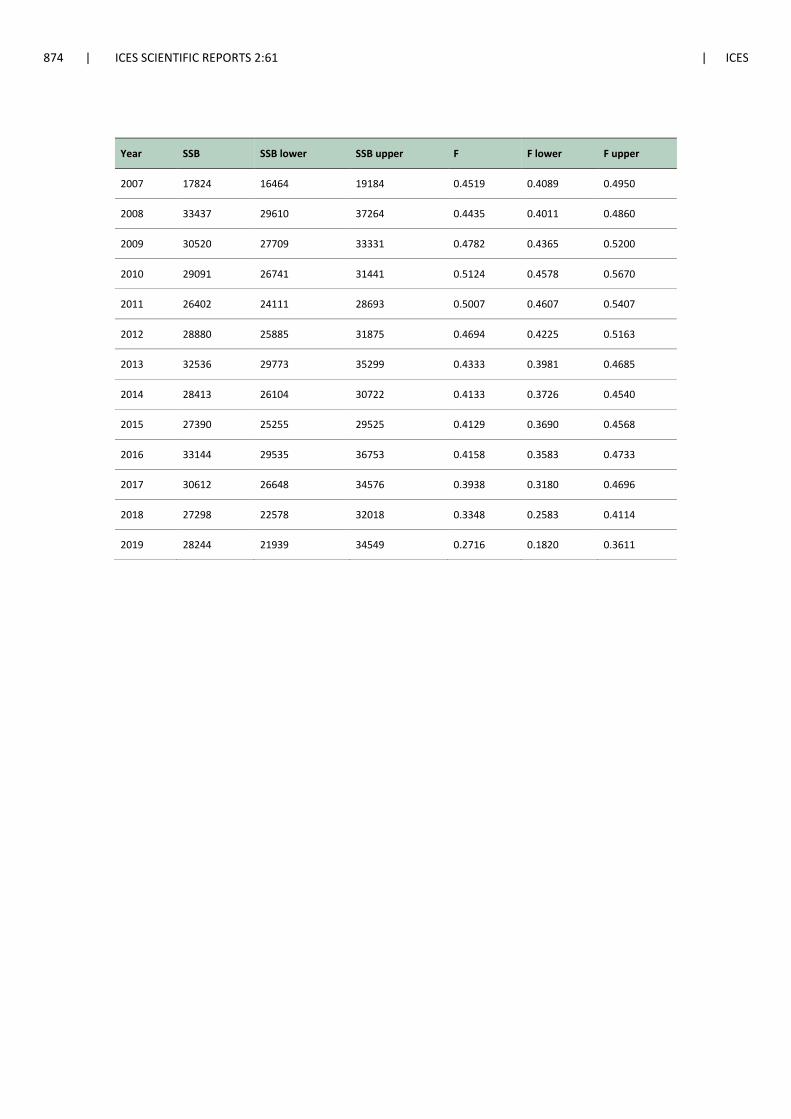
sented in Tables 17.6.1 and 17.6.2 respectively. Table 17.6.3 contains the estimates of SSB and
fishing mortality, including confidence intervals, computed as 2 times the standard deviation.
848 | ICES SCIENTIFIC REPORTS 2:61 | ICES
17.7 Recruitment estimates
The short term forecast for the stock requires an assumption about recruitment in the intermedi-
ate year, 2020. This has been set to the geometric mean of the 1957-2016 time series of recruitment
estimates, 111.481 million fish.
17.8 Short-term forecasts
Short-term forecasts were carried out from the abundances estimated by the assesment model in
2019, with the following settings
• Natural mortality, maturity and weights-at-age in landings, discards and stock for 2020-
2022 set as the average of the 2015-2019 period.
• Selectivity-at-age for 2020-2022 set as the average of the last five years (2015-2019).
• Ratio of discards to landings at age as the average over the last three years (2017-2019).
• Recruitment in 2020 and 2021 set as 111.481 million fish.
• Population numbers in the intermediate year for ages 2 and older are taken from the AAP
survivor estimates.
Fishing mortality in the intermediate year, 2020, was set as that that would result in catches equal
to the 2020 TAC, 17 545 t. Projecting the stock in 2020 under the same fishing mortality as that
estimated for 2019, 0.272, would lead to catches that are larger than the agreed TAC. Conse-
quently, fishing mortality in the intermediate year was set at 0.256.
Forecasts were carried out using the FLR toolset2 (Kell et al., 2007), and in particular the FLasher
package3 (Scott and Mosqueira, 2016). Source code for this analysis is available at the correspond-
ing TAF repository4
The projections carried out were those necessary to populate the stock catch options table, as
summarized here:
1. FMSY: Fbar (2021) = 0.207
2. FMSY lower: Fbar (2021) = 0.123
3. FMSY upper: Fbar (2021) = 0.123
4. Zero catch: Fbar (2021) = 0
5. Fpa: Fbar (2021) = 0.302
6. Flim: Fbar (2021) = 0.42
7. Bpa: SSB (2022) = 42 838
8. Flim: SSB (2022) = 30 828
9. MSY Btrigger: SSB (2022) = 42 838
10. F2020: Fbar (2021) = 0.256
2 https://flr-project.org
3 https://flr-project.org/FLasher
4 https://github.com/ices-taf/2020_sol.27.4_forecast/
ICES | WGNSSK 2020 | 849
11. Fmp: Fbar (2021) = 0.20
12. Roll-over TAC: Catch (2021) = 17 545 t
17.9 Reference points
The reference points for sole in Subarea 4 have been updated at the recent benchmark (ICES
WKFlatNSCS, 2020; Mosqueira, 2020), following the procedures of ICES WKMSYREF3 (2014).
All values are derived from a run of the accepted AAP model including data up to 2018. The
reference points in use for the stock are as follows:
Reference point
Value Technical basis
MSY Btrigger 42 838 t 𝐵𝑝𝑎
FMSY 0.207 EQsim analysis based on the recruitment period 1958-2015
Blim 30 828 t Break-point of hockey stick stock-recruit relationship, based on the recruitment period 1958-2018
Bpa 42 838 t 𝐵𝑙𝑖𝑚 ⋅ exp(1.645 ⋅ 0.2)
Flim 0.420 EQsim analysis, based on the recruitment period 1958-2018
Fpa 0.302 𝐹𝑙𝑖𝑚/exp(1.645 ⋅ 0.2)
MAP MSY Btrig-
ger 42 838 t MSY
MAP range Flower
0.123-0.207
Consistent with ranges provided by ICES (2017a), resulting in no more than 5% reduc-tion in long-term yield compared with MSY
MAP range Fup-
per 0.207-0.341
Consistent with ranges provided by ICES (2017a), resulting in no more than 5% reduc-tion in long-term yield compared with MSY
17.10 Quality of the assessment
The new stock assessment has led to a substantial revision of the estimates of spawning biomass
and fishing mortality over the last 10 years. This change appears to be driven by the use of the
GAM-standardized index of abundance. The index of abundance-at-age built around the BTS Q3
samples now extends over a larger area, with Belgium and German surveys covering the West-
ern and Eastern limits of the Southern North Sea. Initial analyses of the information contained in
the Belgium survey already pointed at the likely effect on biomass estimates the addition of those
samples could have on the stock assessment (ICES WGNNSK, 2019).
Retrospective patterns have been exacerbated with the addition of the 2019 catch and survey
data. Nothing in the 2019 data can be obviously linked to this relative deterioration in the model
consistency. Further work will have to be carried out to try to understand the causes and, if
possible, improve the model retrospective pattern. The use of a GAM-standardized index could
introduce greater variation in future model estimates, as abundances at age can be expected to
change in past years with the addition of new survey data.
850 | ICES SCIENTIFIC REPORTS 2:61 | ICES
17.11 Status of the stock
The status of the stock inferred from the 2020 stock assessment is more pessimistic than previ-
ously. Biomass appears to have been oscillating around the Blim level since the early 2000s, alt-
hough fishing mortality has markedly been reduced over the same period. The stronger year
classes in the last two decades were not particularly large, especially when compared with past
recruitment events.
The estimated spawning biomass in 2019, 28 244 t, is lower than B lim, although it is expected to
have moved already above that limit at the start of 2020, up to 34 569 t, given the 2019 catch
levels.
Recruitment in 2019 is currently estimated to be the largest in the time series, 616 million fish,
and despite the uncertainty in model estimates in the final year, all surveys seem to agree on the
2018 year class, which is assumed to enter the spawning stock in 2021, being particularly strong.
17.12 Management considerations
The expected increase in stock biomass as a consequence of the 2018 year-class is leading to the
corresponding increase in TAC that are now much higher than the recent catches. TAC for 2020,
17 545 t, set during the autumn update and already accounting for the 2019 recruitment effect on
the 2021 SSB, is substantially higher than the 2019 estimated catches, 10 607 t. The TAC proposal
for 2021 that would bring the stock to FMSY levels in 2022, 21 361 t, expects catches to be even
higher.
17.13 Issues for future benchmarks
The stock has gone through a benchmark process in 2020 (ICES WKFLATNSCS, 2020) that con-
centrated on the two main items on the ICES WGNSSK (2019) issue list: for the BTS Q3 index of
abundance to include samples from multiple surveys, and improvements on the residual pat-
terns of the model fit.
Limitations on time did now allow any work on the effect and suitability of the current assump-
tions on natural mortality and maturity at age to be carried out for this year’s benchmark. A
general revision of the biological assumptions and processes in this stock would be a useful con-
tribution to a future benchmark.
17.14 References
ICES WGELECTRA. 2018. Report of the Working Group on Electric Trawling (WGELECTRA). ICES Report
WGELECTRA 2018 17 - 19 April 2018. IJmuiden, the Netherlands. 155pp.
ICES WKFLATNSCS. 2020. Benchmark Workshop for Flatfish stocks in the North Sea and Celtic Sea
(WKFlatNSCS). ICES Scientific Reports. 2:23. 966 pp. http://doi.org/10.17895/ices.pub.5976
ICES WKMSYREF3. 2014. Report of the Joint ICES-MYFISH Workshop to consider the basis for FMSY
ranges for all stocks (WKMSYREF3), 17–21 November 2014, Charlottenlund, Denmark. ICES CM
2014/ACOM:64. 147 pp.
Kell, L. T., Mosqueira, I., Grosjean, P., Fromentin, J-M., Garcia, D., Hillary, R., Jardim, E., Mardle, S., Pas-
toors, M. A., Poos, J. J., Scott, F., and Scott, R. D. 2007. FLR: an open-source framework for the evalua-
tion and development of management strategies. – ICES Journal of Marine Science, 64: 640–646.
https://doi.org/10.1093/icesjms/fsm012
ICES | WGNSSK 2020 | 851
Mosqueira, I. 2020. Calculation of reference points for North Sea sole (sol.27.4) based on the updated AAP
stock assessment. Working Document. ICES Benchmark Workshop for Flatfish stocks in the North Sea
and Celtic Sea (WKFlatNSCS).
Scott, F, Mosqueira, I. 2016. Bioeconomic Modelling for Fisheries. EUR-Scientific and Technical Research
Reports. Publications Office of the European Union. doi:(10.2788/722156)[http://publications.jrc.ec.eu-
ropa.eu/repository/handle/JRC104842].
852 | ICES SCIENTIFIC REPORTS 2:61 | ICES
Table 17.2.1. Time-series of the official landings by country and overall total, the official BMS landings, the landings re-ported to ICES and the total TAC (figures rounded to the nearest tonne).
Year BE DK FR DE NL UK Other Official BMS ICES TAC
1982 1900 524 686 266 17686 403 2 21467 NA 21579 21000
1983 1740 730 332 619 16101 435 0 19957 NA 24927 20000
1984 1771 818 400 1034 14330 586 1 18940 NA 26839 20000
1985 2390 692 875 303 14897 774 3 19934 NA 24248 22000
1986 1833 443 296 155 9558 647 2 12934 NA 18201 20000
1987 1644 342 318 210 10635 676 4 13829 NA 17368 14000
1988 1199 616 487 452 9841 740 28 13363 NA 21590 14000
1989 1596 1020 312 864 9620 1033 50 14495 NA 21805 14000
1990 2389 1427 352 2296 18202 1614 263 26543 NA 35120 25000
1991 2977 1307 465 2107 18758 1723 271 27608 NA 33513 27000
1992 2058 1359 548 1880 18601 1281 277 26004 NA 29341 25000
1993 2783 1661 490 1379 22015 1149 298 29775 NA 31491 32000
1994 2935 1804 499 1744 22874 1137 298 31291 NA 33002 32000
1995 2624 1673 640 1564 20927 1040 312 28780 NA 30467 28000
1996 2555 1018 535 670 15344 848 229 21199 NA 22651 23000
1997 1519 689 99 510 10241 479 204 13741 NA 14901 18000
1998 1844 520 510 782 15198 549 339 19742 NA 20868 19100
1999 1919 828 NA 1458 16283 645 501 21634 NA 23475 22000
2000 1806 1069 362 1280 15273 600 539 20929 NA 22641 22000
2001 1874 772 411 958 13345 597 394 18351 NA 19944 19000
2002 1437 644 266 759 12120 451 292 15969 NA 16945 16000
2003 1605 703 728 749 12469 521 363 17138 NA 17920 15900
2004 1477 808 655 949 12860 535 544 17828 NA 18757 17000
2005 1374 831 676 756 10917 667 357 15579 NA 16355 18600
2006 980 585 648 475 8299 910 0 11933 NA 12594 17700
2007 955 413 401 458 10365 1203 5 13800 NA 14635 15000
2008 1379 507 714 513 9456 851 15 13435 NA 14071 12800
2009 1353 476 NA 555 12038 951 1 14898 NA 13952 14000
ICES | WGNSSK 2020 | 853
Year BE DK FR DE NL UK Other Official BMS ICES TAC
2010 1268 406 621 537 8770 526 1 12129 NA 12603 14100
2011 857 346 539 327 8133 786 2 10990 NA 11485 14100
2012 593 418 633 416 9089 599 3 11752 NA 11602 16200
2013 697 497 680 561 9987 867 0 13291 NA 13137 14000
2014 920 314 675 642 9569 840 0 12547 NA 13060 11900
2015 933 271 532 765 8899 804 0 12203 NA 12867 11900
2016 767 355 362 861 9600 705 0 12651 NA 14127 13262
2017 556 432 393 731 9155 513 0 11781 30 12370 16123
2018 408 368 432 717 8412 431 2 10771 57 11199 15694
2019 259 116 110 616 7212 334 1 8339 48 8658 12555
2020 NA NA NA NA NA NA NA NA NA NA 17545
Table 17.2.2. Time-series of landings at age (in thousands) of sole in Subarea 27.4.
Year 1 2 3 4 5 6 7 8 9 10
1957 0 1472 10556 13150 3913 3041 6780 1803.0 529 6541
1958 0 1863 8482 14240 9547 3501 3023 4461.0 2264 6590
1959 0 3694 12139 10499 9060 5823 1217 2044.0 2598 5668
1960 0 11965 14043 16691 9248 8313 4815 1583.0 1049 7851
1961 0 972 50470 19403 12574 4760 3998 4338.0 847 7355
1962 0 1584 6173 58836 15254 10478 4797 4087.0 2074 7450
1963 0 670 8271 8485 45823 8420 6603 2403.0 3365 8316
1964 53 150 2041 5518 3680 16749 3020 1749.0 790 2913
1965 0 45180 1045 1534 4798 2381 11990 1494.0 1463 3077
1966 0 12145 132170 979 1168 3649 736 6255.0 694 2424
1967 0 3769 26260 87039 1998 548 1962 777.0 5160 2978
1968 1034 17093 13852 24894 48417 461 244 1639.0 323 6502
1969 404 24404 21884 5433 12638 25646 338 249.0 1214 5379
1970 1299 6141 25996 8236 1784 3231 11961 246.0 140 5234
1971 425 33765 14596 12909 4538 1459 2355 7300.0 194 4649
1972 354 7511 36356 6997 4911 1548 517 1218.0 4654 2772
854 | ICES SCIENTIFIC REPORTS 2:61 | ICES
Year 1 2 3 4 5 6 7 8 9 10
1973 716 12459 13025 16493 4101 2368 1013 779.0 1241 5899
1974 100 15171 21248 5412 6965 1896 1563 649.0 396 4750
1975 267 23193 28833 11839 2110 3870 798 916.0 513 3481
1976 1064 3619 28571 14316 4923 987 1950 562.0 434 2721
1977 1780 22747 12299 15593 7580 1812 325 1133.0 261 2155
1978 27 24921 29163 6102 6610 4231 1730 608.0 643 1595
1979 9 8280 41681 16259 3033 3262 1769 826.0 244 1546
1980 650 1233 12762 18138 7444 1479 2241 1437.0 374 1227
1981 434 29983 3344 7046 8439 3757 973 909.0 786 932
1982 2697 26799 46375 1868 3584 4855 1701 623.0 613 1295
1983 391 34545 41551 21273 626 1383 1958 982.0 388 1181
1984 192 30839 44081 22631 8821 744 857 1047.0 526 897
1985 163 16449 42773 20079 9307 3520 207 375.0 631 965
1986 372 9304 18381 17591 7698 5480 2256 109.0 281 1671
1987 93 28896 21927 8851 6477 3102 1559 898.0 81 690
1988 10 13206 47135 15217 4377 3878 1549 890.0 523 317
1989 115 45652 17973 22295 4551 1627 1414 637.0 451 459
1990 854 11816 103380 9667 9099 3315 1032 1186.0 548 837
1991 118 12938 24985 76580 6609 3612 1706 707.0 718 1072
1992 965 6730 43713 15961 37745 2440 2995 730.0 393 1163
1993 53 49870 16575 31047 13709 23758 1472 1170.0 456 833
1994 709 7710 86349 13387 18513 5642 11174 458.0 905 897
1995 4766 12674 16700 68073 6262 7254 1981 5971 293 665
1996 170 18609 16005 16770 26946 3814 4725 932 3267 976
1997 1574 5987 23418 7253 5058 12667 1189 2303 330 1672
1998 242 56162 15011 14806 3466 1924 4727 787 1022 838
1999 284 15601 71730 8103 6049 1200 657 1964 328 804
2000 2329 14929 32425 42394 3257 2453 796 431 922 708
2001 857 25045 20925 19260 16211 1383 808 266 163 701
ICES | WGNSSK 2020 | 855
Year 1 2 3 4 5 6 7 8 9 10
2002 1046 10958 32570 12185 8145 6393 667 592 88 362
2003 1047 32295 17479 16072 5814 3902 2427 400 128 451
2004 516 14960 48003 9531 7462 2167 902 962 389 389
2005 1131 7254 22633 28875 4168 3861 1491 602 768 392
2006 7008 9966 10397 9606 10943 1617 1577 724 373 553
2007 315 39643 10820 6407 5706 5479 819 725 498 541
2008 1959 6325 37427 5996 2928 2393 2613 448 491 459
2009 1630 10417 10771 26548 3278 1652 1591 1532 312 864
2010 371 11659 13354 8530 13623 1817 907 809 1196 690
2011 44 11992 19788 8379 5070 6436 983 431 283 765
2012 1 6439 28605 11069 4285 2146 4072 587 286 1028
2013 0 2741 28189 21500 5643 2042 1532 2246 242 471
2014 371 8111 6916 22942 11440 2591 1808 620 840 459
2015 201 10512 16589 4738 14756 6157 1470 562 393 545
2016 119 6151 24249 11489 4475 8994 4495 774 278 854
2017 416 4928 17641 16818 5909 2118 3745 2005 443 498
2018 331 11141 9184 11994 10095 3918 1096 1942 804 436
2019 488 6238 15757 6237 5383 4784 1485 696 1623 473
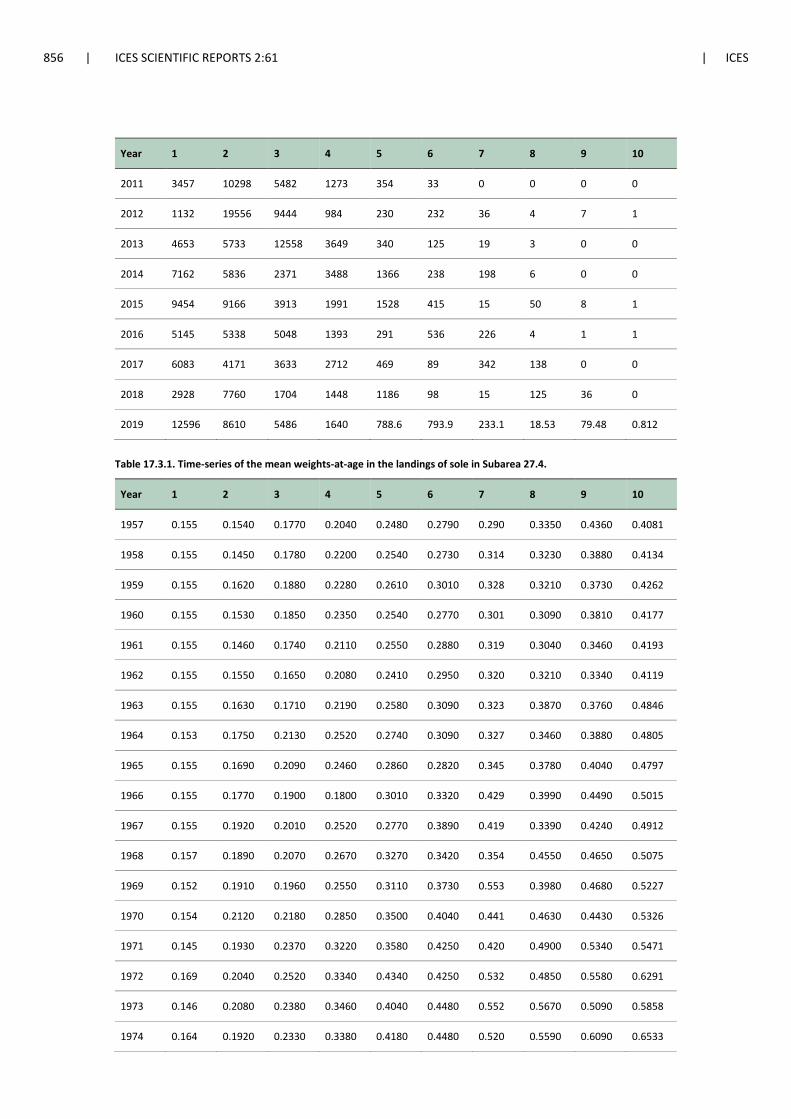
Table 17.2.3. Time-series of discards at age (in thousands) of sole in Subarea 27.4
Year 1 2 3 4 5 6 7 8 9 10
2002 6461 12606 5212 1029 272 0 0 0 0 0
2003 1156 7152 5059 1212 381 0 0 0 0 0
2004 293 12832 7449 1719 518 12 0 0 0 0
2005 2256 5622 4796 1258 375 63 22 0 0 0
2006 2390 5727 2705 654 197 28 18 7 0 0
2007 818 4923 3010 619 226 57 4 0 0 0
2008 1230 2704 1764 371 106 0 8 0 0 0
2009 2695 6480 3652 999 266 5 9 0 0 0
2010 5687 12164 6670 1544 493 31 10 2 2 0
856 | ICES SCIENTIFIC REPORTS 2:61 | ICES
Year 1 2 3 4 5 6 7 8 9 10
2011 3457 10298 5482 1273 354 33 0 0 0 0
2012 1132 19556 9444 984 230 232 36 4 7 1
2013 4653 5733 12558 3649 340 125 19 3 0 0
2014 7162 5836 2371 3488 1366 238 198 6 0 0
2015 9454 9166 3913 1991 1528 415 15 50 8 1
2016 5145 5338 5048 1393 291 536 226 4 1 1
2017 6083 4171 3633 2712 469 89 342 138 0 0
2018 2928 7760 1704 1448 1186 98 15 125 36 0
2019 12596 8610 5486 1640 788.6 793.9 233.1 18.53 79.48 0.812
Table 17.3.1. Time-series of the mean weights-at-age in the landings of sole in Subarea 27.4.
Year 1 2 3 4 5 6 7 8 9 10
1957 0.155 0.1540 0.1770 0.2040 0.2480 0.2790 0.290 0.3350 0.4360 0.4081
1958 0.155 0.1450 0.1780 0.2200 0.2540 0.2730 0.314 0.3230 0.3880 0.4134
1959 0.155 0.1620 0.1880 0.2280 0.2610 0.3010 0.328 0.3210 0.3730 0.4262
1960 0.155 0.1530 0.1850 0.2350 0.2540 0.2770 0.301 0.3090 0.3810 0.4177
1961 0.155 0.1460 0.1740 0.2110 0.2550 0.2880 0.319 0.3040 0.3460 0.4193
1962 0.155 0.1550 0.1650 0.2080 0.2410 0.2950 0.320 0.3210 0.3340 0.4119
1963 0.155 0.1630 0.1710 0.2190 0.2580 0.3090 0.323 0.3870 0.3760 0.4846
1964 0.153 0.1750 0.2130 0.2520 0.2740 0.3090 0.327 0.3460 0.3880 0.4805
1965 0.155 0.1690 0.2090 0.2460 0.2860 0.2820 0.345 0.3780 0.4040 0.4797
1966 0.155 0.1770 0.1900 0.1800 0.3010 0.3320 0.429 0.3990 0.4490 0.5015
1967 0.155 0.1920 0.2010 0.2520 0.2770 0.3890 0.419 0.3390 0.4240 0.4912
1968 0.157 0.1890 0.2070 0.2670 0.3270 0.3420 0.354 0.4550 0.4650 0.5075
1969 0.152 0.1910 0.1960 0.2550 0.3110 0.3730 0.553 0.3980 0.4680 0.5227
1970 0.154 0.2120 0.2180 0.2850 0.3500 0.4040 0.441 0.4630 0.4430 0.5326
1971 0.145 0.1930 0.2370 0.3220 0.3580 0.4250 0.420 0.4900 0.5340 0.5471
1972 0.169 0.2040 0.2520 0.3340 0.4340 0.4250 0.532 0.4850 0.5580 0.6291
1973 0.146 0.2080 0.2380 0.3460 0.4040 0.4480 0.552 0.5670 0.5090 0.5858
1974 0.164 0.1920 0.2330 0.3380 0.4180 0.4480 0.520 0.5590 0.6090 0.6533
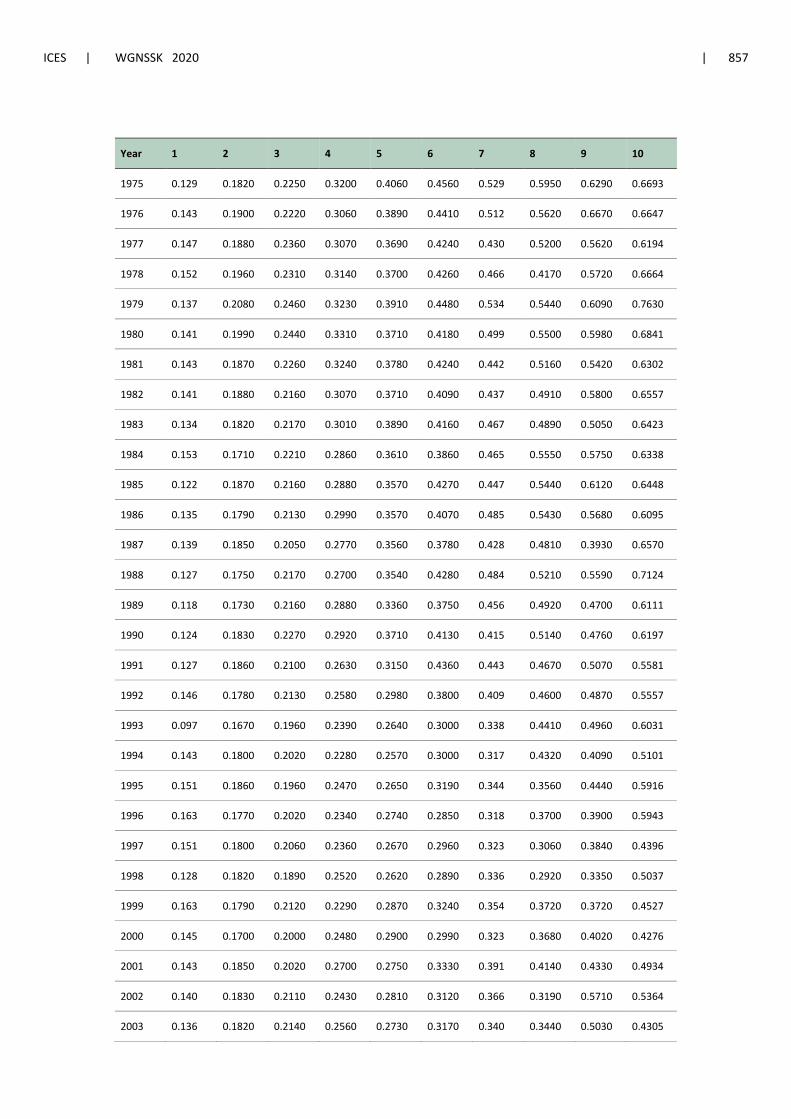
ICES | WGNSSK 2020 | 857
Year 1 2 3 4 5 6 7 8 9 10
1975 0.129 0.1820 0.2250 0.3200 0.4060 0.4560 0.529 0.5950 0.6290 0.6693
1976 0.143 0.1900 0.2220 0.3060 0.3890 0.4410 0.512 0.5620 0.6670 0.6647
1977 0.147 0.1880 0.2360 0.3070 0.3690 0.4240 0.430 0.5200 0.5620 0.6194
1978 0.152 0.1960 0.2310 0.3140 0.3700 0.4260 0.466 0.4170 0.5720 0.6664
1979 0.137 0.2080 0.2460 0.3230 0.3910 0.4480 0.534 0.5440 0.6090 0.7630
1980 0.141 0.1990 0.2440 0.3310 0.3710 0.4180 0.499 0.5500 0.5980 0.6841
1981 0.143 0.1870 0.2260 0.3240 0.3780 0.4240 0.442 0.5160 0.5420 0.6302
1982 0.141 0.1880 0.2160 0.3070 0.3710 0.4090 0.437 0.4910 0.5800 0.6557
1983 0.134 0.1820 0.2170 0.3010 0.3890 0.4160 0.467 0.4890 0.5050 0.6423
1984 0.153 0.1710 0.2210 0.2860 0.3610 0.3860 0.465 0.5550 0.5750 0.6338
1985 0.122 0.1870 0.2160 0.2880 0.3570 0.4270 0.447 0.5440 0.6120 0.6448
1986 0.135 0.1790 0.2130 0.2990 0.3570 0.4070 0.485 0.5430 0.5680 0.6095
1987 0.139 0.1850 0.2050 0.2770 0.3560 0.3780 0.428 0.4810 0.3930 0.6570
1988 0.127 0.1750 0.2170 0.2700 0.3540 0.4280 0.484 0.5210 0.5590 0.7124
1989 0.118 0.1730 0.2160 0.2880 0.3360 0.3750 0.456 0.4920 0.4700 0.6111
1990 0.124 0.1830 0.2270 0.2920 0.3710 0.4130 0.415 0.5140 0.4760 0.6197
1991 0.127 0.1860 0.2100 0.2630 0.3150 0.4360 0.443 0.4670 0.5070 0.5581
1992 0.146 0.1780 0.2130 0.2580 0.2980 0.3800 0.409 0.4600 0.4870 0.5557
1993 0.097 0.1670 0.1960 0.2390 0.2640 0.3000 0.338 0.4410 0.4960 0.6031
1994 0.143 0.1800 0.2020 0.2280 0.2570 0.3000 0.317 0.4320 0.4090 0.5101
1995 0.151 0.1860 0.1960 0.2470 0.2650 0.3190 0.344 0.3560 0.4440 0.5916
1996 0.163 0.1770 0.2020 0.2340 0.2740 0.2850 0.318 0.3700 0.3900 0.5943
1997 0.151 0.1800 0.2060 0.2360 0.2670 0.2960 0.323 0.3060 0.3840 0.4396
1998 0.128 0.1820 0.1890 0.2520 0.2620 0.2890 0.336 0.2920 0.3350 0.5037
1999 0.163 0.1790 0.2120 0.2290 0.2870 0.3240 0.354 0.3720 0.3720 0.4527
2000 0.145 0.1700 0.2000 0.2480 0.2900 0.2990 0.323 0.3680 0.4020 0.4276
2001 0.143 0.1850 0.2020 0.2700 0.2750 0.3330 0.391 0.4140 0.4330 0.4934
2002 0.140 0.1830 0.2110 0.2430 0.2810 0.3120 0.366 0.3190 0.5710 0.5364
2003 0.136 0.1820 0.2140 0.2560 0.2730 0.3170 0.340 0.3440 0.5030 0.4305
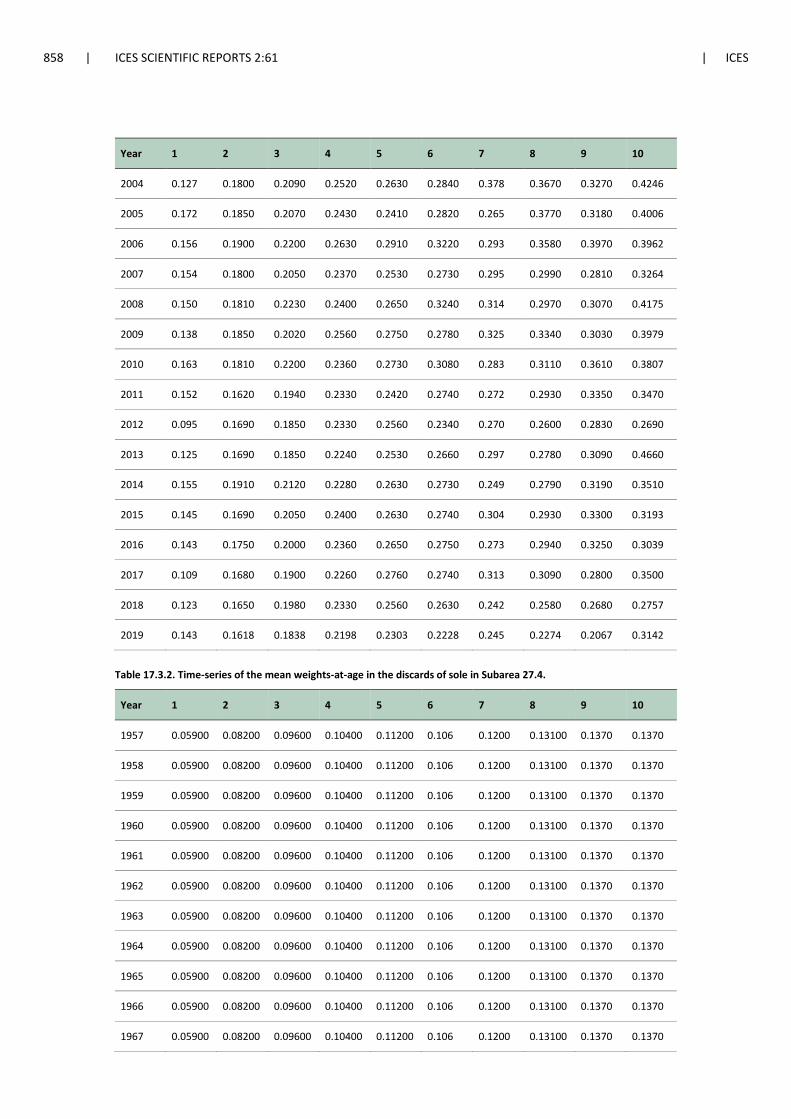
858 | ICES SCIENTIFIC REPORTS 2:61 | ICES
Year 1 2 3 4 5 6 7 8 9 10
2004 0.127 0.1800 0.2090 0.2520 0.2630 0.2840 0.378 0.3670 0.3270 0.4246
2005 0.172 0.1850 0.2070 0.2430 0.2410 0.2820 0.265 0.3770 0.3180 0.4006
2006 0.156 0.1900 0.2200 0.2630 0.2910 0.3220 0.293 0.3580 0.3970 0.3962
2007 0.154 0.1800 0.2050 0.2370 0.2530 0.2730 0.295 0.2990 0.2810 0.3264
2008 0.150 0.1810 0.2230 0.2400 0.2650 0.3240 0.314 0.2970 0.3070 0.4175
2009 0.138 0.1850 0.2020 0.2560 0.2750 0.2780 0.325 0.3340 0.3030 0.3979
2010 0.163 0.1810 0.2200 0.2360 0.2730 0.3080 0.283 0.3110 0.3610 0.3807
2011 0.152 0.1620 0.1940 0.2330 0.2420 0.2740 0.272 0.2930 0.3350 0.3470
2012 0.095 0.1690 0.1850 0.2330 0.2560 0.2340 0.270 0.2600 0.2830 0.2690
2013 0.125 0.1690 0.1850 0.2240 0.2530 0.2660 0.297 0.2780 0.3090 0.4660
2014 0.155 0.1910 0.2120 0.2280 0.2630 0.2730 0.249 0.2790 0.3190 0.3510
2015 0.145 0.1690 0.2050 0.2400 0.2630 0.2740 0.304 0.2930 0.3300 0.3193
2016 0.143 0.1750 0.2000 0.2360 0.2650 0.2750 0.273 0.2940 0.3250 0.3039
2017 0.109 0.1680 0.1900 0.2260 0.2760 0.2740 0.313 0.3090 0.2800 0.3500
2018 0.123 0.1650 0.1980 0.2330 0.2560 0.2630 0.242 0.2580 0.2680 0.2757
2019 0.143 0.1618 0.1838 0.2198 0.2303 0.2228 0.245 0.2274 0.2067 0.3142
Table 17.3.2. Time-series of the mean weights-at-age in the discards of sole in Subarea 27.4.
Year 1 2 3 4 5 6 7 8 9 10
1957 0.05900 0.08200 0.09600 0.10400 0.11200 0.106 0.1200 0.13100 0.1370 0.1370
1958 0.05900 0.08200 0.09600 0.10400 0.11200 0.106 0.1200 0.13100 0.1370 0.1370
1959 0.05900 0.08200 0.09600 0.10400 0.11200 0.106 0.1200 0.13100 0.1370 0.1370
1960 0.05900 0.08200 0.09600 0.10400 0.11200 0.106 0.1200 0.13100 0.1370 0.1370
1961 0.05900 0.08200 0.09600 0.10400 0.11200 0.106 0.1200 0.13100 0.1370 0.1370
1962 0.05900 0.08200 0.09600 0.10400 0.11200 0.106 0.1200 0.13100 0.1370 0.1370
1963 0.05900 0.08200 0.09600 0.10400 0.11200 0.106 0.1200 0.13100 0.1370 0.1370
1964 0.05900 0.08200 0.09600 0.10400 0.11200 0.106 0.1200 0.13100 0.1370 0.1370
1965 0.05900 0.08200 0.09600 0.10400 0.11200 0.106 0.1200 0.13100 0.1370 0.1370
1966 0.05900 0.08200 0.09600 0.10400 0.11200 0.106 0.1200 0.13100 0.1370 0.1370
1967 0.05900 0.08200 0.09600 0.10400 0.11200 0.106 0.1200 0.13100 0.1370 0.1370
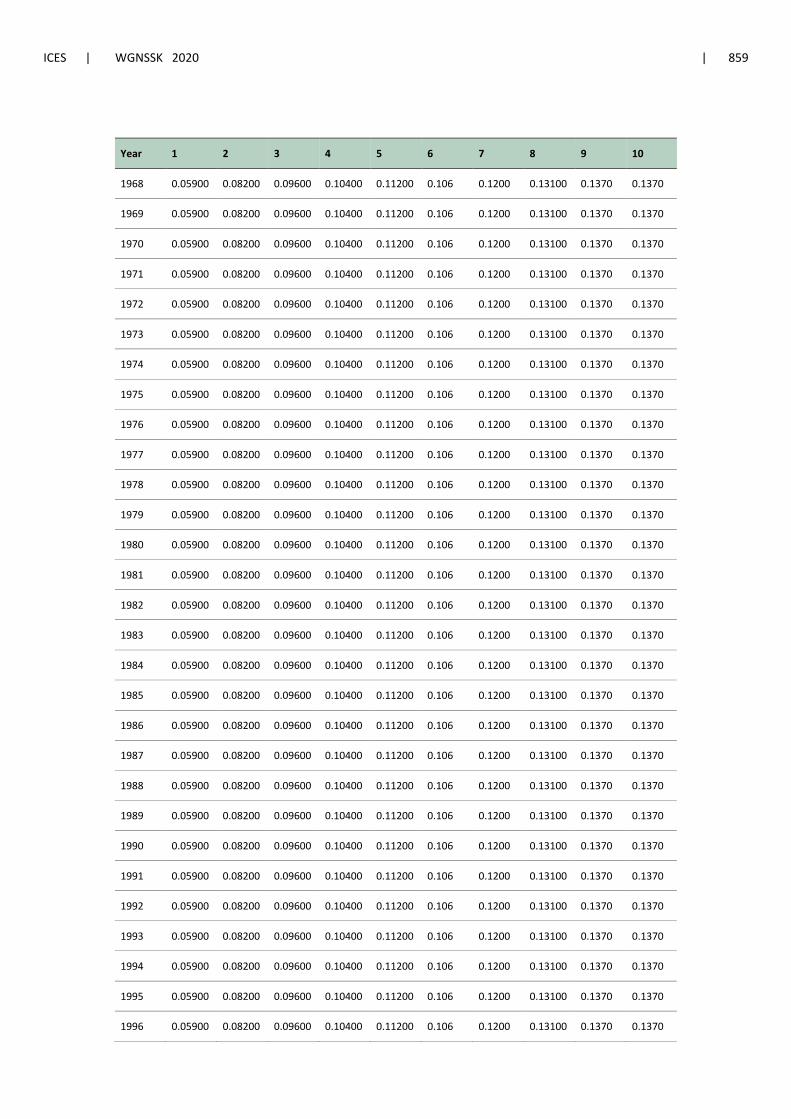
ICES | WGNSSK 2020 | 859
Year 1 2 3 4 5 6 7 8 9 10
1968 0.05900 0.08200 0.09600 0.10400 0.11200 0.106 0.1200 0.13100 0.1370 0.1370
1969 0.05900 0.08200 0.09600 0.10400 0.11200 0.106 0.1200 0.13100 0.1370 0.1370
1970 0.05900 0.08200 0.09600 0.10400 0.11200 0.106 0.1200 0.13100 0.1370 0.1370
1971 0.05900 0.08200 0.09600 0.10400 0.11200 0.106 0.1200 0.13100 0.1370 0.1370
1972 0.05900 0.08200 0.09600 0.10400 0.11200 0.106 0.1200 0.13100 0.1370 0.1370
1973 0.05900 0.08200 0.09600 0.10400 0.11200 0.106 0.1200 0.13100 0.1370 0.1370
1974 0.05900 0.08200 0.09600 0.10400 0.11200 0.106 0.1200 0.13100 0.1370 0.1370
1975 0.05900 0.08200 0.09600 0.10400 0.11200 0.106 0.1200 0.13100 0.1370 0.1370
1976 0.05900 0.08200 0.09600 0.10400 0.11200 0.106 0.1200 0.13100 0.1370 0.1370
1977 0.05900 0.08200 0.09600 0.10400 0.11200 0.106 0.1200 0.13100 0.1370 0.1370
1978 0.05900 0.08200 0.09600 0.10400 0.11200 0.106 0.1200 0.13100 0.1370 0.1370
1979 0.05900 0.08200 0.09600 0.10400 0.11200 0.106 0.1200 0.13100 0.1370 0.1370
1980 0.05900 0.08200 0.09600 0.10400 0.11200 0.106 0.1200 0.13100 0.1370 0.1370
1981 0.05900 0.08200 0.09600 0.10400 0.11200 0.106 0.1200 0.13100 0.1370 0.1370
1982 0.05900 0.08200 0.09600 0.10400 0.11200 0.106 0.1200 0.13100 0.1370 0.1370
1983 0.05900 0.08200 0.09600 0.10400 0.11200 0.106 0.1200 0.13100 0.1370 0.1370
1984 0.05900 0.08200 0.09600 0.10400 0.11200 0.106 0.1200 0.13100 0.1370 0.1370
1985 0.05900 0.08200 0.09600 0.10400 0.11200 0.106 0.1200 0.13100 0.1370 0.1370
1986 0.05900 0.08200 0.09600 0.10400 0.11200 0.106 0.1200 0.13100 0.1370 0.1370
1987 0.05900 0.08200 0.09600 0.10400 0.11200 0.106 0.1200 0.13100 0.1370 0.1370
1988 0.05900 0.08200 0.09600 0.10400 0.11200 0.106 0.1200 0.13100 0.1370 0.1370
1989 0.05900 0.08200 0.09600 0.10400 0.11200 0.106 0.1200 0.13100 0.1370 0.1370
1990 0.05900 0.08200 0.09600 0.10400 0.11200 0.106 0.1200 0.13100 0.1370 0.1370
1991 0.05900 0.08200 0.09600 0.10400 0.11200 0.106 0.1200 0.13100 0.1370 0.1370
1992 0.05900 0.08200 0.09600 0.10400 0.11200 0.106 0.1200 0.13100 0.1370 0.1370
1993 0.05900 0.08200 0.09600 0.10400 0.11200 0.106 0.1200 0.13100 0.1370 0.1370
1994 0.05900 0.08200 0.09600 0.10400 0.11200 0.106 0.1200 0.13100 0.1370 0.1370
1995 0.05900 0.08200 0.09600 0.10400 0.11200 0.106 0.1200 0.13100 0.1370 0.1370
1996 0.05900 0.08200 0.09600 0.10400 0.11200 0.106 0.1200 0.13100 0.1370 0.1370
860 | ICES SCIENTIFIC REPORTS 2:61 | ICES
Year 1 2 3 4 5 6 7 8 9 10
1997 0.05900 0.08200 0.09600 0.10400 0.11200 0.106 0.1200 0.13100 0.1370 0.1370
1998 0.05900 0.08200 0.09600 0.10400 0.11200 0.106 0.1200 0.13100 0.1370 0.1370
1999 0.05900 0.08200 0.09600 0.10400 0.11200 0.106 0.1200 0.13100 0.1370 0.1370
2000 0.05900 0.08200 0.09600 0.10400 0.11200 0.106 0.1200 0.13100 0.1370 0.1370
2001 0.05900 0.08200 0.09600 0.10400 0.11200 0.106 0.1200 0.13100 0.1370 0.1370
2002 0.04600 0.06800 0.08400 0.09100 0.09600 0.110 0.1240 0.13700 0.1370 0.1370
2003 0.05400 0.08700 0.10000 0.10700 0.11400 0.110 0.1240 0.13700 0.1370 0.1370
2004 0.06500 0.08900 0.10300 0.11100 0.11800 0.095 0.1240 0.13700 0.1370 0.1370
2005 0.06800 0.08900 0.10400 0.10900 0.11400 0.103 0.1070 0.13700 0.1370 0.1370
2006 0.06600 0.08200 0.09900 0.10900 0.10800 0.115 0.1130 0.12100 0.1370 0.1370
2007 0.06600 0.08700 0.09800 0.10200 0.10700 0.104 0.1210 0.13600 0.1360 0.1360
2008 0.06400 0.08600 0.10100 0.11200 0.12400 0.110 0.1110 0.13700 0.1370 0.1370
2009 0.06600 0.08900 0.10100 0.10600 0.11400 0.126 0.1040 0.13700 0.1370 0.1370
2010 0.06600 0.08300 0.09600 0.10500 0.10900 0.111 0.1130 0.12100 0.1210 0.1210
2011 0.05300 0.08100 0.09300 0.10400 0.11300 0.104 0.1100 0.12200 0.1260 0.1260
2012 0.05900 0.07500 0.09000 0.09600 0.11100 0.080 0.1150 0.12200 0.1210 0.1210
2013 0.04100 0.07500 0.08600 0.10000 0.11700 0.090 0.1120 0.11700 0.1210 0.1210
2014 0.05100 0.07900 0.08900 0.09700 0.10600 0.100 0.1170 0.09900 0.1470 0.1470
2015 0.03200 0.07600 0.09500 0.08700 0.10500 0.117 0.1320 0.12400 0.1590 0.1590
2016 0.02400 0.07300 0.08700 0.09500 0.11400 0.108 0.1240 0.22100 0.2140 0.2140
2017 0.04700 0.07300 0.08600 0.08600 0.09700 0.124 0.1110 0.11300 0.2870 0.2870
2018 0.03500 0.06900 0.08600 0.09100 0.09700 0.103 0.1020 0.10500 0.0127 0.0127
2019 0.04269 0.07026 0.08313 0.09408 0.09603 0.106 0.1053 0.09781 0.1177 0.1297
ICES | WGNSSK 2020 | 861
Table 17.3.3. Time-series of the mean weights-at-age in the stock of sole in Subarea 27.4.
Year 1 2 3 4 5 6 7 8 9 10
1957 0.02500 0.07000 0.1470 0.1870 0.208 0.2530 0.2620 0.3550 0.3900 0.3652
1958 0.02500 0.07000 0.1640 0.2050 0.226 0.2280 0.2970 0.3180 0.3930 0.4215
1959 0.02500 0.07000 0.1590 0.1980 0.239 0.2710 0.2920 0.2760 0.3030 0.4258
1960 0.02500 0.07000 0.1630 0.2070 0.234 0.2400 0.2680 0.2420 0.3600 0.4313
1961 0.02500 0.07000 0.1480 0.2060 0.235 0.2320 0.2590 0.2740 0.2810 0.3964
1962 0.02500 0.07000 0.1480 0.1920 0.240 0.3010 0.2930 0.2820 0.2730 0.4414
1963 0.02500 0.07000 0.1480 0.1930 0.243 0.2750 0.3110 0.3630 0.3290 0.4654
1964 0.02500 0.07000 0.1590 0.2140 0.240 0.2910 0.3050 0.3060 0.3650 0.4739
1965 0.02500 0.14000 0.1980 0.2230 0.251 0.2970 0.3370 0.3580 0.5260 0.4604
1966 0.02500 0.07000 0.1600 0.1490 0.389 0.3100 0.4060 0.3770 0.3850 0.5045
1967 0.02500 0.17700 0.1640 0.2350 0.242 0.3990 0.3620 0.2830 0.3810 0.4591
1968 0.02500 0.12200 0.1710 0.2480 0.312 0.2800 0.6290 0.4160 0.4100 0.4856
1969 0.02500 0.13700 0.1740 0.2520 0.324 0.3640 0.5790 0.4150 0.4690 0.5211
1970 0.02500 0.13700 0.2010 0.2750 0.341 0.3670 0.4230 0.4580 0.3900 0.5544
1971 0.03400 0.14800 0.2130 0.3130 0.361 0.4100 0.4320 0.4740 0.4830 0.5325
1972 0.03800 0.15500 0.2180 0.3130 0.419 0.4430 0.4430 0.4430 0.5080 0.6018
1973 0.03900 0.14900 0.2260 0.3220 0.371 0.4330 0.4520 0.4720 0.4460 0.5355
1974 0.03500 0.14600 0.2180 0.3290 0.408 0.4290 0.4990 0.5650 0.5420 0.6180
1975 0.03500 0.14800 0.2060 0.3110 0.403 0.4460 0.5080 0.5820 0.5800 0.6501
1976 0.03500 0.14200 0.2010 0.3010 0.379 0.4580 0.5080 0.5170 0.6440 0.6648
1977 0.03500 0.14700 0.2020 0.2910 0.365 0.4090 0.4780 0.4870 0.5310 0.6443
1978 0.03500 0.13900 0.2110 0.2900 0.365 0.4290 0.4270 0.3850 0.5420 0.6444
1979 0.04500 0.14800 0.2110 0.3000 0.352 0.4290 0.5210 0.5620 0.5670 0.7434
1980 0.03900 0.15700 0.2000 0.3040 0.345 0.3940 0.4890 0.5370 0.5790 0.6451
1981 0.05000 0.13700 0.2000 0.3050 0.364 0.4020 0.4540 0.5220 0.5610 0.6223
1982 0.05000 0.13000 0.1930 0.2700 0.359 0.4110 0.4290 0.4760 0.5830 0.6422
1983 0.05000 0.14000 0.2000 0.2850 0.329 0.4350 0.4640 0.4830 0.5100 0.6362
1984 0.05000 0.13300 0.2030 0.2680 0.348 0.3860 0.4880 0.5910 0.5670 0.6635
1985 0.05000 0.12700 0.1850 0.2670 0.324 0.3810 0.3800 0.6260 0.5540 0.6423
862 | ICES SCIENTIFIC REPORTS 2:61 | ICES
Year 1 2 3 4 5 6 7 8 9 10
1986 0.05000 0.13300 0.1910 0.2780 0.345 0.4230 0.4950 0.4870 0.5870 0.6863
1987 0.05000 0.15400 0.1910 0.2620 0.357 0.3810 0.4060 0.4540 0.3320 0.6197
1988 0.05000 0.13300 0.1930 0.2600 0.335 0.4090 0.4170 0.4740 0.4860 0.6543
1989 0.05000 0.13300 0.1950 0.2900 0.350 0.3400 0.4110 0.4750 0.4190 0.5944
1990 0.05000 0.14800 0.2030 0.2940 0.357 0.4470 0.3990 0.4940 0.4810 0.6528
1991 0.05000 0.13900 0.1840 0.2540 0.301 0.4130 0.4470 0.5220 0.5480 0.5734
1992 0.05000 0.15600 0.1940 0.2570 0.307 0.3980 0.4060 0.4720 0.5000 0.5401
1993 0.05000 0.12800 0.1840 0.2290 0.265 0.2930 0.3440 0.4820 0.4370 0.5833
1994 0.05000 0.14300 0.1740 0.2090 0.257 0.3260 0.3490 0.4020 0.4940 0.4589
1995 0.05000 0.15100 0.1790 0.2400 0.253 0.3210 0.3650 0.3570 0.5450 0.5453
1996 0.05000 0.14700 0.1780 0.2080 0.274 0.2680 0.3210 0.3750 0.4020 0.5464
1997 0.05000 0.15000 0.1900 0.2250 0.252 0.3030 0.3190 0.3250 0.3600 0.4240
1998 0.05000 0.14000 0.1730 0.2340 0.267 0.2810 0.3280 0.2730 0.3360 0.4546
1999 0.05000 0.13100 0.1870 0.2160 0.259 0.2960 0.3400 0.3220 0.3690 0.4639
2000 0.05000 0.13900 0.1850 0.2260 0.264 0.2750 0.2870 0.3370 0.3910 0.3763
2001 0.05000 0.14400 0.1850 0.2230 0.263 0.3190 0.3270 0.4210 0.4100 0.5302
2002 0.05000 0.14500 0.1970 0.2450 0.267 0.2670 0.2990 0.3080 0.4350 0.4354
2003 0.05000 0.14600 0.1940 0.2400 0.256 0.2880 0.3300 0.3120 0.5090 0.4697
2004 0.05000 0.13700 0.1950 0.2400 0.245 0.3050 0.3160 0.4480 0.3560 0.6014
2005 0.05000 0.15000 0.1890 0.2340 0.237 0.2580 0.2760 0.3960 0.3690 0.4286
2006 0.05000 0.14800 0.1970 0.2500 0.270 0.3190 0.2860 0.3410 0.4090 0.4552
2007 0.05000 0.15200 0.1790 0.2160 0.242 0.2450 0.2750 0.2520 0.2570 0.3640
2008 0.05000 0.15400 0.1980 0.2120 0.239 0.3020 0.2820 0.2310 0.2740 0.4004
2009 0.05000 0.14200 0.1850 0.2320 0.255 0.2790 0.2830 0.3330 0.3020 0.3902
2010 0.05000 0.14900 0.2000 0.2300 0.272 0.3070 0.3360 0.3360 0.3610 0.4100
2011 0.05000 0.14100 0.1790 0.2230 0.261 0.2760 0.3200 0.3600 0.4440 0.3908
2012 0.02500 0.05800 0.1440 0.2050 0.230 0.2090 0.2510 0.2350 0.3340 0.2230
2013 0.03400 0.06800 0.1170 0.1860 0.254 0.2580 0.3090 0.2410 0.3250 0.5620
2014 0.02200 0.07900 0.1360 0.1880 0.212 0.2270 0.2280 0.2900 0.3430 0.6030
ICES | WGNSSK 2020 | 863
Year 1 2 3 4 5 6 7 8 9 10
2015 0.07000 0.07500 0.1420 0.1480 0.227 0.2440 0.2630 0.2880 0.3700 0.3893
2016 0.01000 0.06700 0.1510 0.1860 0.232 0.2480 0.2360 0.2610 0.2210 0.2808
2017 0.02100 0.07400 0.1310 0.1740 0.231 0.2420 0.2490 0.2170 0.2330 0.3674
2018 0.02600 0.08400 0.1460 0.1800 0.205 0.2370 0.2280 0.2190 0.2600 0.4249
2019 0.02733 0.07248 0.1328 0.1525 0.191 0.1684 0.1768 0.2236 0.1942 0.2481
Table 17.4.1. Assumed values of maturity and natural mortality-at-age in the stock of sole in Subarea 27.4.
Age Maturity M
1 0 0.1
2 0 0.1
3 1 0.1
4 1 0.1
5 1 0.1
6 1 0.1
7 1 0.1
8 1 0.1
9 1 0.1
10 1 0.1
Table 17.5.1. Index of abundance, based on the BTS Q3 survey samples from The Netherlands, Germany and Belgium, used in the assessment of sole in Subarea 27.4.
Year 1 2 3 4 5 6 7 8 9 10
1985 876.6 811.5 777.5 425.54 196.77 85.93 0.00 0.000 20.685 47.315
1986 3478.1 1732.2 646.2 406.38 276.40 103.53 60.11 0.000 27.282 71.796
1987 698.7 2173.2 491.9 178.11 162.77 119.39 97.41 88.446 5.604 6.112
1988 7146.8 835.6 766.0 227.01 86.20 81.15 70.22 41.703 15.414 26.859
1989 2160.9 6189.9 653.1 554.73 106.88 61.33 53.76 1.850 45.410 35.233
1990 2878.8 2580.1 4901.1 379.36 236.70 138.39 38.62 30.129 15.662 25.722
1991 1251.8 3401.8 1395.1 1915.29 108.93 56.21 30.49 27.813 21.047 53.450
1992 17407.1 3284.4 3673.8 721.10 1109.16 17.04 58.57 12.166 7.251 15.418
1993 5203.9 11170.8 591.2 1894.71 731.05 1322.81 50.35 72.126 21.735 100.877
864 | ICES SCIENTIFIC REPORTS 2:61 | ICES
Year 1 2 3 4 5 6 7 8 9 10
1994 3770.0 2731.0 6509.0 79.87 368.17 61.78 347.12 53.472 12.023 100.954
1995 7318.7 2405.7 1808.0 1931.28 200.70 270.66 84.95 153.610 24.134 48.792
1996 1592.0 2327.6 489.5 485.30 724.40 93.04 108.39 31.878 66.028 30.356
1997 16121.7 1059.3 819.8 195.93 219.84 158.89 26.89 15.499 15.083 20.569
1998 2802.9 5073.4 190.5 262.47 62.22 58.62 105.68 6.560 15.561 30.689
1999 2620.3 1604.7 2006.2 50.68 124.53 21.30 14.82 59.541 9.011 40.596
2000 2848.4 878.0 690.8 367.19 73.67 24.28 15.22 2.563 29.416 18.569
2001 2083.6 1359.1 460.0 469.71 235.72 31.48 3.96 12.488 10.659 42.073
2002 3241.4 650.4 587.0 210.09 98.42 114.47 20.39 17.341 7.267 24.749
2003 2874.7 1453.8 393.8 259.71 77.53 57.29 62.98 5.073 4.367 10.340
2004 994.4 1123.9 862.3 167.44 131.54 37.12 21.29 10.706 1.143 15.934
2005 1625.0 881.2 532.1 371.85 85.27 75.56 32.35 10.749 8.844 15.072
2006 4255.4 737.5 241.4 381.43 203.04 50.62 59.22 20.515 20.469 8.914
2007 2100.1 3026.1 386.3 116.10 154.37 142.66 28.91 26.804 13.552 14.137
2008 2922.0 1456.0 1396.2 211.94 67.32 72.34 92.80 11.398 24.667 14.866
2009 3193.4 1261.1 692.7 804.04 117.26 40.29 85.70 61.248 14.233 25.748
2010 3580.4 1514.3 481.9 266.36 250.33 79.14 20.81 19.355 18.993 26.605
2011 2967.4 2711.3 686.2 233.20 191.13 185.60 28.11 14.700 20.359 27.124
2012 1360.9 3901.5 1470.3 344.35 164.38 99.35 57.97 20.317 6.474 22.339
2013 1715.0 880.8 2045.9 593.77 191.46 50.88 53.23 46.854 10.702 39.327
2014 4037.2 2114.6 445.6 826.93 351.92 79.35 24.18 27.288 16.328 5.695
2015 3171.7 2600.5 1389.5 375.38 691.84 224.66 101.93 24.983 20.247 31.275
2016 1671.4 2065.2 1383.7 691.09 205.42 356.57 102.99 22.529 2.597 33.483
2017 6521.2 1391.7 1257.0 627.68 268.33 88.82 121.43 58.816 2.376 17.269
2018 3516.6 2174.6 613.0 599.41 197.99 133.93 45.50 69.661 7.142 5.288
2019 15323.3 1908.6 1259.1 337.57 237.44 82.08 67.59 16.236 22.790 9.221
ICES | WGNSSK 2020 | 865
Table 17.5.2. Index of abundance, based on the SNS survey, used in the assessment of sole in Subarea 27.4.
Year 0 1 2 3 4 5 6
1970 623.1 5410.3 734.4 237.7 35.4 4.0 0.0
1971 10685.1 902.7 1831.1 113.4 2.9 28.9 0.0
1972 16.0 1454.7 272.3 148.6 0.0 28.3 0.0
1973 895.7 5587.2 935.3 83.8 37.3 13.0 0.0
1974 174.4 2347.9 361.4 65.2 0.0 0.0 4.4
1975 577.5 525.4 864.5 177.0 17.5 0.0 17.1
1976 464.6 1399.4 73.6 229.1 26.7 5.7 0.0
1977 1585.0 3742.9 776.1 103.8 43.1 31.7 3.9
1978 10370.5 1547.7 1354.7 294.1 28.0 99.4 13.3
1979 3922.7 93.8 408.3 300.8 76.9 0.0 16.7
1980 5145.8 4312.9 88.9 109.3 61.3 3.3 0.0
1981 3240.7 3737.2 1413.1 50.0 20.0 0.0 0.0
1982 2147.0 5856.5 1146.2 227.8 6.7 10.0 0.0
1983 769.1 2621.1 1123.3 120.6 39.9 0.0 19.7
1984 3334.0 2493.1 1099.9 318.3 74.4 8.0 0.0
1985 2713.4 3619.4 715.6 167.1 49.3 4.4 0.0
1986 742.0 3705.1 457.6 69.2 31.4 16.7 0.0
1987 13610.1 1947.9 943.7 64.8 21.3 0.0 0.0
1988 522.7 11226.7 593.8 281.6 81.5 10.2 15.5
1989 1743.4 2830.7 5005.0 207.6 53.1 18.2 18.6
1990 50.8 2856.2 1119.5 914.3 100.4 49.6 12.5
1991 3639.7 1253.6 2529.1 513.8 623.9 27.2 35.8
1992 302.9 11114.0 144.4 360.4 194.9 284.8 20.0
1993 231.3 1290.8 3419.6 153.8 212.8 0.0 191.7
1994 4692.7 651.8 498.3 934.1 10.2 59.3 0.0
1995 1374.9 1362.1 223.7 142.8 411.1 7.1 31.1
1996 2322.3 218.4 349.1 29.6 35.5 90.0 10.0
1997 803.0 10279.3 153.6 189.8 26.5 58.1 230.0
1998 327.9 4094.6 3126.4 141.7 98.7 0.0 10.0
866 | ICES SCIENTIFIC REPORTS 2:61 | ICES
Year 0 1 2 3 4 5 6
1999 2187.9 1648.9 971.8 455.6 10.0 20.7 0.0
2000 70.0 1639.2 125.9 166.3 118.0 0.0 2.0
2001 8340.0 970.3 655.4 106.7 35.5 56.2 0.0
2002 1127.7 7547.5 379.0 195.3 0.0 30.8 19.2
2003 NA NA NA NA NA NA NA
2004 162.0 1369.5 624.4 393.0 68.9 53.1 7.5
2005 305.0 568.1 162.9 124.0 0.0 21.3 6.7
2006 16.0 2726.4 117.1 25.0 30.0 0.0 0.0
2007 466.9 848.6 911.0 33.3 39.5 14.4 0.0
2008 754.7 1259.1 258.5 325.3 0.0 10.0 0.0
2009 2291.0 1931.6 344.4 61.7 102.7 0.0 0.0
2010 333.9 2636.9 237.1 67.1 42.2 23.2 0.0
2011 136.3 1248.0 883.9 211.3 111.8 0.0 38.0
2012 144.7 226.6 159.5 54.0 18.0 0.0 0.0
2013 237.3 967.4 426.6 490.5 179.3 50.8 7.6
2014 126.0 2849.0 448.2 44.8 60.0 33.6 0.0
2015 109.7 3192.0 2333.9 137.8 159.9 162.4 150.6
2016 373.2 733.8 623.3 494.6 109.8 16.7 42.9
2017 205.9 956.7 204.3 209.6 209.7 41.6 5.2
2018 6574.9 1002.3 482.4 163.1 94.1 82.4 5.7
2019 78.4 7896.7 476.3 375.2 60.7 6.7 50.9
Table 17.6.1 Time series of abundances at age (in thousands) estimated by the AAP stock assessment for sole in Subarea 27.4.
Year 1 2 3 4 5 6 7 8 9 10
1957 137911 75380 86824 62785 17357 18093 35136 17339 3038 45102
1958 121838 124786 65842 64508 41740 11626 12923 24773 13876 35537
1959 443013 110243 109380 47514 45231 28308 8150 9296 18666 37704
1960 40092 400848 96634 76440 33825 30331 19396 5873 6459 43266
1961 67021 36276 349031 65341 52011 21361 20164 13529 3726 36618
1962 10554 60640 31186 230330 40494 30053 13710 13208 8094 27277
ICES | WGNSSK 2020 | 867
Year 1 2 3 4 5 6 7 8 9 10
1963 12372 9548 51590 20563 134757 22771 18695 8458 8162 22519
1964 583561 11192 8097 34563 12476 80256 13950 11380 5739 20135
1965 146876 527948 9432 5432 22468 7782 49826 8949 8299 18356
1966 59219 132895 435471 6099 3699 13804 5021 34884 6707 20276
1967 96575 53583 104434 259404 4117 2141 9195 3714 25904 21188
1968 131700 87376 38297 54440 157488 2206 1429 6793 2629 36439
1969 85878 118729 54824 17159 27308 80486 1448 1017 4523 28785
1970 197968 75052 69884 22824 7775 14501 52326 1000 675 23436
1971 58013 172233 45852 29622 11024 4474 9435 36002 696 16661
1972 118261 51563 109067 19490 15207 6514 2898 6533 25511 11846
1973 153656 106059 32415 43596 9773 8483 4135 2006 4442 24901
1974 120919 138043 67240 12491 20639 5049 5207 2810 1293 19229
1975 61016 108217 93397 27916 5757 10596 2977 3386 1812 13563
1976 145354 54166 77447 42839 13168 3080 6107 1858 2216 10327
1977 182236 129066 38676 36569 21555 7248 1813 3854 1168 8418
1978 62372 163160 88111 17671 19462 11879 4454 1189 2215 6323
1979 17166 56127 109176 39032 9295 10576 7441 2922 657 5545
1980 187117 15472 38813 48428 18806 4953 6490 4612 1717 4009
1981 239299 168528 10919 17186 21718 9851 2902 3798 2894 3687
1982 215666 214486 115156 4662 7983 11276 5454 1707 2417 4190
1983 200709 191353 138283 46020 2284 4117 5904 3260 1066 4176
1984 90233 177535 120310 51098 21958 1164 2067 3382 1983 3340
1985 106378 80484 113984 42381 22537 10996 573 1092 2011 3376
1986 166588 95627 53657 41755 18289 11113 5480 296 642 3192
1987 79837 150294 66314 21824 19177 8980 5738 3033 176 2013
1988 589903 72110 108650 29327 10620 9597 4857 3440 1890 1152
1989 114202 532820 54213 49854 14392 5525 5426 3049 2283 1909
1990 220001 103093 410703 26280 24261 7656 3215 3417 2063 2931
1991 92487 198430 79828 222461 12920 12616 4469 1927 2160 3387
868 | ICES SCIENTIFIC REPORTS 2:61 | ICES
Year 1 2 3 4 5 6 7 8 9 10
1992 511966 83342 151273 47360 111946 6383 7152 2462 1090 3329
1993 123568 461000 61149 90398 24210 53084 3366 3671 1402 2477
1994 86784 111098 320049 33720 45424 11246 25322 1672 2290 2270
1995 123913 77474 74006 153491 15504 20584 5040 12327 1042 2734
1996 78075 107754 51550 30465 59578 6736 9345 2400 6495 2139
1997 307085 67070 72913 19145 10604 24818 3118 4437 1016 4465
1998 146503 273882 45757 27226 7383 4321 11151 1526 1928 2691
1999 117612 132011 184335 18391 11979 2999 1886 5626 761 2290
2000 141741 105445 84778 79959 7985 4903 1371 946 2902 1603
2001 78486 119410 64569 38801 31258 3323 2418 673 462 2558
2002 207098 60838 75641 30357 15389 13393 1654 1216 324 1842
2003 101725 178799 42063 35658 14166 6856 6252 891 628 1375
2004 53242 90774 127195 19616 18411 6569 3128 3551 494 1241
2005 52919 47382 60240 58868 9774 8848 3302 1789 2033 956
2006 168662 46337 29264 28763 27113 4853 4938 1885 1051 1457
2007 68487 147643 31382 15268 13394 13887 2792 2895 1165 1286
2008 78240 60651 111290 17757 7681 7035 7801 1682 1867 1439
2009 100181 69284 45873 63580 9392 4089 3818 4603 1079 2070
2010 177721 87416 47580 24770 33478 4996 2185 2099 2778 1939
2011 165023 153170 55787 24472 12440 17556 2704 1135 1162 2753
2012 48820 144000 106863 29452 11496 6384 9811 1414 587 2172
2013 97206 42941 108867 61129 13663 5858 3622 5162 717 1512
2014 158225 84319 32412 68185 31170 7145 3229 1798 2714 1272
2015 116715 131655 61179 21401 38444 16926 3741 1466 970 2344
2016 73331 94200 95614 39802 12302 21351 8634 1652 747 1850
2017 143480 60370 71475 58349 22082 6933 11183 4115 754 1260
2018 108700 121825 47049 42202 32637 12884 3909 6140 1883 854
2019 616179 94260 94397 29247 25872 20229 8003 2494 3342 1130
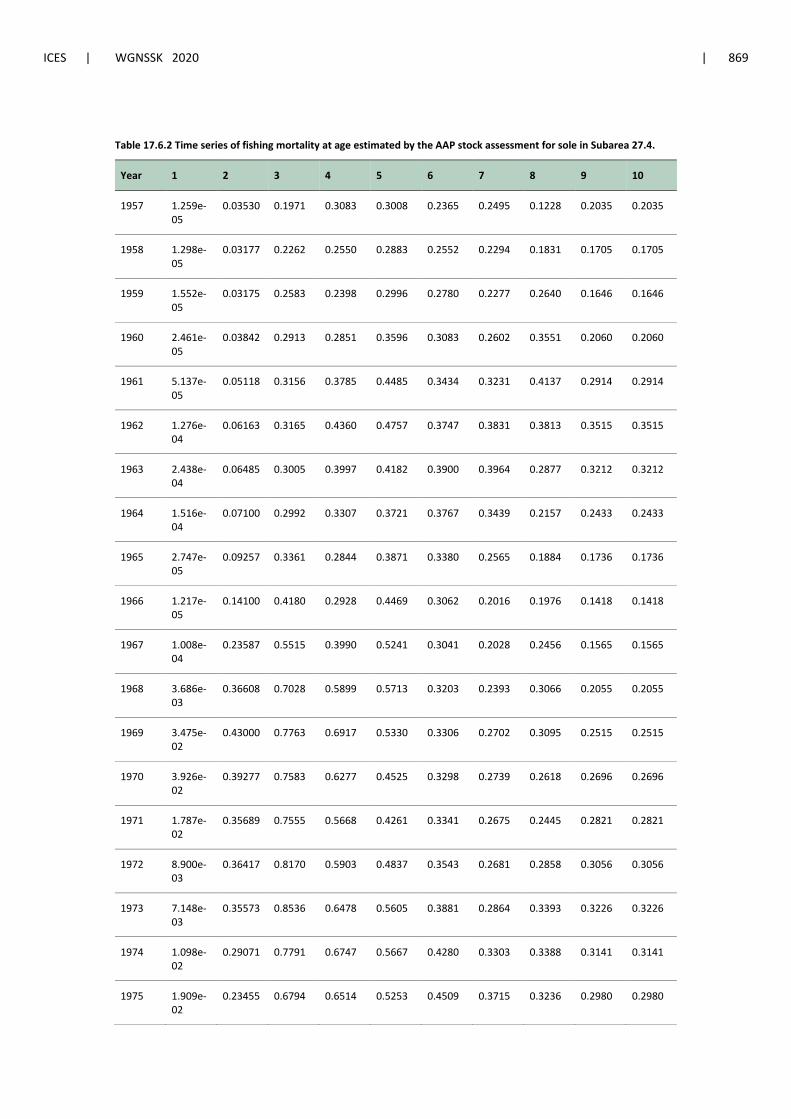
ICES | WGNSSK 2020 | 869
Table 17.6.2 Time series of fishing mortality at age estimated by the AAP stock assessment for sole in Subarea 27.4.
Year 1 2 3 4 5 6 7 8 9 10
1957 1.259e-05
0.03530 0.1971 0.3083 0.3008 0.2365 0.2495 0.1228 0.2035 0.2035
1958 1.298e-05
0.03177 0.2262 0.2550 0.2883 0.2552 0.2294 0.1831 0.1705 0.1705
1959 1.552e-05
0.03175 0.2583 0.2398 0.2996 0.2780 0.2277 0.2640 0.1646 0.1646
1960 2.461e-05
0.03842 0.2913 0.2851 0.3596 0.3083 0.2602 0.3551 0.2060 0.2060
1961 5.137e-05
0.05118 0.3156 0.3785 0.4485 0.3434 0.3231 0.4137 0.2914 0.2914
1962 1.276e-04
0.06163 0.3165 0.4360 0.4757 0.3747 0.3831 0.3813 0.3515 0.3515
1963 2.438e-04
0.06485 0.3005 0.3997 0.4182 0.3900 0.3964 0.2877 0.3212 0.3212
1964 1.516e-04
0.07100 0.2992 0.3307 0.3721 0.3767 0.3439 0.2157 0.2433 0.2433
1965 2.747e-05
0.09257 0.3361 0.2844 0.3871 0.3380 0.2565 0.1884 0.1736 0.1736
1966 1.217e-05
0.14100 0.4180 0.2928 0.4469 0.3062 0.2016 0.1976 0.1418 0.1418
1967 1.008e-04
0.23587 0.5515 0.3990 0.5241 0.3041 0.2028 0.2456 0.1565 0.1565
1968 3.686e-03
0.36608 0.7028 0.5899 0.5713 0.3203 0.2393 0.3066 0.2055 0.2055
1969 3.475e-02
0.43000 0.7763 0.6917 0.5330 0.3306 0.2702 0.3095 0.2515 0.2515
1970 3.926e-02
0.39277 0.7583 0.6277 0.4525 0.3298 0.2739 0.2618 0.2696 0.2696
1971 1.787e-02
0.35689 0.7555 0.5668 0.4261 0.3341 0.2675 0.2445 0.2821 0.2821
1972 8.900e-03
0.36417 0.8170 0.5903 0.4837 0.3543 0.2681 0.2858 0.3056 0.3056
1973 7.148e-03
0.35573 0.8536 0.6478 0.5605 0.3881 0.2864 0.3393 0.3226 0.3226
1974 1.098e-02
0.29071 0.7791 0.6747 0.5667 0.4280 0.3303 0.3388 0.3141 0.3141
1975 1.909e-02
0.23455 0.6794 0.6514 0.5253 0.4509 0.3715 0.3236 0.2980 0.2980
870 | ICES SCIENTIFIC REPORTS 2:61 | ICES
Year 1 2 3 4 5 6 7 8 9 10
1976 1.885e-02
0.23682 0.6504 0.5869 0.4971 0.4297 0.3603 0.3637 0.2988 0.2988
1977 1.057e-02
0.28172 0.6833 0.5308 0.4959 0.3868 0.3215 0.4540 0.3161 0.3161
1978 5.501e-03
0.30177 0.7142 0.5425 0.5099 0.3677 0.3215 0.4931 0.3317 0.3317
1979 3.904e-03
0.26885 0.7129 0.6302 0.5295 0.3882 0.3783 0.4313 0.3364 0.3364
1980 4.631e-03
0.24854 0.7147 0.7019 0.5466 0.4345 0.4357 0.3659 0.3404 0.3404
1981 9.471e-03
0.28082 0.7511 0.6668 0.5555 0.4912 0.4303 0.3518 0.3515 0.3515
1982 1.961e-02
0.33894 0.8172 0.6134 0.5621 0.5470 0.4145 0.3704 0.3588 0.3588
1983 2.269e-02
0.36405 0.8956 0.6400 0.5745 0.5890 0.4571 0.3973 0.3509 0.3509
1984 1.434e-02
0.34311 0.9434 0.7186 0.5916 0.6072 0.5379 0.4197 0.3553 0.3553
1985 6.551e-03
0.30545 0.9042 0.7404 0.6071 0.5963 0.5595 0.4310 0.4232 0.4232
1986 2.933e-03
0.26605 0.7996 0.6781 0.6113 0.5609 0.4916 0.4197 0.5444 0.5444
1987 1.787e-03
0.22446 0.7159 0.6203 0.5922 0.5145 0.4115 0.3730 0.5416 0.5416
1988 1.774e-03
0.18527 0.6790 0.6119 0.5535 0.4702 0.3654 0.3100 0.3659 0.3659
1989 2.336e-03
0.16031 0.6241 0.6202 0.5311 0.4414 0.3623 0.2906 0.2580 0.2580
1990 3.193e-03
0.15576 0.5131 0.6100 0.5539 0.4382 0.4117 0.3588 0.2883 0.2883
1991 4.114e-03
0.17135 0.4221 0.5867 0.6051 0.4676 0.4961 0.4692 0.4105 0.4105
1992 4.862e-03
0.20964 0.4149 0.5710 0.6461 0.5399 0.5668 0.4633 0.4792 0.4792
1993 6.374e-03
0.26492 0.4952 0.5882 0.6668 0.6402 0.5997 0.3719 0.4358 0.4358
1994 1.348e-02
0.30627 0.6348 0.6770 0.6915 0.7025 0.6199 0.3726 0.4116 0.4116
1995 3.973e-02
0.30739 0.7876 0.8464 0.7336 0.6896 0.6418 0.5408 0.4680 0.4680
ICES | WGNSSK 2020 | 871
Year 1 2 3 4 5 6 7 8 9 10
1996 5.193e-02
0.29058 0.8905 0.9553 0.7757 0.6703 0.6447 0.7598 0.5595 0.5595
1997 1.442e-02
0.28238 0.8851 0.8529 0.7977 0.7000 0.6143 0.7336 0.6114 0.6114
1998 4.164e-03
0.29594 0.8115 0.7211 0.8008 0.7291 0.5841 0.5953 0.6014 0.6014
1999 9.206e-03
0.34285 0.7352 0.7342 0.7934 0.6825 0.5900 0.5619 0.5435 0.5435
2000 7.144e-02
0.39046 0.6816 0.8392 0.7767 0.6066 0.6108 0.6147 0.4661 0.4661
2001 1.547e-01
0.35656 0.6547 0.8248 0.7476 0.5975 0.5874 0.6297 0.3948 0.3948
2002 4.693e-02
0.26904 0.6520 0.6622 0.7086 0.6617 0.5180 0.5603 0.3547 0.3547
2003 1.390e-02
0.24054 0.6628 0.5611 0.6684 0.6845 0.4658 0.4889 0.3789 0.3789
2004 1.661e-02
0.31004 0.6704 0.5966 0.6327 0.5876 0.4587 0.4575 0.4959 0.4959
2005 3.282e-02
0.38190 0.6393 0.6753 0.6001 0.4832 0.4604 0.4317 0.6187 0.6187
2006 3.310e-02
0.28972 0.5506 0.6643 0.5691 0.4526 0.4338 0.3816 0.5677 0.5677
2007 2.150e-02
0.18266 0.4694 0.5870 0.5438 0.4767 0.4066 0.3385 0.4327 0.4327
2008 2.156e-02
0.17926 0.4598 0.5370 0.5304 0.5111 0.4274 0.3439 0.3684 0.3684
2009 3.630e-02
0.27580 0.5163 0.5414 0.5312 0.5265 0.4982 0.4049 0.3849 0.3849
2010 4.867e-02
0.34913 0.5649 0.5887 0.5455 0.5139 0.5547 0.4913 0.4385 0.4385
2011 3.628e-02
0.26000 0.5388 0.6556 0.5672 0.4819 0.5483 0.5589 0.4890 0.4890
2012 2.831e-02
0.17968 0.4586 0.6681 0.5741 0.4666 0.5421 0.5780 0.5018 0.5018
2013 4.223e-02
0.18130 0.3679 0.5735 0.5483 0.4955 0.6001 0.5427 0.4613 0.4613
2014 8.383e-02
0.22080 0.3151 0.4730 0.5106 0.5469 0.6894 0.5172 0.4309 0.4309
2015 1.143e-01
0.21986 0.3299 0.4537 0.4881 0.5731 0.7170 0.5739 0.4827 0.4827
872 | ICES SCIENTIFIC REPORTS 2:61 | ICES
Year 1 2 3 4 5 6 7 8 9 10
2016 9.449e-02
0.17607 0.3939 0.4891 0.4735 0.5466 0.6410 0.6839 0.6232 0.6232
2017 6.361e-02
0.14931 0.4269 0.4810 0.4388 0.4729 0.4996 0.6817 0.7583 0.7583
2018 4.254e-02
0.15507 0.3754 0.3893 0.3784 0.3760 0.3495 0.5083 0.7848 0.7848
2019 2.860e-02
0.18030 0.2944 0.2832 0.3137 0.2863 0.2314 0.3238 0.7427 0.7427
Table 17.6.3. Time series of spawning stock biomass and mean fishing mortality, plus lower and upper confidence inter-vals, estimated by the AAP stock assessment for sole in Subarea 27.4.
Year SSB SSB lower SSB upper F F lower F upper
1957 65708 58319 73097 0.2156 0.1748 0.2563
1958 68255 60703 75807 0.2113 0.1849 0.2377
1959 71937 64476 79398 0.2215 0.1890 0.2540
1960 74376 66758 81994 0.2565 0.2236 0.2894
1961 106790 95894 117686 0.3074 0.2672 0.3476
1962 89594 81127 98061 0.3329 0.2900 0.3758
1963 72662 65729 79595 0.3147 0.2774 0.3519
1964 54407 48353 60461 0.2899 0.2473 0.3326
1965 43843 37827 49859 0.2876 0.2491 0.3261
1966 104300 90071 118529 0.3210 0.2706 0.3714
1967 103920 93241 114599 0.4029 0.3488 0.4571
1968 92302 83689 100915 0.5101 0.4394 0.5807
1969 70390 63939 76841 0.5523 0.4730 0.6316
1970 64146 57808 70484 0.5122 0.4437 0.5807
1971 55203 49761 60645 0.4879 0.4129 0.5628
1972 63402 56255 70549 0.5219 0.4597 0.5841
1973 46796 41999 51593 0.5611 0.4835 0.6387
1974 46126 41347 50905 0.5478 0.4887 0.6070
1975 48319 42707 53931 0.5083 0.4455 0.5711
1976 47220 42630 51810 0.4802 0.4242 0.5361
1977 38075 34743 41407 0.4757 0.4182 0.5332
ICES | WGNSSK 2020 | 873
Year SSB SSB lower SSB upper F F lower F upper
1978 43552 38786 48318 0.4872 0.4209 0.5535
1979 52569 46478 58660 0.5059 0.4522 0.5597
1980 40157 36422 43892 0.5292 0.4640 0.5945
1981 26510 24535 28485 0.5491 0.4947 0.6035
1982 38237 32551 43923 0.5757 0.5035 0.6480
1983 50830 43508 58152 0.6126 0.5455 0.6797
1984 52556 45276 59836 0.6408 0.5708 0.7108
1985 48079 42254 53904 0.6307 0.5614 0.7000
1986 38292 34916 41668 0.5832 0.5281 0.6383
1987 33664 30543 36785 0.5335 0.4736 0.5933
1988 41407 36891 45923 0.5000 0.4541 0.5458
1989 37715 34213 41217 0.4754 0.4214 0.5295
1990 109060 94319 123801 0.4542 0.4118 0.4966
1991 86423 77068 95778 0.4506 0.4032 0.4980
1992 84836 77982 91690 0.4763 0.4287 0.5239
1993 58907 54235 63579 0.5311 0.4808 0.5814
1994 89759 77769 101749 0.6024 0.5350 0.6699
1995 68914 61322 76506 0.6729 0.6156 0.7302
1996 41323 37717 44929 0.7165 0.6417 0.7913
1997 33050 29593 36507 0.7036 0.6461 0.7611
1998 23418 21102 25734 0.6717 0.6033 0.7400
1999 46230 39021 53439 0.6576 0.5953 0.7199
2000 39662 34524 44800 0.6589 0.5995 0.7183
2001 32500 29436 35564 0.6362 0.5744 0.6980
2002 31836 28580 35092 0.5907 0.5458 0.6356
2003 25627 23343 27911 0.5635 0.5087 0.6183
2004 39527 34659 44395 0.5595 0.5157 0.6032
2005 32541 29106 35976 0.5560 0.4994 0.6125
2006 24973 23133 26813 0.5053 0.4620 0.5485
874 | ICES SCIENTIFIC REPORTS 2:61 | ICES
Year SSB SSB lower SSB upper F F lower F upper
2007 17824 16464 19184 0.4519 0.4089 0.4950
2008 33437 29610 37264 0.4435 0.4011 0.4860
2009 30520 27709 33331 0.4782 0.4365 0.5200
2010 29091 26741 31441 0.5124 0.4578 0.5670
2011 26402 24111 28693 0.5007 0.4607 0.5407
2012 28880 25885 31875 0.4694 0.4225 0.5163
2013 32536 29773 35299 0.4333 0.3981 0.4685
2014 28413 26104 30722 0.4133 0.3726 0.4540
2015 27390 25255 29525 0.4129 0.3690 0.4568
2016 33144 29535 36753 0.4158 0.3583 0.4733
2017 30612 26648 34576 0.3938 0.3180 0.4696
2018 27298 22578 32018 0.3348 0.2583 0.4114
2019 28244 21939 34549 0.2716 0.1820 0.3611
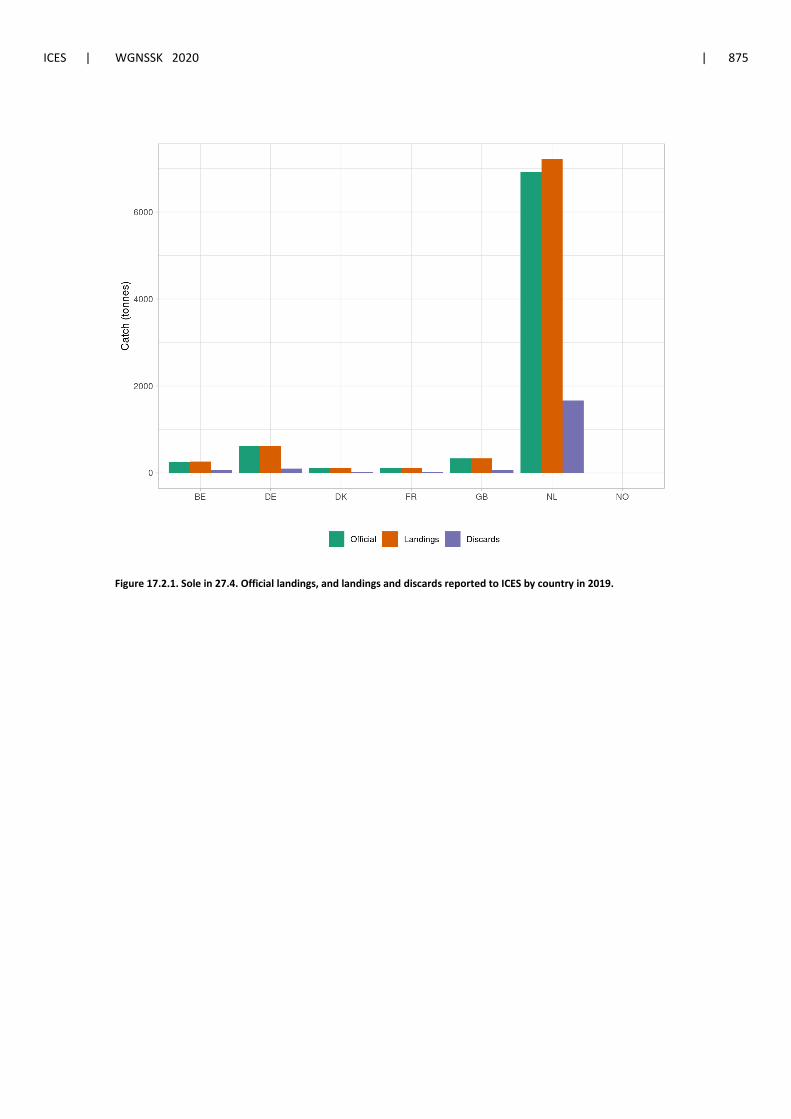
ICES | WGNSSK 2020 | 875
Figure 17.2.1. Sole in 27.4. Official landings, and landings and discards reported to ICES by country in 2019.
876 | ICES SCIENTIFIC REPORTS 2:61 | ICES
Figure 17.2.5. Sole in 27.4. Time series of catches, landings and discards (in tonnes) reported to ICES Intercatch.
ICES | WGNSSK 2020 | 877
Figure 17.2.6. Sole in 27.4. Time series of landings at age (in thousands).
878 | ICES SCIENTIFIC REPORTS 2:61 | ICES
Figure 17.2.7. Sole in 27.4. Time series of discards at age (in thousands).
ICES | WGNSSK 2020 | 879
Figure 17.2.8 Sole in 27.4. Proportions of fish discarded by age over the 2002-2019 period.
880 | ICES SCIENTIFIC REPORTS 2:61 | ICES
Figure 17.2.2. Sole in 27.4. InterCatch summary plots. Sampled and unsampled fleets for landings yield estimation (tonnes).
Figure 17.2.2. Sole in 27.4. InterCatch summary plots. Sampled and unsampled fleets for landings yield estimation (cu-mulative percentage)
ICES | WGNSSK 2020 | 881
Figure 17.2.3. Sole in 27.4. InterCatch summary plots. Sampled and unsampled fleets for discards yield estimation
882 | ICES SCIENTIFIC REPORTS 2:61 | ICES
(tonnes).
Figure 17.3.1. Sole in 27.4. Time series of mean weight-at-age in the landings (in grams).
ICES | WGNSSK 2020 | 883
Figure 17.3.2 Sole in 27.4. Time series of mean weight-at-age in the stock (in grams).
884 | ICES SCIENTIFIC REPORTS 2:61 | ICES
Figure 17.5.1. Sole in 27.4. Location of stations sampled during the BTS Q3 survey and included in the BTS index of abun-dance.
ICES | WGNSSK 2020 | 885
Figure 17.5.4 Sole in 27.4. Comparison of the time series of relative abundance at age from the BTS Q3 delta-lognormal GAM standardized (1985-2019) and SNS (1970-2019) indices of abundance.
886 | ICES SCIENTIFIC REPORTS 2:61 | ICES
Figure 17.5.2 Sole in 27.4. Time series of relative abundance at age from the BTS Q3 delta-lognormal GAM standardized index of abundance (1985-2019).
ICES | WGNSSK 2020 | 887
Figure 17.5.5. Sole in 27.4. Bivariate cross-correlation plots showing the internal consistency in signals by cohort for the BTS Q3 delta-lognormal GAM standardized index of abundance (1985-2019).
888 | ICES SCIENTIFIC REPORTS 2:61 | ICES
Figure 17.5.7. Sole in 27.4. Abundance in log scale by cohort (in the x axis) and age (coloured lines) for the BTS Q3 delta-lognormal GAM standardized index of abundance (2001-2019).
ICES | WGNSSK 2020 | 889
Figure 17.5.3. Sole in 27.4. Time series of relative abundance at age from the BTS Q3 delta-lognormal GAM standardized index of abundance (1985-2019).
890 | ICES SCIENTIFIC REPORTS 2:61 | ICES
Figure 17.5.6. Sole in 27.4. Bivariate cross-correlation plots showing the internal consistency in signals by cohort for the SNS index of abundance (1970-2019).
ICES | WGNSSK 2020 | 891
Figure 17.5.8. Sole in 27.4. Abundance in log scale by cohort (in the x axis) and age (coloured lines) for the SNS index of abundance (2004-2019).
892 | ICES SCIENTIFIC REPORTS 2:61 | ICES
Figure 17.6.1. Sole in 27.4. Estimates time series of recruitment at age 1 (in thousands), spawning biomass (in tonnes) and fishing mortality (as average of ages 2 to 6), together with total catch (in tonnes). Grey bands show the 95% uncer-tainty estimate, computed as two times the standard deviation.
ICES | WGNSSK 2020 | 893
Figure 17.6.2. Sole in 27.4. Estimates of recruitment at age 1 (in thousands) and spawning biomass (in tonnes), connected in time. Labels refer to the year in which recruitment was observed.
894 | ICES SCIENTIFIC REPORTS 2:61 | ICES
Figure 17.6.3. Sole in 27.4. Estimated proportions of spawning biomass by age and year.
ICES | WGNSSK 2020 | 895
Figure 17.6.4. Residuals of model fit to the four sources of data: BTS and SNS indices of abundance, landings-at-age (land-ings.n) and discards-ta-age (discards.n). Residuals in log scale are standardized by the estimated standard deviation.
896 | ICES SCIENTIFIC REPORTS 2:61 | ICES
Figure 17.6.5. Sole in 27.4. Retrospective patterns in estimated age 1 recruitment, spawning biomass and mean fishing mortality, computed over five one-year steps.
ICES | WGNSSK 2020 | 897
Figure 17.6.6. Leave-one-out analysis of the AAP model run.
898 | ICES SCIENTIFIC REPORTS 2:61 | ICES
Figure 17.6.7. Sole in 27.4. Estimated standard deviations of the partial model likelihood by age and per each component.


