Embed Size (px)
Citation preview
@>
4 * % + ) !& # >
-3(&4,&4'6(##".&!'10'!3"$$0,!3'";6$1,#(#,1&
& 04 * % & ( # 3 5 # " ! 26 & ! H # % " 0 '% # 3 %3 0 6 H # - & ! ' (% ' # I 5 # 4 6 " " !),' H# #% ' ( # (,63" % 2 # I 5 # J ! ' ' !) )
%LTHOUGH EL VARAL IS in no sense a “shell mound,” the shells of mollusks and gastropods are common there. In a series of deposits
from late in the occupation of the mound, shells out-numbered sherds by a considerable margin. In earlier deposits, sherds were likely to outnumber shells. These two classes of evidence together constitute the bulk of materials recovered from the site. We begin with shells in the presentation of El Varal artifacts because patterns of shellfish exploitation provide the basis for a chronological division of deposits alterna-tive to the stratigraphic periods presented in Chapter 3. The “shell phases” defined here will be referred to repeatedly throughout the remainder of the volume. We use “periods” for stratigraphic divisions and “phases” for shell-based divisions in the hopes of avoiding confusion between the two schemes. Both, however, refer solely to the internal stratigraphy of the Vásquez Mound. Thus, the shell phases are not formal “phases” in the usual archaeological sense (as is, for example, the Jocotal phase).
Shells were identified by Gagiu, and stratigraphic analysis was conducted by Lesure. Information on habitat is provided by isotopic analysis of clam shells conducted by Kennett and Culleton (see also Chapter 13). Most common and consistently represented were four bivalves: the ark shell, Anadara grandis (MNI
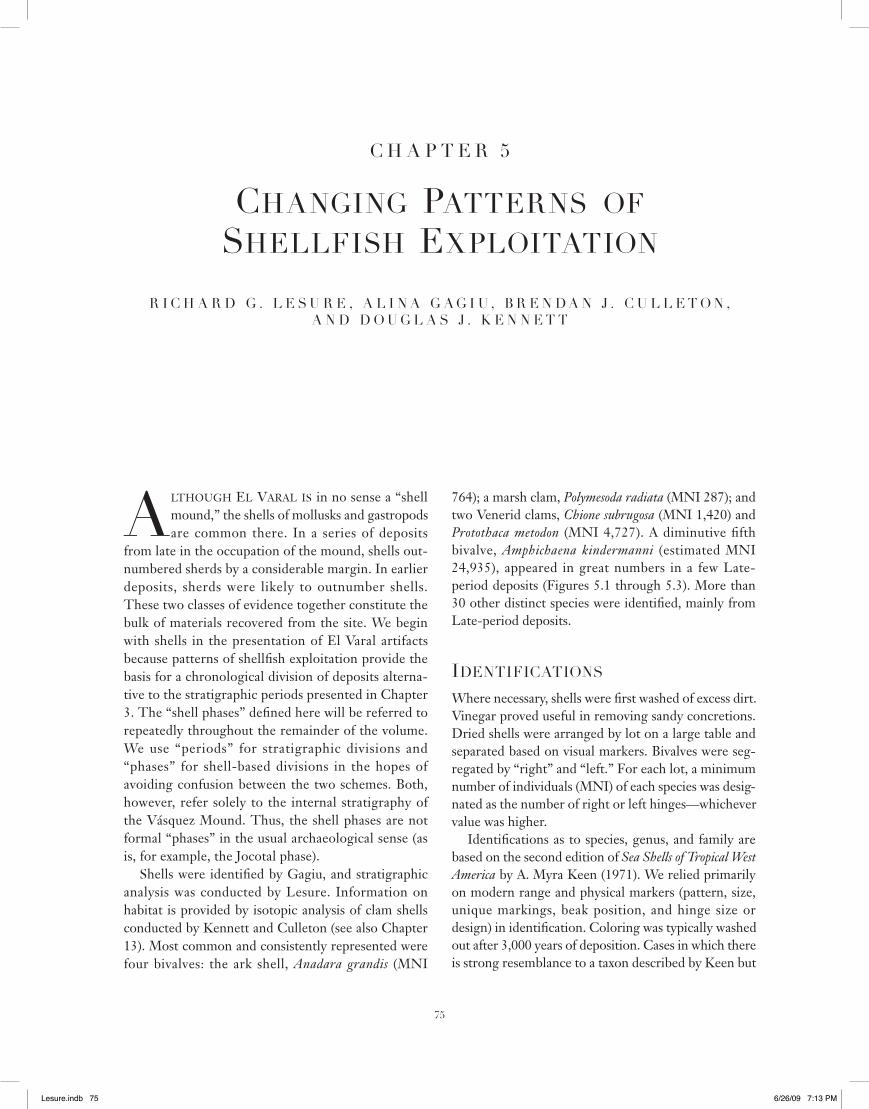
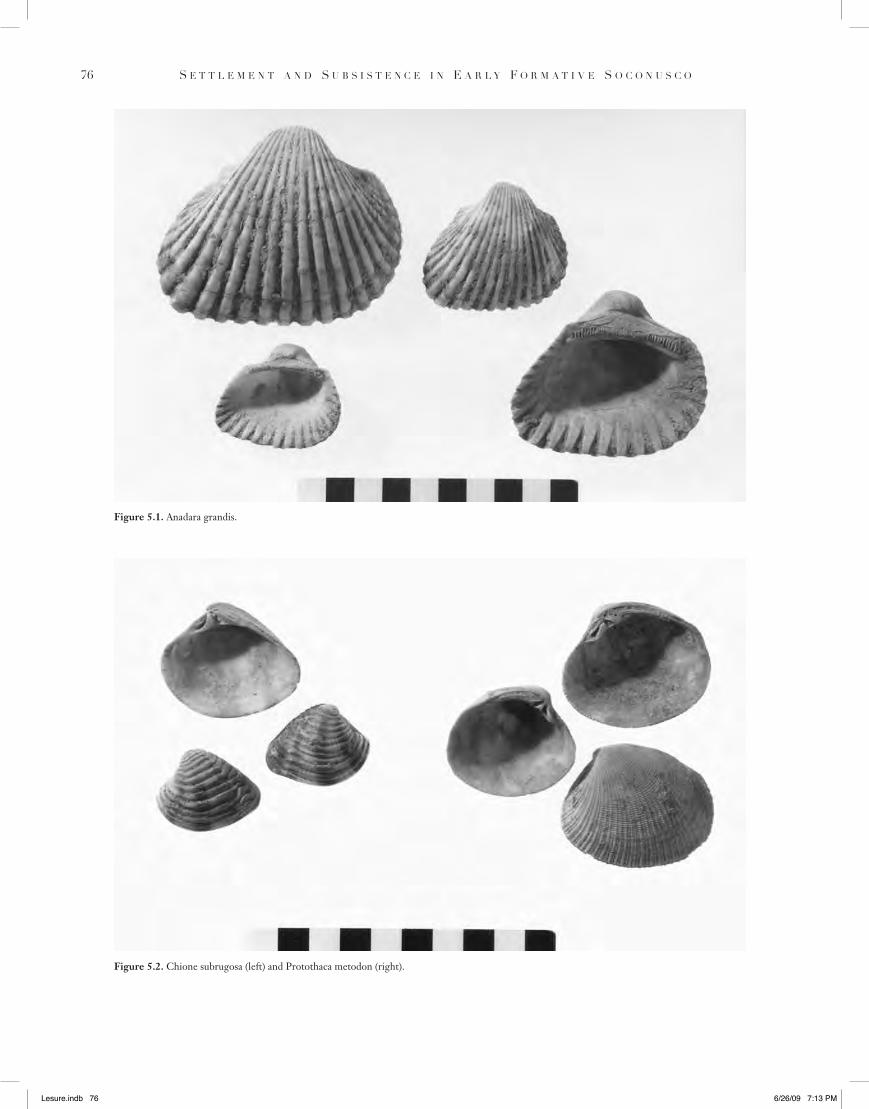
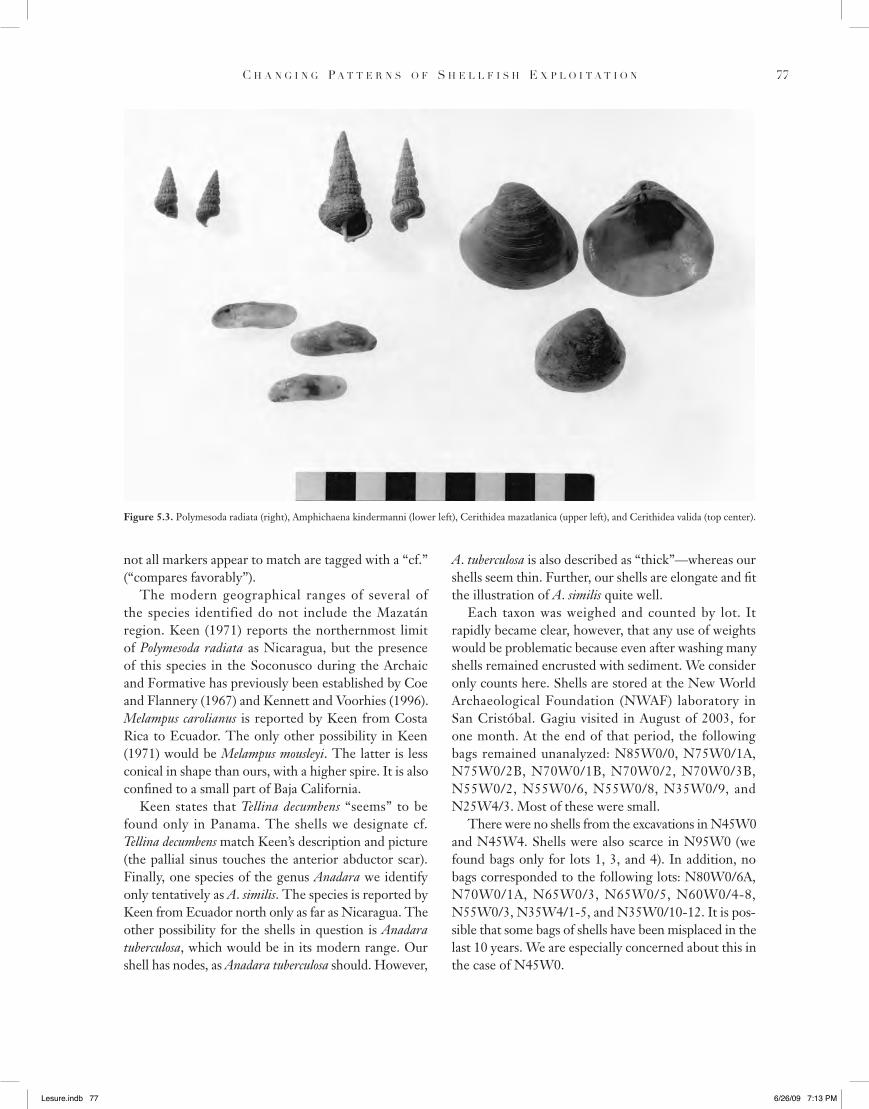
764); a marsh clam, Polymesoda radiata (MNI 287); and two Venerid clams, Chione subrugosa (MNI 1,420) and Protothaca metodon (MNI 4,727). A diminutive fifth bivalve, Amphichaena kindermanni (estimated MNI 24,935), appeared in great numbers in a few Late-period deposits (Figures 5.1 through 5.3). More than 30 other distinct species were identified, mainly from Late-period deposits.
,)"&#,0,-(#,1&!
Where necessary, shells were first washed of excess dirt. Vinegar proved useful in removing sandy concretions. Dried shells were arranged by lot on a large table and separated based on visual markers. Bivalves were seg-regated by “right” and “left.” For each lot, a minimum number of individuals (MNI) of each species was desig-nated as the number of right or left hinges—whichever value was higher.
Identifications as to species, genus, and family are based on the second edition of Sea Shells of Tropical West America by A. Myra Keen (1971). We relied primarily on modern range and physical markers (pattern, size, unique markings, beak position, and hinge size or design) in identification. Coloring was typically washed out after 3,000 years of deposition. Cases in which there is strong resemblance to a taxon described by Keen but
!"#$%"&'()*+++28 -./-.01+++23,4+56
! " # # $ " % " & # ' ( & ) ' ! * + ! , ! # " & - " ' , & ' " ( . $ / ' 01 . % ( # , 2 " ' ! 1 - 1 & * ! - 1@?
Figure 5.1. Anadara grandis.
Figure 5.2. Chione subrugosa (left) and Protothaca metodon (right).
!"#$%"&'()*+++2- -./-.01+++23,4+56
@@- 3 ( & 4 , & 4 ' 6( # # " . & ! ' 1 0 ' ! 3 " $ $ 0 , ! 3 ' " ; 6 $ 1 , # ( # , 1 &
A. tuberculosa is also described as “thick”—whereas our shells seem thin. Further, our shells are elongate and fit the illustration of A. similis quite well.
Each taxon was weighed and counted by lot. It rapidly became clear, however, that any use of weights would be problematic because even after washing many shells remained encrusted with sediment. We consider only counts here. Shells are stored at the New World Archaeological Foundation (NWAF) laboratory in San Cristóbal. Gagiu visited in August of 2003, for one month. At the end of that period, the following bags remained unanalyzed: N85W0/0, N75W0/1A, N75W0/2B, N70W0/1B, N70W0/2, N70W0/3B, N55W0/2, N55W0/6, N55W0/8, N35W0/9, and N25W4/3. Most of these were small.
There were no shells from the excavations in N45W0 and N45W4. Shells were also scarce in N95W0 (we found bags only for lots 1, 3, and 4). In addition, no bags corresponded to the following lots: N80W0/6A, N70W0/1A, N65W0/3, N65W0/5, N60W0/4-8, N55W0/3, N35W4/1-5, and N35W0/10-12. It is pos-sible that some bags of shells have been misplaced in the last 10 years. We are especially concerned about this in the case of N45W0.
not all markers appear to match are tagged with a “cf.” (“compares favorably”).
The modern geographical ranges of several of the species identified do not include the Mazatán region. Keen (1971) reports the northernmost limit of Polymesoda radiata as Nicaragua, but the presence of this species in the Soconusco during the Archaic and Formative has previously been established by Coe and Flannery (1967) and Kennett and Voorhies (1996). Melampus carolianus is reported by Keen from Costa Rica to Ecuador. The only other possibility in Keen (1971) would be Melampus mousleyi. The latter is less conical in shape than ours, with a higher spire. It is also confined to a small part of Baja California.
Keen states that Tellina decumbens “seems” to be found only in Panama. The shells we designate cf. Tellina decumbens match Keen’s description and picture (the pallial sinus touches the anterior abductor scar). Finally, one species of the genus Anadara we identify only tentatively as A. similis. The species is reported by Keen from Ecuador north only as far as Nicaragua. The other possibility for the shells in question is Anadara tuberculosa, which would be in its modern range. Our shell has nodes, as Anadara tuberculosa should. However,
Figure 5.3. Polymesoda radiata (right), Amphichaena kindermanni (lower left), Cerithidea mazatlanica (upper left), and Cerithidea valida (top center).
!"#$%"&'()*+++22 -./-.01+++23,4+56
! " # # $ " % " & # ' ( & ) ' ! * + ! , ! # " & - " ' , & ' " ( . $ / ' 01 . % ( # , 2 " ' ! 1 - 1 & * ! - 1@A
deposition of shell did not occur at a constant rate. It seems likely that site occupants engaged in occasional intensive harvesting along with low-level expedient collecting throughout the period of deposition of the Vásquez Mound. Nevertheless, we will also suggest that the character of intensive harvesting changed over time.
A conversion to meat-weight values points up the importance of A. grandis. If we discount A. kindermanni (which occurs primarily in just two lots), A. grandis makes up 10.6 percent of the four most common species by count. However, it contributes 33.8 percent of meat weight. The pattern is even stronger when the deposits are broken down by stratigraphic period (Table 5.3). A. grandis dominates meat weight everywhere, except in the Late period—when it is overtaken by P. metodon. If A. kindermannis is added to Late-period calculations, it contributes 12.7 percent of the meat weight (P. metodon falls to 59.8 percent).
The other notable patterns in Table 5.3 are the sharp decline in P. radiata after the Early period, the sharp increase in P. metodon in the Late period, and the fluc-tuations in percentages of A. grandis and C. subrugosa. A useful alternative perspective is provided by considering the density of shells per unit volume for each species (Table 5.4). The densities of A. grandis and C. subrugosa actually increase steadily from the Early through Late periods. Their decline in percentage in the Late period is the result of the extraordinary rise in the density of P. metodon.
Our Terminal-period sample is smaller than the others, derived from a single midden. In addition, in con-trast to other lots the shells from N95W0 were eroded and fragile because they had lain exposed a long time or because they were deposited in clay. It seems, nev-ertheless, that basic patterns continued from the Early through the Terminal period: one species (P. radiata) was important early on and dropped out over time, whereas the other three principal species formed a loose triad that increased in importance as P. radiata declined.
An analysis of these patterns lot by lot in the two stratigraphic sequences demonstrates that overall patterns are robust (in that they appear in both sequences), and reveals further detail. Characterizing both sequences are the gradual disappearance of P. radiata, the appearance of denser shell middens later in the sequence, and in the Late period itself a sharp rise in the importance of P. metodon and occasional deposition of vast numbers of A. kindermannis. Figures 5.4 and 5.5 show changes in “meat-weight density” by lot, with the principal species first lumped and then split.
Two lots, N80W0/3A and N25W4/2, contained huge numbers of A. kindermanni shells. All such shells in N25W4/2 were collected during excavation, but the numbers recovered were so great that counting was not feasible in the time available. A sample was counted and weighed. The remaining uncounted shells were then weighed, and an estimated total number calculated based on the count/weight of the sample. During exca-vation of N80W0/3A, A. kindermanni shells were not collected (but all other shell taxa were saved). A sample of matrix was collected with the idea of estimating the original number of A. kindermanni based on the fre-quencies of other taxa.
Estimates were made based on the most common other shells in the sample (C. subrugosa and P. metodon), and the two results were averaged to estimate the original number of A. kindermanni. The estimate is of the right order of magnitude, but it could be off by a few thousand of these tiny shells. Although our MNI values for A. kindermanni in these two lots are mere estimates, we have used these values in various analyses (as noted below). It has seemed important to note that very large numbers of the shells were harvested in a few isolated episodes late in the occupation of the mound. Shells modified by humans were separated and placed in labeled bags for further investigation (see Chapter 10).
Because there was considerable inter-species varia-tion in shell size, we devised the following method to estimate meat weights. We use it only to assess the relative distribution of meat weight among the five main shell species. No reliable relation to actual meat weights should be assumed. For each species, at least six valves were selected: two that appeared to be of larger size, two of smaller size, and two that seemed average in size. Plasticine was pressed into each valve, and then extracted and weighed. These were doubled to obtain heuristic meat-weight values for an entire two-valve animal. Averages and ranges were as follows: A. grandis 65 g (13.8–132.6 g), A. kindermanni 0.7 g (0.4–1.0 g), Chione subrugosa 8.6 g (4.2–15.0 g), P. radiata 12.4 g (2.6–21.6 g), and P. metodon 17.9 g (9.8–27.4 g).
4"&".($' 6(##".&!
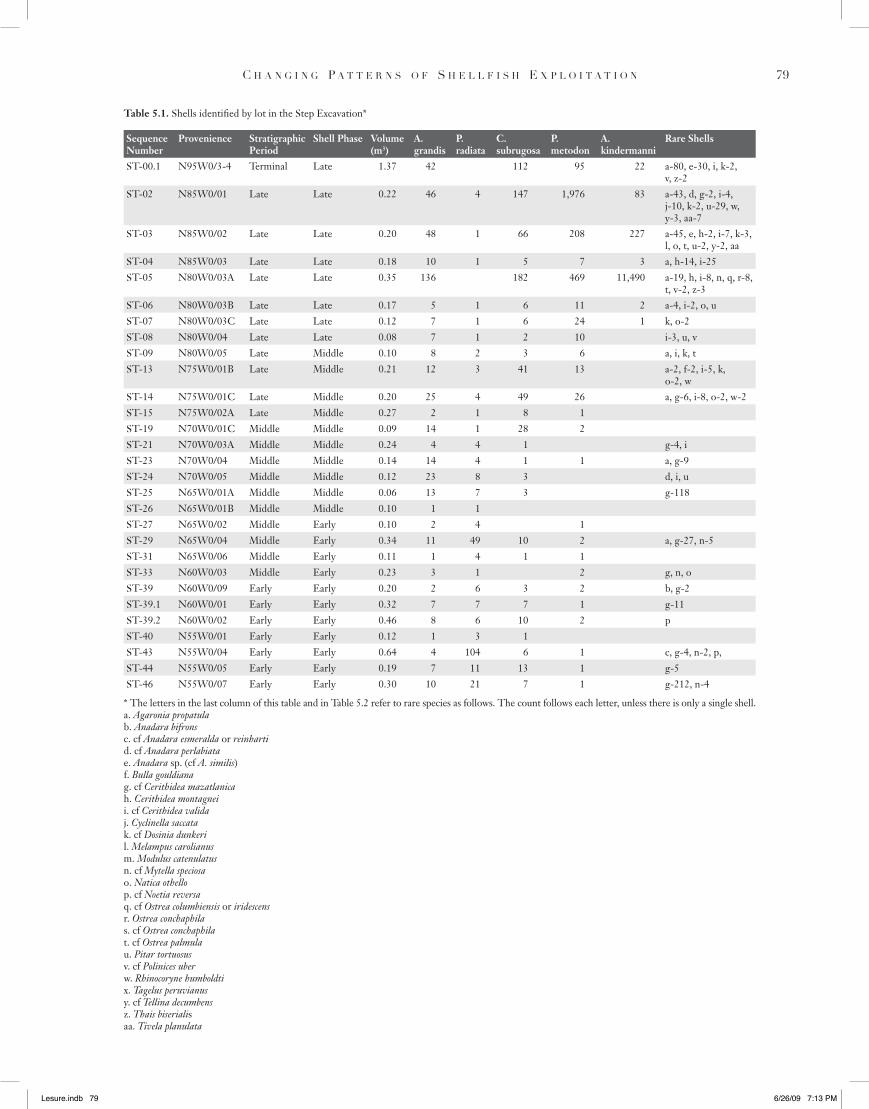
The raw data, consisting of MNI counts of each spe-cies by lot, are presented in Tables 5.1 and 5.2. The most striking pattern is the extraordinary variation in numbers of shells from lot to lot, especially in the later part of the sequence. The obvious implication is that
!"#$%"&'()*+++29 -./-.01+++23,4+56
@B- 3 ( & 4 , & 4 ' 6( # # " . & ! ' 1 0 ' ! 3 " $ $ 0 , ! 3 ' " ; 6 $ 1 , # ( # , 1 &
Table 5.1. Shells identified by lot in the Step Excavation*
SequenceNumber
Provenience Stratigraphic Period
Shell Phase Volume (m3)
A. grandis
P. radiata
C. subrugosa
P. metodon
A. kindermanni
Rare Shells
ST-00.1 N95W0/3-4 Terminal Late 1.37 42 112 95 22 a-80, e-30, i, k-2, v, z-2
ST-02 N85W0/01 Late Late 0.22 46 4 147 1,976 83 a-43, d, g-2, i-4, j-10, k-2, u-29, w, y-3, aa-7
ST-03 N85W0/02 Late Late 0.20 48 1 66 208 227 a-45, e, h-2, i-7, k-3, l, o, t, u-2, y-2, aa
ST-04 N85W0/03 Late Late 0.18 10 1 5 7 3 a, h-14, i-25ST-05 N80W0/03A Late Late 0.35 136 182 469 11,490 a-19, h, i-8, n, q, r-8,
t, v-2, z-3 ST-06 N80W0/03B Late Late 0.17 5 1 6 11 2 a-4, i-2, o, uST-07 N80W0/03C Late Late 0.12 7 1 6 24 1 k, o-2ST-08 N80W0/04 Late Late 0.08 7 1 2 10 i-3, u, vST-09 N80W0/05 Late Middle 0.10 8 2 3 6 a, i, k, tST-13 N75W0/01B Late Middle 0.21 12 3 41 13 a-2, f-2, i-5, k,
o-2, wST-14 N75W0/01C Late Middle 0.20 25 4 49 26 a, g-6, i-8, o-2, w-2ST-15 N75W0/02A Late Middle 0.27 2 1 8 1 ST-19 N70W0/01C Middle Middle 0.09 14 1 28 2 ST-21 N70W0/03A Middle Middle 0.24 4 4 1 g-4, iST-23 N70W0/04 Middle Middle 0.14 14 4 1 1 a, g-9ST-24 N70W0/05 Middle Middle 0.12 23 8 3 d, i, uST-25 N65W0/01A Middle Middle 0.06 13 7 3 g-118ST-26 N65W0/01B Middle Middle 0.10 1 1 ST-27 N65W0/02 Middle Early 0.10 2 4 1 ST-29 N65W0/04 Middle Early 0.34 11 49 10 2 a, g-27, n-5ST-31 N65W0/06 Middle Early 0.11 1 4 1 1 ST-33 N60W0/03 Middle Early 0.23 3 1 2 g, n, oST-39 N60W0/09 Early Early 0.20 2 6 3 2 b, g-2ST-39.1 N60W0/01 Early Early 0.32 7 7 7 1 g-11ST-39.2 N60W0/02 Early Early 0.46 8 6 10 2 pST-40 N55W0/01 Early Early 0.12 1 3 1 ST-43 N55W0/04 Early Early 0.64 4 104 6 1 c, g-4, n-2, p,ST-44 N55W0/05 Early Early 0.19 7 11 13 1 g-5ST-46 N55W0/07 Early Early 0.30 10 21 7 1 g-212, n-4
* The letters in the last column of this table and in Table 5.2 refer to rare species as follows. The count follows each letter, unless there is only a single shell.a. Agaronia propatulab. Anadara bifronsc. cf Anadara esmeralda or reinhartid. cf Anadara perlabiatae. Anadara sp. (cf A. similis)f. Bulla gouldianag. cf Cerithidea mazatlanicah. Cerithidea montagneii. cf Cerithidea validaj. Cyclinella saccatak. cf Dosinia dunkeril. Melampus carolianusm. Modulus catenulatusn. cf Mytella speciosao. Natica othellop. cf Noetia reversaq. cf Ostrea columbiensis or iridescensr. Ostrea conchaphilas. cf Ostrea conchaphilat. cf Ostrea palmulau. Pitar tortuosusv. cf Polinices uberw. Rhinocoryne humboldtix. Tagelus peruvianusy. cf Tellina decumbensz. Thais biserialisaa. Tivela planulata
!"#$%"&'()*+++21 -./-.01+++23,4+56
! " # # $ " % " & # ' ( & ) ' ! * + ! , ! # " & - " ' , & ' " ( . $ / ' 01 . % ( # , 2 " ' ! 1 - 1 & * ! - 1AC
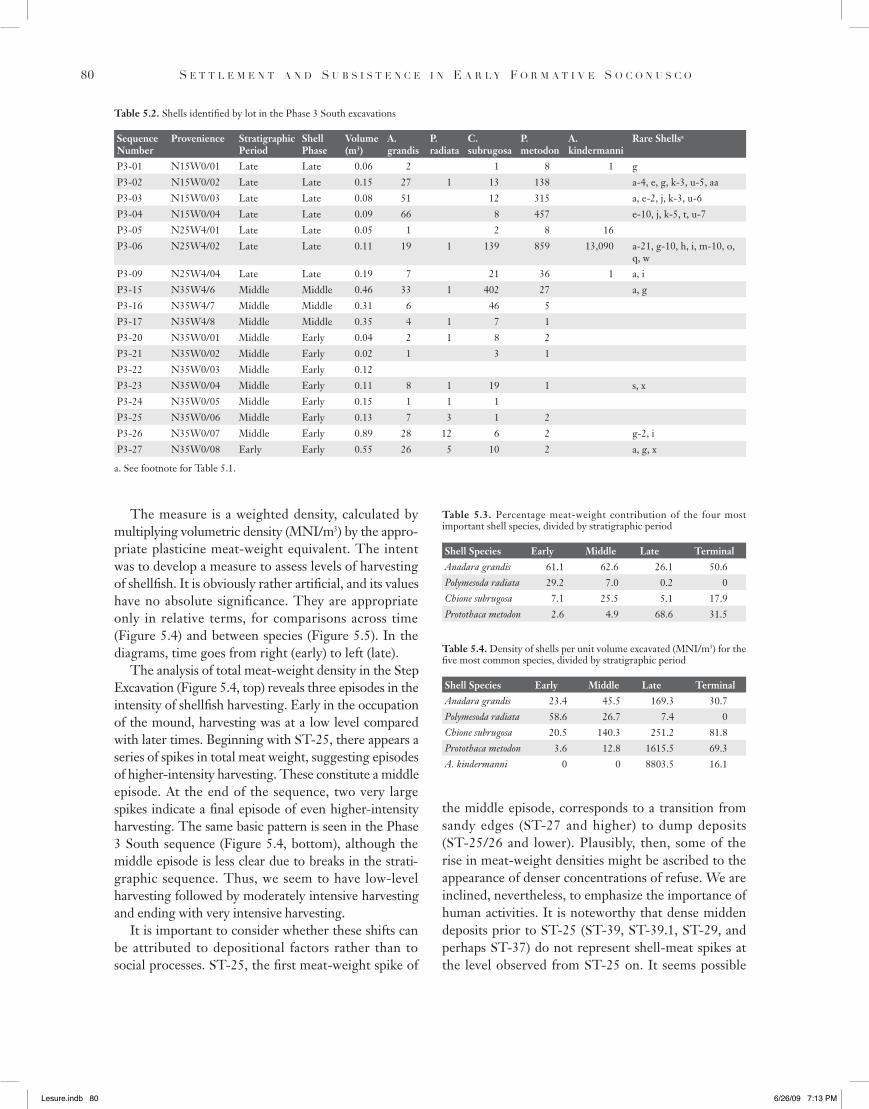
the middle episode, corresponds to a transition from sandy edges (ST-27 and higher) to dump deposits (ST-25/26 and lower). Plausibly, then, some of the rise in meat-weight densities might be ascribed to the appearance of denser concentrations of refuse. We are inclined, nevertheless, to emphasize the importance of human activities. It is noteworthy that dense midden deposits prior to ST-25 (ST-39, ST-39.1, ST-29, and perhaps ST-37) do not represent shell-meat spikes at the level observed from ST-25 on. It seems possible
The measure is a weighted density, calculated by multiplying volumetric density (MNI/m3) by the appro-priate plasticine meat-weight equivalent. The intent was to develop a measure to assess levels of harvesting of shellfish. It is obviously rather artificial, and its values have no absolute significance. They are appropriate only in relative terms, for comparisons across time (Figure 5.4) and between species (Figure 5.5). In the diagrams, time goes from right (early) to left (late).
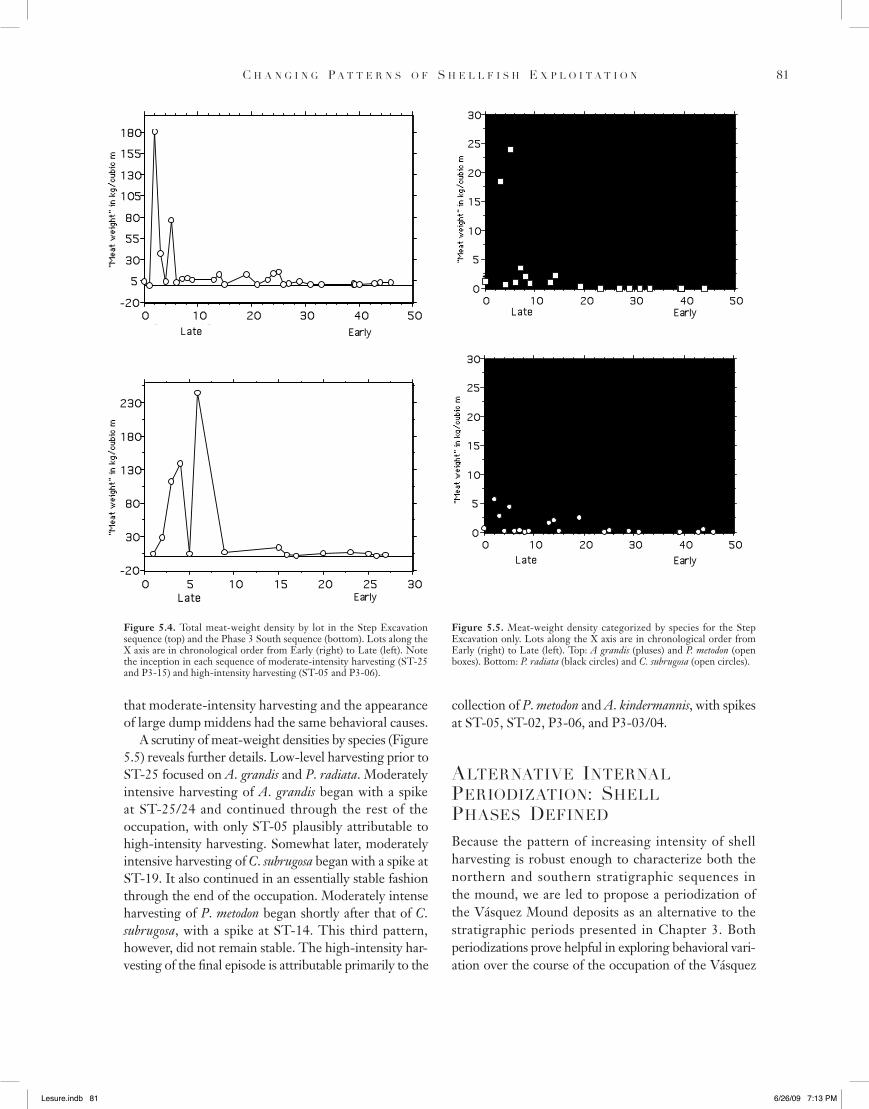
The analysis of total meat-weight density in the Step Excavation (Figure 5.4, top) reveals three episodes in the intensity of shellfish harvesting. Early in the occupation of the mound, harvesting was at a low level compared with later times. Beginning with ST-25, there appears a series of spikes in total meat weight, suggesting episodes of higher-intensity harvesting. These constitute a middle episode. At the end of the sequence, two very large spikes indicate a final episode of even higher-intensity harvesting. The same basic pattern is seen in the Phase 3 South sequence (Figure 5.4, bottom), although the middle episode is less clear due to breaks in the strati-graphic sequence. Thus, we seem to have low-level harvesting followed by moderately intensive harvesting and ending with very intensive harvesting.
It is important to consider whether these shifts can be attributed to depositional factors rather than to social processes. ST-25, the first meat-weight spike of
Table 5.2. Shells identified by lot in the Phase 3 South excavations
SequenceNumber
Provenience Stratigraphic Period
Shell Phase
Volume (m3)
A. grandis
P. radiata
C. subrugosa
P. metodon
A. kindermanni
Rare Shellsa
P3-01 N15W0/01 Late Late 0.06 2 1 8 1 gP3-02 N15W0/02 Late Late 0.15 27 1 13 138 a-4, e, g, k-3, u-5, aaP3-03 N15W0/03 Late Late 0.08 51 12 315 a, e-2, j, k-3, u-6P3-04 N15W0/04 Late Late 0.09 66 8 457 e-10, j, k-5, t, u-7P3-05 N25W4/01 Late Late 0.05 1 2 8 16P3-06 N25W4/02 Late Late 0.11 19 1 139 859 13,090 a-21, g-10, h, i, m-10, o,
q, wP3-09 N25W4/04 Late Late 0.19 7 21 36 1 a, i P3-15 N35W4/6 Middle Middle 0.46 33 1 402 27 a, gP3-16 N35W4/7 Middle Middle 0.31 6 46 5P3-17 N35W4/8 Middle Middle 0.35 4 1 7 1P3-20 N35W0/01 Middle Early 0.04 2 1 8 2 P3-21 N35W0/02 Middle Early 0.02 1 3 1P3-22 N35W0/03 Middle Early 0.12P3-23 N35W0/04 Middle Early 0.11 8 1 19 1 s, xP3-24 N35W0/05 Middle Early 0.15 1 1 1P3-25 N35W0/06 Middle Early 0.13 7 3 1 2 P3-26 N35W0/07 Middle Early 0.89 28 12 6 2 g-2, iP3-27 N35W0/08 Early Early 0.55 26 5 10 2 a, g, x
a. See footnote for Table 5.1.
Table 5.3. Percentage meat-weight contribution of the four most important shell species, divided by stratigraphic period
Shell Species Early Middle Late TerminalAnadara grandis 61.1 62.6 26.1 50.6Polymesoda radiata 29.2 7.0 0.2 0Chione subrugosa 7.1 25.5 5.1 17.9Protothaca metodon 2.6 4.9 68.6 31.5
Table 5.4. Density of shells per unit volume excavated (MNI/m3) for the five most common species, divided by stratigraphic period
Shell Species Early Middle Late TerminalAnadara grandis 23.4 45.5 169.3 30.7Polymesoda radiata 58.6 26.7 7.4 0Chione subrugosa 20.5 140.3 251.2 81.8Protothaca metodon 3.6 12.8 1615.5 69.3A. kindermanni 0 0 8803.5 16.1
!"#$%"&'()*+++90 -./-.01+++23,4+56
A<- 3 ( & 4 , & 4 ' 6( # # " . & ! ' 1 0 ' ! 3 " $ $ 0 , ! 3 ' " ; 6 $ 1 , # ( # , 1 &
collection of P. metodon and A. kindermannis, with spikes at ST-05, ST-02, P3-06, and P3-03/04.
($#".&(#,2"' ,&#".&($'6".,1),<(#,1&7' !3"$$'63(!"!')"0,&")
Because the pattern of increasing intensity of shell harvesting is robust enough to characterize both the northern and southern stratigraphic sequences in the mound, we are led to propose a periodization of the Vásquez Mound deposits as an alternative to the stratigraphic periods presented in Chapter 3. Both periodizations prove helpful in exploring behavioral vari-ation over the course of the occupation of the Vásquez
that moderate-intensity harvesting and the appearance of large dump middens had the same behavioral causes.
A scrutiny of meat-weight densities by species (Figure 5.5) reveals further details. Low-level harvesting prior to ST-25 focused on A. grandis and P. radiata. Moderately intensive harvesting of A. grandis began with a spike at ST-25/24 and continued through the rest of the occupation, with only ST-05 plausibly attributable to high-intensity harvesting. Somewhat later, moderately intensive harvesting of C. subrugosa began with a spike at ST-19. It also continued in an essentially stable fashion through the end of the occupation. Moderately intense harvesting of P. metodon began shortly after that of C. subrugosa, with a spike at ST-14. This third pattern, however, did not remain stable. The high-intensity har-vesting of the final episode is attributable primarily to the
Figure 5.4. Total meat-weight density by lot in the Step Excavation sequence (top) and the Phase 3 South sequence (bottom). Lots along the X axis are in chronological order from Early (right) to Late (left). Note the inception in each sequence of moderate-intensity harvesting (ST-25 and P3-15) and high-intensity harvesting (ST-05 and P3-06).
!
!
!
!
!
!
!
!
!
!
!
!
!
Figure 5.5. Meat-weight density categorized by species for the Step Excavation only. Lots along the X axis are in chronological order from Early (right) to Late (left). Top: A grandis (pluses) and P. metodon (open boxes). Bottom: P. radiata (black circles) and C. subrugosa (open circles).
!
!
!
!
!
!
!
!
!
!"#$%"&'()*+++9, -./-.01+++23,4+56
! " # # $ " % " & # ' ( & ) ' ! * + ! , ! # " & - " ' , & ' " ( . $ / ' 01 . % ( # , 2 " ' ! 1 - 1 & * ! - 1AD
(Michaels and Voorhies 1999; Voorhies 2004:121–129). C. subrugosa is reported from lagoons and intertidal mud flats near mangrove areas (Keen 1971; Cantera 1991; Fischer et al. 1995:219).
The other three primary species seem to prefer higher-salinity habitats. Rosalles-Lossener and Dix (1989) describe an episode of paralytic shell poisoning in Guatemala in July of 1987 involving A. kindermanni. The shells had been “collected in the intertidal zone or just below the low tide mark on the ocean beach.” Shells of P. metodon have been reported washed up on sandy beaches (Cantera 1991). A. grandis can be collected on sandbars at low tide (Keen 1971). A. grandis—along with mussels, slipper limpets (Crepidula sp.), and oys-ters—replaced a shell assemblage dominated by P.
Mound (see Chapter 14). We will refer to this second periodization as shell-harvesting phases or simply shell phases. Early (low-intensity harvesting) corresponds with ST-47 through ST-27 and P3-38 through P3-18. Middle (moderate-intensity harvesting) corresponds with ST-26 through ST-08 and P3-17 through P3-10. (ST-26 is stratigraphically contemporary with ST-25 and therefore becomes Middle. Likewise, ST-06 and ST-07 are part of the same midden as ST-05 and therefore become Late.)
Late (high-intensity harvesting) corresponds with ST-07 through ST-00 and P3-09 through P3-01. We also treat the Terminal stratigraphic period as a distinct shell phase for the purposes of other analyses in this volume. Because there is only a single sample of shells from N95W0, we have no knowledge of variability in that period. We thus do not attempt to characterize harvesting patterns in that phase.
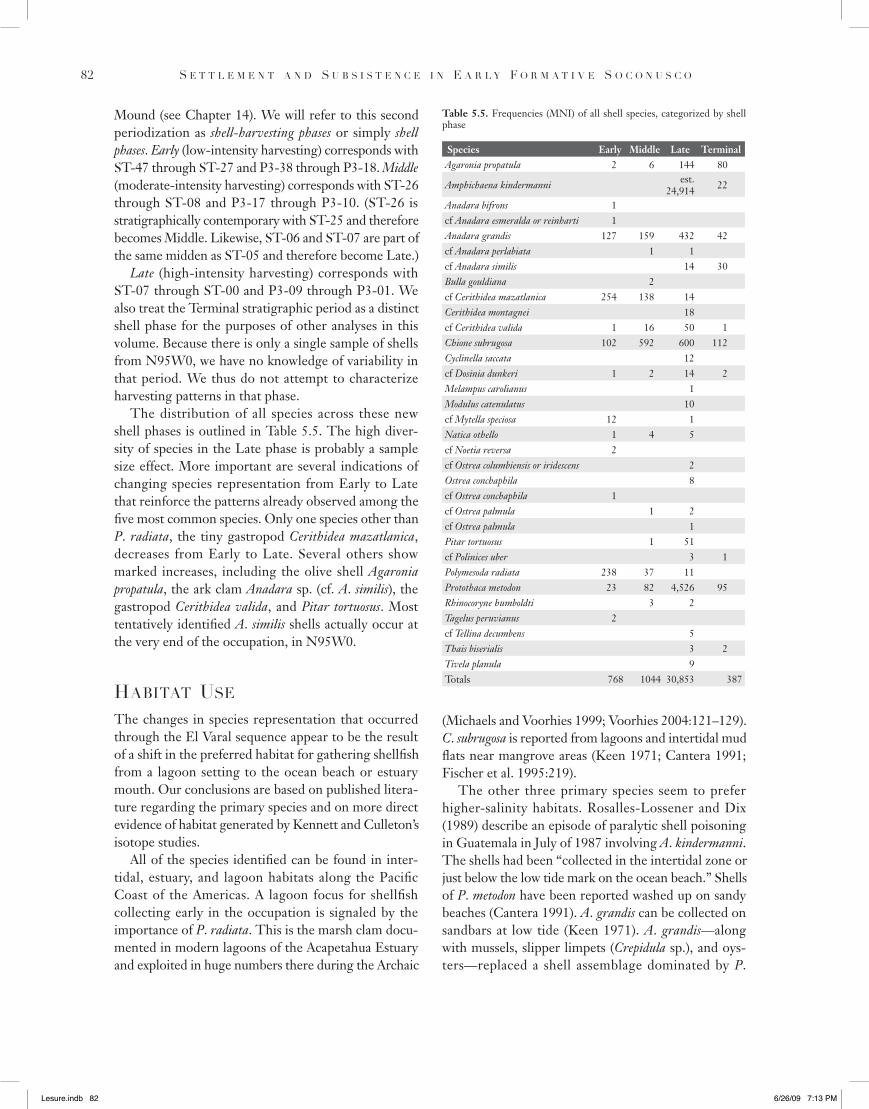
The distribution of all species across these new shell phases is outlined in Table 5.5. The high diver-sity of species in the Late phase is probably a sample size effect. More important are several indications of changing species representation from Early to Late that reinforce the patterns already observed among the five most common species. Only one species other than P. radiata, the tiny gastropod Cerithidea mazatlanica, decreases from Early to Late. Several others show marked increases, including the olive shell Agaronia propatula, the ark clam Anadara sp. (cf. A. similis), the gastropod Cerithidea valida, and Pitar tortuosus. Most tentatively identified A. similis shells actually occur at the very end of the occupation, in N95W0.
3(+,#(#'*!"
The changes in species representation that occurred through the El Varal sequence appear to be the result of a shift in the preferred habitat for gathering shellfish from a lagoon setting to the ocean beach or estuary mouth. Our conclusions are based on published litera-ture regarding the primary species and on more direct evidence of habitat generated by Kennett and Culleton’s isotope studies.
All of the species identified can be found in inter-tidal, estuary, and lagoon habitats along the Pacific Coast of the Americas. A lagoon focus for shellfish collecting early in the occupation is signaled by the importance of P. radiata. This is the marsh clam docu-mented in modern lagoons of the Acapetahua Estuary and exploited in huge numbers there during the Archaic
Table 5.5. Frequencies (MNI) of all shell species, categorized by shell phase
Species Early Middle Late TerminalAgaronia propatula 2 6 144 80
Amphichaena kindermanni est. 24,914 22
Anadara bifrons 1cf Anadara esmeralda or reinharti 1Anadara grandis 127 159 432 42cf Anadara perlabiata 1 1cf Anadara similis 14 30Bulla gouldiana 2cf Cerithidea mazatlanica 254 138 14Cerithidea montagnei 18cf Cerithidea valida 1 16 50 1Chione subrugosa 102 592 600 112Cyclinella saccata 12cf Dosinia dunkeri 1 2 14 2Melampus carolianus 1Modulus catenulatus 10cf Mytella speciosa 12 1Natica othello 1 4 5cf Noetia reversa 2cf Ostrea columbiensis or iridescens 2Ostrea conchaphila 8cf Ostrea conchaphila 1cf Ostrea palmula 1 2cf Ostrea palmula 1Pitar tortuosus 1 51cf Polinices uber 3 1Polymesoda radiata 238 37 11Protothaca metodon 23 82 4,526 95Rhinocoryne humboldti 3 2Tagelus peruvianus 2cf Tellina decumbens 5Thais biserialis 3 2Tivela planula 9Totals 768 1044 30,853 387
!"#$%"&'()*+++9/ -./-.01+++23,4+56
A;- 3 ( & 4 , & 4 ' 6( # # " . & ! ' 1 0 ' ! 3 " $ $ 0 , ! 3 ' " ; 6 $ 1 , # ( # , 1 &
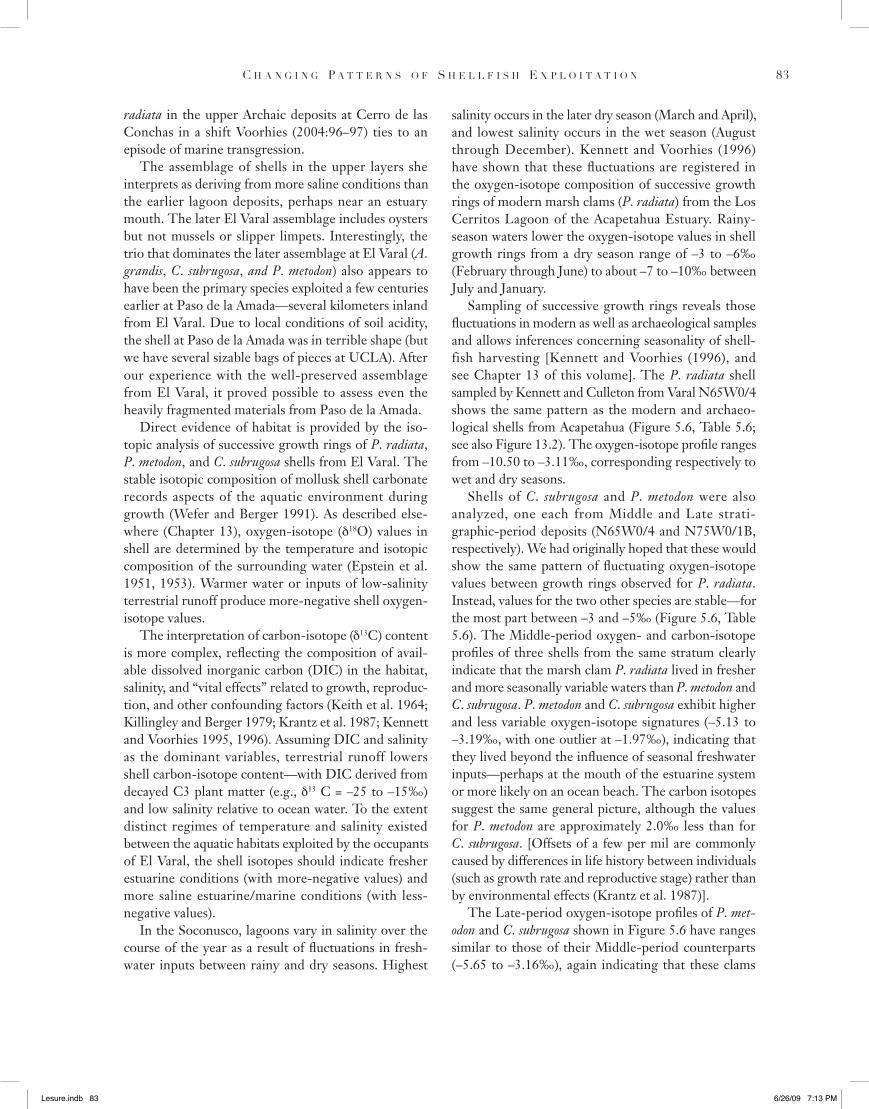
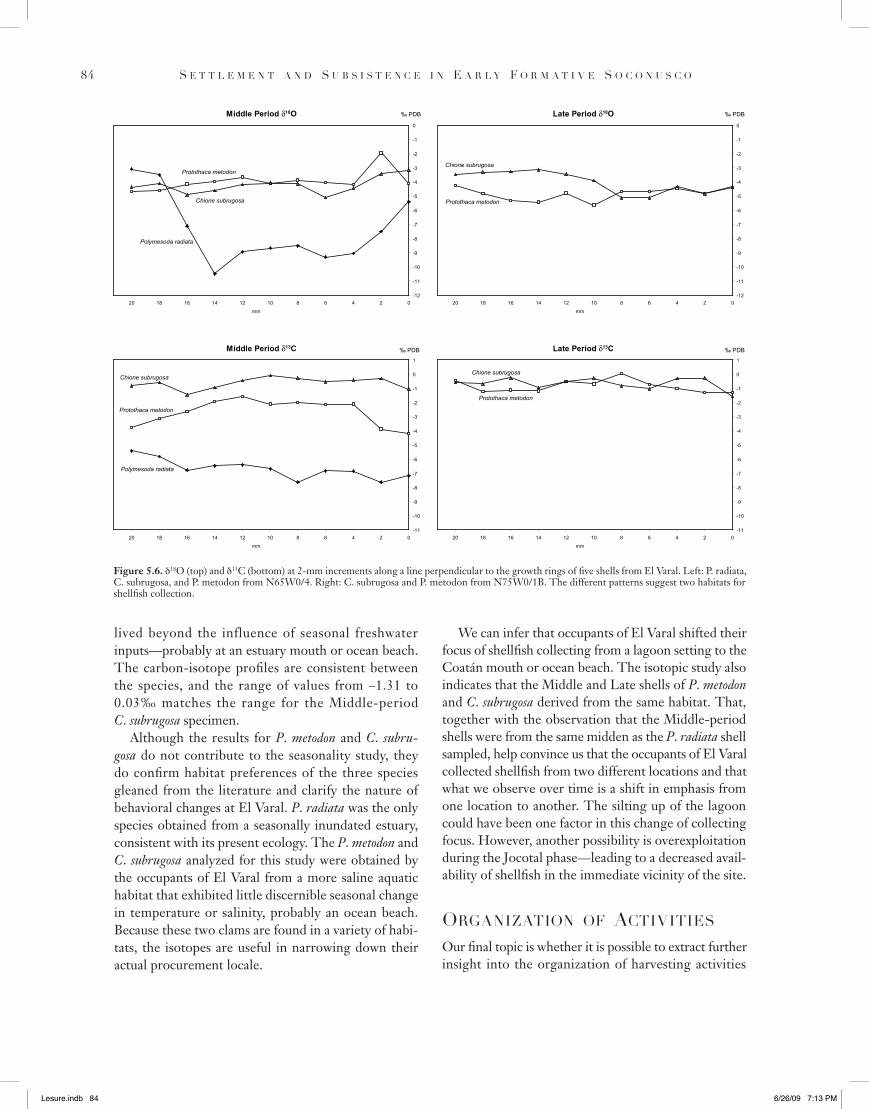
salinity occurs in the later dry season (March and April), and lowest salinity occurs in the wet season (August through December). Kennett and Voorhies (1996) have shown that these fluctuations are registered in the oxygen-isotope composition of successive growth rings of modern marsh clams (P. radiata) from the Los Cerritos Lagoon of the Acapetahua Estuary. Rainy-season waters lower the oxygen-isotope values in shell growth rings from a dry season range of –3 to –6‰ (February through June) to about –7 to –10‰ between July and January.
Sampling of successive growth rings reveals those fluctuations in modern as well as archaeological samples and allows inferences concerning seasonality of shell-fish harvesting [Kennett and Voorhies (1996), and see Chapter 13 of this volume]. The P. radiata shell sampled by Kennett and Culleton from Varal N65W0/4 shows the same pattern as the modern and archaeo-logical shells from Acapetahua (Figure 5.6, Table 5.6; see also Figure 13.2). The oxygen-isotope profile ranges from –10.50 to –3.11‰, corresponding respectively to wet and dry seasons.
Shells of C. subrugosa and P. metodon were also analyzed, one each from Middle and Late strati-graphic-period deposits (N65W0/4 and N75W0/1B, respectively). We had originally hoped that these would show the same pattern of fluctuating oxygen-isotope values between growth rings observed for P. radiata. Instead, values for the two other species are stable—for the most part between –3 and –5‰ (Figure 5.6, Table 5.6). The Middle-period oxygen- and carbon-isotope profiles of three shells from the same stratum clearly indicate that the marsh clam P. radiata lived in fresher and more seasonally variable waters than P. metodon and C. subrugosa. P. metodon and C. subrugosa exhibit higher and less variable oxygen-isotope signatures (–5.13 to –3.19‰, with one outlier at –1.97‰), indicating that they lived beyond the influence of seasonal freshwater inputs—perhaps at the mouth of the estuarine system or more likely on an ocean beach. The carbon isotopes suggest the same general picture, although the values for P. metodon are approximately 2.0‰ less than for C. subrugosa. [Offsets of a few per mil are commonly caused by differences in life history between individuals (such as growth rate and reproductive stage) rather than by environmental effects (Krantz et al. 1987)].
The Late-period oxygen-isotope profiles of P. met-odon and C. subrugosa shown in Figure 5.6 have ranges similar to those of their Middle-period counterparts (–5.65 to –3.16‰), again indicating that these clams
radiata in the upper Archaic deposits at Cerro de las Conchas in a shift Voorhies (2004:96–97) ties to an episode of marine transgression.
The assemblage of shells in the upper layers she interprets as deriving from more saline conditions than the earlier lagoon deposits, perhaps near an estuary mouth. The later El Varal assemblage includes oysters but not mussels or slipper limpets. Interestingly, the trio that dominates the later assemblage at El Varal (A. grandis, C. subrugosa, and P. metodon) also appears to have been the primary species exploited a few centuries earlier at Paso de la Amada—several kilometers inland from El Varal. Due to local conditions of soil acidity, the shell at Paso de la Amada was in terrible shape (but we have several sizable bags of pieces at UCLA). After our experience with the well-preserved assemblage from El Varal, it proved possible to assess even the heavily fragmented materials from Paso de la Amada.
Direct evidence of habitat is provided by the iso-topic analysis of successive growth rings of P. radiata, P. metodon, and C. subrugosa shells from El Varal. The stable isotopic composition of mollusk shell carbonate records aspects of the aquatic environment during growth (Wefer and Berger 1991). As described else-where (Chapter 13), oxygen-isotope (!18O) values in shell are determined by the temperature and isotopic composition of the surrounding water (Epstein et al. 1951, 1953). Warmer water or inputs of low-salinity terrestrial runoff produce more-negative shell oxygen-isotope values.
The interpretation of carbon-isotope (!13C) content is more complex, reflecting the composition of avail-able dissolved inorganic carbon (DIC) in the habitat, salinity, and “vital effects” related to growth, reproduc-tion, and other confounding factors (Keith et al. 1964; Killingley and Berger 1979; Krantz et al. 1987; Kennett and Voorhies 1995, 1996). Assuming DIC and salinity as the dominant variables, terrestrial runoff lowers shell carbon-isotope content—with DIC derived from decayed C3 plant matter (e.g., !13 C = –25 to –15‰) and low salinity relative to ocean water. To the extent distinct regimes of temperature and salinity existed between the aquatic habitats exploited by the occupants of El Varal, the shell isotopes should indicate fresher estuarine conditions (with more-negative values) and more saline estuarine/marine conditions (with less-negative values).
In the Soconusco, lagoons vary in salinity over the course of the year as a result of fluctuations in fresh-water inputs between rainy and dry seasons. Highest
!"#$%"&'()*+++94 -./-.01+++23,4+56
! " # # $ " % " & # ' ( & ) ' ! * + ! , ! # " & - " ' , & ' " ( . $ / ' 01 . % ( # , 2 " ' ! 1 - 1 & * ! - 1A=
We can infer that occupants of El Varal shifted their focus of shellfish collecting from a lagoon setting to the Coatán mouth or ocean beach. The isotopic study also indicates that the Middle and Late shells of P. metodon and C. subrugosa derived from the same habitat. That, together with the observation that the Middle-period shells were from the same midden as the P. radiata shell sampled, help convince us that the occupants of El Varal collected shellfish from two different locations and that what we observe over time is a shift in emphasis from one location to another. The silting up of the lagoon could have been one factor in this change of collecting focus. However, another possibility is overexploitation during the Jocotal phase—leading to a decreased avail-ability of shellfish in the immediate vicinity of the site.
1.4(&,<(#,1&' 10'(-#,2,#,"!
Our final topic is whether it is possible to extract further insight into the organization of harvesting activities
lived beyond the influence of seasonal freshwater inputs—probably at an estuary mouth or ocean beach. The carbon-isotope profiles are consistent between the species, and the range of values from –1.31 to 0.03‰ matches the range for the Middle-period C. subrugosa specimen.
Although the results for P. metodon and C. subru-gosa do not contribute to the seasonality study, they do confirm habitat preferences of the three species gleaned from the literature and clarify the nature of behavioral changes at El Varal. P. radiata was the only species obtained from a seasonally inundated estuary, consistent with its present ecology. The P. metodon and C. subrugosa analyzed for this study were obtained by the occupants of El Varal from a more saline aquatic habitat that exhibited little discernible seasonal change in temperature or salinity, probably an ocean beach. Because these two clams are found in a variety of habi-tats, the isotopes are useful in narrowing down their actual procurement locale.
Late Period 18O
12
11
10
9
8
7
6
5
4
3
2
1
0
02468101214161820
mm
Protothaca metodon
Chione subrugosa
‰ PDBMiddle Period 18O
12
11
10
9
8
7
6
5
4
3
2
1
0
02468101214161820
mm
Polymesoda radiata
Protothaca metodon
Chione subrugosa
‰ PDB
Late Period 13C
11
10
9
8
7
6
5
4
3
2
1
0
1
02468101214161820
mm
Protothaca metodon
Chione subrugosa
‰ PDBMiddle Period 13C
11
10
9
8
7
6
5
4
3
2
1
0
1
02468101214161820
mm
Polymesoda radiata
Protothaca metodon
Chione subrugosa
‰ PDB
Figure 5.6. !18O (top) and !13C (bottom) at 2-mm increments along a line perpendicular to the growth rings of five shells from El Varal. Left: P. radiata, C. subrugosa, and P. metodon from N65W0/4. Right: C. subrugosa and P. metodon from N75W0/1B. The different patterns suggest two habitats for shellfish collection.
!"#$%"&'()*+++97 -./-.01+++23,4+56
A>- 3 ( & 4 , & 4 ' 6( # # " . & ! ' 1 0 ' ! 3 " $ $ 0 , ! 3 ' " ; 6 $ 1 , # ( # , 1 &
Binford’s (1983) foraging/collecting continuum toward more logistical strategies?
These themes were briefly raised in Chapter 1, and are elaborated in Chapter 14. Our goal here is simply to begin assembling relevant evidence. If there was a shift toward task specialization, across our shell phases we might expect to see increasingly clear patterns of asso-ciation among the material indicators of any particular activity and decreasing association between the mate-rial indicators of different activities. In other words, items related to one specialized task should increas-ingly be found together—apart from items related to
from an analysis of lot-to-lot variation in shell densities. Thus far, we have identified a three-stage transition from low- to high-intensity harvesting—superimposed on a gradual shift in focus from lagoon to ocean beach or estuary-mouth habitat. One question that arises at this point is whether the trend toward higher-intensity harvesting involved a greater emphasis on specialized task groups (groups organized to concentrate on par-ticular activities and share the produce with others). In other words, do the changes in harvesting inten-sity observed in the Vásquez Mound deposits reflect increasing “specialization” of production or a shift on
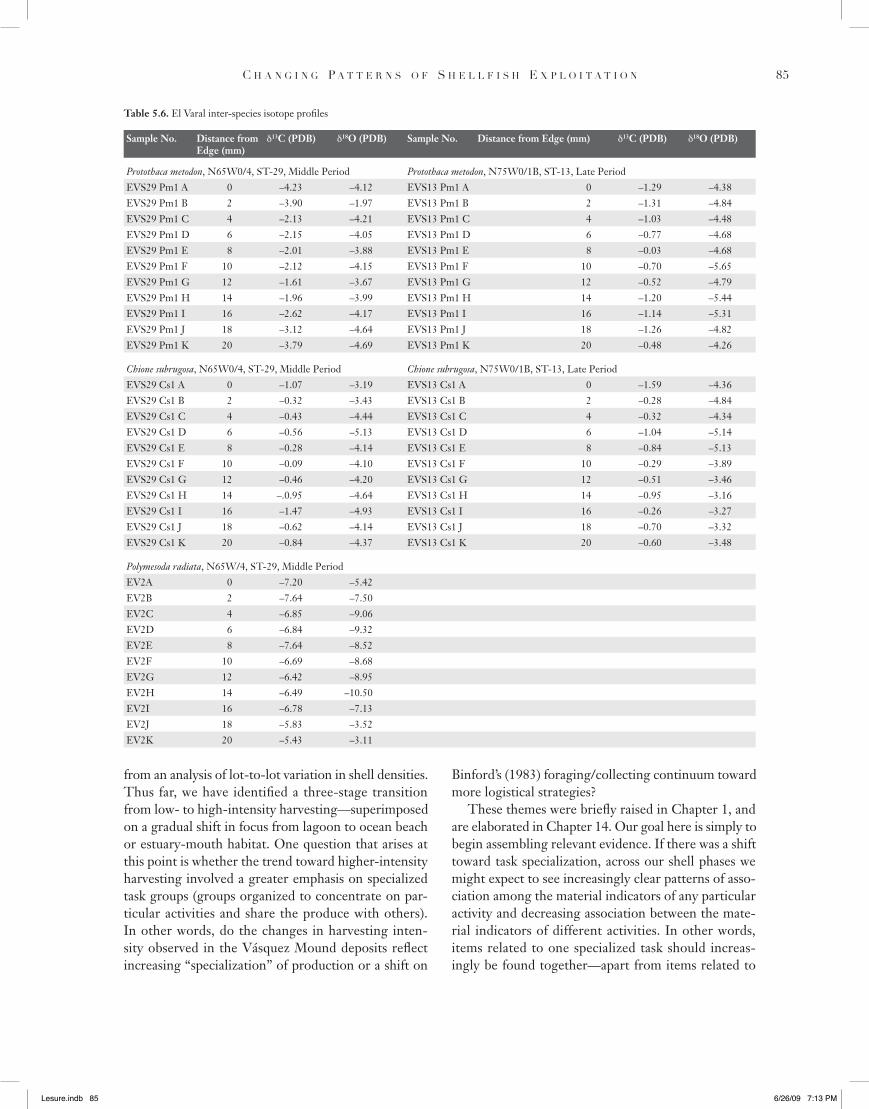
Table 5.6. El Varal inter-species isotope profiles
Sample No. Distance from Edge (mm)
!13C (PDB) !18O (PDB) Sample No. Distance from Edge (mm) !13C (PDB) !18O (PDB)
Protothaca metodon, N65W0/4, ST-29, Middle Period Protothaca metodon, N75W0/1B, ST-13, Late PeriodEVS29 Pm1 A 0 –4.23 –4.12 EVS13 Pm1 A 0 –1.29 –4.38EVS29 Pm1 B 2 –3.90 –1.97 EVS13 Pm1 B 2 –1.31 –4.84EVS29 Pm1 C 4 –2.13 –4.21 EVS13 Pm1 C 4 –1.03 –4.48EVS29 Pm1 D 6 –2.15 –4.05 EVS13 Pm1 D 6 –0.77 –4.68EVS29 Pm1 E 8 –2.01 –3.88 EVS13 Pm1 E 8 –0.03 –4.68EVS29 Pm1 F 10 –2.12 –4.15 EVS13 Pm1 F 10 –0.70 –5.65EVS29 Pm1 G 12 –1.61 –3.67 EVS13 Pm1 G 12 –0.52 –4.79EVS29 Pm1 H 14 –1.96 –3.99 EVS13 Pm1 H 14 –1.20 –5.44EVS29 Pm1 I 16 –2.62 –4.17 EVS13 Pm1 I 16 –1.14 –5.31EVS29 Pm1 J 18 –3.12 –4.64 EVS13 Pm1 J 18 –1.26 –4.82EVS29 Pm1 K 20 –3.79 –4.69 EVS13 Pm1 K 20 –0.48 –4.26
Chione subrugosa, N65W0/4, ST-29, Middle Period Chione subrugosa, N75W0/1B, ST-13, Late PeriodEVS29 Cs1 A 0 –1.07 –3.19 EVS13 Cs1 A 0 –1.59 –4.36EVS29 Cs1 B 2 –0.32 –3.43 EVS13 Cs1 B 2 –0.28 –4.84EVS29 Cs1 C 4 –0.43 –4.44 EVS13 Cs1 C 4 –0.32 –4.34EVS29 Cs1 D 6 –0.56 –5.13 EVS13 Cs1 D 6 –1.04 –5.14EVS29 Cs1 E 8 –0.28 –4.14 EVS13 Cs1 E 8 –0.84 –5.13EVS29 Cs1 F 10 –0.09 –4.10 EVS13 Cs1 F 10 –0.29 –3.89EVS29 Cs1 G 12 –0.46 –4.20 EVS13 Cs1 G 12 –0.51 –3.46EVS29 Cs1 H 14 –.0.95 –4.64 EVS13 Cs1 H 14 –0.95 –3.16EVS29 Cs1 I 16 –1.47 –4.93 EVS13 Cs1 I 16 –0.26 –3.27EVS29 Cs1 J 18 –0.62 –4.14 EVS13 Cs1 J 18 –0.70 –3.32EVS29 Cs1 K 20 –0.84 –4.37 EVS13 Cs1 K 20 –0.60 –3.48
Polymesoda radiata, N65W/4, ST-29, Middle PeriodEV2A 0 –7.20 –5.42EV2B 2 –7.64 –7.50EV2C 4 –6.85 –9.06EV2D 6 –6.84 –9.32EV2E 8 –7.64 –8.52EV2F 10 –6.69 –8.68EV2G 12 –6.42 –8.95EV2H 14 –6.49 –10.50EV2I 16 –6.78 –7.13EV2J 18 –5.83 –3.52EV2K 20 –5.43 –3.11
!"#$%"&'()*+++98 -./-.01+++23,4+56
! " # # $ " % " & # ' ( & ) ' ! * + ! , ! # " & - " ' , & ' " ( . $ / ' 01 . % ( # , 2 " ' ! 1 - 1 & * ! - 1A?
favored interpretation is that the Late deposits contain a record of occasional ambitious shell-collecting expe-ditions in which numerous shellfish were harvested, brought to the mound, processed, and the useless remains dumped immediately over the edge. Such a pattern would be consistent with increased “specializa-tion,” a question considered further in Chapter 14.
-1&-$*!,1&!
Our findings concerning shellfish exploitation at El Varal can be boiled down to two main points. First, throughout the occupation of the Vásquez Mound site occupants harvested shellfish in at least two habitats: a lagoon with significant seasonal fluctuations in salinity and an ocean beach or estuary mouth setting without such fluctuations. Over the course of the occupation, there was a shift in the primary emphasis of harvesting efforts from the lagoon to the beach. The change in harvesting patterns may have been related to an alteration of habitat (from lagoon to vegetated pampa) in the immediate vicinity of the site or to Jocotal-phase overexploitation of the lagoon
other specialized tasks. It is important to point out that other formation processes could yield similar archaeo-logical signatures. Change in the spatial distribution of activities or, perhaps more clearly, increasingly rapid deposition of materials could lead to greater variation of content between deposits.
Our analysis of associations among variables cen-ters on the volumetric densities (MNI/m3) of the four main shell species and the density in kg/m3 of sherds. The original distributions were in all cases strongly left-skewed. Computing logarithms of the density values produced more normal-looking distributions, and we worked with these derived values. Logarithms cannot be computed for density values of zero. We experimented with two ways of addressing this, first by simply leaving instances of zero density out of any particular analysis and second by replacing zeroes with the density value of 0.1 (slightly smaller than any of our observed densities). The analysis in Table 5.7 uses the first method. The second method produced broadly similar but not identical results. We also tried splitting deposits by stratigraphic periods and by shell phases. In these different versions of the analysis, we were particularly on the lookout for patterns that recurred in one analysis after another.
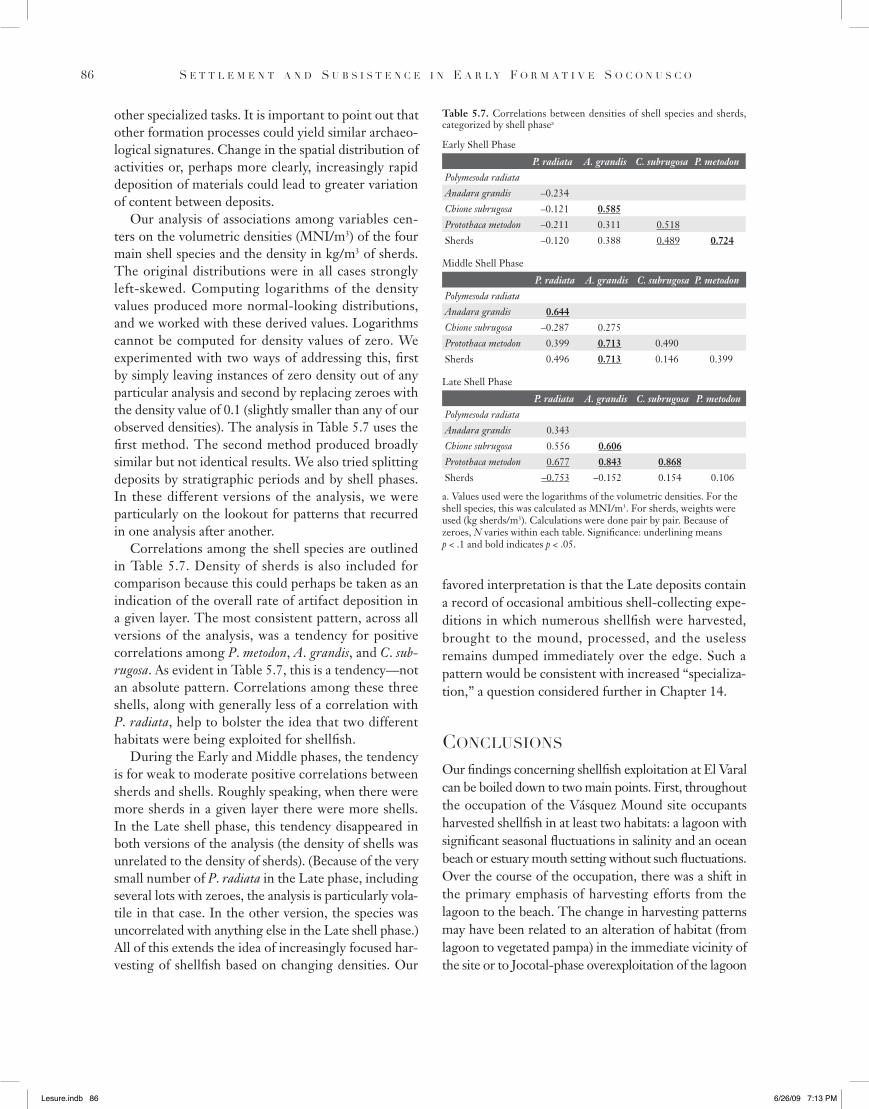
Correlations among the shell species are outlined in Table 5.7. Density of sherds is also included for comparison because this could perhaps be taken as an indication of the overall rate of artifact deposition in a given layer. The most consistent pattern, across all versions of the analysis, was a tendency for positive correlations among P. metodon, A. grandis, and C. sub-rugosa. As evident in Table 5.7, this is a tendency—not an absolute pattern. Correlations among these three shells, along with generally less of a correlation with P. radiata, help to bolster the idea that two different habitats were being exploited for shellfish.
During the Early and Middle phases, the tendency is for weak to moderate positive correlations between sherds and shells. Roughly speaking, when there were more sherds in a given layer there were more shells. In the Late shell phase, this tendency disappeared in both versions of the analysis (the density of shells was unrelated to the density of sherds). (Because of the very small number of P. radiata in the Late phase, including several lots with zeroes, the analysis is particularly vola-tile in that case. In the other version, the species was uncorrelated with anything else in the Late shell phase.) All of this extends the idea of increasingly focused har-vesting of shellfish based on changing densities. Our
Table 5.7. Correlations between densities of shell species and sherds, categorized by shell phasea
Early Shell Phase
P. radiata A. grandis C. subrugosa P. metodonPolymesoda radiataAnadara grandis –0.234Chione subrugosa –0.121 0.585Protothaca metodon –0.211 0.311 0.518Sherds –0.120 0.388 0.489 0.724
Middle Shell Phase
P. radiata A. grandis C. subrugosa P. metodonPolymesoda radiataAnadara grandis 0.644Chione subrugosa –0.287 0.275Protothaca metodon 0.399 0.713 0.490Sherds 0.496 0.713 0.146 0.399
Late Shell Phase
P. radiata A. grandis C. subrugosa P. metodonPolymesoda radiataAnadara grandis 0.343Chione subrugosa 0.556 0.606Protothaca metodon 0.677 0.843 0.868Sherds –0.753 –0.152 0.154 0.106
a. Values used were the logarithms of the volumetric densities. For the shell species, this was calculated as MNI/m3. For sherds, weights were used (kg sherds/m3). Calculations were done pair by pair. Because of zeroes, N varies within each table. Significance: underlining means p < .1 and bold indicates p < .05.
!"#$%"&'()*+++9- -./-.01+++23,4+56
A@- 3 ( & 4 , & 4 ' 6( # # " . & ! ' 1 0 ' ! 3 " $ $ 0 , ! 3 ' " ; 6 $ 1 , # ( # , 1 &
resource base (leading the site occupants to venture far-ther afield in search of shellfish).
Our second conclusion is that superimposed on this shift in habitat exploitation was a change in the scale of shellfish harvesting. The densities of shells per volume of deposit suggested a three-phase trajectory of low-level, moderate, and intensive harvesting. These form the basis of the shell-phase alternative to the stratigraphic periodization of the mound deposits. A statistical analysis of lot content divided by these three phases provided some evidence for an increase in the segregation of tasks over the course of occupation of the site. Tendencies toward positive correlation between shells and sherds decrease over the course of the occupation. Although these findings are consistent with a shift toward greater task specificity in the harvesting and processing of estuary sources, Lesure’s synthesis of the various strands of evidence (Chapter 14) does not reveal any significant change in the organization of production during the course of the occupation of the mound.
!"#$%"&'()*+++92 -./-.01+++23,4+56
!"##$"%"&#'(&)'!*+!,!#"&-"' ,&'"(.$/'01.%(#,2"'!1-1&*!-1
!"#$%&%"#%'(#)*!#+&,-"!.#,/#0')!&120)!#%22!.-"%3!#$%&0%)0,'
& 04* % & ( # 3 5 # " ! 26 & !
!(0 ),& # % ' ( # +& 0 '4 0 +% " # %6 ) *,&
- 1 # ! " & ' , & ! # , # * # " ' 1 0 ' ( . - 3 ( " 1 $ 1 4 /
* & , 2 " . ! , # / ' 1 0 ' - ( $ , 0 1 . & , ( 5 ' $ 1 ! ' ( & 4 " $ " !
!"#$%"&'()*+++4 -./-.01+++23,4+56


