Embed Size (px)
DESCRIPTION
پژوهش های جغرافیای طبیعی، شماره ۶۸، تابستان ۱۳۸۸
Citation preview
68 1388
32-15
–
–
:15/11/1386 :1/8/1387
1) TAPM( .
30 15 5 5
. PM-10 CO
) (
.
.
.
11 12 4 21
.
. 2 60 .
51
.
11 12 .
20 )10 (
.
: TAPM .
.
E- mail: [email protected] :09123841192
1. The Air Pollution Model 2. Index of Agreement
68 1388 16
.
.
7/7 ) 1385 (
. 2 )
1384 ( 500 5000 )25 ( 20
70 80
) 1376(
.
.
:
1. .
2. .
.
3. .
.
.
.
. 1300
:
) 1379 .(
.
) 1930 (
.
.
.
) 1379.(
17
1971 .
.
70 .
. 90
.
)2005 (
. )Co (
.
) 2005 (
PM10 NOx .
.
)2005 ( 2000
1999 .
.
15 .
.
)2001 (
.
.
)2006 (
. .
CO2 NO2
.
)2006 (
.
.
)2006 ( PM10 .
TAPM .
20
PM10 . TAPM
68 1388 18
.
)1378 (
.
)1383 (
. .
)2003 (
.
.
.
)1383 (
. MPDATA
. k10×2 .
.
.
.
.
.
.
.
.
.
.
.
.
19
TAPM
1) TAPM ( .
2) CSIRO ( .TAPM )
( ) 10 ( ) 2007 .(
3 .
.
. . 30
5 5 .
.
.
(TAPM)
) 2005( .TAPM
) 2007 .(
. 4 (WRF)
. .
.
:
1 . 5 . 6
.
.
2 .
. 75
.
1. The Air Pollution Model 2. Common Wealth Scientific Industrial Research Organization 3. Mesoscale 4. Weather Research and Forcasting 5. Terrain 6. Resolution
68 1388 20
3 . .
.
. ASCII
.
. ( 1
. (2
.
. ( 3 .
. ( 4 .
5 .
. 2000 2006
) /35 45 /51 08( ) /35 47 /51 37(
) /35 32 /51 11 ( ) /35 41 /51 05 ( ) /35 42
/51 20 ( .
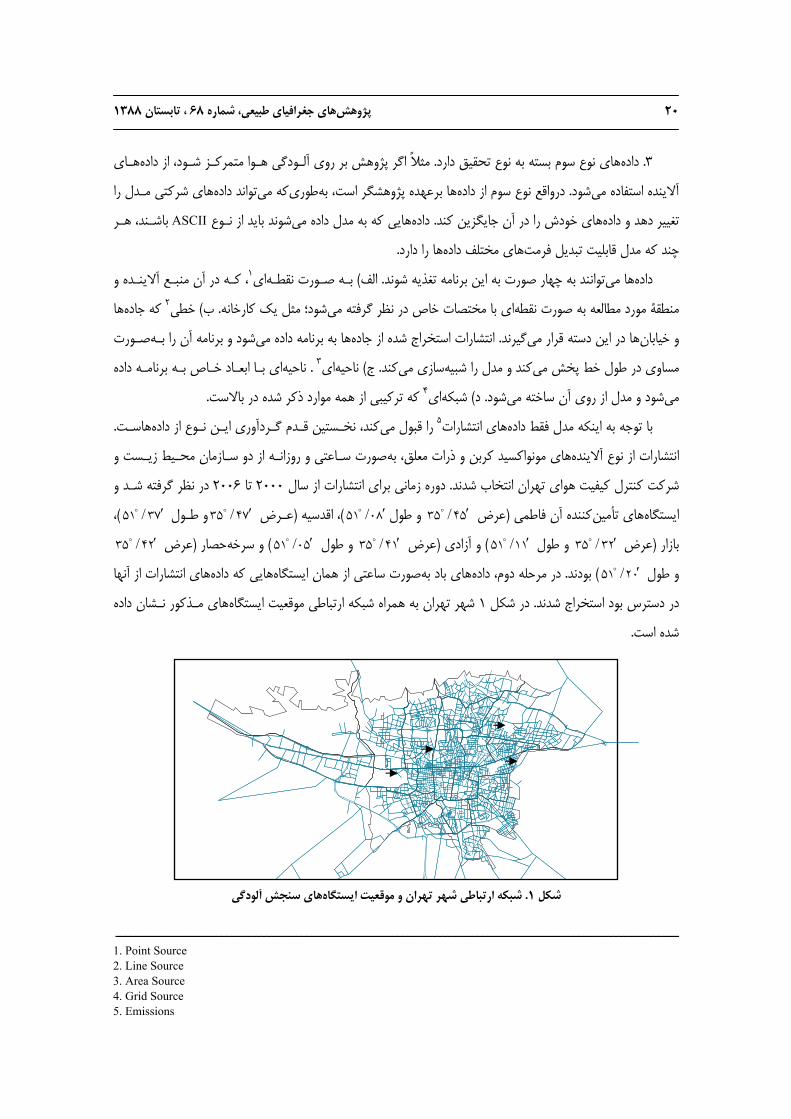
. 1
.
1 .
1. Point Source 2. Line Source 3. Area Source 4. Grid Source 5. Emissions
21
WRPLOT .
.
.
.
. .
)Uc ( .
Uc=3.41logp-11.6 ) 1981.(
P . 8
5 .
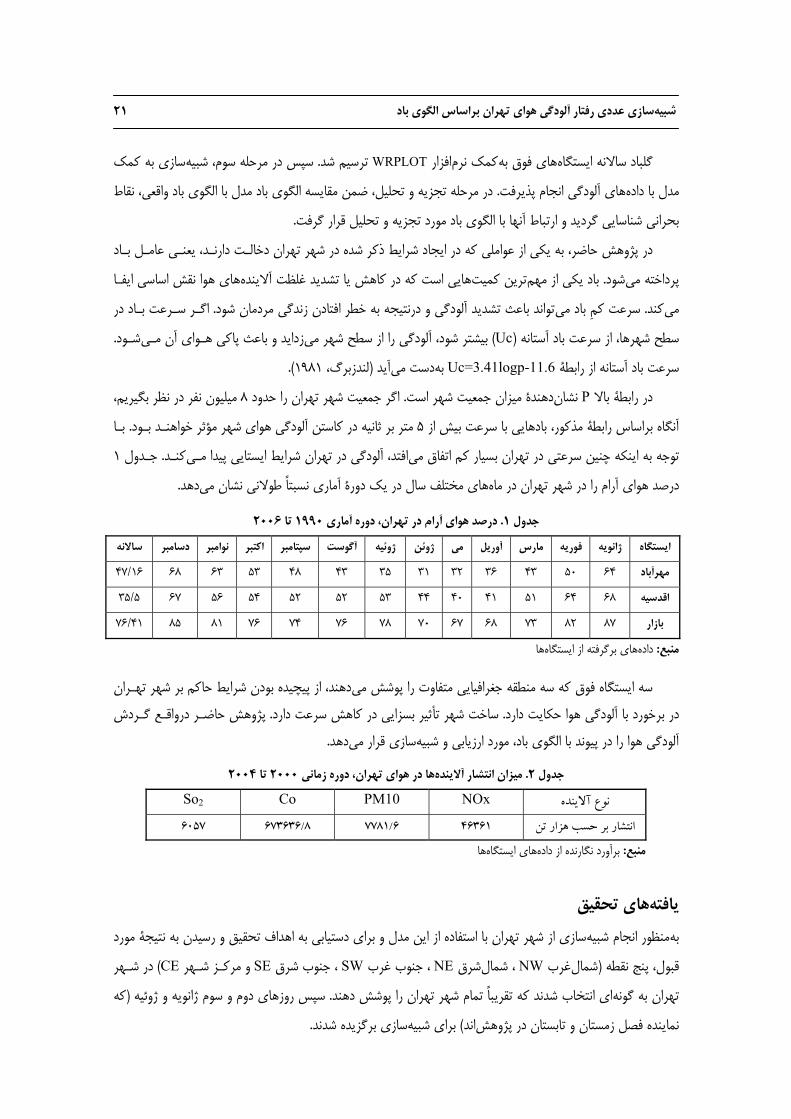
. 1
.
1 . 1990 2006
64 50 43 36 32 31 35 43 48 53 63 68 16/47
68 64 51 41 40 44 53 52 52 54 56 67 5/35
87 82 73 68 67 70 78 76 74 76 81 85 41/76
:
. .
.
2 . 2000 2004
NOx PM10 Co So2
46361 6/7781 8/673636 6057
:
) NW NE SW SE CE (
. )
( .
68 1388 22
.
) 2 ( 24
. 1 . 18
10 . 10
. 1 24
.
.
3 6 . 9
. 10
12 . 11 16
. 18
. 2003 2006
.
.
2006 ) 2 .(
.
.
5
.
.
1 . 2
. .
) 3 (
23
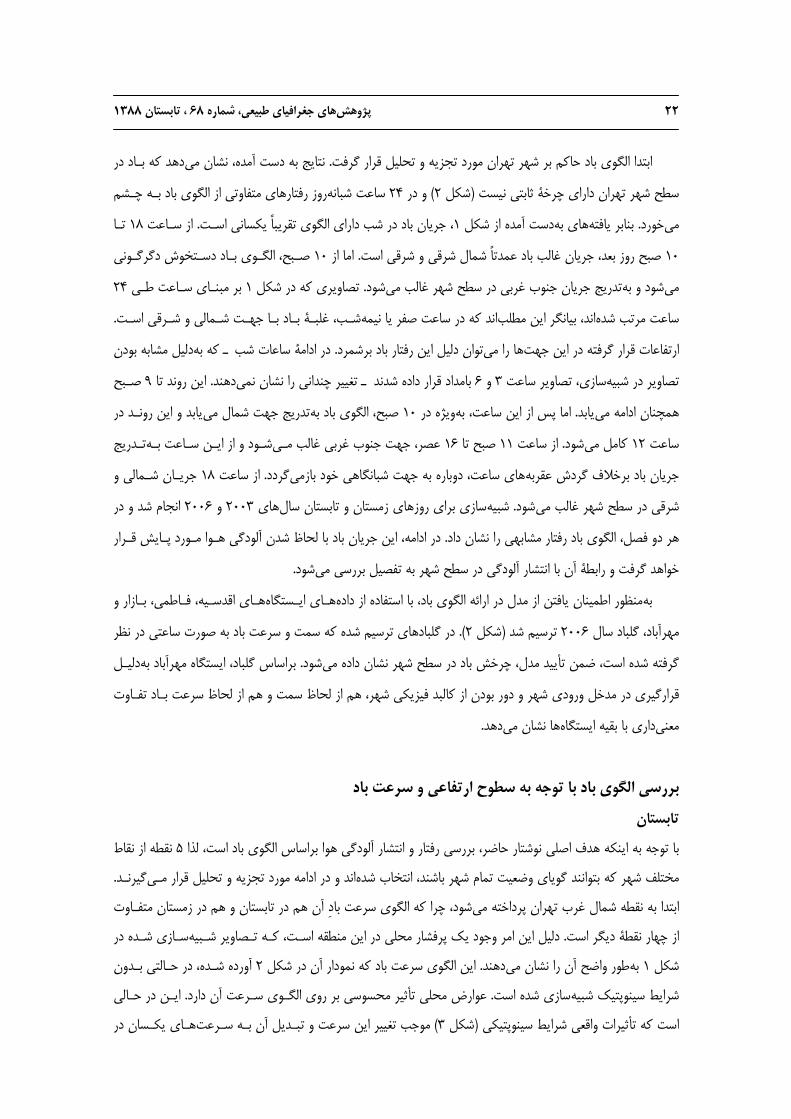
2 .
.
( ( 3 ( 6
( 10 ( 11 ( 1
( 4 ( 5 ( 8
2 . 10 24 )1 2006(
TAPM
68 1388 24
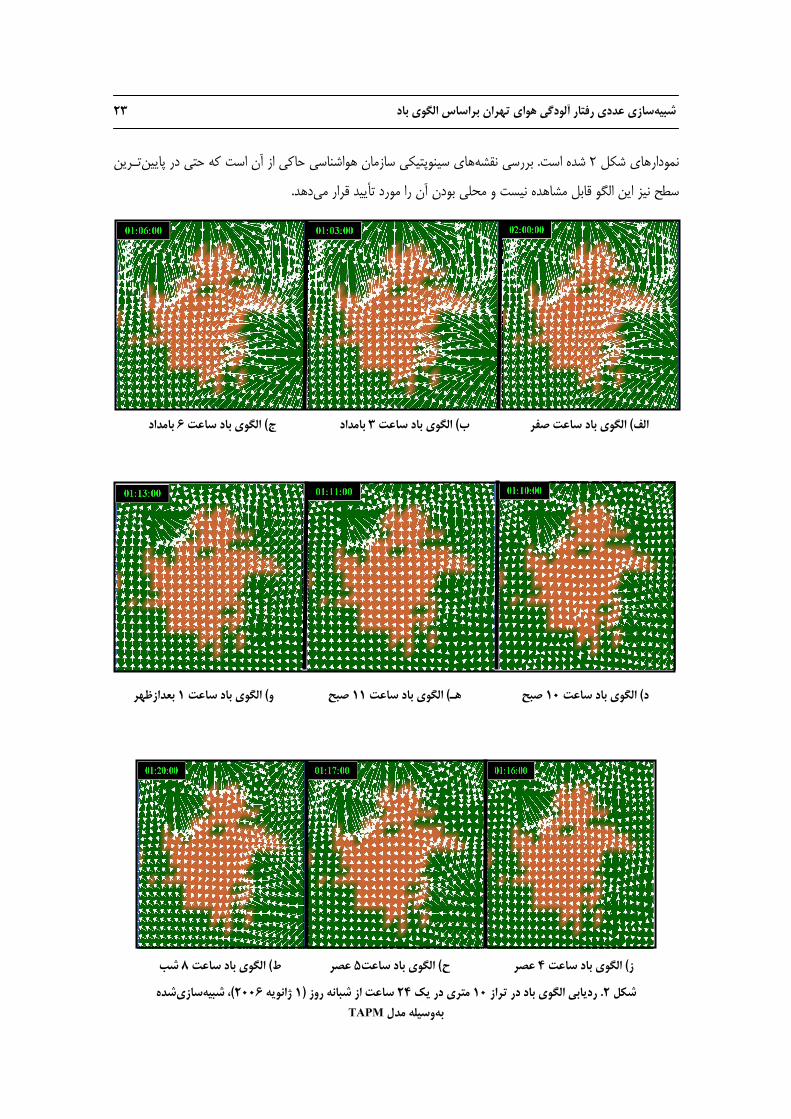
3 .
3 15
8000 . 1 2
. 12 ) 3 (
. .
.
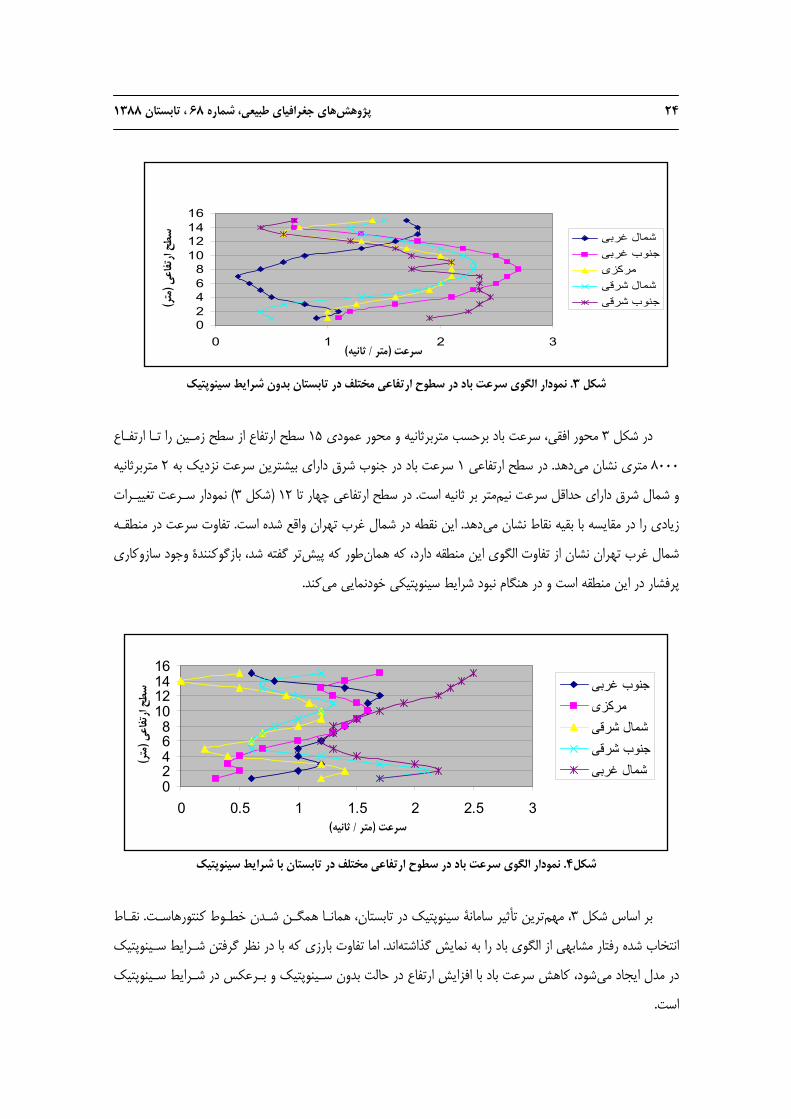
4.
3 .
.
.
02468
10121416
0 1 2 3
)(
)/(
02468
10121416
0 0.5 1 1.5 2 2.5 3
)(
)/(
25
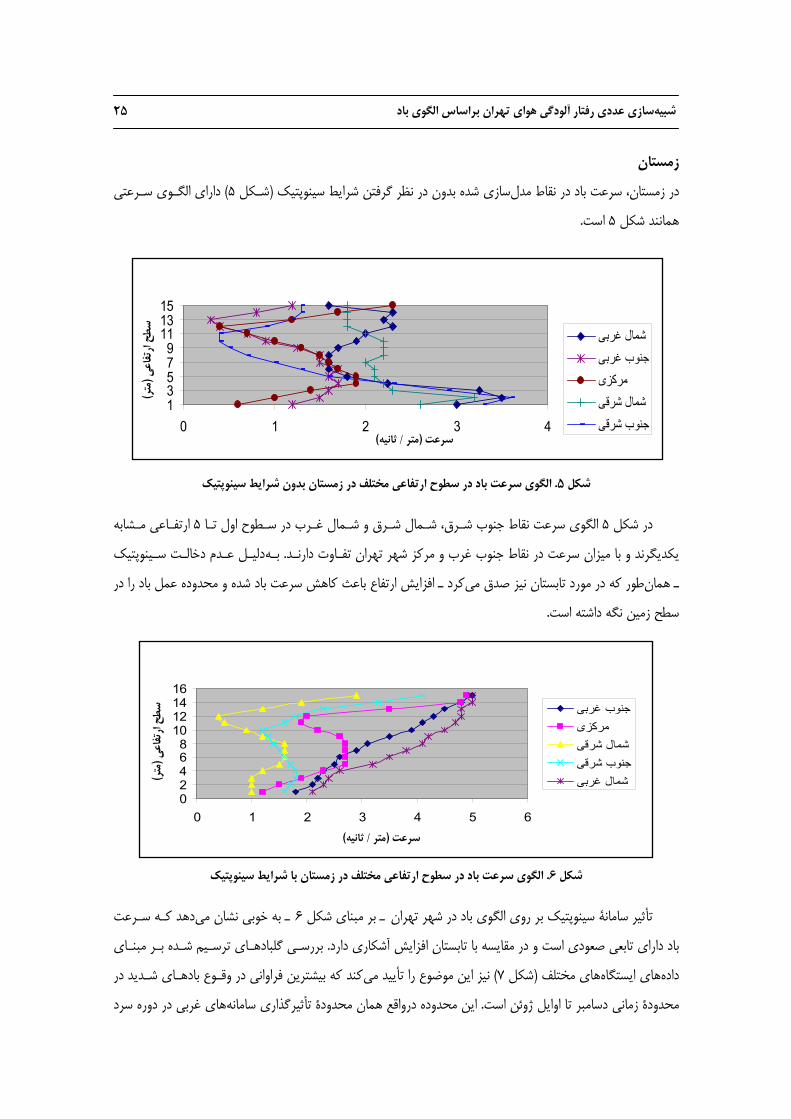
) 5 (
5 .
5 .
5 5
.
.
6 .
6
.
) 7 (
.
13579
111315
0 1 2 3 4
)(
)/(
02468
10121416
0 1 2 3 4 5 6
)(
)/(
68 1388 26
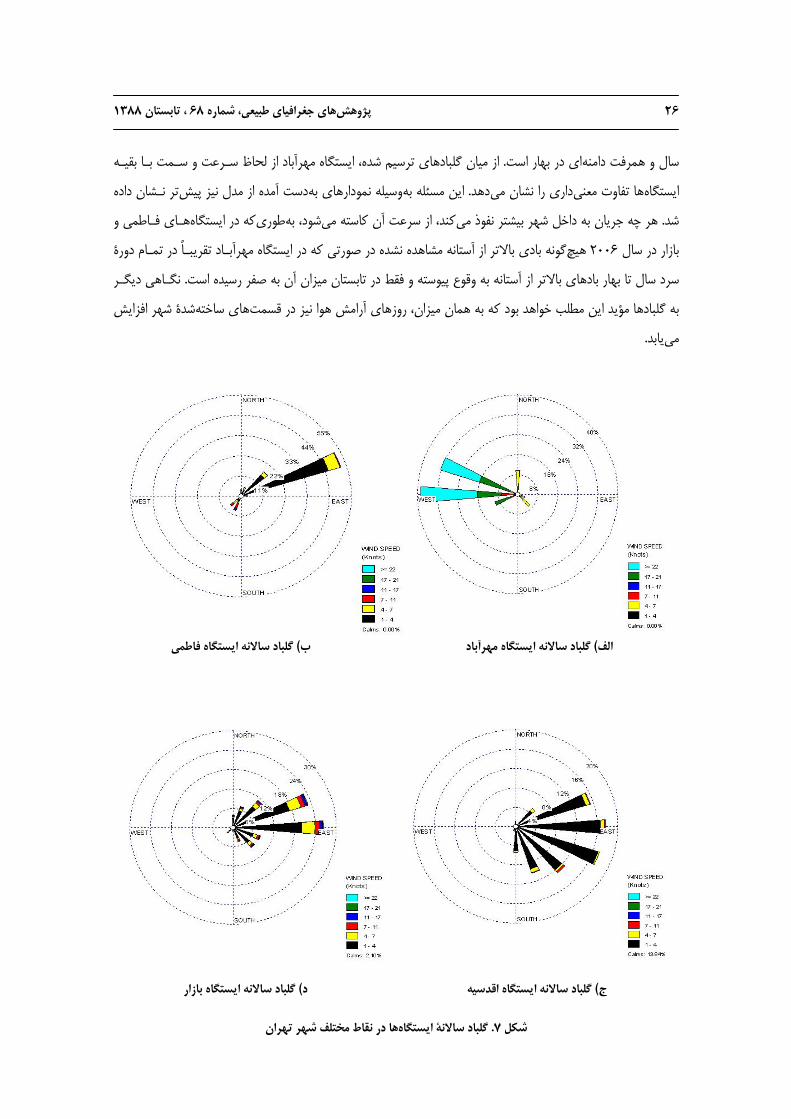
.
.
.
2006
.
.
( (
( (
7 .
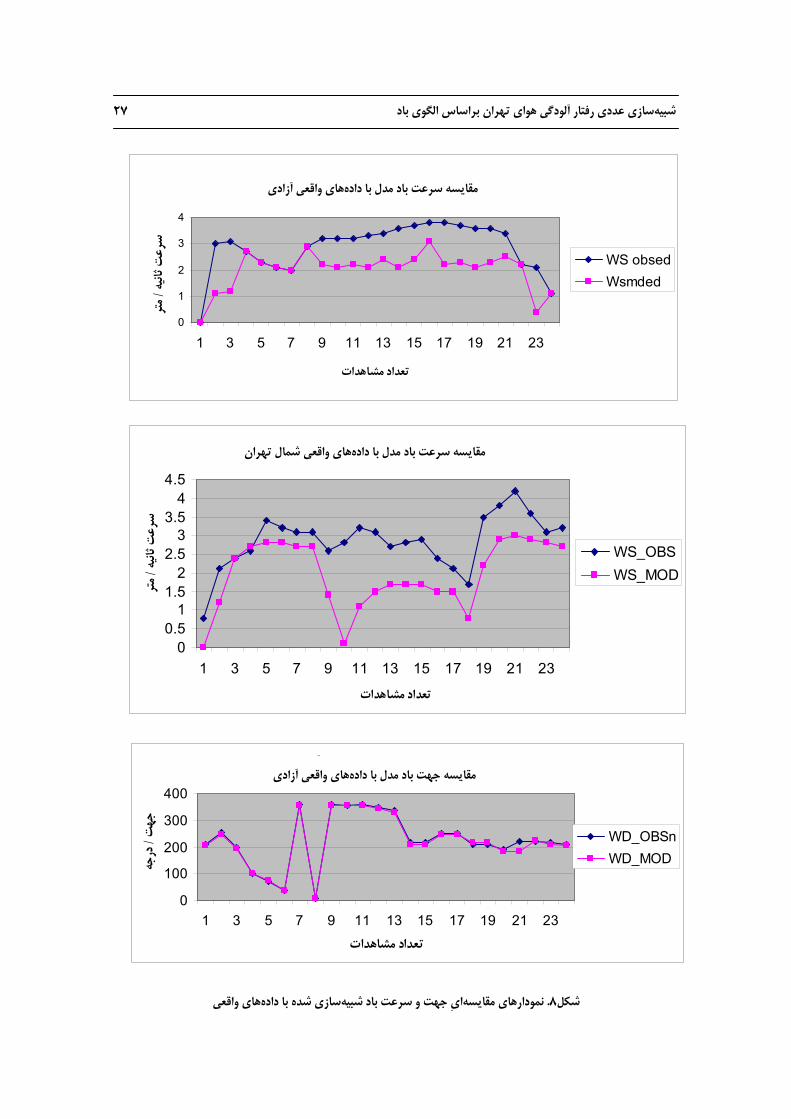
27
8.
0
1
2
3
4
1 3 5 7 9 11 13 15 17 19 21 23
/ WS obsed
Wsmded
00.5
11.5
22.5
33.5
44.5
1 3 5 7 9 11 13 15 17 19 21 23
/ WS_OBS
WS_MOD
0
100
200
300
400
1 3 5 7 9 11 13 15 17 19 21 23
/
WD_OBSnWD_MOD
/
/
/
68 1388 28
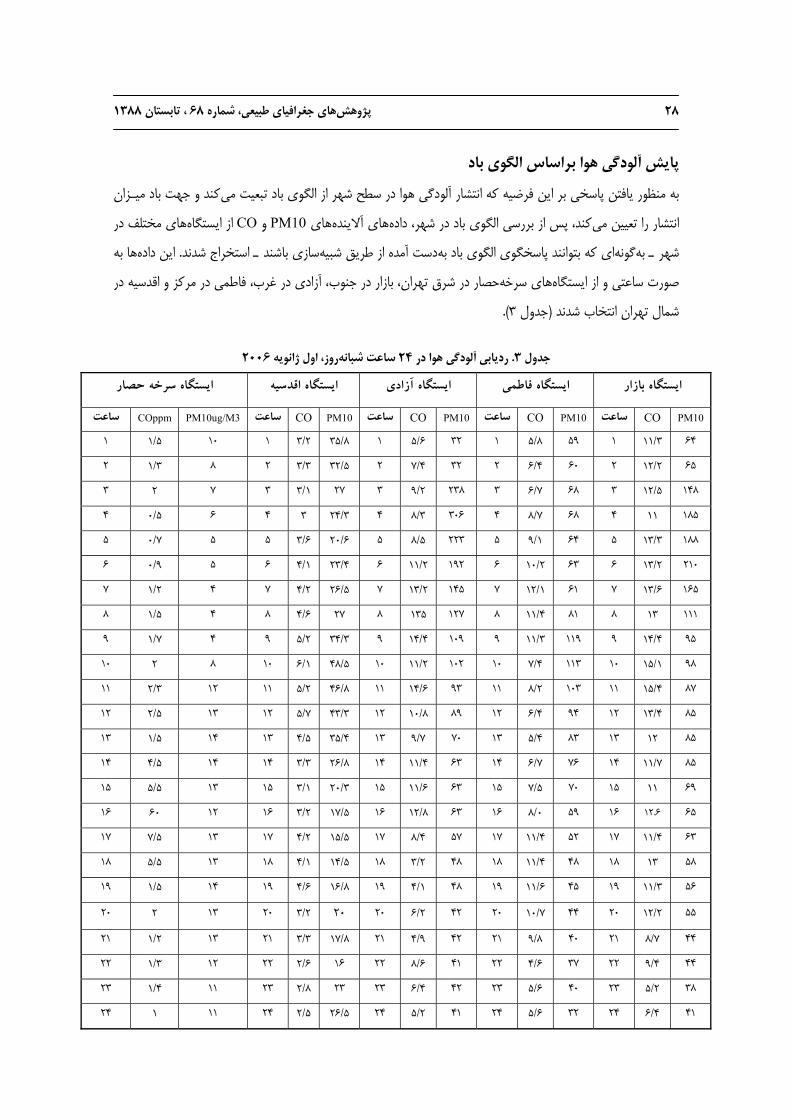
PM10 CO
.
) 3.(
3 . 24 2006
PM10 CO PM10 CO PM10 CO PM10 CO PM10ug/M3 COppm
3/11 8/5 6/5 8/35 2/3 5/1
2/12 4/6 4/7 5/32 3/3 3/1
5/12 7/6 2/9 1/3 2
11 7/8 3/8 3/24 3 5/0
3/13 1/9 5/8 6/20 6/3 7/0
2/13 2/10 2/11 4/23 1/4 9/0
6/13 1/12 2/13 5/26 2/4 2/1
13 4/11 135 27 6/4 5/1
4/14 3/11 4/14 3/34 2/5 7/1
1/15 4/7 2/11 5/48 1/6 2
4/15 2/8 6/14 8/46 2/5 3/2
4/13 4/6 8/10 3/43 7/5 5/2
12 4/5 7/9 4/355/4 5/1
7/11 7/6 4/11 8/26 3/3 5/4
11 5/7 6/11 3/20 1/3 5/5
0/8 8/12 5/17 2/3 60
4/11 4/11 4/8 5/15 2/4 5/7
13 4/11 2/3 5/14 1/4 5/5
3/11 6/11 1/4 8/16 6/4 5/1
2/12 7/10 2/6 20 2/3 2
7/8 8/9 9/4 8/17 3/3 2/1
4/9 6/4 6/8 6/2 3/1
2/5 6/5 4/6 8/2 4/1
4/6 6/5 2/5 5/26 5/2 1
29
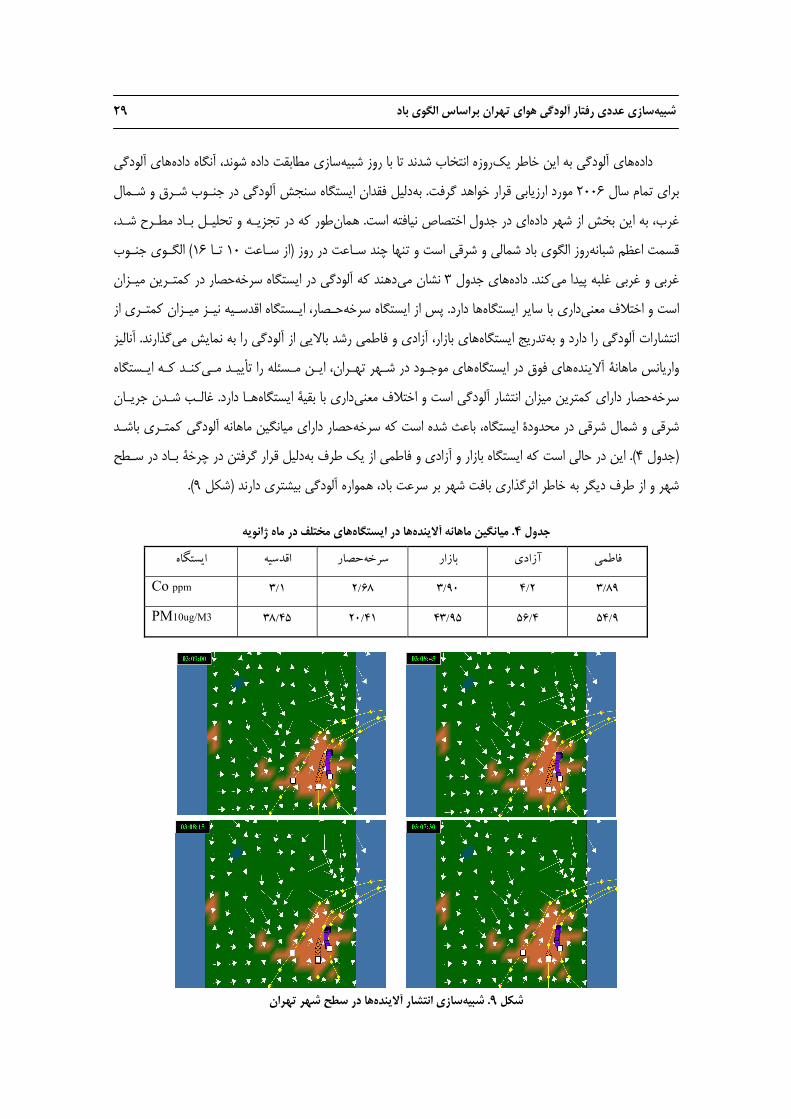
2006 .
.
) 10 16(
. 3
.
.
.
) 4 .(
) 9.(
4 .
89/3 2/4 90/3 68/2 1/3 Co ppm
9/54 4/56 95/43 41/20 45/38 PM10ug/M3
9 .
68 1388 30
TAPM
.
.
:
1 . .
.
2 .
.
3 .
.
4 .
.
.
5 . .
6 . .
7 . 2006
.
.
Air Quality Control Center, from 1997 to 2007, Statistical Handbook of Tehran Air Pollution.
Aldrin M., 2005, Generalized Addictive Modeling of Air Pollution Traffic Volume and Meteorology, Oslo, Atmospheric Environment 37, 649–660.
Alijani B., 2004, The Relation between Pressure and Air Pollution, environment organization.
Arab-Hoseini & et al., 2004. Numerical Simulation of Wind Shear in Complicated Topography, Shiraz University.
Ashok K. & et al., 2003, Evaluation of TAPM, A Prognostic Meteorological and Air Pollution Model, Using Urban and Rural, point-source data, Atmospheric Environment 30, 5543–5507.
31
Ashok K. & et al., 2006, Modelling PM10 Concentrations and Carrying Capacity Associated With Woodheater Emissions in Launceston, Tasmania, Atmospheric Environment 40, 5543�–5557.
Bahram Soltani K., 1990, Tehran Green Space, Journal of Architecture, N. 8, pp 14-28.
Brzozowski K., 2005, Modeling of Air Pollution on a Military Airfield, Air Force Academy, Dywizjonu 303 nr 12, 08-521 Deblin, Poland
Ebel A., 2001, Modeling of Air Pollution on Regional Scales, university of Cologn, Germany.
Environment Organization, 1997, Detailed Design for Tehran Air Pollution.
Environment Organization, from 1997 to 2007, Statistical Handbook of Tehran Air Pollution.
Han Z., 2007, A Regional Air Quality Model: Evaluation and Simulation of O3 and Relevant Gaseous Species in East Asia During Spring 2001, Environmental Modelling & Software 22, 1328-1336.
Harrison M. et al., 2005, Measurement and Modeling of Air Pollution and Atmospheric Chemistry in the U.K. West Midlands Conurbation: Overview of the PUMA Consortium Project, Department of Chemistry University of Leeds, Leeds LS2 9JT, UK.
Hurley, P. et al., 2003, Year-long, High-resolution, Urban Airshed Modeling: Verification of TAPM Predictions of Smog and Particles in Melbourne, Australia, Atmospheric Environment, 37, 1899�–1910.
Hurley, P. et al., 2005, TAPM: a Practical Approach to Prognostic Meteorological and Air Pollution Modeling, Environmental Modelling & Software 20, 737-752.
Hurley, P., 2002, The Air Pollution Model (TAPM) Version 2. Part 1: Technical Description, CSIRO Atmospheric Research Technical Paper No. 55, Available at http://www.dar.csiro.au/TAPM.
Hurley, P., 2005, The Air Pollution Model (TAPM) Version 3. User Manual, CSIRO Atmospheric Research Internal paper No. 31. Available at http://www.dar.csiro.au/TAPM.
Ionescu A., 2007, Air Pollutant Emissions Prediction by Process Modeling e Application in the Iron and Steel Industry in the Case of a Re-heating Furnace, Environmental Modelling & Software 22, 1362-1371.
Landsberg, H. E., 1981, The Urban Climate: Academic Press, p. 288.
Mansoor G., 1988, Air Pollution, University of Tehran, Tehran.
Moharam Nejad, N. (2000), Effect of Air Pollution on Human Health, journal of environment, N. 23.
Moradzade M., 1999, Numerical Simulation of Tehran Heat Island, university of Tehran.
Ranjbar A. and Bidokhti, A. 2004, Tehran Heat Island, Journal of Physics of earth and space, v. 30, N.2, pp 1-19.
Ranjbar, A. and Bidokhti, A. 2005, The Effect of Tehran Heat Island on Climate, journal of physics of earth and space, v. 32, n. 2, pp 11-22.
Statistics Organization, 1996, Iran Overall Census.
Tehran Municipality, 2005, Counting Active Automobile.
68 1388 32
Vicente L., 2007, Modeling of Surface Explosion of NO + H2 Reaction on Pt(100): Mean-Field Analysis and Dynamic Monte Carlo Simulations, Journal of Molecular Catalysis A: Chemical 272, 118�–127.
Zawar-Reza , Gaines Wilson, P., 2006, Intraurban-scale Dispersion Modelling of Particulate Matter Concentrations: Applications for Exposure Estimates in Cohort Studies, Atmospheric Environment 40, 1053�–1063.
Zawar-Reza et al., 2007, Long Term Simulation of Mesoscale Floe and Air Pollution Dispersion over Tehran, part1: low-level flow features, Conference on urban air quality, 27-29.
Zawar-Reza, et al., 2005, Evaluation of a Year-Long Dispersion Modelling of PM10 Using the Mesoscale Model TAPM for Christchurch, New Zealand, Science of the Total Environment, vol. 349, pp. 249-259.