Embed Size (px)
Citation preview
© AberdeenGroup 2009
Top Strategies for Asset Performance Management
(APM)
Mehul Shah, Research AnalystAberdeen Group
February 24th, 2010
© AberdeenGroup 2009 2
Agenda
Introduction Polling Questions Define Asset Performance Management Challenges Aberdeen Research Frameworks APM Research Results Recommendation for Action
© AberdeenGroup 2009 3
Polling Question # 1
What are your CFO’s TOP THREE (3) OBJECTIVES for the next 12 months?
1. Revenue growth
2. Reduce operating expense
3. Improve profitability
4. Customer satisfaction
5. Risk Management
6. Maintain or improve product and service margins
7. Sustainability / Corporate Responsibility
© AberdeenGroup 2009 4
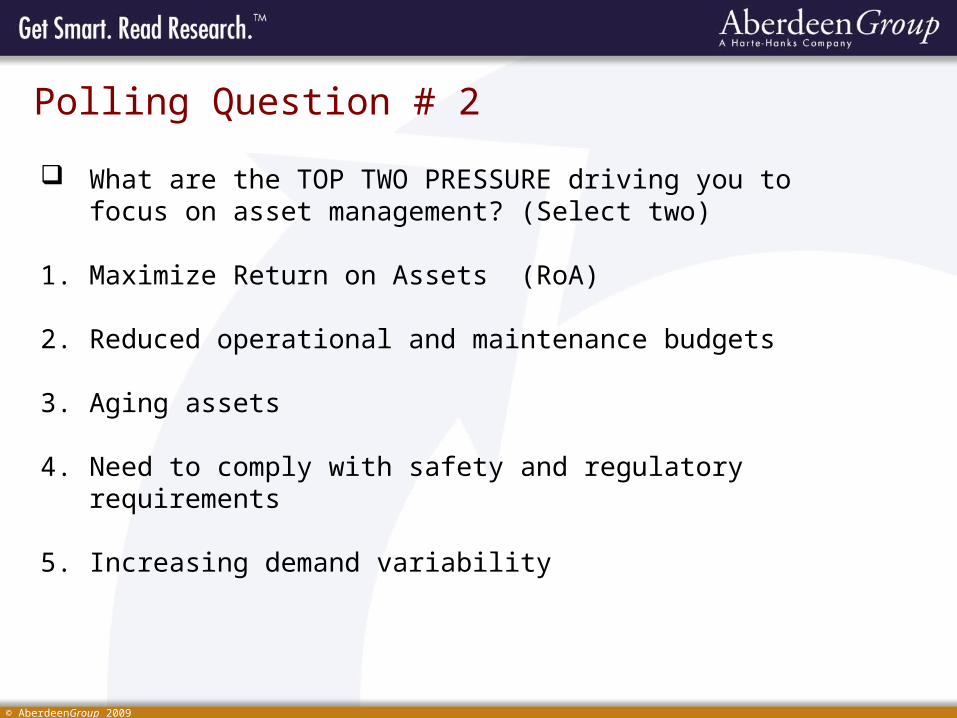
Polling Question # 2
What are the TOP TWO PRESSURE driving you to focus on asset management? (Select two)
1. Maximize Return on Assets (RoA)
2. Reduced operational and maintenance budgets
3. Aging assets
4. Need to comply with safety and regulatory requirements
5. Increasing demand variability
© AberdeenGroup 2009 5
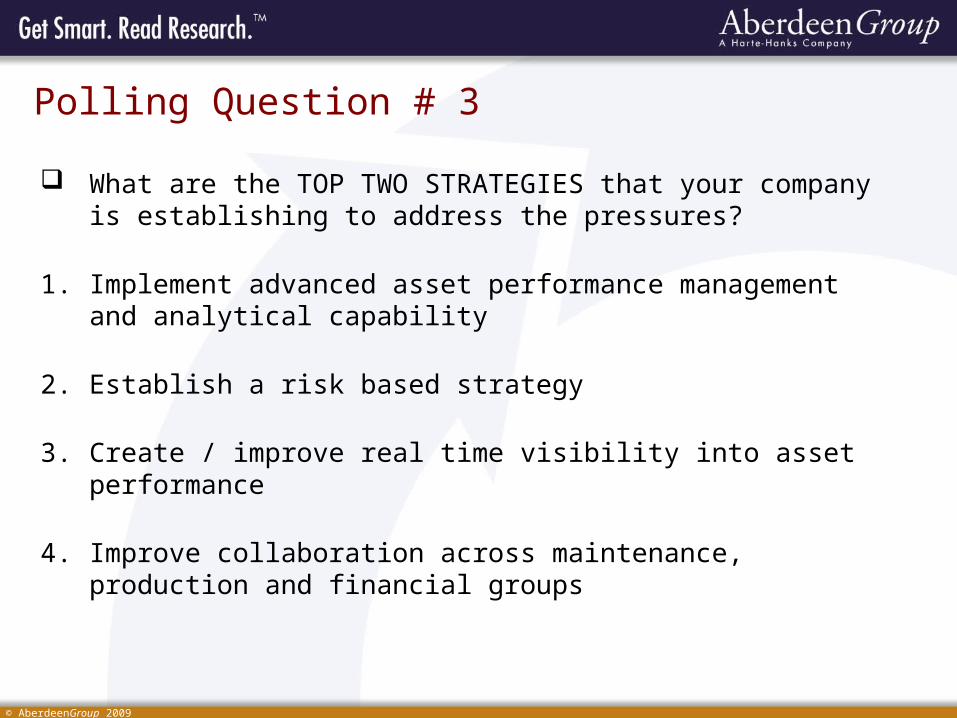
Polling Question # 3
What are the TOP TWO STRATEGIES that your company is establishing to address the pressures?
1. Implement advanced asset performance management and analytical capability
2. Establish a risk based strategy
3. Create / improve real time visibility into asset performance
4. Improve collaboration across maintenance, production and financial groups
© AberdeenGroup 2009 6
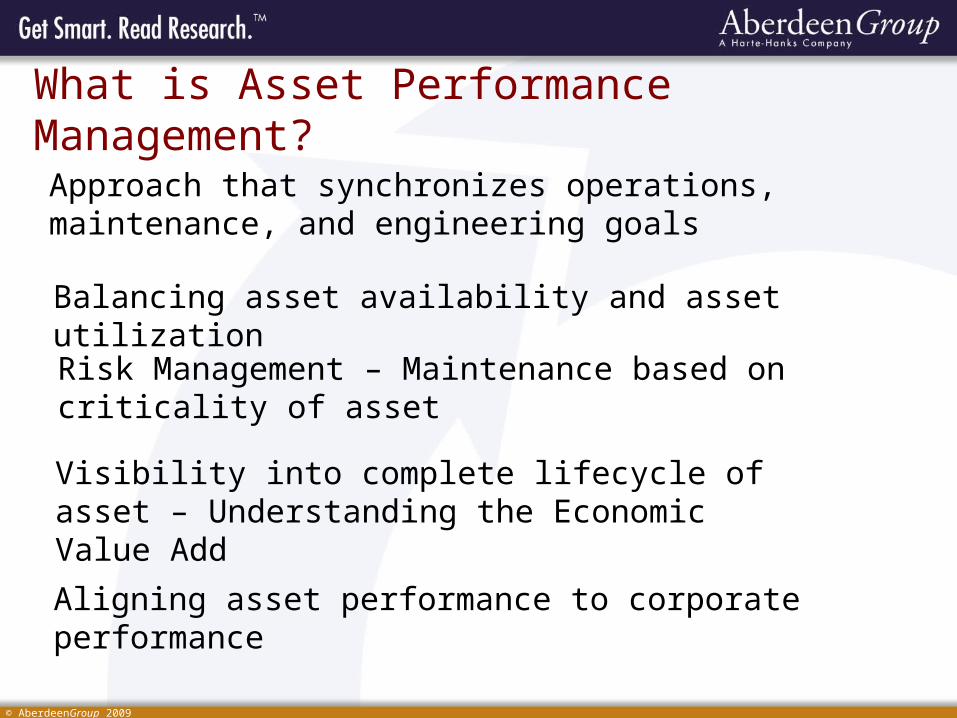
What is Asset Performance Management?
Approach that synchronizes operations, maintenance, and engineering goals
Visibility into complete lifecycle of asset – Understanding the Economic Value Add
Balancing asset availability and asset utilization
Aligning asset performance to corporate performance
Risk Management – Maintenance based on criticality of asset
© AberdeenGroup 2009 7
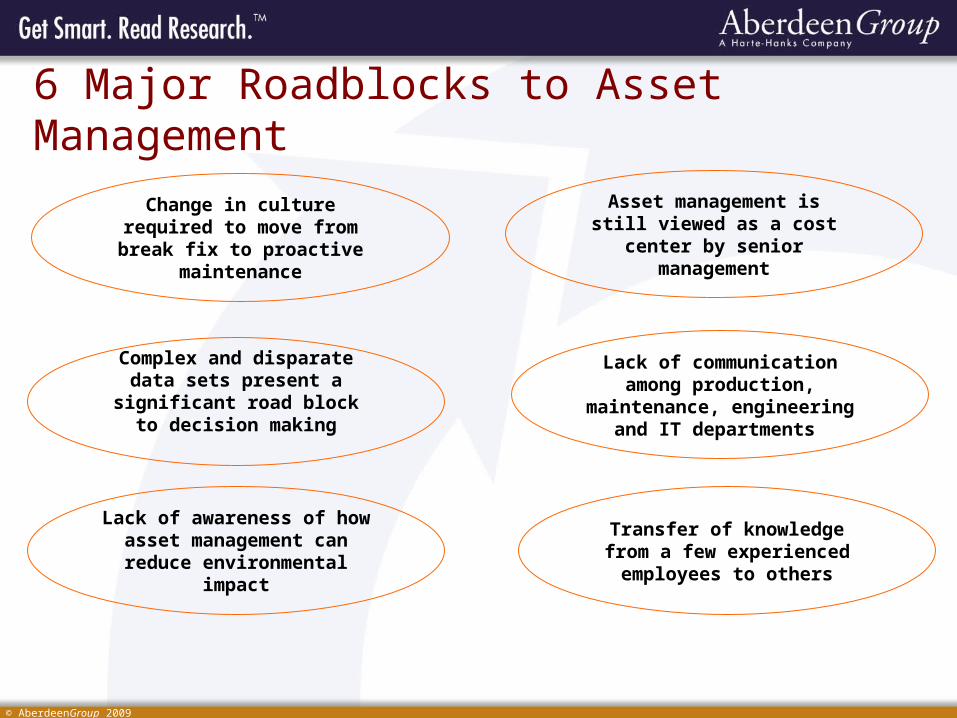
6 Major Roadblocks to Asset Management
Change in culture required to move from break fix to proactive maintenance
Asset management is still viewed as a cost center by
senior management
Complex and disparate data sets present a significant road
block to decision making
Lack of communication among production, maintenance,
engineering and IT departments
Lack of awareness of how asset management can reduce
environmental impact
Transfer of knowledge from a few experienced employees to
others
© AberdeenGroup 2009 8
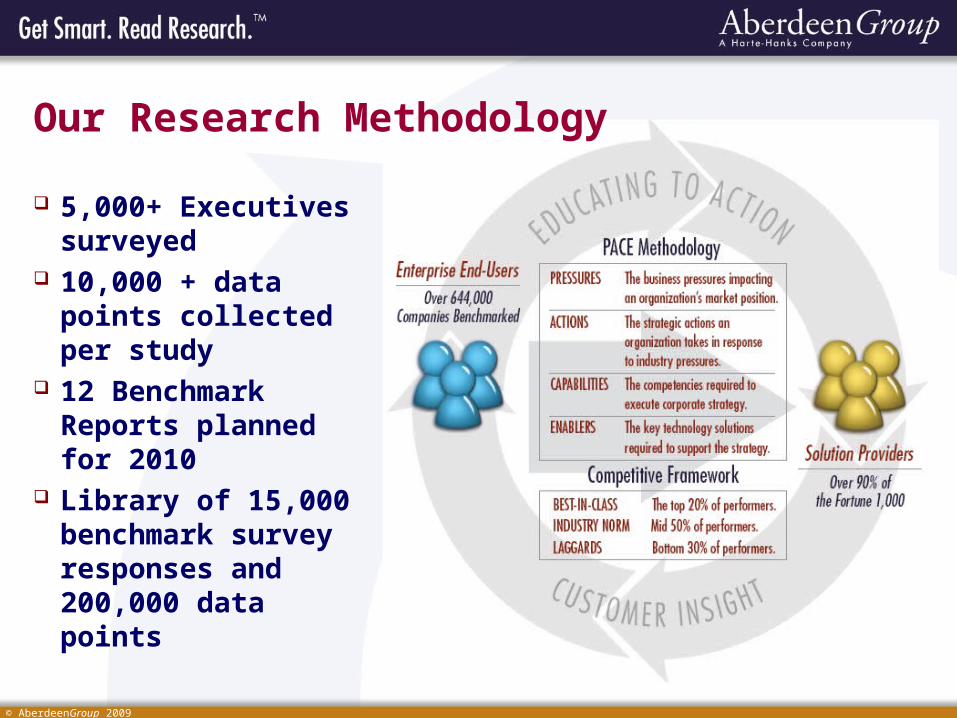
5,000+ Executives surveyed
10,000 + data points collected per study
12 Benchmark Reports planned for 2010
Library of 15,000 benchmark survey responses and 200,000 data points
Our Research Methodology
© AberdeenGroup 2009 9
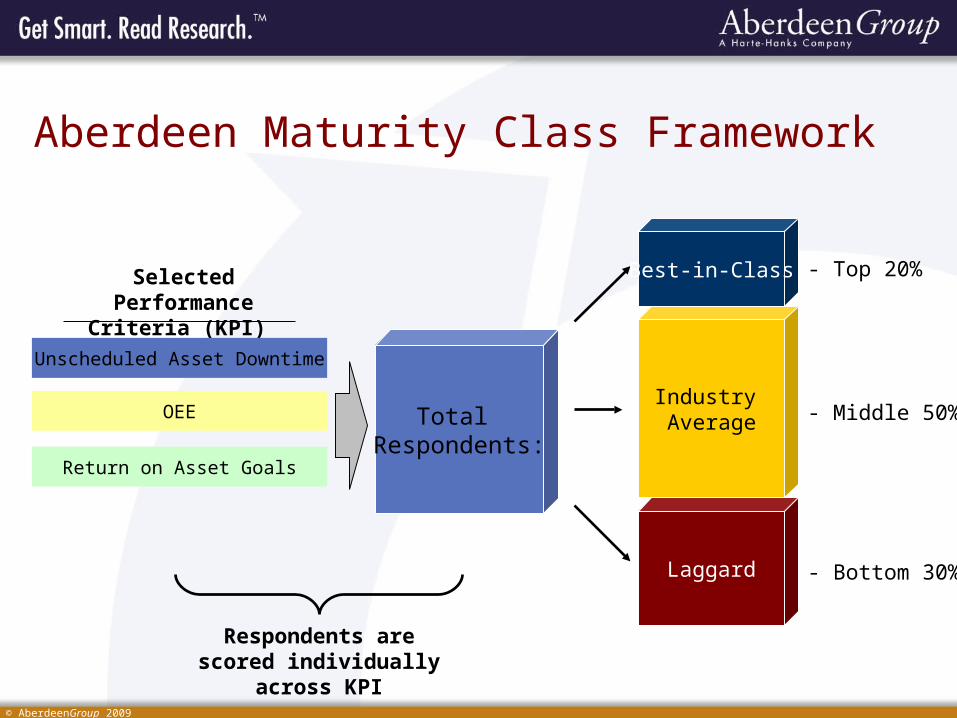
Aberdeen Maturity Class Framework
Selected Performance Criteria (KPI)
Unscheduled Asset Downtime
OEE
Return on Asset Goals
Total Respondents:
- Top 20%
- Middle 50%
- Bottom 30%
Respondents are scored individually across KPI
Best-in-Class
Industry Average
Laggard
© AberdeenGroup 2009 10
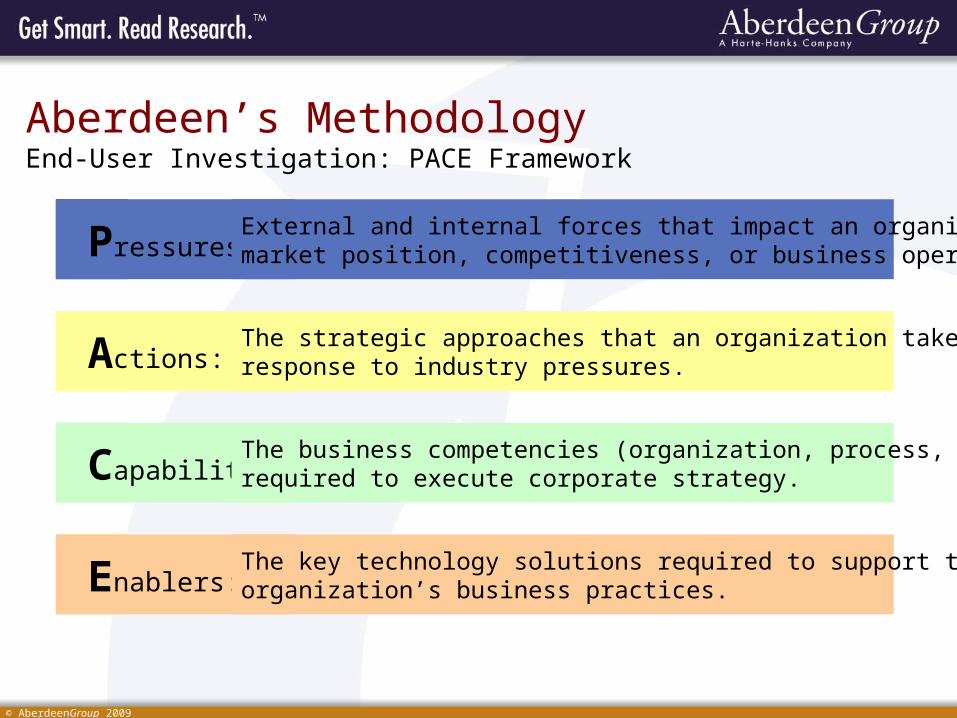
Aberdeen’s MethodologyEnd-User Investigation: PACE Framework
P
A
C
E
Pressures:External and internal forces that impact an organization’s market position, competitiveness, or business operations.
Actions:The strategic approaches that an organization takes in response to industry pressures.
Capabilities:The business competencies (organization, process, etc…) required to execute corporate strategy.
Enablers:The key technology solutions required to support the organization’s business practices.
© AberdeenGroup 2009 11
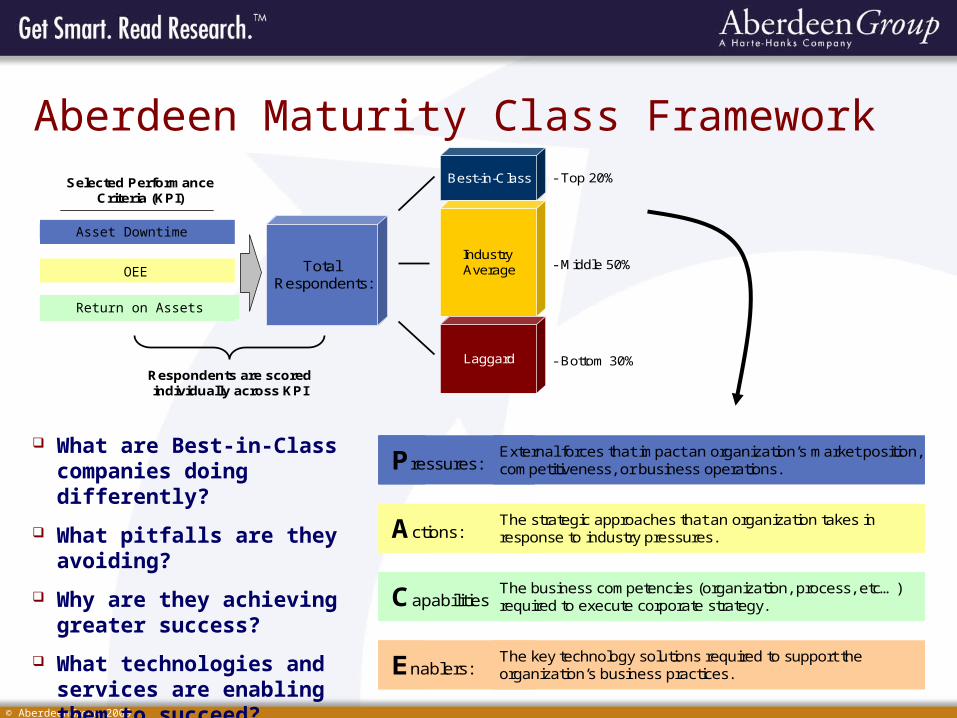
Aberdeen Maturity Class Framework
P
A
C
E
Pressures:External forces that impact an organization’s market position, competitiveness, or business operations.Pressures:External forces that impact an organization’s market position, competitiveness, or business operations.
Actions:The strategic approaches that an organization takes in response to industry pressures.Actions:The strategic approaches that an organization takes in response to industry pressures.
Capabilities:The business competencies (organization, process, etc…) required to execute corporate strategy.Capabilities:The business competencies (organization, process, etc…) required to execute corporate strategy.
Enablers:The key technology solutions required to support the organization’s business practices.Enablers:The key technology solutions required to support the organization’s business practices.
What are Best-in-Class companies doing differently?
What pitfalls are they avoiding?
Why are they achieving greater success?
What technologies and services are enabling them to succeed?
Selected Performance Criteria (KPI)
Time-to-Action/Decision
Employee Productivity
Reduction of Risk (i.e. Litigation)
Total Respondents:
- Top 20%
- Middle 50%
- Bottom 30%Respondents are scored individually across KPI
Best-in-Class
Industry Average
Laggard
Asset Downtime
OEE
Return on Assets
© AberdeenGroup 2009 12
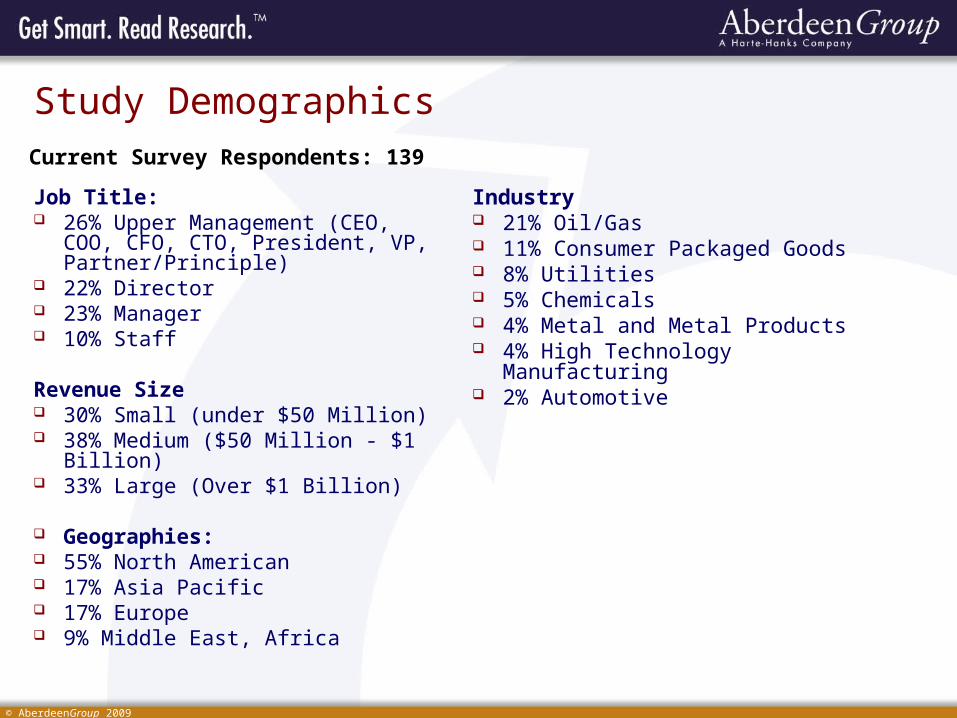
Study Demographics
Job Title: 26% Upper Management (CEO, COO,
CFO, CTO, President, VP, Partner/Principle)
22% Director 23% Manager 10% Staff
Revenue Size 30% Small (under $50 Million) 38% Medium ($50 Million - $1 Billion) 33% Large (Over $1 Billion)
Geographies: 55% North American 17% Asia Pacific 17% Europe 9% Middle East, Africa
Industry 21% Oil/Gas 11% Consumer Packaged Goods 8% Utilities 5% Chemicals 4% Metal and Metal Products 4% High Technology Manufacturing 2% Automotive
Current Survey Respondents: 139
© AberdeenGroup 2009 13
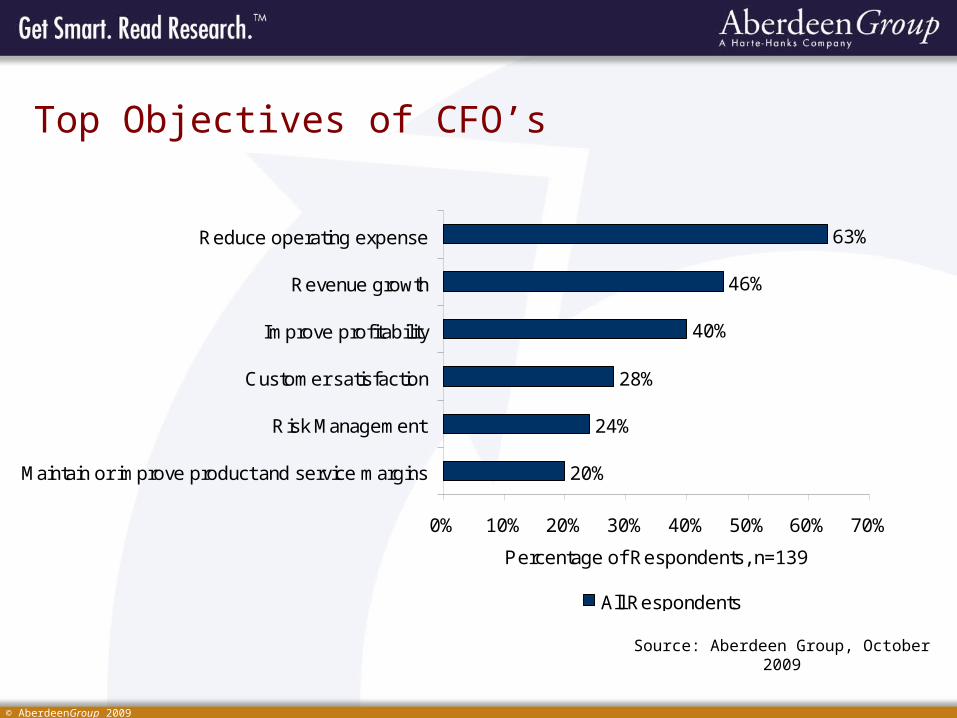
Top Objectives of CFO’s
20%
24%
28%
40%
46%
63%
0% 10% 20% 30% 40% 50% 60% 70%
Maintain or improve product and service margins
Risk Management
Customer satisfaction
Improve profitability
Revenue growth
Reduce operating expense
Percentage of Respondents, n=139
All Respondents
Source: Aberdeen Group, October 2009
© AberdeenGroup 2009 14
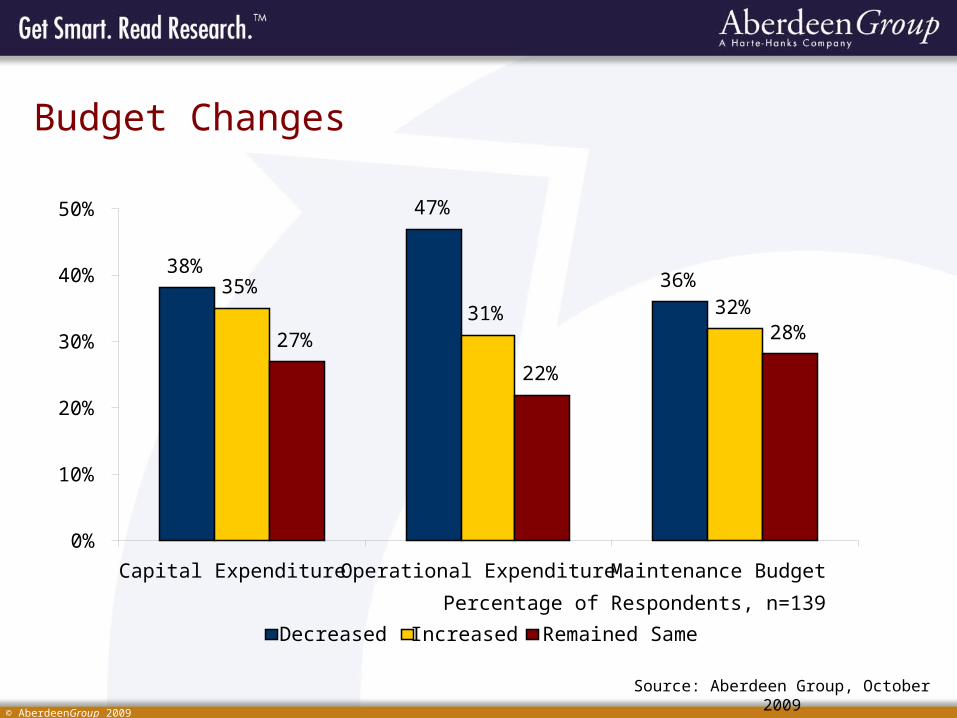
Budget Changes
Source: Aberdeen Group, October 2009
38%
47%
36%35%31% 32%
27%
22%
28%
0%
10%
20%
30%
40%
50%
Capital Expenditure Operational Expenditure Maintenance Budget
Decreased Increased Remained Same
Percentage of Respondents, n=139
© AberdeenGroup 2009 15
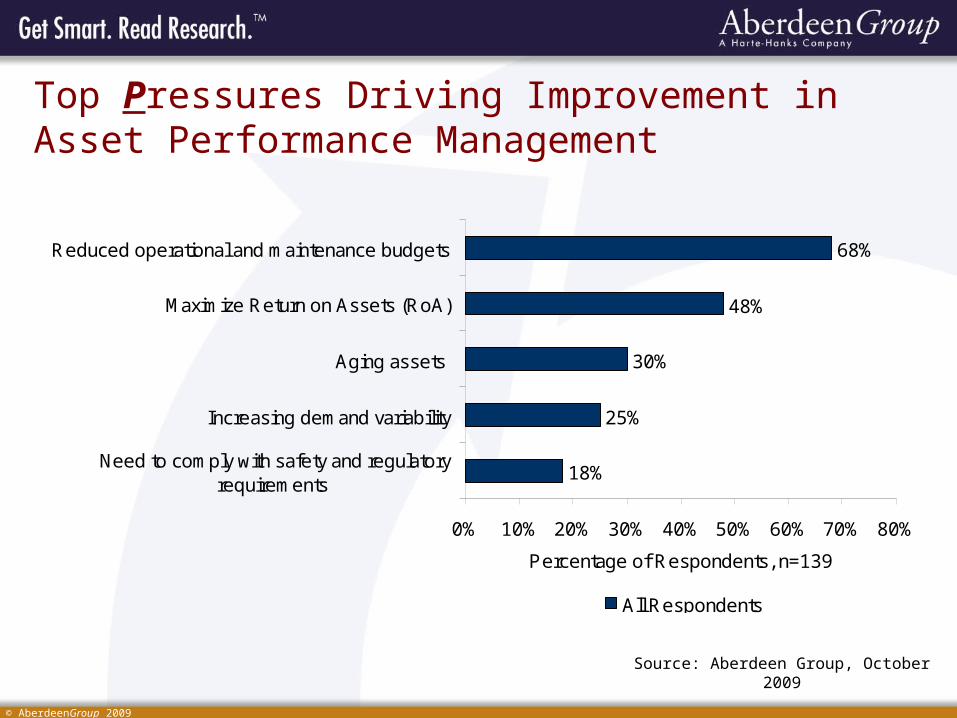
Top Pressures Driving Improvement in Asset Performance Management
Source: Aberdeen Group, October 2009
18%
25%
30%
48%
68%
0% 10% 20% 30% 40% 50% 60% 70% 80%
Need to comply with safety and regulatoryrequirements
Increasing demand variability
Aging assets
Maximize Return on Assets (RoA)
Reduced operational and maintenance budgets
Percentage of Respondents, n=139
All Respondents
© AberdeenGroup 2009 16
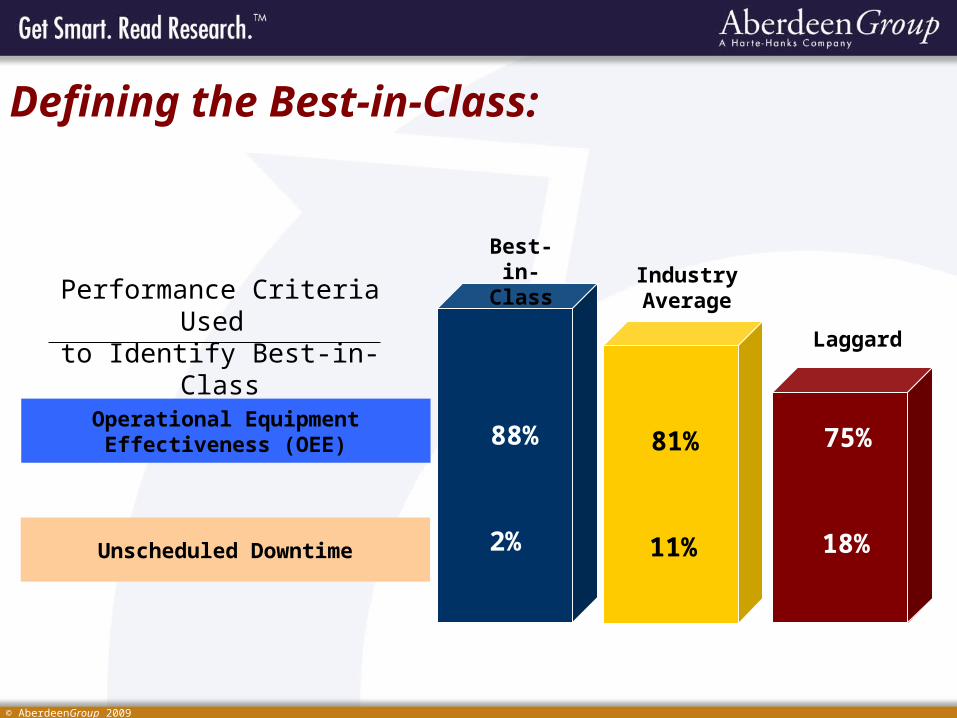
Defining the Best-in-Class:
Best-in-Class Industry
Average
Laggard
Performance Criteria Used to Identify Best-in-Class
Operational EquipmentEffectiveness (OEE) 88% 81% 75%
Unscheduled Downtime 2% 11% 18%
© AberdeenGroup 2009 17
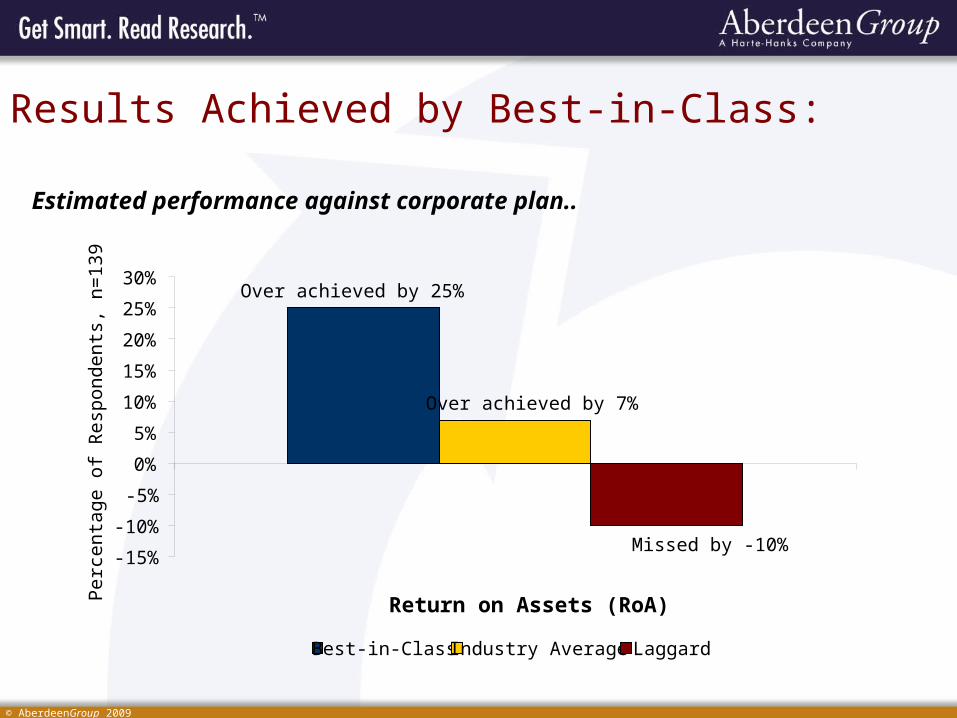
Results Achieved by Best-in-Class:
Estimated performance against corporate plan..
Over achieved by 25%
Over achieved by 7%
Missed by -10%-15%
-10%
-5%
0%
5%
10%
15%
20%
25%
30%
Return on Assets (RoA)
Per
cen
tag
e o
f R
espo
nden
ts,
n=
139
Best-in-Class Industry Average Laggard
© AberdeenGroup 2009 18
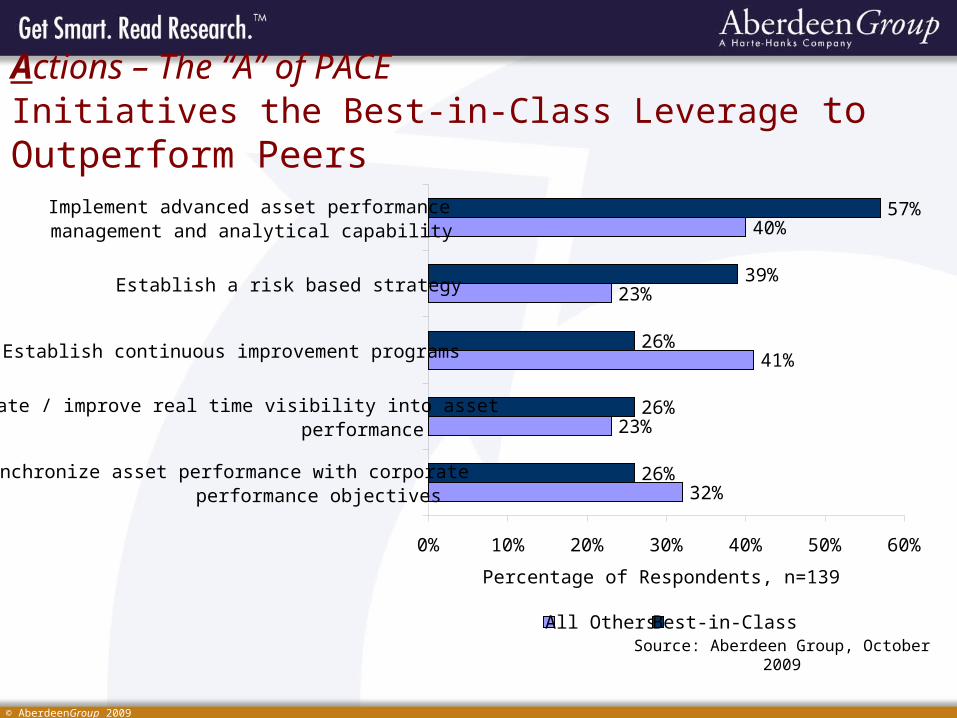
Actions – The “A” of PACEInitiatives the Best-in-Class Leverage to Outperform Peers
32%
23%
41%
23%
40%
26%
26%
26%
39%
57%
0% 10% 20% 30% 40% 50% 60%
Synchronize asset performance with corporateperformance objectives
Create / improve real time visibility into assetperformance
Establish continuous improvement programs
Establish a risk based strategy
Implement advanced asset performancemanagement and analytical capability
Percentage of Respondents, n=139
All Others Best-in-ClassSource: Aberdeen Group, October 2009
© AberdeenGroup 2009 19
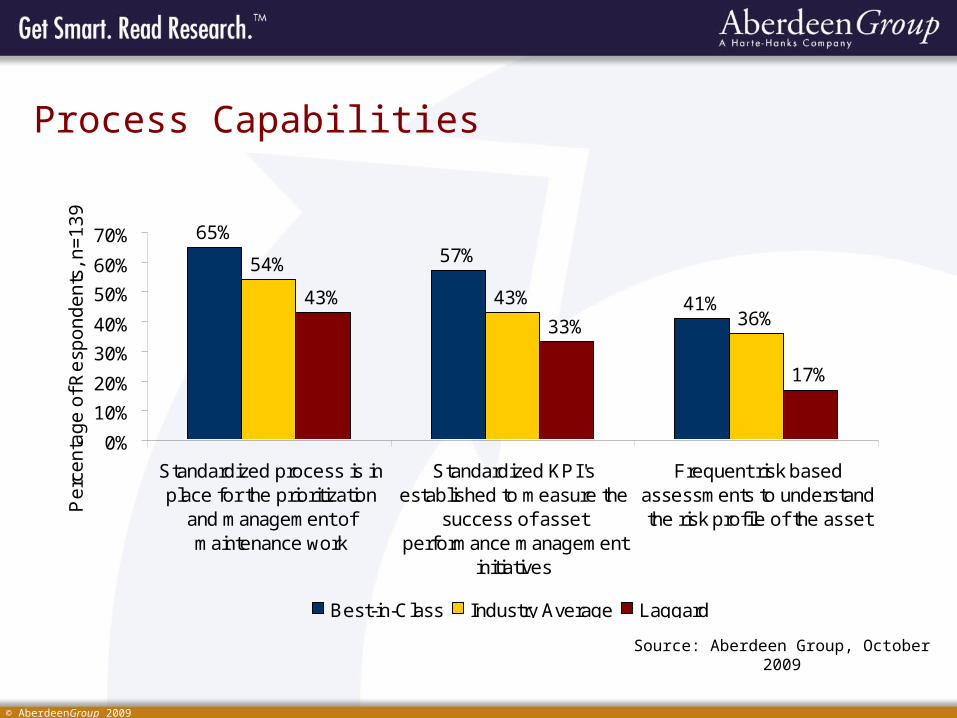
Process Capabilities
65%57%
41%
54%
43%36%
43%
33%
17%
0%
10%
20%
30%
40%
50%
60%
70%
Standardized process is inplace for the prioritization
and management ofmaintenance work
Standardized KPI'sestablished to measure the
success of assetperformance management
initiatives
Frequent risk basedassessments to understandthe risk profile of the assetP
erc
en
tag
e o
f Re
spo
nd
en
ts, n
=1
39
Best-in-Class Industry Average Laggard
Source: Aberdeen Group, October 2009
© AberdeenGroup 2009 20
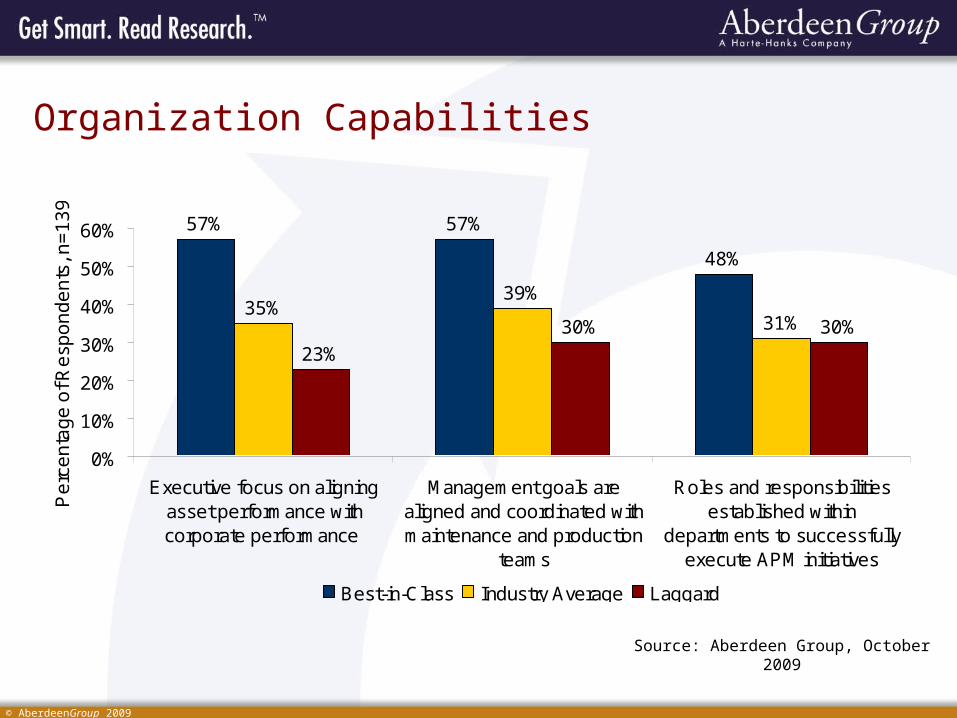
Organization Capabilities
57% 57%
48%
35%39%
31%
23%
30% 30%
0%
10%
20%
30%
40%
50%
60%
Executive focus on aligningasset performance withcorporate performance
Management goals arealigned and coordinated withmaintenance and production
teams
Roles and responsibilitiesestablished within
departments to successfullyexecute APM initiatives
Pe
rce
nta
ge
of R
esp
on
de
nts
, n=
13
9
Best-in-Class Industry Average Laggard
Source: Aberdeen Group, October 2009
© AberdeenGroup 2009 21
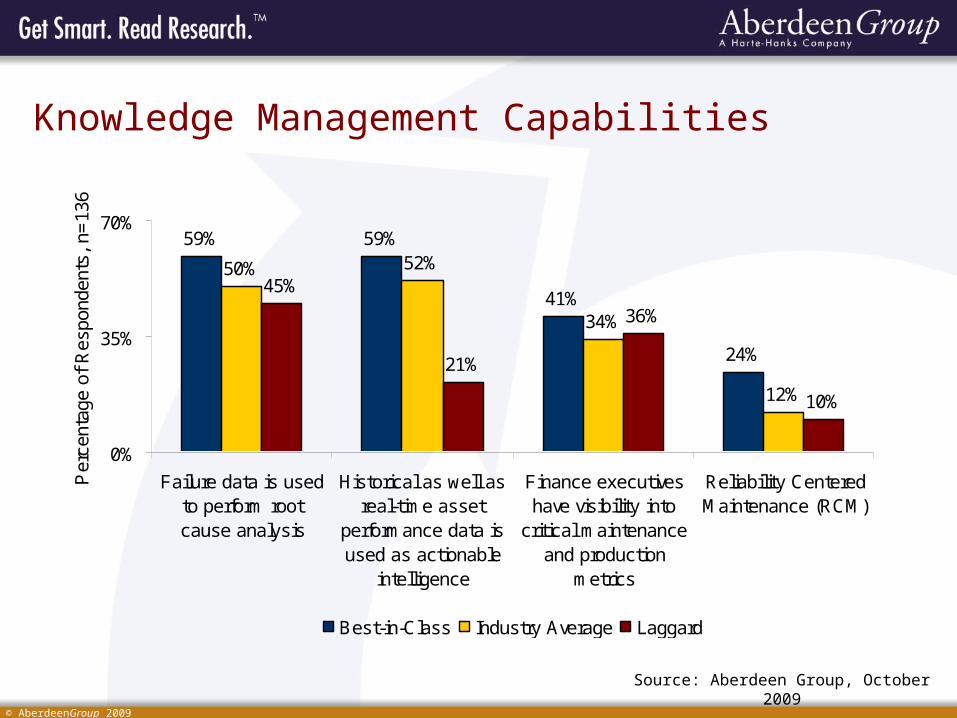
Knowledge Management Capabilities
Source: Aberdeen Group, October 2009
59% 59%
41%
24%
50% 52%
34%
12%
45%
21%
36%
10%
0%
35%
70%
Failure data is usedto perform rootcause analysis
Historical as well asreal-time asset
performance data isused as actionable
intelligence
Finance executiveshave visibility into
critical maintenanceand production
metrics
Reliability CenteredMaintenance (RCM)
Per
cent
age
of R
espo
nden
ts,
n=13
6
Best-in-Class Industry Average Laggard
© AberdeenGroup 2009 22
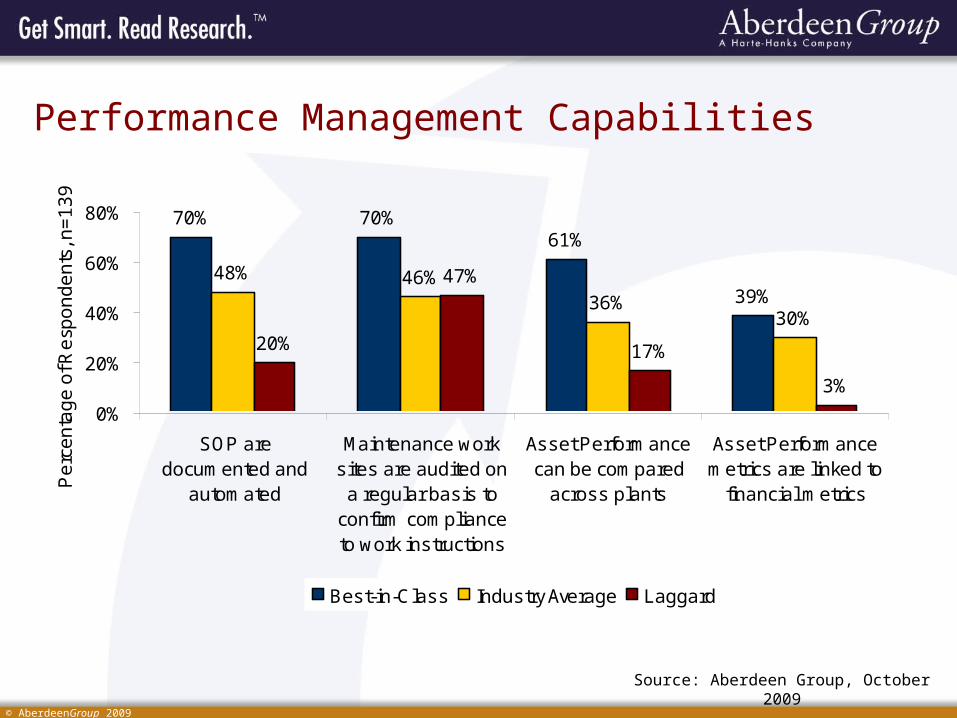
Performance Management Capabilities
Source: Aberdeen Group, October 2009
70% 70%61%
39%48% 46%
36%30%
20%
47%
17%
3%
0%
20%
40%
60%
80%
SOP aredocumented and
automated
Maintenance worksites are audited on
a regular basis toconfirm complianceto work instructions
Asset Performancecan be compared
across plants
Asset Performancemetrics are linked to
financial metricsPe
rce
nta
ge
of R
esp
on
de
nts
, n=
13
9
Best-in-Class Industry Average Laggard
© AberdeenGroup 2009 23
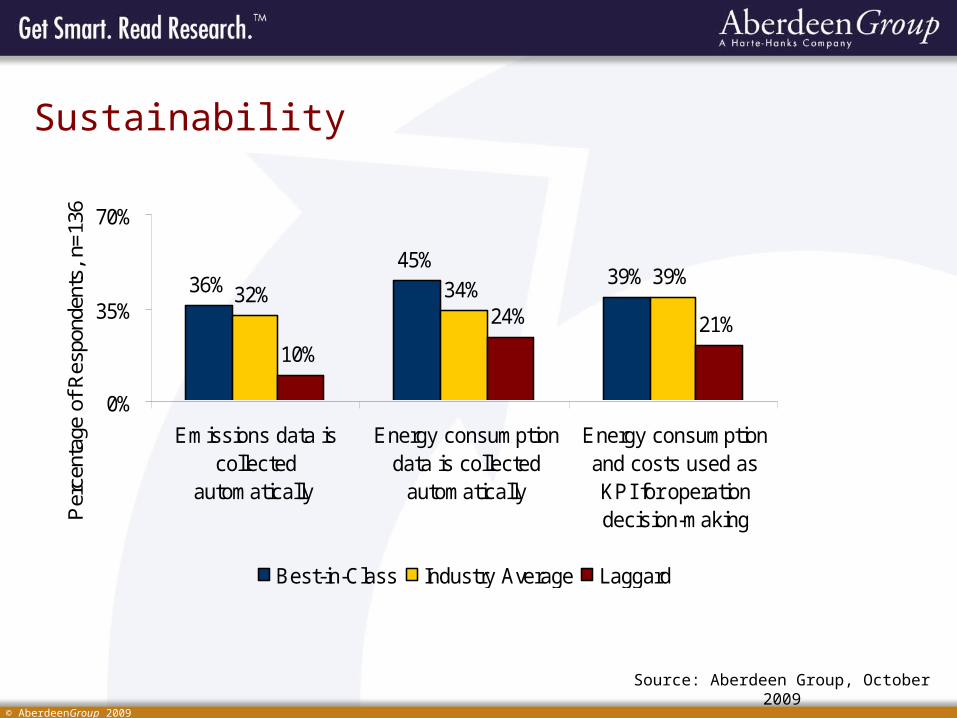
Sustainability
Source: Aberdeen Group, October 2009
36%45%
39%32% 34%
39%
10%
24% 21%
0%
35%
70%
Emissions data iscollected
automatically
Energy consumptiondata is collected
automatically
Energy consumptionand costs used asKPI for operationdecision-makingP
erce
ntag
e of
Res
pond
ents
, n=
136
Best-in-Class Industry Average Laggard
© AberdeenGroup 2009 24
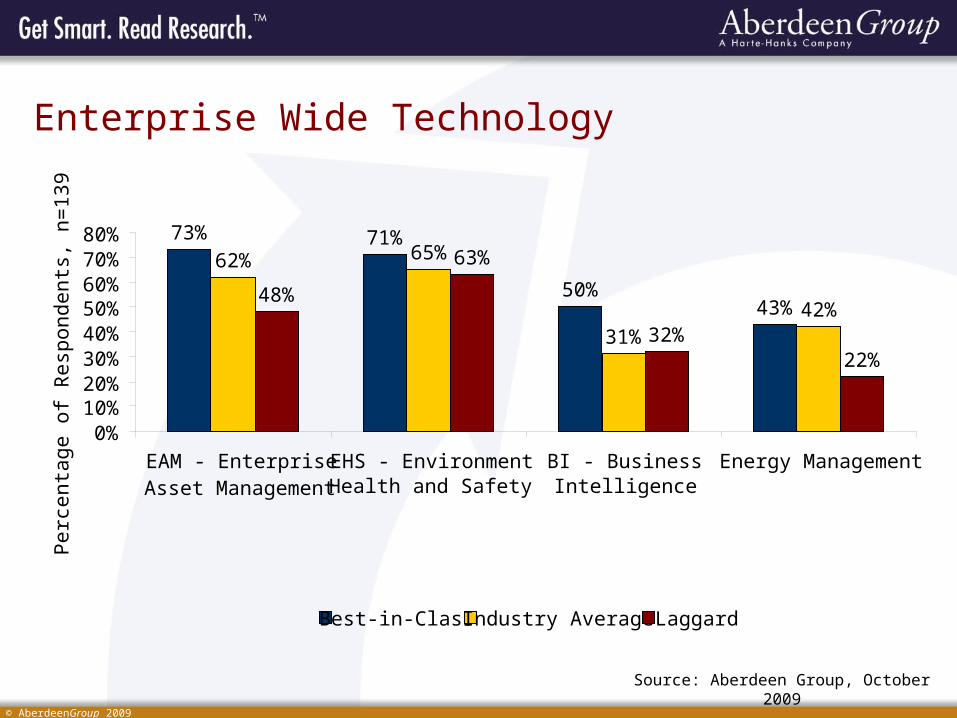
Enterprise Wide Technology
Source: Aberdeen Group, October 2009
73% 71%
50%43%
62% 65%
31%42%
48%
63%
32%22%
0%10%20%30%40%50%60%70%80%
EAM - EnterpriseAsset Management
EHS - EnvironmentHealth and Safety
BI - BusinessIntelligence
Energy Management
Pe
rce
nta
ge
of
Re
spo
nd
en
ts,
n=
13
9
Best-in-Class Industry Average Laggard
© AberdeenGroup 2009 25
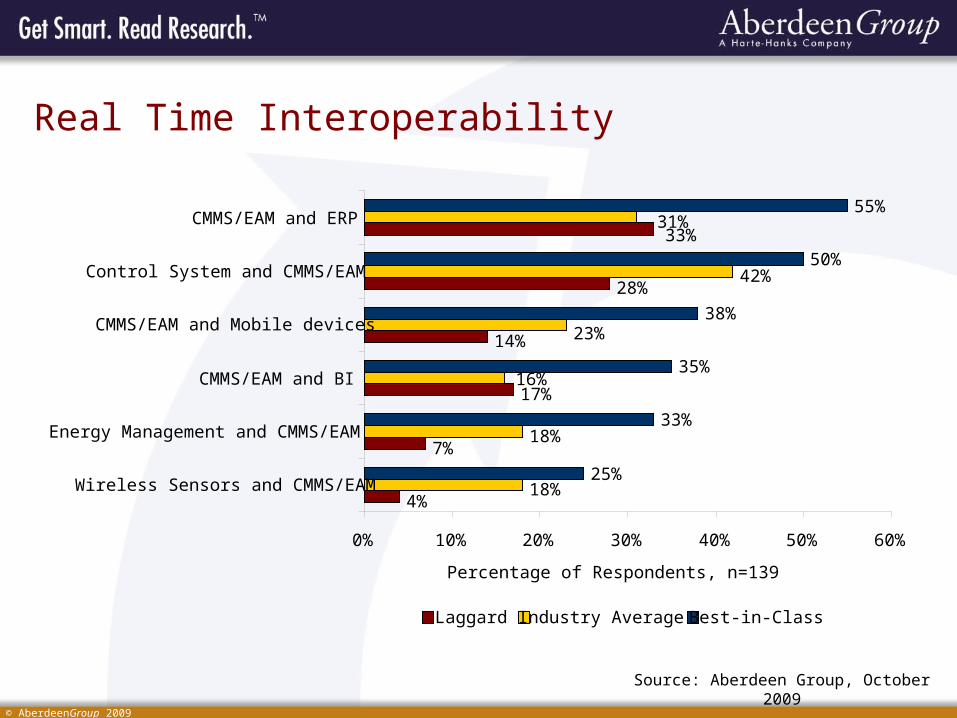
Real Time Interoperability
4%
7%
17%
14%
28%
33%
18%
18%
16%
23%
42%
31%
25%
33%
35%
38%
50%
55%
0% 10% 20% 30% 40% 50% 60%
Wireless Sensors and CMMS/EAM
Energy Management and CMMS/EAM
CMMS/EAM and BI
CMMS/EAM and Mobile devices
Control System and CMMS/EAM
CMMS/EAM and ERP
Percentage of Respondents, n=139
Laggard Industry Average Best-in-Class
Source: Aberdeen Group, October 2009
© AberdeenGroup 2009 26
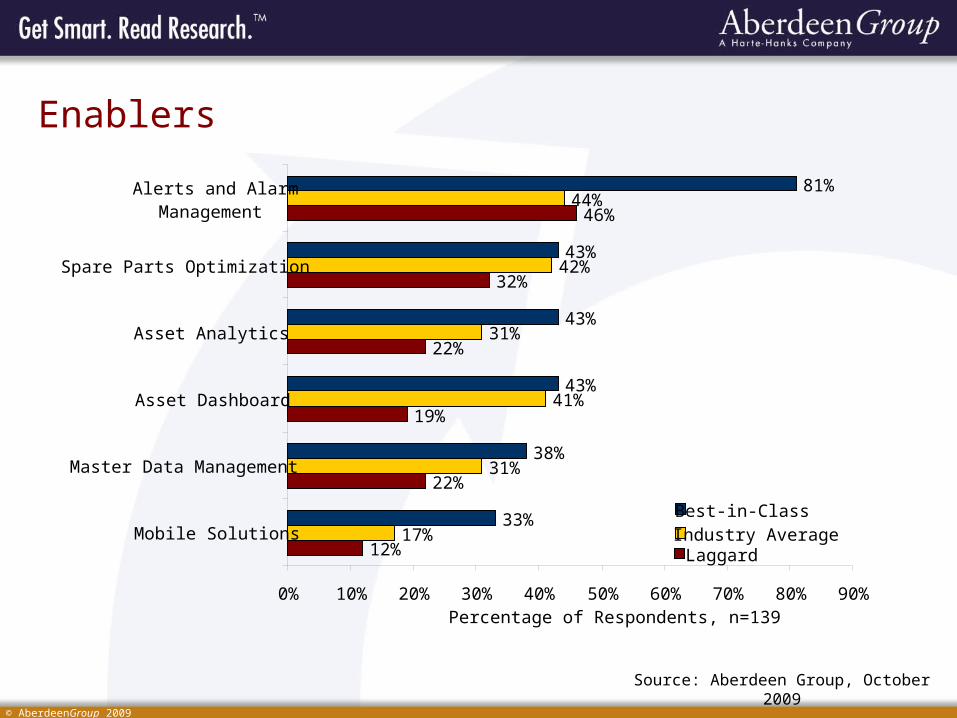
Enablers
12%
22%
19%
22%
32%
46%
17%
31%
41%
31%
42%
44%
33%
38%
43%
43%
43%
81%
0% 10% 20% 30% 40% 50% 60% 70% 80% 90%
Mobile Solutions
Master Data Management
Asset Dashboard
Asset Analytics
Spare Parts Optimization
Alerts and AlarmManagement
Percentage of Respondents, n=139
LaggardIndustry AverageBest-in-Class
Source: Aberdeen Group, October 2009
© AberdeenGroup 2009 27
Laggard Step to Success
Establish executive ownership and sponsorship for asset performance and energy management strategies across the enterprise
Align goals and metrics across maintenance and production teams
Invest in analytics to provide predictive insights based on the captured asset data
Include energy data (consumption, costs etc) as part of the optimization process to schedule maintenance and production activities
© AberdeenGroup 2009 28
Industry Average Steps to Success
Provide on-demand asset lifecycle information to maintenance and production employees
Invest in centralized knowledge warehouse to store asset performance, energy and operations data
Include energy management in corporate wide sustainability initiative
Invest in automation with specific focus on alarm management, dashboards, analytics, and mobile solution
© AberdeenGroup 2009 29
Best-in-Class Steps to Success
Align operational performance with corporate performance to understand the impact of asset strategies on organizations financial goals
Manage energy consumption by developing initiatives integrated with the overall asset management strategy
Establish a risk based approach to ensure predictive asset management
Establish real-time interoperability between asset management and business systems