Embed Size (px)
Citation preview
1© Copyright 2008 NCCI Holdings, Inc. All Rights Reserved.
Workers Compensation Update
Spring Midwestern Actuarial ForumMarch 7, 2008
Barry Lipton, Practice Leader and Senior ActuaryNCCI
Workers Compensation Update
Spring Midwestern Actuarial ForumMarch 7, 2008
Barry Lipton, Practice Leader and Senior ActuaryNCCI
2© Copyright 2008 NCCI Holdings, Inc. All Rights Reserved.
Workers Compensation Results
3© Copyright 2008 NCCI Holdings, Inc. All Rights Reserved.
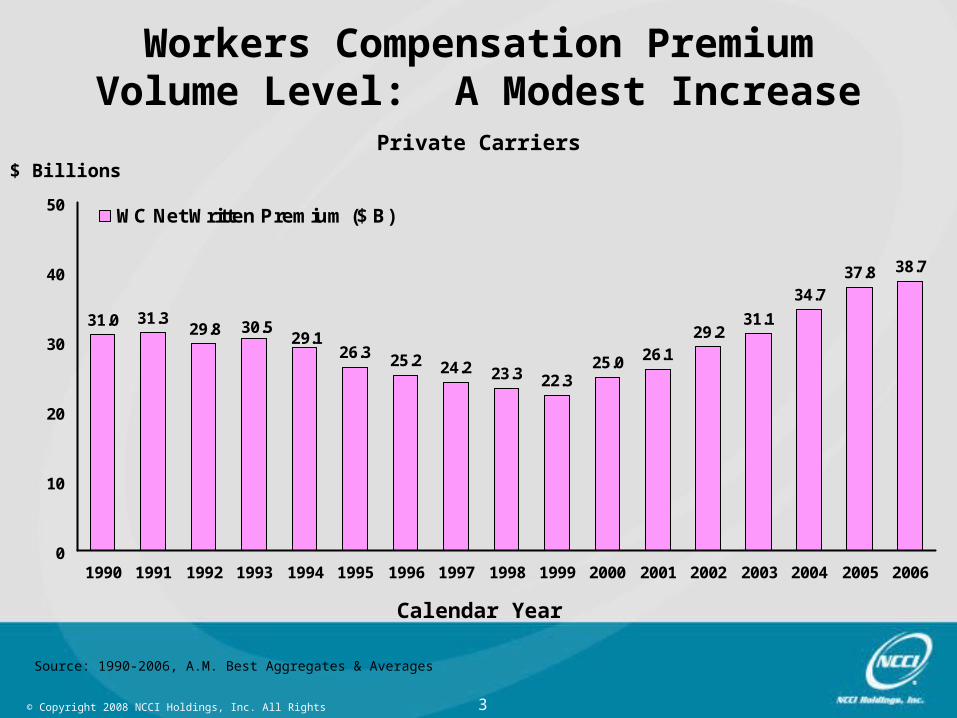
31.0 31.3
26.3 25.2 24.2 23.3 22.325.0 26.1
29.231.1
37.8 38.7
34.7
29.130.529.8
0
10
20
30
40
50
1990 1991 1992 1993 1994 1995 1996 1997 1998 1999 2000 2001 2002 2003 2004 2005 2006
WC Net Written Premium ($ B)
Workers Compensation PremiumVolume Level: A Modest Increase
Private Carriers$ Billions
Calendar Year
Source: 1990-2006, A.M. Best Aggregates & Averages
4© Copyright 2008 NCCI Holdings, Inc. All Rights Reserved.
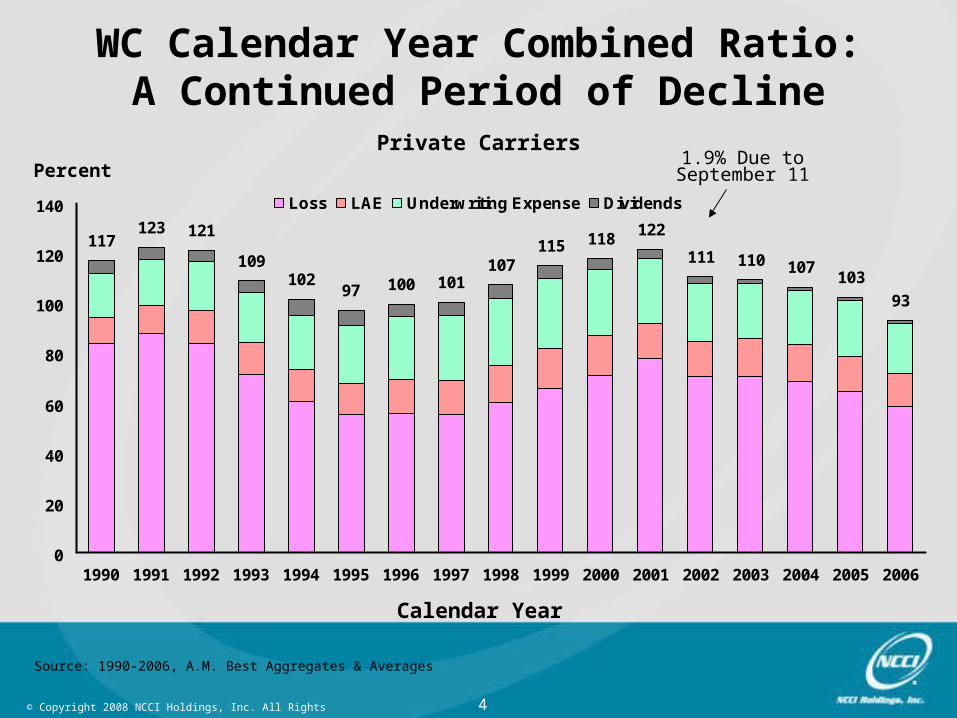
117123 121
109102
97 100 101107
115 118122
111 110 107103
93
0
20
40
60
80
100
120
140
1990 1991 1992 1993 1994 1995 1996 1997 1998 1999 2000 2001 2002 2003 2004 2005 2006
Loss LAE Underwriting Expense Dividends
1.9% Due to September 11Percent
WC Calendar Year Combined Ratio:A Continued Period of Decline
Private Carriers
Calendar Year
Source: 1990-2006, A.M. Best Aggregates & Averages
5© Copyright 2008 NCCI Holdings, Inc. All Rights Reserved.
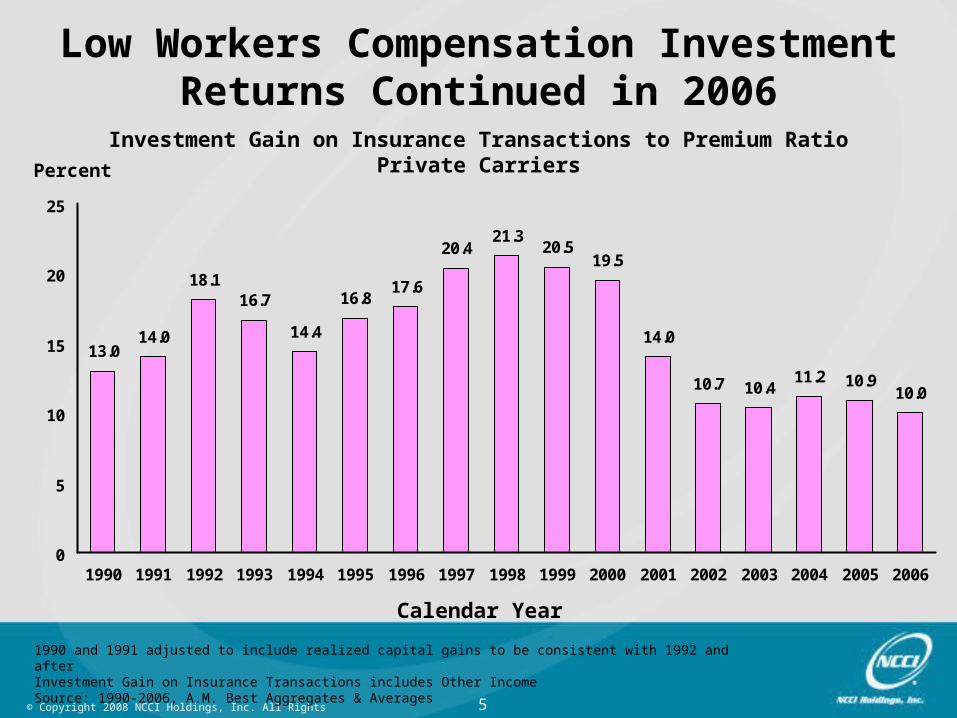
1990 and 1991 adjusted to include realized capital gains to be consistent with 1992 and afterInvestment Gain on Insurance Transactions includes Other IncomeSource: 1990-2006, A.M. Best Aggregates & Averages
13.014.0
18.116.7
14.4
16.817.6
20.421.3
20.519.5
14.0
10.7 10.4 10.910.0
11.2
0
5
10
15
20
25
1990 1991 1992 1993 1994 1995 1996 1997 1998 1999 2000 2001 2002 2003 2004 2005 2006
Percent
Low Workers Compensation InvestmentReturns Continued in 2006
Investment Gain on Insurance Transactions to Premium RatioPrivate Carriers
Calendar Year
6© Copyright 2008 NCCI Holdings, Inc. All Rights Reserved.
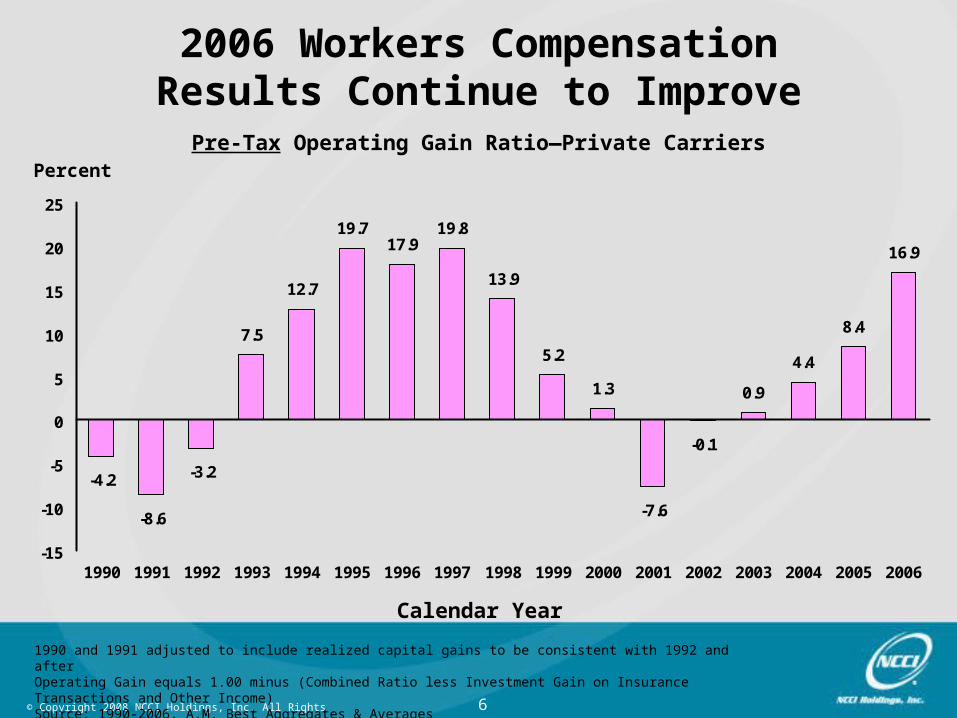
1990 and 1991 adjusted to include realized capital gains to be consistent with 1992 and afterOperating Gain equals 1.00 minus (Combined Ratio less Investment Gain on Insurance Transactions and Other Income)Source: 1990-2006, A.M. Best Aggregates & Averages
7.5
12.7
19.717.9
19.8
13.9
5.2
1.3 0.9
8.4
16.9
4.4
-0.1
-7.6
-3.2
-8.6
-4.2
-15
-10
-5
0
5
10
15
20
25
1990 1991 1992 1993 1994 1995 1996 1997 1998 1999 2000 2001 2002 2003 2004 2005 2006
Percent
Calendar Year
2006 Workers CompensationResults Continue to Improve
Pre-Tax Operating Gain Ratio—Private Carriers

7© Copyright 2008 NCCI Holdings, Inc. All Rights Reserved.
Workers CompensationResidual Market
8© Copyright 2008 NCCI Holdings, Inc. All Rights Reserved.
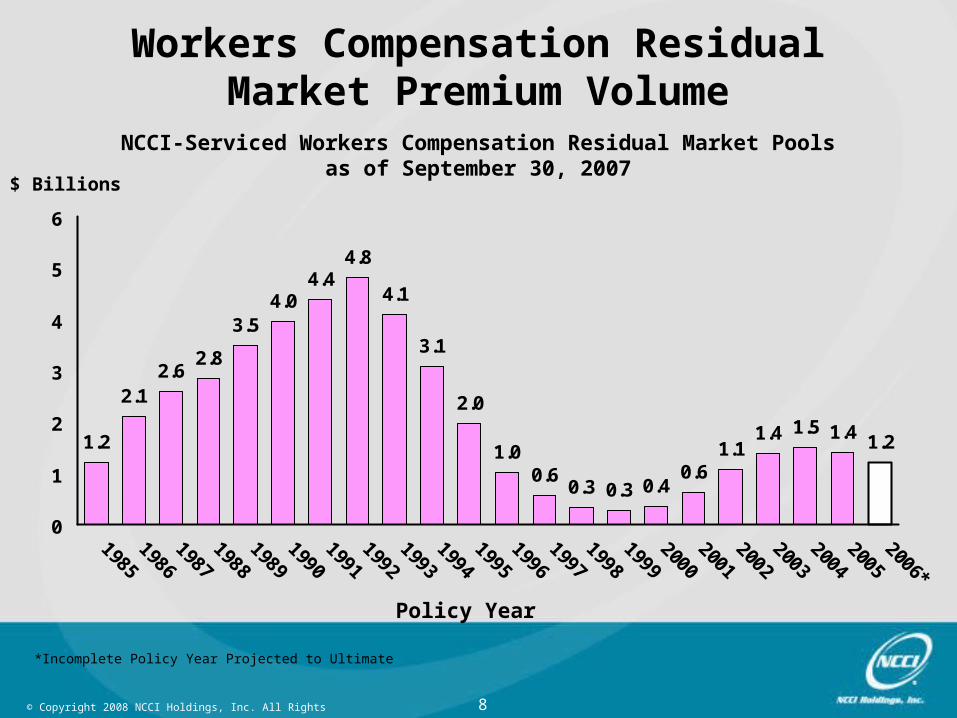
Workers Compensation Residual Market Premium Volume
NCCI-Serviced Workers Compensation Residual Market Poolsas of September 30, 2007
$ Billions
Policy Year
1.2
2.12.6
2.8
3.54.0
4.44.8
4.1
3.1
2.0
1.00.6
0.3 0.3 0.40.6
1.11.4 1.5
1.21.4
0
1
2
3
4
5
6
*Incomplete Policy Year Projected to Ultimate

9© Copyright 2008 NCCI Holdings, Inc. All Rights Reserved.
*Incomplete Policy Year Projected to Ultimate
Workers Compensation Residual Market Combined Ratios
NCCI-Serviced Workers Compensation Residual Market Pools as of September 30, 2007
Percent
Policy Year
177
166 170167160
143
128
112104
98 95100103
117117 119
108 110108114115
108
80
100
120
140
160
180
200
10© Copyright 2008 NCCI Holdings, Inc. All Rights Reserved.
Workers Compensation
Accident Year ResultsAnd
Reserve Estimates
11© Copyright 2008 NCCI Holdings, Inc. All Rights Reserved.
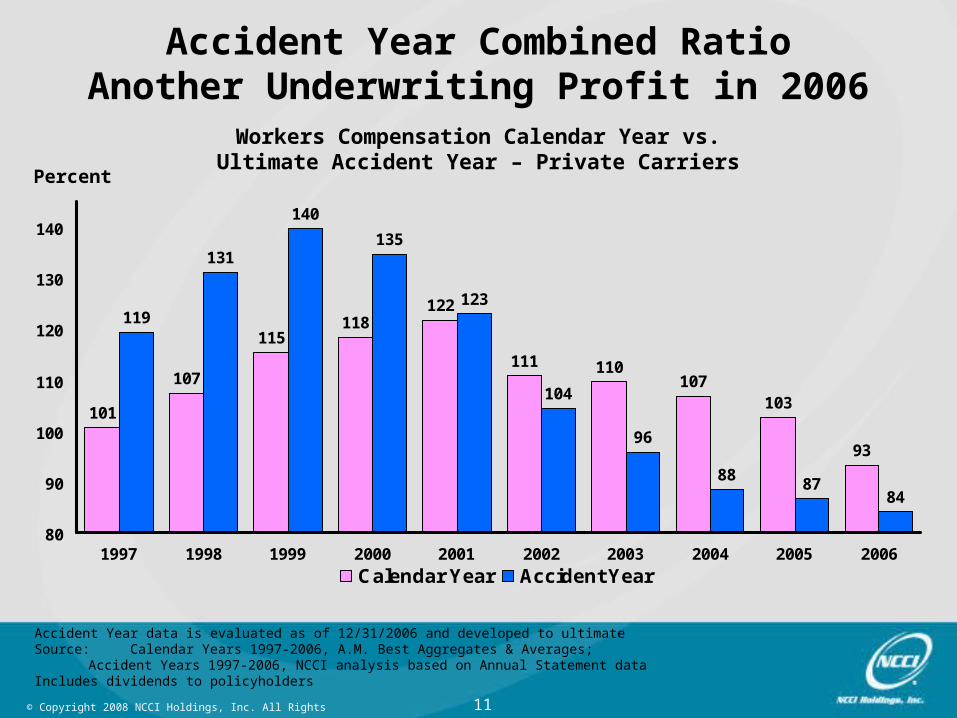
Accident Year Combined RatioAnother Underwriting Profit in 2006
Workers Compensation Calendar Year vs.Ultimate Accident Year – Private Carriers
Percent
101
107
115118
122
111 110107
103
119
131
140
135
123
104
96
8887
93
84
80
90
100
110
120
130
140
1997 1998 1999 2000 2001 2002 2003 2004 2005 2006
Calendar Year Accident Year
Accident Year data is evaluated as of 12/31/2006 and developed to ultimateSource: Calendar Years 1997-2006, A.M. Best Aggregates & Averages;
Accident Years 1997-2006, NCCI analysis based on Annual Statement dataIncludes dividends to policyholders
12© Copyright 2008 NCCI Holdings, Inc. All Rights Reserved.
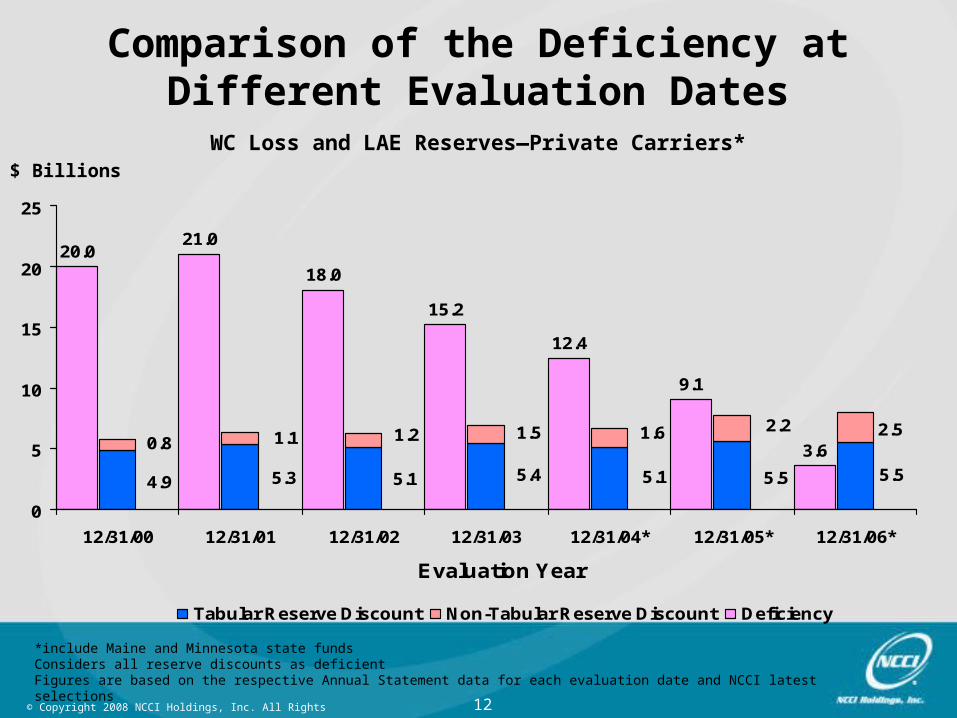
*include Maine and Minnesota state fundsConsiders all reserve discounts as deficientFigures are based on the respective Annual Statement data for each evaluation date and NCCI latest selections
$ Billions
Comparison of the Deficiency at Different Evaluation Dates
WC Loss and LAE Reserves—Private Carriers*
5.54.9 5.3 5.1 5.55.15.4
2.50.8 1.1 1.2
2.21.61.5
20.021.0
18.0
15.2
12.4
9.1
3.6
0
5
10
15
20
25
12/31/00 12/31/01 12/31/02 12/31/03 12/31/04* 12/31/05* 12/31/06*
Evaluation Year
Tabular Reserve Discount Non-Tabular Reserve Discount Deficiency
13© Copyright 2008 NCCI Holdings, Inc. All Rights Reserved.
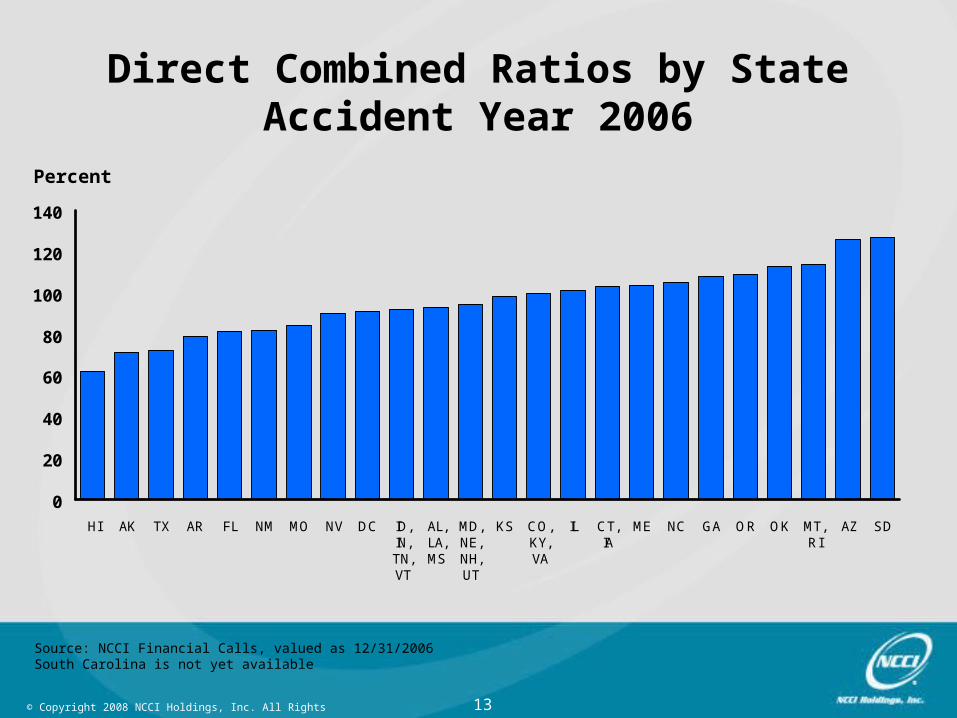
Direct Combined Ratios by StateAccident Year 2006
Percent
0
20
40
60
80
100
120
140
HI AK TX AR FL NM MO NV DC ID,IN,TN,VT
AL,LA,MS
MD,NE,NH,UT
KS CO,KY,VA
IL CT,IA
ME NC GA OR OK MT,RI
AZ SD
Source: NCCI Financial Calls, valued as 12/31/2006South Carolina is not yet available
14© Copyright 2008 NCCI Holdings, Inc. All Rights Reserved.
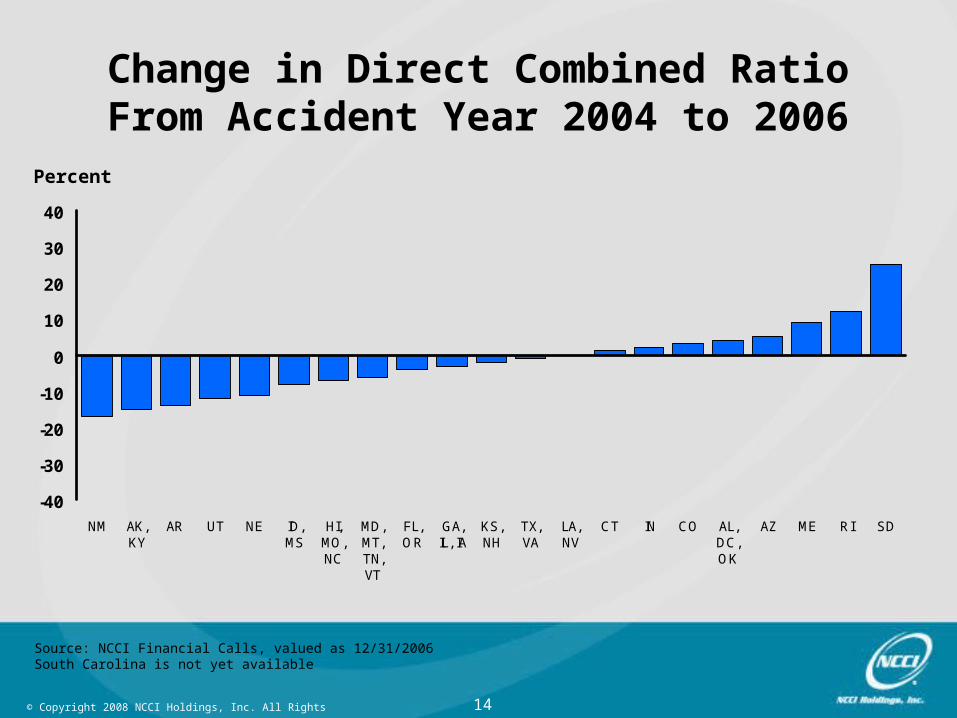
Change in Direct Combined RatioFrom Accident Year 2004 to 2006
Percent
-40
-30
-20
-10
0
10
20
30
40
NM AK,KY
AR UT NE ID,MS
HI,MO,NC
MD,MT,TN,VT
FL,OR
GA,IL, IA
KS,NH
TX,VA
LA,NV
CT IN CO AL,DC,OK
AZ ME RI SD
Source: NCCI Financial Calls, valued as 12/31/2006South Carolina is not yet available
15© Copyright 2008 NCCI Holdings, Inc. All Rights Reserved.
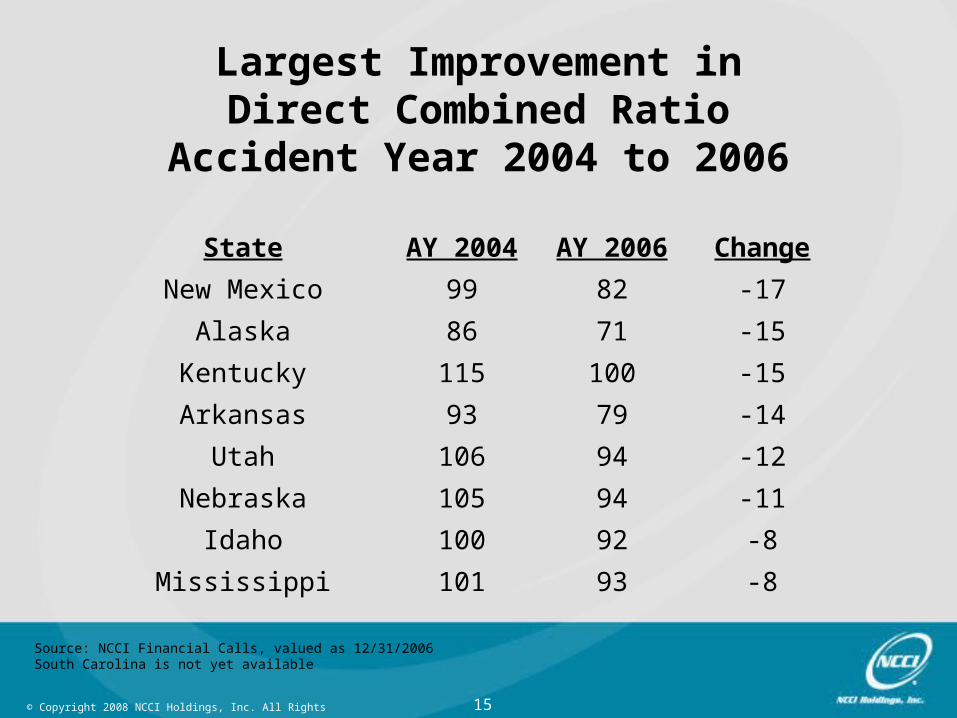
Largest Improvement inDirect Combined Ratio
Accident Year 2004 to 2006
Source: NCCI Financial Calls, valued as 12/31/2006South Carolina is not yet available
State AY 2004 AY 2006 Change
New Mexico 99 82 -17
Alaska 86 71 -15
Kentucky 115 100 -15
Arkansas 93 79 -14
Utah 106 94 -12
Nebraska 105 94 -11
Idaho 100 92 -8
Mississippi 101 93 -8
16© Copyright 2008 NCCI Holdings, Inc. All Rights Reserved.
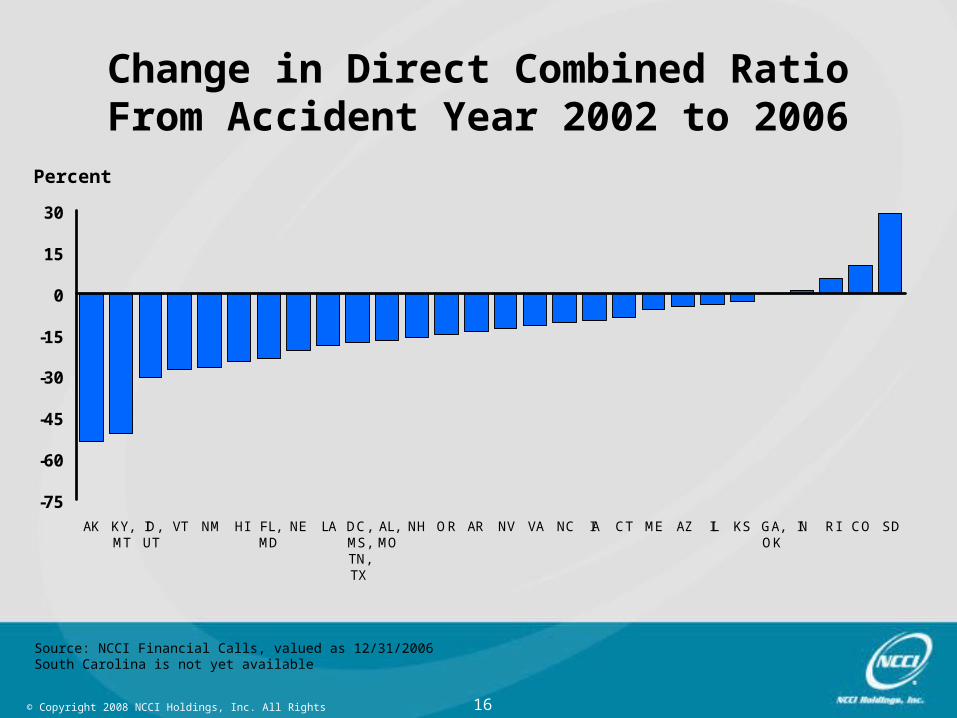
Change in Direct Combined RatioFrom Accident Year 2002 to 2006
Percent
-75
-60
-45
-30
-15
0
15
30
AK KY,MT
ID,UT
VT NM HI FL,MD
NE LA DC,MS,TN,TX
AL,MO
NH OR AR NV VA NC IA CT ME AZ IL KS GA,OK
IN RI CO SD
Source: NCCI Financial Calls, valued as 12/31/2006South Carolina is not yet available

17© Copyright 2008 NCCI Holdings, Inc. All Rights Reserved.
Largest Improvement inDirect Combined Ratio
Accident Year 2002 to 2006
Source: NCCI Financial Calls, valued as 12/31/2006South Carolina is not yet available
State AY 2002 AY 2006 Change
Alaska 125 71 -54
Kentucky 151 100 -51
Montana 165 114 -51
Idaho 123 92 -31
Utah 125 94 -31
Vermont 120 92 -28
New Mexico 109 82 -27
Hawaii 87 62 -25
18© Copyright 2008 NCCI Holdings, Inc. All Rights Reserved.
Workers Compensation
Premium Drivers
19© Copyright 2008 NCCI Holdings, Inc. All Rights Reserved.
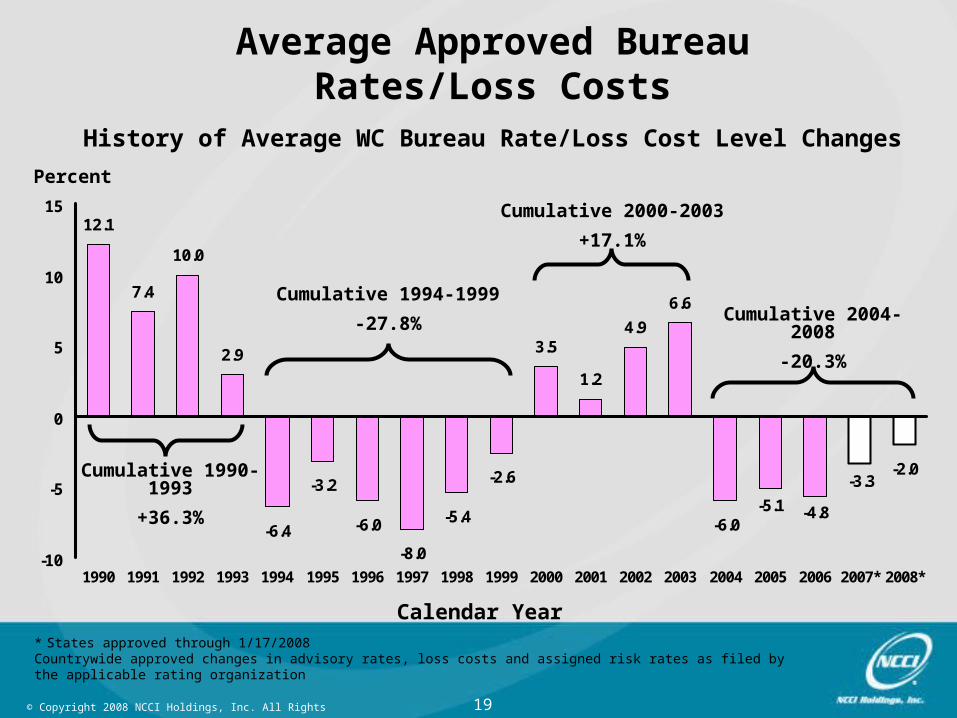
-3.3
12.1
7.4
10.0
2.9 3.5
1.2
4.9
6.6
-2.0
-6.0
-2.6
-5.4
-8.0
-6.0
-3.2
-6.4
-5.1 -4.8
-10
-5
0
5
10
15
1990 1991 1992 1993 1994 1995 1996 1997 1998 1999 2000 2001 2002 2003 2004 2005 2006 2007* 2008*
Cumulative 1990-1993
+36.3%
Cumulative 1994-1999
-27.8%
Average Approved BureauRates/Loss Costs
History of Average WC Bureau Rate/Loss Cost Level Changes
Percent
Cumulative 2000-2003
+17.1%
Cumulative 2004-2008
-20.3%
Calendar Year* States approved through 1/17/2008Countrywide approved changes in advisory rates, loss costs and assigned risk rates as filed by the applicable rating organization
20© Copyright 2008 NCCI Holdings, Inc. All Rights Reserved.
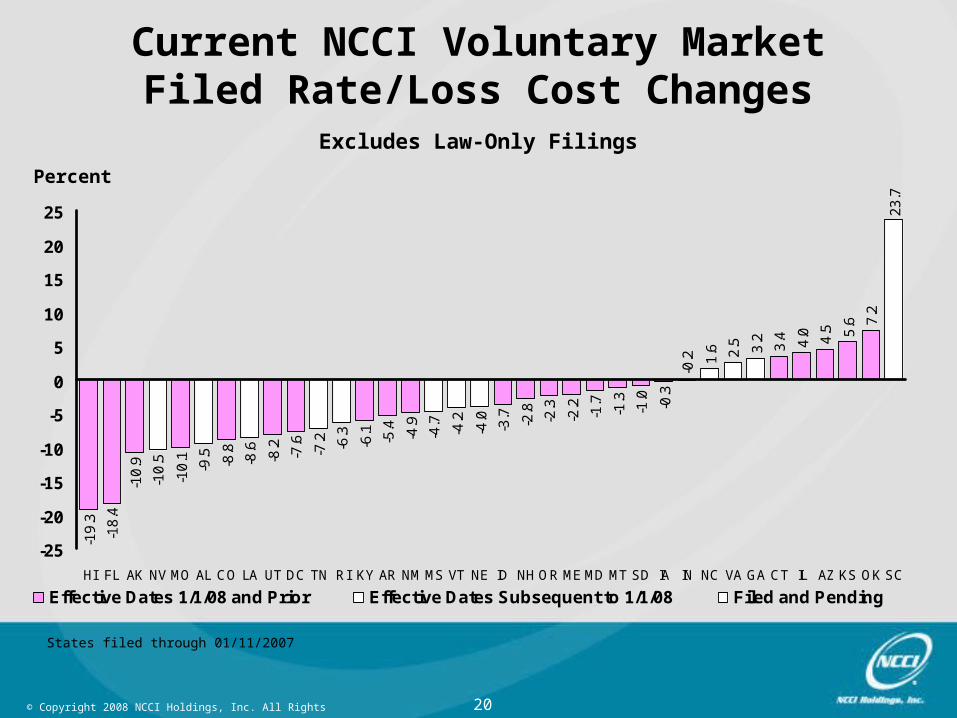
Current NCCI Voluntary MarketFiled Rate/Loss Cost Changes
Excludes Law-Only Filings
Percent
States filed through 01/11/2007
-19
.3
-18
.4
-10
.9
-10
.1 -8.8
-8.2
-7.6 -6
.1
-5.4
-4.9 -3
.7 -2.8
-2.3
-2.2
-1.7
-1.3
-1.0
-0.3
-0.2
3.4 4.0 4.5 5.6 7
.2
-9.5 -7
.2
-4.0
1.6 2.5 3.2
-10
.5 -8.6 -6
.3 -4.7
-4.2
23
.7
-25
-20
-15
-10
-5
0
5
10
15
20
25
HI FL AK NV MO AL CO LA UT DC TN RI KY AR NM MS VT NE ID NH OR ME MD MT SD IA IN NC VA GA CT IL AZ KS OK SC
Effective Dates 1/1/08 and Prior Effective Dates Subsequent to 1/1/08 Filed and Pending
21© Copyright 2008 NCCI Holdings, Inc. All Rights Reserved.
Percent
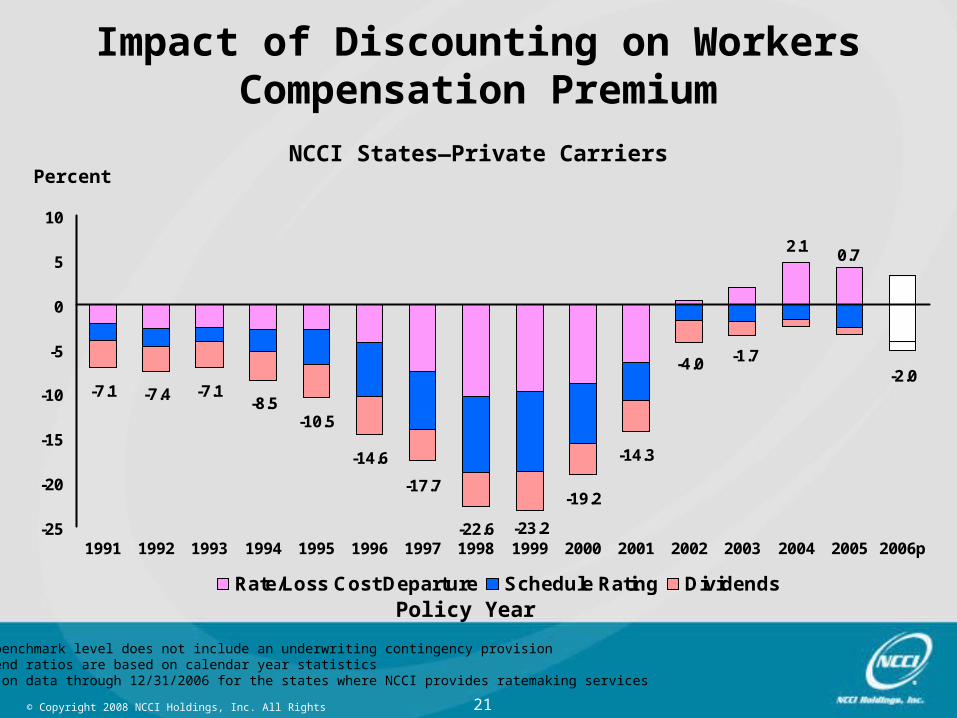
Impact of Discounting on Workers Compensation Premium
NCCI States—Private Carriers
NCCI benchmark level does not include an underwriting contingency provisionDividend ratios are based on calendar year statisticsBased on data through 12/31/2006 for the states where NCCI provides ratemaking services
Policy Year
-7.1 -7.4 -7.1-8.5
-10.5
-14.6
-17.7
-22.6
-19.2
-14.3
-4.0-2.0
-1.7
-23.2
2.10.7
-25
-20
-15
-10
-5
0
5
10
1991 1992 1993 1994 1995 1996 1997 1998 1999 2000 2001 2002 2003 2004 2005 2006p
Rate/Loss Cost Departure Schedule Rating Dividends
22© Copyright 2008 NCCI Holdings, Inc. All Rights Reserved.
Workers Compensation
Loss Drivers
23© Copyright 2008 NCCI Holdings, Inc. All Rights Reserved.
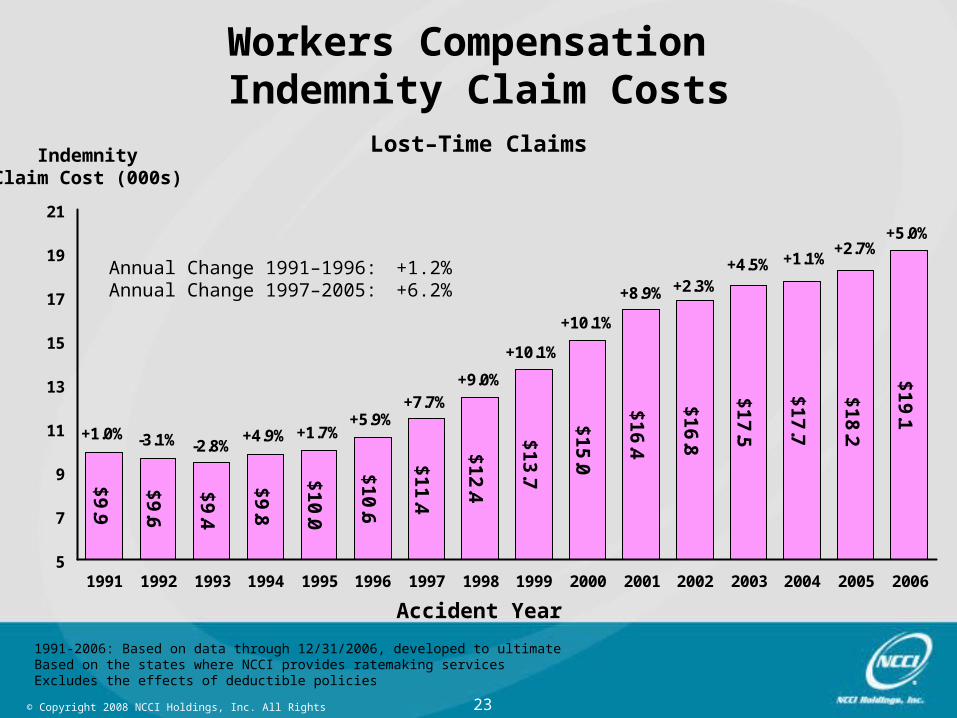
IndemnityClaim Cost (000s)
1991-2006: Based on data through 12/31/2006, developed to ultimateBased on the states where NCCI provides ratemaking servicesExcludes the effects of deductible policies
Workers Compensation Indemnity Claim Costs
Lost–Time Claims
Accident Year
$9
.9
$9
.6
$9
.4
$9
.8
$1
0.0
$1
0.6
$1
1.4
$1
2.4
$1
3.7
$1
5.0
$1
6.4
$1
6.8
$1
7.5
$1
9.1
$1
7.7
$1
8.2
+5.0%
+1.0% -3.1% -2.8%+4.9% +1.7%
+5.9%+7.7%
+9.0%
+10.1%
+10.1%
+8.9% +2.3%+4.5% +1.1%
+2.7%
5
7
9
11
13
15
17
19
21
1991 1992 1993 1994 1995 1996 1997 1998 1999 2000 2001 2002 2003 2004 2005 2006
Annual Change 1991–1996: +1.2%Annual Change 1997–2005: +6.2%
24© Copyright 2008 NCCI Holdings, Inc. All Rights Reserved.
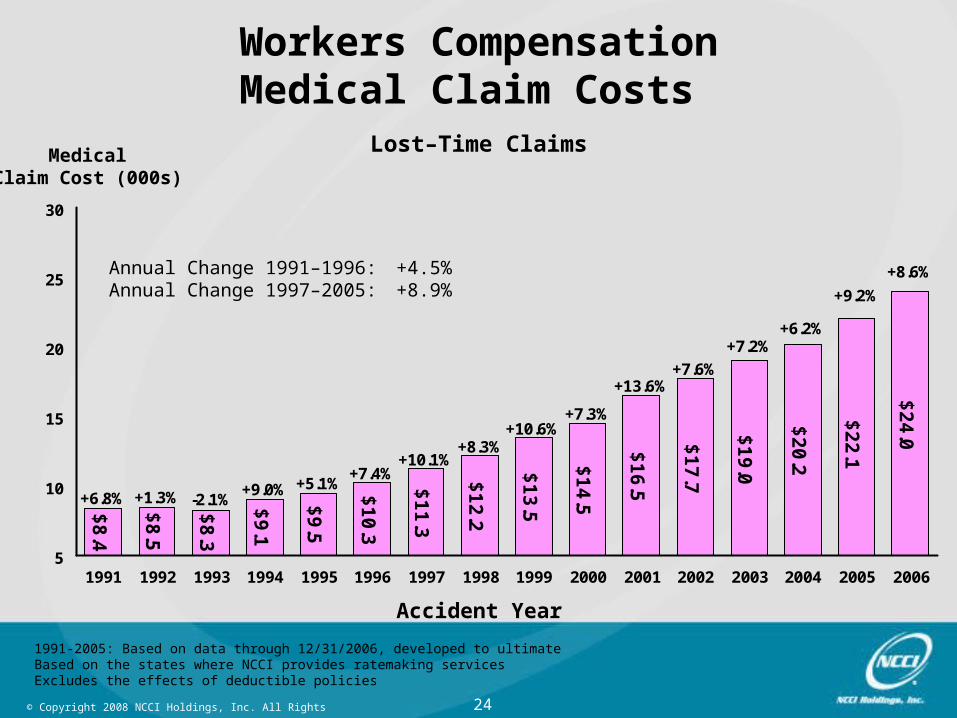
1991-2005: Based on data through 12/31/2006, developed to ultimateBased on the states where NCCI provides ratemaking servicesExcludes the effects of deductible policies
Workers CompensationMedical Claim Costs
Lost–Time ClaimsMedicalClaim Cost (000s)
Accident Year
$8
.4
$8
.5
$8
.3
$9
.1
$9
.5
$1
0.3
$1
1.3
$1
2.2
$1
3.5
$1
4.5
$1
6.5
$1
7.7
$1
9.0
$2
4.0
$2
0.2
$2
2.1
+8.6%
+6.8% +1.3% -2.1%+9.0% +5.1%
+7.4%+10.1%
+8.3%+10.6%
+7.3%
+13.6%+7.6%
+7.2%+6.2%
+9.2%
5
10
15
20
25
30
1991 1992 1993 1994 1995 1996 1997 1998 1999 2000 2001 2002 2003 2004 2005 2006
Annual Change 1991–1996: +4.5%Annual Change 1997–2005: +8.9%
25© Copyright 2008 NCCI Holdings, Inc. All Rights Reserved.
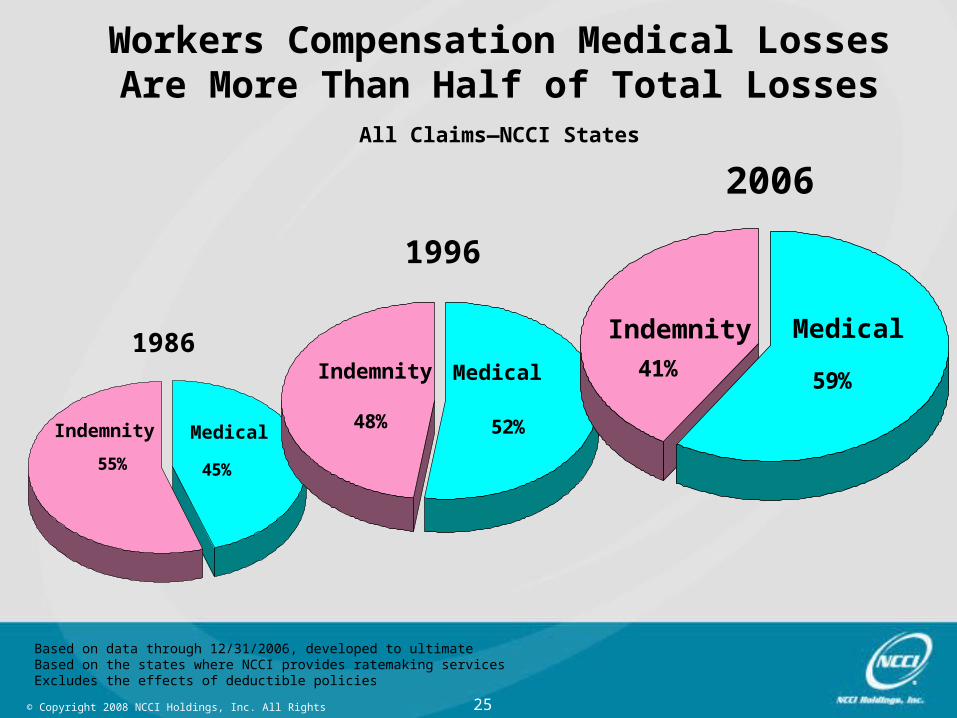
Workers Compensation Medical Losses Are More Than Half of Total Losses
All Claims—NCCI States
Based on data through 12/31/2006, developed to ultimateBased on the states where NCCI provides ratemaking servicesExcludes the effects of deductible policies
45%55%
1986
MedicalIndemnity
1996
48% 52%
Indemnity Medical
2006
41% 59%
Indemnity Medical
26© Copyright 2008 NCCI Holdings, Inc. All Rights Reserved.
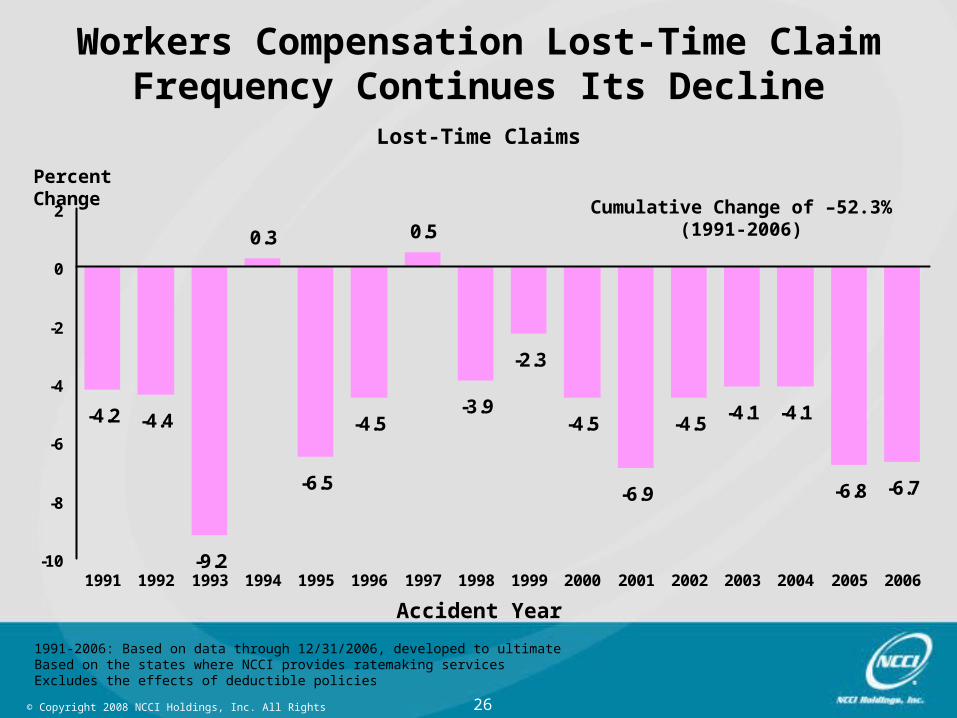
Percent Change
Workers Compensation Lost-Time Claim Frequency Continues Its Decline
Lost-Time Claims
Accident Year
1991-2006: Based on data through 12/31/2006, developed to ultimateBased on the states where NCCI provides ratemaking servicesExcludes the effects of deductible policies
-4.2 -4.4
-9.2
-6.9
-4.5-4.1 -4.1
-6.7
0.3
-6.5
-4.5
0.5
-3.9
-2.3
-4.5
-6.8
-10
-8
-6
-4
-2
0
2
1991 1992 1993 1994 1995 1996 1997 1998 1999 2000 2001 2002 2003 2004 2005 2006
Cumulative Change of –52.3%(1991-2006)
27© Copyright 2008 NCCI Holdings, Inc. All Rights Reserved.
Prescription Drug Study2007 Update
28© Copyright 2008 NCCI Holdings, Inc. All Rights Reserved.
How Are Workers Compensation Drug Costs Changing?
What percentage of workers compensation (WC) medical costs are prescription drugs? How has the percentage changed over time?
Do WC prescription drug costs differ by state?
What types of drugs are prescribed most often?
29© Copyright 2008 NCCI Holdings, Inc. All Rights Reserved.
WC Prescription Drug Cost Containment Options
Prescription drug-fee schedulesUsed in a majority of statesMany use Average Wholesale Price (AWP) Most also add a dispensing fee
Negotiation of lower prices
Mandated use of generic drugs
Pharmacy Benefit Managers (PBMs)
Formularies
30© Copyright 2008 NCCI Holdings, Inc. All Rights Reserved.
Key Findings
There are some signs that the WC prescription drug share of medical costs is leveling off, at least temporarily
Some states’ WC prescription drug costs vary significantly from average
Utilization is the significant driving force behind total cost
31© Copyright 2008 NCCI Holdings, Inc. All Rights Reserved.
Key Findings
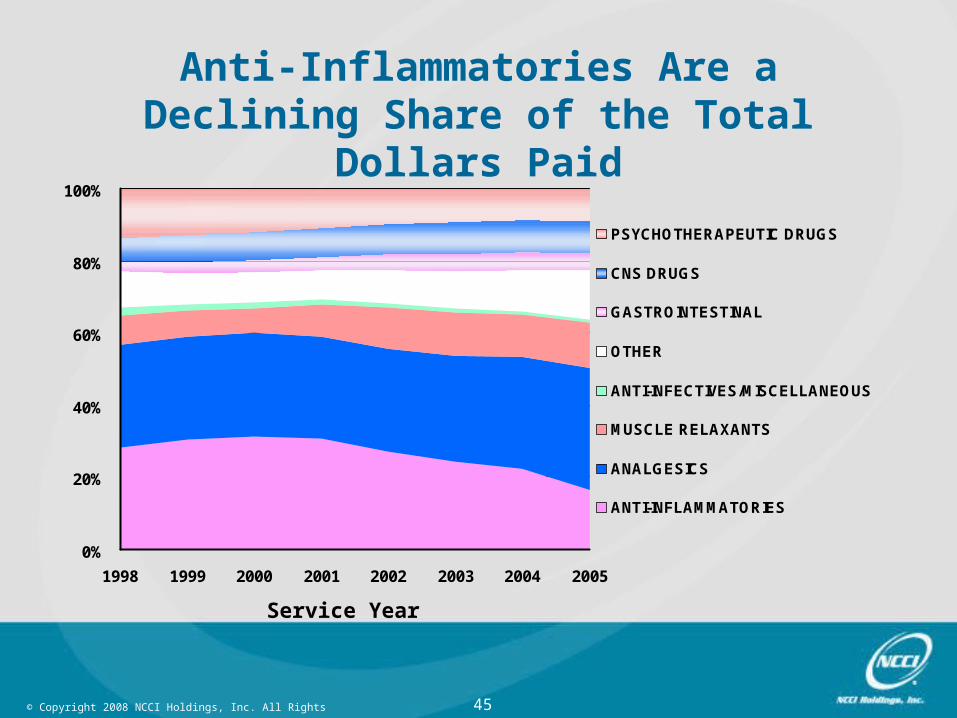
Anti-inflammatories and painkillers represent about half of total amount paid for drugs in 2005, and comprise 6 of the top 10 drugs
For drugs with generic equivalents, generics were prescribed 87% of the time in Service Year 2005
Additional savings of about 12% of total drug costs can be realized from using generic equivalents
32© Copyright 2008 NCCI Holdings, Inc. All Rights Reserved.
Study Design
Data includes a nationwide sample
Data covers claims from 1994 to 2005 and services from years 1996 to 2005
“Prescription drug” is defined as a transaction identified with a National Drug Code (NDC) or with carrier specialized codes
33© Copyright 2008 NCCI Holdings, Inc. All Rights Reserved.
Nationwide View
34© Copyright 2008 NCCI Holdings, Inc. All Rights Reserved.
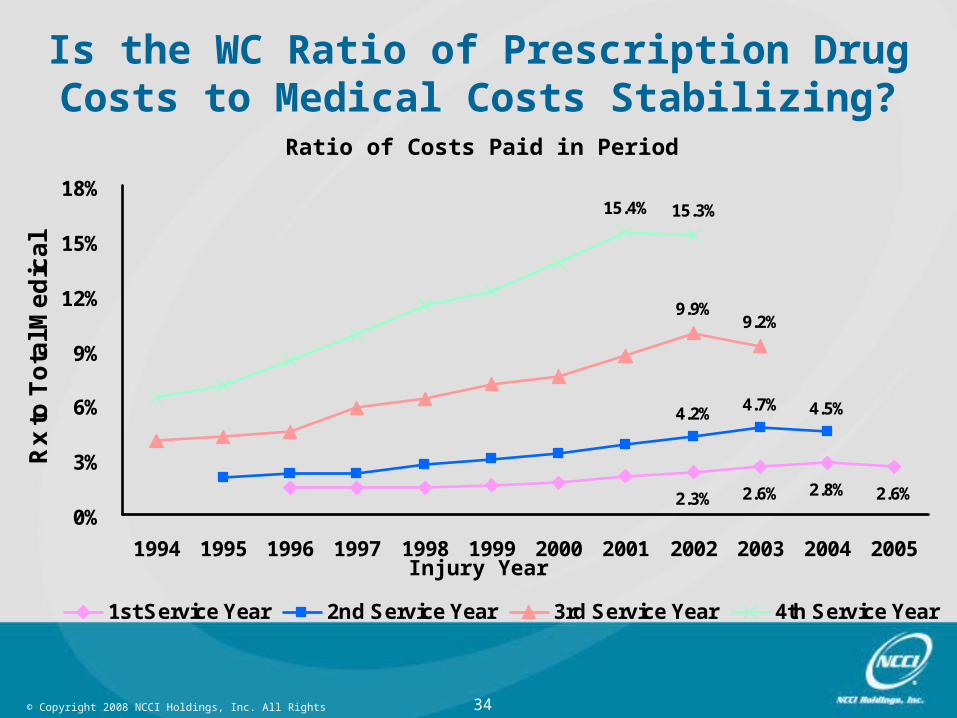
2.3% 2.6% 2.8% 2.6%
4.2% 4.7% 4.5%
9.2%9.9%
15.4% 15.3%
0%
3%
6%
9%
12%
15%
18%
1994 1995 1996 1997 1998 1999 2000 2001 2002 2003 2004 2005
Rx
to T
ota
l Me
dic
al
1st Service Year 2nd Service Year 3rd Service Year 4th Service Year
Is the WC Ratio of Prescription Drug Costs to Medical Costs Stabilizing?
Ratio of Costs Paid in Period
Injury Year
35© Copyright 2008 NCCI Holdings, Inc. All Rights Reserved.
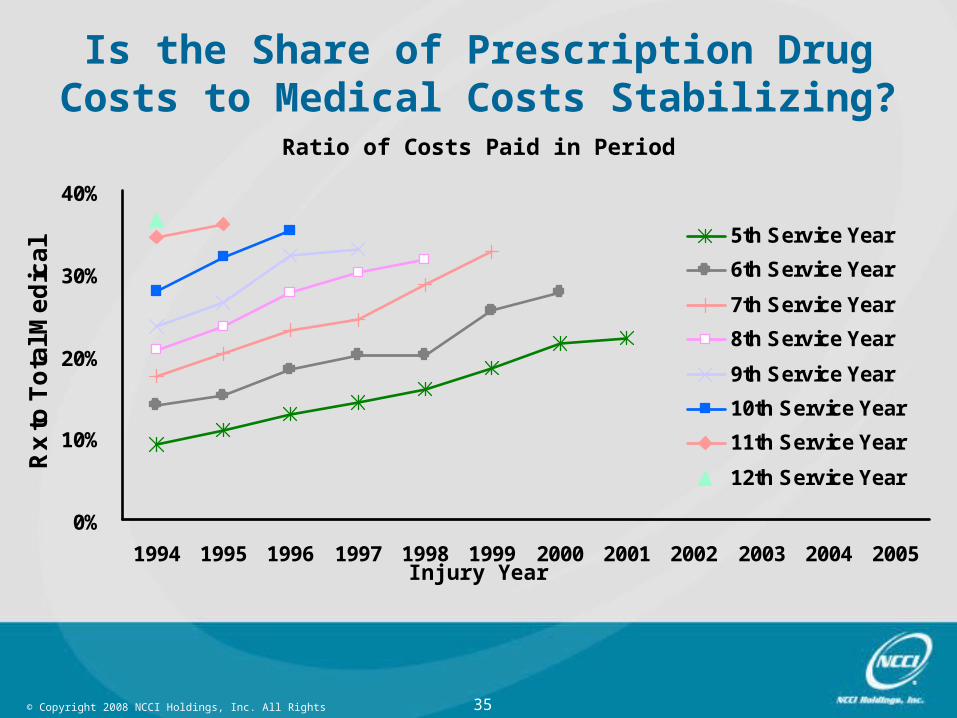
0%
10%
20%
30%
40%
1994 1995 1996 1997 1998 1999 2000 2001 2002 2003 2004 2005
Rx
to T
ota
l Me
dic
al 5th Service Year
6th Service Year
7th Service Year
8th Service Year
9th Service Year
10th Service Year
11th Service Year
12th Service Year
Is the Share of Prescription Drug Costs to Medical Costs Stabilizing?
Ratio of Costs Paid in Period
Injury Year
36© Copyright 2008 NCCI Holdings, Inc. All Rights Reserved.
Forecasting Rx Share of Medical Cost
Three scenarios naturally ariseLatest year is representative of the trendLatest year is an aberration; trend will continue at historical ratesTrends will continue at historical rates only after the fifth service year
We forecasted the Rx share under these three scenarios
37© Copyright 2008 NCCI Holdings, Inc. All Rights Reserved.
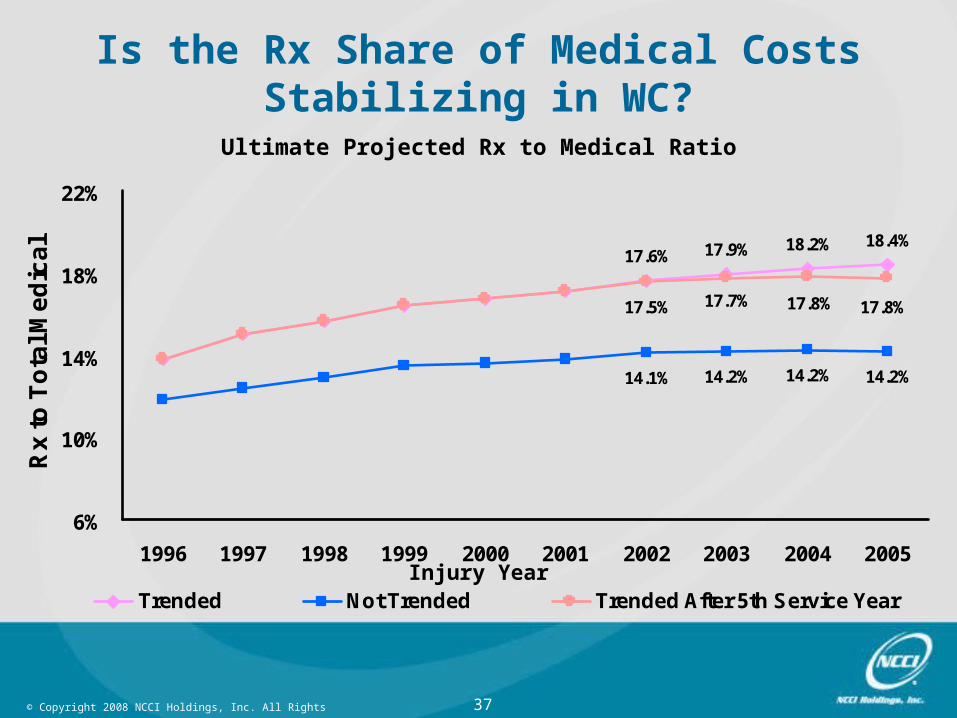
17.9%17.6%18.4%18.2%
14.1% 14.2% 14.2%14.2%
17.8%17.8%17.7%17.5%
6%
10%
14%
18%
22%
1996 1997 1998 1999 2000 2001 2002 2003 2004 2005
Rx
to
To
tal M
ed
ica
l
Trended Not Trended Trended After 5th Service Year
Is the Rx Share of Medical Costs Stabilizing in WC?
Ultimate Projected Rx to Medical Ratio
Injury Year
38© Copyright 2008 NCCI Holdings, Inc. All Rights Reserved.
-10%
0%
10%
20%
30%
40%
1998–1999 1999–2000 2000–2001 2001–2002 2002–2003 2003–2004 2004–2005p
Pe
rce
nta
ge
Ch
an
ge
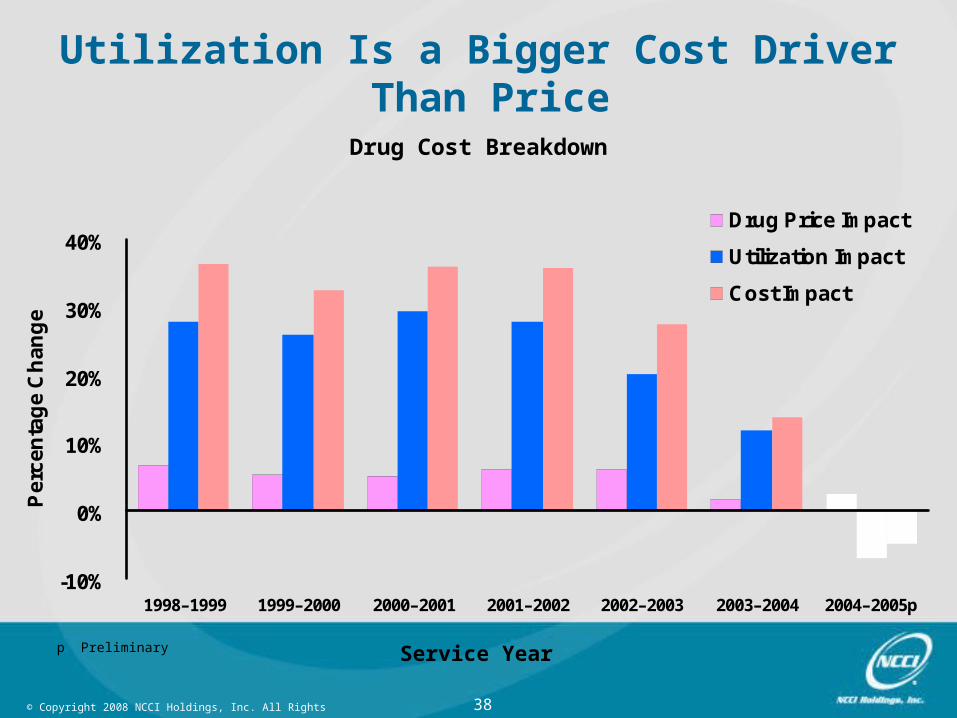
Drug Price Impact
Utilization Impact
Cost Impact
Utilization Is a Bigger Cost Driver Than Price
Drug Cost Breakdown
Service Yearp Preliminary
39© Copyright 2008 NCCI Holdings, Inc. All Rights Reserved.
Regional View

40© Copyright 2008 NCCI Holdings, Inc. All Rights Reserved.
WC Rx Cost per Claim
Below Average
Average
Above Average
OR
MT
KS
NE
OK
LA
MS
KY
TN
FL
WI
IN
GA
MN
TX
CO
ID
UT
AR
AL
SC
VA
NC
AZ
IL
MI
IA
MO
CA
NH
MA
CT
MD
PA
DE
41© Copyright 2008 NCCI Holdings, Inc. All Rights Reserved.
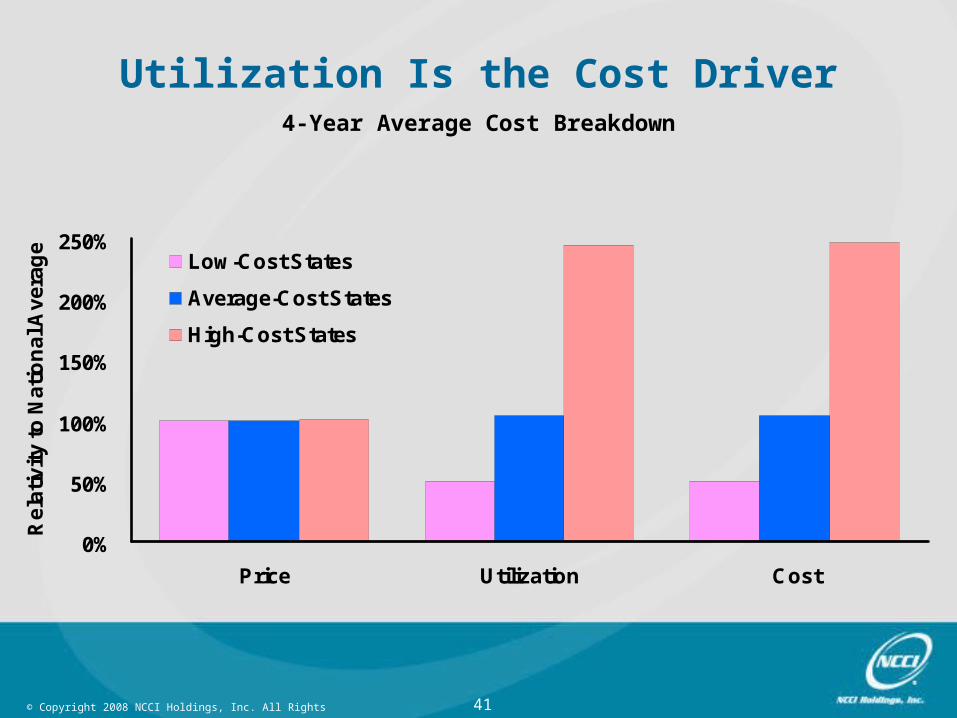
0%
50%
100%
150%
200%
250%
Price Utilization Cost
Re
lativ
ity
to N
atio
na
l Av
era
ge
Low-Cost States
Average-Cost States
High-Cost States
Utilization Is the Cost Driver4-Year Average Cost Breakdown
42© Copyright 2008 NCCI Holdings, Inc. All Rights Reserved.
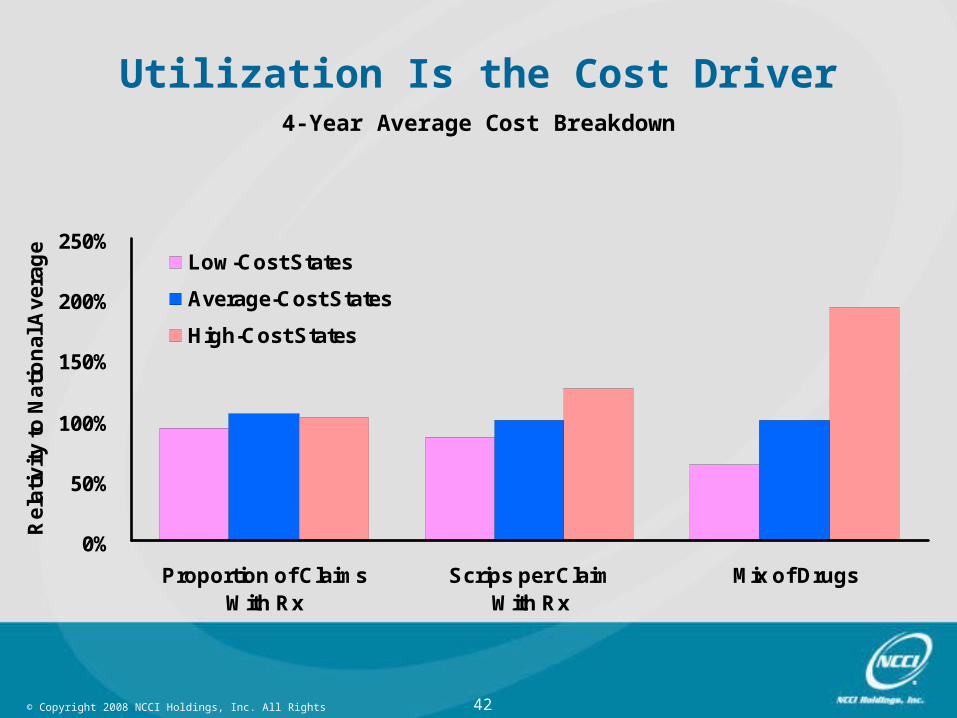
0%
50%
100%
150%
200%
250%
Proportion of ClaimsWith Rx
Scrips per ClaimWith Rx
Mix of Drugs
Re
lativ
ity
to N
atio
na
l Av
era
ge
Low-Cost States
Average-Cost States
High-Cost States
Utilization Is the Cost Driver4-Year Average Cost Breakdown

43© Copyright 2008 NCCI Holdings, Inc. All Rights Reserved.
Detailed View
44© Copyright 2008 NCCI Holdings, Inc. All Rights Reserved.
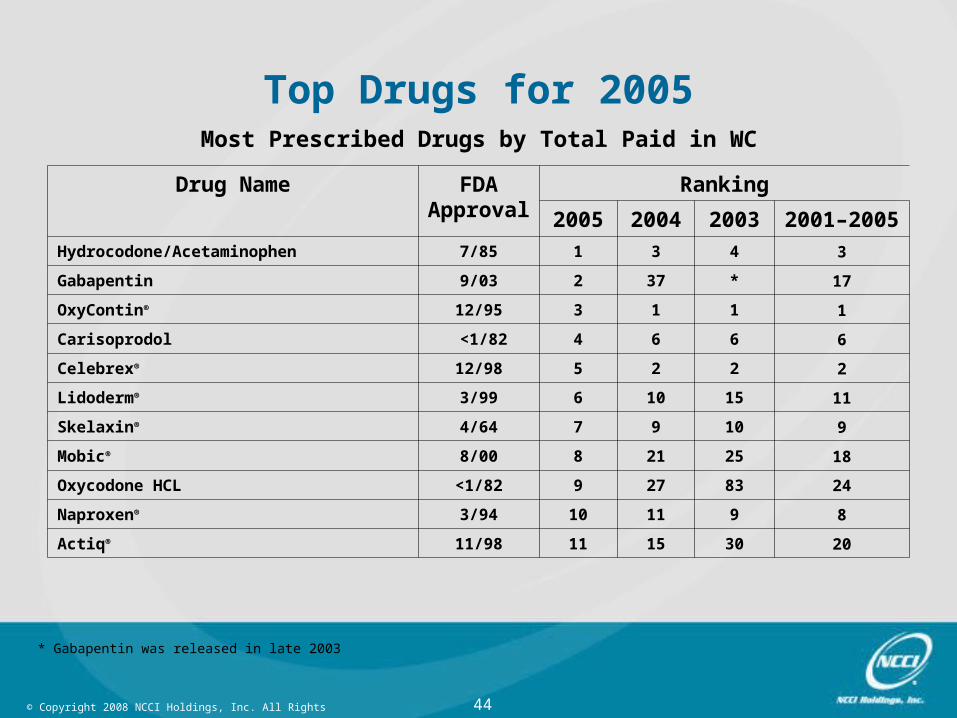
Top Drugs for 2005Most Prescribed Drugs by Total Paid in WC
Drug Name FDAApproval
Ranking
2005 2004 2003 2001–2005
Hydrocodone/Acetaminophen 7/85 1 3 4 3
Gabapentin 9/03 2 37 * 17
OxyContin® 12/95 3 1 1 1
Carisoprodol <1/82 4 6 6 6
Celebrex® 12/98 5 2 2 2
Lidoderm® 3/99 6 10 15 11
Skelaxin® 4/64 7 9 10 9
Mobic® 8/00 8 21 25 18
Oxycodone HCL <1/82 9 27 83 24
Naproxen® 3/94 10 11 9 8
Actiq® 11/98 11 15 30 20
* Gabapentin was released in late 2003
45© Copyright 2008 NCCI Holdings, Inc. All Rights Reserved.
Anti-Inflammatories Are a Declining Share of the Total Dollars Paid
0%
20%
40%
60%
80%
100%
1998 1999 2000 2001 2002 2003 2004 2005
Service Year
PSYCHOTHERAPEUTIC DRUGS
CNS DRUGS
GASTROINTESTINAL
OTHER
ANTI-INFECTIVES/MISCELLANEOUS
MUSCLE RELAXANTS
ANALGESICS
ANTI-INFLAMMATORIES
46© Copyright 2008 NCCI Holdings, Inc. All Rights Reserved.
0%
20%
40%
60%
80%
100%
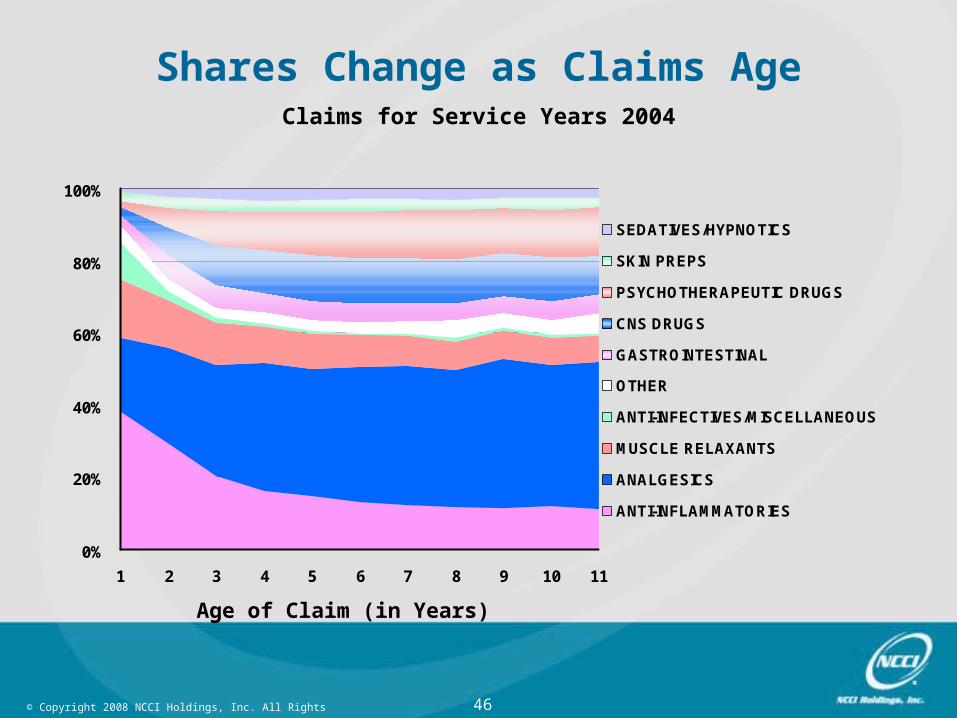
1 2 3 4 5 6 7 8 9 10 11
Age of Claim (in Years)
SEDATIVES/HYPNOTICS
SKIN PREPS
PSYCHOTHERAPEUTIC DRUGS
CNS DRUGS
GASTROINTESTINAL
OTHER
ANTI-INFECTIVES/MISCELLANEOUS
MUSCLE RELAXANTS
ANALGESICS
ANTI-INFLAMMATORIES
Shares Change as Claims AgeClaims for Service Years 2004
47© Copyright 2008 NCCI Holdings, Inc. All Rights Reserved.
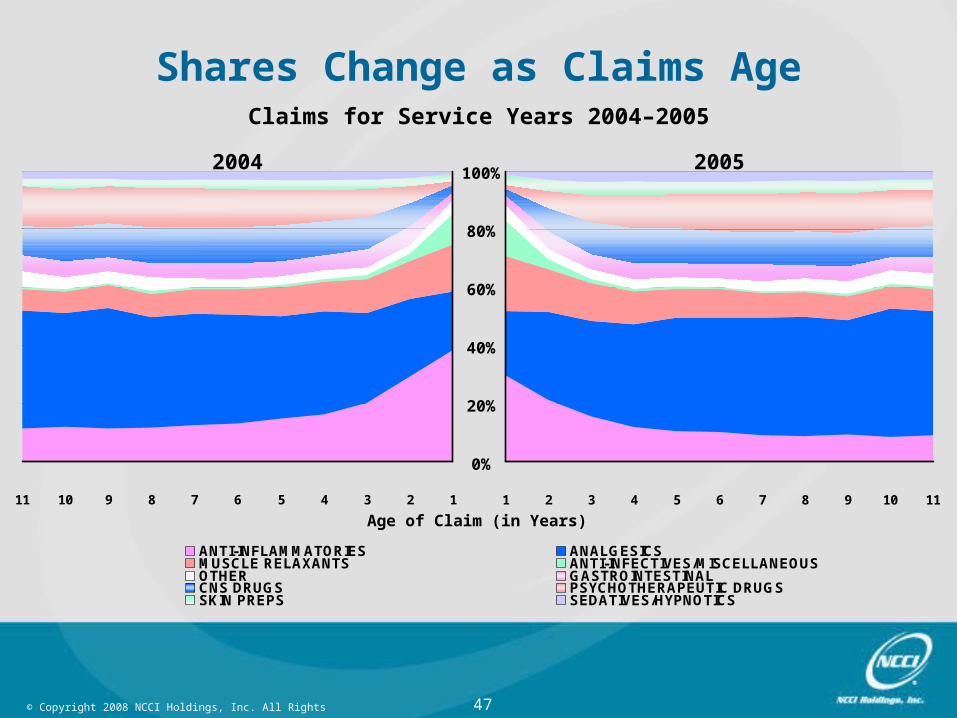
Shares Change as Claims AgeClaims for Service Years 2004–2005
ANTI-INFLAMMATORIES ANALGESICSMUSCLE RELAXANTS ANTI-INFECTIVES/MISCELLANEOUSOTHER GASTROINTESTINALCNS DRUGS PSYCHOTHERAPEUTIC DRUGSSKIN PREPS SEDATIVES/HYPNOTICS
1234567891011 1 2 3 4 5 6 7 8 9 10 11
Age of Claim (in Years)
100%
80%
60%
40%
20%
0%
2004 2005
48© Copyright 2008 NCCI Holdings, Inc. All Rights Reserved.
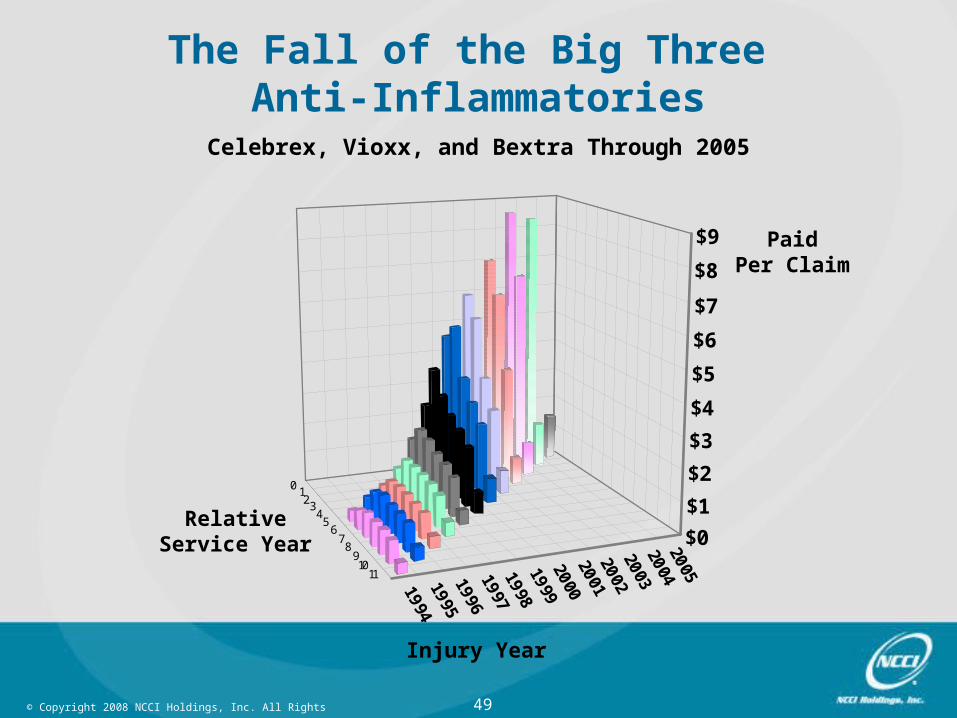
September 2004—Merck & Company voluntarily withdrew Vioxx® from the market
April 2005—At the request of the FDA, Pfizer voluntarily suspended sales of Bextra®
April 2005—The FDA allowed Pfizer to keep Celebrex® on the market, but with expanded risk information included in the labeling
The Fall of the Big Three Anti-Inflammatories
In 2003, Vioxx® ranked 5th, Bextra® ranked 7th, and Celebrex® ranked 2nd in terms of total dollars paid.
49© Copyright 2008 NCCI Holdings, Inc. All Rights Reserved.
0123
45
678
910
11
199419951996199719981999200020012002200320042005
$0
$1
$2
$3
$4
$5
$6
$7
$8
$9
The Fall of the Big Three Anti-Inflammatories
Celebrex, Vioxx, and Bextra Through 2005
Injury Year
RelativeService Year
PaidPer Claim
50© Copyright 2008 NCCI Holdings, Inc. All Rights Reserved.
012
345
67
8910
11199419951996199719981999200020012002200320042005
$0.00
$0.20
$0.40
$0.60
$0.80
$1.00
$1.20
$1.40
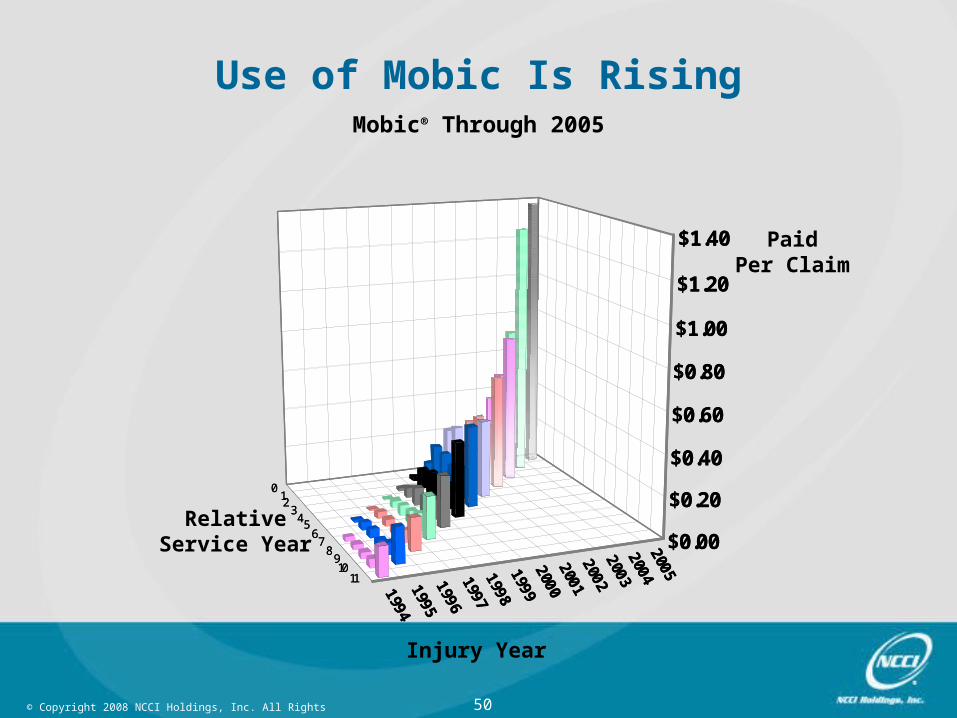
Use of Mobic Is RisingMobic® Through 2005
012
345
67
8910
11199419951996199719981999200020012002200320042005
$0.00
$0.20
$0.40
$0.60
$0.80
$1.00
$1.20
$1.40
Injury Year
RelativeService Year
PaidPer Claim
51© Copyright 2008 NCCI Holdings, Inc. All Rights Reserved.
Comments & DiscussionComments & Discussion
![Dynamic Reductions for Model Checking Concurrent Softwarealfons.laarman.com/slides/vmcai_2017_dynamic.pdf · Lipton Reduction [Lipton ’77, Lamport et al. ’89] Lipton Reduction](https://img.pdfslide.net/doc/110x75/5fd446796552407308296f61/dynamic-reductions-for-model-checking-concurrent-lipton-reduction-lipton-a77.jpg)