Embed Size (px)
Citation preview
WORKERS COMPENSATION- CURRENT ISSUES -
(SESSION WC-3)
Barry Lipton, FCAS, MAAA – NCCI
Nancy Treitel, FCAS, MAAA – Liberty Mutual
Casualty Actuarial Society2004 Seminar on Ratemaking
Philadelphia, PennsylvaniaMarch 11-12, 2004

2
Line of Business 2002 2003p ChangePersonal Auto 139.6 B$ 149.5 B$ 7.1%
Homeowners 40.0 B$ 44.6 B$ 11.5%
Other Liability (Incl Prod Liab) 30.9 B$ 38.4 B$ 24.1%
Workers Compensation $ 36.5 B 41.4 B$ 13.3%
Commercial Multiple Peril 25.4 B$ 27.9 B$ 9.7%
Commercial Auto 24.6 B$ 26.1 B$ 6.3%
Fire & Allied Lines (Incl EQ) 15.4 B$ 17.1 B$ 11.1%
All Other Lines 66.4 B$ 72.5 B$ 9.2%
Total All Lines 378.9 B$ 417.5 B$ 10.2%
Source: Best’s Aggregates & Averages, Review/Preview
(Includes state funds for: AZ, CA, ID, LA, MD, ME, MN, OR, RI, TX, and UT)
WC Premium Growth Leads Most Other Lines
Net Written Premium by Line
© 2004 National Council on Compensation Insurance, Inc.
3
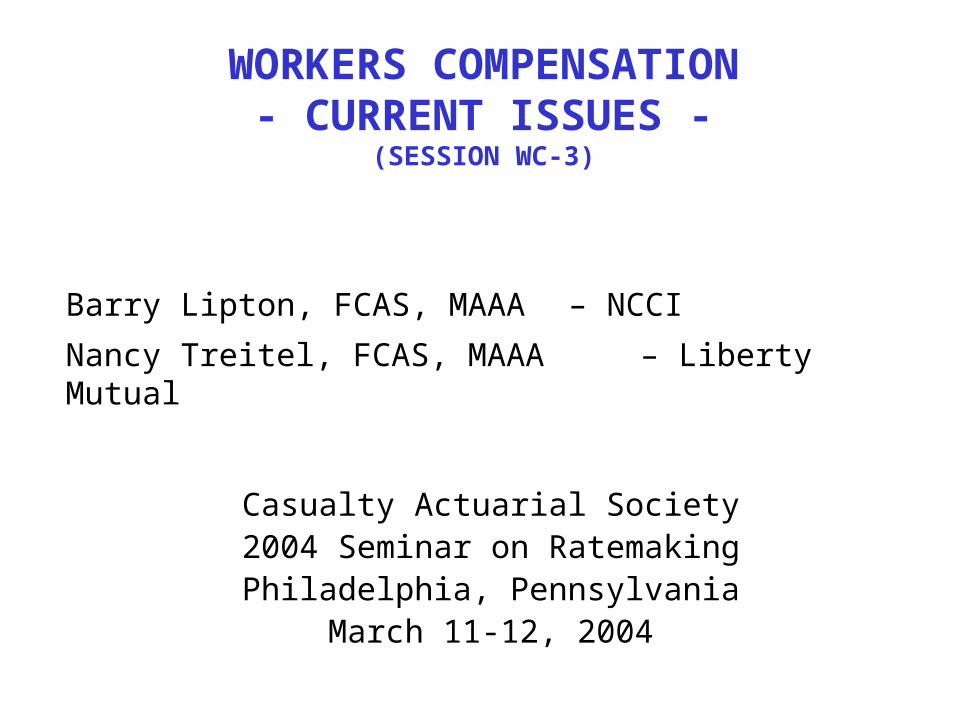
Line of Business 2001 2002 2003pPersonal Auto 108% 104% 99%
Homeowners 122% 109% 103%
Other Liability (Incl Prod Liab) 130% 137% 121%
Workers Compensation 121% 112% 110%
Commercial Multiple Peril 119% 105% 102%
Commercial Auto 116% 103% 94%
Fire & Allied Lines (Incl EQ) 127% 89% 85%
All Other 115% 105% 92%
Reinsurance Co's 163% 126% N/A
Total All Lines 116% 107% 101%
Combined Ratios Improved in 2003 Net Combined Ratios
© 2004 National Council on Compensation Insurance, Inc.
Source: Best’s Aggregates & Averages, Review/Preview
(Includes state funds for: AZ, CA, ID, LA, MD, ME, MN, OR, RI, TX, and UT)

4
14.5%
7.0%
9.5%
14.5%
7.5%
9.8%
0%
2%
4%
6%
8%
10%
12%
14%
16%
Drug Auto Mfg. (Big 3)
LargeBanks
Retail Life Ins. P/C Ins.(Proj.ROS)
Source: Value-Line, latest estimates as of 1/2004. P/C projected 2003 ROS from Best’s Review/Preview.
Return on Equity for Total P&C Appears In Line With Other Industries
Estimated 2003 After-Tax ROE for Public Companies
© 2004 National Council on Compensation Insurance, Inc.
5
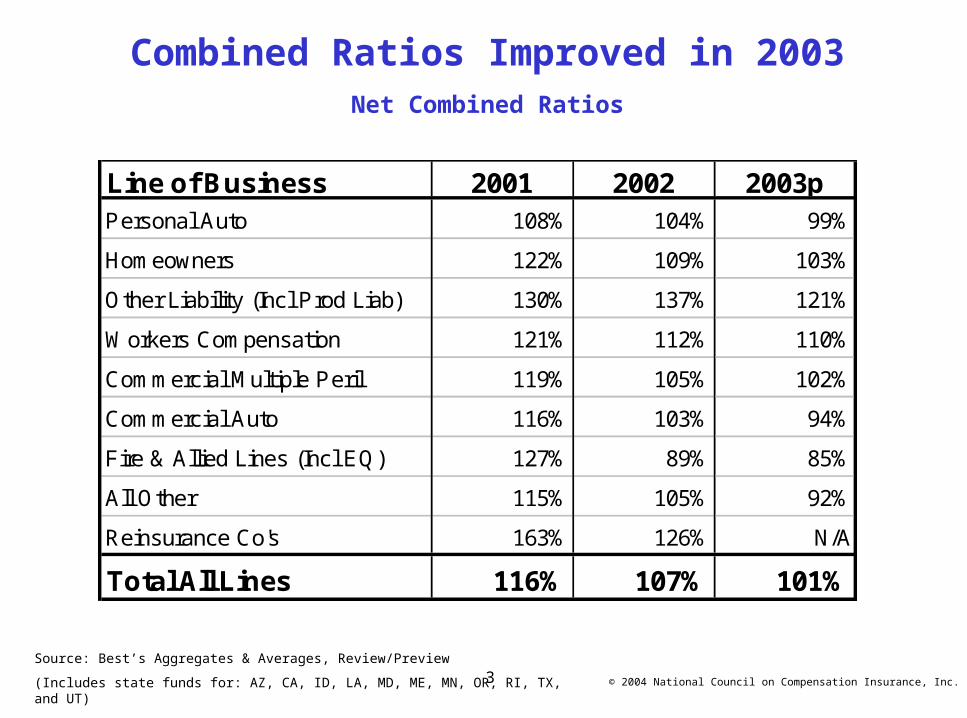
Workers Compensation Premium VolumeContinues to Grow
Workers Compensation Net Written Premium
34.3 32.7
25.7 24.628.1
31.436.5
41.4
26.527.7
29.5
0
10
20
30
40
50
60
1993 1994 1995 1996 1997 1998 1999 2000 2001 2002 2003p
Calendar Year
0.0
1.0
2.0
3.0
4.0
5.0
WC Net Written Premium ($ B) Private Nonfarm Wages and Salaries ($ T)
$ Billions $ Trillions
Source: Best’s Aggregates & Averages, Review/Preview; Economy.com
© 2004 National Council on Compensation Insurance, Inc.
6
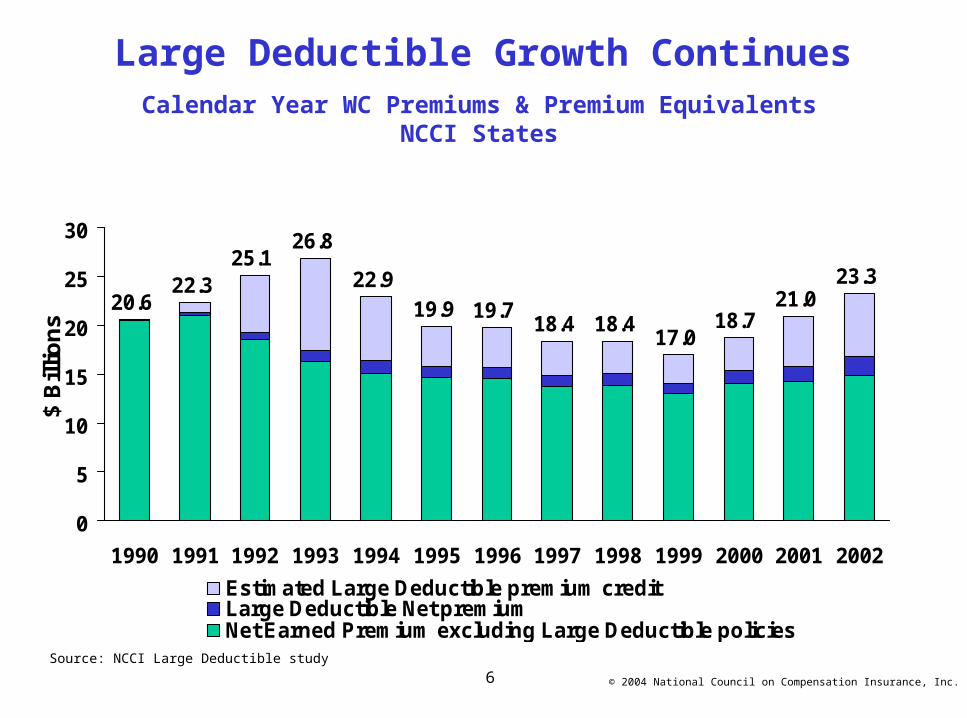
Large Deductible Growth ContinuesCalendar Year WC Premiums & Premium Equivalents
NCCI States
20.622.3
25.126.8
22.919.9 19.7
18.4 18.417.0
18.721.0
23.3
0
5
10
15
20
25
30
1990 1991 1992 1993 1994 1995 1996 1997 1998 1999 2000 2001 2002
$ B
illio
ns
Estimated Large Deductible premium creditLarge Deductible Net premiumNet Earned Premium excluding Large Deductible policies
Source: NCCI Large Deductible study
© 2004 National Council on Compensation Insurance, Inc.
7
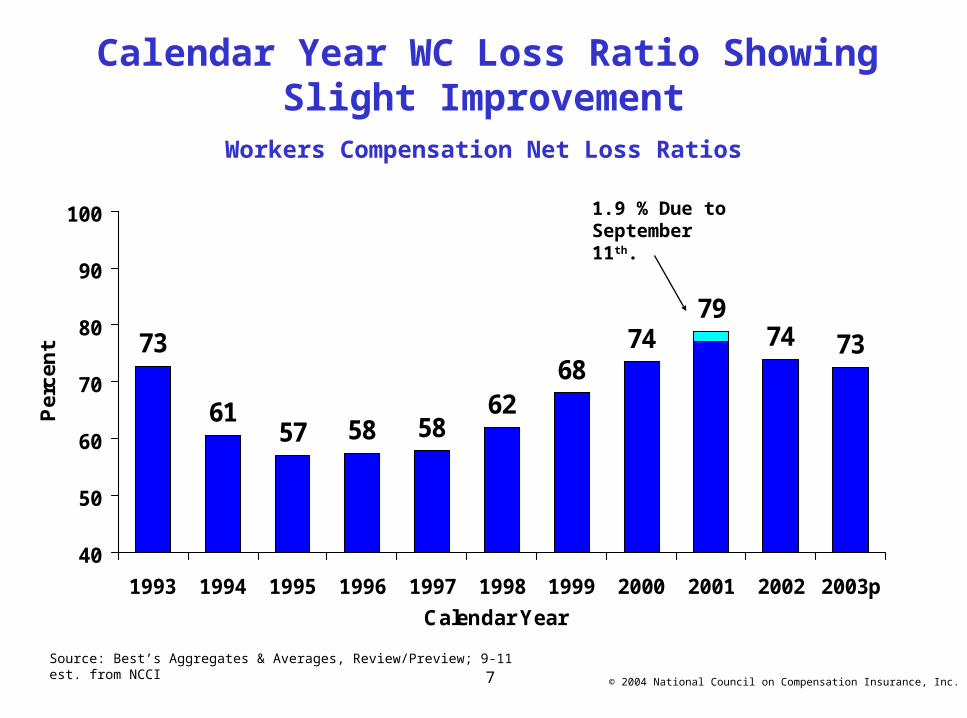
Calendar Year WC Loss Ratio Showing Slight Improvement
Workers Compensation Net Loss Ratios
73
6157 58 58
6268
7479
74 73
40
50
60
70
80
90
100
1993 1994 1995 1996 1997 1998 1999 2000 2001 2002 2003p
Calendar Year
Pe
rce
nt
Source: Best’s Aggregates & Averages, Review/Preview; 9-11 est. from NCCI
1.9 % Due to September 11th.
© 2004 National Council on Compensation Insurance, Inc.

8
WC Loss Ratios - Impact of Large Deductible Policies
First LargeDollar Deductible
Loss $ 75 $ 15Expense $ 25 $ 23Premium $100 $ 38
Loss Ratio 75% 40%Expense Ratio 25% 60%

9
WC LAE Ratios to Premium Appears to Have Leveled Off
WC Ratio of Loss Adjustment Expense to Net Earned Premiums
12.5 13.1 12.8
14.5 14.2
16.2 16.2 16.0
13.5 13.1 13.1
0
5
10
15
20
1993 1994 1995 1996 1997 1998 1999 2000 2001 2002 2003p
Calendar Year
Pe
rce
nt
Source: Best’s Aggregates & Averages, Review/Preview
© 2004 National Council on Compensation Insurance, Inc.
10
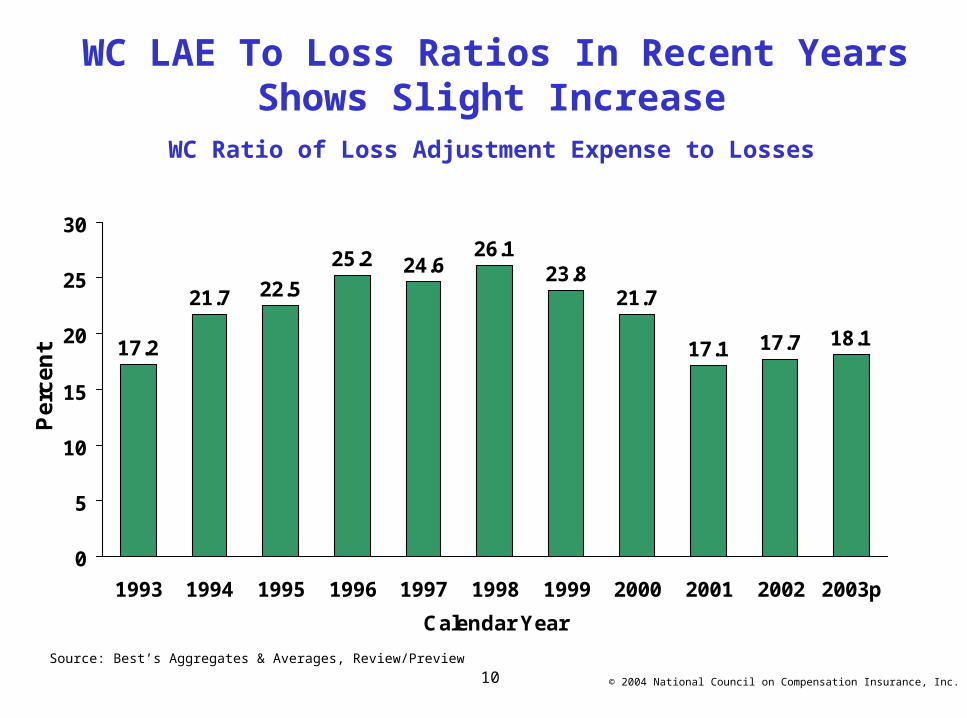
WC LAE To Loss Ratios In Recent Years Shows Slight Increase
WC Ratio of Loss Adjustment Expense to Losses
17.2
21.7 22.5
25.2 24.626.1
23.821.7
17.1 17.7 18.1
0
5
10
15
20
25
30
1993 1994 1995 1996 1997 1998 1999 2000 2001 2002 2003p
Calendar Year
Pe
rce
nt
Source: Best’s Aggregates & Averages, Review/Preview
© 2004 National Council on Compensation Insurance, Inc.
11
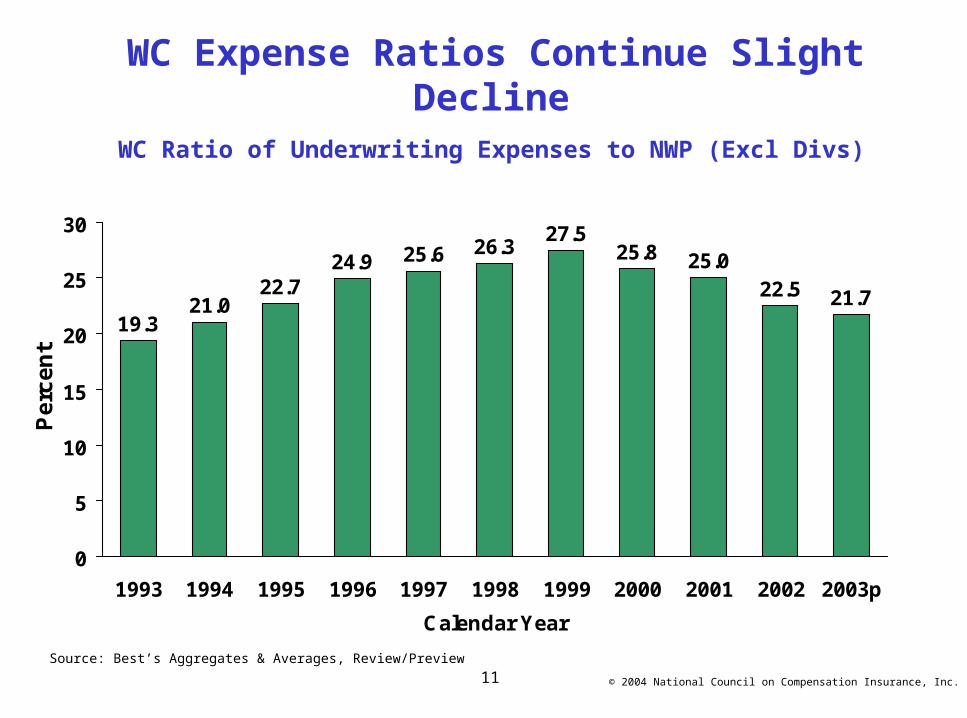
WC Expense Ratios Continue Slight Decline
WC Ratio of Underwriting Expenses to NWP (Excl Divs)
19.321.0
22.724.9 25.6 26.3
27.525.8 25.0
22.5 21.7
0
5
10
15
20
25
30
1993 1994 1995 1996 1997 1998 1999 2000 2001 2002 2003p
Calendar Year
Pe
rce
nt
Source: Best’s Aggregates & Averages, Review/Preview
© 2004 National Council on Compensation Insurance, Inc.
12
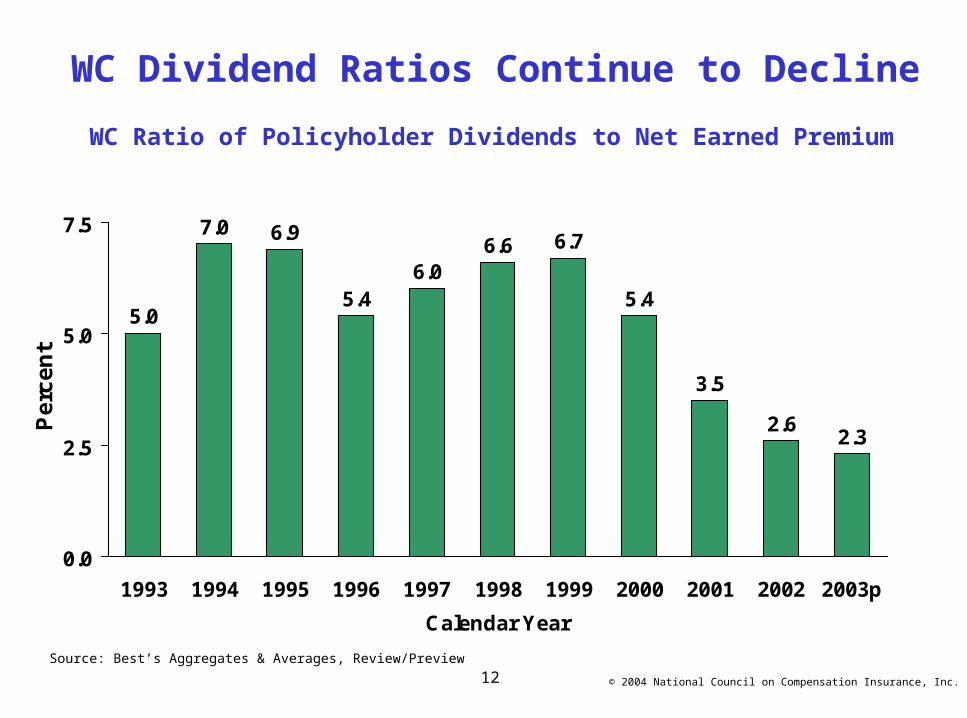
WC Dividend Ratios Continue to Decline
WC Ratio of Policyholder Dividends to Net Earned Premium
5.0
7.0 6.9
5.46.0
6.6 6.7
5.4
3.5
2.62.3
0.0
2.5
5.0
7.5
1993 1994 1995 1996 1997 1998 1999 2000 2001 2002 2003p
Calendar Year
Pe
rce
nt
Source: Best’s Aggregates & Averages, Review/Preview
© 2004 National Council on Compensation Insurance, Inc.

13
110102 100 102 104
111119 121 121
112 110
0
20
40
60
80
100
120
140
1993 1994 1995 1996 1997 1998 1999 2000 2001 2002 2003p
Loss LAE Underwriting Expense Dividends
Workers Compensation Calendar Year Combined Ratio Declined in
2003Workers Compensation Combined Ratios
Source: Best’s Aggregates & Averages, Review/Preview
1.9% Due to September 11th
© 2004 National Council on Compensation Insurance, Inc.
14
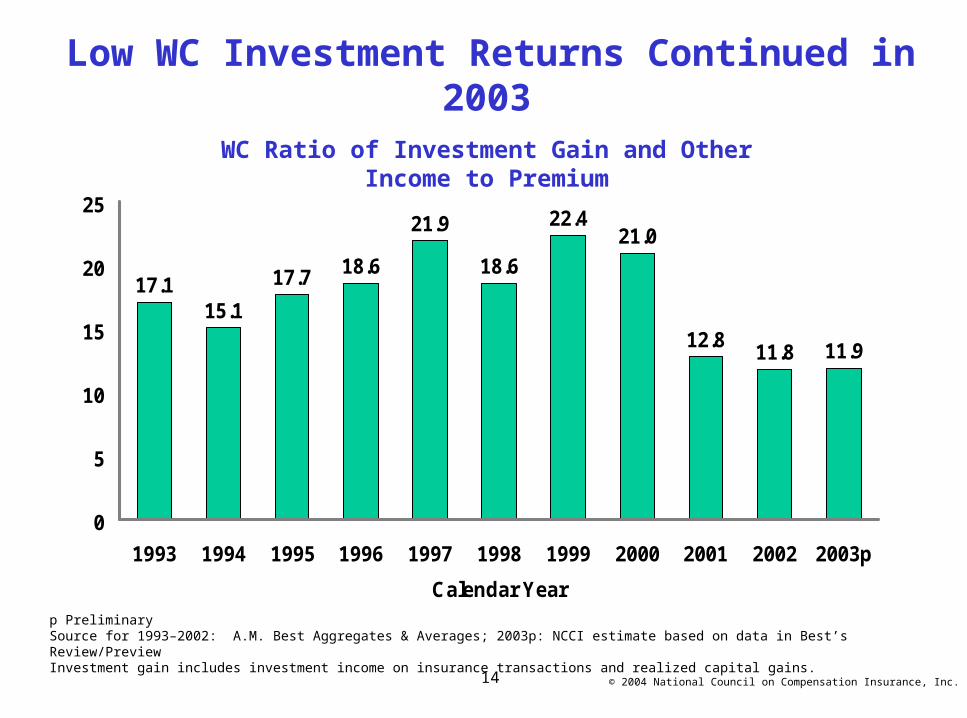
17.115.1
17.7 18.6
21.9
18.6
22.421.0
12.811.8 11.9
0
5
10
15
20
25
1993 1994 1995 1996 1997 1998 1999 2000 2001 2002 2003p
Calendar Year
Low WC Investment Returns Continued in 2003
WC Ratio of Investment Gain and OtherIncome to Premium
© 2004 National Council on Compensation Insurance, Inc.
p PreliminarySource for 1993–2002: A.M. Best Aggregates & Averages; 2003p: NCCI estimate based on data in Best’s Review/PreviewInvestment gain includes investment income on insurance transactions and realized capital gains.

15
7.6
13.5
18.216.2
7.4
3.9
0.2
-0.4
2.4
18.2
-8.1
-15
-10
-5
0
5
10
15
20
25
1993 1994 1995 1996 1997 1998 1999 2000 2001 2002 2003p
Calendar Year
WC Results in 2003 Improved Over 2002
WC Pretax Operating Gain/Loss Ratio
p PreliminarySource for 1993–2002: A.M. Best Aggregates & Averages; 2003p: NCCI estimate based on data in Best’s Review/PreviewInvestment gain includes investment income on insurance transactions and realized capital gains.
© 2004 National Council on Compensation Insurance, Inc.
16
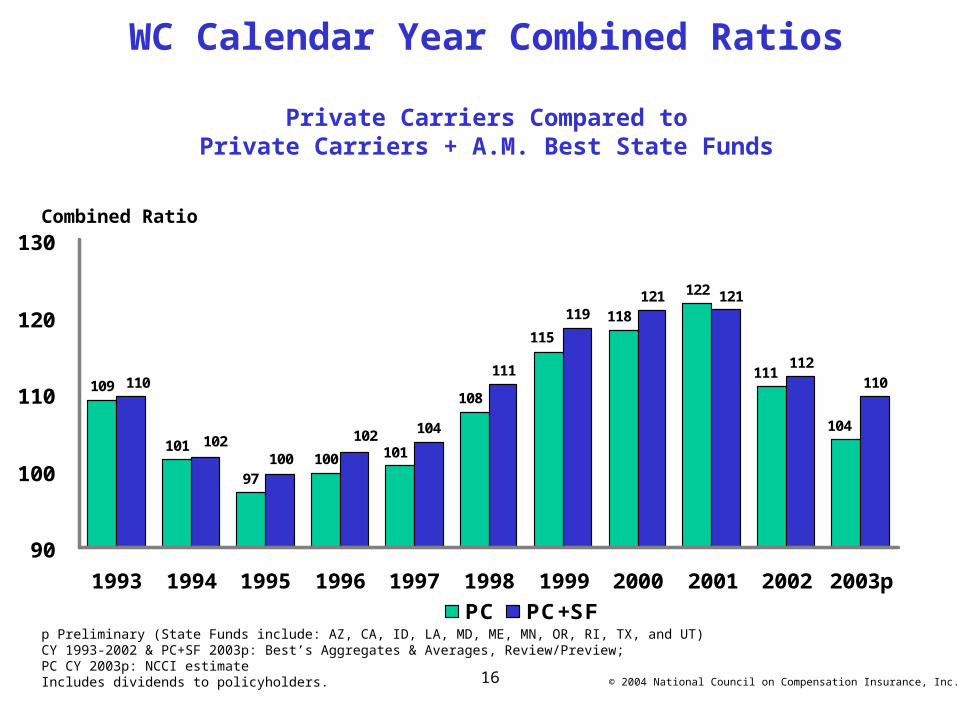
109
101
97100
122
104
111
119121
112
101
108
111
115
118
104
121
110
102
100
110
102
90
100
110
120
130
1993 1994 1995 1996 1997 1998 1999 2000 2001 2002 2003p
PC PC+SFp Preliminary (State Funds include: AZ, CA, ID, LA, MD, ME, MN, OR, RI, TX, and UT)CY 1993-2002 & PC+SF 2003p: Best’s Aggregates & Averages, Review/Preview; PC CY 2003p: NCCI estimateIncludes dividends to policyholders.
Combined Ratio
© 2004 National Council on Compensation Insurance, Inc.
WC Calendar Year Combined Ratios
Private Carriers Compared toPrivate Carriers + A.M. Best State Funds

17
109
10197
100 101
108
115118
122
111
119
129
137133
125
107104
101
106
101
9597
90
100
110
120
130
140
1993 1994 1995 1996 1997 1998 1999 2000 2001 2002 2003p
Calendar Year Accident Yearp PreliminaryCY 1993-2002: Best’s Aggregates & Averages; AY 1993-2002: NCCI; CY & AY 2003p: NCCI estimatesAccident year data is evaluated as of 12/31/2002 and developed to ultimate.Includes dividends to policyholders.
Combined Ratio in AY 2002 Continued to Improve
WC Calendar Year vs. Ultimate Accident YearCountrywide - Private Carriers
Combined Ratio
© 2004 National Council on Compensation Insurance, Inc.
18
What Have Been The Key Factors Impacting Workers Compensation Results?
• Carrier Reserves
• Carrier Pricing
• Loss Severity Trends (especially Medical)
• Frequency Trends
• Investments
© 2004 National Council on Compensation Insurance, Inc.
19
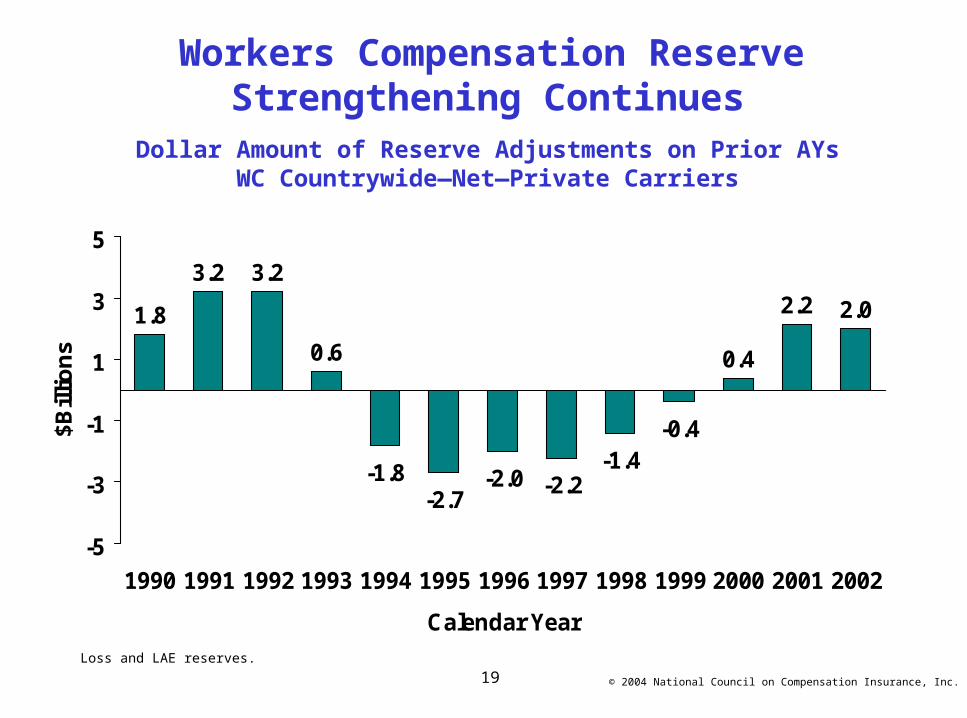
Workers Compensation Reserve Strengthening Continues
Dollar Amount of Reserve Adjustments on Prior AYsWC Countrywide—Net—Private Carriers
1.8
3.2 3.2
0.6
-1.8-2.7
-2.0 -2.2-1.4
-0.4
2.2 2.0
0.4
-5
-3
-1
1
3
5
1990 1991 1992 1993 1994 1995 1996 1997 1998 1999 2000 2001 2002
Calendar Year
$Bill
ion
s
Loss and LAE reserves.
© 2004 National Council on Compensation Insurance, Inc.

20
Reserve Releases Have Partially Offset the Upward Development on More Recent
Accident Years for WC
Accident Year Loss Ratios Including LAE
82%80%
78% 77%79%
81%84% 83% 83%
75%
83%
90% 91%
68%67% 66%
72%
83%
95%
65%
70%
75%
80%
85%
90%
95%
100%
1993 1994 1995 1996 1997 1998 1999 2000 2001 2002
Accident Year
Lo
ss
an
d L
AE
Ra
tio
At First Report As of 12/02
Reserve Releases
Reported Loss and LAE reserves from Schedule P.© 2004 National Council on Compensation Insurance, Inc.
21
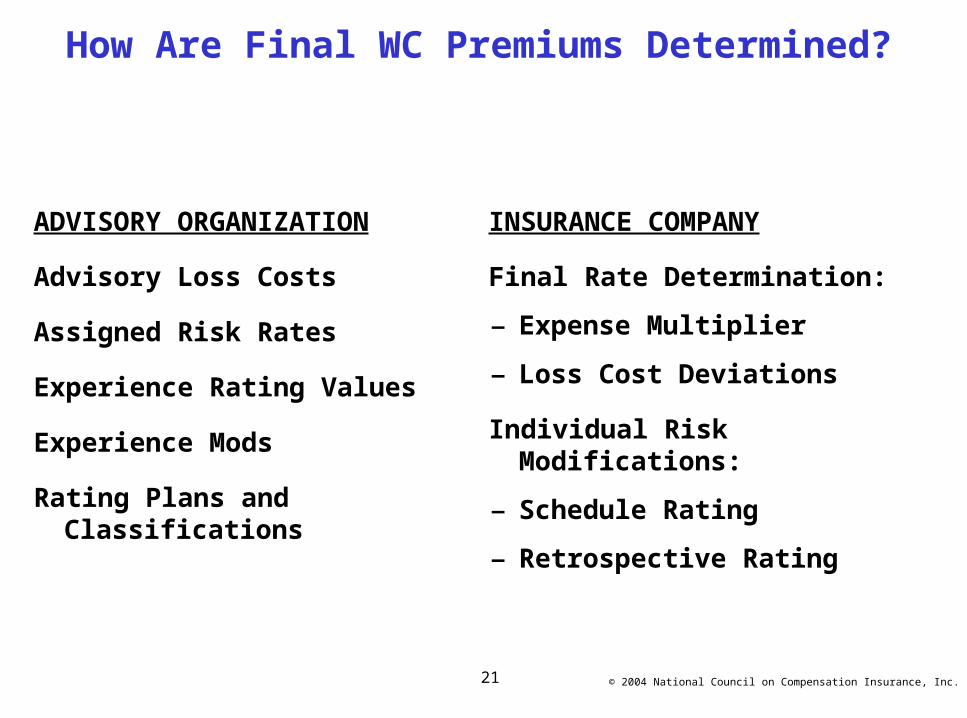
How Are Final WC Premiums Determined?
ADVISORY ORGANIZATION
Advisory Loss Costs
Assigned Risk Rates
Experience Rating Values
Experience Mods
Rating Plans and Classifications
INSURANCE COMPANY
Final Rate Determination:
– Expense Multiplier
– Loss Cost Deviations
Individual Risk Modifications:
– Schedule Rating
– Retrospective Rating
© 2004 National Council on Compensation Insurance, Inc.

22
Following Six Years of Decreases, the Average Approved Bureau Rate/Loss Cost Changes Have
Been Increases for the Last Three YearsHistory of Average WC Bureau Rate/Loss Cost Level Changes
6.1
12.1
7.4
10.0
2.9
-6.4
-3.2
-6.0-8.0
-5.4
-2.6
3.5
1.2
6.6
-3.5
4.9
-10
-6
-2
2
6
10
14
Calendar Year
Pe
rce
nt
Cumulative 1990-1993
+36.2%
Cumulative 1994-1999
-27.7%
p Preliminary (states approved to date in 2004).Countrywide approved changes in advisory rates, loss costs and assigned risk rates as filed by the applicable rating organization. The countrywide change is a weighted average of individual state changes based on state premium volumes and ignoring effective dates. © 2004 National Council on Compensation Insurance, Inc.
Cumulative 2000-2003+17.0%
23
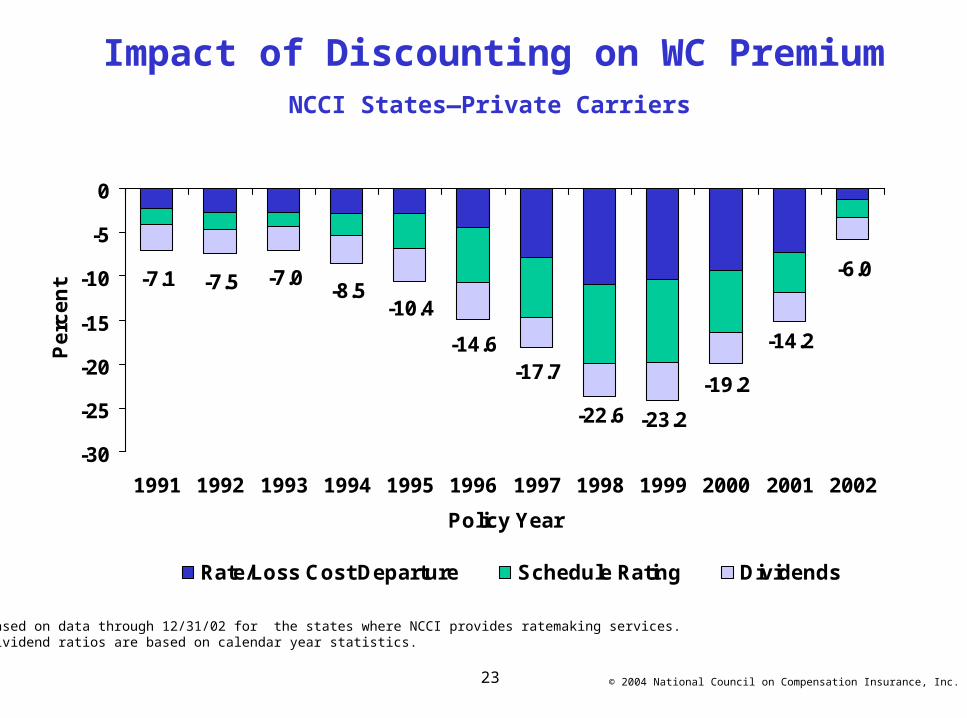
-7.1 -7.5 -7.0-8.5
-10.4
-14.6-17.7
-22.6 -23.2
-19.2
-14.2
-6.0
-30
-25
-20
-15
-10
-5
0
1991 1992 1993 1994 1995 1996 1997 1998 1999 2000 2001 2002
Policy Year
Pe
rce
nt
Rate/Loss Cost Departure Schedule Rating Dividends
Impact of Discounting on WC Premium
NCCI States—Private Carriers
Based on data through 12/31/02 for the states where NCCI provides ratemaking services.Dividend ratios are based on calendar year statistics.
© 2004 National Council on Compensation Insurance, Inc.

24
Loss Cost = f (customer, company, and/or industry losses,inflation, interest rate, medicaltechnology, economy, etc.)
+ Risk Charge + Expenses + Tax Premium
What are Some Key Components and Factors for WC Premiums?

25
$9
.7
$9
.4
$9
.1
$9
.6
$9
.7
$1
0.3
$1
1.0
$1
1.8
$1
2.8
$1
4.2
$1
5.2
$1
6.1+1.0% +1.7%
+5.9%+6.9%
+7.3%
+8.3%
+10.5%
+7.3%+6.0%
-3.1% -2.8%+4.9%
5
7
9
11
13
15
17
1991 1992 1993 1994 1995 1996 1997 1998 1999 2000 2001 2002
Accident Year
Av
era
ge
Ind
em
nit
y C
laim
Co
st
pe
r L
os
t-T
ime
Cla
im (
00
0s
)
Annual Change 1991–1995: +0.3%
Annual Change 1996–2002: +7.5%
The Rate of Change in Workers Compensation Indemnity Claim Costs
Has Accelerated Since 1995
Based on data through 12/31/02, developed to ultimate.Based on the states where NCCI provides ratemaking services.Excludes the effects of deductible policies.
© 2004 National Council on Compensation Insurance, Inc.

26
2.8% 2.8%
4.1%4.7%
4.2%4.9%
4.2%
2.2%1.7%
5.9%6.9% 7.3%
8.3%
10.5%
7.3%
6.0%
0%
2%
4%
6%
8%
10%
12%
1995 1996 1997 1998 1999 2000 2001 2002
Year
Change in CPS wage Change in Indemnity Cost Per Lost Time Claim
WC Indemnity Severity Is Outpacing Wage Inflation
Source for Indemnity Severity: NCCI, based on data through 12/31/02.Based on the states where NCCI provides ratemaking services, excludes the effects of deductible policies.Source for CPS (Current Population Survey): Economy.com as of Feb 2004
© 2004 National Council on Compensation Insurance, Inc.
27
$7
.9
$8
.0
$7
.8
$8
.5
$8
.9
$9
.6
$1
0.3
$1
1.1
$1
2.0
$1
3.1
$1
4.7
$1
6.3
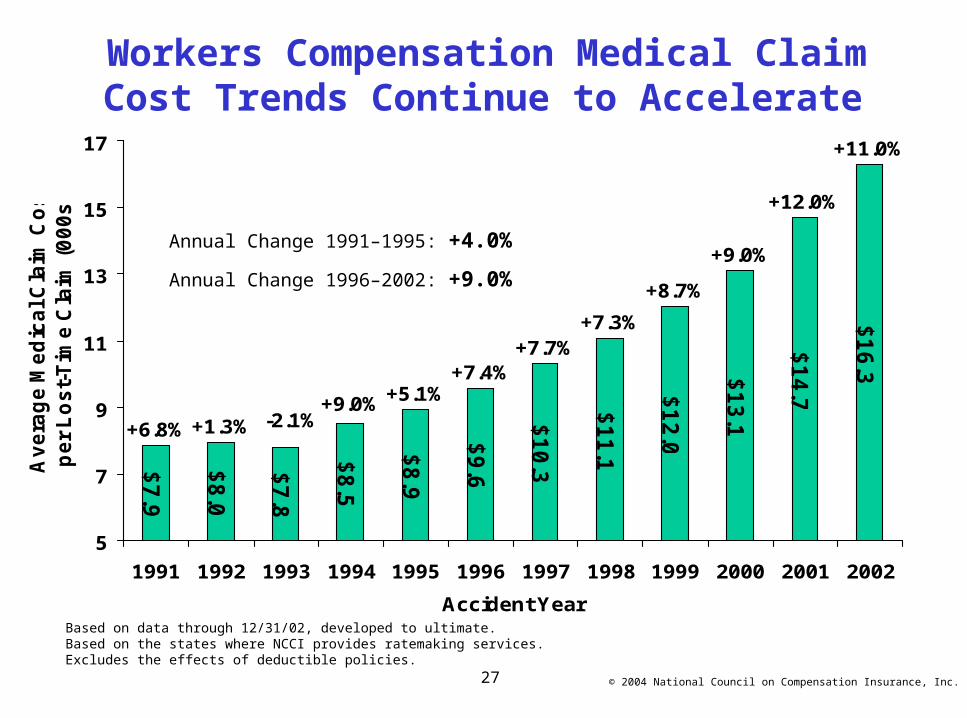
+6.8% +1.3%
+5.1%+7.4%
+7.7%+7.3%
+8.7%
+9.0%
+12.0%
+11.0%
-2.1%+9.0%
5
7
9
11
13
15
17
1991 1992 1993 1994 1995 1996 1997 1998 1999 2000 2001 2002
Accident Year
Av
era
ge
Me
dic
al C
laim
Co
st
pe
r L
os
t-T
ime
Cla
im (
00
0s
) Workers Compensation Medical Claim
Cost Trends Continue to Accelerate
Annual Change 1991–1995: +4.0%
Annual Change 1996–2002: +9.0%
Based on data through 12/31/02, developed to ultimate.Based on the states where NCCI provides ratemaking services.Excludes the effects of deductible policies.
© 2004 National Council on Compensation Insurance, Inc.
28
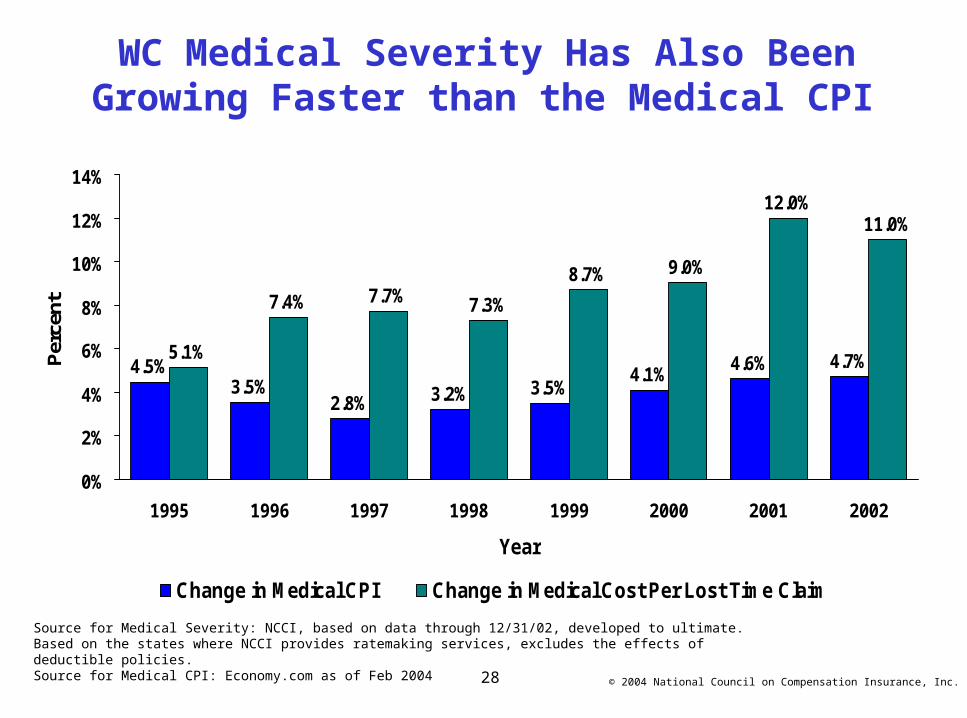
4.5%3.5%
2.8% 3.2% 3.5%4.1%
4.6% 4.7%5.1%
7.4% 7.7% 7.3%
8.7% 9.0%
12.0%11.0%
0%
2%
4%
6%
8%
10%
12%
14%
1995 1996 1997 1998 1999 2000 2001 2002
Year
Per
cent
Change in Medical CPI Change in Medical Cost Per Lost Time Claim
WC Medical Severity Has Also Been Growing Faster than the Medical CPI
Source for Medical Severity: NCCI, based on data through 12/31/02, developed to ultimate.Based on the states where NCCI provides ratemaking services, excludes the effects of deductible policies.Source for Medical CPI: Economy.com as of Feb 2004
© 2004 National Council on Compensation Insurance, Inc.
29
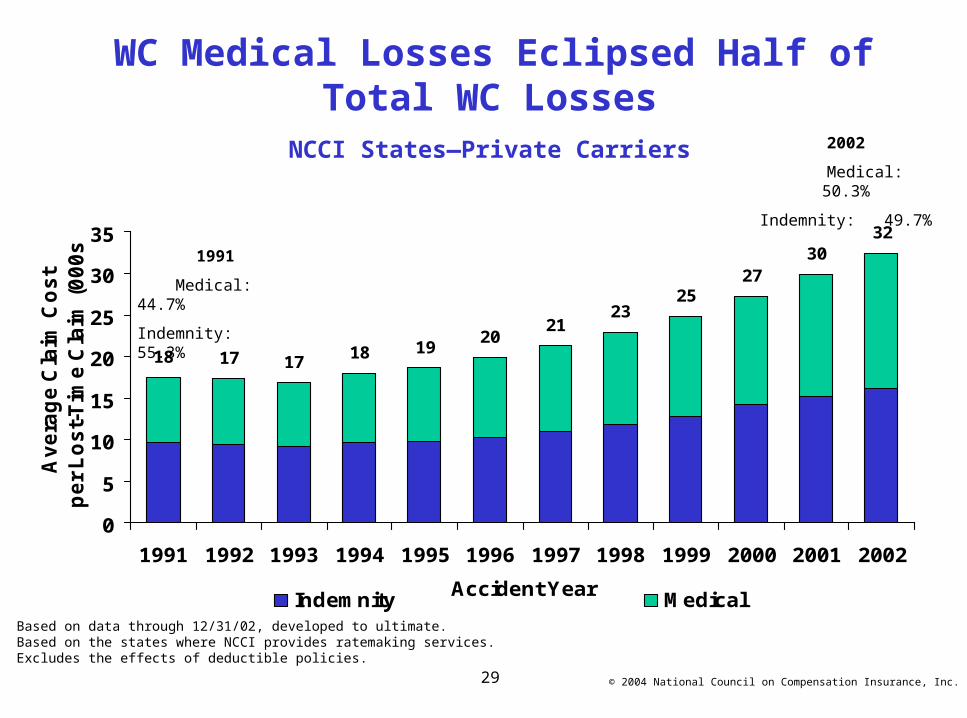
18 17 1718 19
2021
2325
2730
32
0
5
10
15
20
25
30
35
1991 1992 1993 1994 1995 1996 1997 1998 1999 2000 2001 2002
Accident Year
Av
era
ge
Cla
im C
os
t p
er
Lo
st-
Tim
e C
laim
(0
00
s)
Indemnity Medical
WC Medical Losses Eclipsed Half of Total WC Losses
NCCI States—Private Carriers
Based on data through 12/31/02, developed to ultimate.Based on the states where NCCI provides ratemaking services.Excludes the effects of deductible policies.
2002
Medical: 50.3%
Indemnity: 49.7%
1991
Medical: 44.7%
Indemnity: 55.3%
© 2004 National Council on Compensation Insurance, Inc.

30
NCCI Prescription Drug Study
• In 2001, workers compensation insurers paid roughly 75% more than group health for the same drugs
• Prescription drug share of medical costs in workers compensation grew from 7% in Accident Year 1997 to approximately 10% in Accident Year 2001
• Utilization has a greater impact than price on workers compensation drug costs
• Savings opportunities from using generic equivalents are present for less than 10% of total drug costs
• Painkillers represent 55% of workers compensation drug costs
© 2004 National Council on Compensation Insurance, Inc.
31
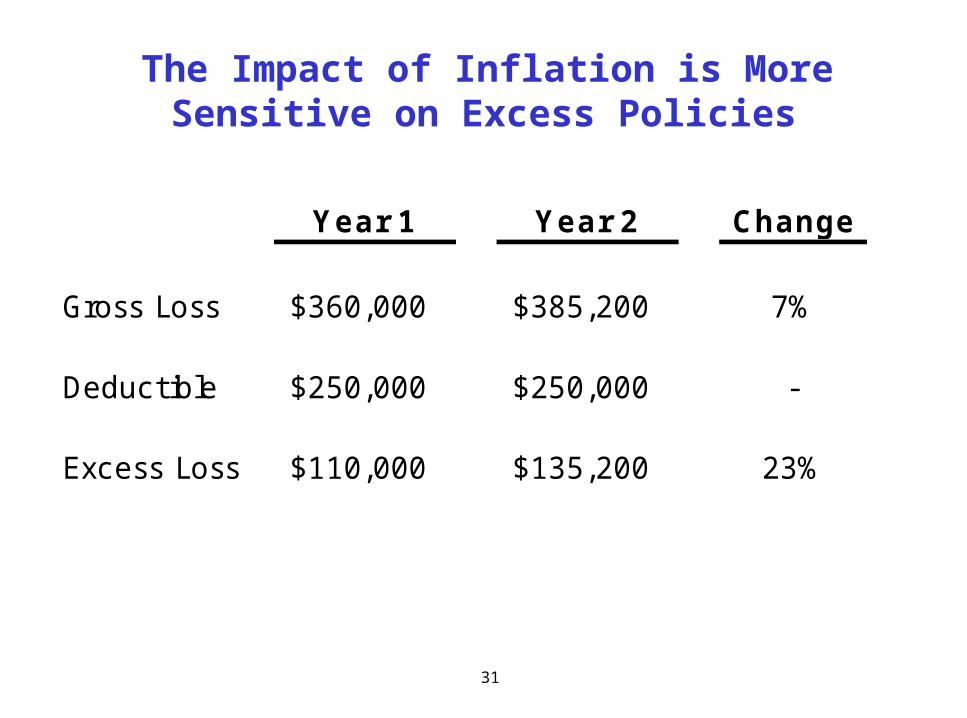
The Impact of Inflation is More Sensitive on Excess Policies
Year 1 Year 2 Change
Gross Loss $360,000 $385,200 7%
Deductible $250,000 $250,000 -
Excess Loss $110,000 $135,200 23%
32
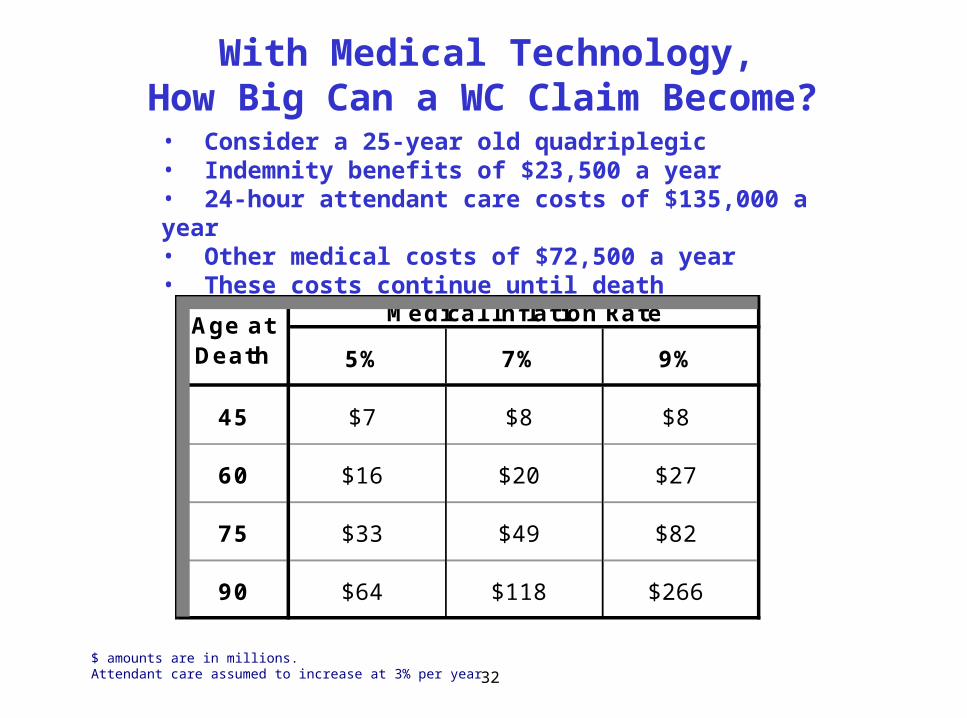
• Consider a 25-year old quadriplegic• Indemnity benefits of $23,500 a year• 24-hour attendant care costs of $135,000 a year• Other medical costs of $72,500 a year• These costs continue until death
With Medical Technology,How Big Can a WC Claim Become?
Medical Inflation Rate
5% 7% 9%
45 $7 $8 $8
60 $16 $20 $27
75 $33 $49 $82
90 $64 $118 $266
Age at Death
$ amounts are in millions.Attendant care assumed to increase at 3% per year
33
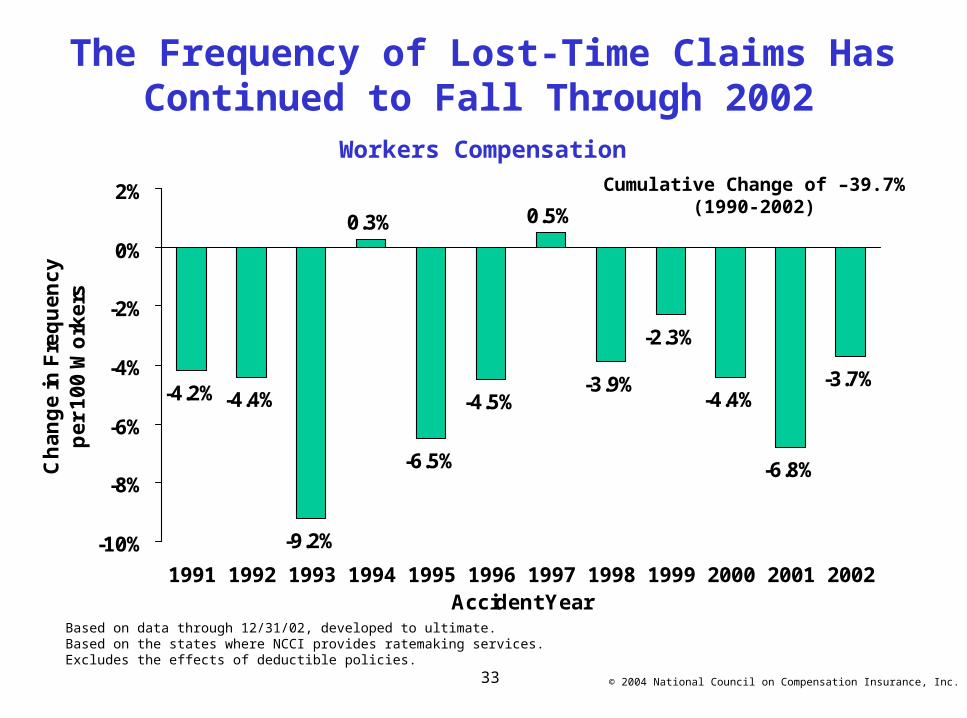
-4.2% -4.4%
-9.2%
0.3%
-6.5%
-4.5%
0.5%
-3.9%
-2.3%
-4.4%-3.7%
-6.8%
-10%
-8%
-6%
-4%
-2%
0%
2%
1991 1992 1993 1994 1995 1996 1997 1998 1999 2000 2001 2002Accident Year
Ch
an
ge
in F
req
ue
nc
yp
er
10
0 W
ork
ers
Cumulative Change of –39.7%(1990-2002)
Based on data through 12/31/02, developed to ultimate.Based on the states where NCCI provides ratemaking services.Excludes the effects of deductible policies.
The Frequency of Lost-Time Claims Has Continued to Fall Through 2002
Workers Compensation
© 2004 National Council on Compensation Insurance, Inc.
34
Workers Compensation Frequency Trends
Workers Compensation Frequency is Composed of Two Key Components:
• Long-term improving trend due to working conditions
• Short-term cyclical behavior that correlates with the economy
© 2004 National Council on Compensation Insurance, Inc.
35
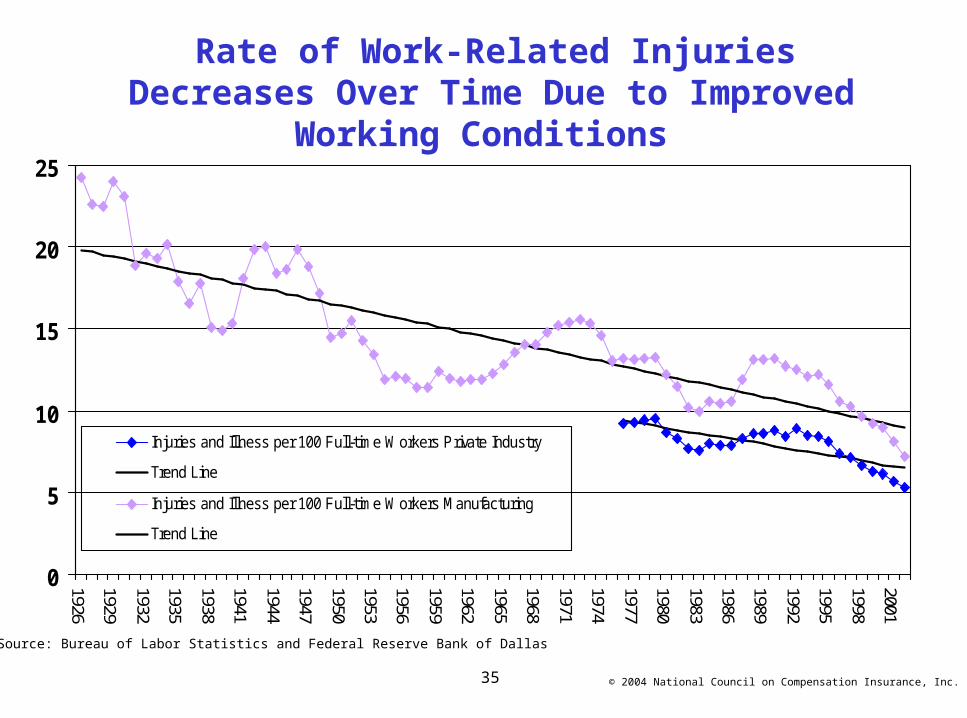
Rate of Work-Related Injuries Decreases Over Time Due to Improved Working
Conditions
0
5
10
15
20
25
1926
1929
1932
1935
1938
1941
1944
1947
1950
1953
1956
1959
1962
1965
1968
1971
1974
1977
1980
1983
1986
1989
1992
1995
1998
2001
Injuries and Illness per 100 Full-time Workers Private Industry
Trend Line
Injuries and Illness per 100 Full-time Workers Manufacturing
Trend Line
© 2004 National Council on Compensation Insurance, Inc.
Source: Bureau of Labor Statistics and Federal Reserve Bank of Dallas

36
Workplace Injury Incidence Rates— Decreases During Recessions and
Increases in Recovery
Countrywide—Six Recessions Since 1960
0
5
10
15
20
25
1960
1961
1962
1963
1964
1965
1966
1967
1968
1969
1970
1971
1972
1973
1974
1975
1976
1977
1978
1979
1980
1981
1982
1983
1984
1985
1986
1987
1988
1989
1990
1991
1992
1993
1994
1995
1996
1997
1998
1999
2000
2001
2002
Inc
ide
nc
e R
ate
s
Pe
r 1
00
FT
E W
ork
ers
Recessions
Injuries and illnesses per 100 full-time workers in manufacturing
Injuries and illnesses per 100 full-time workers in private industry
© 2004 National Council on Compensation Insurance, Inc.
Source: Bureau of Labor Statistics and National Bureau of Economic Research
37
0.00
0.02
0.04
0.06
0.08
0.10
0.12
0.14
0.16
0.18
0.20
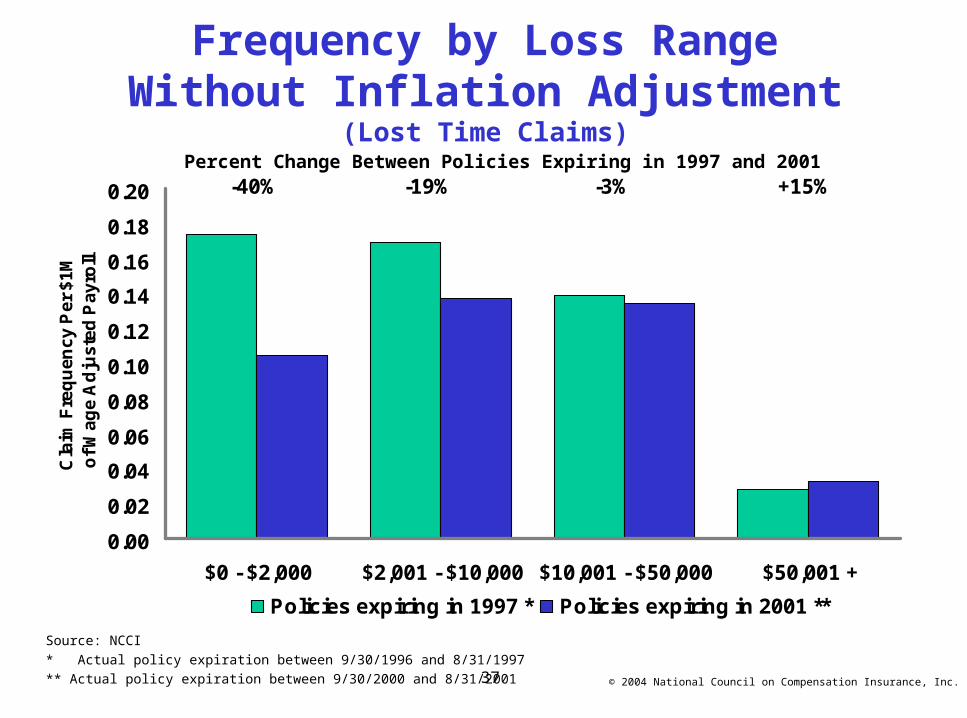
$0 - $2,000 $2,001 - $10,000 $10,001 - $50,000 $50,001 +
Cla
im F
req
ue
nc
y P
er
$1
M
of
Wa
ge
Ad
jus
ted
Pa
yro
ll
Policies expiring in 1997 * Policies expiring in 2001 **
-40% +15%-3%-19%
Frequency by Loss RangeWithout Inflation Adjustment
(Lost Time Claims)
Source: NCCI* Actual policy expiration between 9/30/1996 and 8/31/1997** Actual policy expiration between 9/30/2000 and 8/31/2001
Percent Change Between Policies Expiring in 1997 and 2001
© 2004 National Council on Compensation Insurance, Inc.
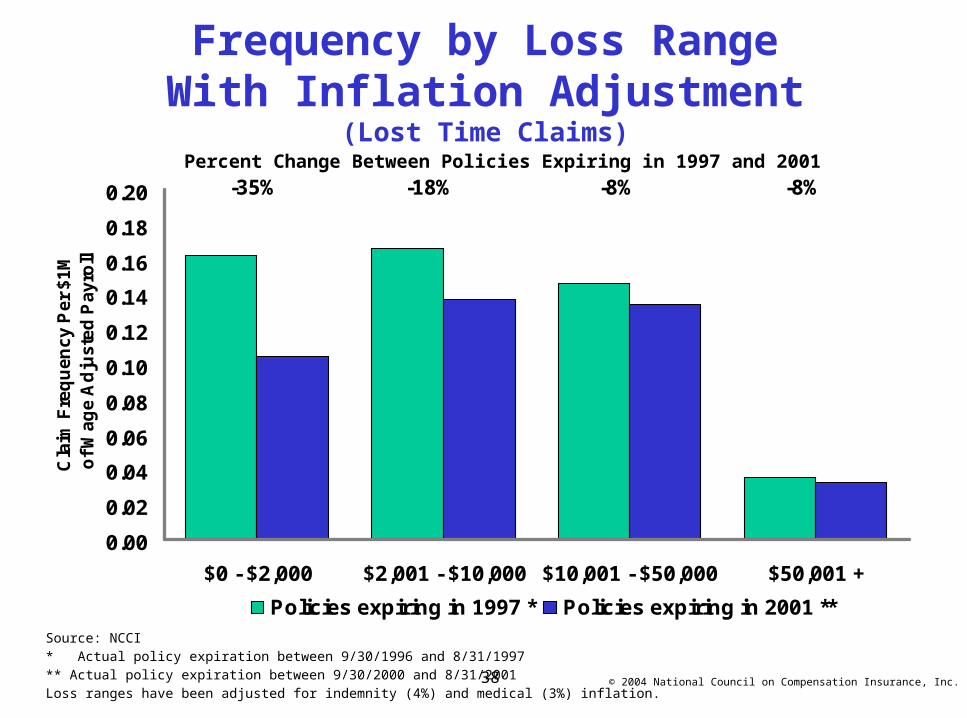
38
0.00
0.02
0.04
0.06
0.08
0.10
0.12
0.14
0.16
0.18
0.20
$0 - $2,000 $2,001 - $10,000 $10,001 - $50,000 $50,001 +
Cla
im F
req
ue
nc
y P
er
$1
M
of
Wa
ge
Ad
jus
ted
Pa
yro
ll
Policies expiring in 1997 * Policies expiring in 2001 **
-35% -8%-8%-18%
Frequency by Loss RangeWith Inflation Adjustment
(Lost Time Claims)
Source: NCCI* Actual policy expiration between 9/30/1996 and 8/31/1997** Actual policy expiration between 9/30/2000 and 8/31/2001Loss ranges have been adjusted for indemnity (4%) and medical (3%) inflation.
Percent Change Between Policies Expiring in 1997 and 2001
© 2004 National Council on Compensation Insurance, Inc.
39
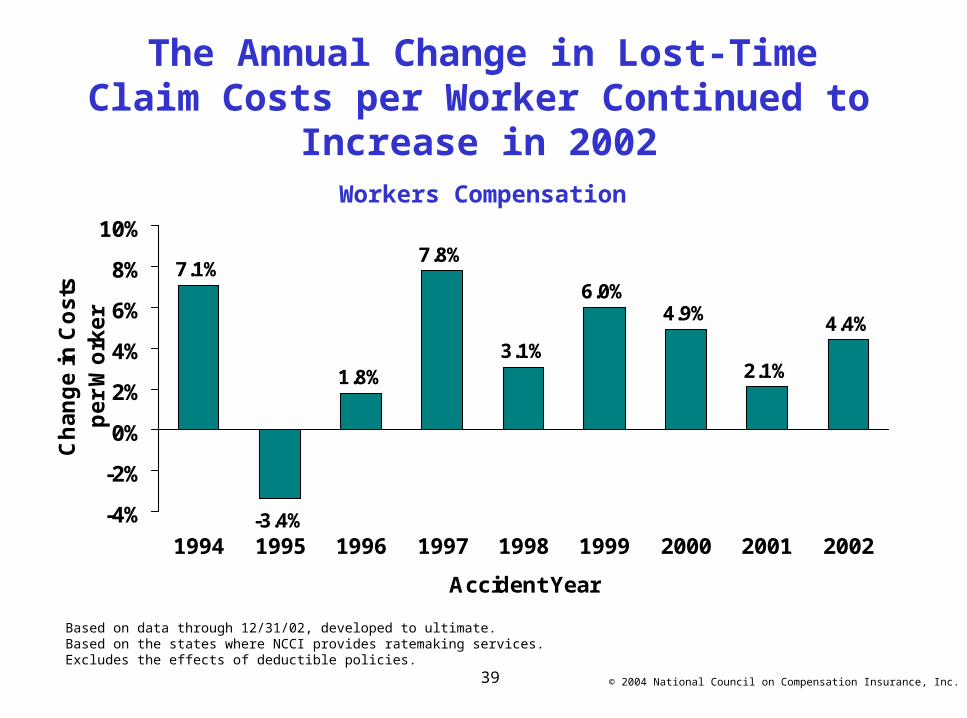
7.1%
-3.4%
1.8%
7.8%
3.1%
6.0%4.9%
2.1%
4.4%
-4%
-2%
0%
2%
4%
6%
8%
10%
1994 1995 1996 1997 1998 1999 2000 2001 2002
Accident Year
Ch
an
ge
in
Co
sts
pe
r W
ork
er
Based on data through 12/31/02, developed to ultimate.Based on the states where NCCI provides ratemaking services.Excludes the effects of deductible policies.
© 2004 National Council on Compensation Insurance, Inc.
The Annual Change in Lost-TimeClaim Costs per Worker Continued to
Increase in 2002 Workers Compensation
40
What Are Today’s Key Issues in Workers Compensation?
• WC Medical Inflation
• Growth in Residual Markets
• Expiration of Terrorism Risk Insurance Act (TRIA) 12/31/2005
• Insurer and Reinsurer Downgrades, Insolvencies, and Consolidations
• Legislative Issues
41
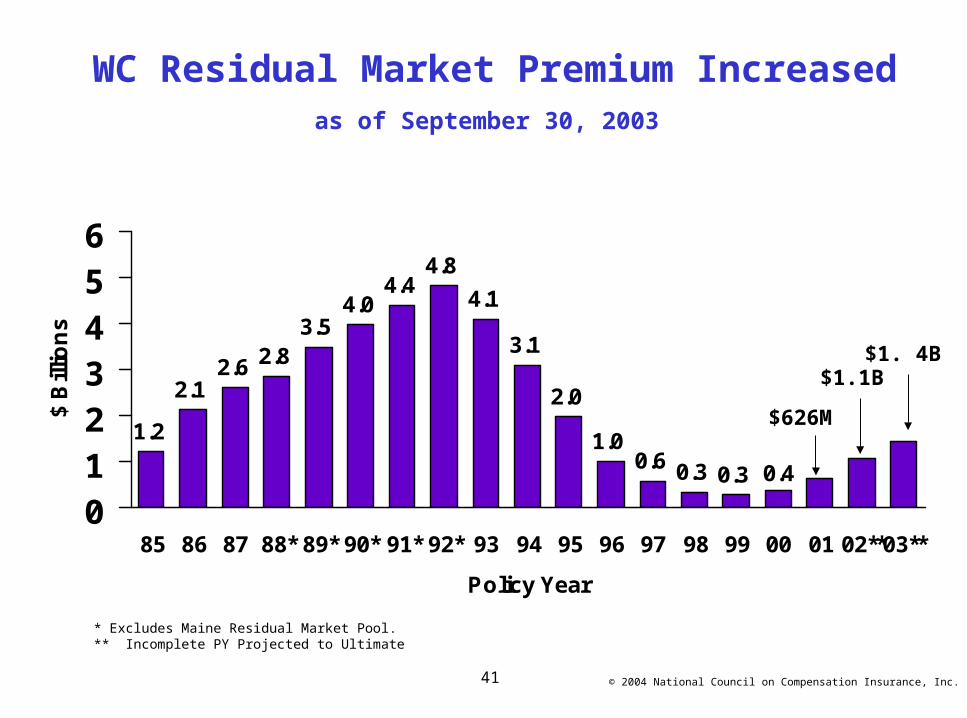
1.2
2.12.6 2.8
3.54.0
4.44.8
4.1
3.1
2.0
1.00.6 0.3 0.3 0.4
0123456
85 86 87 88* 89* 90* 91* 92* 93 94 95 96 97 98 99 00 01 02**03**
Policy Year
$ B
illio
ns
$1.1B
$626M
* Excludes Maine Residual Market Pool.** Incomplete PY Projected to Ultimate
$1. 4B
© 2004 National Council on Compensation Insurance, Inc.
WC Residual Market Premium Increased
as of September 30, 2003
42
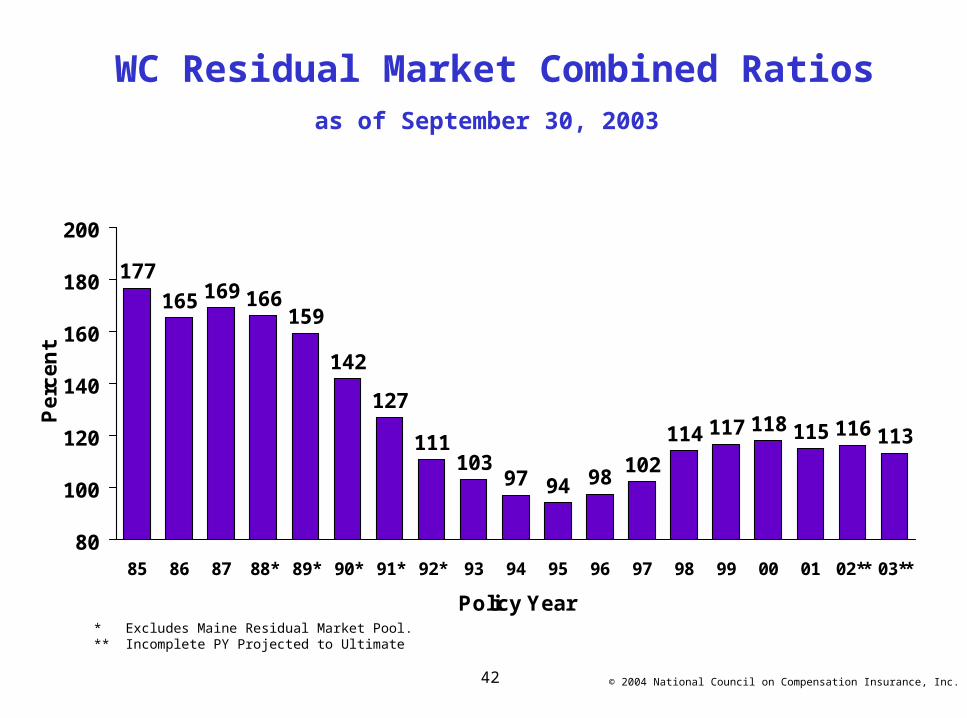
117 118 115 116 113114
102989497
103111
127
142
159166169165
177
80
100
120
140
160
180
200
85 86 87 88* 89* 90* 91* 92* 93 94 95 96 97 98 99 00 01 02** 03**
Policy Year
Pe
rce
nt
WC Residual Market Combined Ratiosas of September 30, 2003
* Excludes Maine Residual Market Pool.** Incomplete PY Projected to Ultimate
© 2004 National Council on Compensation Insurance, Inc.

43
-936
-1,369
-1,802-1,883
-2,072
-1,674
-1,176
-542
-125
100 11621
-47 -64 -96 -169 -190-45-13
-2,500
-2,000
-1,500
-1,000
-500
0
500
85 86 87 88* 89* 90* 91* 92* 93 94 95 96 97 98 99 00 01 02** 03**
Policy Year
$ M
illi
on
sWC Residual Market
Underwriting Results Show Slight Deterioration
as of September 30, 2003
* Excludes Maine Residual Market Pool.** Incomplete PY Projected to Ultimate
© 2004 National Council on Compensation Insurance, Inc.

44
Unique Challenges of Workers Compensation and Terrorism
Coverage
• Coverage mandated by law, exclusions are not possible
• Benefits are defined by law, limits aren’t possible
• Risks that aren’t written voluntarily will be backed by the entire market through the involuntary pool
• Terrorism Risk Insurance Act (TRIA) expires 12/31/2005– Government backstop goes away, unless Congress
renews– Any policy effective after 1/1/2005 has exposure– NCCI developing filing strategy
45
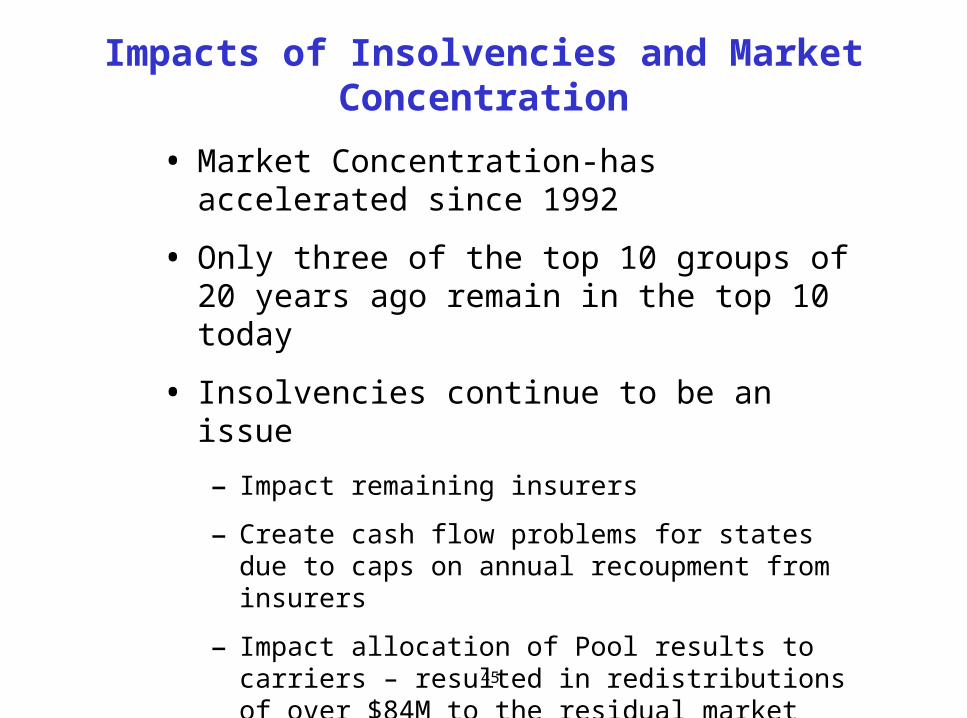
Impacts of Insolvencies and Market Concentration
• Market Concentration-has accelerated since 1992
• Only three of the top 10 groups of 20 years ago remain in the top 10 today
• Insolvencies continue to be an issue
– Impact remaining insurers
– Create cash flow problems for states due to caps on annual recoupment from insurers
– Impact allocation of Pool results to carriers – resulted in redistributions of over $84M to the residual market pool members in 2003
– Create data problems for advisory organizations

46
Legislative UpdateIssues and Trends
2003 Session Overview
• Most active session since the mid-1990s
• Over 1000 bills introduced, more than 150 enacted
• Many proposals for benefit increases, but few enacted
• State budget issues abound
• Many new governors, legislators and regulators
47
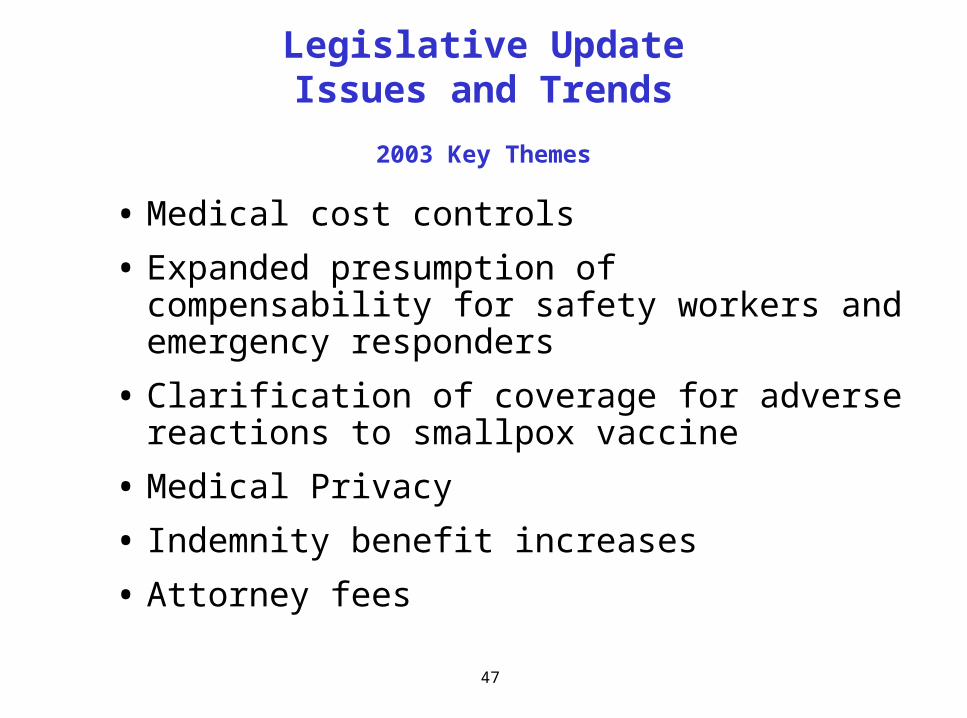
• Medical cost controls
• Expanded presumption of compensability for safety workers and emergency responders
• Clarification of coverage for adverse reactions to smallpox vaccine
• Medical Privacy
• Indemnity benefit increases
• Attorney fees
Legislative UpdateIssues and Trends
2003 Key Themes
48
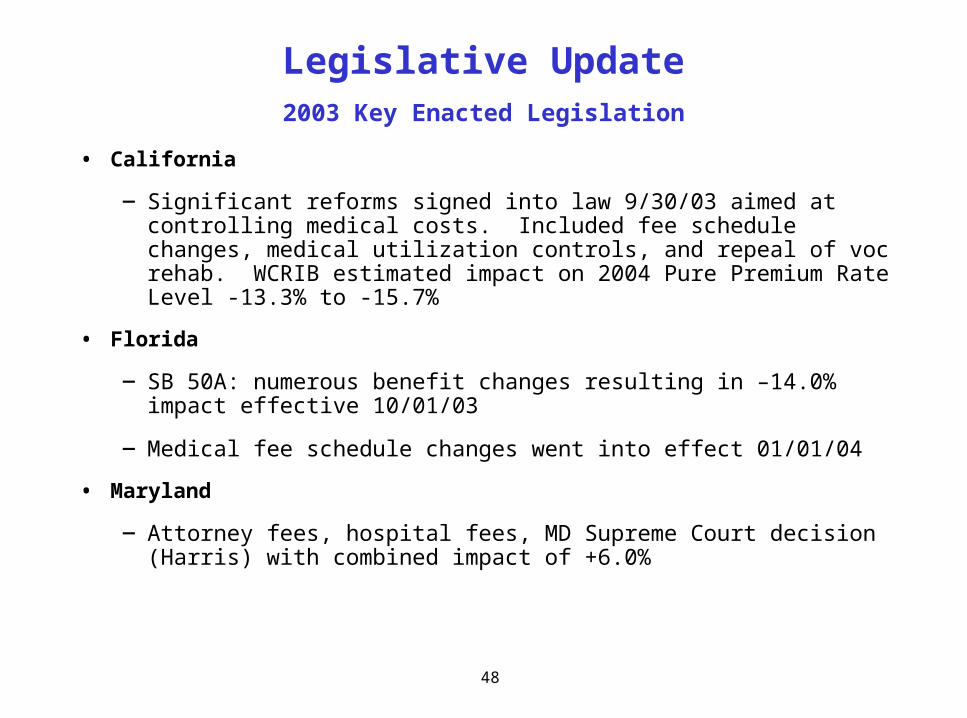
• California
− Significant reforms signed into law 9/30/03 aimed at controlling medical costs. Included fee schedule changes, medical utilization controls, and repeal of voc rehab. WCRIB estimated impact on 2004 Pure Premium Rate Level -13.3% to -15.7%
• Florida
− SB 50A: numerous benefit changes resulting in –14.0% impact effective 10/01/03
− Medical fee schedule changes went into effect 01/01/04
• Maryland
− Attorney fees, hospital fees, MD Supreme Court decision (Harris) with combined impact of +6.0%
Legislative Update2003 Key Enacted Legislation
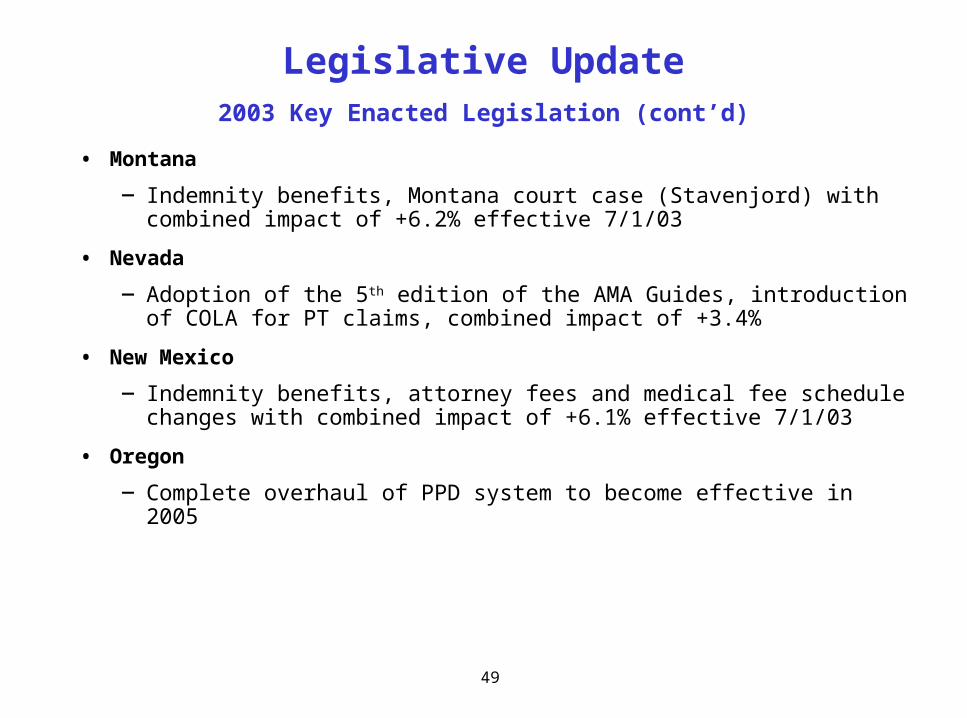
49
• Montana
− Indemnity benefits, Montana court case (Stavenjord) with combined impact of +6.2% effective 7/1/03
• Nevada
− Adoption of the 5th edition of the AMA Guides, introduction of COLA for PT claims, combined impact of +3.4%
• New Mexico
− Indemnity benefits, attorney fees and medical fee schedule changes with combined impact of +6.1% effective 7/1/03
• Oregon
− Complete overhaul of PPD system to become effective in 2005
Legislative Update2003 Key Enacted Legislation (cont’d)

50
• Employer vs Employee Choice of Physician
• Erosion of Exclusive Remedy
• Medical Fee Schedules
• Attorney Fees
• Indemnity Benefit Increases
• Second Injury Funds
• Containing Medical Costs
Legislative UpdateIssues and Trends
2004 Emerging Themes
51
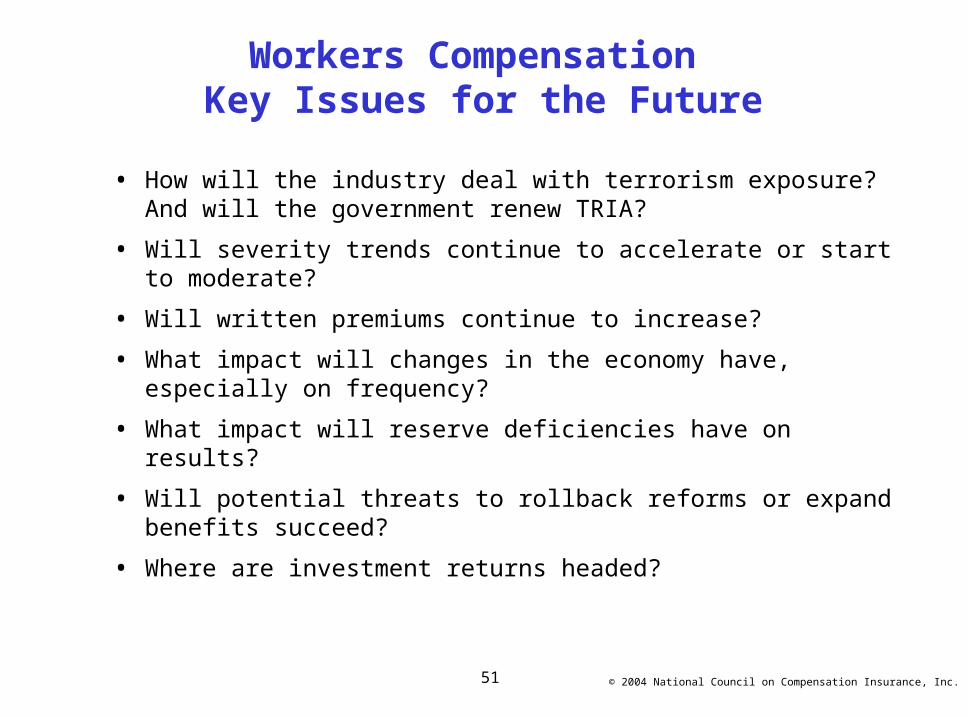
Workers Compensation Key Issues for the Future
• How will the industry deal with terrorism exposure? And will the government renew TRIA?
• Will severity trends continue to accelerate or start to moderate?
• Will written premiums continue to increase?
• What impact will changes in the economy have, especially on frequency?
• What impact will reserve deficiencies have on results?
• Will potential threats to rollback reforms or expand benefits succeed?
• Where are investment returns headed?
© 2004 National Council on Compensation Insurance, Inc.

WORKERS COMPENSATION- CURRENT ISSUES -
(SESSION WC-3)
Q & A