Embed Size (px)
Citation preview
Pertti Nurmi( Finnish Meteorological Institute )
Design of OperationalVerification Systems
Montreal17.9.2004
0
10
20
30
1980 1985 1990 1995 2000
T max D+2
0.2
0.4
0.6
T mean D+6-10
T mean D+1-5
T2m; ME & MAE; ECMWF & LAMAverage over 30 stations; Winter 2003
-1
0
1
2
3
4
5
6 12 18 24 30 36 42 48 54 60 72 84 96 108 120
MAE_ECMWF MAE_LAM ME_ECMWF ME_LAM
(C)
( hrs )
17.9.2004Design of Operational Verification Systems / [email protected]
Acknowledgements:! HUNGARY: (!) Gabriella Csima, Istvan Ihasz,
Helga Toth, Ervin Zsótér! AUSTRALIA: Beth Ebert et al.! FRANCE: Frederic Atger, Bernard Strauss! GERMANY: Ulrich Damrath, Martin Göber,
Thomas Kratzsch! NORWAY: Helen Korsmo! SLOVENIA: Miha Razinger! U.S.A.: Barb Brown, Keith Brill, Ying Lin,
Andy Loughe+ ECMWF
17.9.2004Design of Operational Verification Systems / [email protected]
17.9.2004Design of Operational Verification Systems / [email protected]
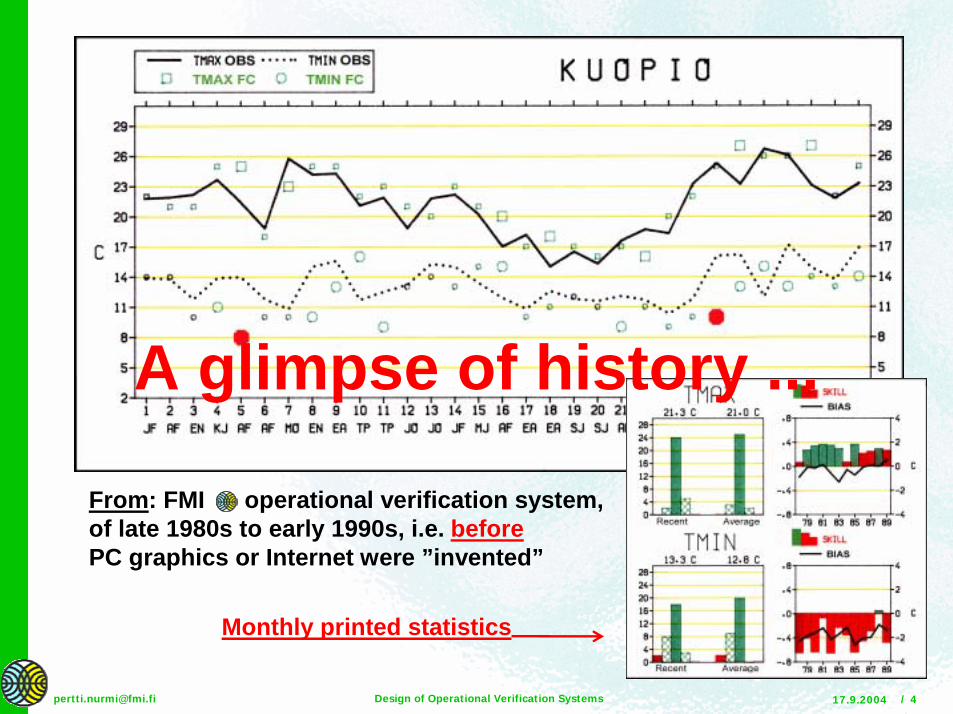
From: FMI operational verification system,of late 1980s to early 1990s, i.e. beforePC graphics or Internet were ”invented”
Monthly printed statistics
A glimpse of history ...
17.9.2004Design of Operational Verification Systems / [email protected]
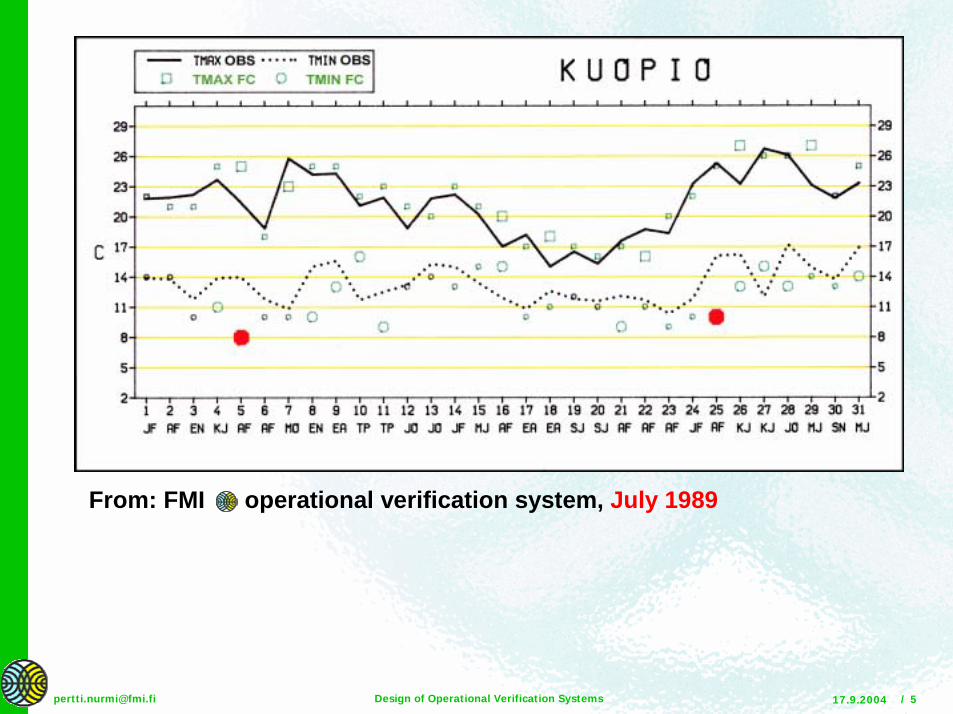
From: FMI operational verification system, July 1989
17.9.2004Design of Operational Verification Systems / [email protected]
From: FMI operational verification system, July 1989
Cold bias: – 1.5 oC
17.9.2004Design of Operational Verification Systems / [email protected]
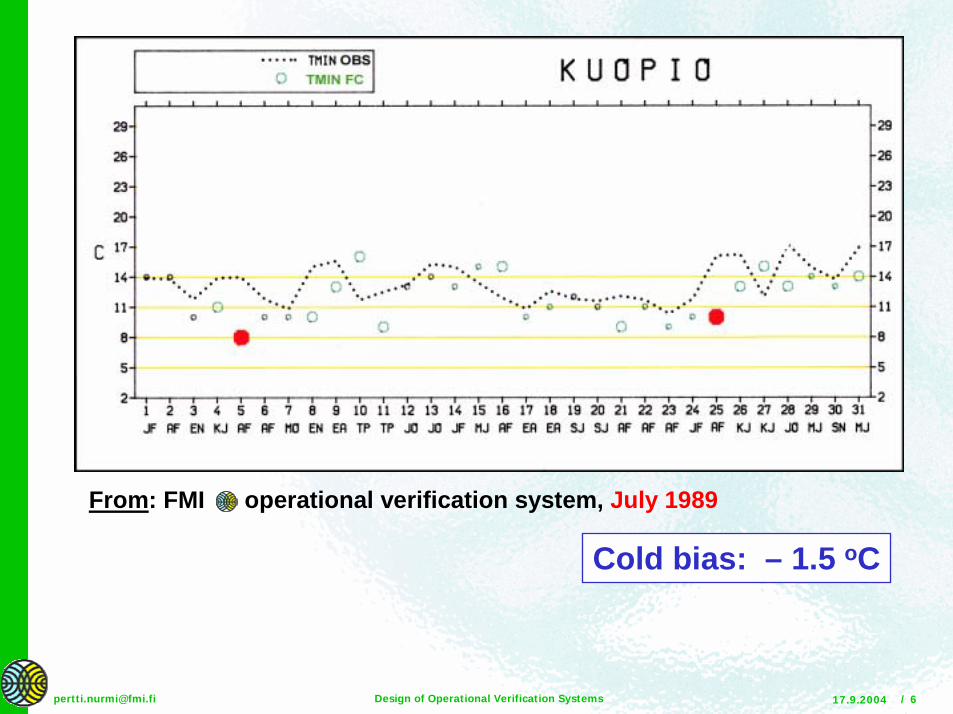
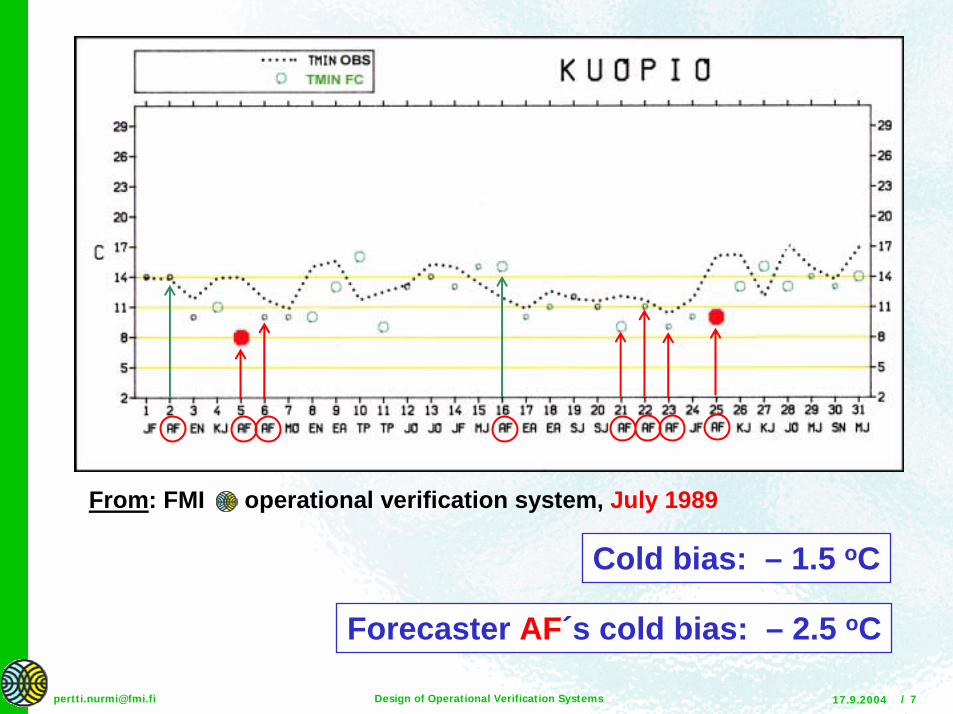
From: FMI operational verification system, July 1989
Cold bias: – 1.5 oC
Forecaster AF´s cold bias: – 2.5 oC
17.9.2004Design of Operational Verification Systems / [email protected]
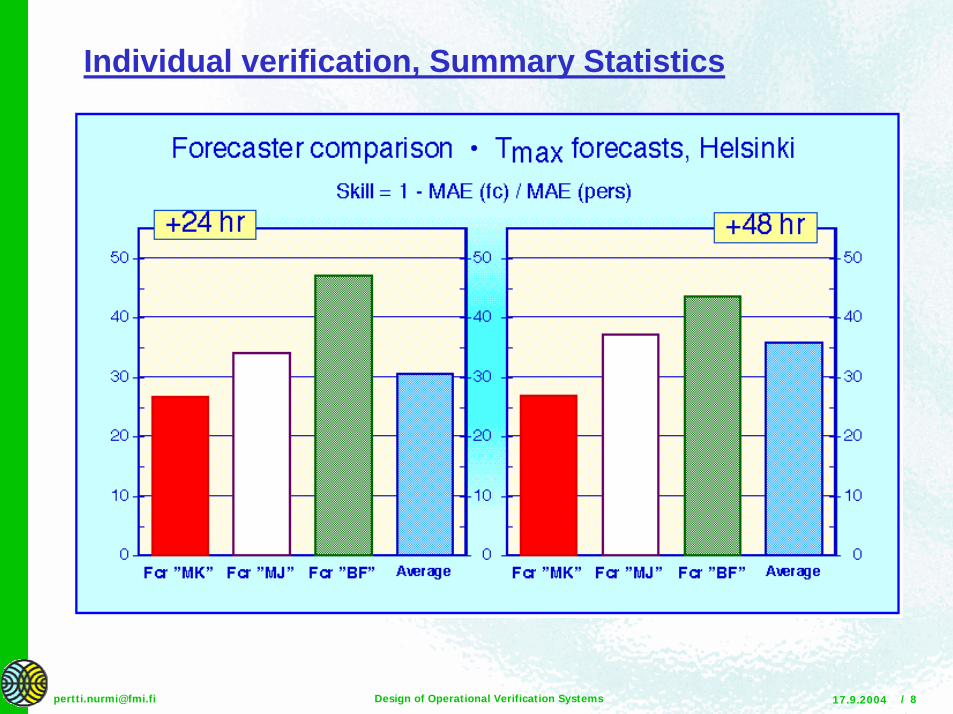
Individual verification, Summary Statistics
17.9.2004Design of Operational Verification Systems / [email protected]
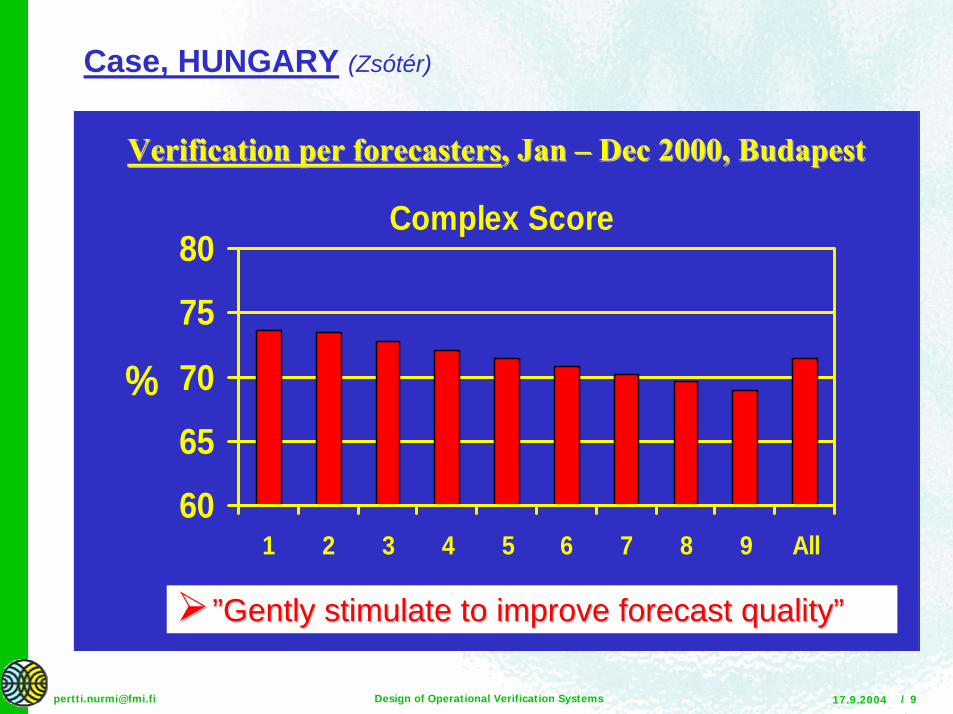
Case, HUNGARY (Zsótér)
Verification per forecastersVerification per forecasters, Jan , Jan �� Dec 2000, BudapestDec 2000, Budapest
Complex Score
60
65
70
75
80
1 2 3 4 5 6 7 8 9 All
%
"" ””GentlGentlyy stimulatstimulatee toto improveimprove forecastforecast qualityquality””
17.9.2004Design of Operational Verification Systems / [email protected]
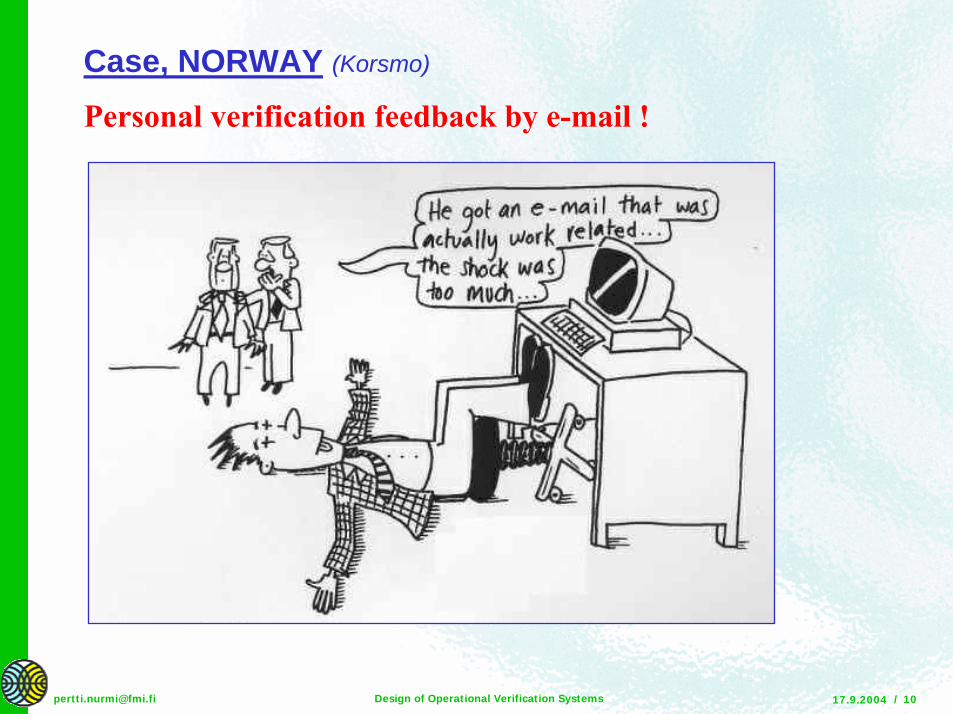
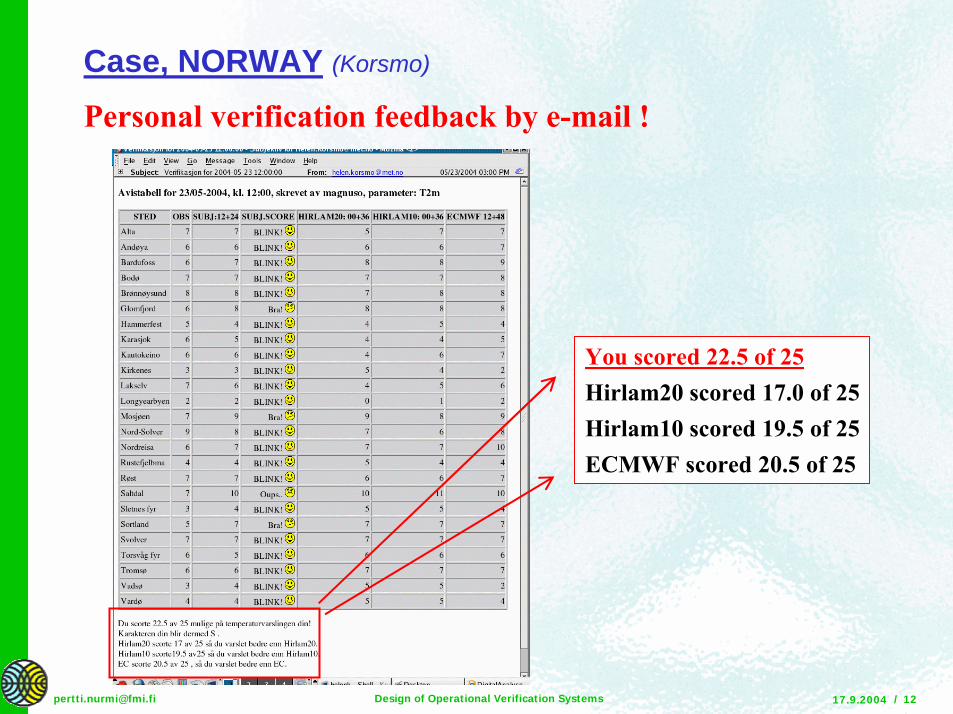
Personal verification feedback by e-mail !
Case, NORWAY (Korsmo)
17.9.2004Design of Operational Verification Systems / [email protected]
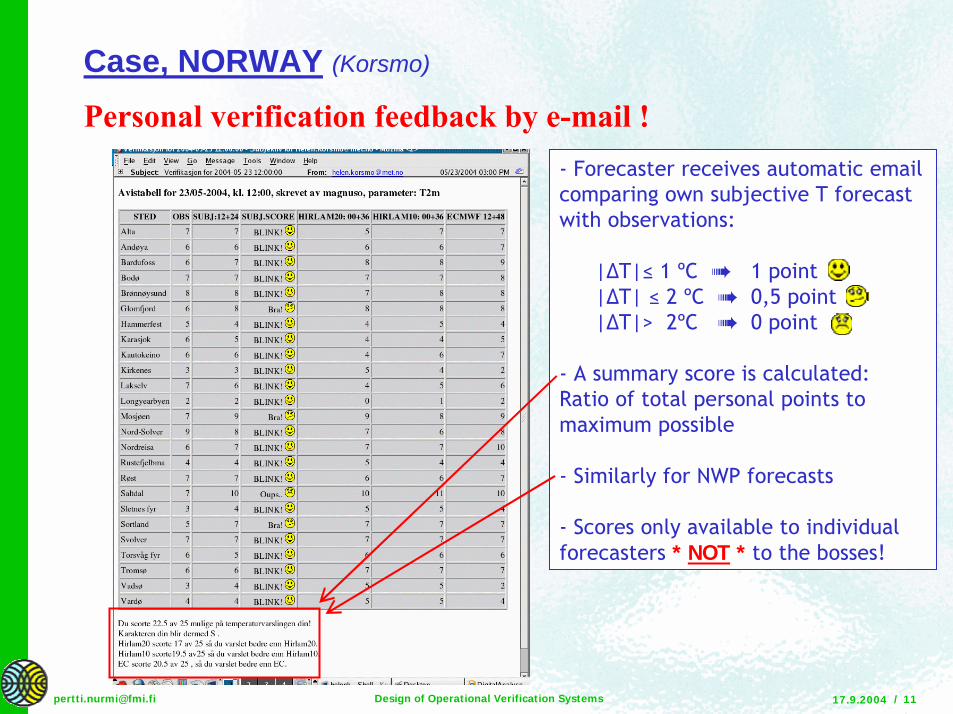
- Forecaster receives automatic emailcomparing own subjective T forecastwith observations:
|∆T|≤ 1 ºC ➠ 1 point |∆T| ≤ 2 ºC ➠ 0,5 point|∆T|> 2ºC ➠ 0 point
- A summary score is calculated:Ratio of total personal points tomaximum possible
- Similarly for NWP forecasts
- Scores only available to individualforecasters * NOT * to the bosses!
Case, NORWAY (Korsmo)
Personal verification feedback by e-mail !
17.9.2004Design of Operational Verification Systems / [email protected]
Case, NORWAY (Korsmo)
You scored 22.5 of 25Hirlam20 scored 17.0 of 25Hirlam10 scored 19.5 of 25ECMWF scored 20.5 of 25
Personal verification feedback by e-mail !
17.9.2004Design of Operational Verification Systems / [email protected]
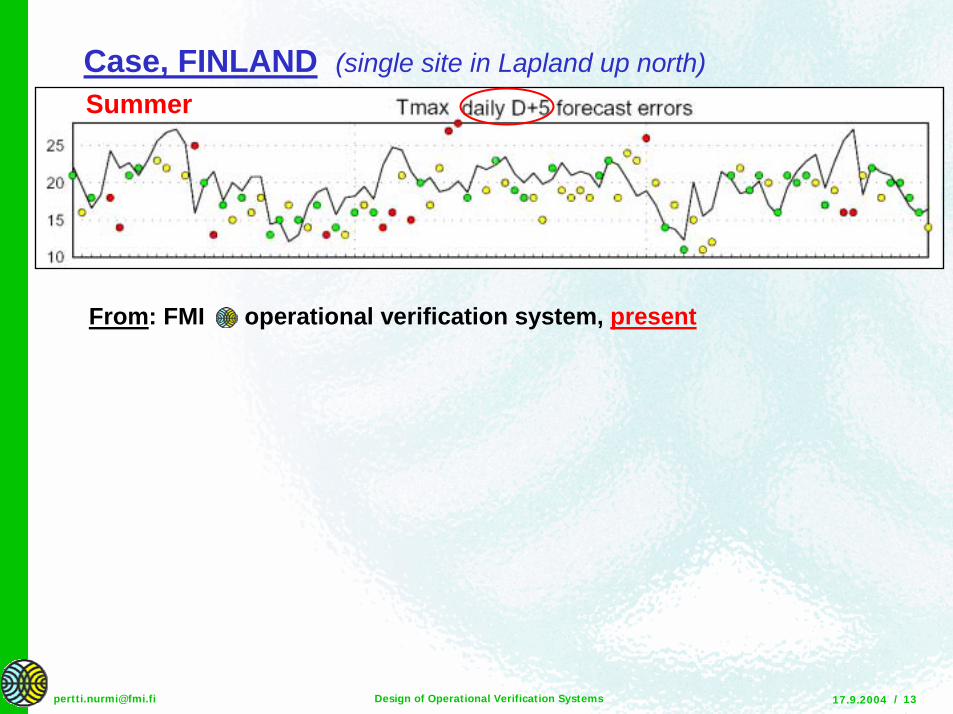
From: FMI operational verification system, present
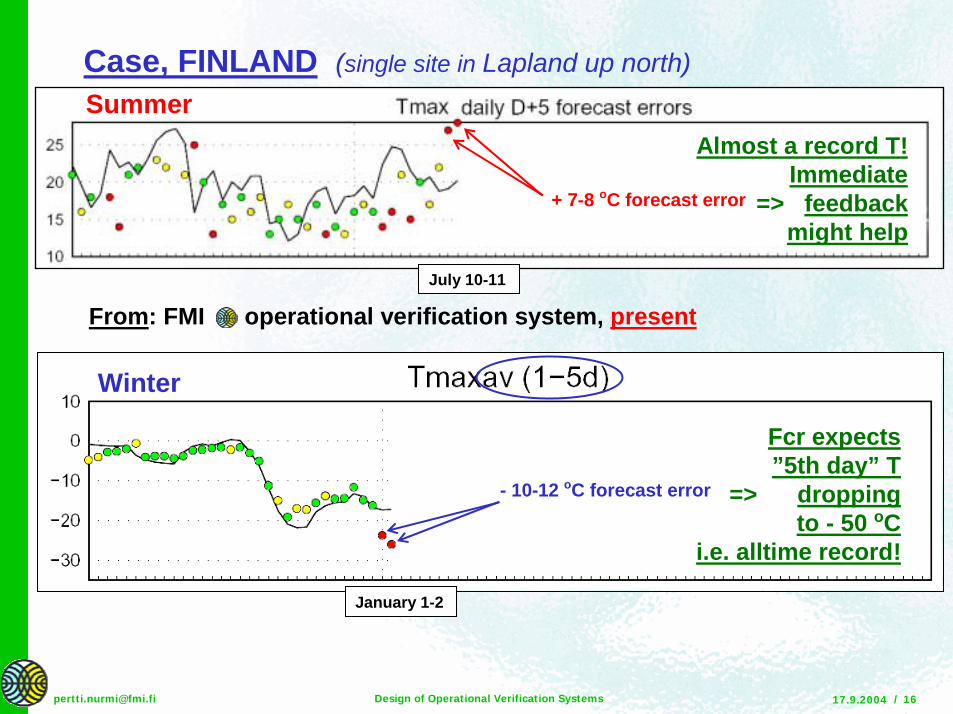
Case, FINLAND (single site in Lapland up north)Summer
17.9.2004Design of Operational Verification Systems / [email protected]
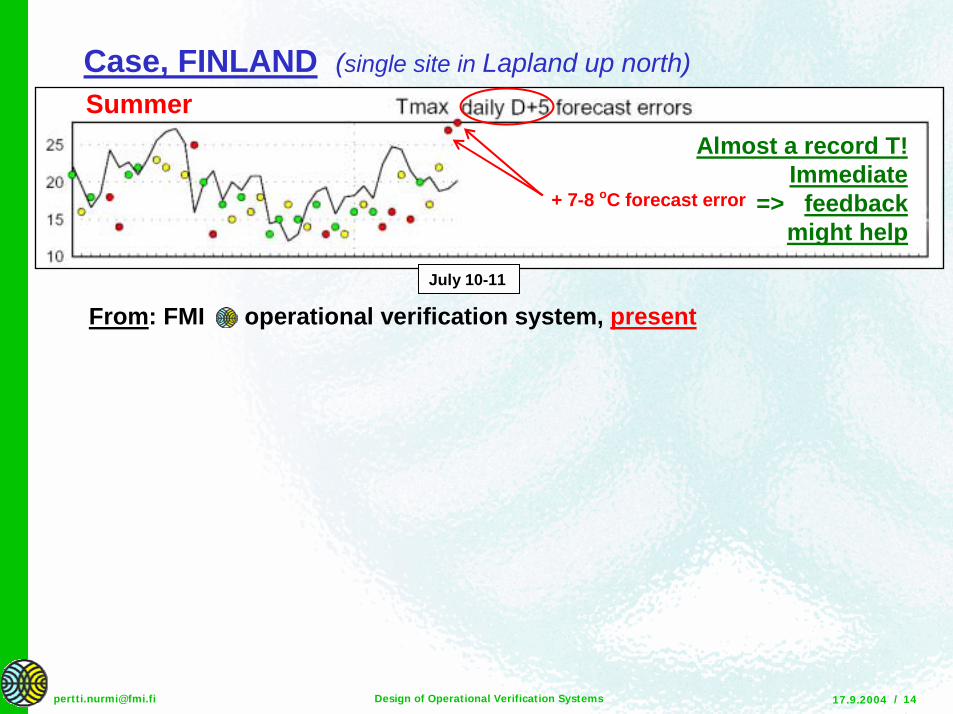
July 10-11
+ 7-8 oC forecast error
From: FMI operational verification system, present
Almost a record T!Immediate
=> feedbackmight help
Case, FINLAND (single site in Lapland up north)Summer
17.9.2004Design of Operational Verification Systems / [email protected]
July 10-11
+ 7-8 oC forecast error
From: FMI operational verification system, present
Almost a record T!Immediate
=> feedbackmight help
Case, FINLAND (single site in Lapland up north)Summer
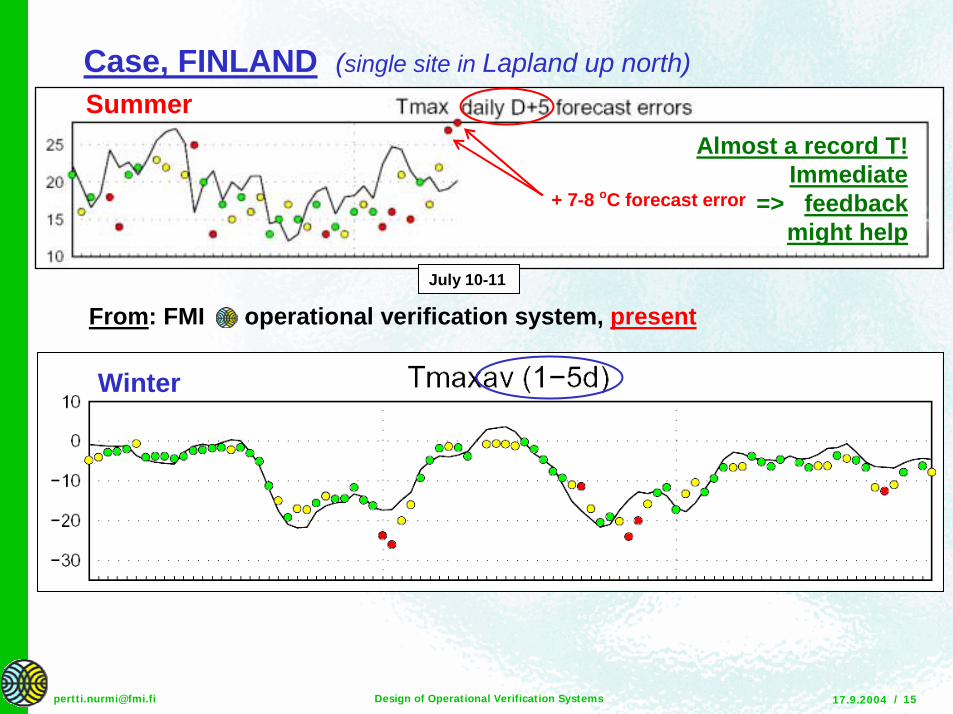
Winter
17.9.2004Design of Operational Verification Systems / [email protected]
July 10-11
+ 7-8 oC forecast error
- 10-12 oC forecast error
From: FMI operational verification system, present
January 1-2
Fcr expects”5th day” T
=> droppingto - 50 oC
i.e. alltime record!
Almost a record T!Immediate
=> feedbackmight help
Case, FINLAND (single site in Lapland up north)
Winter
Summer
17.9.2004Design of Operational Verification Systems / [email protected]
Outline:" Introduction" General guidelines" Verification measures for continuous variables" Verification measures for categorical events" Verification measures for probability forecasts" Forecast value aspects" Examples of practices at selected NWSs –
scattered here and there during the presentation
…I guess you heard it already
17.9.2004Design of Operational Verification Systems / [email protected]
First notes on (operational) verification:
!An essential daily, real-time, online practicein the operational forecasting environment
!A fundamental means to improve weather forecasts and services
!An act (or even “art”?) of countless methods and measures
!An active feedback and dialogue processbetween forecasters, modellers, developers, decision-makers, customers, public… thus serving the whole (meteorological) community
17.9.2004Design of Operational Verification Systems / [email protected]
Principles of (all) verification:!Verification activity has value only if the
generated information leads to a decision about the forecast or the system being verified# User of the information must be identified# Purpose of the verification must be known
!No single verification measure can provide complete information about forecast quality
!Forecasts need be formulated in a verifiable form=> e.g. How to verify worded forecasts?
17.9.2004Design of Operational Verification Systems / [email protected]
Goals of (operational) verification:! “Administrative”
– Feedback process to operational forecasters– Monitor the quality of forecasts and potential trends in quality– Feedback process to decision-makers, customers, public
# Justify costs of provision of weather services# Justify additional or new equipment, models, …
! “Scientific”– Feedback process to modellers and developers
# Identify strengths or weaknesses of a (NWP) forecast or guidance product leading to improvements, i.e. provide information to direct R&D
! “Value” (not discussed here)
17.9.2004Design of Operational Verification Systems / [email protected]
Operational online verification, “State-of-the-Art”
! Comprehensive evaluation of all forecast(er)s! Stratification and aggregation (pooling) of results! Statistics of guidance forecasts - e.g. NWP, MOS, competitor
! Instant feedback to forecasters! Statistics of individual forecasters – e.g. personal biases
! Comprehensive set of tailored verification measures! Simplified measures for laymen! Continuity into history! Covers/Serves all users/customers! Covers/Serves official monitoring / target scores! Clear and functional Web user-interface;
including user-guide, tutorial, glossary, …
17.9.2004Design of Operational Verification Systems / [email protected]
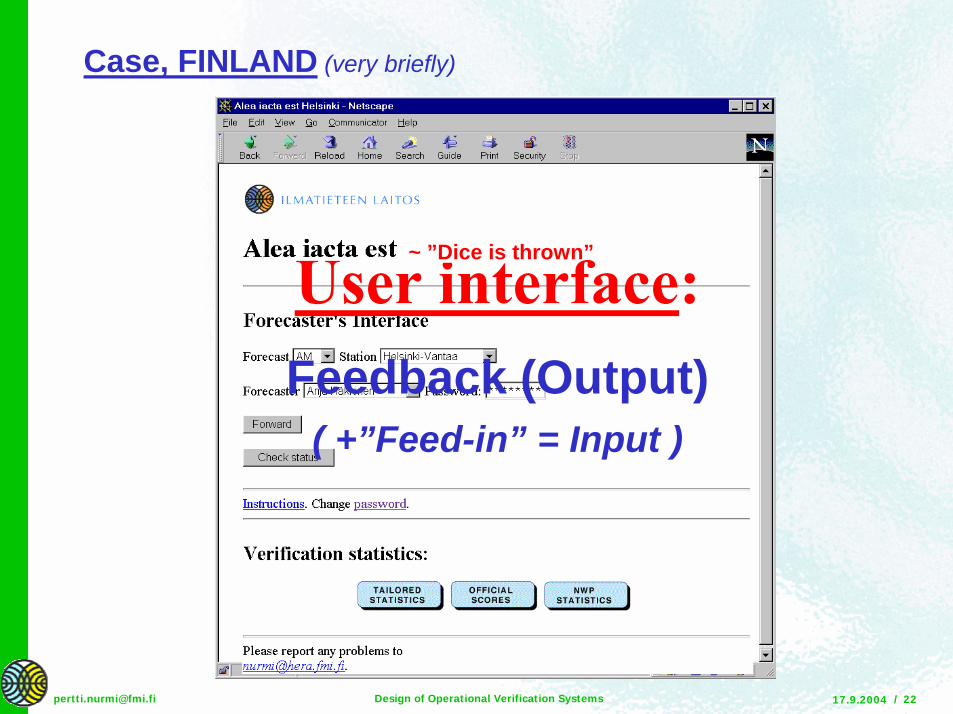
Case, FINLAND (very briefly)
User interface:Feedback (Output)
( +”Feed-in” = Input )
~ ”Dice is thrown”
17.9.2004Design of Operational Verification Systems / [email protected]
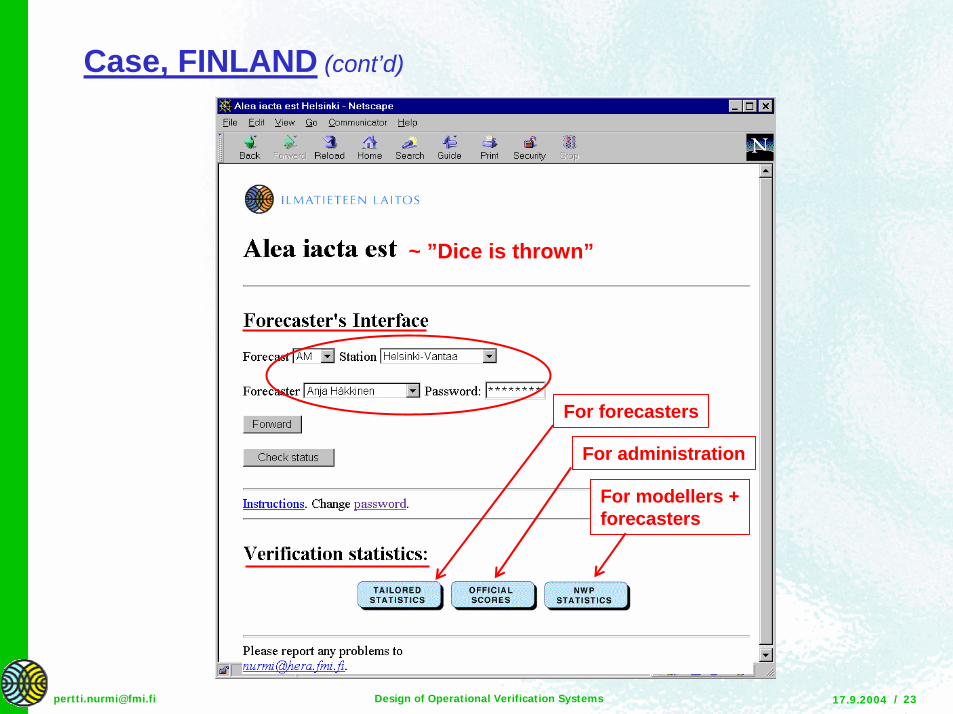
Case, FINLAND (cont’d)
For forecasters
For administration
For modellers + forecasters
~ ”Dice is thrown”
17.9.2004Design of Operational Verification Systems / [email protected]
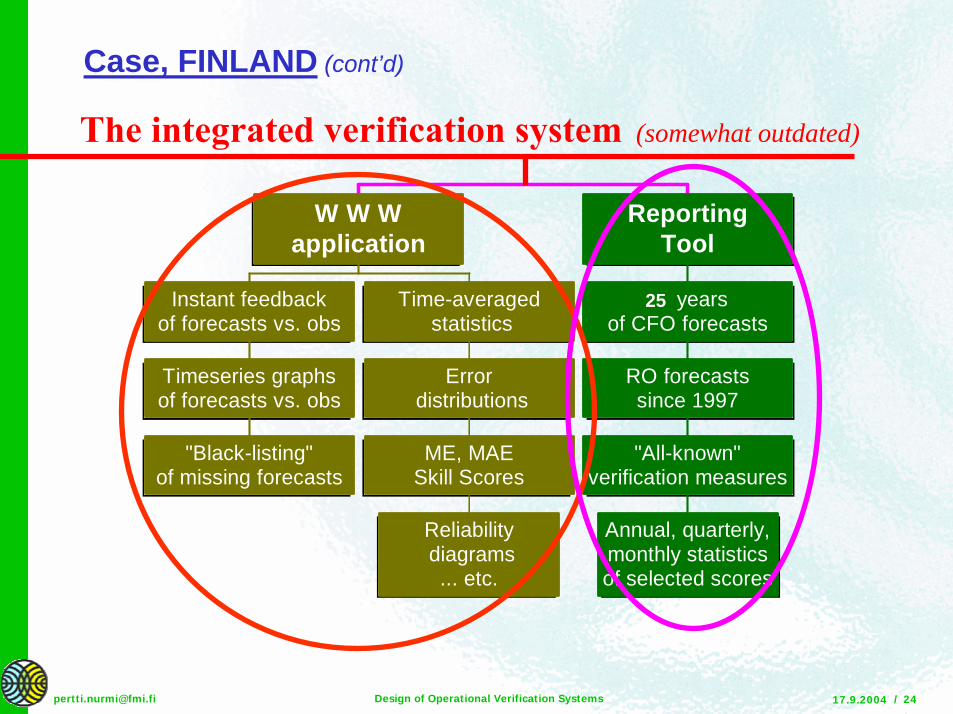
Case, FINLAND (cont’d)
The integrated verification system (somewhat outdated)
"Black-listing"of missing forecasts
Timeseries graphsof forecasts vs. obs
Instant feedbackof forecasts vs. obs
Reliability diagrams
... etc.
ME, MAESkill Scores
Error distributions
Time-averaged statistics
W W Wapplication
Annual, quarterly,monthly statisticsof selected scores
"All-known"verification measures
RO forecastssince 1997
20 yearsof CFO forecasts
ReportingTool
25
17.9.2004Design of Operational Verification Systems / [email protected]
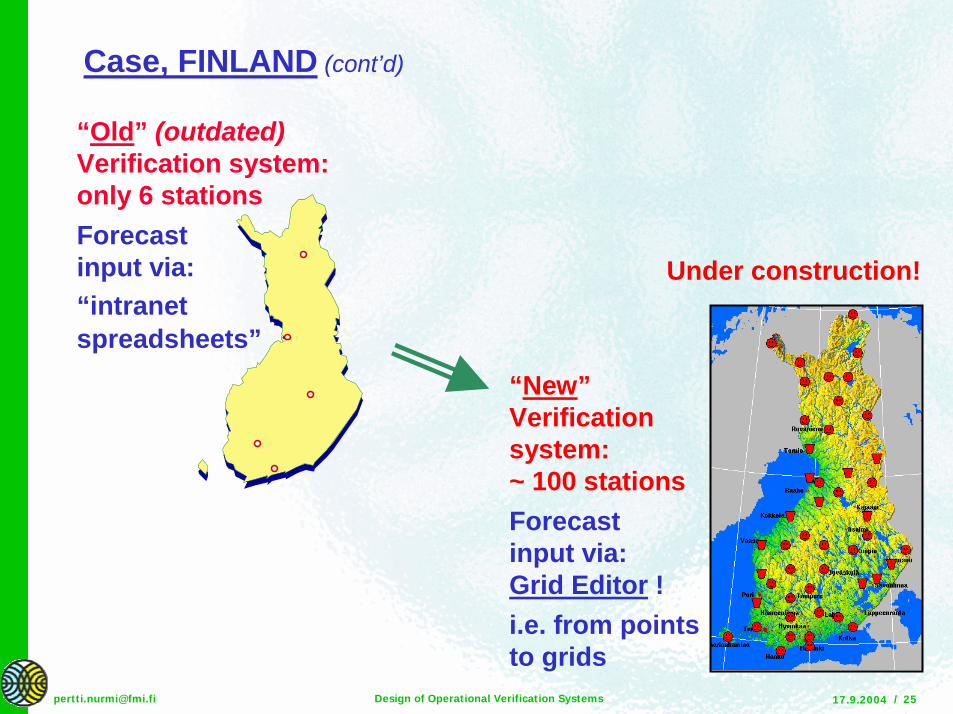
“Old” (outdated)Verification system:only 6 stationsForecastinput via:“intranetspreadsheets”
Case, FINLAND (cont’d)
“New”Verificationsystem:~ 100 stationsForecastinput via:Grid Editor !i.e. from points to grids
Under construction!
17.9.2004Design of Operational Verification Systems / [email protected]
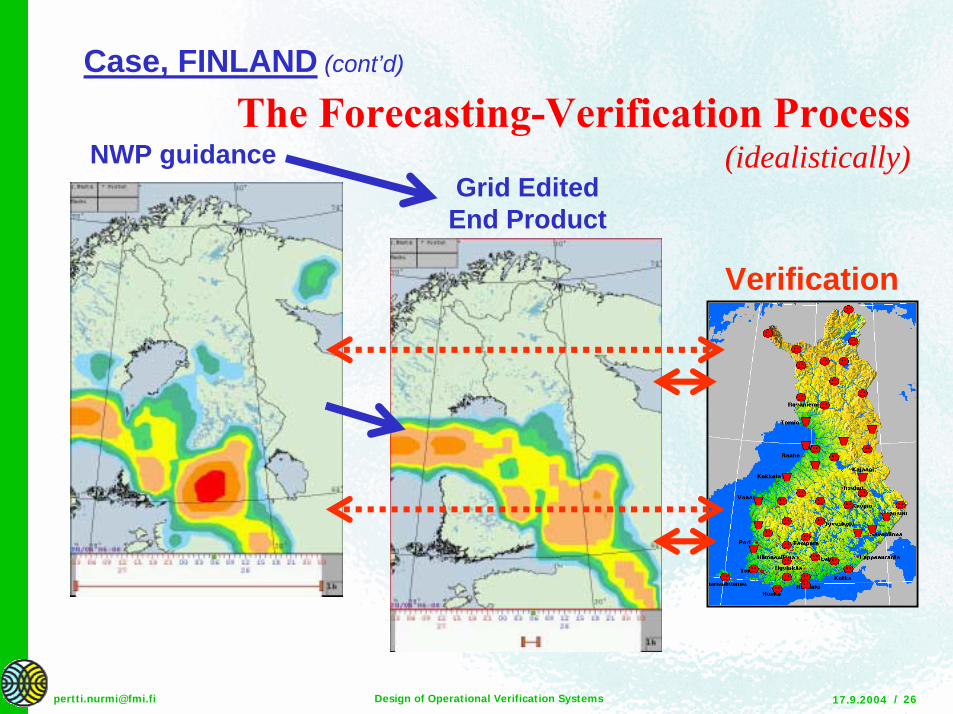
NWP guidanceGrid Edited
End Product
The Forecasting-Verification Process(idealistically)
Verification
Case, FINLAND (cont’d)
17.9.2004Design of Operational Verification Systems / [email protected]
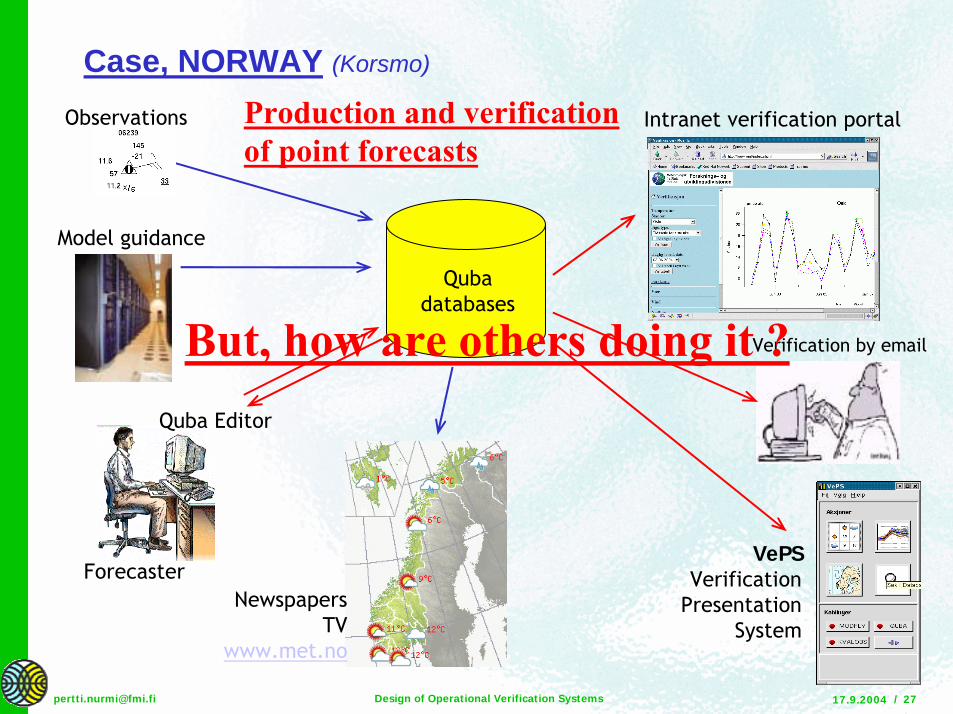
Model guidance
Quba Editor
Forecaster
Qubadatabases
NewspapersTV
www.met.no
VePSVerification
PresentationSystem
Observations
Verification by email
Intranet verification portal
Case, NORWAY (Korsmo)
Production and verificationof point forecasts
But, how are others doing it ?
17.9.2004Design of Operational Verification Systems / [email protected]
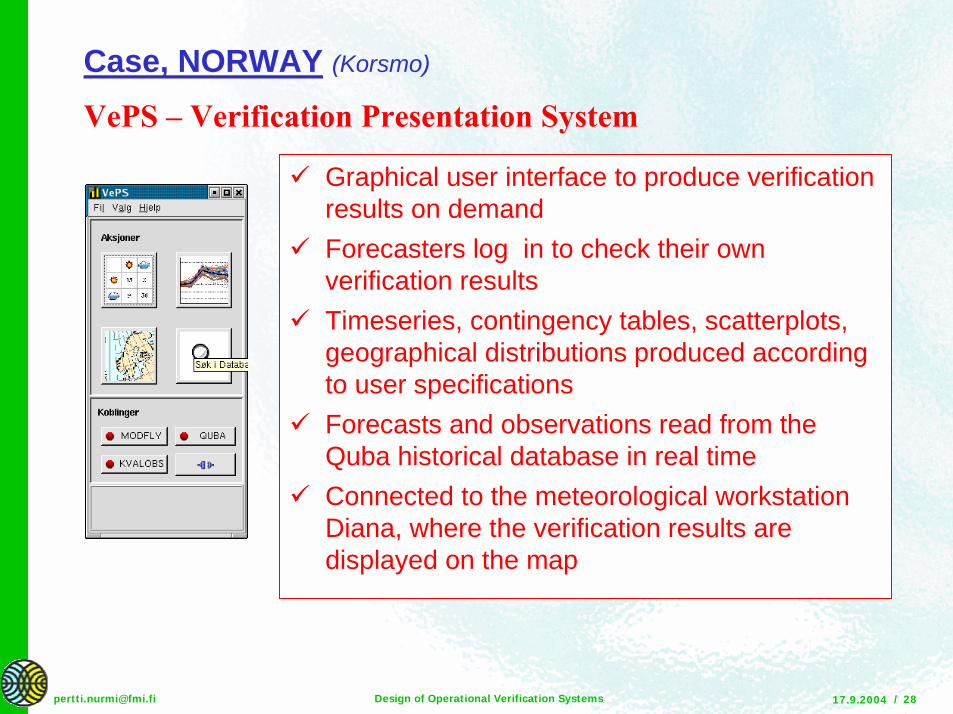
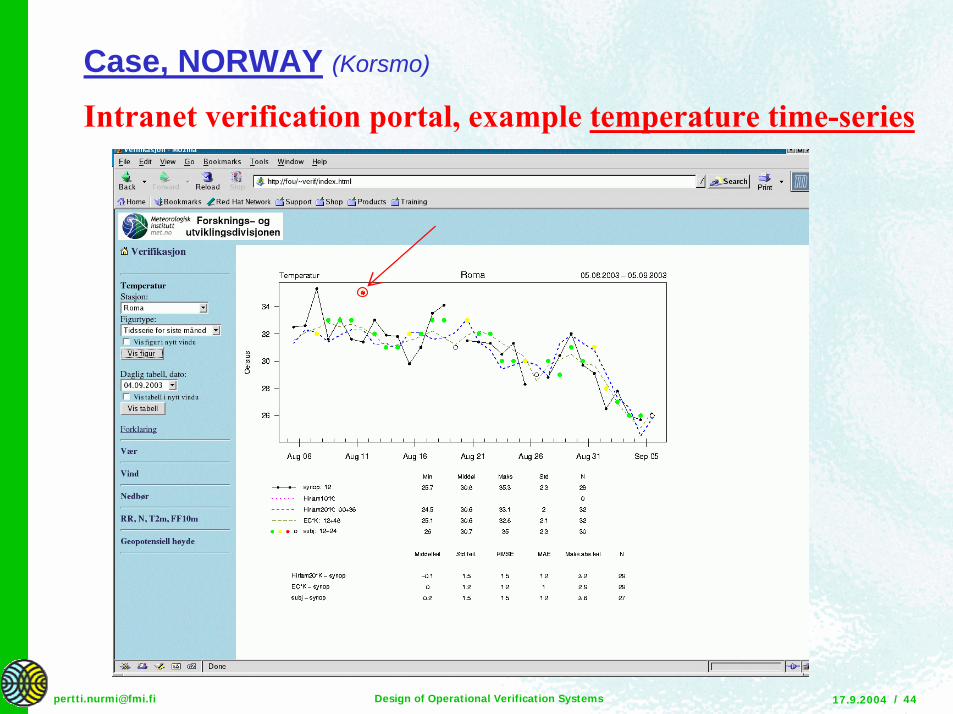
! Graphical user interface to produce verification results on demand
! Forecasters log in to check their own verification results
! Timeseries, contingency tables, scatterplots, geographical distributions produced according to user specifications
! Forecasts and observations read from the Quba historical database in real time
! Connected to the meteorological workstation Diana, where the verification results are displayed on the map
VePS � Verification Presentation System
Case, NORWAY (Korsmo)
17.9.2004Design of Operational Verification Systems / [email protected]
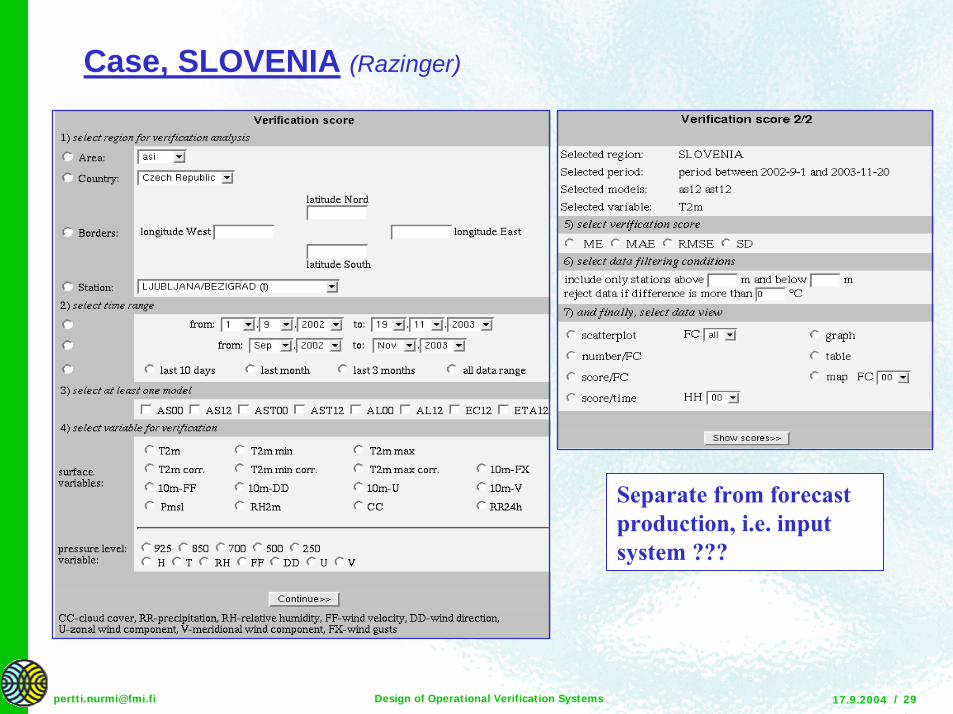
Case, SLOVENIA (Razinger)
Separate from forecast production, i.e. input system ???
17.9.2004Design of Operational Verification Systems / [email protected]
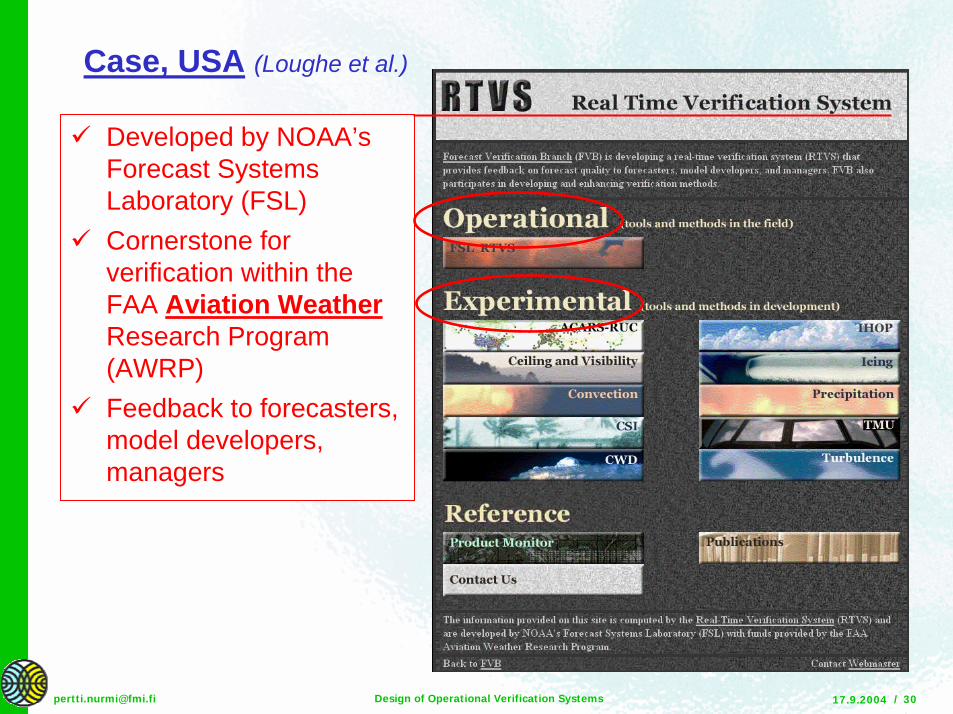
! Developed by NOAA’s Forecast Systems Laboratory (FSL)
! Cornerstone for verification within the FAA Aviation WeatherResearch Program (AWRP)
! Feedback to forecasters, model developers, managers
Case, USA (Loughe et al.)
17.9.2004Design of Operational Verification Systems / [email protected]
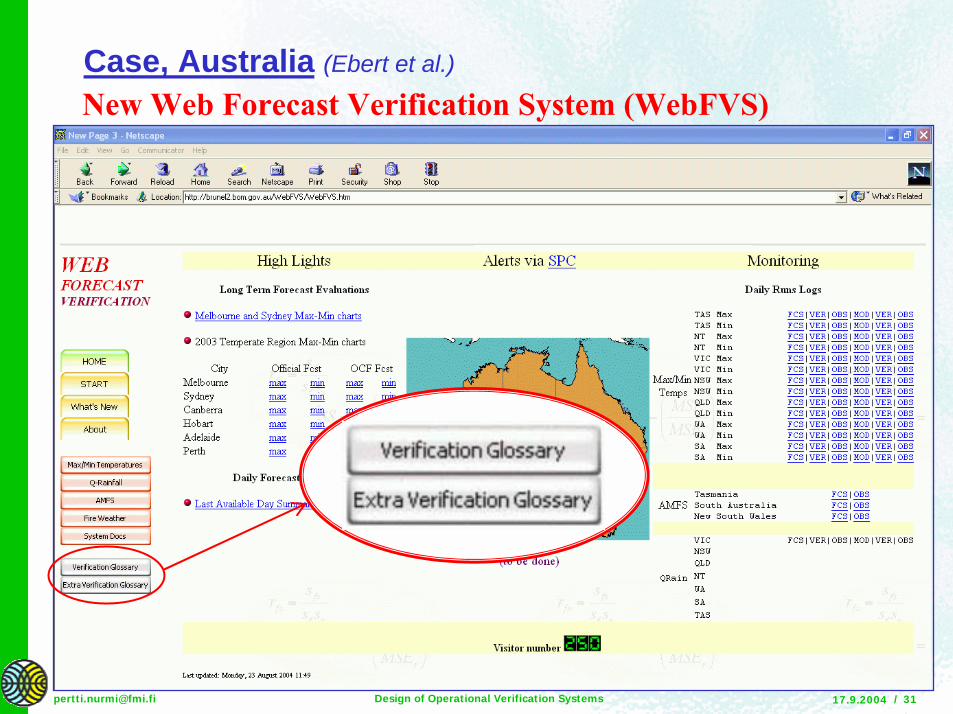
Case, Australia (Ebert et al.)
New Web Forecast Verification System (WebFVS)
17.9.2004Design of Operational Verification Systems / [email protected]
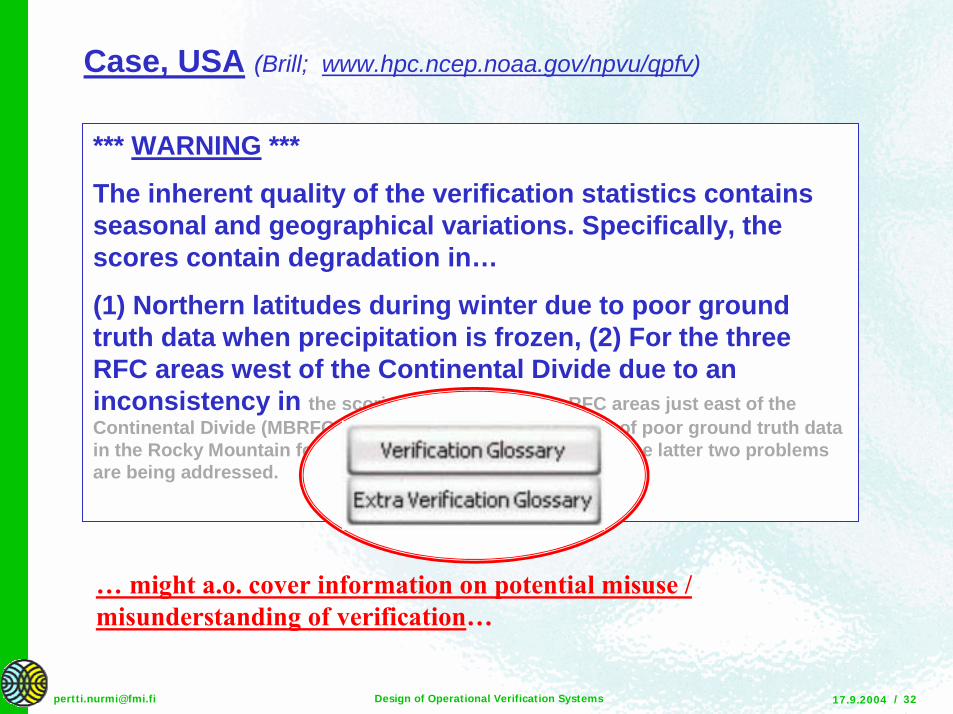
Case, USA (Brill; www.hpc.ncep.noaa.gov/npvu/qpfv)
*** WARNING ***
The inherent quality of the verification statistics contains seasonal and geographical variations. Specifically, the scores contain degradation in…
(1) Northern latitudes during winter due to poor ground truth data when precipitation is frozen, (2) For the three RFC areas west of the Continental Divide due to an inconsistency in the scoring, and (3) the three RFC areas just east of the Continental Divide (MBRFC, ABRFC, and WGRFC) because of poor ground truth data in the Rocky Mountain foothills areas. Scoring upgrades for the latter two problems are being addressed.
� might a.o. cover information on potential misuse / misunderstanding of verification�
17.9.2004Design of Operational Verification Systems / [email protected]
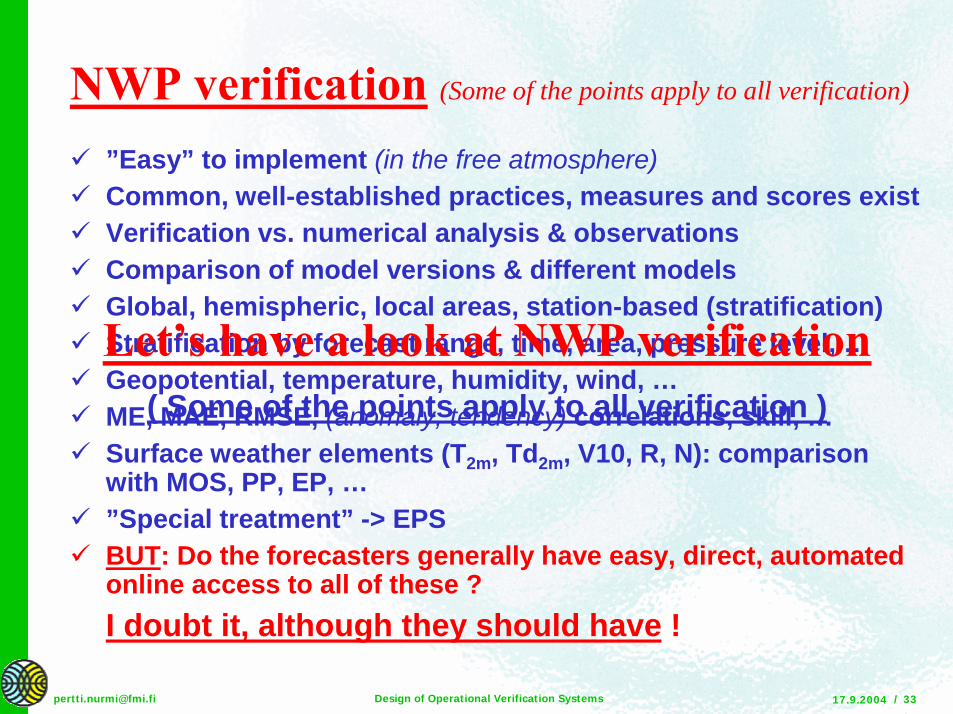
NWP verification (Some of the points apply to all verification)
! ”Easy” to implement (in the free atmosphere)! Common, well-established practices, measures and scores exist! Verification vs. numerical analysis & observations! Comparison of model versions & different models! Global, hemispheric, local areas, station-based (stratification)! Stratification by forecast range, time, area, pressure level, …! Geopotential, temperature, humidity, wind, …! ME, MAE, RMSE, (anomaly, tendency) correlations, skill, …! Surface weather elements (T2m, Td2m, V10, R, N): comparison
with MOS, PP, EP, …! ”Special treatment” -> EPS! BUT: Do the forecasters generally have easy, direct, automated
online access to all of these ?I doubt it, although they should have !
Let�s have a look at NWP verification( Some of the points apply to all verification )
17.9.2004Design of Operational Verification Systems / [email protected]
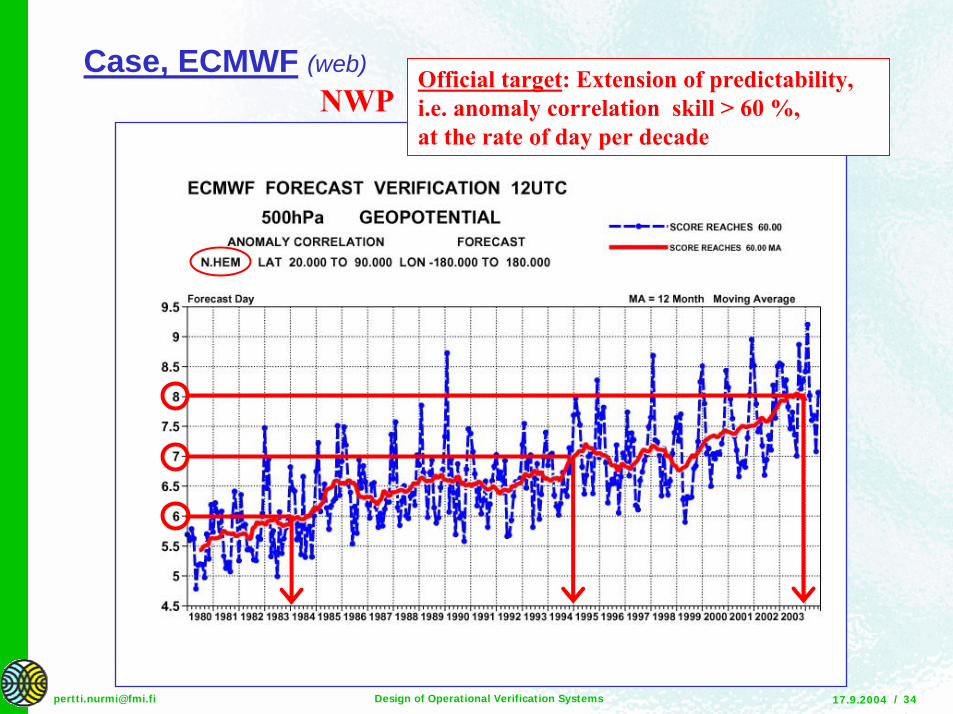
Case, ECMWF (web) Official target: Extension of predictability, i.e. anomaly correlation skill > 60 %,at the rate of day per decade
NWP
17.9.2004Design of Operational Verification Systems / [email protected]
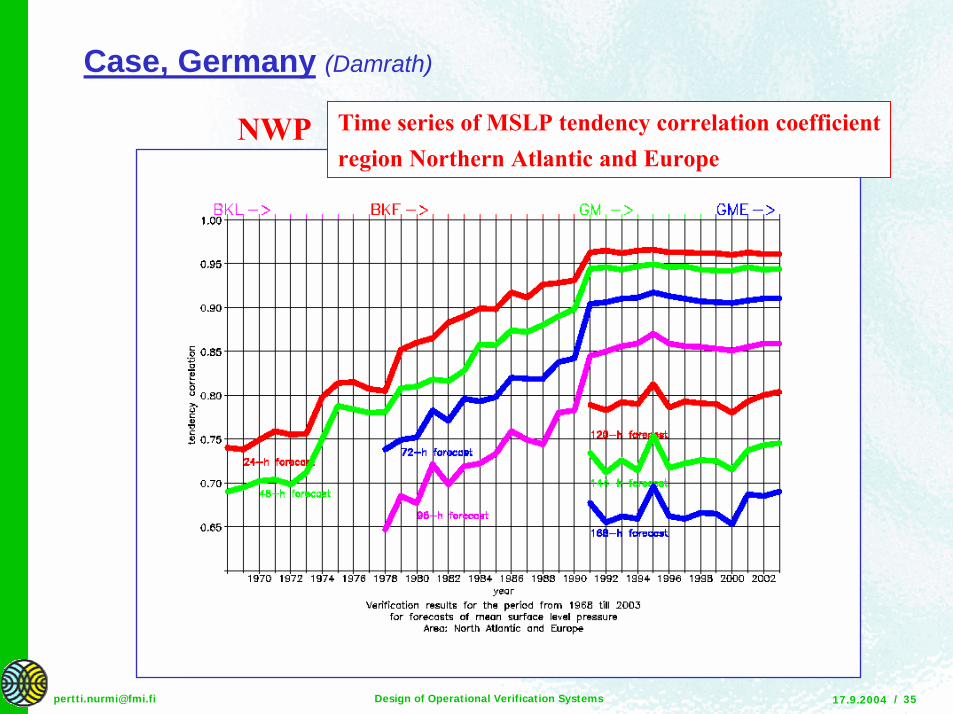
Case, Germany (Damrath)
Time series of MSLP tendency correlation coefficientregion Northern Atlantic and Europe
NWP
17.9.2004Design of Operational Verification Systems / [email protected]
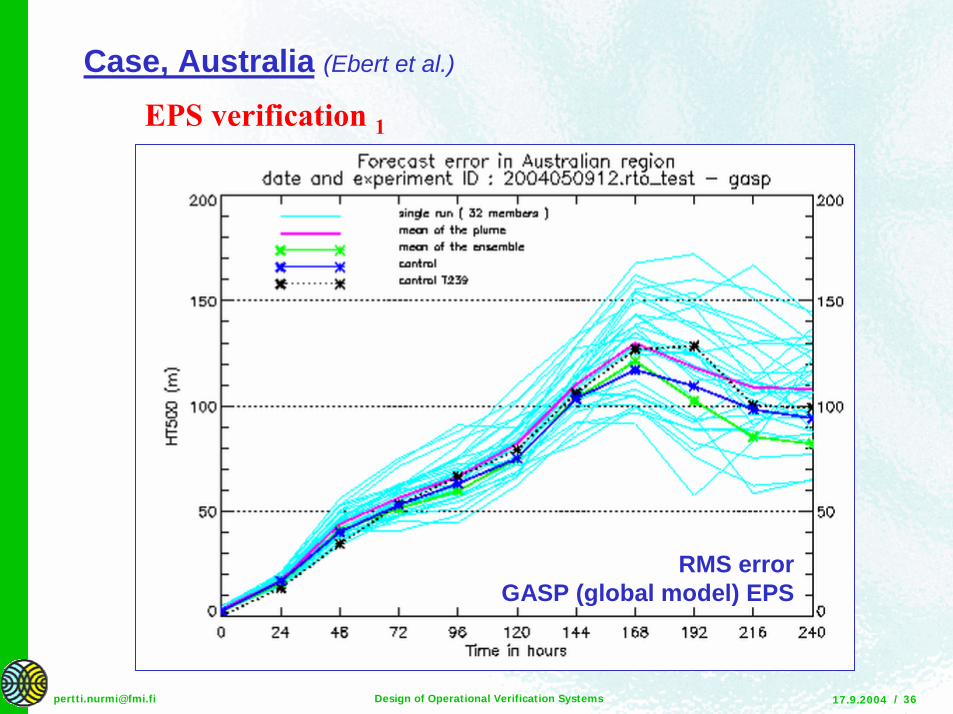
EPS verification 1
Case, Australia (Ebert et al.)
RMS errorGASP (global model) EPS
17.9.2004Design of Operational Verification Systems / [email protected]
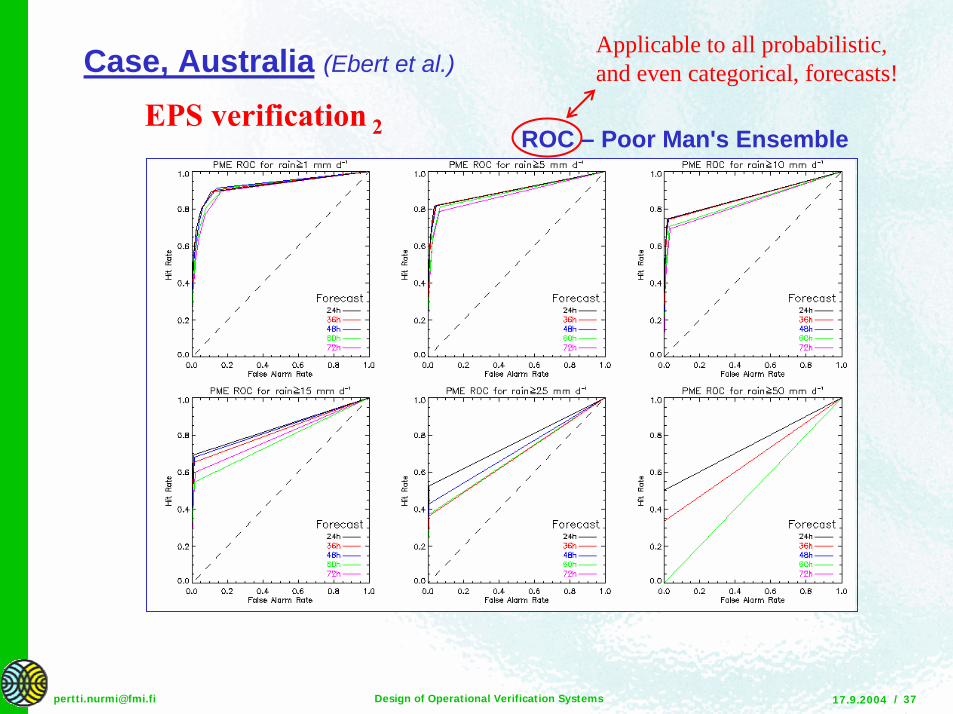
EPS verification 2
Case, Australia (Ebert et al.)
ROC – Poor Man's Ensemble
Applicable to all probabilistic,and even categorical, forecasts!
17.9.2004Design of Operational Verification Systems / [email protected]
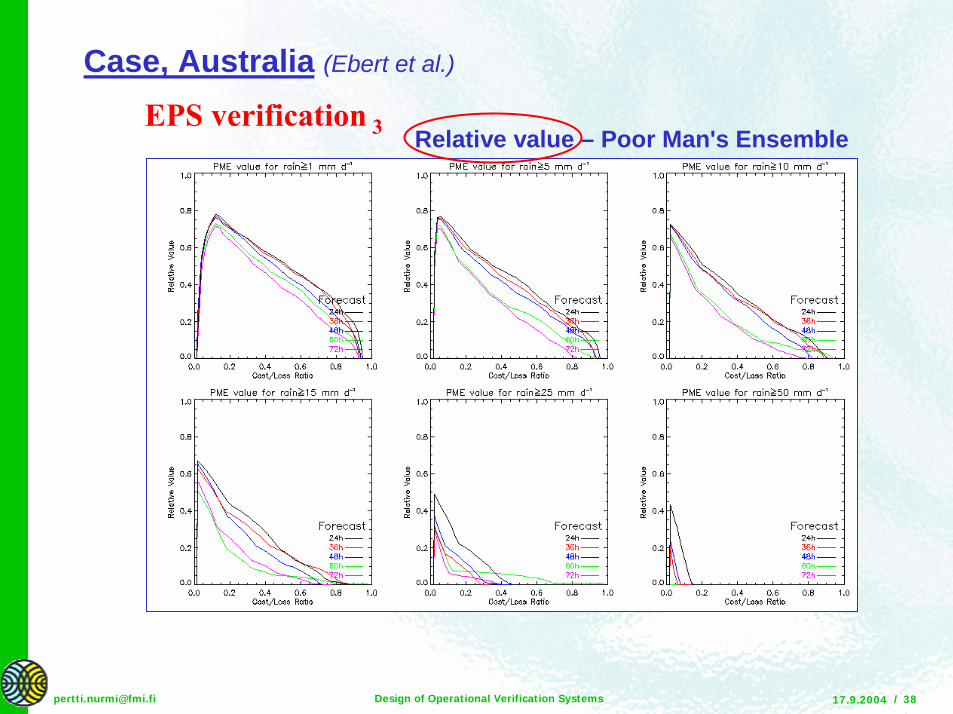
EPS verification 3
Case, Australia (Ebert et al.)
Relative value – Poor Man's Ensemble
17.9.2004Design of Operational Verification Systems / [email protected]
Uncertainty - Why Probability Forecasts ?
©“… the widespread practice of ignoring uncertainty when formulating and communicating forecasts represents an extreme form of inconsistency and generally results in the largest possible reductions in quality and value.”
- Allan Murphy (1993)
17.9.2004Design of Operational Verification Systems / [email protected]
Uncertainty - Why Probability Forecasts ?
©“… Go look at the weather,I believe it’s gonna rain”
- Legendary Chicago Blues ArtistMuddy Waters (early 1960s)
”Clouds in My Heart”
17.9.2004Design of Operational Verification Systems / [email protected]
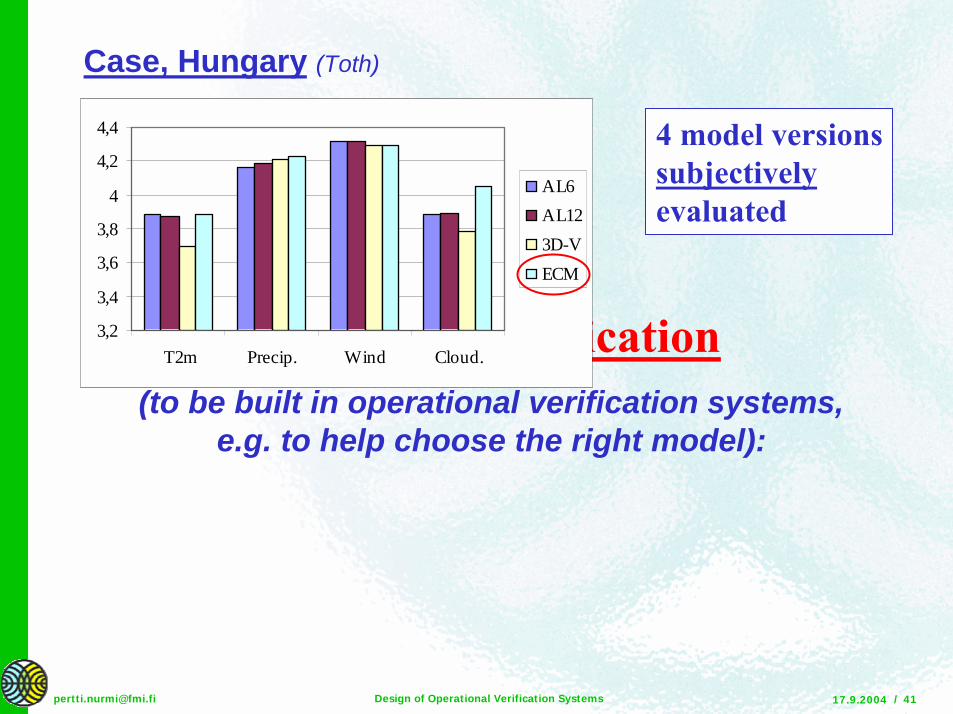
Subjective verification(to be built in operational verification systems,
e.g. to help choose the right model):
Case, Hungary (Toth)
3,2
3,4
3,6
3,8
4
4,2
4,4
T2m Precip. Wind Cloud.
AL6AL123D-VECM
4 model versionssubjectivelyevaluated
17.9.2004Design of Operational Verification Systems / [email protected]
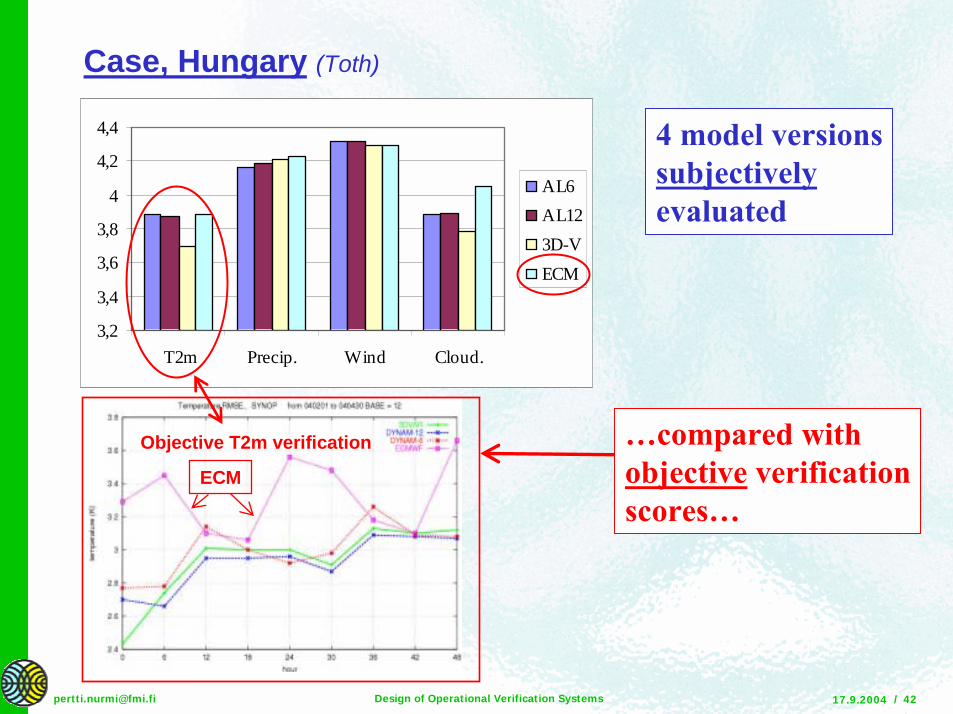
Case, Hungary (Toth)
3,2
3,4
3,6
3,8
4
4,2
4,4
T2m Precip. Wind Cloud.
AL6AL123D-VECM
4 model versionssubjectivelyevaluated
Objective T2m verification
ECM
�compared withobjective verificationscores�
17.9.2004Design of Operational Verification Systems / [email protected]
" Verification feedback in the internet, rather than intranet, which often seems to be the case
End product, public weatherand rare event verification:
17.9.2004Design of Operational Verification Systems / [email protected]
Intranet verification portal, example temperature time-series
Case, NORWAY (Korsmo)
17.9.2004Design of Operational Verification Systems / [email protected]
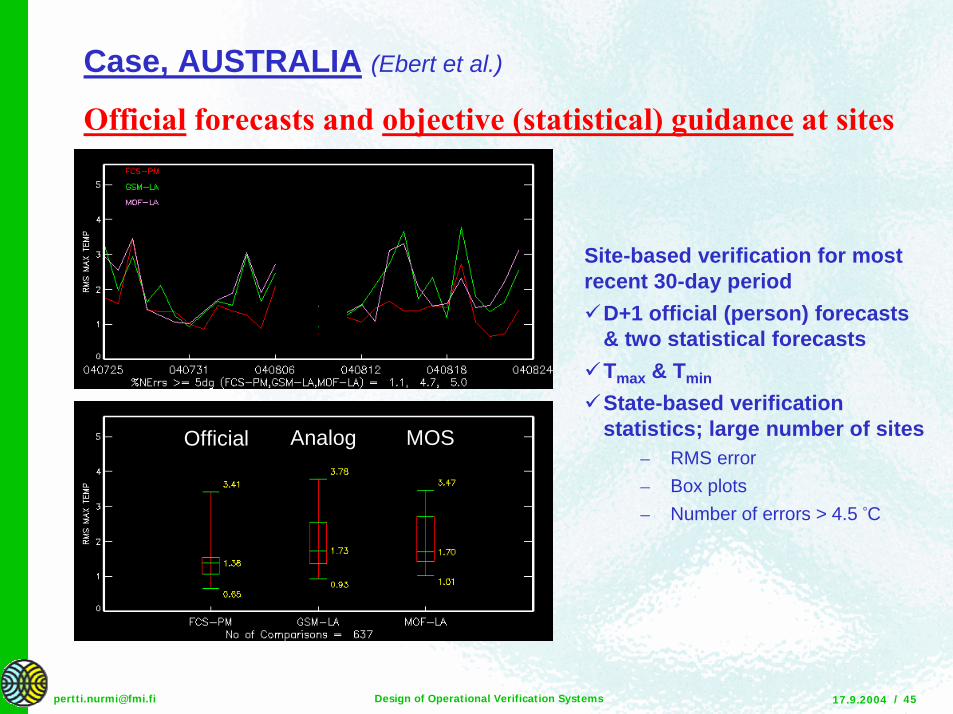
Official forecasts and objective (statistical) guidance at sites
Site-based verification for mostrecent 30-day period!D+1 official (person) forecasts
& two statistical forecasts!Tmax & Tmin
!State-based verification statistics; large number of sites
– RMS error – Box plots– Number of errors > 4.5 °C
Official Analog MOS
Case, AUSTRALIA (Ebert et al.)
17.9.2004Design of Operational Verification Systems / [email protected]
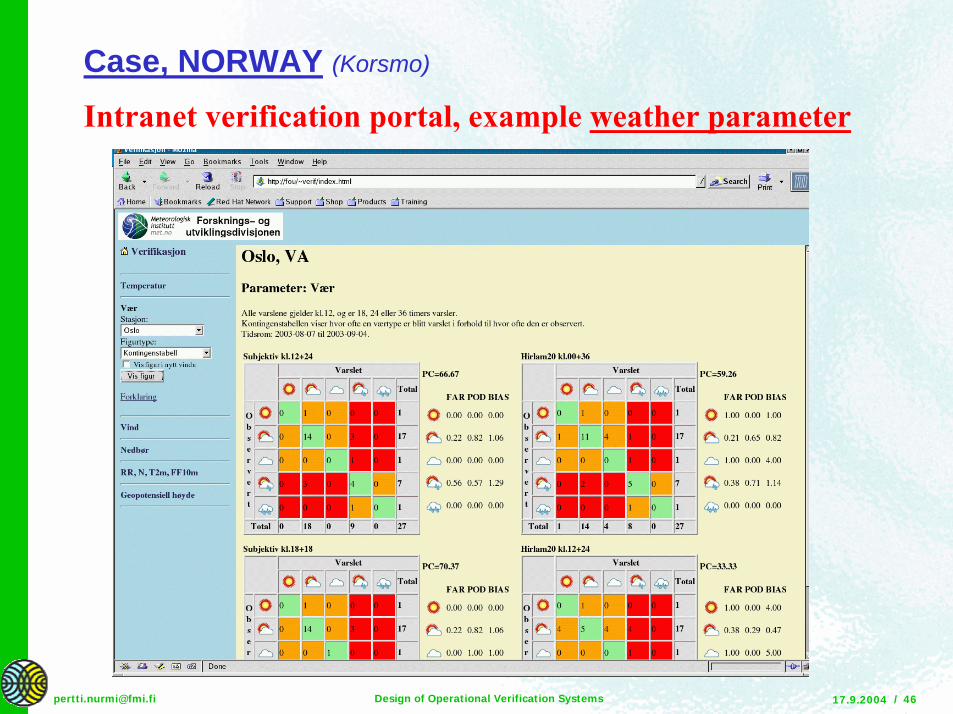
Intranet verification portal, example weather parameter
Case, NORWAY (Korsmo)
17.9.2004Design of Operational Verification Systems / [email protected]
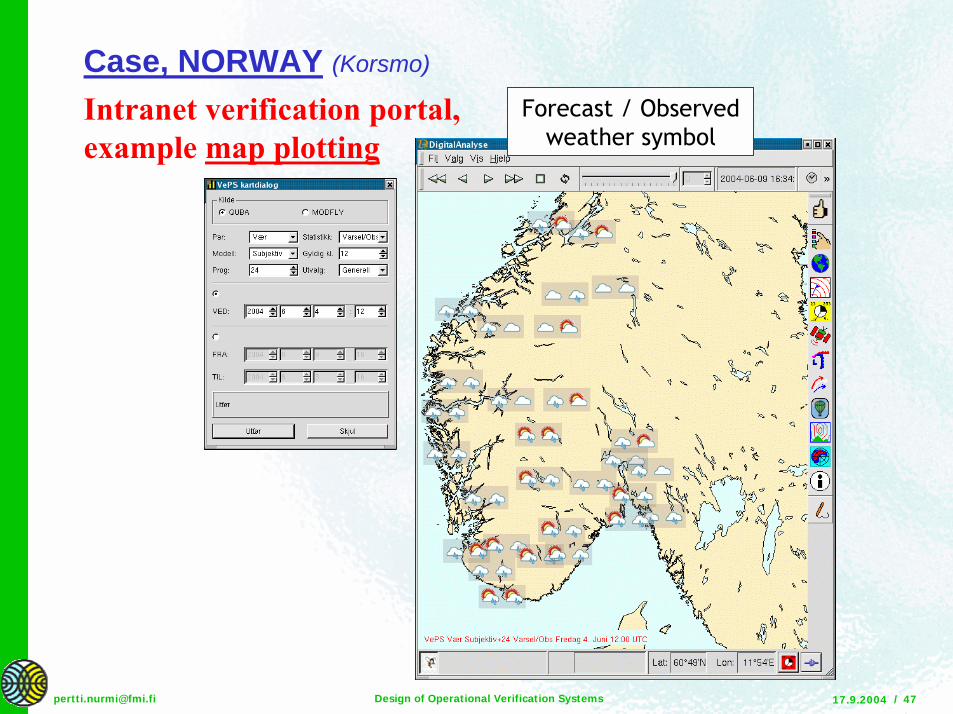
Forecast / Observedweather symbol
Case, NORWAY (Korsmo)
Intranet verification portal,example map plotting
17.9.2004Design of Operational Verification Systems / [email protected]
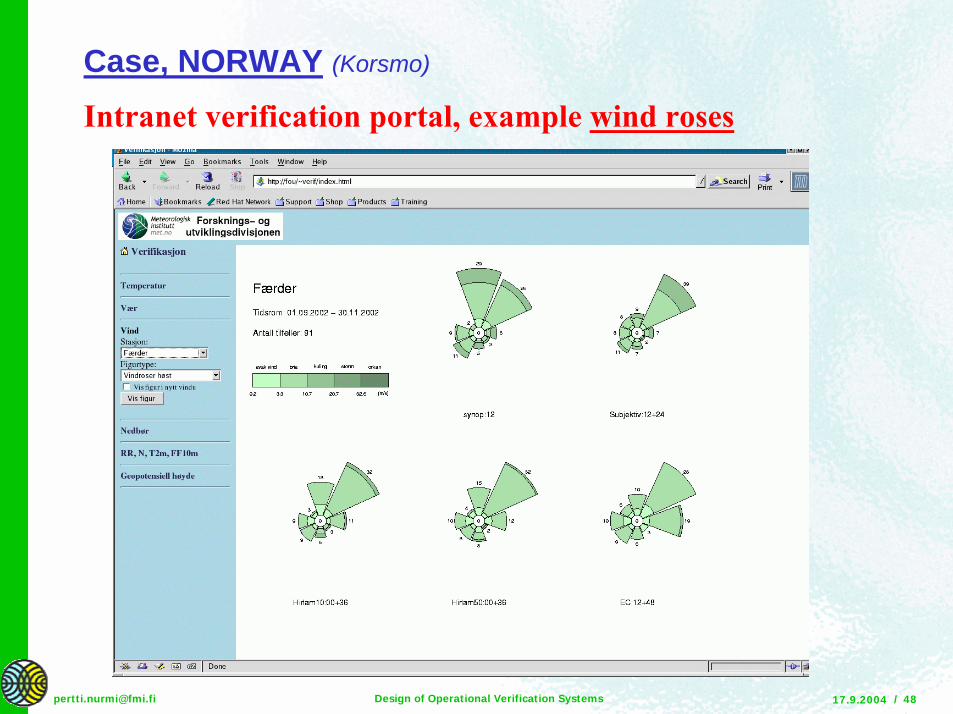
Intranet verification portal, example wind roses
Case, NORWAY (Korsmo)
17.9.2004Design of Operational Verification Systems / [email protected]
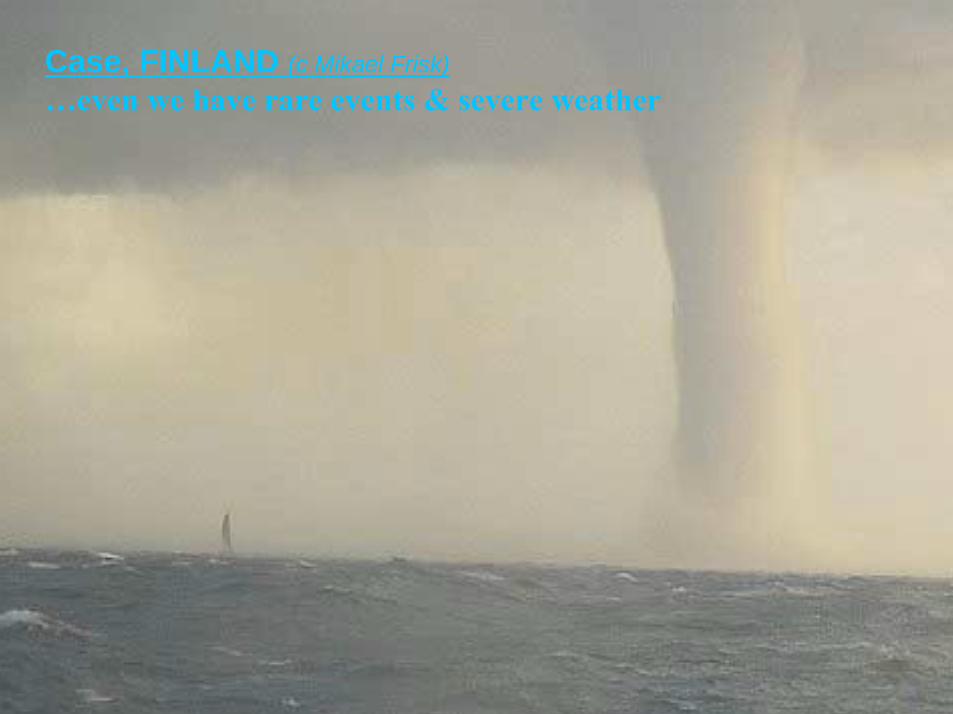
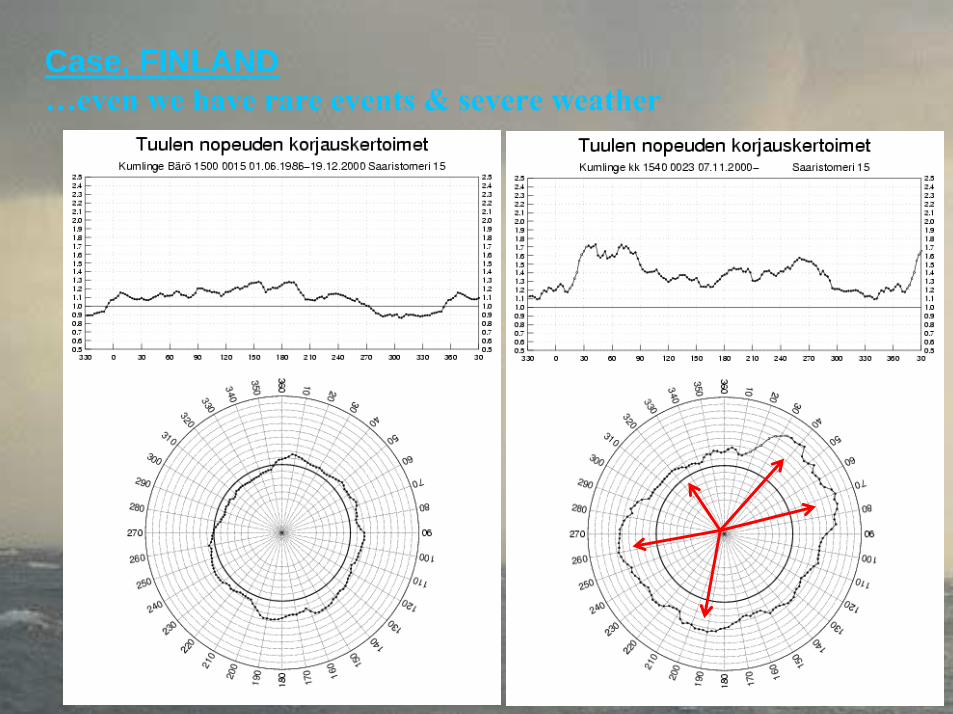
Case, FINLAND (c Mikael Frisk)�even we have rare events & severe weather
17.9.2004Design of Operational Verification Systems / [email protected]
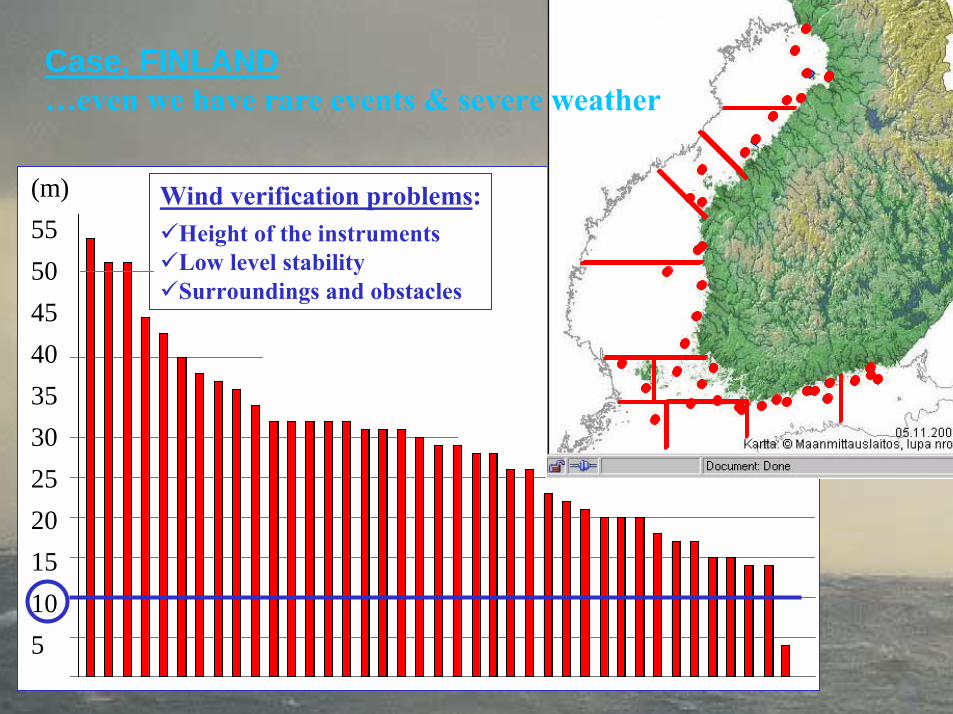
(m)555045403530252015105
Wind verification problems:!Height of the instruments!Low level stability!Surroundings and obstacles
Case, FINLAND�even we have rare events & severe weather
17.9.2004Design of Operational Verification Systems / [email protected]
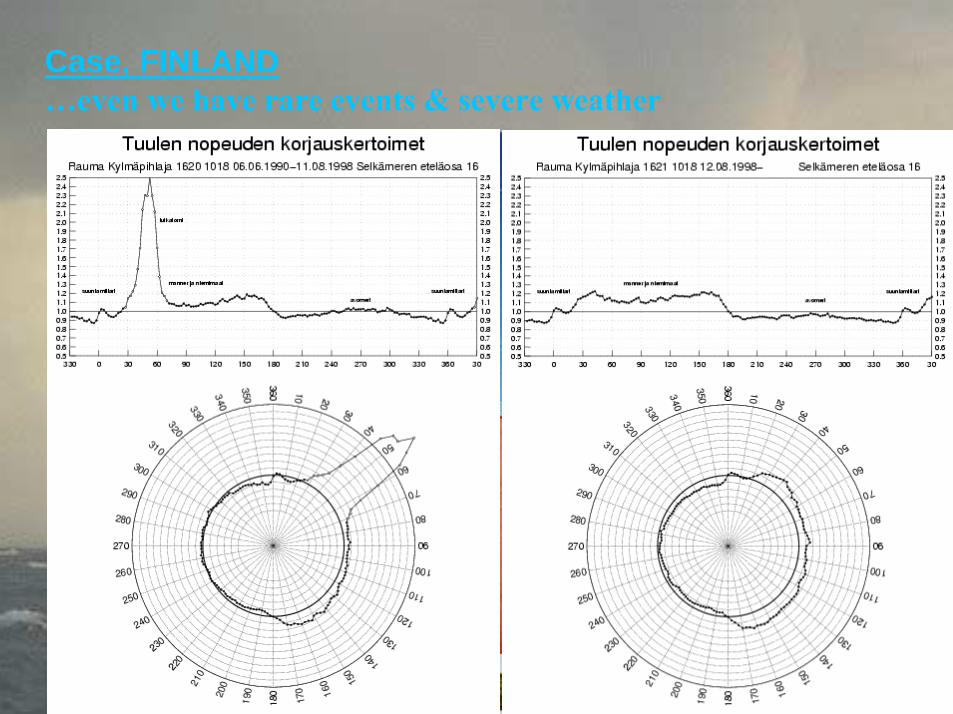
Case, FINLAND�even we have rare events & severe weather
17.9.2004Design of Operational Verification Systems / [email protected]
Case, FINLAND�even we have rare events & severe weather
17.9.2004Design of Operational Verification Systems / [email protected]
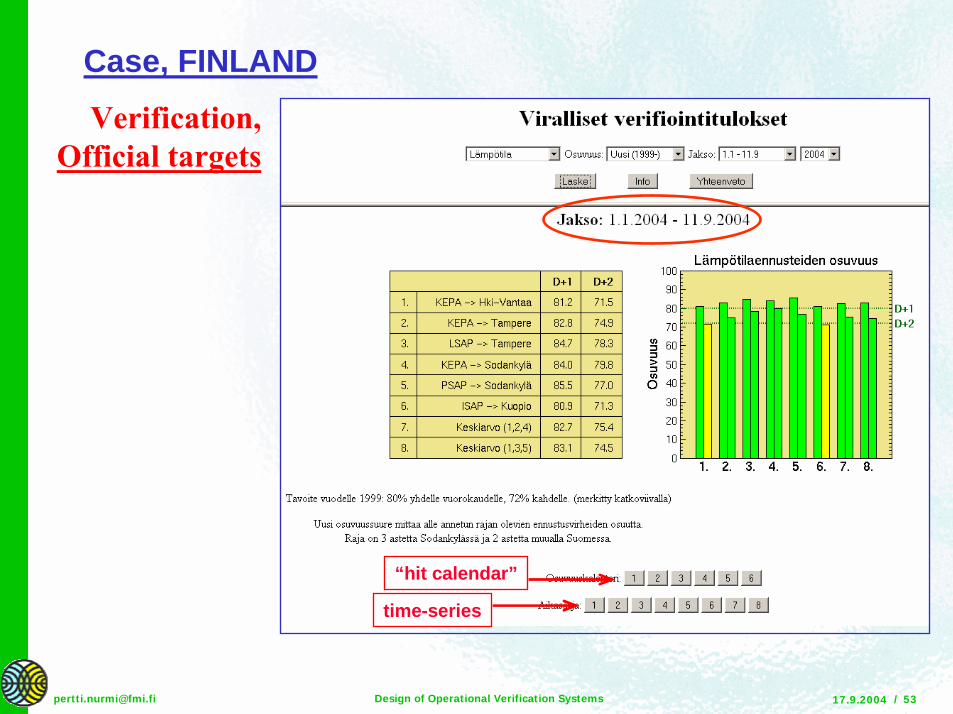
Verification,Official targets
Case, FINLAND
“hit calendar”
time-series
17.9.2004Design of Operational Verification Systems / [email protected]
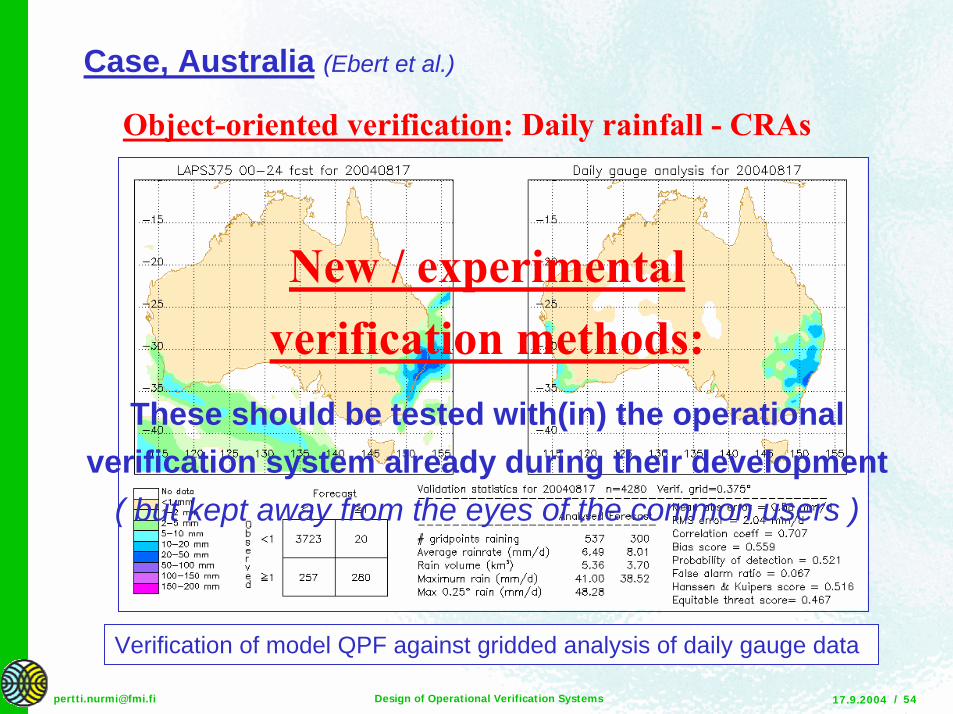
Case, Australia (Ebert et al.)
Verification of model QPF against gridded analysis of daily gauge data
Object-oriented verification: Daily rainfall - CRAs
New / experimentalverification methods:
These should be tested with(in) the operationalverification system already during their development
( but kept away from the eyes of the common users )
17.9.2004Design of Operational Verification Systems / [email protected]
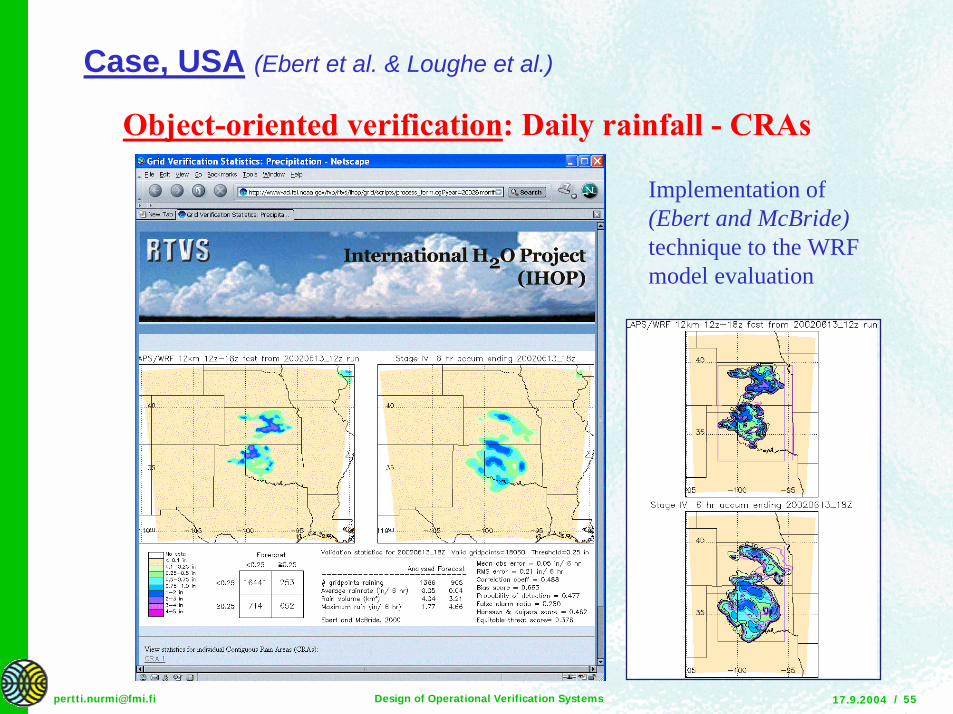
Case, USA (Ebert et al. & Loughe et al.)
Object-oriented verification: Daily rainfall - CRAs
Implementation of (Ebert and McBride)technique to the WRF model evaluation
17.9.2004Design of Operational Verification Systems / [email protected]
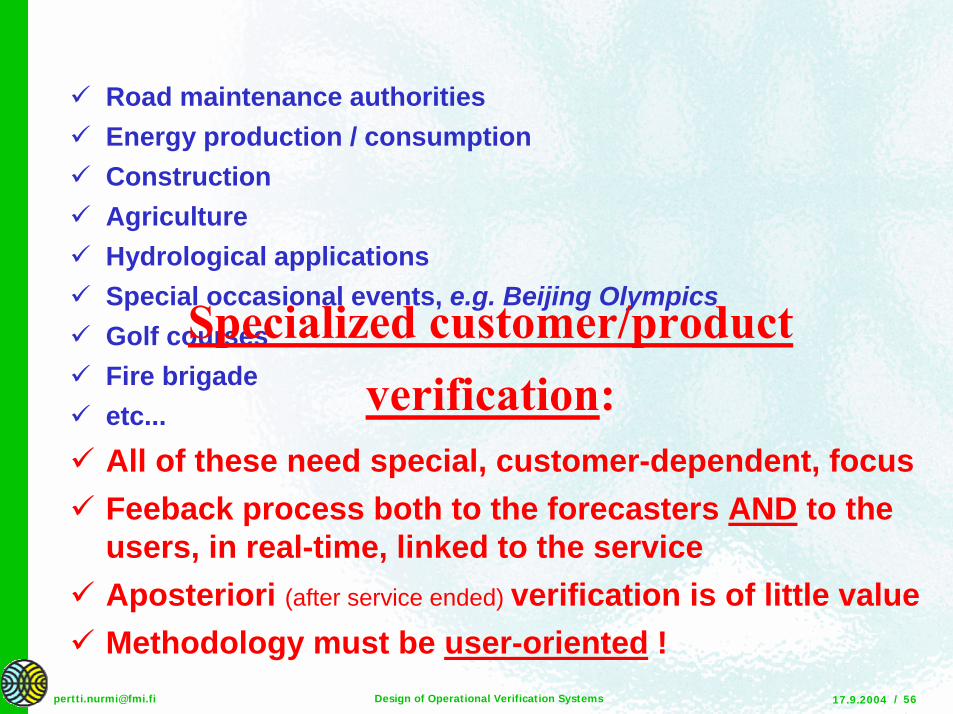
! Road maintenance authorities! Energy production / consumption! Construction! Agriculture! Hydrological applications! Special occasional events, e.g. Beijing Olympics! Golf courses! Fire brigade! etc...
! All of these need special, customer-dependent, focus! Feeback process both to the forecasters AND to the
users, in real-time, linked to the service! Aposteriori (after service ended) verification is of little value ! Methodology must be user-oriented !
Specialized customer/productverification:
17.9.2004Design of Operational Verification Systems / [email protected]
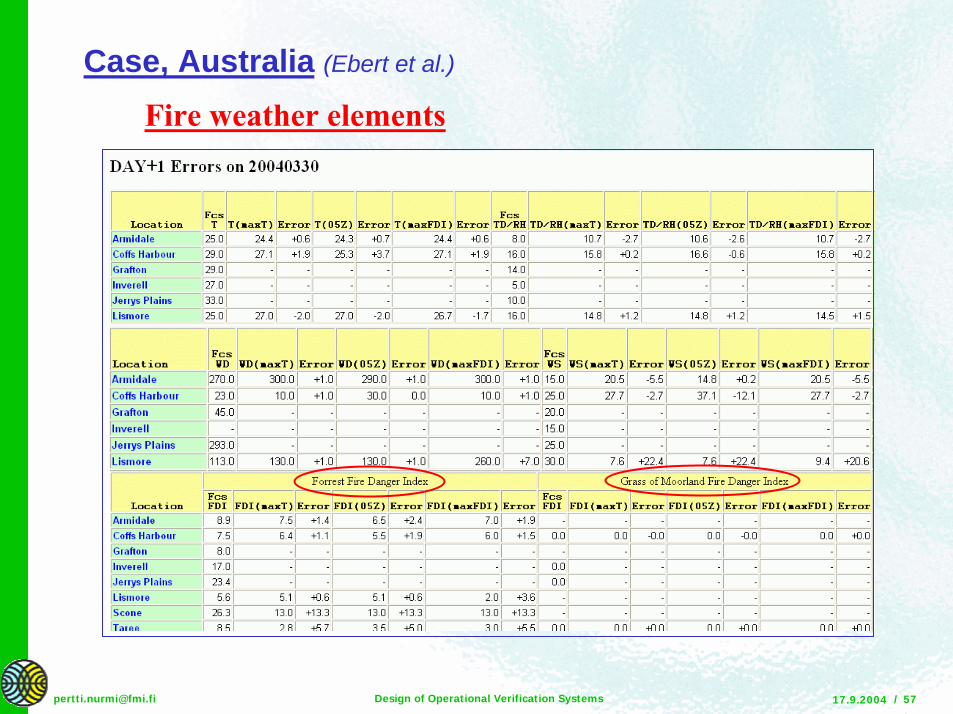
Case, Australia (Ebert et al.)
Fire weather elements
17.9.2004Design of Operational Verification Systems / [email protected]
Specialized verification: Aviation, TAF! “Totally it‘s own world“! Often separate from „terrestrial“ forecast production...
Possibly requiring an independent verification system! Similar prerequisites as for all operational verification! Not elaborated here, except with one example
17.9.2004Design of Operational Verification Systems / [email protected]
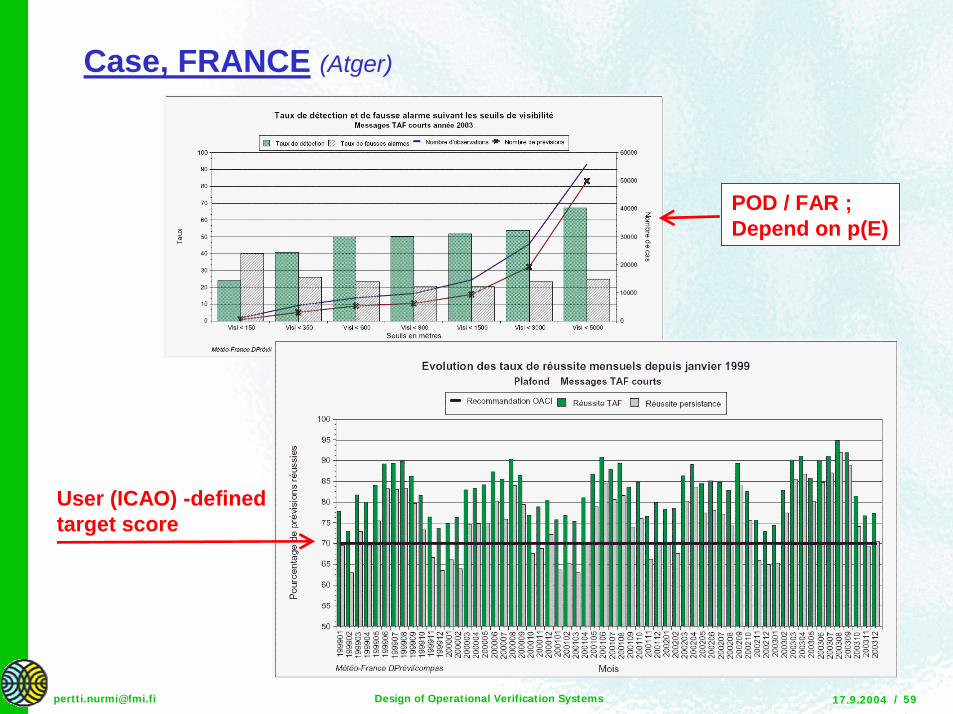
Case, FRANCE (Atger)
POD / FAR ;Depend on p(E)
User (ICAO) -definedtarget score
17.9.2004Design of Operational Verification Systems / [email protected]
Techniques of verification systems! Personally, I’m a novice of modern IT techniques !
=> No answers on “How to do it?” in this talk! Well-structured, rapid, interactive user interface and
verification database! How about, e.g. packages like “R” ???
– Are they easy to link to various, different local database structures?
! Comprehensive user-guide/tutorial “tool bag”
17.9.2004Design of Operational Verification Systems / [email protected]
Continuous variables, Exploring the data
! Scatterplots of forecasts vs. observations– Visual relation between forecast and observed distributions– Distinguish outliers in forecast and/or observation datasets
! Additional scatterplots– Observations vs. [ forecast - observation ] difference– Forecasts vs. [ forecast - observation ] difference– Behaviour of forecast errors with respect to observed or forecast
distributions - potential clustering or curvature in the relationships
! Time-series plot of forecasts vs. observations (or forecast error)– Potential outliers in either forecast or observation datasets– Trends and time-dependent relationships
Verification ”toolbag”
Verification tutorial, user-guide�toolbag� of an operational system
might include something like what follows,time permitting, probably not:
17.9.2004Design of Operational Verification Systems / [email protected]
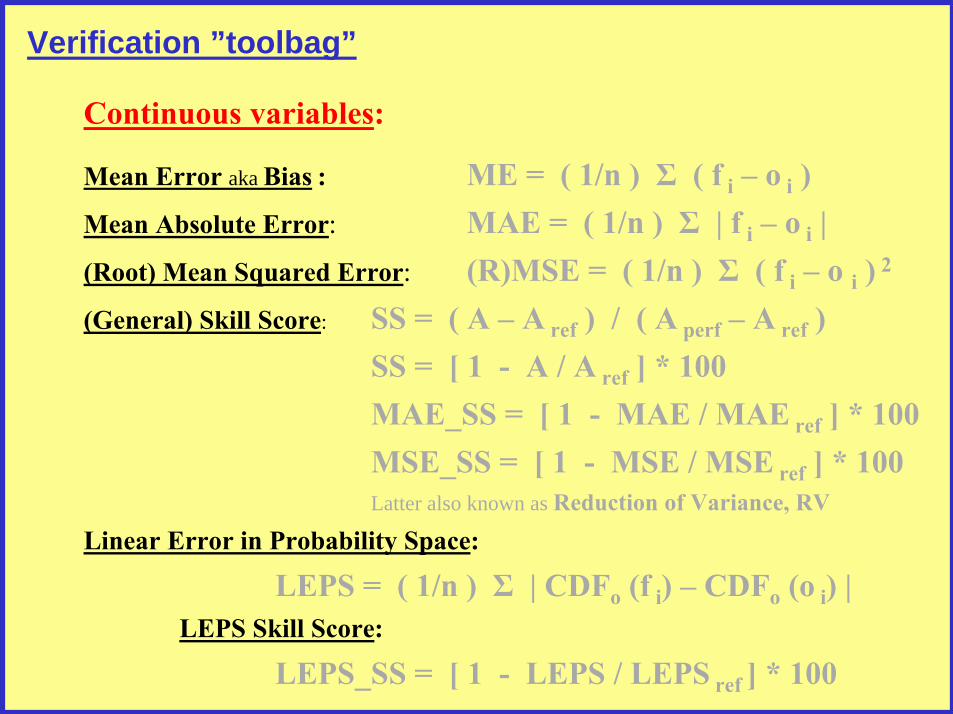
Mean Error aka Bias : ME = ( 1/n ) Σ ( f i � o i )Mean Absolute Error: MAE = ( 1/n ) Σ | f i � o i |(Root) Mean Squared Error: (R)MSE = ( 1/n ) Σ ( f i � o i ) 2
(General) Skill Score: SS = ( A � A ref ) / ( A perf � A ref )SS = [ 1 - A / A ref ] * 100MAE_SS = [ 1 - MAE / MAE ref ] * 100MSE_SS = [ 1 - MSE / MSE ref ] * 100Latter also known as Reduction of Variance, RV
Linear Error in Probability Space:
LEPS = ( 1/n ) Σ | CDFo (f i) � CDFo (o i) | LEPS Skill Score:
LEPS_SS = [ 1 - LEPS / LEPS ref ] * 100
Continuous variables:
Verification ”toolbag”
17.9.2004Design of Operational Verification Systems / [email protected]
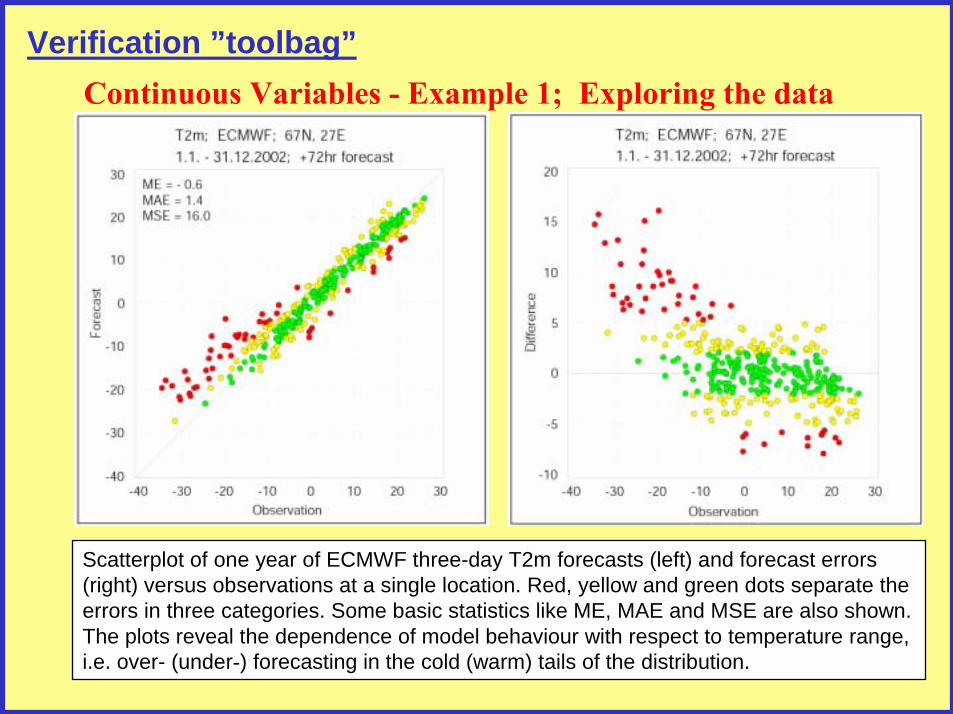
Continuous Variables - Example 1; Exploring the data
Scatterplot of one year of ECMWF three-day T2m forecasts (left) and forecast errors (right) versus observations at a single location. Red, yellow and green dots separate the errors in three categories. Some basic statistics like ME, MAE and MSE are also shown. The plots reveal the dependence of model behaviour with respect to temperature range, i.e. over- (under-) forecasting in the cold (warm) tails of the distribution.
Verification ”toolbag”
17.9.2004Design of Operational Verification Systems / [email protected]
T2m; ME & MAE; ECMWF & LAMAverage over 30 stations; Winter 2003
-1
0
1
2
3
4
5
6 12 18 24 30 36 42 48 54 60 72 84 96 108 120
MAE_ECMWF MAE_LAM ME_ECMWF ME_LAM
(C)
( hrs )
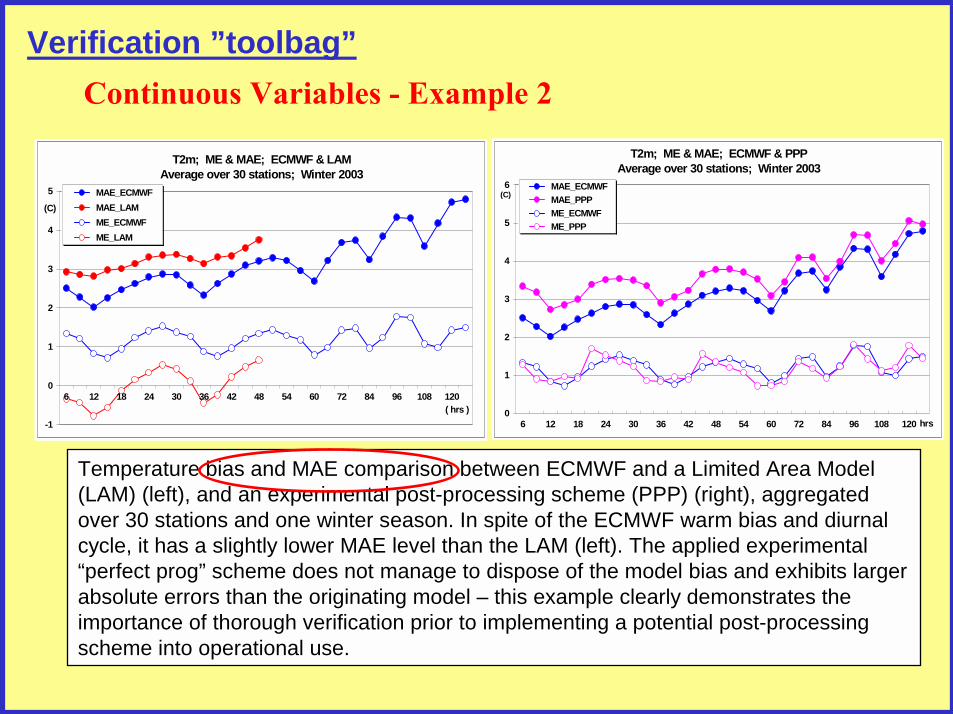
Temperature bias and MAE comparison between ECMWF and a Limited Area Model (LAM) (left), and an experimental post-processing scheme (PPP) (right), aggregated over 30 stations and one winter season. In spite of the ECMWF warm bias and diurnal cycle, it has a slightly lower MAE level than the LAM (left). The applied experimental “perfect prog” scheme does not manage to dispose of the model bias and exhibits larger absolute errors than the originating model – this example clearly demonstrates the importance of thorough verification prior to implementing a potential post-processing scheme into operational use.
T2m; ME & MAE; ECMWF & PPPAverage over 30 stations; Winter 2003
0
1
2
3
4
5
6
6 12 18 24 30 36 42 48 54 60 72 84 96 108 120
MAE_ECMWF MAE_PPP ME_ECMWF ME_PPP
(C)
hrs
Continuous Variables - Example 2Verification ”toolbag”
17.9.2004Design of Operational Verification Systems / [email protected]
T2m; MAE; Average over 3 stations & forecast ranges +12-120 hrs
0
1
2
3
4
Winter2001
Spring2001
Summer2001
Autumn2001
Winter2002
Spring2002
Summer2002
Autumn2002
Winter2003
Timeaverage
(C) End Product "Better of ECMWF / LAM"
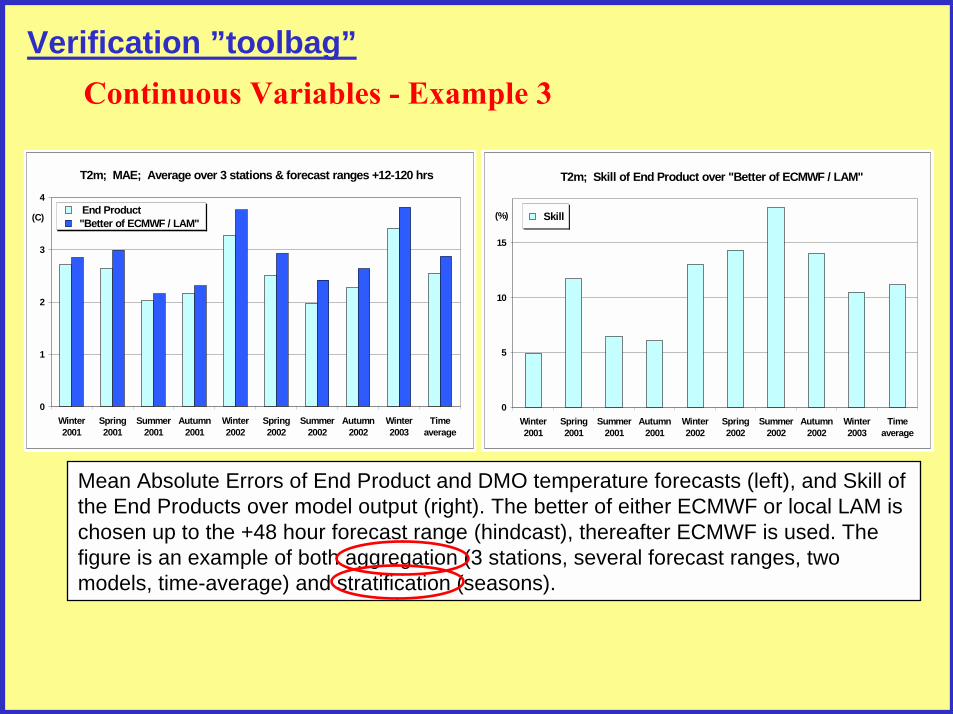
Mean Absolute Errors of End Product and DMO temperature forecasts (left), and Skill of the End Products over model output (right). The better of either ECMWF or local LAM is chosen up to the +48 hour forecast range (hindcast), thereafter ECMWF is used. The figure is an example of both aggregation (3 stations, several forecast ranges, two models, time-average) and stratification (seasons).
T2m; Skill of End Product over "Better of ECMWF / LAM"
0
5
10
15
Winter2001
Spring2001
Summer2001
Autumn2001
Winter2002
Spring2002
Summer2002
Autumn2002
Winter2003
Timeaverage
(%) Skill
Continuous Variables - Example 3Verification ”toolbag”
17.9.2004Design of Operational Verification Systems / [email protected]
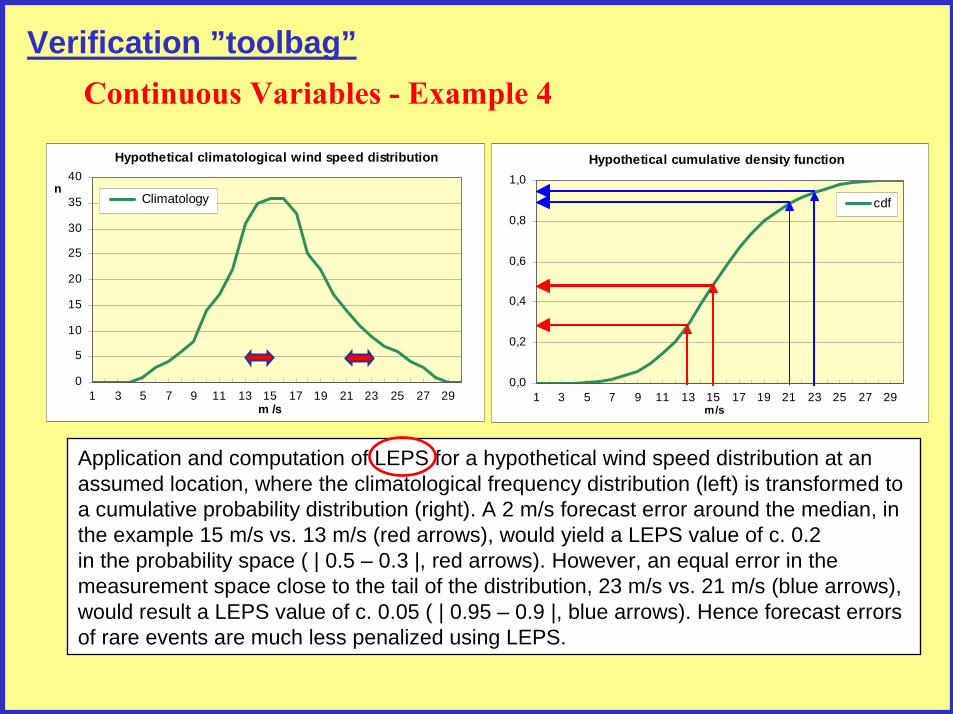
Application and computation of LEPS for a hypothetical wind speed distribution at an assumed location, where the climatological frequency distribution (left) is transformed to a cumulative probability distribution (right). A 2 m/s forecast error around the median, in the example 15 m/s vs. 13 m/s (red arrows), would yield a LEPS value of c. 0.2 in the probability space ( | 0.5 – 0.3 |, red arrows). However, an equal error in the measurement space close to the tail of the distribution, 23 m/s vs. 21 m/s (blue arrows), would result a LEPS value of c. 0.05 ( | 0.95 – 0.9 |, blue arrows). Hence forecast errors of rare events are much less penalized using LEPS.
Hypothetical climatological wind speed distribution
0
5
10
15
20
25
30
35
40
1 3 5 7 9 11 13 15 17 19 21 23 25 27 29m /s
n Climatology
Hypothetical cumulative density function
0,0
0,2
0,4
0,6
0,8
1,0
1 3 5 7 9 11 13 15 17 19 21 23 25 27 29m/s
cdf
Continuous Variables - Example 4Verification ”toolbag”
17.9.2004Design of Operational Verification Systems / [email protected]
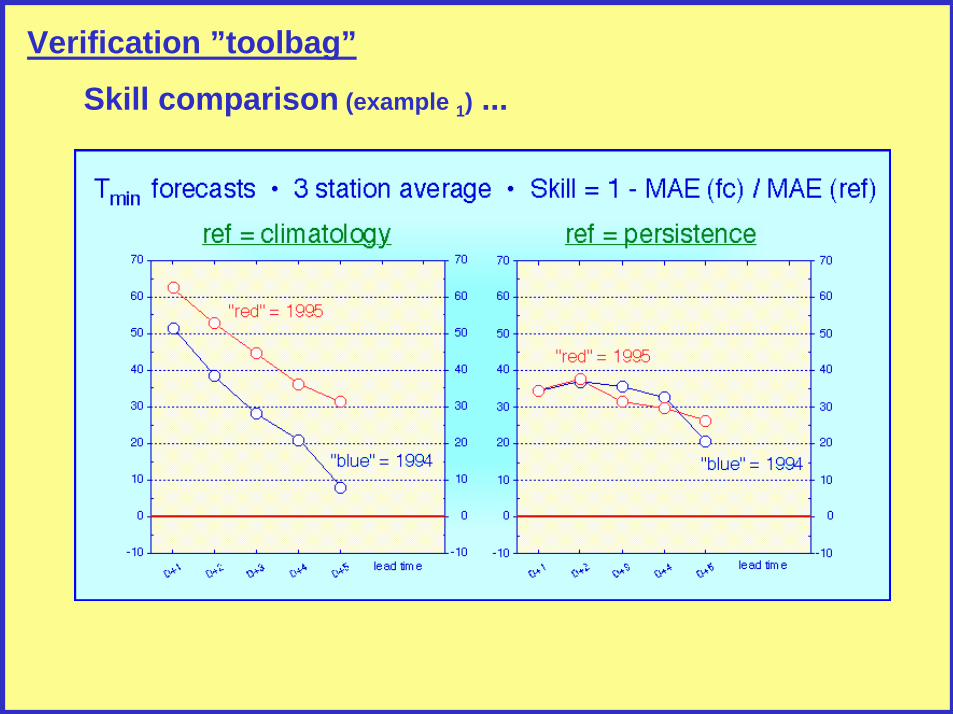
Skill comparison (example 1) ...
Verification ”toolbag”
17.9.2004Design of Operational Verification Systems / [email protected]
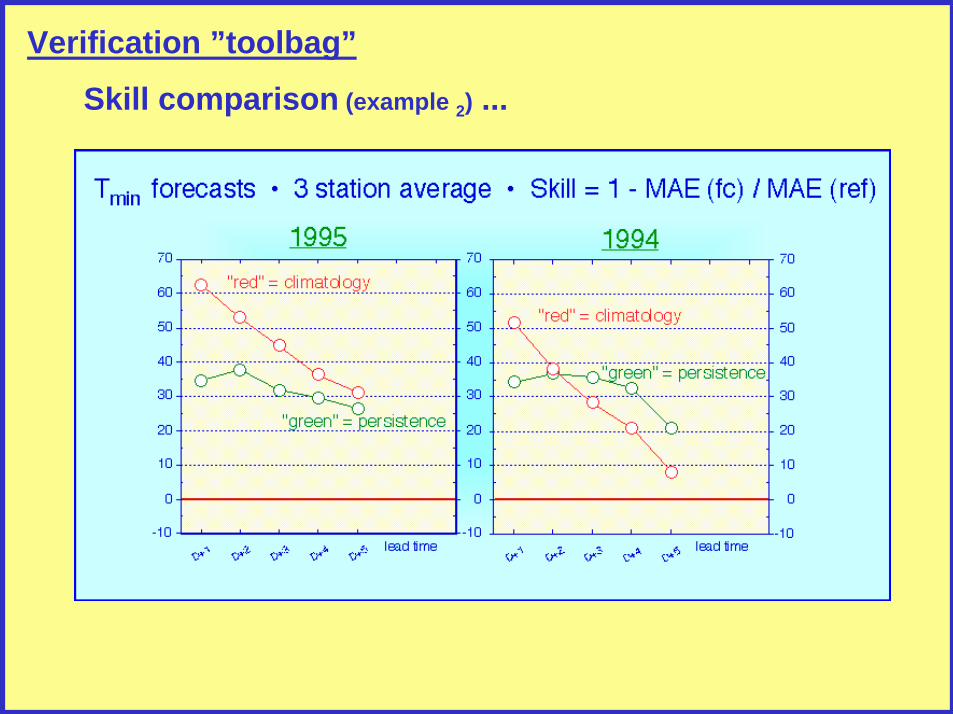
Skill comparison (example 2) ...
Verification ”toolbag”
17.9.2004Design of Operational Verification Systems / [email protected]
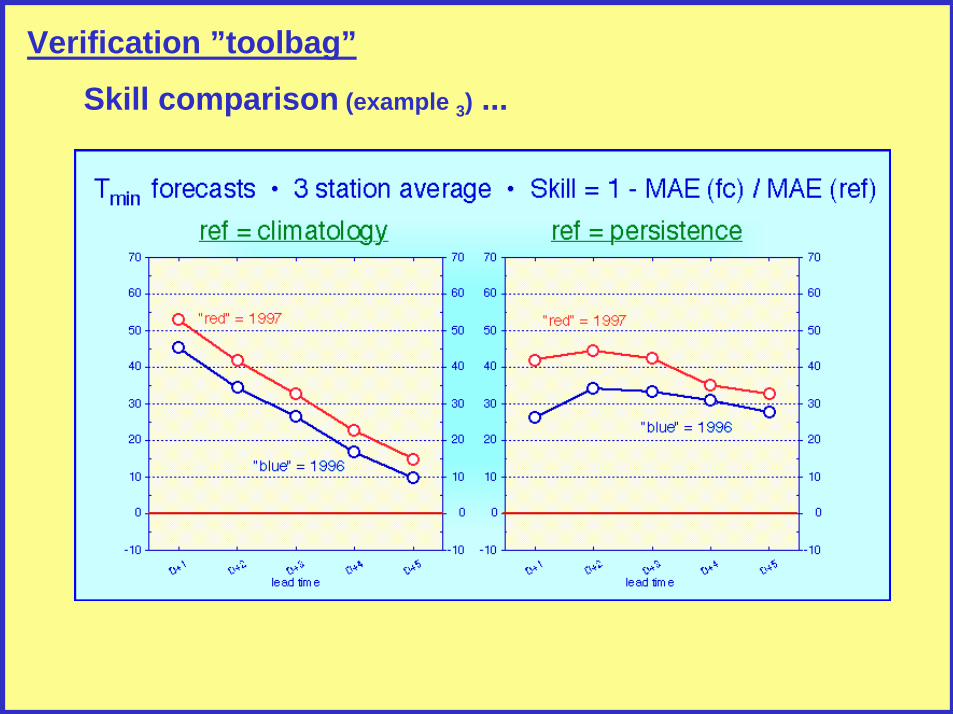
Skill comparison (example 3) ...
Verification ”toolbag”
17.9.2004Design of Operational Verification Systems / [email protected]
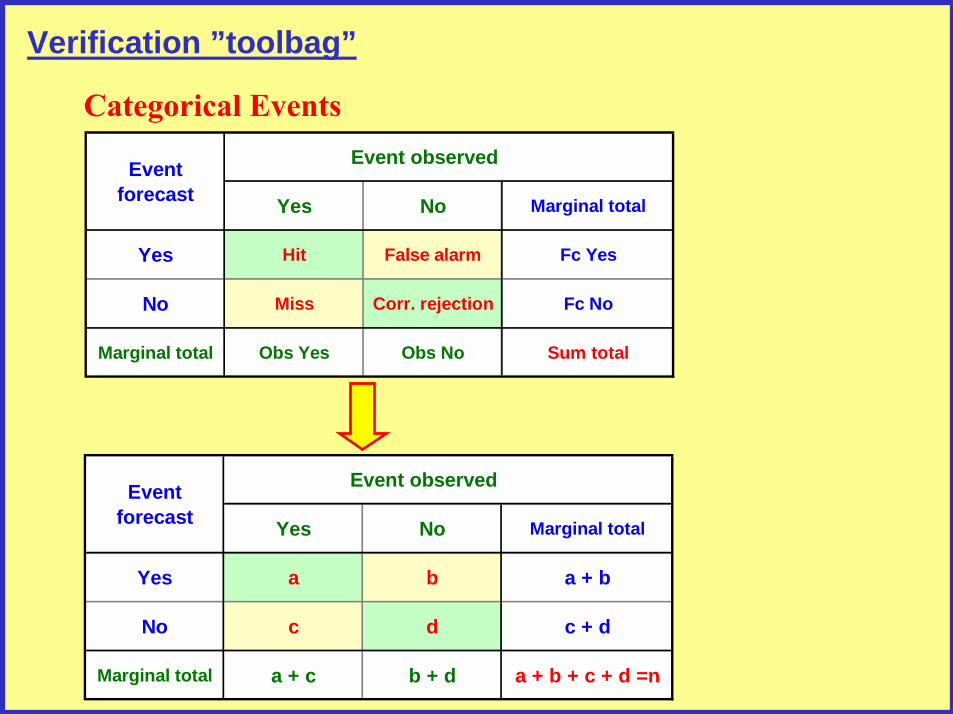
Event Event observed
forecast Yes No Marginal total
Yes Hit False alarm Fc Yes
No Miss Corr. rejection Fc No
Marginal total Obs Yes Obs No Sum total
Event Event observed
forecast Yes No Marginal total
Yes a b a + b
No c d c + d
Marginal total a + c b + d a + b + c + d =n
Categorical Events
Verification ”toolbag”
17.9.2004Design of Operational Verification Systems / [email protected]
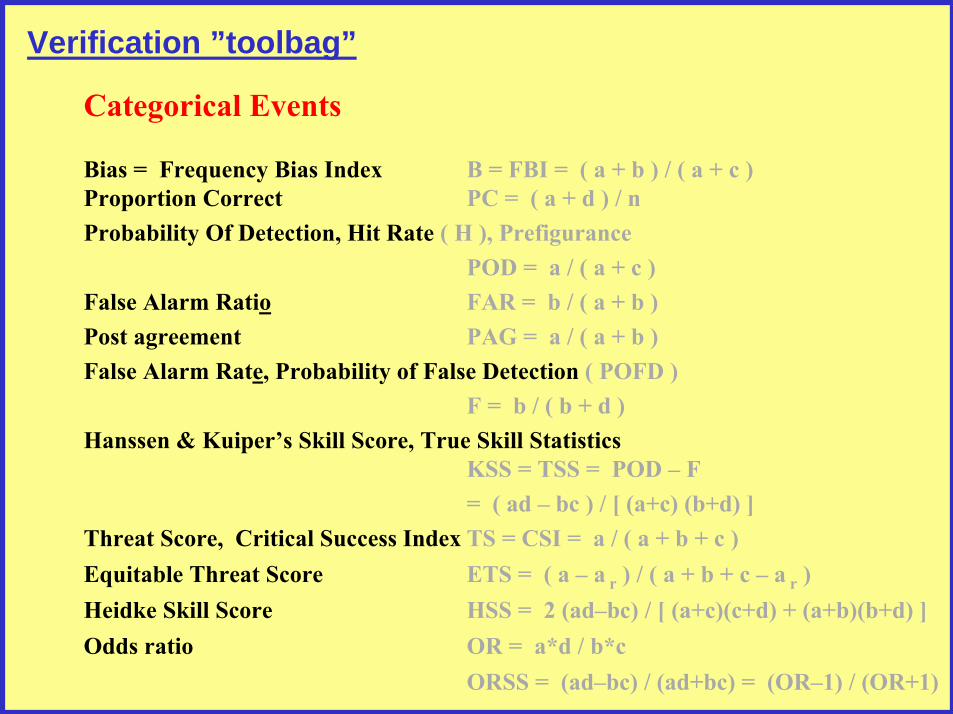
Bias = Frequency Bias Index B = FBI = ( a + b ) / ( a + c )Proportion Correct PC = ( a + d ) / nProbability Of Detection, Hit Rate ( H ), Prefigurance
POD = a / ( a + c )False Alarm Ratio FAR = b / ( a + b )Post agreement PAG = a / ( a + b )False Alarm Rate, Probability of False Detection ( POFD )
F = b / ( b + d )Hanssen & Kuiper�s Skill Score, True Skill Statistics
KSS = TSS = POD � F= ( ad � bc ) / [ (a+c) (b+d) ]
Threat Score, Critical Success Index TS = CSI = a / ( a + b + c )Equitable Threat Score ETS = ( a � a r ) / ( a + b + c � a r )Heidke Skill Score HSS = 2 (ad�bc) / [ (a+c)(c+d) + (a+b)(b+d) ]Odds ratio OR = a*d / b*c
ORSS = (ad�bc) / (ad+bc) = (OR�1) / (OR+1)
Categorical Events
Verification ”toolbag”
17.9.2004Design of Operational Verification Systems / [email protected]
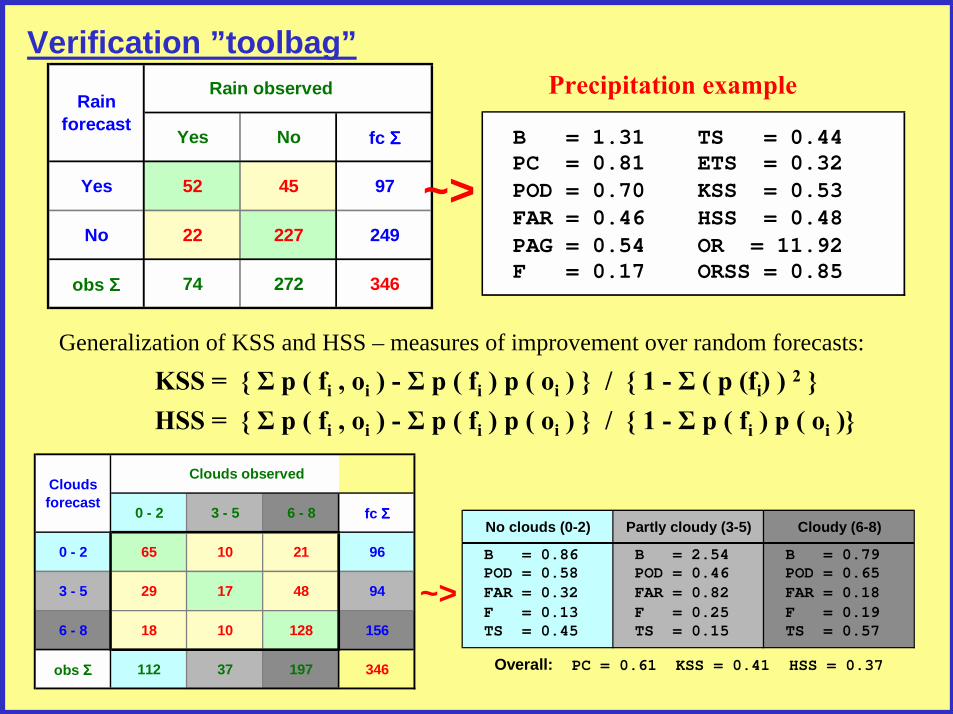
RainRain observed
forecastYes No fc ΣΣΣΣ
Yes 52 45 97
No 22 227 249
obs ΣΣΣΣ 74 272 346
B = 1.31 TS = 0.44 PC = 0.81 ETS = 0.32
~> POD = 0.70 KSS = 0.53 FAR = 0.46 HSS = 0.48 PAG = 0.54 OR = 11.92 F = 0.17 ORSS = 0.85
Precipitation example
No clouds (0-2) Partly cloudy (3-5) Cloudy (6-8)
B = 0.86 B = 2.54 B = 0.79 POD = 0.58 POD = 0.46 POD = 0.65
~> FAR = 0.32 FAR = 0.82 FAR = 0.18 F = 0.13 F = 0.25 F = 0.19 TS = 0.45 TS = 0.15 TS = 0.57
Overall: PC = 0.61 KSS = 0.41 HSS = 0.37
CloudsClouds observed
forecast0 - 2 3 - 5 6 - 8 fc ΣΣΣΣ
0 - 2 65 10 21 96
3 - 5 29 17 48 94
6 - 8 18 10 128 156
obs ΣΣΣΣ 112 37 197 346
Generalization of KSS and HSS – measures of improvement over random forecasts:KSS = { Σ p ( fi , oi ) - Σ p ( fi ) p ( oi ) } / { 1 - Σ ( p (fi) ) 2 }HSS = { Σ p ( fi , oi ) - Σ p ( fi ) p ( oi ) } / { 1 - Σ p ( fi ) p ( oi )}
Verification ”toolbag”
17.9.2004Design of Operational Verification Systems / [email protected]
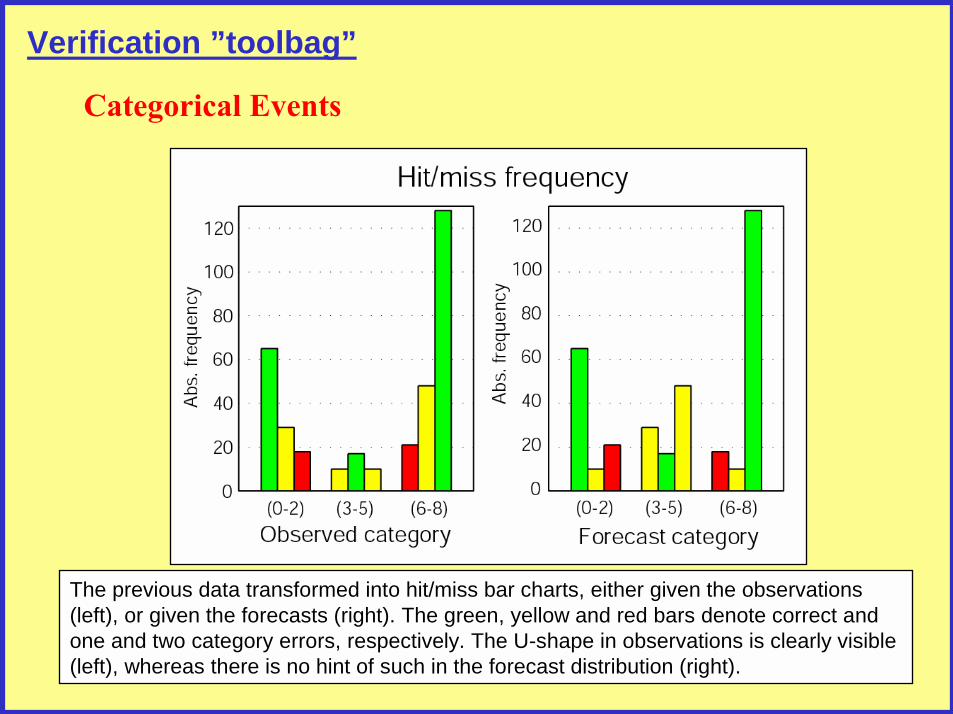
The previous data transformed into hit/miss bar charts, either given the observations (left), or given the forecasts (right). The green, yellow and red bars denote correct and one and two category errors, respectively. The U-shape in observations is clearly visible (left), whereas there is no hint of such in the forecast distribution (right).
Categorical Events
Verification ”toolbag”
17.9.2004Design of Operational Verification Systems / [email protected]
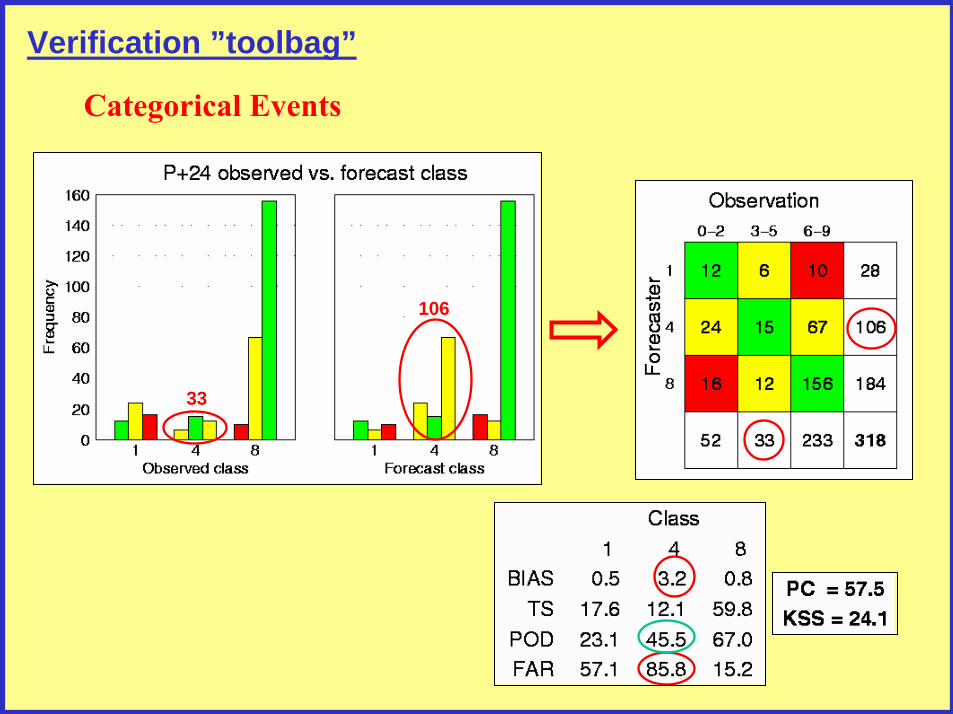
33
106
Categorical Events
Verification ”toolbag”
17.9.2004Design of Operational Verification Systems / [email protected]
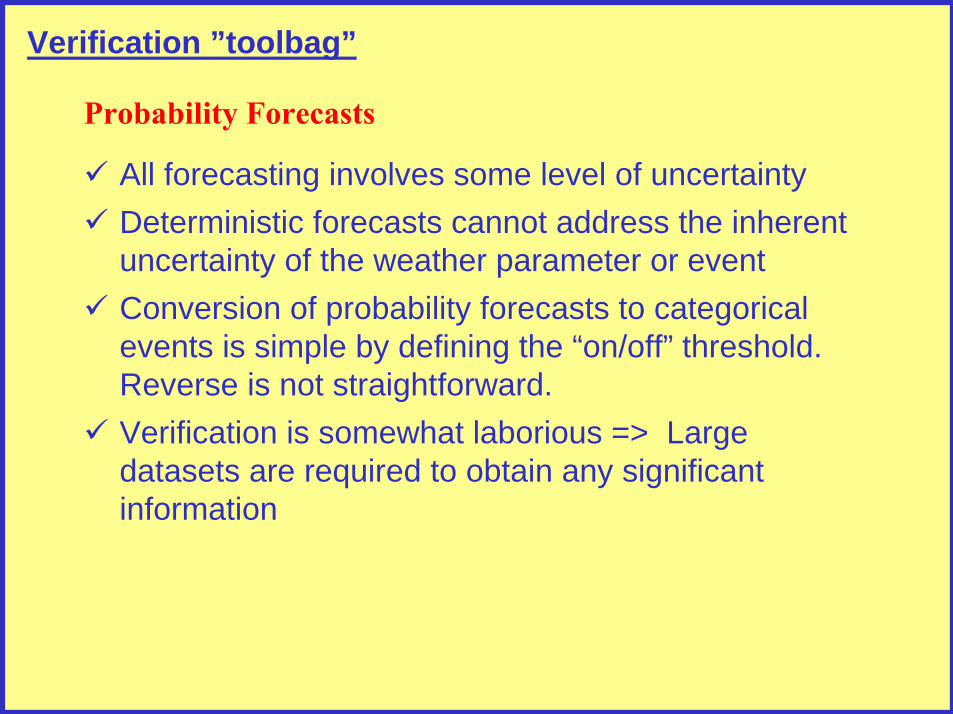
Probability Forecasts
! All forecasting involves some level of uncertainty! Deterministic forecasts cannot address the inherent
uncertainty of the weather parameter or event! Conversion of probability forecasts to categorical
events is simple by defining the “on/off” threshold. Reverse is not straightforward.
! Verification is somewhat laborious => Large datasets are required to obtain any significant information
Verification ”toolbag”
17.9.2004Design of Operational Verification Systems / [email protected]
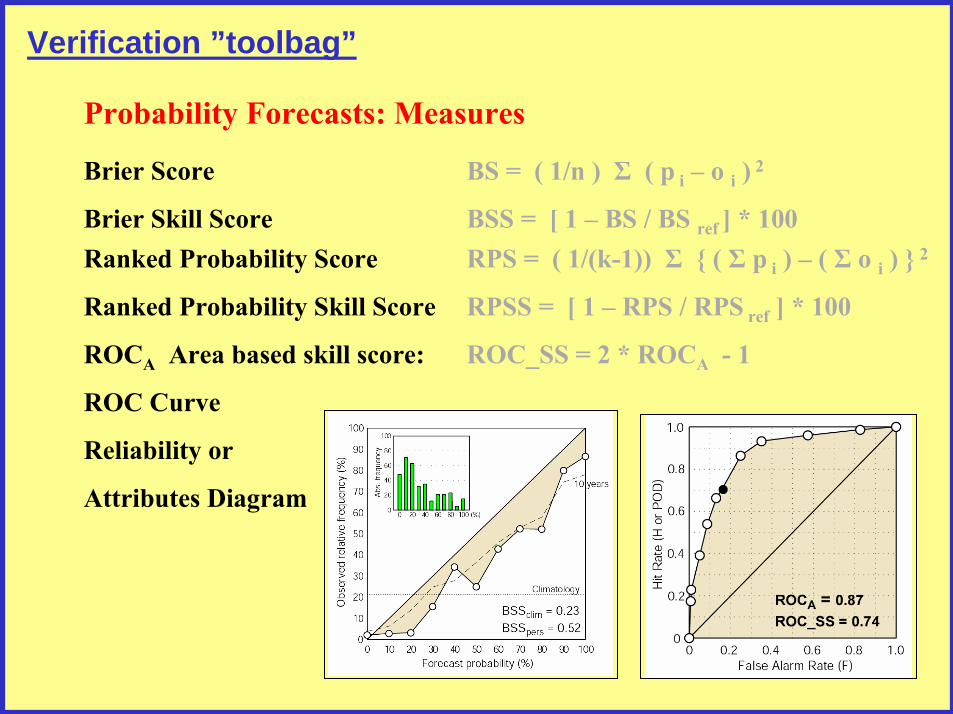
Brier Score BS = ( 1/n ) Σ ( p i � o i ) 2
Brier Skill Score BSS = [ 1 � BS / BS ref ] * 100Ranked Probability Score RPS = ( 1/(k-1)) Σ { ( Σ p i ) � ( Σ o i ) } 2
Ranked Probability Skill Score RPSS = [ 1 � RPS / RPS ref ] * 100
ROCA Area based skill score: ROC_SS = 2 * ROCA - 1
ROC Curve
Reliability or
Attributes Diagram
Probability Forecasts: Measures
Verification ”toolbag”
17.9.2004Design of Operational Verification Systems / [email protected]
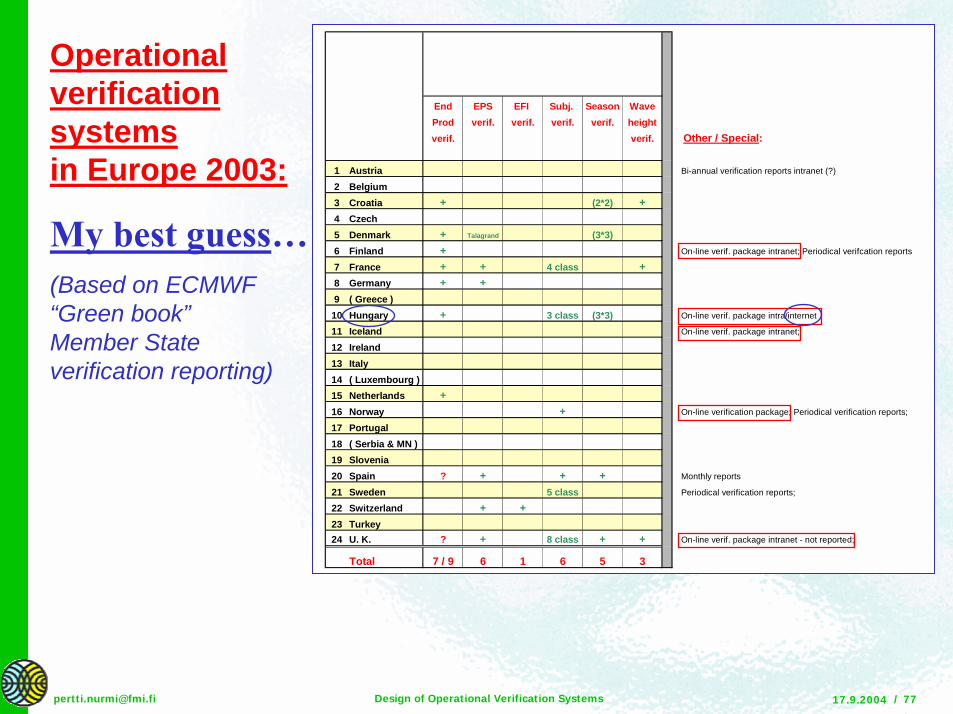
Operationalverificationsystemsin Europe 2003:
My best guess�(Based on ECMWF “Green book” Member State verification reporting)
End EPS EFI Subj. Season WaveProd verif. verif. verif. verif. heightverif. verif. Other / Special:
1 Austria Bi-annual verification reports intranet (?)
2 Belgium3 Croatia + (2*2) +4 Czech5 Denmark + Talagrand (3*3)6 Finland + On-line verif. package intranet; Periodical verifcation reports
7 France + + 4 class +8 Germany + +9 ( Greece )
10 Hungary + 3 class (3*3) On-line verif. package intra/internet
11 Iceland On-line verif. package intranet;
12 Ireland13 Italy14 ( Luxembourg )15 Netherlands +16 Norway + On-line verification package; Periodical verification reports;
17 Portugal18 ( Serbia & MN )19 Slovenia20 Spain ? + + + Monthly reports
21 Sweden 5 class Periodical verification reports;
22 Switzerland + +23 Turkey24 U. K. ? + 8 class + + On-line verif. package intranet - not reported;
Total 7 / 9 6 1 6 5 3
17.9.2004Design of Operational Verification Systems / [email protected]
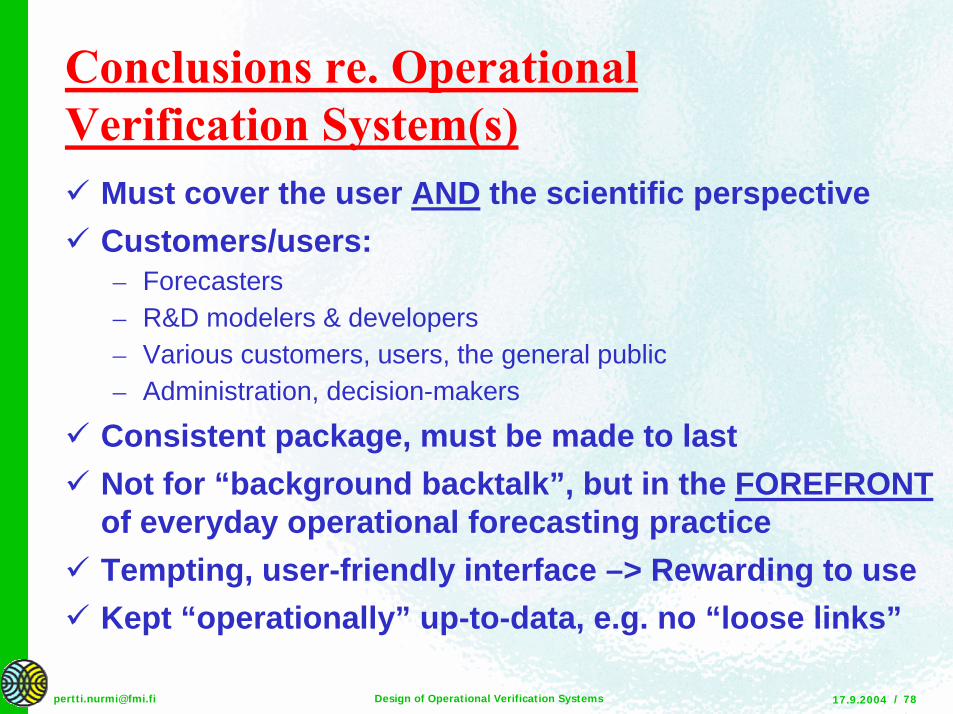
Conclusions re. Operational Verification System(s)! Must cover the user AND the scientific perspective! Customers/users:
– Forecasters– R&D modelers & developers– Various customers, users, the general public– Administration, decision-makers
! Consistent package, must be made to last! Not for “background backtalk”, but in the FOREFRONT
of everyday operational forecasting practice! Tempting, user-friendly interface –> Rewarding to use! Kept “operationally” up-to-data, e.g. no “loose links”

17.9.2004Design of Operational Verification Systems / [email protected]
Thank Youfor bearing with me !!!