Embed Size (px)
Citation preview
Valuation of Auto Ancillaries under NAV Model and MNAV Approach
K. Srinivasa Reddy, MBA Scholar of Company Secretary, Visakhapatnam Chapter,
The Institute of Company Secretaries of India (ICSI), New Delhi. Mobile: +91-9701706854; e-mail: [email protected]
ABSTRACT Growing importance of ‘Business Valuation’ as a specialized area in corporate finance, suggest the methodology to fit for both development of learning & practice for academia and valuers. The intention behind the study is to innovate new business valuation models in upcoming area of mergers and acquisition advisory for auto ancillary. The accounting methodology is divided into two phases; first compute firm value under NAV model, second, modeling forecasting hurdle rate for determination of firm value under MNAV approach and finally these are compared to find which one gives better value to the shareholders. The findings suggest that, MNAV approach results synergetic value than NAV model by considering various imperative factors for valuation of target firms in M&A process. Moreover this is the first of its kind model that undertakes macroeconomic and political risk variables in determining the firm value. I believe that MNAV model shall be of great help to M&A advisory and investment bankers while negotiating deal value/ consideration in acquisition process. Keywords: Mergers, business valuation, NAV model, forecasting, auto ancillaries 1.0. INTRODUCTION Valuation is the crucial aspect and subject cum complex area in emerging research field of corporate finance. Business practitioners, value analysts and academicians expressed their concern on ‘Business value’ that it is a sacrifice value, here one is the looser and other one is the payer (Ray, 2010). Most of the past research studies stated that one is the looser and other one is gainer, since this is not practically or openly possible, may be in some cases, but not in all. Since Indian accounting standards, practices and its regulations is managed by Institute of Chartered Accountants of India (ICAI). There is no specific valuation model in India to value the business of any specific industry like IT, FMCG, Pharma, etc., further observe that advancement in technology, education and human capital in both media and public and this is debatable. There have been queries on ‘valuation practices in India’ is expressed by the community of shareholders, media, consultants, politicians and academicians in the subject of process and methodology adopted in valuation of shares of both public and private companies, which involved in corporate restructuring strategies like amalgamations, M&A, takeovers and demergers, etc. Therefore many countries have issue guidelines in this regards in order to instill objectivity in corporate valuation practices (Ray, 2010). Under the present Indian laws, a short script of valuation report is available to the shareholders for inspection only, not the methods of valuation (Companies Act, 1956). The forces effecting changes in corporate control and the resulting impact on the business community present some of the most interesting and contested debates in the field of finance. M&A are major corporate finance events that, when executed efficiently with proper motives can help managers and realize their ultimate goal of maximizing shareholder wealth. Lannam (1999) business valuations are performed and conventionally categorized into three groups. These are transaction based approach, tax-based approach and litigation based approach. First, the transaction based approach is found in mergers, acquisitions, divestitures, employee stock option plan (ESOPs), buy-sell agreements, leveraged buyouts, fairness & solvency options and debt/equity financing. Second, tax-based valuations occasionally occurred in the case of gift & estate taxes, estate planning, charitable contributions, creation of family limited partnerships (FLPs) and granting of stock options. Finally, litigation-driven valuations are most common in divorce of partnership, bankruptcy, shareholder actions, breach of contract and a variety of break-up transactions. These numerous methods exist to financially value a proposed deal. Depending on the industry, type of company, company growth, structure of deal proposed, private or public status, different valuation techniques or combinations thereof will be used. Doing valuation is a highly subjective exercise as
Srinivasa Reddy , Int.J.Buss.Mgt.Eco.Res., Vol 2(4),2011,258-269
258
much as art & as a science, because the best method of valuation is differs by situation. A true business philosophy in M&A infers, ‘all sellers want an arm and leg for their businesses, all buyers feel the businesses is overpriced’. It depends upon whether a buyer or a seller, sellers’ dominant motivating factor or reason for the sale and from the buyers’ perspective, how long they have been looking to buy a business. Mac Taub (1999), when a buyer is seeking to purchase a business, exclusively the main factors from the buyers’ perspective – type of business, geographic location and price of the business. The business value, enterprise valuation and prevalence are important phenomenon in mergers and acquisitions. Over the past ten years, the peak year for M&A was 2000, in which the value approximated at $3.5 trillion (Thomson Reuters, 2010). Given this and the velocity of globalization of business is an opportunity for financial research in the upcoming of segment of ‘business valuation’. The research on M&A shows that a majority of deals fail to create value for firm owners. This opens the basic question of ‘value to whom?’ the existence of deals themselves may actually create value for the economy by increasing the velocity of spending in economy. The previous research says that deals failure due to value from the perspective of stockholders of a buying a firm. Too often, these firms do destroy value for their stockholders. To address all the above concerns and queries on business valuation, this research study presents an innovative valuation model to value the business of auto ancillaries. The remaining of the study is organized as follows: section 2 describes about trends and case examples in Indian auto ancillary industry, section 3 depicts literature review, section 4 present the methodology, section 5 interpret the results and finally conclusions represent in section 6. 2.0. AUTO ANCILLARY INDUSTRY IN INDIA Economic progress is indicated by the amount of goods and services produced which give the impetus for transportation and boost the sale of vehicles. Increase in automobile production has a catalyst effect by indirectly increasing the demand for a number of raw materials like steel, rubber, plastics, glass, paint, electronics and services. This phenomenon can be compared to the business collaboration in the outsourcing industry. There are two distinct sets of players in the Indian auto industry: Automobile component manufacturers (ACM) and the vehicle manufacturers, which are also referred to as Original Equipment Manufacturers (OEMs). While the ACM set is engaged in manufacturing parts, components, bodies and chassis involved in automobile manufacturing, the OEM is engaged in assembling of all these components into an automobile/vehicle. The industry was de-licensed in 1993, and then no industrial license is required for setting up of any unit for manufacture of automobiles expect in defense and special cases. The policy and regulation for foreign investment, import of technology have progressively liberalized to make this sector to be competitive. Now, 100 percent foreign direct investment (FDI) is permissible under automatic route in almost all segments. Following economic liberalization in India in 1991, the Indian automotive industry has demonstrated sustained growth as a result of increased competitiveness and relaxed restrictions. Several automobile manufacturers such as Tata Motors, Maruti Suzuki and Mahindra and Mahindra, expanded their domestic and international operations to grasp the opportunities in globalization arena. India's robust economic growth led to further expansion of its domestic automobile market which attracted significant investment by multinational automobile manufacturers. In the last decade, automobile industry share in Indian economy is around 5 per cent of GDP and nearly 4 per cent of the total industrial output, the automotive sector has become a significant donor to the exchequer. The industry is manufacturing over 11 million vehicles in a year and employing more than three million people in India. Pingle (2000) reviews the policy framework of India’s automobile industry and its impact on economic growth. While the ties between bureaucrats and the managers of state-owned enterprises played a positive role especially since the late 1980s, ties between politicians and industrialists and between politicians and labour leaders have impeded the growth. McKinsey (2005) predicts the growth potential of India-based automotive component manufacturing at around 500 per cent from 2005 to 2015. The analysis identifies strong engineering skills and an emerging culture of cost-competitiveness as the major strengths of Indian auto component sector, while its weaknesses includes slow growth in domestic demand and structural disadvantages such as power tariffs and indirect taxes.
Srinivasa Reddy , Int.J.Buss.Mgt.Eco.Res., Vol 2(4),2011,258-269
259

The Indian automobile industry is expected to grow $40 billion by 2015 from $ 7 billion in 2008. By 2016, the industry is expected to contribute 10 per cent of the nation’s GDP. The turnover of Indian auto industry is surged at compound annual growth rate 83 per cent from $20896 mn in 2004-05 to $38238 mn in 2008-09. The market share of passenger vehicles 15.86 per cent, commercial vehicles 4.32 per cent, three wheelers 3.58 per cent and two wheelers 76.23 per cent is occupied in the industry. Society of Indian automobile manufacturers (SIAM) is the community body for automobile companies and it represents the industry data in various segments in Table 1 below.
Today India is the largest three wheeler markets, second largest in two wheeler market, fourth largest in tractor market, fifth largest in commercial vehicle market in the world and fourth largest in passenger vehicle market in Asia. This is due to growth of middle class accordance to economic surge over the past few years and has attracted global auto majors to the Indian market. SIAM (2010) forecast the growth rate in various segments in automobile industry for the year 2010-11, passenger cars 12 per cent, utility vehicles 13 per cent, commercial vehicles 19 per cent, two wheelers 10 per cent and three wheelers 7 per cent. In India there are 100 people per vehicle, while 82 in China. The rise in automobile industry has led to robust growth of an auto component sector in the country. The auto ancillary sector is expected to drive the growth of engineering in view of its strong downstream and upstream linkages with many other associates like raw materials, capital goods and process goods, etc. The Indian automotive component manufacturing sector (Auto ancillaries) consists of 500 firms in the organized sector and around 31000 enterprises in the unorganized sector, which contribute more than 85 per cent of India's production. This sector supplies the components to vehicle manufacturers, other component suppliers, state transport undertakings, defence establishments, railways and replacement market. Varieties of components are exported to OEMs abroad and third markets worldwide. According to automotive components manufacturers association (ACMA) the Indian auto ancillary sector sales are estimated at $5.1 billion, where 57 per cent in the replacement segment, 28 per cent to original equipment manufacturers and 15 per cent to the export markets. The global auto component industry is estimated to be $ 1.2 trillion in value and is likely to increase to $ 1.7 trillion by 2015. Investments in this sector would also grow by $ 15 billion from the current level of $ 3.1 billion. The recent trends in this sector is portray in Table 2 below.
Table 1: Indian Automobile Industry, 2000 - 2010 (number of units)
2000-01
2001-02
2002-03
2003-04
2004-05
2005-06
2006-07
2007-08
2008-09
2009-10
Cars 517907 564052 608851 843235 1027858
1112542
1322728
1521813
1516967
1926484
Change (%) -9.83 8.91 7.94 38.50 21.89 8.24 18.89 15.05 -0.32 27.00
Multi Utility Vehicles
125938 105667 114479 146325 182018 196371 222495 246038 219498 272848
Change (%) 1.31 -16.10 8.34 27.82 24.39 7.89 13.30 10.58 -10.79 24.31
LCVs 63869 65756 83195 108917 138896 171781 225724 254049 224587 316437
Change (%) 4.34 2.95 26.52 30.92 27.52 23.68 31.40 12.55 -11.60 40.90
Buses & Trucks 88185 96752 120502 166123 214807 219297 294258 294957 192283 250171
Change (%) -22.69 9.71 24.55 37.86 29.31 2.09 34.18 0.24 -34.81 30.11
Scooters 879759 937506 848434 935279 987498 1020013
943944 1074933
1161276
1494409
Change (%) -30.15 6.56 -9.50 10.24 5.58 3.29 -7.46 13.88 8.03 28.69
Motorcycles 2183430
2906323
3876175
4355168
5193894
6201214
7112281
6503532
6798118
8444852
Change (%) 21.70 33.11 33.37 12.36 19.26 19.39 14.69 -8.56 4.53 24.22
Mopeds 694974 427498 351612 332294 348437 379574 379987 430827 436219 571070
Change (%) -4.08 -38.49 -17.75 -5.49 4.86 8.94 0.11 13.38 1.25 30.91
3-Wheelers 203234 212748 276719 356223 374445 434424 556126 500660 497020 619093
Change (%) -1.12 4.68 30.07 28.73 5.12 16.02 28.01 -9.97 -0.73 24.56
Tractors 248079 207324 166889 191633 249077 296080 352835 345762 339510 433207
Change (%) -3.51 -16.43 -19.50 14.83 29.98 18.87 19.17 -2.00 -1.81 27.60
Source: Society of Indian Automobile Manufacturers (SIAM), India
Srinivasa Reddy , Int.J.Buss.Mgt.Eco.Res., Vol 2(4),2011,258-269
260
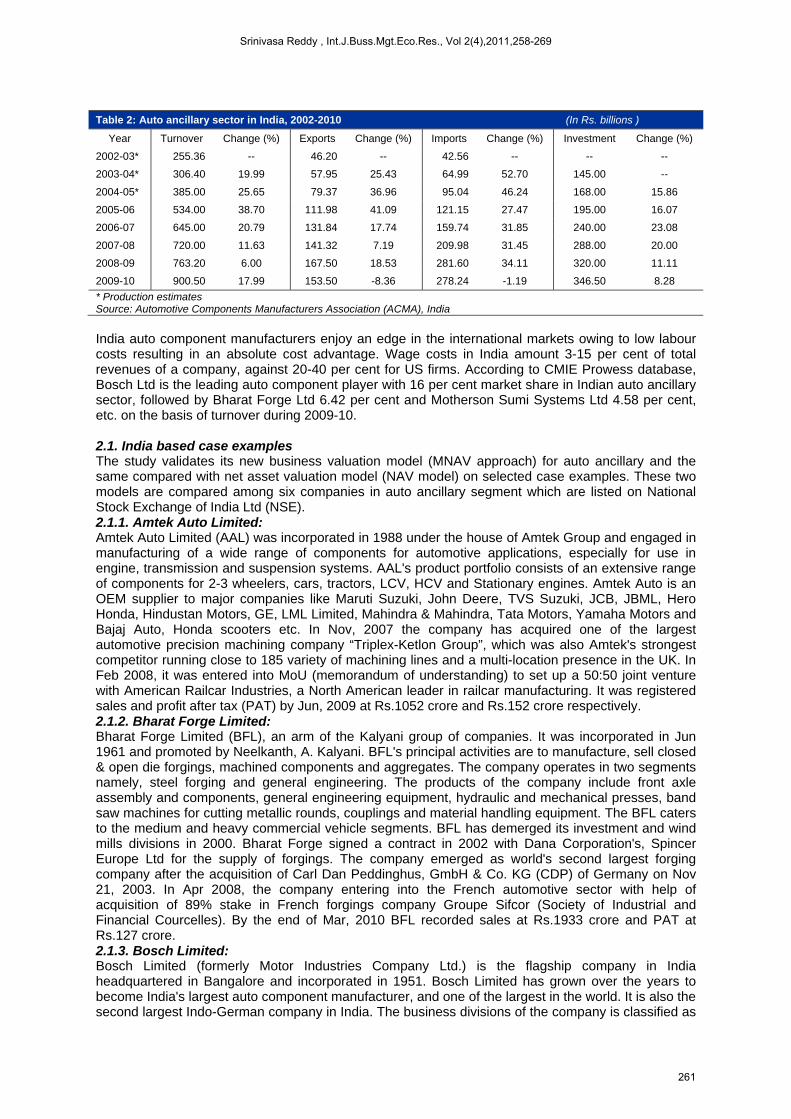
Table 2: Auto ancillary sector in India, 2002-2010 (In Rs. billions )
Year Turnover Change (%) Exports Change (%) Imports Change (%) Investment Change (%)
2002-03* 255.36 -- 46.20 -- 42.56 -- -- --
2003-04* 306.40 19.99 57.95 25.43 64.99 52.70 145.00 --
2004-05* 385.00 25.65 79.37 36.96 95.04 46.24 168.00 15.86
2005-06 534.00 38.70 111.98 41.09 121.15 27.47 195.00 16.07
2006-07 645.00 20.79 131.84 17.74 159.74 31.85 240.00 23.08
2007-08 720.00 11.63 141.32 7.19 209.98 31.45 288.00 20.00
2008-09 763.20 6.00 167.50 18.53 281.60 34.11 320.00 11.11
2009-10 900.50 17.99 153.50 -8.36 278.24 -1.19 346.50 8.28
* Production estimates Source: Automotive Components Manufacturers Association (ACMA), India
India auto component manufacturers enjoy an edge in the international markets owing to low labour costs resulting in an absolute cost advantage. Wage costs in India amount 3-15 per cent of total revenues of a company, against 20-40 per cent for US firms. According to CMIE Prowess database, Bosch Ltd is the leading auto component player with 16 per cent market share in Indian auto ancillary sector, followed by Bharat Forge Ltd 6.42 per cent and Motherson Sumi Systems Ltd 4.58 per cent, etc. on the basis of turnover during 2009-10. 2.1. India based case examples The study validates its new business valuation model (MNAV approach) for auto ancillary and the same compared with net asset valuation model (NAV model) on selected case examples. These two models are compared among six companies in auto ancillary segment which are listed on National Stock Exchange of India Ltd (NSE). 2.1.1. Amtek Auto Limited: Amtek Auto Limited (AAL) was incorporated in 1988 under the house of Amtek Group and engaged in manufacturing of a wide range of components for automotive applications, especially for use in engine, transmission and suspension systems. AAL's product portfolio consists of an extensive range of components for 2-3 wheelers, cars, tractors, LCV, HCV and Stationary engines. Amtek Auto is an OEM supplier to major companies like Maruti Suzuki, John Deere, TVS Suzuki, JCB, JBML, Hero Honda, Hindustan Motors, GE, LML Limited, Mahindra & Mahindra, Tata Motors, Yamaha Motors and Bajaj Auto, Honda scooters etc. In Nov, 2007 the company has acquired one of the largest automotive precision machining company “Triplex-Ketlon Group”, which was also Amtek's strongest competitor running close to 185 variety of machining lines and a multi-location presence in the UK. In Feb 2008, it was entered into MoU (memorandum of understanding) to set up a 50:50 joint venture with American Railcar Industries, a North American leader in railcar manufacturing. It was registered sales and profit after tax (PAT) by Jun, 2009 at Rs.1052 crore and Rs.152 crore respectively. 2.1.2. Bharat Forge Limited: Bharat Forge Limited (BFL), an arm of the Kalyani group of companies. It was incorporated in Jun 1961 and promoted by Neelkanth, A. Kalyani. BFL's principal activities are to manufacture, sell closed & open die forgings, machined components and aggregates. The company operates in two segments namely, steel forging and general engineering. The products of the company include front axle assembly and components, general engineering equipment, hydraulic and mechanical presses, band saw machines for cutting metallic rounds, couplings and material handling equipment. The BFL caters to the medium and heavy commercial vehicle segments. BFL has demerged its investment and wind mills divisions in 2000. Bharat Forge signed a contract in 2002 with Dana Corporation's, Spincer Europe Ltd for the supply of forgings. The company emerged as world's second largest forging company after the acquisition of Carl Dan Peddinghus, GmbH & Co. KG (CDP) of Germany on Nov 21, 2003. In Apr 2008, the company entering into the French automotive sector with help of acquisition of 89% stake in French forgings company Groupe Sifcor (Society of Industrial and Financial Courcelles). By the end of Mar, 2010 BFL recorded sales at Rs.1933 crore and PAT at Rs.127 crore. 2.1.3. Bosch Limited: Bosch Limited (formerly Motor Industries Company Ltd.) is the flagship company in India headquartered in Bangalore and incorporated in 1951. Bosch Limited has grown over the years to become India's largest auto component manufacturer, and one of the largest in the world. It is also the second largest Indo-German company in India. The business divisions of the company is classified as
Srinivasa Reddy , Int.J.Buss.Mgt.Eco.Res., Vol 2(4),2011,258-269
261
diesel systems, gasoline systems, starters and generators, electrical drives, automotive accessories, test equipment, auto electrical, car multimedia, power tools, packaging machines, special purpose machines and security systems. The company's manufacturing sites are located in Bangalore, Nashik, Jaipur and Naganathapura. Bosch security systems (BSS) launched network video solutions and video surveillance system that allows remote monitoring over IP (internet protocol) networks. The company planned to invest Rs.850 crore by 2010, which is other than the expansion of common rail diesel production. The company reported sales Rs.5107 crore and PAT Rs.590 crore for the financial year 2009-10. 2.1.4. Motherson Sumi Systems Ltd: Motherson Sumi Systems Ltd (MSSL) is a world-class supplier of high performance components, modules and systems. It is the largest supplier of EDS to the Indian automotive industry. They offer a range of products in the fields of electrical distribution systems, plastic molding, tooling, metal machining, automotive rear view mirrors and integrated modules. They also provide a range of services from design to manufacturing, supplies to logistics to its customers in India and abroad. The company as a supply partner provides complete solutions to their customers’ right from product design to mass supplies. They have developed a network of manufacturing bases, design centers, logistics centers, marketing support and sourcing hubs across a diversified geographical base. The company has a presence in 20 countries which include India, UAE, Sri Lanka, Singapore, China, Korea, Japan, Germany, UK, Czech Republic, Austria, Hungary, Italy, Spain, France, Ireland, USA, Mexico, Australia & Mauritius to provide timely and quality delivery to their customers worldwide. It was incorporated in 1986 as a joint venture between Samvardhana Motherson Finance Limited (SMFL), Sumitomo Wiring Systems (SWS), Japan and Sojitz Corporation, Japan (formerly Nissho Iwai Corporation). For 2009-10, it reported Rs.1870 crore as sales and Rs.178 crore as PAT. 2.1.5. Sundram Fasteners Ltd: Sundram Fasteners Ltd (SFL), a TVS group company is one of the leading auto component manufacturers in India. SFL was incorporated in 1962 as a private limited under the name Kasjax Engineering Ancillaries Pvt Ltd and the name was changed to Sundram Fasteners Pvt Ltd in 1965. In 1982 the company introduced new products in technical collaboration with Neumeyer, Germany. The company engaged in the manufacture of auto components. Product range includes high-tensile fasteners, powder metal components, cold extruded parts, hot forged components, radiator caps, automotive pumps, gear shifters, gears and couplings, and iron powder. The company's subsidiaries include Upasana Engineering Ltd, Sundaram Fasteners Investment Ltd, Sundram Non-conventional Energy Systems Ltd, Sundram Bleistahi Ltd, etc. The company and their subsidiaries are having eleven manufacturing locations in India and four in abroad. It recorded sales at Rs.1421 crore and PAT at Rs.75 crore by the end of Mar 2010. 2.1.6. WABCO-TVS (INDIA) Limited: Wabco-Tvs (India) Limited is a joint venture between TVS Group and WABCO Holdings Inc, Belgium. It has pioneered the manufacture of air-assisted and air brake systems for commercial vehicles in India. The company has achieved a share of business in the original equipment segment (OEM) more than 85 per cent market share and 75 per cent in the after-market. The research and development centre is full-fledged and state-of-the-art to facilitate design, development, simulation and testing. A team of professional engineers powered with the best production facilities gears up to translate design competence into excellence in manufacturing through concepts such as cellular manufacturing and operation standards. It supplies original equipment fitments for vehicles manufactured by Ashok Leyland, Tata Motors, Vehicle Factory (Jabalpur), Bharat Earth Movers Ltd, Tafe, Volvo, Sutlej, Caterpillar, Eicher Motors, Swaraj Mazda, Force Motors, Mahindra & Mahindra, Tata Cummins (Engines) and a host of other trailer manufacturers. The export network consists of Australia, Malaysia, UK, Singapore, South Asia, North America, Venezuela and the Middle East. By the end of Mar 2010, reported the sales for Rs.657 crore and PAT for Rs.78 crore. 3.0. LITERATURE REVIEW The review of literature for the present study comprises all aspects relating to firm valuation, but could not find related valuation of auto ancillary business in the area of firm valuation in corporate finance. It has structured in sequential way to meet the objective and need of present research study. Most of the academicians and researchers have studied comparison of DCF, DDM and RI methods (Paul Bailey, et al. 2008; Plenborg, 2002), compendium of ten methods (Fernandez, 2007), relationship between diversification and valuation (Lin and Su, 2008), relationship between governance mechanisms & the market valuation (Liu, et al. 2004) and valuation effects on bank mergers (Becher, 2000).
Srinivasa Reddy , Int.J.Buss.Mgt.Eco.Res., Vol 2(4),2011,258-269
262

Valuation can be defined by Baum and Crosby (1988) ‘valuation’ as the estimate or prediction of the most likely selling price, distinguishable from ‘worth’ which is specific to an individual given its subjective estimates of factors relevant to that individual. Becher (2000) examines the valuation effects of a sample of 558 bank mergers from 1980–1997. The overall results indicate that bank mergers create wealth. The results further indicate that mergers in the 1990s, which have not been extensively studied in prior work, have positive effects. In 1990s over the 36-day window: target gain significantly, bidder returns are positive and statistically larger than the mid-1980s, and combined firm returns are significantly positive. Berger and Ofek (1995) estimate the diversification’s effect on firm value by imputing stand-alone values for individual business segments. Comparing the sum of these stand-alone values to the firm’s actual value implies a 13 to 15 per cent average value loss from diversification during 1986-1991. Parker (1999) describes the level of valuation accuracy observed is compared to that noted in the quantitatively analytical literature and found to be supportive at the portfolio level, suggesting that such practical limitations may have relatively little effect on the results. Fernandez (2007) summarizes the compendium of ten methods including: free cash flow; equity cash flow; capital cash flow; adjusted present value; business’s risk adjusted free cash flow and equity cash flow; risk-free rate-adjusted free cash flow and equity cash flow; economic profit; and economic value added. These ten methods always give the same value. Finally it concludes by analysis of ten methods of company valuation using discounted cash flows and nine different theories about the VTS. Frankel and Lee (1998) study examines the usefulness of an analyst-based valuation model in predicting cross-sectional stock returns. They estimate fundamental values (V) and a residual income model of business value. They found that ‘V’ is highly correlated with contemporaneous stock price, and that the B/P ratio is a good predictor of long-term cross-sectional returns. Levin and Olsson (2000) demonstrate that if the steady state condition is not reached when the terminal value is calculated, the RI approach yields more accurate firm value estimates than the DCF approach. Liu, et al. (2004) investigates empirically the relationship between governance mechanisms and the market valuation of publicly listed firms in China. They construct measures of corporate governance and market valuation for all publicly listed firms on the two stock markets in China. The results support that both high concentration of non-controlling shareholding and issuing shares to foreign investors have positive effects on market valuation. Lin and Su (2008) investigate the relationship between industrial diversification and firm valuation in a sample of 816 publicly listed firms in China. The study found that when decision to diversify is modeled as an endogenous choice based on firm characteristics and multi-segment firms have significantly higher Tobin's q than single-segment firms. Even after controlling for factors such as ownership structure, ownership concentration, and growth opportunities. Matthew, et al. (2005) uses regression techniques to decompose the M/B ratio into components that track misvaluation at the firm and sector levels and a component that tracks long-run growth opportunities. This decomposition allows us to test theories arguing mis-valuation drives merger activity. Cash targets are undervalued relative to stock targets. Cash acquirers are less overvalued than stock acquirers. Misund et al. (2008) suggest that contemporaneous earnings are more useful than current operating cash flow in predicting future cash flows and more relevant for company valuation. Using the oil and gas industry as a case, examines how the oil industry upheaval in the late 1990s influenced the value relevance of financial statement information. They found that the value relevance of cash flows actually decreased in the recent oil industry upheaval. Bailey, et al. (2008) it is based on a sample of listed Australian firms, indicates that the residual income model (RIM) provides better estimates of firm value than two other commonly used models. It also provides that there is less need to forecast returns as far into the future and, with this model, a terminal value based upon a constant future return (or relatively low growth rates) can be used. Plenborg (2002) compares the discounted cash flow approach (DCF) and residual income model (RIM). The two valuation approaches are compared on the basis of analytical attractiveness. The residual income approach yields more accurate firm value estimates, while in others the DCF approach yields more accurate estimates. Rad and Beek (1999) examines cross-border mergers in the European banking sector in terms of their effect on their shareholders’ wealth. The results suggest that returns to bidding bank shareholders are more positive when the bidder is larger and more
Srinivasa Reddy , Int.J.Buss.Mgt.Eco.Res., Vol 2(4),2011,258-269
263
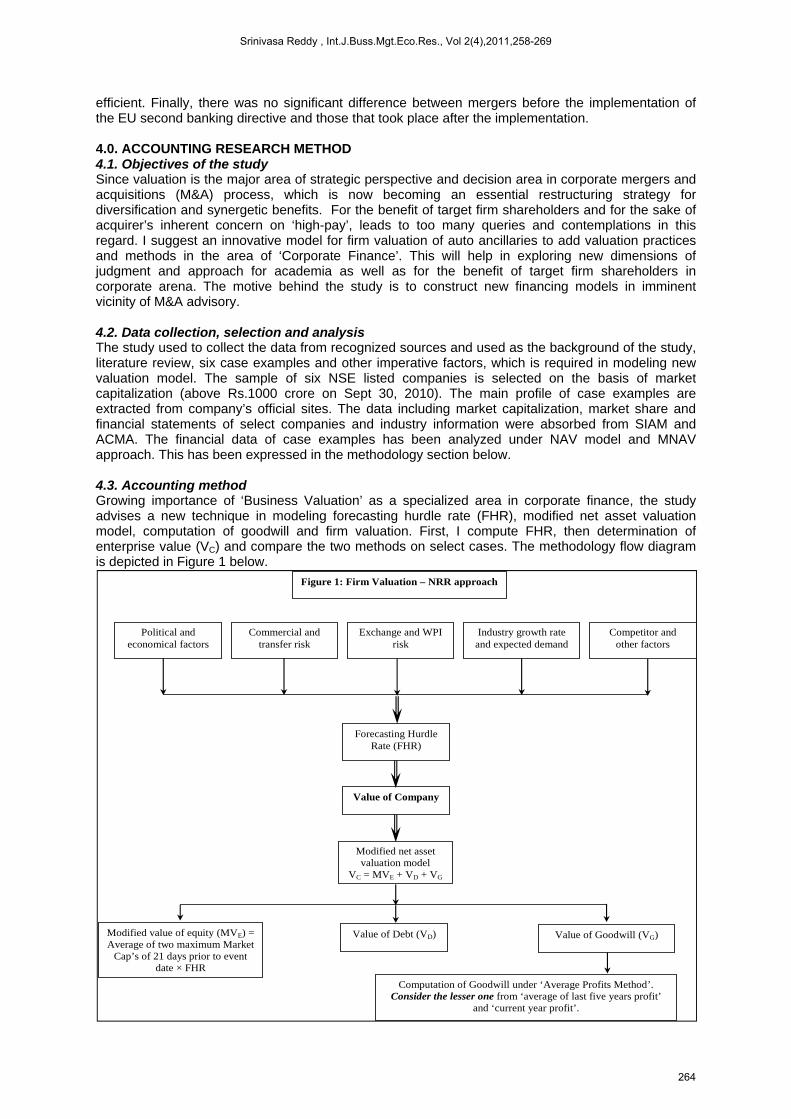
efficient. Finally, there was no significant difference between mergers before the implementation of the EU second banking directive and those that took place after the implementation. 4.0. ACCOUNTING RESEARCH METHOD 4.1. Objectives of the study Since valuation is the major area of strategic perspective and decision area in corporate mergers and acquisitions (M&A) process, which is now becoming an essential restructuring strategy for diversification and synergetic benefits. For the benefit of target firm shareholders and for the sake of acquirer’s inherent concern on ‘high-pay’, leads to too many queries and contemplations in this regard. I suggest an innovative model for firm valuation of auto ancillaries to add valuation practices and methods in the area of ‘Corporate Finance’. This will help in exploring new dimensions of judgment and approach for academia as well as for the benefit of target firm shareholders in corporate arena. The motive behind the study is to construct new financing models in imminent vicinity of M&A advisory. 4.2. Data collection, selection and analysis The study used to collect the data from recognized sources and used as the background of the study, literature review, six case examples and other imperative factors, which is required in modeling new valuation model. The sample of six NSE listed companies is selected on the basis of market capitalization (above Rs.1000 crore on Sept 30, 2010). The main profile of case examples are extracted from company’s official sites. The data including market capitalization, market share and financial statements of select companies and industry information were absorbed from SIAM and ACMA. The financial data of case examples has been analyzed under NAV model and MNAV approach. This has been expressed in the methodology section below. 4.3. Accounting method Growing importance of ‘Business Valuation’ as a specialized area in corporate finance, the study advises a new technique in modeling forecasting hurdle rate (FHR), modified net asset valuation model, computation of goodwill and firm valuation. First, I compute FHR, then determination of enterprise value (VC) and compare the two methods on select cases. The methodology flow diagram is depicted in Figure 1 below.
Political and economical factors
Commercial and transfer risk
Exchange and WPI risk
Industry growth rate and expected demand
Competitor and other factors
Forecasting Hurdle Rate (FHR)
Figure 1: Firm Valuation – NRR approach
Modified net asset valuation model
VC = MVE + VD + VG
Value of Company
Value of Debt (VD) Modified value of equity (MVE) = Average of two maximum Market
Cap’s of 21 days prior to event date × FHR
Computation of Goodwill under ‘Average Profits Method’. Consider the lesser one from ‘average of last five years profit’
and ‘current year profit’.
Value of Goodwill (VG)
Srinivasa Reddy , Int.J.Buss.Mgt.Eco.Res., Vol 2(4),2011,258-269
264

4.3.1. Forecasting hurdle rate (FHR) Forecasting is the process of estimation in unknown situations from the historical data for the purpose of future decision making (Damodaran, 1996). There are various models in the context of economics and finance. The study suggests a model “forecasting hurdle rate” by using various economic, political, industry, financial and production factors. This FHR is the premium rate in computation of value of equity. In addition it can be used in the process of estimating sales growth rate for computation of future free cash flows (FFCF), which generally apply in discounted cash flow (DCF) method under income based business valuation. Forecasting Hurdle Rate (FHR) = 1 DNSGR + [MS × GRPCS] + [MS × GRCVS] + [MS × GRTTWS] − [PCMS × GRPCS] − [PCMS × GRCVS] − [PCMS × GRTTWS]log WPI. GR + log Cm. R + log EX. R + log PRST + log TR × 100
(1) Where, DNSGR is domestic net sales growth rate, MS is market share of select case, GRPCS is growth rate in passenger car sales, GRCVS is growth rate in commercial vehicle sales, GRTTWS is growth rate in two and three wheeler sales, PCMS is prime competitor market share, WPI.GR is whole sale price index of motor & motor parts (growth rate against five preceding years), Cm.R is commercial risk, EX.R is exchange risk (Rupee vs. US$), PRST is political risk for special transactions, TR is transfer risk and log is logarithm. 4.3.2. Net asset valuation model (NAVM) Primarily this method fall under asset based valuation approach. Most of the valuation practitioners applied this common method in asset, capital and product based industries. Here, the study computed total value of the company or business by using ‘net asset valuation model (NAVM)’. This model largely used to compute the total value of company in terms of equity and debt.
VC = VE + VD (2) Where, VC = total value of the company VE = value of equity VD = value of debt
4.3.3. Modified net asset valuation model (MNAV) This new model (MNAV approach) is suggestible to compute the total value of company in terms of modified equity, debt and goodwill. There is a need to modify the NAVM, because changes and opportunities occurred in present business scenario, in addition to protect the interest of minority shareholders. I believe this is the most vibrant method in evaluating business value of auto ancillary as a part of M&A negotiations.
VC = MVE + VD + VG (3) Where, VC = total value of the company MVE = modified value of equity VD = value of debt VG = value of goodwill
4.3.4. Computation of Goodwill For justification and address this auto ancillary experience, the study modified average profits method (Maheswari and Maheswari, 2004), while computing goodwill of an organization either in partnership business or joint stock company. The study considers different risks connected with business cycles, economic & financial melt-down and sub-prime mortgage crisis to associate in goodwill valuation. The consideration of goodwill is equal to ‘average value of last five years profits or current year profit, whichever is lower. This has been modelled with the help of conservative approach in accounting principles. 5.0. RESULTS AND INTERPRETATION The study divided accounting results and inference in three sections. First, Table 3 presents the shareholding pattern of six select cases in auto ancillary sector, second financial analysis by using various ratios and finally discussion respect to comparison of select valuation models. The shareholding pattern includes promoter group (Indian and foreign), institutional and non-institutional holdings in each case example.
Srinivasa Reddy , Int.J.Buss.Mgt.Eco.Res., Vol 2(4),2011,258-269
265
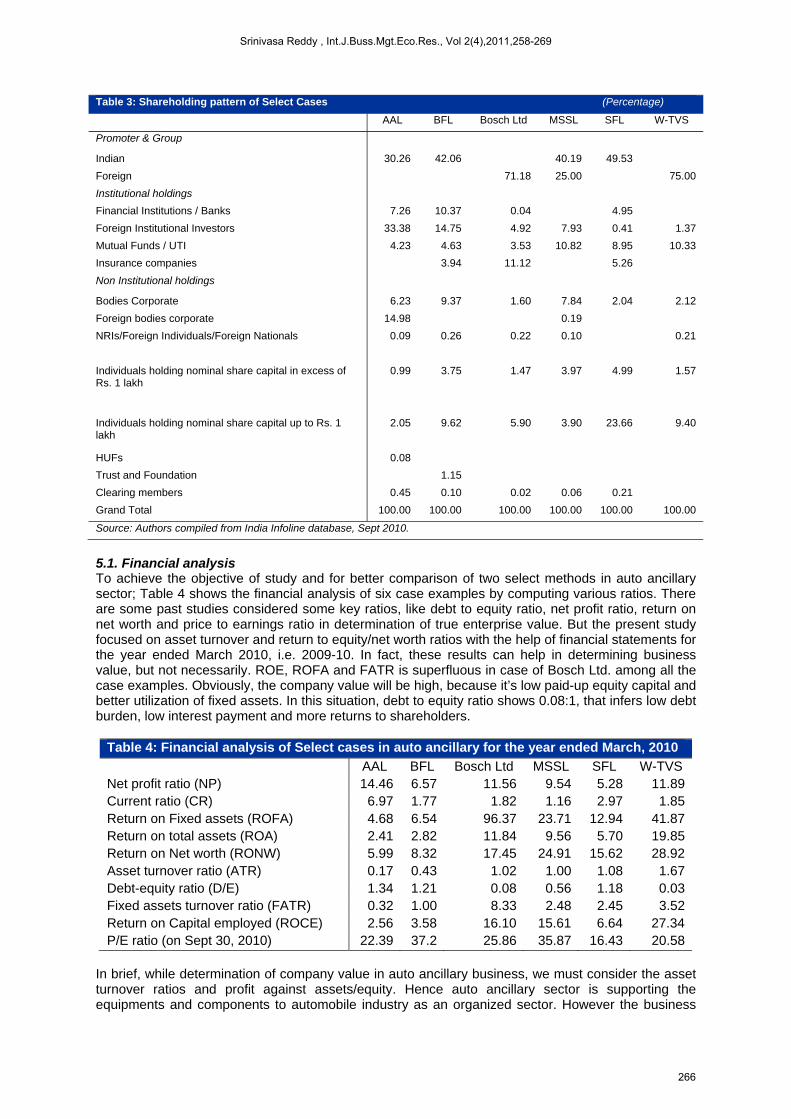
Table 3: Shareholding pattern of Select Cases (Percentage)
AAL BFL Bosch Ltd MSSL SFL W-TVS
Promoter & Group
Indian 30.26 42.06 40.19 49.53
Foreign 71.18 25.00 75.00
Institutional holdings
Financial Institutions / Banks 7.26 10.37 0.04 4.95
Foreign Institutional Investors 33.38 14.75 4.92 7.93 0.41 1.37
Mutual Funds / UTI 4.23 4.63 3.53 10.82 8.95 10.33
Insurance companies 3.94 11.12 5.26
Non Institutional holdings
Bodies Corporate 6.23 9.37 1.60 7.84 2.04 2.12
Foreign bodies corporate 14.98 0.19
NRIs/Foreign Individuals/Foreign Nationals 0.09 0.26 0.22 0.10 0.21
Individuals holding nominal share capital in excess of Rs. 1 lakh
0.99 3.75 1.47 3.97 4.99 1.57
Individuals holding nominal share capital up to Rs. 1 lakh
2.05 9.62 5.90 3.90 23.66 9.40
HUFs 0.08
Trust and Foundation 1.15
Clearing members 0.45 0.10 0.02 0.06 0.21
Grand Total 100.00 100.00 100.00 100.00 100.00 100.00
Source: Authors compiled from India Infoline database, Sept 2010.
5.1. Financial analysis To achieve the objective of study and for better comparison of two select methods in auto ancillary sector; Table 4 shows the financial analysis of six case examples by computing various ratios. There are some past studies considered some key ratios, like debt to equity ratio, net profit ratio, return on net worth and price to earnings ratio in determination of true enterprise value. But the present study focused on asset turnover and return to equity/net worth ratios with the help of financial statements for the year ended March 2010, i.e. 2009-10. In fact, these results can help in determining business value, but not necessarily. ROE, ROFA and FATR is superfluous in case of Bosch Ltd. among all the case examples. Obviously, the company value will be high, because it’s low paid-up equity capital and better utilization of fixed assets. In this situation, debt to equity ratio shows 0.08:1, that infers low debt burden, low interest payment and more returns to shareholders.
Table 4: Financial analysis of Select cases in auto ancillary for the year ended March, 2010
AAL BFL Bosch Ltd MSSL SFL W-TVS Net profit ratio (NP) 14.46 6.57 11.56 9.54 5.28 11.89Current ratio (CR) 6.97 1.77 1.82 1.16 2.97 1.85Return on Fixed assets (ROFA) 4.68 6.54 96.37 23.71 12.94 41.87Return on total assets (ROA) 2.41 2.82 11.84 9.56 5.70 19.85Return on Net worth (RONW) 5.99 8.32 17.45 24.91 15.62 28.92Asset turnover ratio (ATR) 0.17 0.43 1.02 1.00 1.08 1.67Debt-equity ratio (D/E) 1.34 1.21 0.08 0.56 1.18 0.03Fixed assets turnover ratio (FATR) 0.32 1.00 8.33 2.48 2.45 3.52Return on Capital employed (ROCE) 2.56 3.58 16.10 15.61 6.64 27.34P/E ratio (on Sept 30, 2010) 22.39 37.2 25.86 35.87 16.43 20.58
In brief, while determination of company value in auto ancillary business, we must consider the asset turnover ratios and profit against assets/equity. Hence auto ancillary sector is supporting the equipments and components to automobile industry as an organized sector. However the business
Srinivasa Reddy , Int.J.Buss.Mgt.Eco.Res., Vol 2(4),2011,258-269
266
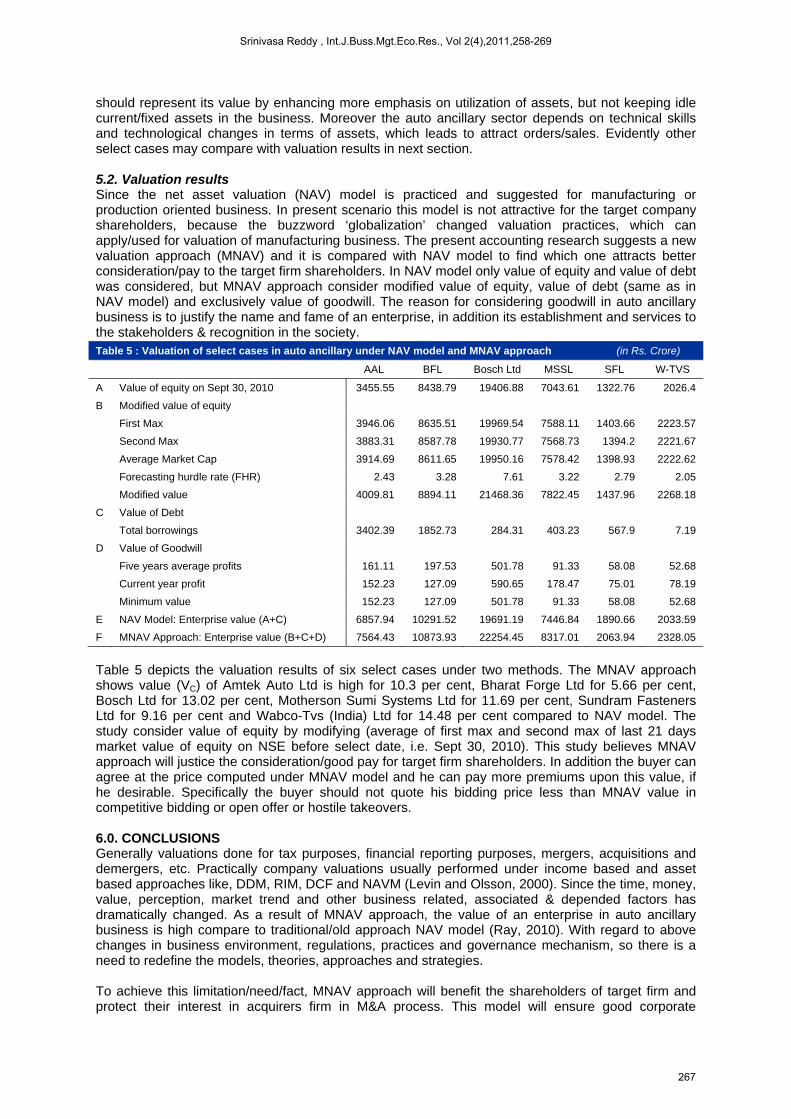
should represent its value by enhancing more emphasis on utilization of assets, but not keeping idle current/fixed assets in the business. Moreover the auto ancillary sector depends on technical skills and technological changes in terms of assets, which leads to attract orders/sales. Evidently other select cases may compare with valuation results in next section. 5.2. Valuation results Since the net asset valuation (NAV) model is practiced and suggested for manufacturing or production oriented business. In present scenario this model is not attractive for the target company shareholders, because the buzzword ‘globalization’ changed valuation practices, which can apply/used for valuation of manufacturing business. The present accounting research suggests a new valuation approach (MNAV) and it is compared with NAV model to find which one attracts better consideration/pay to the target firm shareholders. In NAV model only value of equity and value of debt was considered, but MNAV approach consider modified value of equity, value of debt (same as in NAV model) and exclusively value of goodwill. The reason for considering goodwill in auto ancillary business is to justify the name and fame of an enterprise, in addition its establishment and services to the stakeholders & recognition in the society.
Table 5 depicts the valuation results of six select cases under two methods. The MNAV approach shows value (VC) of Amtek Auto Ltd is high for 10.3 per cent, Bharat Forge Ltd for 5.66 per cent, Bosch Ltd for 13.02 per cent, Motherson Sumi Systems Ltd for 11.69 per cent, Sundram Fasteners Ltd for 9.16 per cent and Wabco-Tvs (India) Ltd for 14.48 per cent compared to NAV model. The study consider value of equity by modifying (average of first max and second max of last 21 days market value of equity on NSE before select date, i.e. Sept 30, 2010). This study believes MNAV approach will justice the consideration/good pay for target firm shareholders. In addition the buyer can agree at the price computed under MNAV model and he can pay more premiums upon this value, if he desirable. Specifically the buyer should not quote his bidding price less than MNAV value in competitive bidding or open offer or hostile takeovers. 6.0. CONCLUSIONS Generally valuations done for tax purposes, financial reporting purposes, mergers, acquisitions and demergers, etc. Practically company valuations usually performed under income based and asset based approaches like, DDM, RIM, DCF and NAVM (Levin and Olsson, 2000). Since the time, money, value, perception, market trend and other business related, associated & depended factors has dramatically changed. As a result of MNAV approach, the value of an enterprise in auto ancillary business is high compare to traditional/old approach NAV model (Ray, 2010). With regard to above changes in business environment, regulations, practices and governance mechanism, so there is a need to redefine the models, theories, approaches and strategies. To achieve this limitation/need/fact, MNAV approach will benefit the shareholders of target firm and protect their interest in acquirers firm in M&A process. This model will ensure good corporate
Table 5 : Valuation of select cases in auto ancillary under NAV model and MNAV approach (in Rs. Crore)
AAL BFL Bosch Ltd MSSL SFL W-TVS
A Value of equity on Sept 30, 2010 3455.55 8438.79 19406.88 7043.61 1322.76 2026.4
B Modified value of equity
First Max 3946.06 8635.51 19969.54 7588.11 1403.66 2223.57
Second Max 3883.31 8587.78 19930.77 7568.73 1394.2 2221.67
Average Market Cap 3914.69 8611.65 19950.16 7578.42 1398.93 2222.62
Forecasting hurdle rate (FHR) 2.43 3.28 7.61 3.22 2.79 2.05
Modified value 4009.81 8894.11 21468.36 7822.45 1437.96 2268.18
C Value of Debt
Total borrowings 3402.39 1852.73 284.31 403.23 567.9 7.19
D Value of Goodwill
Five years average profits 161.11 197.53 501.78 91.33 58.08 52.68
Current year profit 152.23 127.09 590.65 178.47 75.01 78.19
Minimum value 152.23 127.09 501.78 91.33 58.08 52.68
E NAV Model: Enterprise value (A+C) 6857.94 10291.52 19691.19 7446.84 1890.66 2033.59
F MNAV Approach: Enterprise value (B+C+D) 7564.43 10873.93 22254.45 8317.01 2063.94 2328.05
Srinivasa Reddy , Int.J.Buss.Mgt.Eco.Res., Vol 2(4),2011,258-269
267
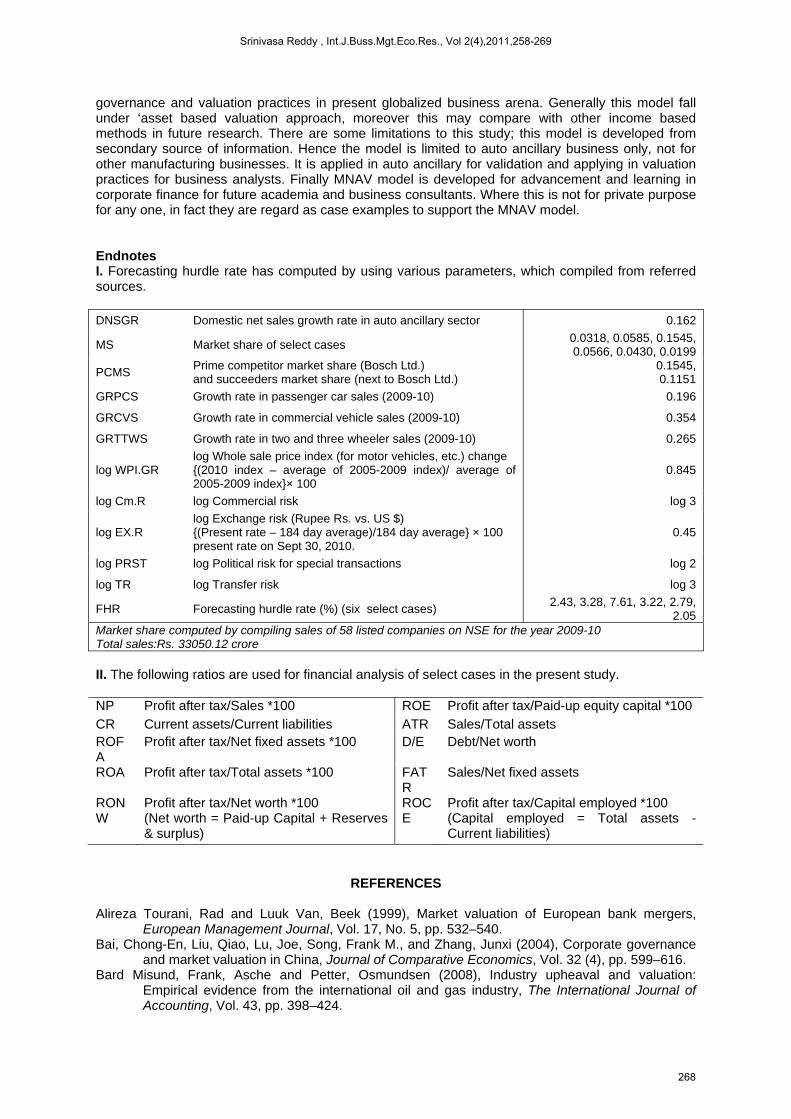
governance and valuation practices in present globalized business arena. Generally this model fall under ‘asset based valuation approach, moreover this may compare with other income based methods in future research. There are some limitations to this study; this model is developed from secondary source of information. Hence the model is limited to auto ancillary business only, not for other manufacturing businesses. It is applied in auto ancillary for validation and applying in valuation practices for business analysts. Finally MNAV model is developed for advancement and learning in corporate finance for future academia and business consultants. Where this is not for private purpose for any one, in fact they are regard as case examples to support the MNAV model. Endnotes I. Forecasting hurdle rate has computed by using various parameters, which compiled from referred sources. DNSGR Domestic net sales growth rate in auto ancillary sector 0.162
MS Market share of select cases 0.0318, 0.0585, 0.1545, 0.0566, 0.0430, 0.0199
PCMS Prime competitor market share (Bosch Ltd.) and succeeders market share (next to Bosch Ltd.)
0.1545, 0.1151
GRPCS Growth rate in passenger car sales (2009-10) 0.196
GRCVS Growth rate in commercial vehicle sales (2009-10) 0.354
GRTTWS Growth rate in two and three wheeler sales (2009-10) 0.265
log WPI.GR log Whole sale price index (for motor vehicles, etc.) change {(2010 index – average of 2005-2009 index)/ average of 2005-2009 index}× 100
0.845
log Cm.R log Commercial risk log 3
log EX.R log Exchange risk (Rupee Rs. vs. US $) {(Present rate – 184 day average)/184 day average} × 100 present rate on Sept 30, 2010.
0.45
log PRST log Political risk for special transactions log 2
log TR log Transfer risk log 3
FHR Forecasting hurdle rate (%) (six select cases) 2.43, 3.28, 7.61, 3.22, 2.79,
2.05 Market share computed by compiling sales of 58 listed companies on NSE for the year 2009-10 Total sales:Rs. 33050.12 crore II. The following ratios are used for financial analysis of select cases in the present study. NP Profit after tax/Sales *100 ROE Profit after tax/Paid-up equity capital *100 CR Current assets/Current liabilities ATR Sales/Total assets ROFA
Profit after tax/Net fixed assets *100 D/E Debt/Net worth
ROA Profit after tax/Total assets *100 FATR
Sales/Net fixed assets
RONW
Profit after tax/Net worth *100 (Net worth = Paid-up Capital + Reserves & surplus)
ROCE
Profit after tax/Capital employed *100 (Capital employed = Total assets - Current liabilities)
REFERENCES Alireza Tourani, Rad and Luuk Van, Beek (1999), Market valuation of European bank mergers,
European Management Journal, Vol. 17, No. 5, pp. 532–540. Bai, Chong-En, Liu, Qiao, Lu, Joe, Song, Frank M., and Zhang, Junxi (2004), Corporate governance
and market valuation in China, Journal of Comparative Economics, Vol. 32 (4), pp. 599–616. Bard Misund, Frank, Asche and Petter, Osmundsen (2008), Industry upheaval and valuation:
Empirical evidence from the international oil and gas industry, The International Journal of Accounting, Vol. 43, pp. 398–424.
Srinivasa Reddy , Int.J.Buss.Mgt.Eco.Res., Vol 2(4),2011,258-269
268
Chen Lin, and Dongwei, Su (2008), Industrial diversification, partial privatization and firm valuation: Evidence from publicly listed firms in China, Journal of Corporate Finance, Vol. 14, pp. 405–417.
David A., Becher (2000), The valuation effects of bank mergers, Journal of Corporate Finance, Vol. 6, pp. 189–214.
David, Parker (1999), A note on valuation accuracy: an Australian case study, Journal of Property Investment & Finance, Vol. 17, No. 4, pp. 401-411.
Industry data, (2010), Auto components, June, available at: www.ibef.org, last accessed on Oct 15, 2010.
Kamal Ghosh, Ray (2010), Mergers and Acquisitions – Strategy, Valuation and Integration, PHI Learning Private Ltd. New Delhi.
Kefford Bryan, (2003), Handbook of Financial Modeling for business decision, Crest Publishing house, New Delhi.
Kevin, K., Boeh and Paul, W., Beamish (2009), Mergers and Acquisitions – Text & Case, South Asia Edition, Sage Publicaios, New Delhi.
Krishnamurthy, Chandrasekhar and Viswanath, S. R., (2009), Advanced Corporate Finance, PHI Learning Private Ltd, New Delhi.
Levin, J., and Olsson, P. (2000). Terminal value techniques in equity valuation-implications of the steady state assumption, Research Report, Stockholm School of Economics, The Economic Research Institute.
Matthew, Rhodes–Kropf, David T., Robinson, and S., Viswanathan (2005), Valuation waves and merger activity: The empirical evidence, Journal of Financial Economics, Vol. 77, pp. 561–603.
McKinsey (2005). Vision 2015 for the Indian Automotive Components Industry, Automotive Component Manufacturers Association of India and McKinsey.
Pablo, Fernandez (2007), Valuing companies by cash flow discounting: ten methods and nine theories, Managerial Finance, Vol. 33 (11), pp. 853-876.
Paul Bailey F Fin, Paul Brown, Michael Potter, and Peter Wells (2008), A practical comparison of firm valuation models: cash flow, dividend and income, The Finsia Journal of Applied Finance, (2), pp. 22-28.
Philip G. Berger, and Eli, Ofek (1995), Diversification’s effect on firm value, Journal of Financial Economics, Vol. 37, pp. 39-65.
Pingle, V. (2000). Rethinking the Developmental State: India’s Industry in Comparative Perspective, Oxford University Press, New Delhi.
Profile of select case examples, available at: www.indiainfoline.com, last accessed on Oct 15, 2010. Richard, Frankel and Charles M.C., Lee (1998), Accounting valuation, market expectation, and cross-
sectional stock returns, Journal of Accounting and Economics, Vol. 25, pp. 283-319. Scott, B. Smart, William L. Megginson and Lawrence J. Gitman (2004), Corporate Finance, South
Western – Thomson. Simon, Peck and Paul, Temple (2002), Mergers and Acquisitions – Critical Perspectives on Business
and Management, Routledge – Taylor & Francis group. Thomas, Plenborg (2002), Firm valuation: comparing the residual income and discounted cash flow
approaches, Scandinavian Journal of Management, Vol. 18, pp. 303–318.
Srinivasa Reddy , Int.J.Buss.Mgt.Eco.Res., Vol 2(4),2011,258-269
269