Embed Size (px)
Citation preview

Copyright © 2013 Pearson Education, Inc.Lectures prepared by Christine L. Case
Chapter 5
Microbial Metabolism
© 2013 Pearson Education, Inc. Lectures prepared by Christine L. Case
1
© 2013 Pearson Education, Inc.
2
© 2013 Pearson Education, Inc.
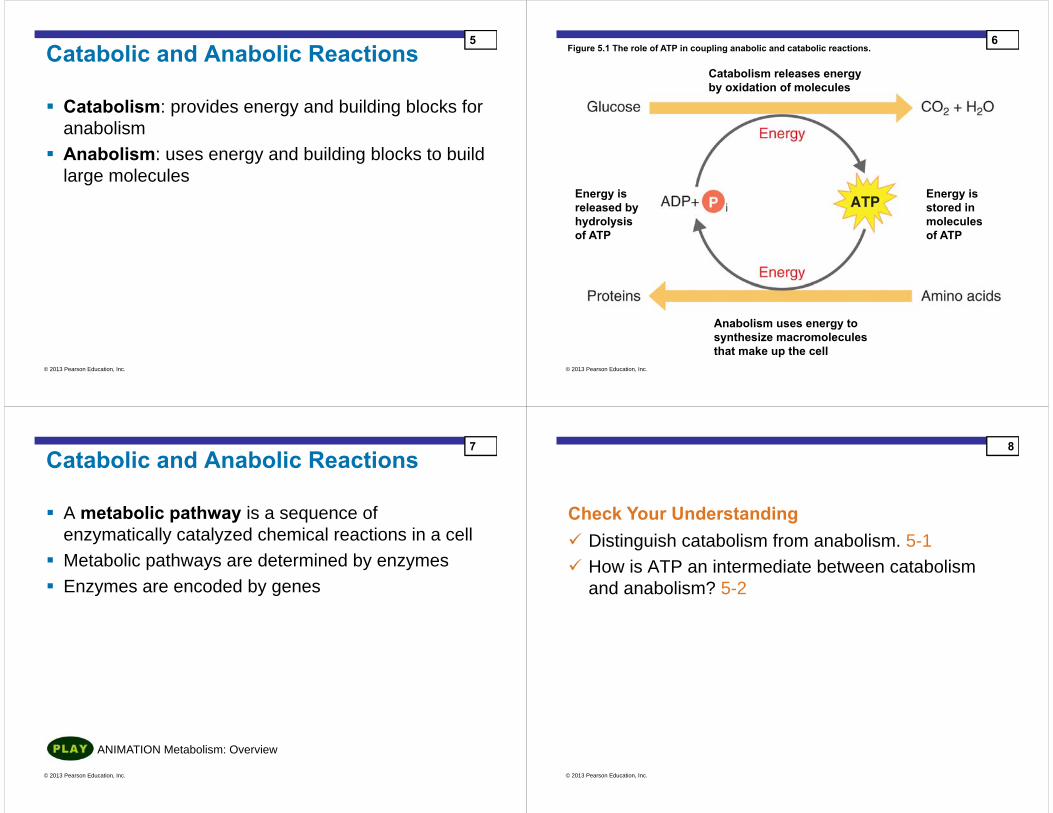
Catabolic and Anabolic Reactions
5-1 Define metabolism, and describe the fundamental differences between anabolism and catabolism.
5-2 Identify the role of ATP as an intermediate between catabolism and anabolism.
Learning Objectives
3
© 2013 Pearson Education, Inc.
Catabolic and Anabolic Reactions
Metabolism: the sum of the chemical reactions in an organism
4
© 2013 Pearson Education, Inc.
Catabolic and Anabolic Reactions
Catabolism: provides energy and building blocks for anabolism
Anabolism: uses energy and building blocks to build large molecules
5
© 2013 Pearson Education, Inc.
Figure 5.1 The role of ATP in coupling anabolic and catabolic reactions.
Catabolism releases energyby oxidation of molecules
Energy isstored inmoleculesof ATP
Anabolism uses energy tosynthesize macromoleculesthat make up the cell
Energy isreleased byhydrolysisof ATP
6
© 2013 Pearson Education, Inc.
ANIMATION Metabolism: Overview
Catabolic and Anabolic Reactions
A metabolic pathway is a sequence of enzymatically catalyzed chemical reactions in a cell
Metabolic pathways are determined by enzymes Enzymes are encoded by genes
7
© 2013 Pearson Education, Inc.
Check Your Understanding
Check Your Understanding
Distinguish catabolism from anabolism. 5-1 How is ATP an intermediate between catabolism
and anabolism? 5-2
8

© 2013 Pearson Education, Inc.
Enzyme
5-3 Identify the components of an enzyme.5-4 Describe the mechanism of enzymatic action.5-5 List the factors that influence enzymatic activity.5-6 Distinguish competitive and noncompetitive
inhibition.5-7 Define ribozyme.
Learning Objectives
9
© 2013 Pearson Education, Inc.
Collision Theory
The collision theory states that chemical reactions can occur when atoms, ions, and molecules collide
Activation energy is needed to disrupt electronic configurations
Reaction rate is the frequency of collisions with enough energy to bring about a reaction
Reaction rate can be increased by enzymes or by increasing temperature or pressure
10
© 2013 Pearson Education, Inc.
Figure 5.2 Energy requirements of a chemical reaction.
Reactionwithout enzyme
Reactionwith enzyme
Reactant
Initial energy level
Final energy levelProducts
Activationenergywithout enzyme
Activationenergywithenzyme
11
© 2013 Pearson Education, Inc.
Enzyme Components
Biological catalysts Specific for a chemical reaction; not used up in that
reaction Apoenzyme: protein Cofactor: nonprotein component Coenzyme: organic cofactor
Holoenzyme: apoenzyme plus cofactor
12

© 2013 Pearson Education, Inc.
Figure 5.3 Components of a holoenzyme.
Coenzyme Substrate
Apoenzyme (protein portion),
inactive
Cofactor(nonprotein portion),
activator
Holoenzyme(whole enzyme),
active
13
© 2013 Pearson Education, Inc.
Important Coenzymes
NAD+
NADP+
FAD Coenzyme A
14
© 2013 Pearson Education, Inc.
ANIMATION Enzymes: Steps in a Reaction
ANIMATION Enzymes: Overview
Enzyme Specificity and Efficiency
The turnover number is generally 1 to 10,000 molecules per second
15
© 2013 Pearson Education, Inc.
Figure 5.4a The mechanism of enzymatic action.
Substrate Active site
Enzyme–substrate
Products
Enzyme complex
16

© 2013 Pearson Education, Inc.
Figure 5.4b The mechanism of enzymatic action.
SubstrateEnzymeSubstrate
17
© 2013 Pearson Education, Inc.
Enzyme Classification
Oxidoreductase: oxidation-reduction reactions Transferase: transfer functional groups Hydrolase: hydrolysis Lyase: removal of atoms without hydrolysis Isomerase: rearrangement of atoms Ligase: joining of molecules; uses ATP
18
© 2013 Pearson Education, Inc.
Factors Influencing Enzyme Activity
Temperature pH Substrate concentration Inhibitors
19
© 2013 Pearson Education, Inc.
Temperature and pH denature proteins
Factors Influencing Enzyme Activity20
© 2013 Pearson Education, Inc.
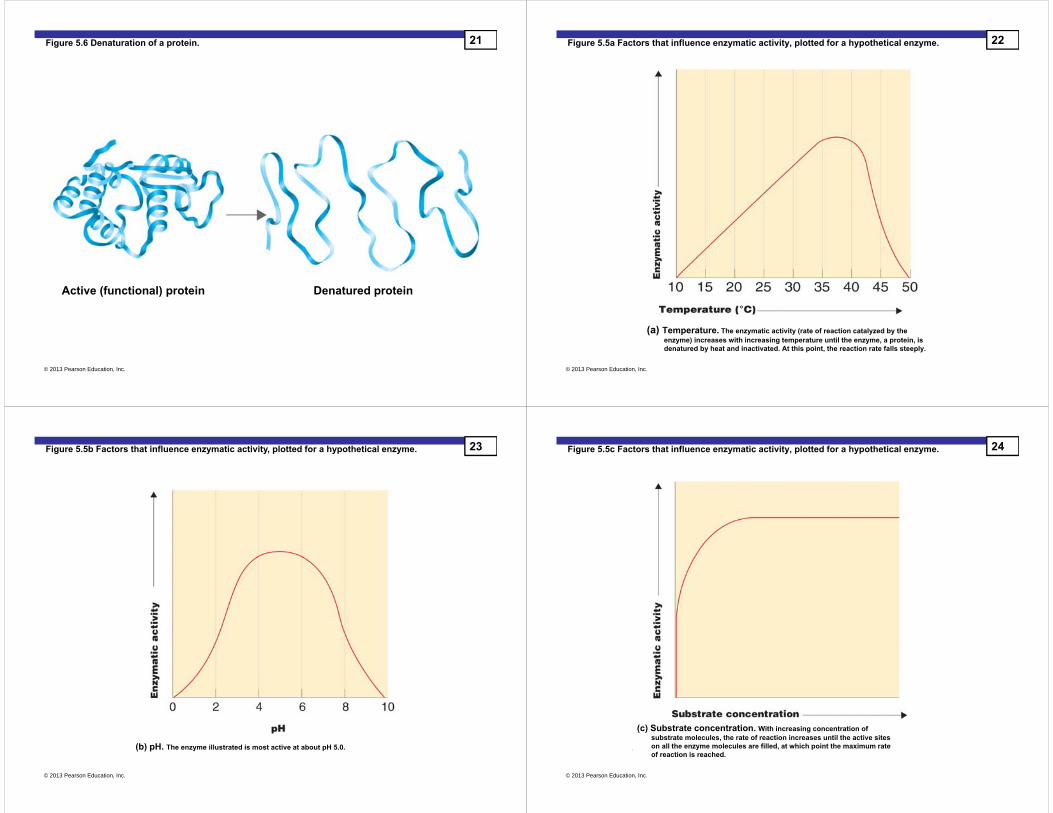
Figure 5.6 Denaturation of a protein.
Active (functional) protein Denatured protein
21
© 2013 Pearson Education, Inc.
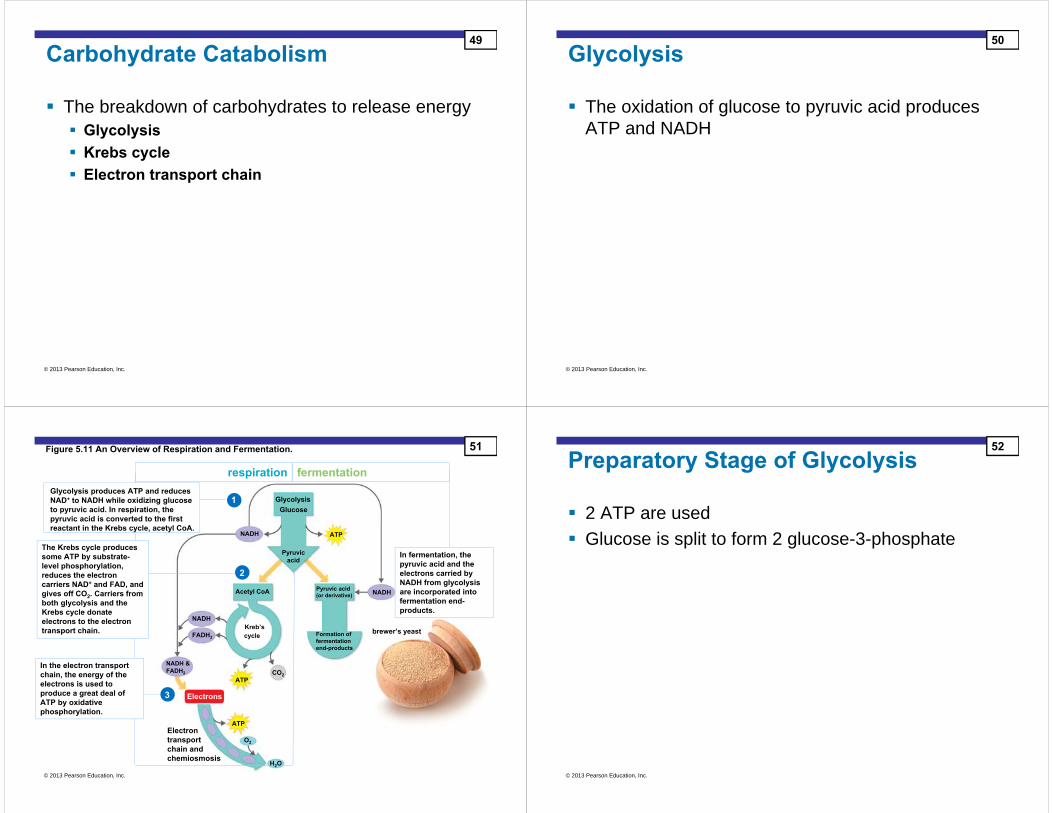
Figure 5.5a Factors that influence enzymatic activity, plotted for a hypothetical enzyme.
(a) Temperature. The enzymatic activity (rate of reaction catalyzed by the enzyme) increases with increasing temperature until the enzyme, a protein, is denatured by heat and inactivated. At this point, the reaction rate falls steeply.
22
© 2013 Pearson Education, Inc.
Figure 5.5b Factors that influence enzymatic activity, plotted for a hypothetical enzyme.
(b) pH. The enzyme illustrated is most active at about pH 5.0.
23
© 2013 Pearson Education, Inc.
Figure 5.5c Factors that influence enzymatic activity, plotted for a hypothetical enzyme.
(c) Substrate concentration. With increasing concentration of substrate molecules, the rate of reaction increases until the active sites on all the enzyme molecules are filled, at which point the maximum rate of reaction is reached.
24

© 2013 Pearson Education, Inc.
ANIMATION Enzymes: Competitive Inhibition
Enzyme Inhibitors: Competitive Inhibition
25
© 2013 Pearson Education, Inc.
Figure 5.7ab Enzyme inhibitors.
Normal Binding of Substrate Action of Enzyme Inhibitors
SubstrateActive site
Enzyme
Competitiveinhibitor
26
© 2013 Pearson Education, Inc.
Enzyme Inhibitors: Competitive Inhibition 27
© 2013 Pearson Education, Inc.
ANIMATION Enzymes: Non-competitive Inhibition
Enzyme Inhibitors: Noncompetitive Inhibition
28

© 2013 Pearson Education, Inc.
Figure 5.7ac Enzyme inhibitors.
Normal Binding of Substrate
SubstrateActive site
Enzyme
Action of Enzyme Inhibitors
Noncompetitiveinhibitor Allosteric
site
Alteredactive site
29
© 2013 Pearson Education, Inc.
Enzyme Inhibitors: Feedback Inhibition30
© 2013 Pearson Education, Inc.
Figure 5.8 Feedback inhibition.
Substrate
PathwayOperates
Intermediate A
Intermediate B
End-product
Enzyme 1
Allosteric site
Enzyme 2
Bound end-product
Pathway Shuts Down
Feed
back
Inhi
bitio
n
Enzyme 3
31
© 2013 Pearson Education, Inc.
Ribozymes
RNA that cuts and splices RNA
32

© 2013 Pearson Education, Inc.
Check Your Understanding
Check Your Understanding
What is a coenzyme? 5-3 Why is enzyme specificity important? 5-4 What happens to an enzyme below its optimal
temperature? Above its optimal temperature? 5-5 Why is feedback inhibition noncompetitive
inhibition? 5-6 What is a ribozyme? 5-7
33
© 2013 Pearson Education, Inc.
5-8 Explain the term oxidation-reduction.5-9 List and provide examples of three types of
phosphorylation reactions that generate ATP.5-10 Explain the overall function of metabolic
pathways.
Energy Production
Learning Objectives
34
© 2013 Pearson Education, Inc.
Oxidation-Reduction Reactions
Oxidation: removal of electrons Reduction: gain of electrons Redox reaction: an oxidation reaction paired with
a reduction reaction
35
© 2013 Pearson Education, Inc.
Figure 5.9 Oxidation-reduction.
Reduction
A oxidized B reduced
Oxidation
A B
36

© 2013 Pearson Education, Inc.
ANIMATION Oxidation-Reduction Reactions
Oxidation-Reduction Reactions
In biological systems, the electrons are often associated with hydrogen atoms
Biological oxidations are often dehydrogenations
37
© 2013 Pearson Education, Inc.
Figure 5.10 Representative biological oxidation.
Reduction
Oxidation
H+
(proton)
Organic moleculethat includes twohydrogen atoms
(H)
NAD+ coenzyme(electron carrier)
Oxidized organic
molecule
NADH + H+ (proton)(reduced electron
carrier)
H
38
© 2013 Pearson Education, Inc.
ATP is generated by the phosphorylation of ADP
The Generation of ATP39
© 2013 Pearson Education, Inc.
The Generation of ATP 40

© 2013 Pearson Education, Inc.
Energy from the transfer of a high-energy PO4– to
ADP generates ATP
Substrate-Level Phosphorylation41
© 2013 Pearson Education, Inc.
Oxidative Phosphorylation
Energy released from transfer of electrons (oxidation) of one compound to another (reduction) is used to generate ATP in the electron transport chain
42
© 2013 Pearson Education, Inc.
Figure 5.14 An electron transport chain (system).
Energy
43
© 2013 Pearson Education, Inc.
Photophosphorylation
Light causes chlorophyll to give up electrons Energy released from transfer of electrons
(oxidation) of chlorophyll through a system of carrier molecules is used to generate ATP
44

© 2013 Pearson Education, Inc.
Figure 5.25 Photophosphorylation.
Light Excitedelectrons
Electrontransportchain
Electron carrier
Energy forproductionof ATP
Excitedelectrons
Excitedelectrons
(b) Noncyclic photophosphorylation
In Photosystem I(a) Cyclic photophosphorylation Electron
transportchain Energy for
productionof ATP
Light
Light
In Photosystem II
In Photosystem I
45
© 2013 Pearson Education, Inc.
Metabolic Pathways of Energy Production 46
© 2013 Pearson Education, Inc.
Check Your Understanding
Check Your Understanding
Why is glucose such an important molecule for organisms? 5-8
Outline the three ways that ATP is generated. 5-9 What is the purpose of metabolic pathways? 5-10
47
© 2013 Pearson Education, Inc.
Carbohydrate Catabolism
5-11 Describe the chemical reactions of glycolysis.5-12 Identify the functions of the pentose phosphate
and Entner-Doudoroff pathways.5-13 Explain the products of the Krebs cycle.5-14 Describe the chemiosmotic model for ATP
generation.5-15 Compare and contrast aerobic and anaerobic
respiration.5-16 Describe the chemical reactions of, and list some
products of, fermentation.
Learning Objectives
48
© 2013 Pearson Education, Inc.
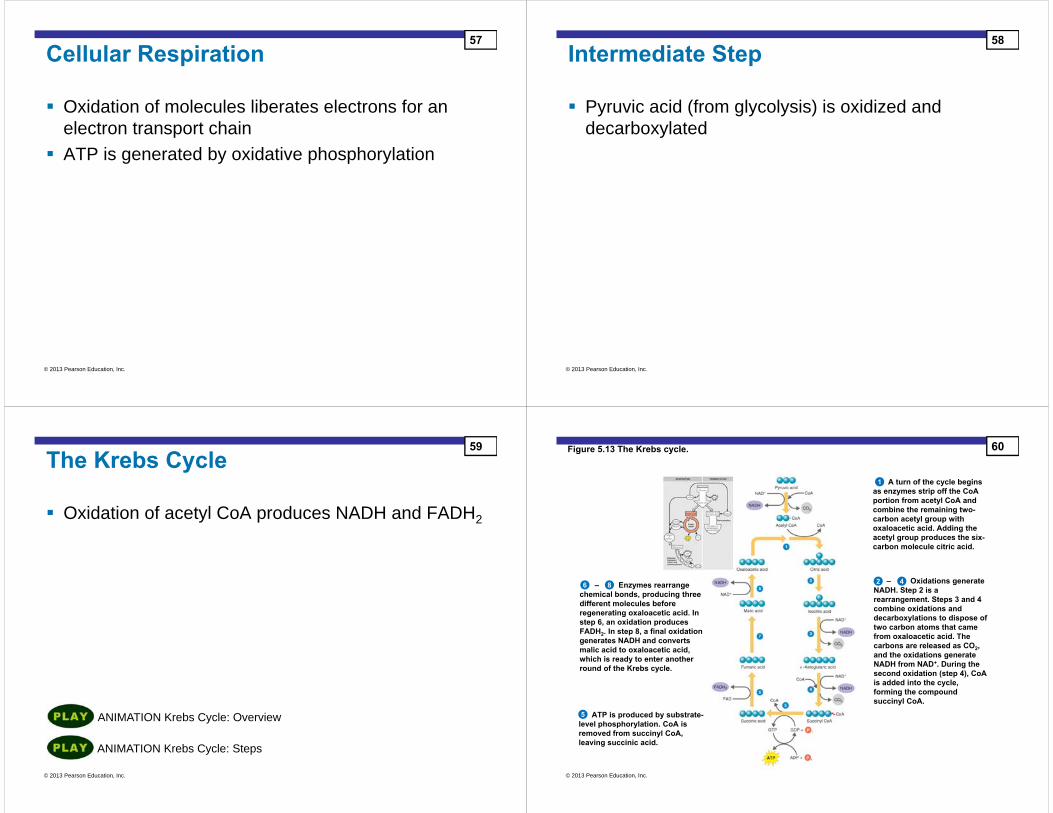
Carbohydrate Catabolism
The breakdown of carbohydrates to release energy Glycolysis Krebs cycle Electron transport chain
49
© 2013 Pearson Education, Inc.
Glycolysis
The oxidation of glucose to pyruvic acid produces ATP and NADH
50
© 2013 Pearson Education, Inc.
Figure 5.11 An Overview of Respiration and Fermentation.
1
3
2
The Krebs cycle produces some ATP by substrate-level phosphorylation, reduces the electron carriers NAD+ and FAD, and gives off CO2. Carriers from both glycolysis and the Krebs cycle donate electrons to the electron transport chain.
In the electron transportchain, the energy of theelectrons is used toproduce a great deal ofATP by oxidativephosphorylation.
Glycolysis produces ATP and reduces NAD+ to NADH while oxidizing glucose to pyruvic acid. In respiration, the pyruvic acid is converted to the first reactant in the Krebs cycle, acetyl CoA.
In fermentation, the pyruvic acid and the electrons carried by NADH from glycolysis are incorporated into fermentation end-products.
brewer’s yeast
NADH
NADH
NADH
FADH2
NADH & FADH2
GlycolysisGlucose
Pyruvic acid
Pyruvic acid(or derivative)
Formation offermentationend-products
ATP
ATP
ATPCO2
O2
Electrons
Acetyl CoA
Electrontransportchain andchemiosmosis
respiration fermentation
H2O
Kreb’scycle
51
© 2013 Pearson Education, Inc.
Preparatory Stage of Glycolysis
2 ATP are used Glucose is split to form 2 glucose-3-phosphate
52

© 2013 Pearson Education, Inc.
Glucose enters the cell and is phosphorylated. Amolecule of ATP is invested. The product is glucose 6-phosphate.
2 Glucose 6-phosphate is rearranged to form fructose 6-phosphate.
The from another ATP is used to produce fructose 1,6-diphosphate, still a six-carbon compound. (Note the total investment of two ATP molecules up to this point.)
An enzyme cleaves (splits) the sugar into two three-carbon molecules: dihydroxyacetone phosphate (DHAP) and glyceraldehyde 3-phosphate (GP).
DHAP is readily converted to GP (the reverse action may also occur).
The next enzyme converts each GP to another three-carbon compound, 1,3-diphosphoglyceric acid. Because each DHAP molecule can be converted to GP and each GP to 1,3-diphosphoglyceric acid, the result is two molecules of 1,3-diphosphoglyceric acid for each initial molecule of glucose. GP is oxidized by the transfer of two hydrogen atoms to NAD+ to form NADH. The enzyme couples this reaction with the creation of a high-energy bond between the sugar and a . The three-carbon sugar now has two groups.
The high-energy is moved to ADP, forming ATP, the first ATP production of glycolysis. (Since the sugar splitting in step 4, all products are doubled. Therefore, this step actually repays the earlier investment of two ATP molecules.)
An enzyme relocates the remaining of 3-phosphoglyceric acid to form 2-phosphoglyceric acid in preparation for the next step.
By the loss of a water molecule, 2-phosphoglyceric acid is converted to phosphoenolpyruvic acid (PEP). In the process, the phosphate bond is upgraded to a high-energy bond.
This high-energy is transferred from PEP to ADP, forming ATP. For each initial glucose molecule, the result of this step is two molecules of ATP and two molecules of a three-carbon compound called pyruvic acid.
2
3
5
6
7
8
9
10
4
Glucose 6-phosphate
Fructose 6-phosphate
Fructose 1,6-diphosphate
Glyceraldehyde 3-phosphate (GP)
1,3-diphosphoglyceric acid
3-phosphoglyceric acid
2-phosphoglyceric acid
Phosphoenolpyruvic acid (PEP)
P
P
P
P
P
P
1
Figure 5.12 An outline of the reactions of glycolysis (Embden-Meyerhof pathway). 53
© 2013 Pearson Education, Inc.
2 glucose-3-phosphate are oxidized to 2 pyruvic acid 4 ATP are produced 2 NADH are produced
Energy-Conserving Stage of Glycolysis54
© 2013 Pearson Education, Inc.
ANIMATION Glycolysis: Steps
ANIMATION Glycolysis: Overview
Glycolysis
Glucose + 2 ATP + 2 ADP + 2 PO4– + 2 NAD+ 2
pyruvic acid + 4 ATP + 2 NADH + 2H+
55
© 2013 Pearson Education, Inc.
Alternatives to Glycolysis
Pentose phosphate pathway Uses pentoses and NADPH Operates with glycolysis
Entner-Doudoroff pathway Produces NADPH and ATP Does not involve glycolysis Pseudomonas, Rhizobium, Agrobacterium
56
© 2013 Pearson Education, Inc.
Cellular Respiration
Oxidation of molecules liberates electrons for an electron transport chain
ATP is generated by oxidative phosphorylation
57
© 2013 Pearson Education, Inc.
Pyruvic acid (from glycolysis) is oxidized and decarboxylated
Intermediate Step58
© 2013 Pearson Education, Inc.
ANIMATION Krebs Cycle: Steps
ANIMATION Krebs Cycle: Overview
The Krebs Cycle
Oxidation of acetyl CoA produces NADH and FADH2
59
© 2013 Pearson Education, Inc.
Figure 5.13 The Krebs cycle.
A turn of the cycle begins as enzymes strip off the CoA portion from acetyl CoA and combine the remaining two-carbon acetyl group with oxaloacetic acid. Adding the acetyl group produces the six-carbon molecule citric acid.
– Oxidations generateNADH. Step 2 is a rearrangement. Steps 3 and 4 combine oxidations and decarboxylations to dispose of two carbon atoms that came from oxaloacetic acid. The carbons are released as CO2, and the oxidations generate NADH from NAD+. During the second oxidation (step 4), CoA is added into the cycle, forming the compound succinyl CoA.
ATP is produced by substrate-level phosphorylation. CoA is removed from succinyl CoA, leaving succinic acid.
– Enzymes rearrange chemical bonds, producing three different molecules before regenerating oxaloacetic acid. In step 6, an oxidation produces FADH2. In step 8, a final oxidation generates NADH and converts malic acid to oxaloacetic acid, which is ready to enter another round of the Krebs cycle.
1
2 46 8
5
60

© 2013 Pearson Education, Inc.
ANIMATION Electron Transport Chain: Overview
The Electron Transport Chain
A series of carrier molecules that are, in turn, oxidized and reduced as electrons are passed down the chain
Energy released can be used to produce ATP by chemiosmosis
61
© 2013 Pearson Education, Inc.
Figure 5.14 An electron transport chain (system).
Energy
62
© 2013 Pearson Education, Inc.
Figure 5.11 An Overview of Respiration and Fermentation.
1
3
2
The Krebs cycle produces some ATP by substrate-level phosphorylation, reduces the electron carriers NAD+ and FAD, and gives off CO2. Carriers from both glycolysis and the Krebs cycle donate electrons to the electron transport chain.
In the electron transportchain, the energy of theelectrons is used toproduce a great deal ofATP by oxidativephosphorylation.
Glycolysis produces ATP and reduces NAD+ to NADH while oxidizing glucose to pyruvic acid. In respiration, the pyruvic acid is converted to the first reactant in the Krebs cycle, acetyl CoA.
In fermentation, the pyruvic acid and the electrons carried by NADH from glycolysis are incorporated into fermentation end-products.
brewer’s yeast
NADH
NADH
NADH
FADH2
NADH & FADH2
GlycolysisGlucose
Pyruvic acid
Pyruvic acid(or derivative)
Formation offermentationend-products
ATP
ATP
ATPCO2
O2
Electrons
Acetyl CoA
Electrontransportchain andchemiosmosis
respiration fermentation
H2O
Kreb’scycle
63
© 2013 Pearson Education, Inc.
CytoplasmBacterium Mitochondrion
Intermembrane spaceMitochondrial matrix
Cellwall
Periplasmic space
Plasma membrane
Outer membrane
Inner membrane
Periplasmic space of prokaryote or intermembrane space of eukaryote
Prokaryoticplasmamembraneor eukaryoticinner mitochondrial membrane
Cytoplasm ofprokaryote ormitochondrialmatrix ofeukaryote
Figure 5.16 Electron transport and the chemiosmotic generation of ATP. 64

© 2013 Pearson Education, Inc.
Figure 5.15 Chemiosmosis.
High H+ concentration
Low H+ concentration
Membrane
65
© 2013 Pearson Education, Inc.
A Summary of Respiration
Aerobic respiration: the final electron acceptor in the electron transport chain is molecular oxygen (O2)
Anaerobic respiration: the final electron acceptor in the electron transport chain is NOT O2 Yields less energy than aerobic respiration because only
part of the Krebs cycle operates under anaerobic conditions
66
© 2013 Pearson Education, Inc.
ANIMATION Electron Transport Chain: Factors Affecting ATP Yield
Respiration67
© 2013 Pearson Education, Inc.
Electron Acceptor ProductsNO3
– NO2–, N2 + H2O
SO4– H2S + H2O
CO32 – CH4 + H2O
Anaerobic Respiration68

© 2013 Pearson Education, Inc.
Pathway Eukaryote ProkaryoteGlycolysis Cytoplasm Cytoplasm
Intermediate step Cytoplasm Cytoplasm
Krebs cycle Mitochondrial matrix Cytoplasm
ETC Mitochondrial inner membrane Plasma membrane
Carbohydrate Catabolism69
© 2013 Pearson Education, Inc.
Energy produced from complete oxidation of one glucose using aerobic respiration
Pathway ATP Produced NADH Produced
FADH2Produced
Glycolysis 2 2 0
Intermediate step 0 2 0
Krebs cycle 2 6 2
Total 4 10 2
Carbohydrate Catabolism70
© 2013 Pearson Education, Inc.
ATP produced from complete oxidation of one glucose using aerobic respiration
Pathway By Substrate-Level Phosphorylation
By Oxidative Phosphorylation
From NADH From FADH
Glycolysis 2 6 0
Intermediate step 0 6 0
Krebs cycle 2 18 4
Total 4 30 4
Carbohydrate Catabolism71
© 2013 Pearson Education, Inc.
36 ATPs are produced in eukaryotes
Pathway By Substrate-Level Phosphorylation
By Oxidative Phosphorylation
From NADH From FADH
Glycolysis 2 6 0
Intermediate step 0 6 0
Krebs cycle 2 18 4
Total 4 30 4
Carbohydrate Catabolism72

© 2013 Pearson Education, Inc.
Fermentation
Any spoilage of food by microorganisms (general use)
Any process that produces alcoholic beverages or acidic dairy products (general use)
Any large-scale microbial process occurring with or without air (common definition used in industry)
73
© 2013 Pearson Education, Inc.
Fermentation
Scientific definition: Releases energy from oxidation of organic molecules Does not require oxygen Does not use the Krebs cycle or ETC Uses an organic molecule as the final electron acceptor
74
© 2013 Pearson Education, Inc.
Figure 5.18a Fermentation. 75
© 2013 Pearson Education, Inc.
Figure 5.18b Fermentation. 76

© 2013 Pearson Education, Inc.
Fermentation
Alcohol fermentation: produces ethanol + CO2
Lactic acid fermentation: produces lactic acid Homolactic fermentation: produces lactic acid only Heterolactic fermentation: produces lactic acid and other
compounds
77
© 2013 Pearson Education, Inc.
Figure 5.19 Types of fermentation.
(a) Lactic acid fermentation
(b) Alcohol fermentation
78
© 2013 Pearson Education, Inc.
Figure 5.23 A fermentation test. 79
© 2013 Pearson Education, Inc.
Table 5.4 Some Industrial Uses for Different Types of Fermentations* 80

© 2013 Pearson Education, Inc.
Check Your Understanding
Check Your Understanding
What happens during the preparatory and energy-conserving stages of glycolysis? 5-11
What is the value of the pentose phosphate and Entner-Doudoroff pathways if they produce only one ATP molecule? 5-12
What are the principal products of the Krebs cycle? 5-13 How do carrier molecules function in the electron transport
chain? 5-14 Compare the energy yield (ATP) of aerobic and anaerobic
respiration. 5-15 List four compounds that can be made from pyruvic acid by
an organism that uses fermentation. 5-16
81
© 2013 Pearson Education, Inc.
Lipid and Protein Catabolism
5-17 Describe how lipids and proteins undergo catabolism.
5-18 Provide two examples of the use of biochemical tests to identify bacteria in the laboratory.
Learning Objectives
82
© 2013 Pearson Education, Inc.
Figure 5.20 Lipid catabolism.
Lipase
Beta-oxidation
Krebscycle
83
© 2013 Pearson Education, Inc.
Figure 5.21 Catabolism of various organic food molecules.
Electrontransportchain andchemiosmosis
Krebscycle
84

© 2013 Pearson Education, Inc.
Protein Amino acidsExtracellular proteases
Krebs cycleDeamination, decarboxylation,
dehydrogenation, desulfurization Organic acid
Protein Catabolism85
© 2013 Pearson Education, Inc.
Figure 5.22 Detecting amino acid catabolizing enzymes in the lab. 86
© 2013 Pearson Education, Inc.
Figure 5.24 Use of peptone iron agar to detect the production of H2S. 87
© 2013 Pearson Education, Inc.
Urease NH3 + CO2Urea
Protein Catabolism88

© 2013 Pearson Education, Inc.
Clinical Focus: Human Tuberculosis – Dallas, Texas
Figure B The urease test.
89
© 2013 Pearson Education, Inc.
Used to identify bacteria
Biochemical Tests90
© 2013 Pearson Education, Inc.
Clinical Focus: Human Tuberculosis – Dallas, Texas
Figure A An identification scheme for selected species of slow-growing mycobacteria.
91
© 2013 Pearson Education, Inc.
Check Your Understanding
Check Your Understanding
What are the end-products of lipid and protein catabolism? 5-17
On what biochemical basis are Pseudomonas and Escherichia differentiated? 5-18
92

© 2013 Pearson Education, Inc.
Photosynthesis
5-19 Compare and contrast cyclic and noncyclic photophosphorylation.
5-20 Compare and contrast the light-dependent and light-independent reactions of photosynthesis.
5-21 Compare and contrast oxidative phosphorylation and photophosphorylation.
Learning Objectives
93
© 2013 Pearson Education, Inc.
ANIMATION Photosynthesis: Overview
Photosynthesis
Photo: conversion of light energy into chemical energy (ATP) Light-dependent (light) reactions
Synthesis: Carbon fixation: fixing carbon into organic molecules Light-independent (dark) reaction: Calvin-Benson cycle
94
© 2013 Pearson Education, Inc.
Figure 4.15 Chromatophores.
Chromatophores
© 2013 Pearson Education, Inc.
95
© 2013 Pearson Education, Inc.
ANIMATION: Photosynthesis: Comparing Prokaryotes and Eukaryotes
Photosynthesis
Oxygenic:
Anoxygenic:
96

© 2013 Pearson Education, Inc.
ANIMATION Photosynthesis: Light Reaction: Cyclic Photophosphorylation
Cyclic Photophosphorylation97
© 2013 Pearson Education, Inc.
Figure 5.25a Photophosphorylation.
LightExcitedelectrons
Electrontransportchain
Electron carrier
In Photosystem I(a) Cyclic photophosphorylation
Energy forproductionof ATP
98
© 2013 Pearson Education, Inc.
ANIMATION Photosynthesis: Light Reaction: Noncyclic Photophosphorylation
Noncyclic Photophosphorylation99
© 2013 Pearson Education, Inc.
Figure 5.25b Photophosphorylation.
Excitedelectrons
Excitedelectrons
(b) Noncyclic photophosphorylation
Electrontransportchain Energy for
productionof ATP
Light
Light
In Photosystem II
In Photosystem I
H+ + H+
12
100

© 2013 Pearson Education, Inc.
ANIMATION Photosynthesis: Light Independent Reaction
Calvin-Benson Cycle101
© 2013 Pearson Education, Inc.
Figure 5.26 A simplified version of the Calvin-Benson cycle.
Ribulose diphosphate 3-phosphoglyceric acid
Input
1,3-diphosphoglyceric acid
Calvin-Benson cycle
Glyceraldehyde3-phosphate
Glyceraldehyde3-phosphate
Output
Glyceraldehyde 3-phosphate
Glyceraldehyde 3-phosphate
102
© 2013 Pearson Education, Inc.
Table 5.6 Photosynthesis Compared in Selected Eukaryotes and Prokaryotes 103
© 2013 Pearson Education, Inc.
Check Your Understanding
Check Your Understanding
How is photosynthesis important to catabolism? 5-19
What is made during the light-dependent reactions? 5-20
How are oxidative phosphorylation and photophosphorylation similar? 5-21
104

© 2013 Pearson Education, Inc.
A Summary of Energy Production
5-22 Write a sentence to summarize energy production in cells.
Learning Objective
105
© 2013 Pearson Education, Inc.
Check Your Understanding
Check Your Understanding
Summarize how oxidation enables organisms to get energy from glucose, sulfur, or sunlight. 5-22
106
© 2013 Pearson Education, Inc.
Metabolic Diversity among Organisms
5-23 Categorize the various nutritional patterns among organisms according to carbon source and mechanisms of carbohydrate catabolism and ATP generation.
Learning Objective
107
© 2013 Pearson Education, Inc.
Use energy from chemicals Chemoheterotroph
Energy is used in anabolism
Glucose
Pyruvic acid
NAD+
NADH
ETC
ADP + P ATP
Chemotrophs108

© 2013 Pearson Education, Inc.
Use energy from chemicals Chemoautotroph, Thiobacillus ferrooxidans
Energy is used in the Calvin-Benson cycle to fix CO2
2Fe2+
2Fe3+
NAD+
NADH
ETC
ADP + P ATP2 H+
Chemotrophs109
© 2013 Pearson Education, Inc.
Chlorophyll
Chlorophylloxidized
ETC
ADP + P ATP
Phototrophs
Use light energy
Photoautotrophs use energy in the Calvin-Benson cycle to fix CO2
Photoheterotrophs use energy
110
© 2013 Pearson Education, Inc.
Figure 5.27 Requirements of ATP production. 111
© 2013 Pearson Education, Inc.
Chemical Light
Organic compounds CO2 Organic compounds CO2
NoYesO2 Not O2Organic
compoundInorganic
compound
Figure 5.28 A nutritional classification of organisms. 112

© 2013 Pearson Education, Inc.
Nutritional Type Energy Source Carbon Source Example
Photoautotroph Light CO2 Oxygenic: Cyanobacteria, plantsAnoxygenic: Green bacteria, purple bacteria
Photoheterotroph Light Organic compounds
Green bacteria, purple nonsulfur bacteria
Chemoautotroph Chemical CO2 Iron-oxidizing bacteria
Chemoheterotroph Chemical Organic compounds
Fermentative bacteriaAnimals, protozoa, fungi, bacteria
Metabolic Diversity among Organisms113
© 2013 Pearson Education, Inc.
Check Your Understanding
Check Your Understanding
Almost all medically important microbes belong to which of the four aforementioned groups? 5-23
114
© 2013 Pearson Education, Inc.
ANIMATION Metabolism: The Big Picture
Metabolic Pathways of Energy Use
5-24 Describe the major types of anabolism and their relationship to catabolism.
Learning Objective
115
© 2013 Pearson Education, Inc.
Figure 5.29 The biosynthesis of polysaccharides.
Glycogen(in bacteria)
Glycogen(in animals)
Peptidoglycan(in bacteria)
116

© 2013 Pearson Education, Inc.
Figure 5.30 The biosynthesis of simple lipids.
Krebscycle
117
© 2013 Pearson Education, Inc.
Figure 5.31a The biosynthesis of amino acids.
Krebscycle
Amination or transamination
Amino acid biosynthesis
118
© 2013 Pearson Education, Inc.
Figure 5.31b The biosynthesis of amino acids.
Transamination
Process of transamination
Glutamic acid Oxaloaceticacid
α-Ketoglutaricacid
Aspartic acid
119
© 2013 Pearson Education, Inc.
Figure 5.32 The biosynthesis of purine and pyrimidine nucleotides.
Krebscycle
120

© 2013 Pearson Education, Inc.
Check Your Understanding
Check Your Understanding
Where do amino acids required for protein synthesis come from? 5-24
121
© 2013 Pearson Education, Inc.
The Integration of Metabolism
5-25 Define amphibolic pathways.Learning Objective
122
© 2013 Pearson Education, Inc.
The Integration of Metabolism
Amphibolic pathways: metabolic pathways that have both catabolic and anabolic functions
123
© 2013 Pearson Education, Inc.
Figure 5.33 The integration of metabolism.
Krebs cycle
CO2
124
© 2013 Pearson Education, Inc.
Check Your Understanding
Check Your Understanding
Summarize the integration of metabolic pathways using peptidoglycan synthesis as an example. 5-25
125


![01 Lecture Presentation PC v2 [Read-Only]profwelday.weebly.com › uploads › 2 › 3 › 0 › 0 › 23005790 › lec_01-06...Campbell Essential Biology, Fifth Edition, and Campbell](https://img.pdfslide.net/doc/110x75/5f04d94c7e708231d41003a1/01-lecture-presentation-pc-v2-read-only-a-uploads-a-2-a-3-a-0-a-0-a.jpg)