Embed Size (px)
DESCRIPTION
Citation preview

1
CSPL Sales Review for 2012-13
Month April May June July Aug Sept Oct Nov Dec Jan Feb Mar Total
Total Sales 238.08 255.07 259.10
Segment Sales April Sales May Sales June
OEM 207.63 228.10 229.91
Retail 21.22 17.50 19.95
Exports 7.42 7.23 8.14
Fleet 1.81 2.25 1.10
Total 238.08 255.07 259.10
Mn. Rs
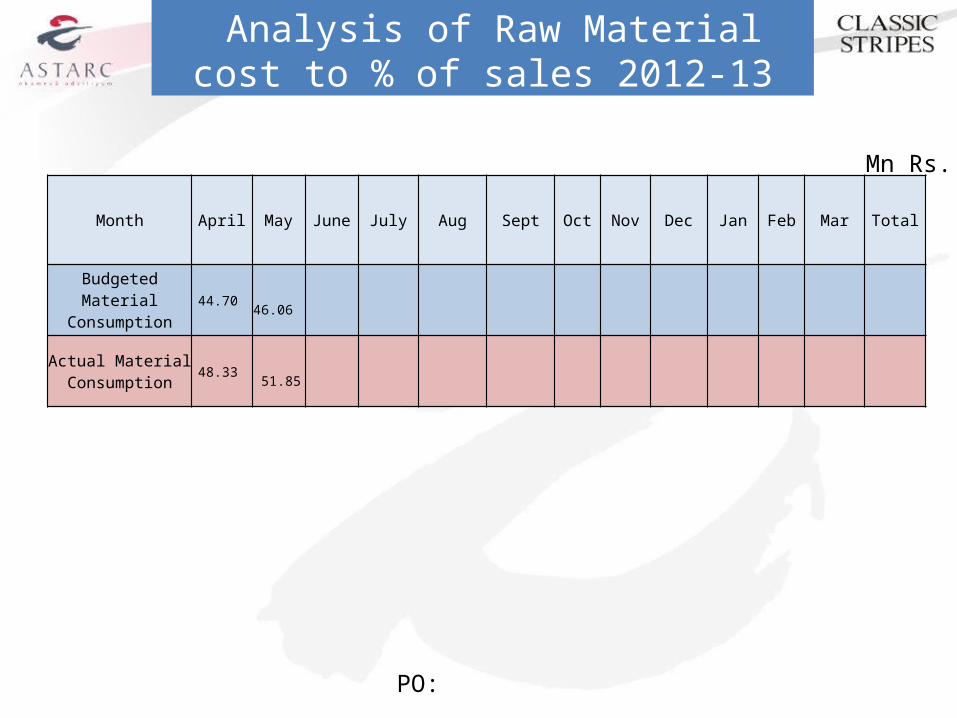
Analysis of Raw Material cost to % of sales 2012-13
PO:
Month April May June July Aug Sept Oct Nov Dec Jan Feb Mar Total
Budgeted Material Consumption 44.70 46.06
Actual Material Consumption 48.33
51.85
Mn Rs.
3
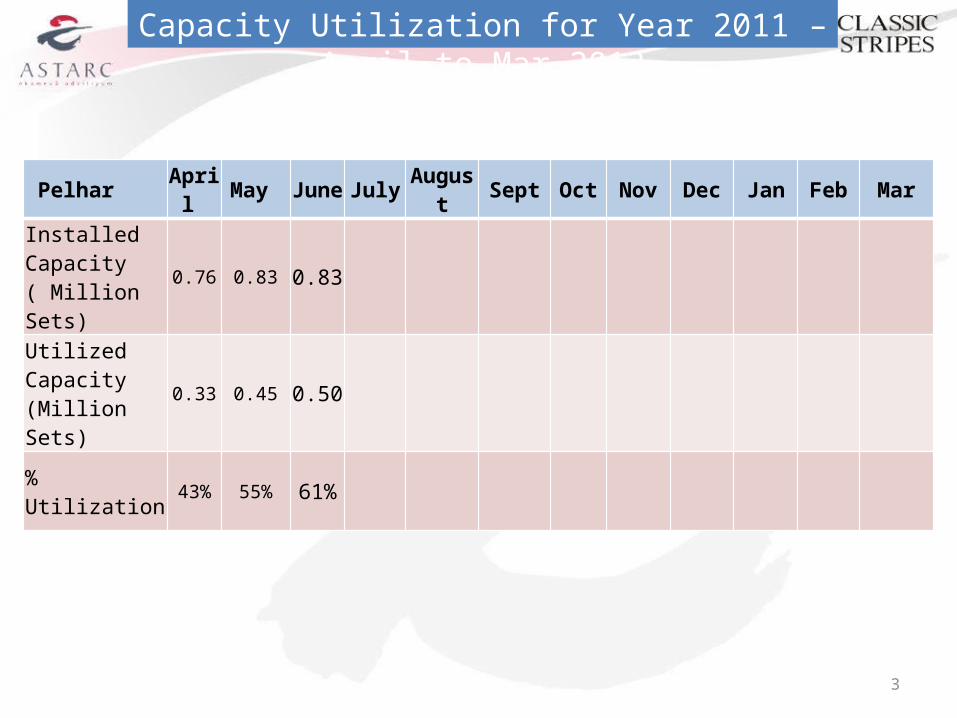
Capacity Utilization for Year 2011 – April to Mar 2013
Pelhar April May June July August Sept Oct Nov Dec Jan Feb MarInstalled Capacity ( Million Sets)
0.76 0.83 0.83
Utilized Capacity (Million Sets)
0.33 0.45 0.50
% Utilization 43% 55% 61%
8/22/2012 4
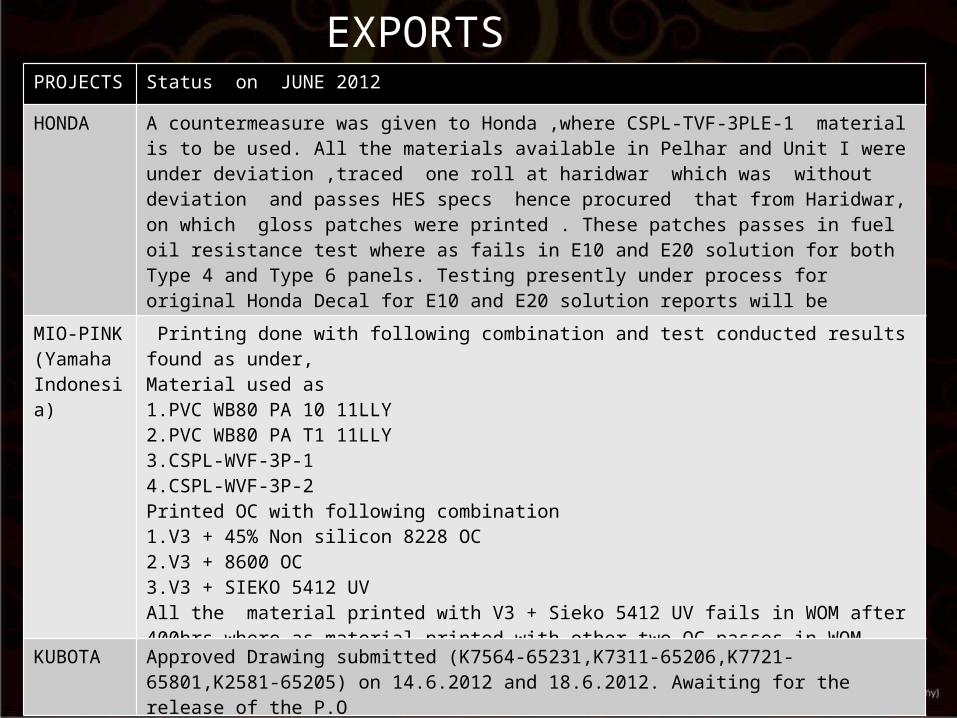
EXPORTS ProjectsPROJECTS Status on JUNE 2012
HONDA A countermeasure was given to Honda ,where CSPL-TVF-3PLE-1 material is to be used. All the materials available in Pelhar and Unit I were under deviation ,traced one roll at haridwar which was without deviation and passes HES specs hence procured that from Haridwar, on which gloss patches were printed . These patches passes in fuel oil resistance test where as fails in E10 and E20 solution for both Type 4 and Type 6 panels. Testing presently under process for original Honda Decal for E10 and E20 solution reports will be submitted by July 1st week
MIO-PINK(Yamaha Indonesia)
Printing done with following combination and test conducted results found as under,Material used as 1.PVC WB80 PA 10 11LLY2.PVC WB80 PA T1 11LLY3.CSPL-WVF-3P-14.CSPL-WVF-3P-2Printed OC with following combination 1.V3 + 45% Non silicon 8228 OC2.V3 + 8600 OC3.V3 + SIEKO 5412 UVAll the material printed with V3 + Sieko 5412 UV fails in WOM after 400hrs,where as material printed with other two OC passes in WOM till 400 hrs and is continued for 900hrs
KUBOTA Approved Drawing submitted (K7564-65231,K7311-65206,K7721-65801,K2581-65205) on 14.6.2012 and 18.6.2012. Awaiting for the release of the P.O
8/22/2012 5
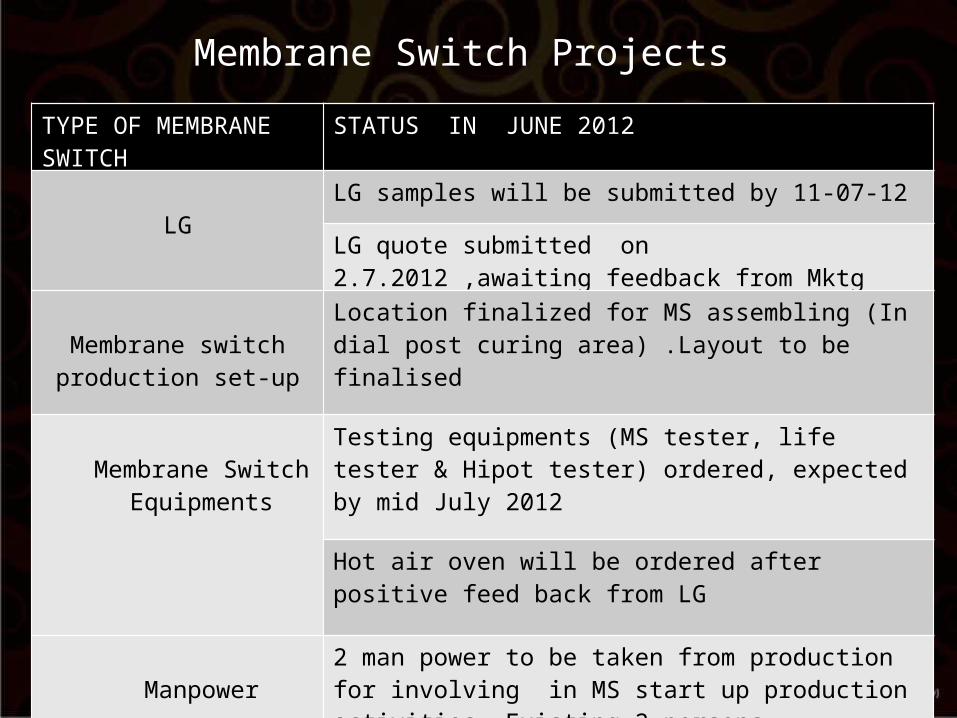
Membrane Switch Projects
TYPE OF MEMBRANE SWITCH
STATUS IN JUNE 2012
LGLG samples will be submitted by 11-07-12
LG quote submitted on 2.7.2012 ,awaiting feedback from Mktg
Membrane switch production set-up
Location finalized for MS assembling (In dial post curing area) .Layout to be finalised
Membrane Switch Equipments
Testing equipments (MS tester, life tester & Hipot tester) ordered, expected by mid July 2012
Hot air oven will be ordered after positive feed back from LG
Manpower2 man power to be taken from production for involving in MS start up production activities. Existing 2 persons

8/22/2012 6
RAW MATERIAL TRACKING SHEET
Raw material
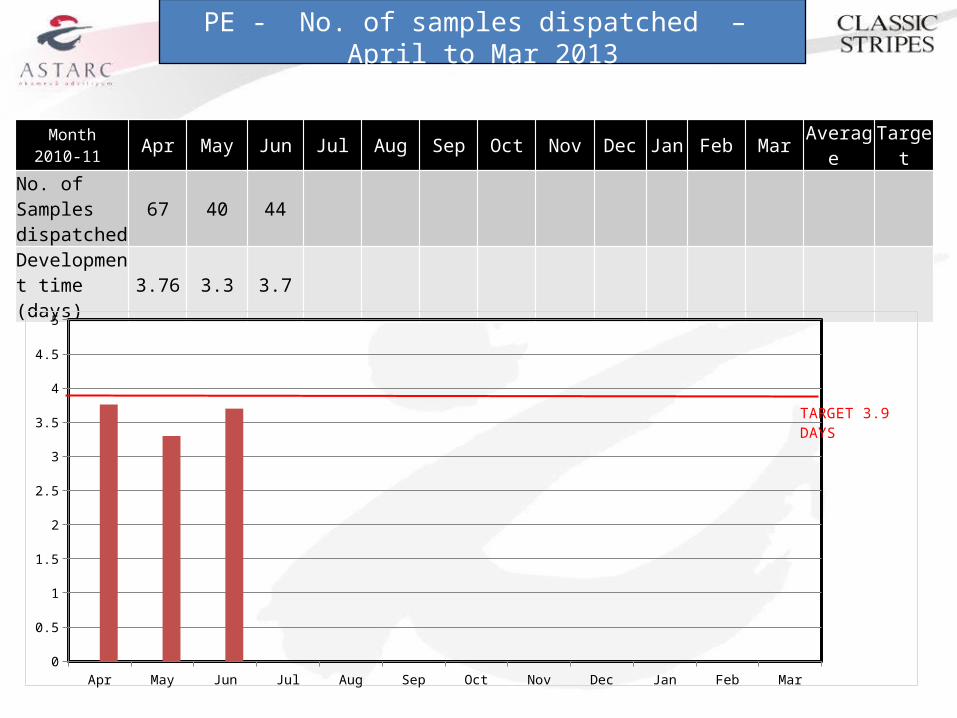
PE - No. of samples dispatched – April to Mar 2013
Month
2010-11 Apr May Jun Jul Aug Sep Oct Nov Dec Jan Feb Mar Average Target
No. of Samples dispatched
67 40 44
Development time (days)
3.76 3.3 3.7
Apr May Jun Jul Aug Sep Oct Nov Dec Jan Feb Mar0
0.5
1
1.5
2
2.5
3
3.5
4
4.5
5
TARGET 3.9 DAYS
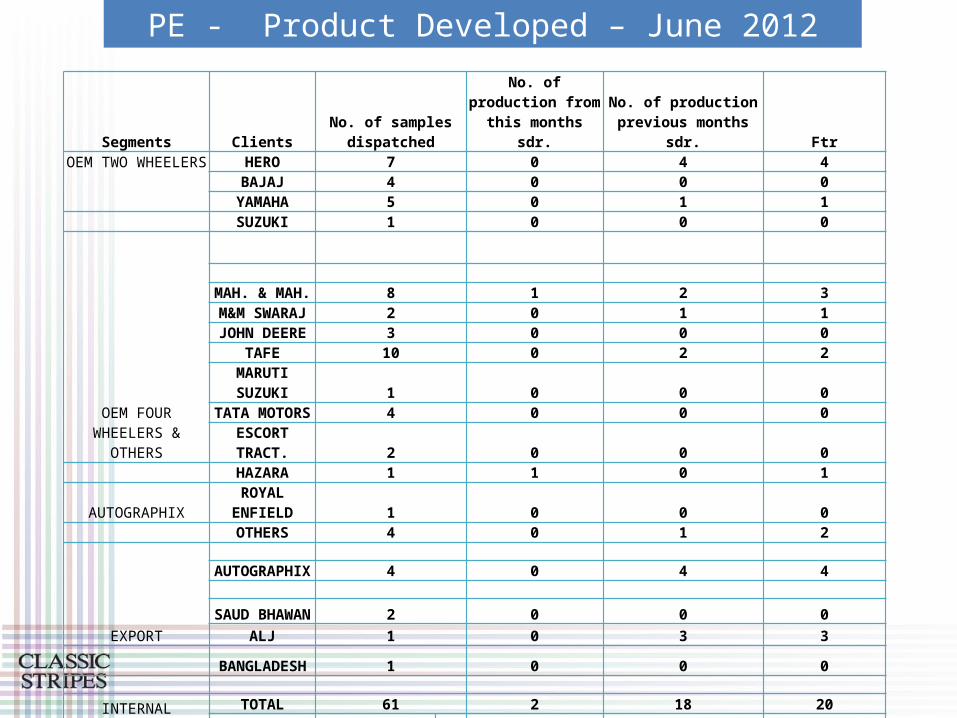
Segments ClientsNo. of samples dispatched
No. of production from this months sdr.
No. of production previous months sdr. Ftr
OEM TWO WHEELERS
HERO 7 0 4 4BAJAJ 4 0 0 0
YAMAHA 5 0 1 1SUZUKI 1 0 0 0
OEM FOUR WHEELERS & OTHERS
MAH. & MAH. 8 1 2 3M&M SWARAJ 2 0 1 1JOHN DEERE 3 0 0 0
TAFE 10 0 2 2MARUTI SUZUKI 1 0 0 0TATA MOTORS 4 0 0 0ESCORT TRACT. 2 0 0 0
HAZARA 1 1 0 1
AUTOGRAPHIX ROYAL ENFIELD 1 0 0 0OTHERS 4 0 1 2
EXPORT
AUTOGRAPHIX 4 0 4 4
SAUD BHAWAN 2 0 0 0ALJ 1 0 3 3
BANGLADESH 1 0 0 0
INTERNAL CUSTOMER
TOTAL 61 2 18 20
HERO HONDA 15 15
PE - Product Developed – June 2012
9
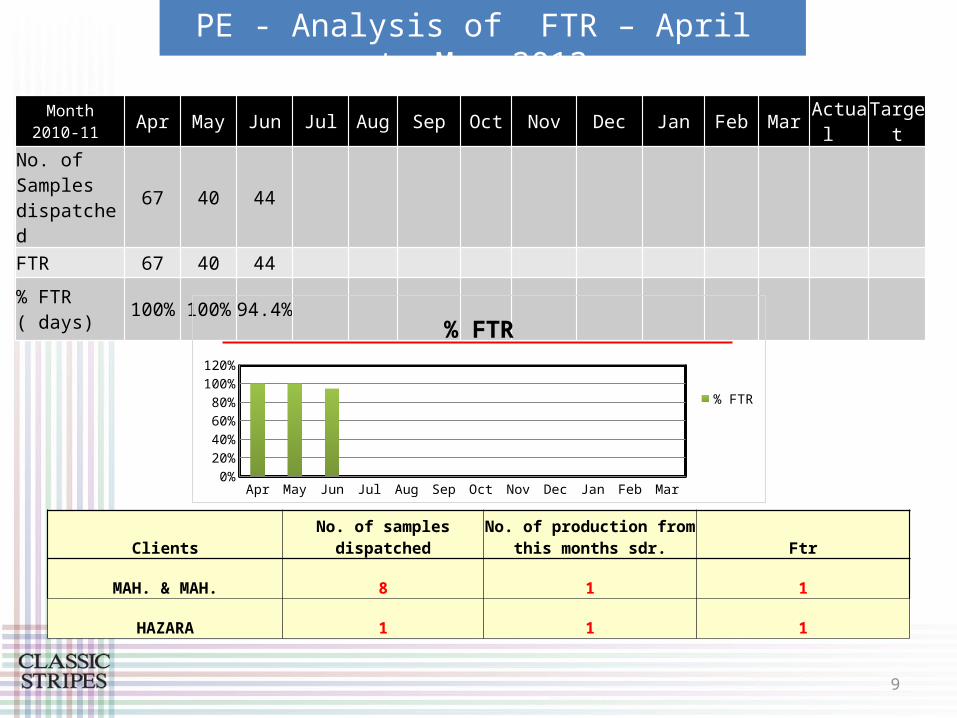
PE - Analysis of FTR – April to Mar 2013
Month2010-11 Apr May Jun Jul Aug Sep Oct Nov Dec Jan Feb Mar Actual Target
No. of Samples dispatched
67 40 44
FTR 67 40 44
% FTR ( days)
100% 100% 94.4%
Apr May Jun Jul Aug Sep Oct Nov Dec Jan Feb Mar0%
20%
40%
60%
80%
100%
120%
% FTR
% FTR
Clients No. of samples dispatchedNo. of production from this
months sdr. Ftr
MAH. & MAH. 8 1 1
HAZARA 1 1 1
10
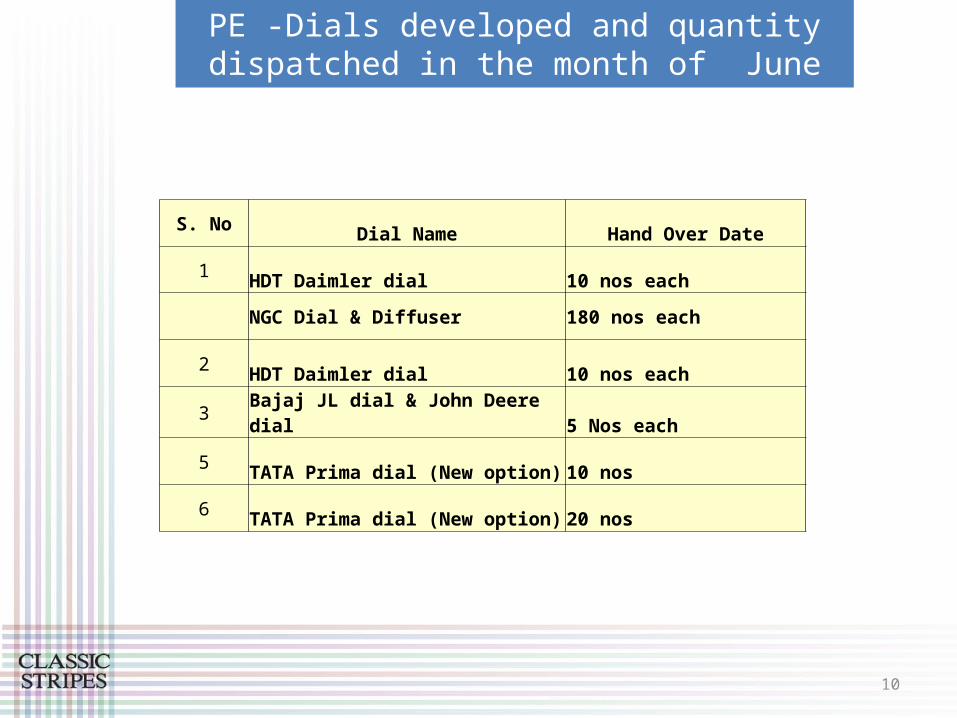
PE -Dials developed and quantity dispatched in the month of June
S. No
Dial Name Hand Over Date
1HDT Daimler dial 10 nos each
NGC Dial & Diffuser 180 nos each
2HDT Daimler dial 10 nos each
3Bajaj JL dial & John Deere dial 5 Nos each
5TATA Prima dial (New option) 10 nos
6TATA Prima dial (New option) 20 nos

11
PE - ITC samples developed in the month of June
List of jobs of JUNE 2012
SR No. JOB Customer
DATE StatusThings gone RightReceived Sales status
1 Classic Inshop- repeat order (2 artwork)repeat size ( 17.3" x 17")new size ( 22" x 14")
ITC 2-Jun PRODUCTION DONE, 11-Jun
FTR approved
2Royal Onshop, 3'X6' ITC 9-Jun Awaiting feedback Clear and well file
information
3Gold Flake red Onshop Vinyl, 3'X6'
ITC 1-JunBackground : approved Brandboad : approved Clear and well file
information
4Gold Flake red Onshop PC, 3'X6'
ITC 1-JunBackground : approved Brandboad : approved Clear and well file
information
5
Flake Filter BRANDBOARD 1) flake BB straight Printing 2) flake BB reverse Printing ITC 19-Jun
Background : approved Brandboad : approved Clear and well file
information
6 NAVY CUT ACP, 59cmx 89cm ITC 22-Jun Awaiting feedback
7 NAVY CUT Reverse printing 17" x
22" ITC 22-Jun
As per the instructions received by Nandini kindly stop all the sample developments on clear acrylic.We will not be using 3mm clear acrylic henceforth.We are going to try some alternate base material
12
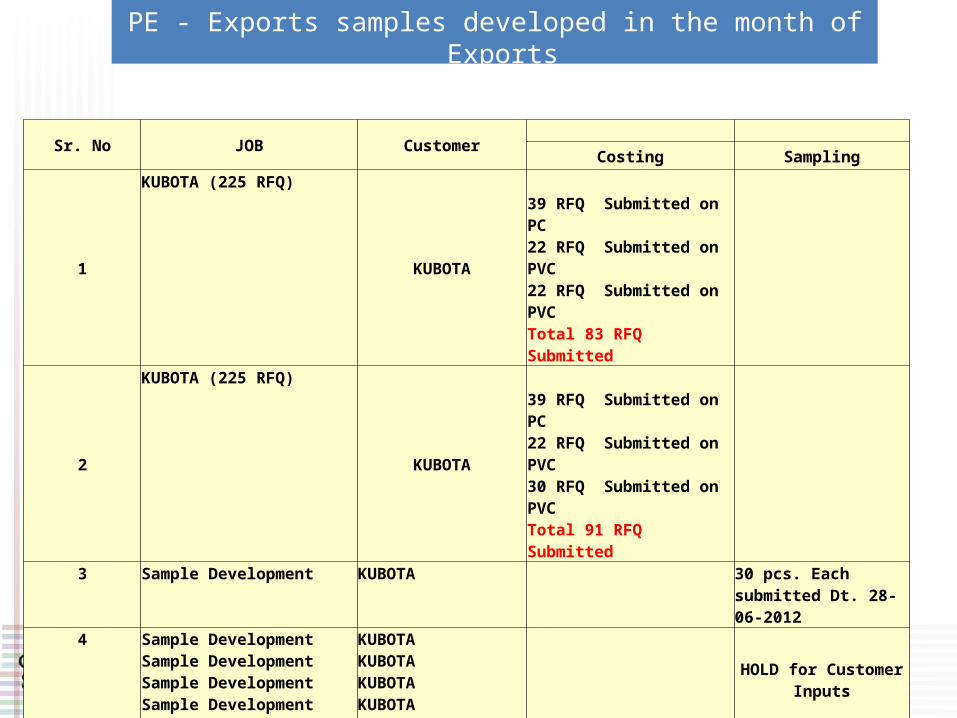
PE - Exports samples developed in the month of Exports
Sr. No JOB Customer
Costing Sampling
1
KUBOTA (225 RFQ)
KUBOTA39 RFQ Submitted on PC22 RFQ Submitted on PVC22 RFQ Submitted on PVCTotal 83 RFQ Submitted
2
KUBOTA (225 RFQ)
KUBOTA39 RFQ Submitted on PC22 RFQ Submitted on PVC30 RFQ Submitted on PVCTotal 91 RFQ Submitted
3 Sample Development KUBOTA 30 pcs. Each submitted Dt. 28-06-2012
4 Sample DevelopmentSample DevelopmentSample DevelopmentSample Development
KUBOTAKUBOTAKUBOTAKUBOTA
HOLD for Customer Inputs
PO:
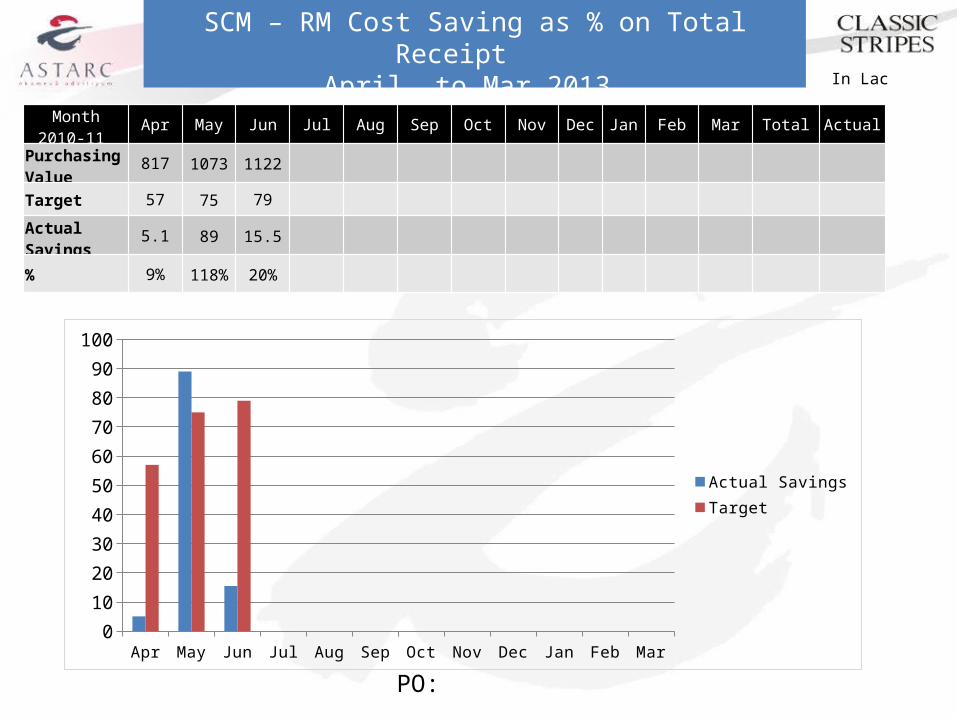
SCM – RM Cost Saving as % on Total Receipt April to Mar 2013
In Lac
Apr May Jun Jul Aug Sep Oct Nov Dec Jan Feb Mar0
10
20
30
40
50
60
70
80
90
100
Actual SavingsTarget
Month2010-11 Apr May Jun Jul Aug Sep Oct Nov Dec Jan Feb Mar Total Actual
Purchasing Value 817 1073 1122
Target 57 75 79
Actual Savings 5.1 89 15.5
% 9% 118% 20%
PO:
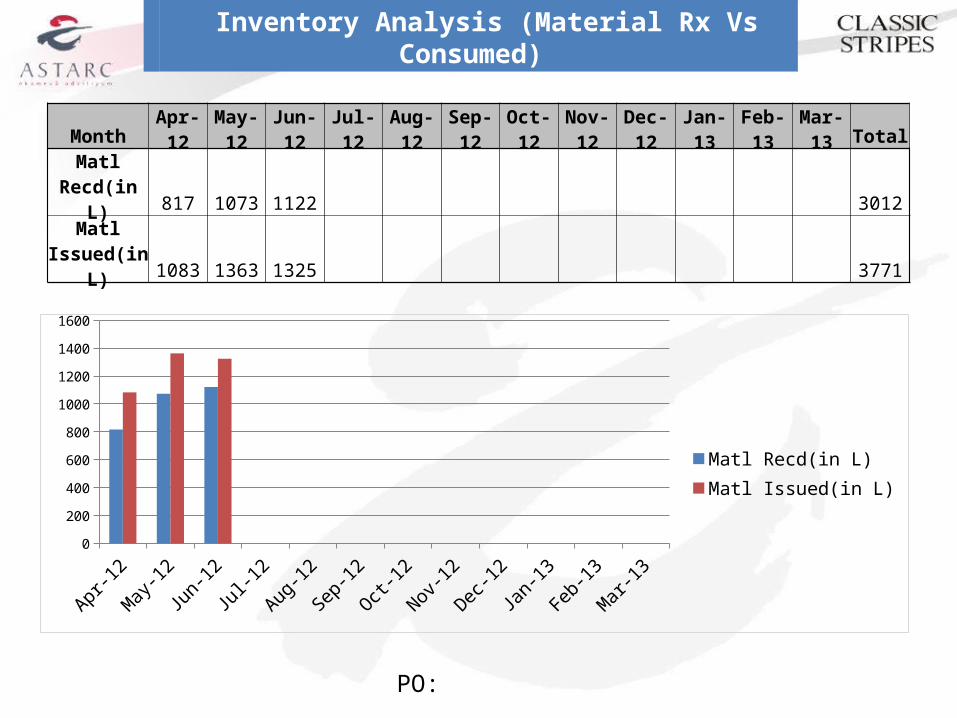
Inventory Analysis (Material Rx Vs Consumed) April to Mar 2013
Month Apr-12May-
12 Jun-12 Jul-12 Aug-12 Sep-12 Oct-12 Nov-12 Dec-12 Jan-13 Feb-13Mar-
13 TotalMatl
Recd(in L) 817 1073 1122 3012Matl
Issued(in L) 1083 1363 1325 3771
Apr-12
May-12
Jun-12Jul-1
2
Aug-12
Sep-12
Oct-12
Nov-12
Dec-12
Jan-13
Feb-13
Mar-13
0
200
400
600
800
1000
1200
1400
1600
Matl Recd(in L)Matl Issued(in L)

PO:
Inventory ValuationApril to Mar 2013
Month Apr-12 May-12 Jun-12 Jul-12 Aug-
12 Sep-12 Oct-12 Nov-12 Dec-12 Jan-
13Feb-13
Mar-13 Total
Local &Import ( Lacs)
1280 1365 1356 4001
Target 1527 1628 1845 2080 2228 2316 11624
April May June July Aug Sep Oct Nov Dec Jan Feb Mar0
500
1000
1500
2000
2500
Local &Import ( Lacs)Target
PO:
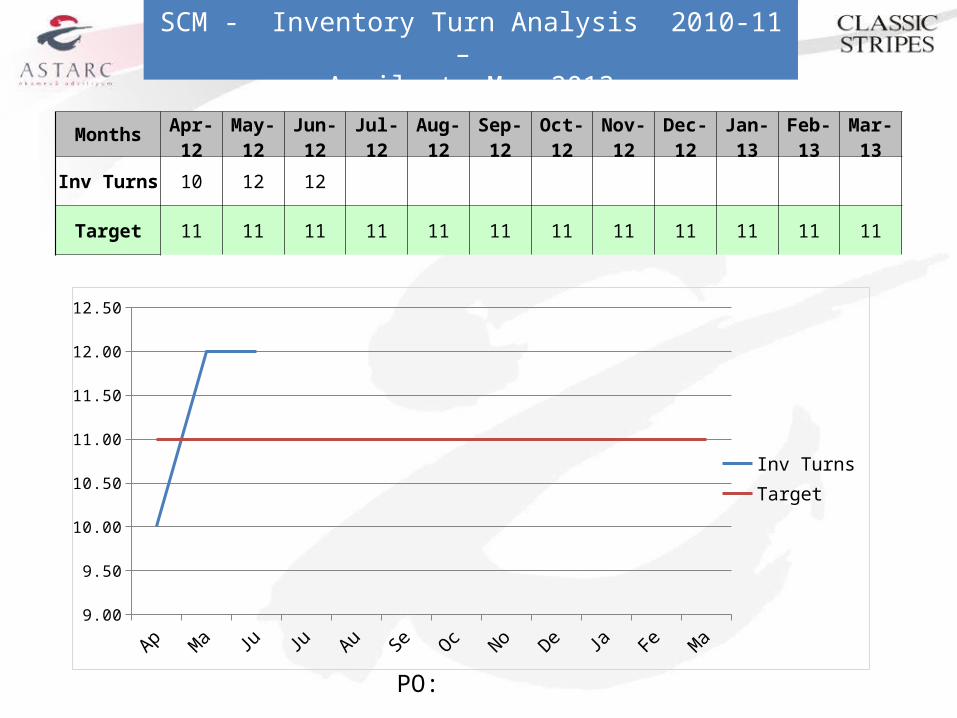
SCM - Inventory Turn Analysis 2010-11 – April to May 2013
Months Apr-12 May-12 Jun-12 Jul-12 Aug-12 Sep-12 Oct-12 Nov-12 Dec-12 Jan-13 Feb-13 Mar-13
Inv Turns 10 12 12
Target 11 11 11 11 11 11 11 11 11 11 11 11
9.00
9.50
10.00
10.50
11.00
11.50
12.00
12.50
Inv TurnsTarget
PO:
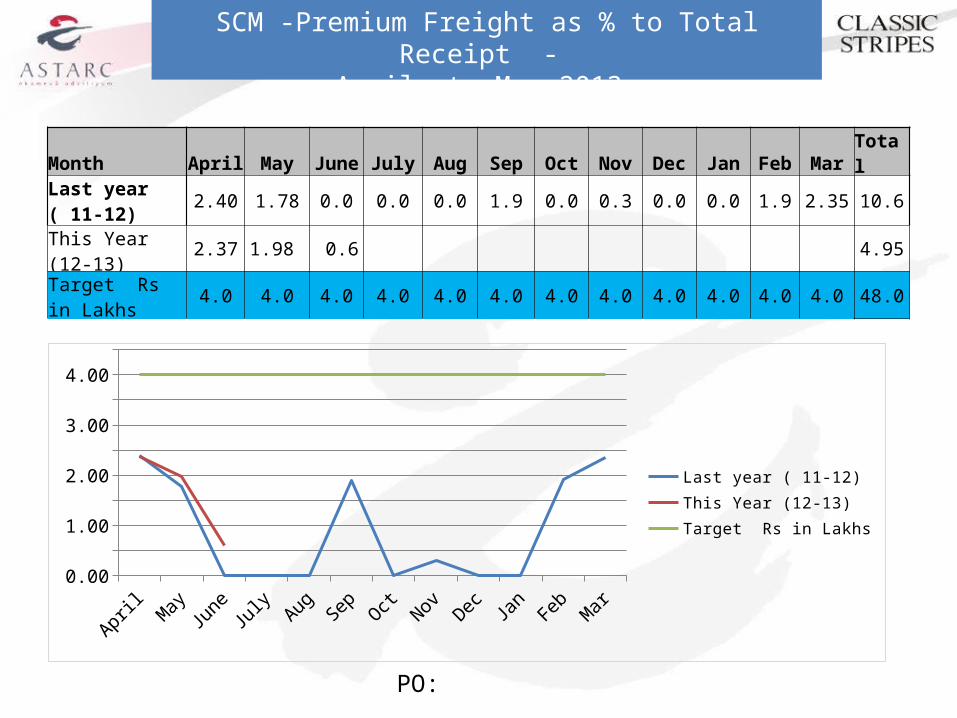
SCM -Premium Freight as % to Total Receipt - April to Mar 2013
Month April May June July Aug Sep Oct Nov Dec Jan Feb Mar
Total
Last year ( 11-12)
2.40 1.78 0.0 0.0 0.0 1.9 0.0 0.3 0.0 0.0 1.9 2.35 10.6
This Year (12-13)2.37 1.98 0.6 4.95
Target Rs in Lakhs 4.0 4.0 4.0 4.0 4.0 4.0 4.0 4.0 4.0 4.0 4.0 4.0 48.0
April May June July Aug Sep Oct Nov Dec Jan Feb Mar0.00
0.50
1.00
1.50
2.00
2.50
3.00
3.50
4.00
4.50
Last year ( 11-12)This Year (12-13)Target Rs in Lakhs

PO:
SCM - Non Moving Stock – April to Mar 2013
Description Apr-12 May-12 Jun-12 Jul-12 Aug-12 Sep-12 Oct-12 Nov-12 Dec-12 Jan-13 Feb-13 Mar-13
Base Film 49 49 49
Application Film 32 31 31
Ink 24 24 24
Grand Total 105 104 104
Target 105 102 101 98 95 93 91 88 85 81 78 75
Apr-12
May-12
Jun-12Jul-1
2
Aug-12
Sep-12
Oct-12
Nov-12
Dec-12
Jan-13
Feb-13
Mar-13
0
20
40
60
80
100
120
Grand TotalTarget

Production Planned v/s Actual ( Rs.) – April to Mar 2013
13.48
9.48 10.22 10
.92
13.66
9.88 10.70
13.44
10.07 10
.69 12.08
02468
10121416
Avg.
(11-1
2)Ap
r-1
2
May
-12
Jun-1
2
Jul-1
2
Aug
-12
Sep-1
2
Oct
-12
Nov
-12
Dec
-12
Jan-1
3
Feb-1
3
Mar
-13
Budget Prod (Rs. Crs.)
Actual Prod (Rs.Crs.)
Sales (Rs.Crs.)

On Time Delivery to Depot – April to Mar 2013
100
100
100
100
100
100
100
100
100
100
100
100
100
99.3
5
99.2
3
99.5
6
99.1
5
70
75
80
85
90
95
100
Avg. (11-12)
Apr-12 May-12 Jun-12 Jul-12 Aug-12 Sep-12 Oct-12 Nov-12 Dec-12 Jan-12 Feb-12 Mar-12
% O
TD
Target
Actual

PPC - Transportation Cost to % of Sales - April to Mar 2013
0.54
0.63 0.62
0.46
0.07
0.22 0.20
0.10
0
0.1
0.2
0.3
0.4
0.5
0.6
0.7
Avg. 11-12
Apr-12 May-12 Jun-12 Jul-12 Aug-12 Sep-12 Oct-12 Nov-12 Dec-12 Jan-13 Feb-13 Mar-13
Target Total Freight cost (%) on sale Premium Freight (%) on sale
New models AACA & K06A
New Models AANA & AAGA
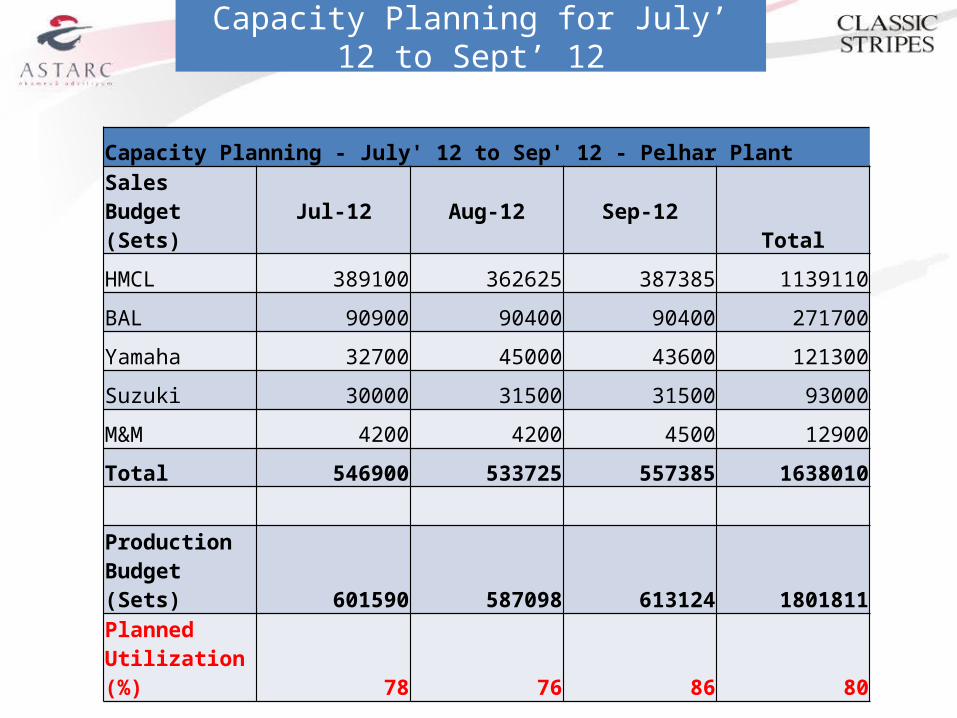
Capacity Planning for July’ 12 to Sept’ 12
Capacity Planning - July' 12 to Sep' 12 - Pelhar PlantSales Budget (Sets) Jul-12 Aug-12 Sep-12 Total
HMCL 389100 362625 387385 1139110
BAL 90900 90400 90400 271700
Yamaha 32700 45000 43600 121300
Suzuki 30000 31500 31500 93000
M&M 4200 4200 4500 12900
Total 546900 533725 557385 1638010
Production Budget (Sets) 601590 587098 613124 1801811Planned Utilization (%) 78 76 86 80
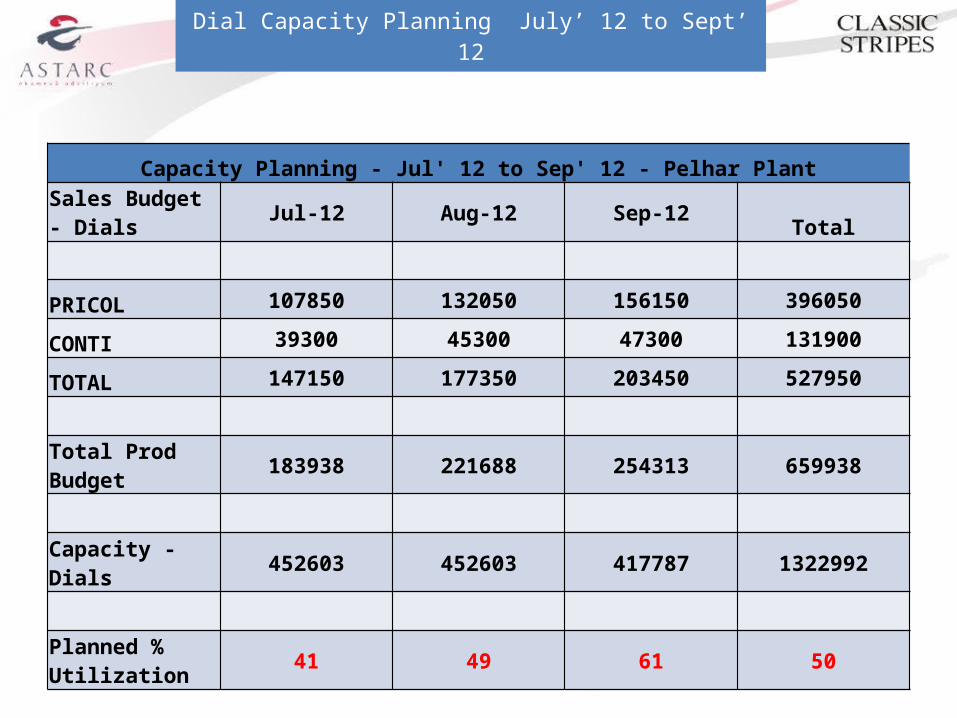
Dial Capacity Planning July’ 12 to Sept’ 12
Capacity Planning - Jul' 12 to Sep' 12 - Pelhar PlantSales Budget - Dials Jul-12 Aug-12 Sep-12 Total
PRICOL 107850 132050 156150 396050
CONTI 39300 45300 47300 131900
TOTAL 147150 177350 203450 527950
Total Prod Budget 183938 221688 254313 659938
Capacity - Dials 452603 452603 417787 1322992
Planned % Utilization 41 49 61 50
24
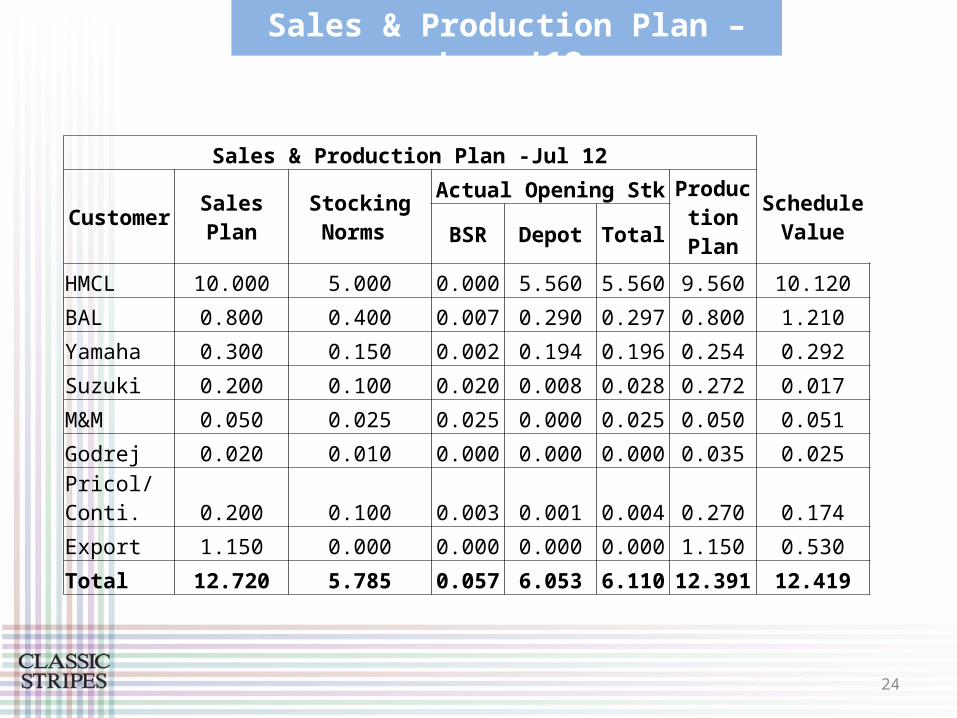
Sales & Production Plan – June ’12
Sales & Production Plan -Jul 12
Customer Sales Plan Stocking Norms
Actual Opening StkProduction Plan
Schedule ValueBSR Depot Total
HMCL 10.000 5.000 0.000 5.560 5.560 9.560 10.120
BAL 0.800 0.400 0.007 0.290 0.297 0.800 1.210
Yamaha 0.300 0.150 0.002 0.194 0.196 0.254 0.292
Suzuki 0.200 0.100 0.020 0.008 0.028 0.272 0.017
M&M 0.050 0.025 0.025 0.000 0.025 0.050 0.051
Godrej 0.020 0.010 0.000 0.000 0.000 0.035 0.025Pricol/Conti. 0.200 0.100 0.003 0.001 0.004 0.270 0.174
Export 1.150 0.000 0.000 0.000 0.000 1.150 0.530
Total 12.720 5.785 0.057 6.053 6.110 12.391 12.419
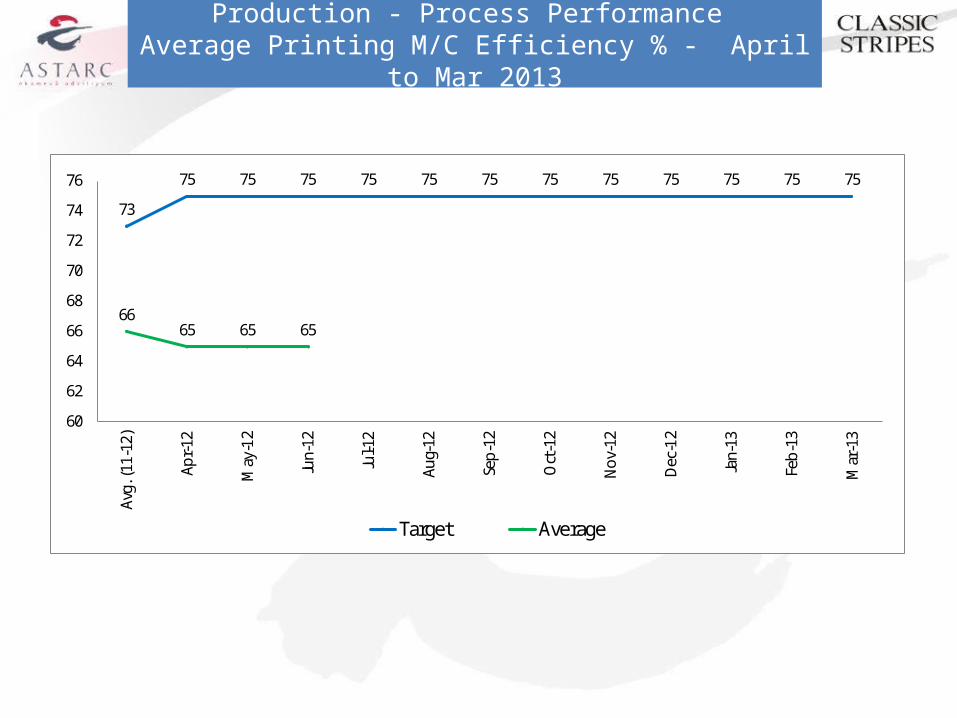
Production - Process Performance Average Printing M/C Efficiency % - April to Mar 2013
73
75 75 75 75 75 75 75 75 75 75 75 75
6665 65 65
60
62
64
66
68
70
72
74
76
Avg.
(11-
12)
Apr-
12
May
-12
Jun-
12
Jul-1
2
Aug-
12
Sep-
12
Oct
-12
Nov
-12
Dec
-12
Jan-
13
Feb-
13
Mar
-13
Target Average
26
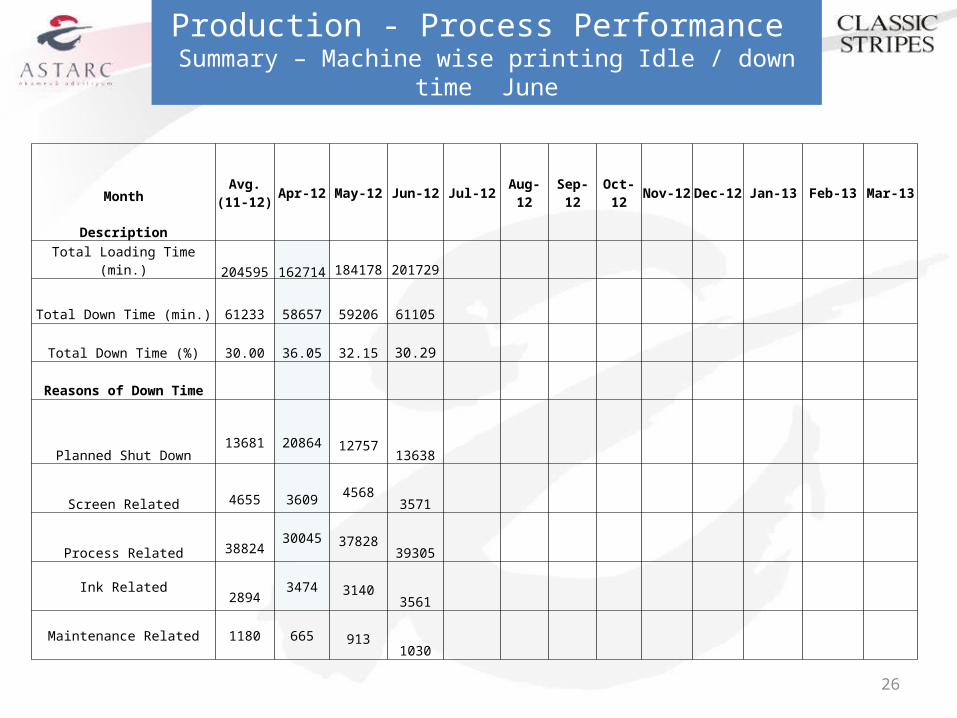
Production - Process Performance Summary – Machine wise printing Idle / down time June
Month
Description
Avg. (11-12)
Apr-12 May-12 Jun-12 Jul-12 Aug-12Sep-12 Oct-12
Nov-12
Dec-12
Jan-13 Feb-13 Mar-13
Total Loading Time (min.) 204595 162714 184178 201729
Total Down Time (min.) 61233 58657 59206 61105
Total Down Time (%) 30.00 36.05 32.15 30.29
Reasons of Down Time
Planned Shut Down13681 20864 12757
13638
Screen Related 4655 36094568
3571
Process Related 3882430045 37828
39305
Ink Related2894
3474 31403561
Maintenance Related 1180 665 9131030
27
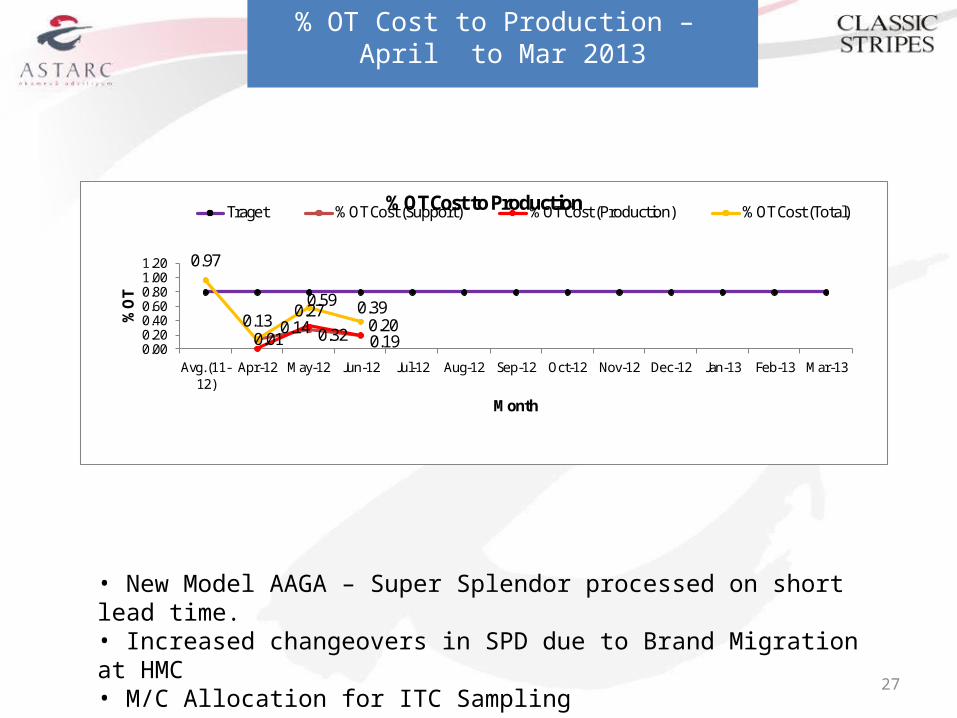
% OT Cost to Production – April to Mar 2013
• New Model AAGA – Super Splendor processed on short lead time.• Increased changeovers in SPD due to Brand Migration at HMC• M/C Allocation for ITC Sampling
0.13 0.27
0.190.01 0.32 0.20
0.97
0.14
0.59 0.39
0.000.200.400.600.801.001.20
Avg. (11-12)
Apr-12 May-12 Jun-12 Jul-12 Aug-12 Sep-12 Oct-12 Nov-12 Dec-12 Jan-13 Feb-13 Mar-13
% OT
Month
% OT Cost to ProductionTraget % OT Cost (Support) % OT Cost (Production) % OT Cost (Total)
28
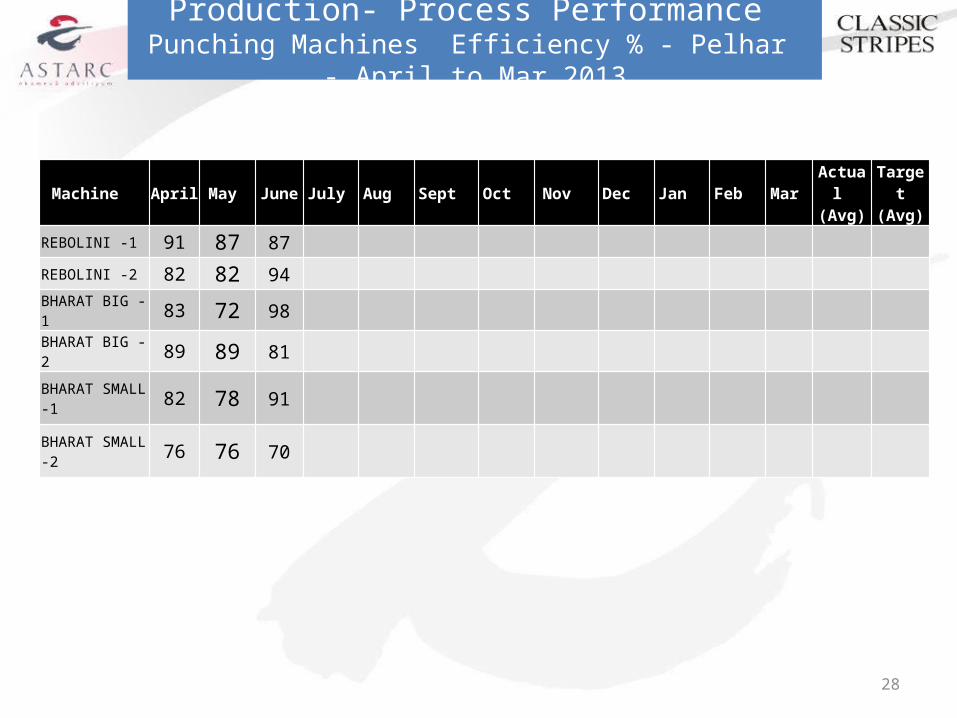
Production- Process Performance Punching Machines Efficiency % - Pelhar - April to Mar 2013
Machine April May June July Aug Sept Oct Nov Dec Jan Feb Mar Actual (Avg)
Target (Avg)
REBOLINI -1 91 87 87
REBOLINI -2 82 82 94
BHARAT BIG -1 83 72 98
BHARAT BIG -2 89 89 81
BHARAT SMALL -1
82 78 91
BHARAT SMALL -2
76 76 70
29
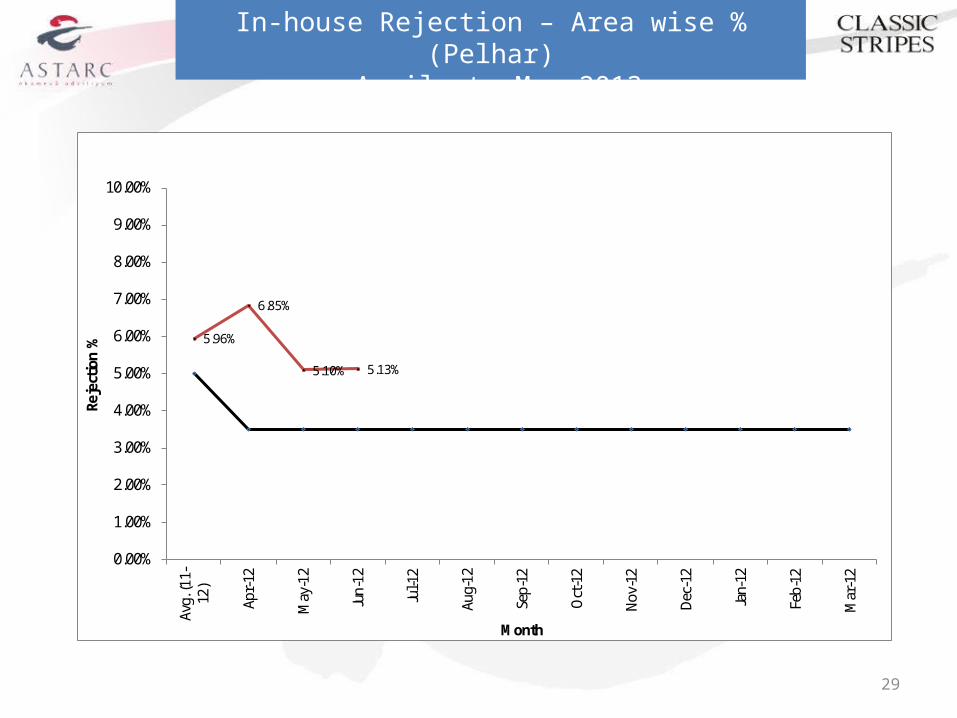
In-house Rejection – Area wise % (Pelhar) April to Mar 2013
5.96%
6.85%
5.10% 5.13%
0.00%
1.00%
2.00%
3.00%
4.00%
5.00%
6.00%
7.00%
8.00%
9.00%
10.00%Av
g. (1
1-12
)
Apr-
12
May
-12
Jun-
12
Jul-1
2
Aug-
12
Sep-
12
Oct
-12
Nov-
12
Dec-
12
Jan-
12
Feb-
12
Mar
-12
Rejection %
Month

30
In-house Rejection – Value wise % April to Mar 2013
Targ
et
Apr
May Jun Jul
Aug
Sep
Oct
Nov Dec Jan
Feb
Mar
0.001.002.003.004.005.006.007.008.009.00
10.00
8.007.19
9.44
8.13
Unit 1PelharHaridwar
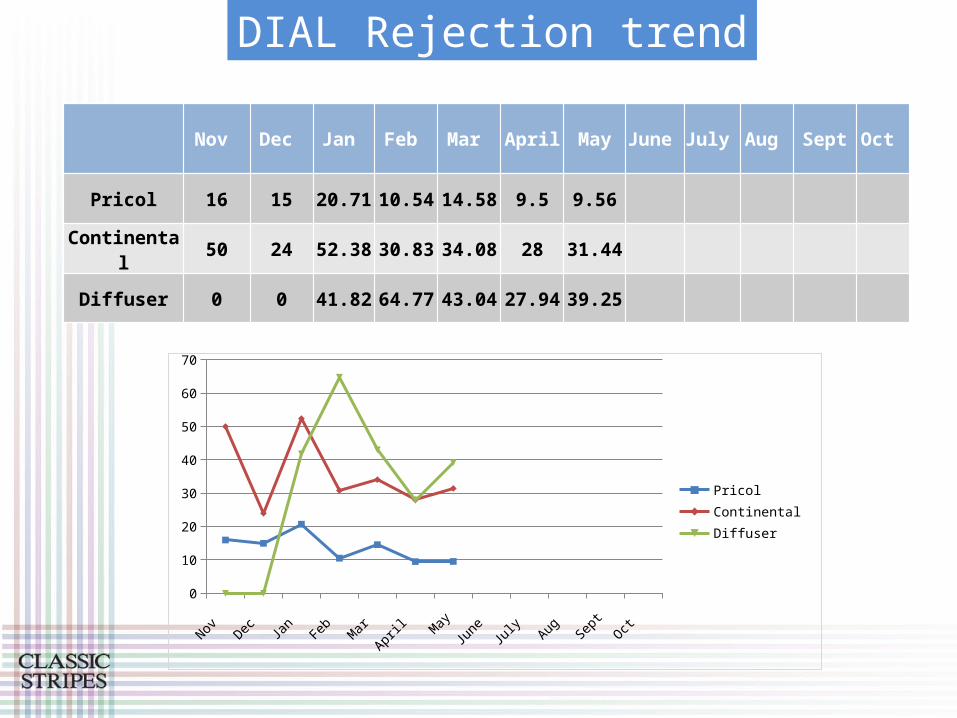
DIAL Rejection trend
Nov Dec Jan Feb Mar April May June July Aug Sept Oct
Pricol 16 15 20.71 10.54 14.58 9.5 9.56
Continental 50 24 52.38 30.83 34.08 28 31.44
Diffuser 0 0 41.82 64.77 43.04 27.94 39.25
Nov Dec Jan Feb Mar April May June July Aug Sept Oct 0
10
20
30
40
50
60
70
Pricol Continental Diffuser
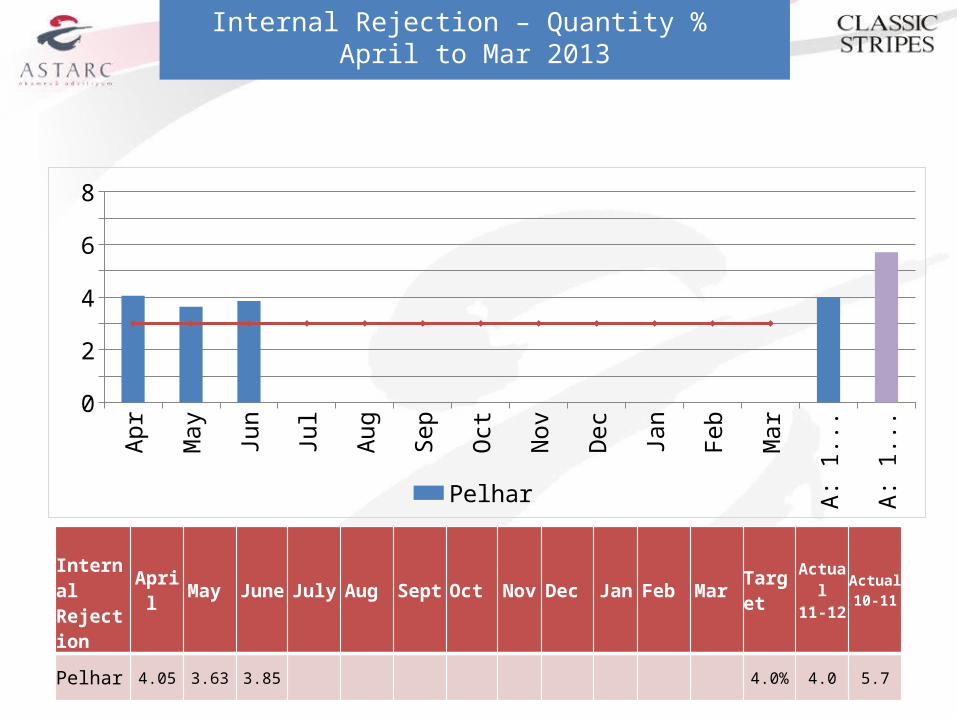
Internal Rejection – Quantity % April to Mar 2013
Apr
May Jun Jul
Aug
Sep
Oct
Nov Dec Jan
Feb
Mar
A: 1
1-12
A: 1
0-11
012345678
Pelhar Target
Internal Rejection
April May June July Aug Sept Oct Nov Dec Jan Feb Mar Target Actual11-12
Actual 10-11
Pelhar 4.05 3.63 3.85 4.0% 4.0 5.7
33
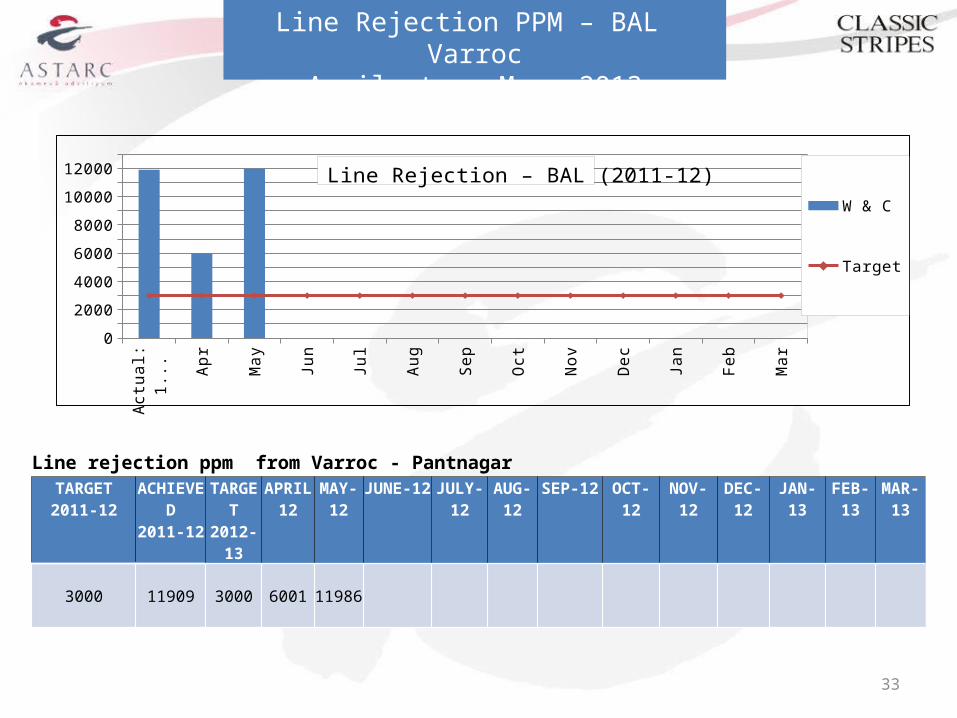
Line Rejection PPM – BAL VarrocApril to Mar 2013
Actu
al:
11-
12 Apr
May Jun Jul
Aug
Sep
Oct
Nov
Dec Jan
Feb
Mar
0
2000
4000
6000
8000
10000
12000
W & C
Target
Line Rejection – BAL (2011-12)
Line rejection ppm from Varroc - PantnagarTARGET2011-12
ACHIEVED2011-12
TARGET2012-13
APRIL 12
MAY-12
JUNE-12 JULY-12 AUG-12
SEP-12 OCT-12 NOV-12 DEC-12 JAN-13 FEB-13 MAR-13
3000 11909 3000 6001 11986
34
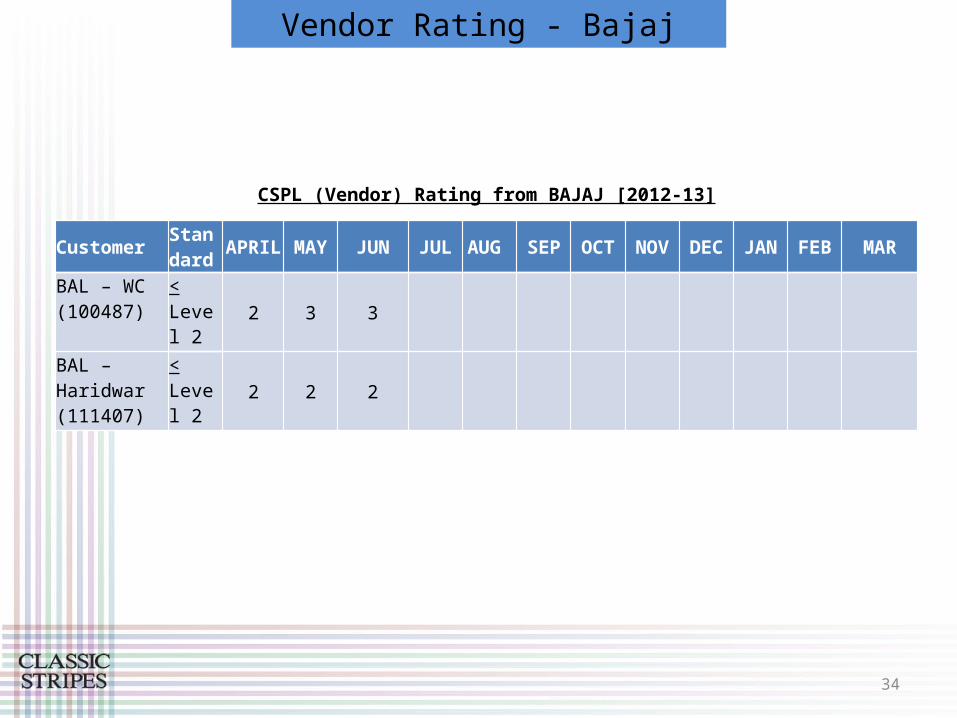
Vendor Rating - Bajaj
CSPL (Vendor) Rating from BAJAJ [2012-13]
Customer Standard APRIL MAY JUN JUL AUG SEP OCT NOV DEC JAN FEB MAR
BAL – WC (100487)
< Level 2
2 3 3
BAL – Haridwar (111407)
< Level 2
2 2 2
35
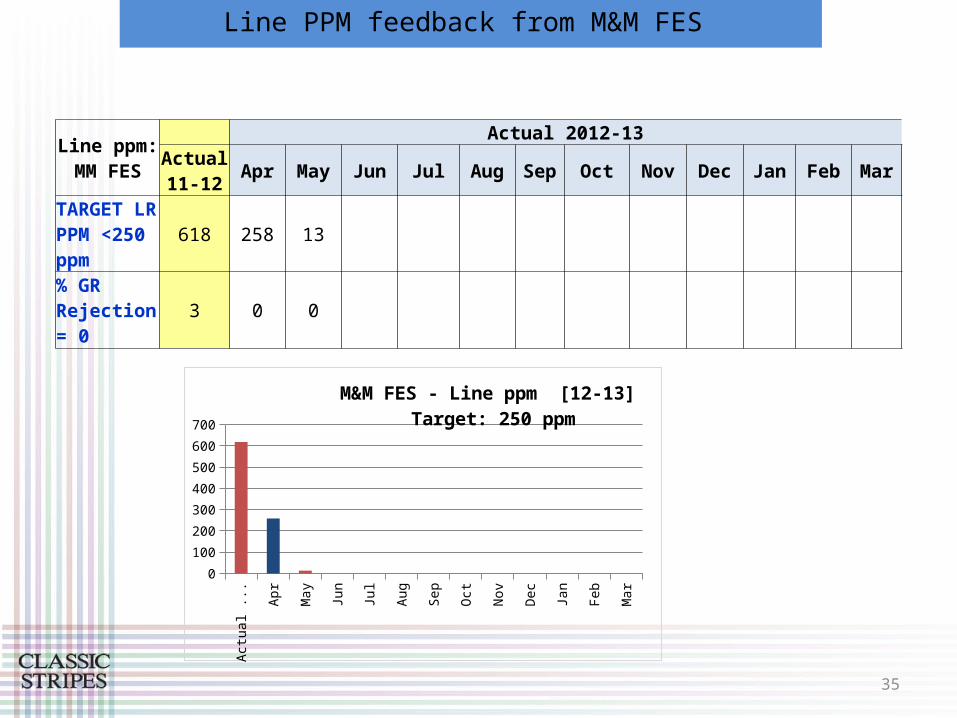
Line PPM feedback from M&M FES
Line ppm: MM FES
Actual 2012-13Actual 11-12 Apr May Jun Jul Aug Sep Oct Nov Dec Jan Feb Mar
TARGET LR PPM <250 ppm
618 258 13
% GR Rejection = 0 3 0 0
Actu
al 1
1-12 Ap
r
May Jun Jul
Aug
Sep
Oct
Nov
Dec
Jan
Feb
Mar
0
100
200
300
400
500
600
700
M&M FES - Line ppm [12-13] Target: 250 ppm
36
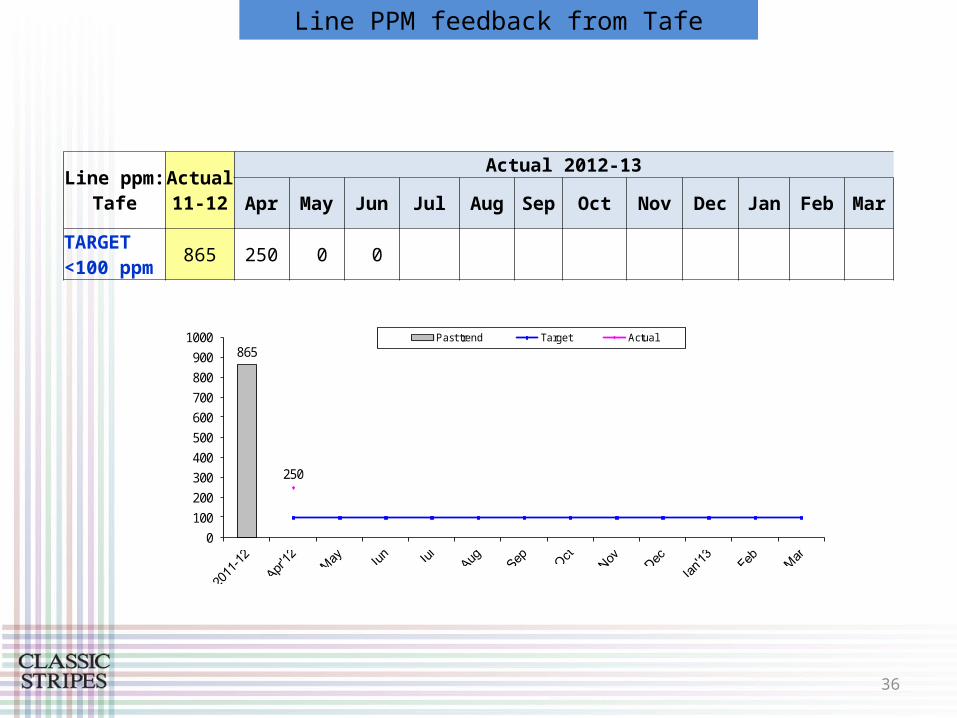
Line PPM feedback from Tafe
Line ppm: Tafe
Actual 11-12
Actual 2012-13
Apr May Jun Jul Aug Sep Oct Nov Dec Jan Feb Mar
TARGET <100 ppm 865 250 0 0
865
250
0
100
200
300
400
500
600
700
800
900
1000 Past trend Target Actual
37
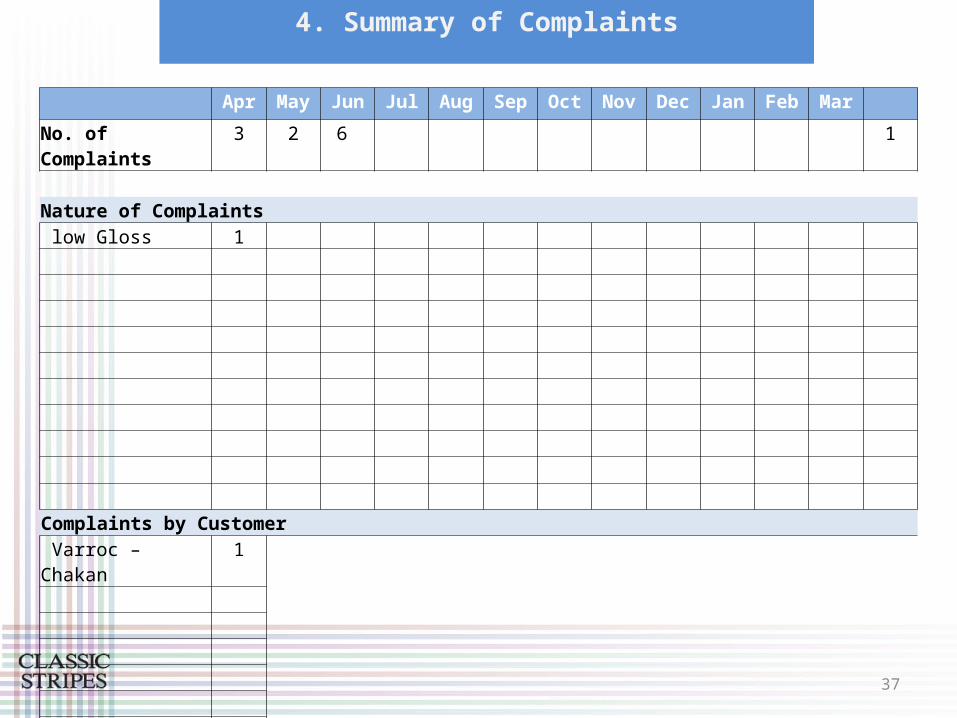
4. Summary of Complaints
Apr May Jun Jul Aug Sep Oct Nov Dec Jan Feb Mar
No. of Complaints 3 2 6 1 Nature of Complaints low Gloss 1 Complaints by Customer Varroc – Chakan 1
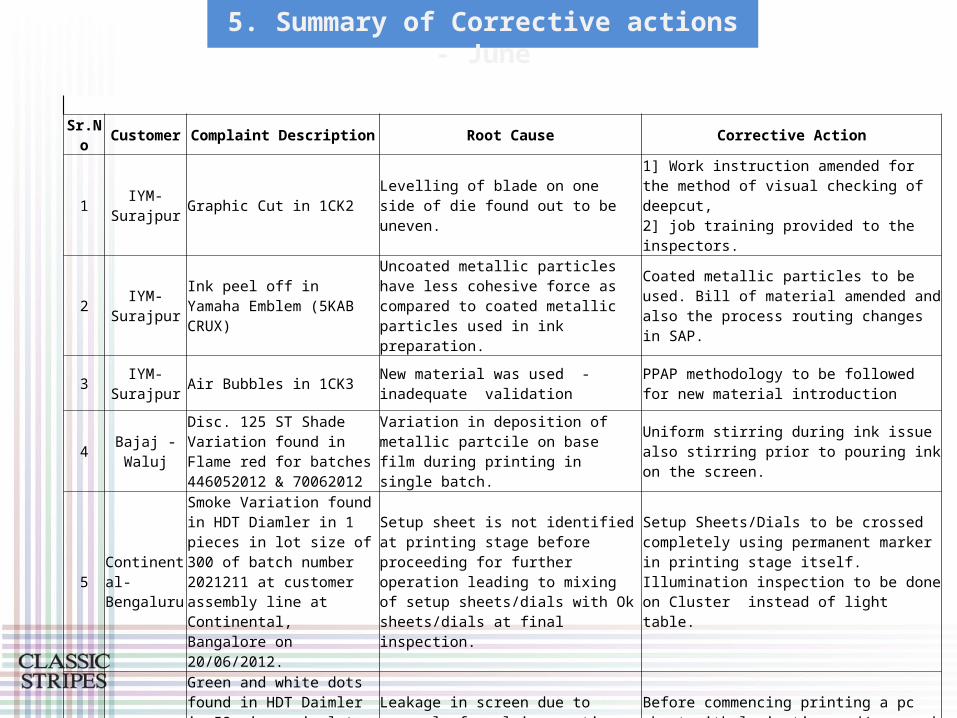
Sr.No Customer Complaint Description Root Cause Corrective Action
1 IYM-Surajpur Graphic Cut in 1CK2 Levelling of blade on one side of die
found out to be uneven.
1] Work instruction amended for the method of visual checking of deepcut,2] job training provided to the inspectors.
2 IYM-Surajpur
Ink peel off in Yamaha Emblem (5KAB CRUX)
Uncoated metallic particles have less cohesive force as compared to coated metallic particles used in ink preparation.
Coated metallic particles to be used. Bill of material amended and also the process routing changes in SAP.
3 IYM-Surajpur Air Bubbles in 1CK3 New material was used - inadequate
validationPPAP methodology to be followed for new material introduction
4 Bajaj - Waluj
Disc. 125 ST Shade Variation found in Flame red for batches 446052012 & 70062012
Variation in deposition of metallic partcile on base film during printing in single batch.
Uniform stirring during ink issue also stirring prior to pouring ink on the screen.
5 Continental-Bengaluru
Smoke Variation found in HDT Diamler in 1 pieces in lot size of 300 of batch number 2021211 at customer assembly line at Continental, Bangalore on 20/06/2012.
Setup sheet is not identified at printing stage before proceeding for further operation leading to mixing of setup sheets/dials with Ok sheets/dials at final inspection.
Setup Sheets/Dials to be crossed completely using permanent marker in printing stage itself.Illumination inspection to be done on Cluster instead of light table.
6 Continental-Bengaluru
Green and white dots found in HDT Daimler in 59 pieces in lot size of 300 of batch number 2021211 at customer assembly line at Continental, Bangalore on 20/06/2012.
Leakage in screen due to removal of emulsion coating from non image area leading to green and grey ink transfer on image area while printing 5th Colour and 6th colour respectively
Before commencing printing a pc sheet with lamination and/or rough pc sheet will be printed and checked for ink leakage and same will be done after every 100th and for last sheet and leakages if any will be touched up by PVA
5. Summary of Corrective actions - June
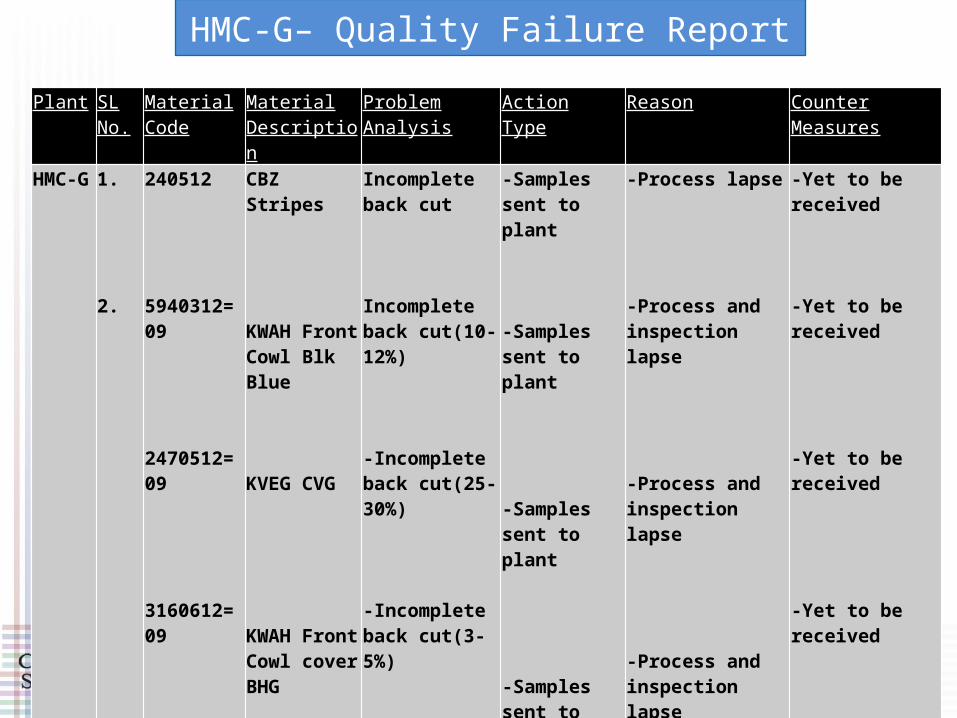
HMC-G– Quality Failure ReportPlant SL
No.Material Code
Material Description
Problem Analysis Action Type Reason Counter Measures
HMC-G 1.
2.
240512
5940312=09
2470512=09
3160612=09
CBZ Stripes
KWAH Front Cowl Blk Blue
KVEG CVG
KWAH Front Cowl cover BHG
Incomplete back cut
Incomplete back cut(10-12%)
-Incomplete back cut(25-30%)
-Incomplete back cut(3-5%)
-Samples sent to plant
-Samples sent to plant
-Samples sent to plant
-Samples sent to plant
-Process lapse
-Process and inspection lapse
-Process and inspection lapse
-Process and inspection lapse
-Yet to be received
-Yet to be received
-Yet to be received
-Yet to be received
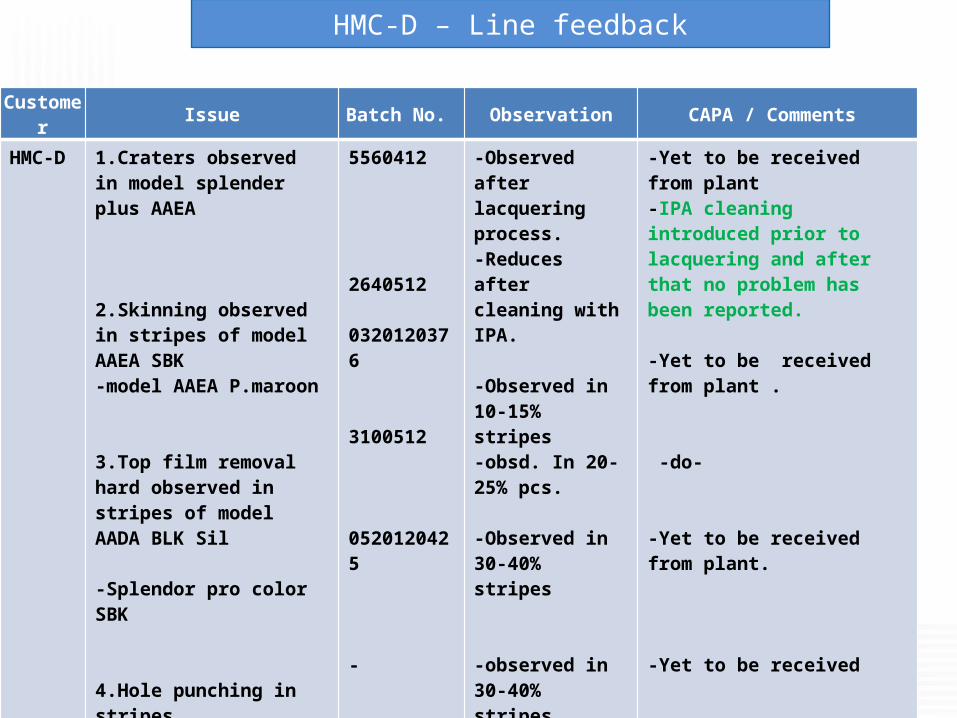
HMC-D – Line feedback
Customer Issue Batch No. Observation CAPA / Comments HMC-D 1.Craters observed in model
splender plus AAEA
2.Skinning observed in stripes of model AAEA SBK -model AAEA P.maroon
3.Top film removal hard observed in stripes of model AADA BLK Sil
-Splendor pro color SBK
4.Hole punching in stripes
5.Incomplete back cut at tab location in side cover color SBK
5560412
2640512
0320120376
3100512
0520120425
-
0520120425
-Observed after lacquering process.-Reduces after cleaning with IPA.
-Observed in 10-15% stripes -obsd. In 20-25% pcs.
-Observed in 30-40% stripes
-observed in 30-40% stripes
-Repeated problem & Observed in the materials belonging to march 12
-Observed in 30-35% pcs.
-Yet to be received from plant -IPA cleaning introduced prior to lacquering and after that no problem has been reported.
-Yet to be received from plant .
-do-
-Yet to be received from plant.
-Yet to be received
-Inform to all concerned with compiled data.
-Yet to be received.

Customer Line feedback-Yamaha SP
Customer Issue Batch No. Observation CAPA / Comments IYM-SP 1.Ink peel off in yamaha
emblem model 5KA
2.Craters in stripes of model 1CK3
5470412
0120120743
-Ink peel off while removal of top application film
-Problem repeated
-Problem observed at edges in different locations after lacquering
-Submitted on 23.04.2012
-Submitted on 26.06.2012-Fresh batch yet to be delivered
-Submitted on 26.06.2012-Fresh batch after c/m yet to be received
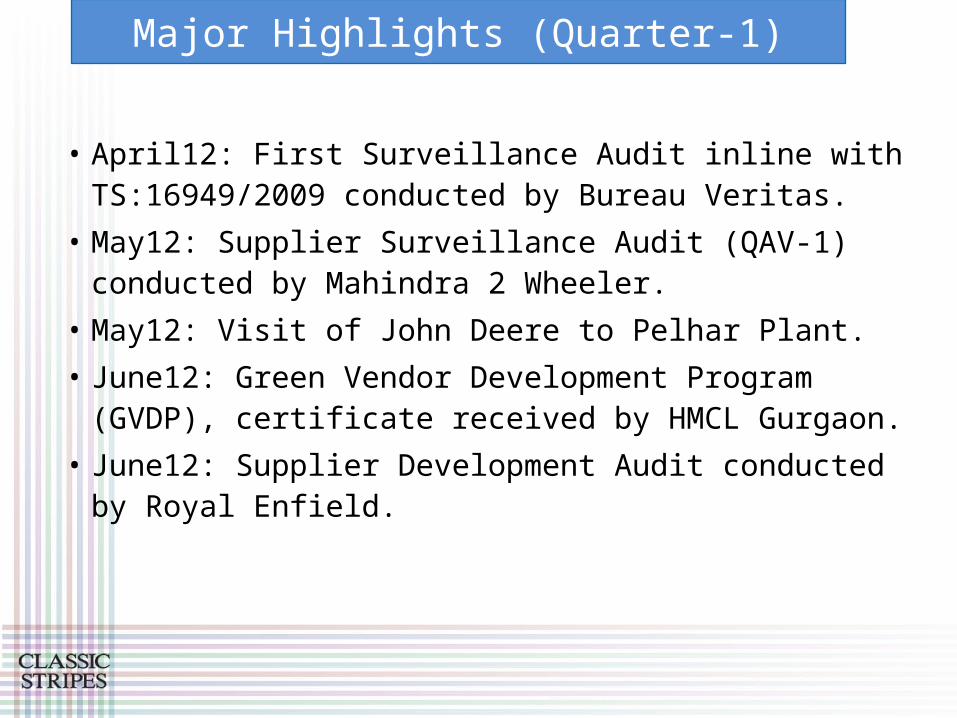
Major Highlights (Quarter-1)
• April12: First Surveillance Audit inline with TS:16949/2009 conducted by Bureau Veritas.
• May12: Supplier Surveillance Audit (QAV-1) conducted by Mahindra 2 Wheeler.
• May12: Visit of John Deere to Pelhar Plant.• June12: Green Vendor Development Program
(GVDP), certificate received by HMCL Gurgaon.• June12: Supplier Development Audit conducted
by Royal Enfield.
43
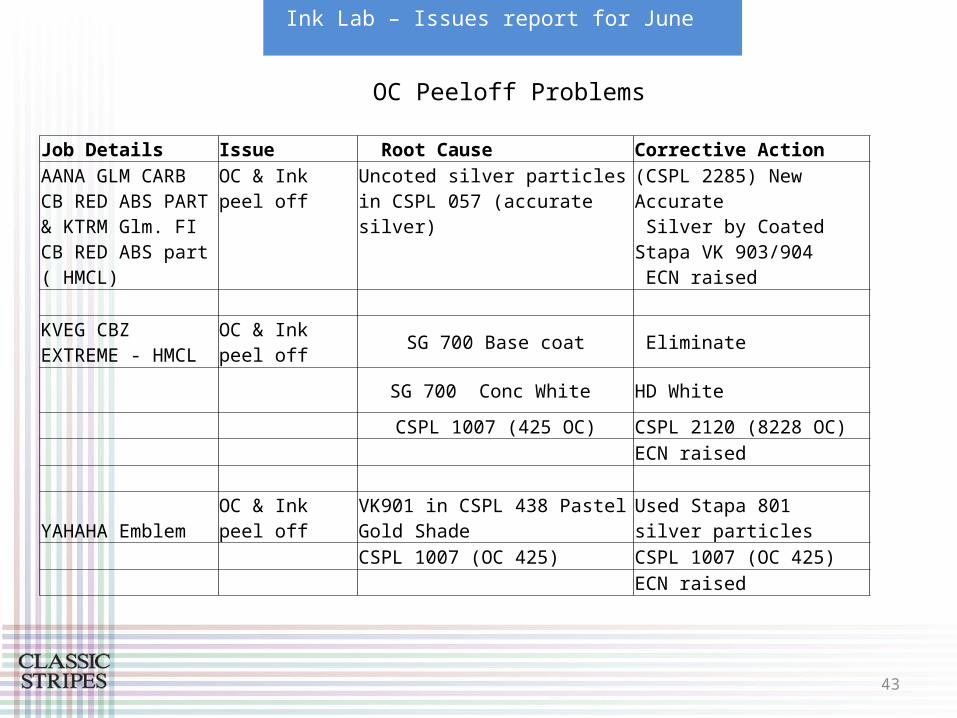
Ink Lab – Issues report for June
Job Details Issue Root Cause Corrective Action AANA GLM CARB CB RED ABS PART & KTRM Glm. FI CB RED ABS part ( HMCL)
OC & Ink peel off Uncoted silver particles in CSPL 057 (accurate silver)
(CSPL 2285) New Accurate Silver by Coated Stapa VK 903/904 ECN raised
KVEG CBZ EXTREME - HMCL
OC & Ink peel off SG 700 Base coat Eliminate
SG 700 Conc White HD White
CSPL 1007 (425 OC) CSPL 2120 (8228 OC) ECN raised
YAHAHA Emblem OC & Ink peel offVK901 in CSPL 438 Pastel Gold Shade Used Stapa 801 silver particles
CSPL 1007 (OC 425) CSPL 1007 (OC 425) ECN raised
OC Peeloff Problems

44
Ink Lab – OC Wastage for June
PO no. Machine Description Qty. 8600 OC Wastage Qty.Kg
% Wastage OC Average
100068194 SPS-XP KWAH BLK H. GREY F/COWL (T-3) [4 SETS] 2000 8.8 1.781 20.20%
100068200 SPS-XP BAJAJ DISC 125ST BLK RED SEAT/FR.COWL(1S 2000 16 3.6 22.50%
100068001 SPS-XP KTPJ C.B.RED T-2 FUC 'A', BC 'A' (1SET) 2600 11.2 2.544 22.70%
100068691 SPS-XP BAJAJ DISC 125ST BLK RED SEAT/FR.COWL(1S 1860 6.4 1.384 21.50%
100068615 ATMA-6 EXPORT 1000 5.8 1.19 20.50%
100070565 ATMA-6 EXPORT 500 4.5 1 22.20% 21.65%
PO no. Machine Description Qty. CSPL 2120 of NazdarWastage Qty.Kg
% Wastage OC Average
100067055 SPS-XP AACA PASSION PRO BLK H.GREY SC (2SETS) 2272 10.5 2.44 23.20%
100068298 SPS-XP AAFA SPL.NXG BLK RED ABS PARTS(1SET) 3000 16.8 4.27 25.40%
100067415 SPS-XP AACA[PASS.PRO]BLK H.GREY ABS (1SET) 2300 11.2 3.5 31.25%
100068271 SPS-XP BAJAJ PULSAR 135 RED ABS(4SETS) 600 3.5 1.2 34.20%
100068001 SPS-XP KTPJ C.B.RED T-2 FUC 'A', BC 'A' (1SET) 1100 5.6 1 17.80%
100068604 SPS-XP KWAH BLK RED/BLUE /H.GREY R/COWL(5SETS) 2500 14.4 3.4 23.60% 26%
45
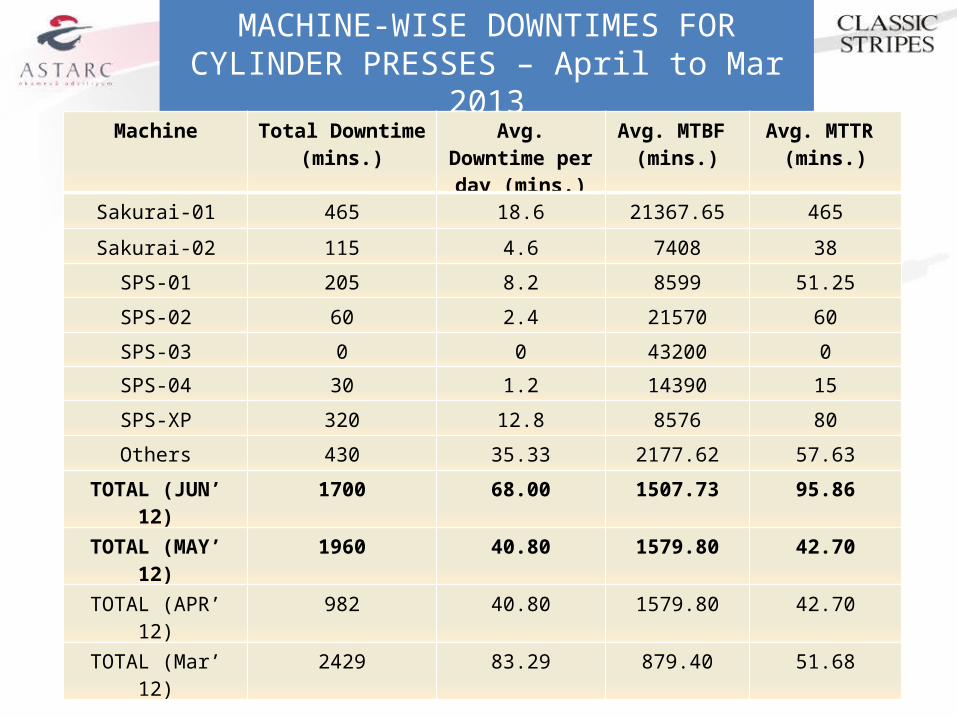
MACHINE-WISE DOWNTIMES FOR CYLINDER PRESSES – April to Mar 2013
MTBF – Mean Time Between Failures; MTTR – Mean Time To RepairDowntime for Rolt is not considered as there are some manufacturing defects which lead to downtimes.
Machine Total Downtime(mins.)
Avg. Downtime per day (mins.)
Avg. MTBF (mins.)
Avg. MTTR (mins.)
Sakurai-01 465 18.6 21367.65 465
Sakurai-02 115 4.6 7408 38
SPS-01 205 8.2 8599 51.25
SPS-02 60 2.4 21570 60
SPS-03 0 0 43200 0
SPS-04 30 1.2 14390 15
SPS-XP 320 12.8 8576 80
Others 430 35.33 2177.62 57.63
TOTAL (JUN’ 12) 1700 68.00 1507.73 95.86
TOTAL (MAY’ 12) 1960 40.80 1579.80 42.70
TOTAL (APR’ 12) 982 40.80 1579.80 42.70
TOTAL (Mar’ 12) 2429 83.29 879.40 51.68
46
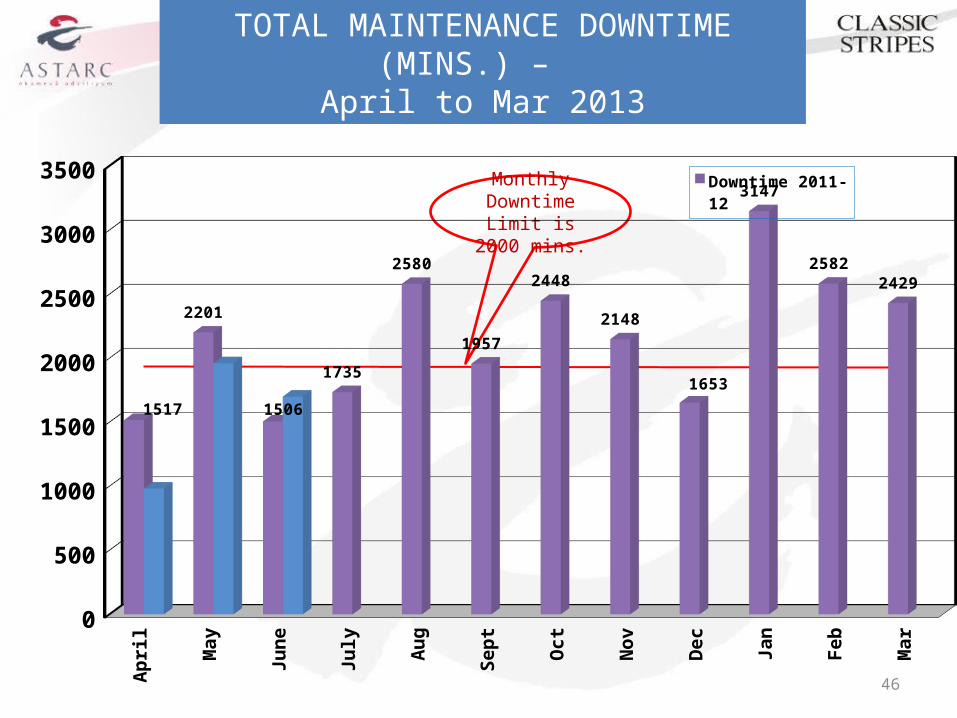
TOTAL MAINTENANCE DOWNTIME (MINS.) – April to Mar 2013
Monthly Downtime Limit
is 2000 mins.
Ap
ril
Ma
y
Ju
ne
Ju
ly
Au
g
Se
pt
Oc
t
No
v
De
c
Ja
n
Fe
b
Ma
r0
500
1000
1500
2000
2500
3000
3500
1517
2201
1506
1735
2580
1957
2448
2148
1653
3147
25822429
Downtime 2011-12
Downtime 2012-13
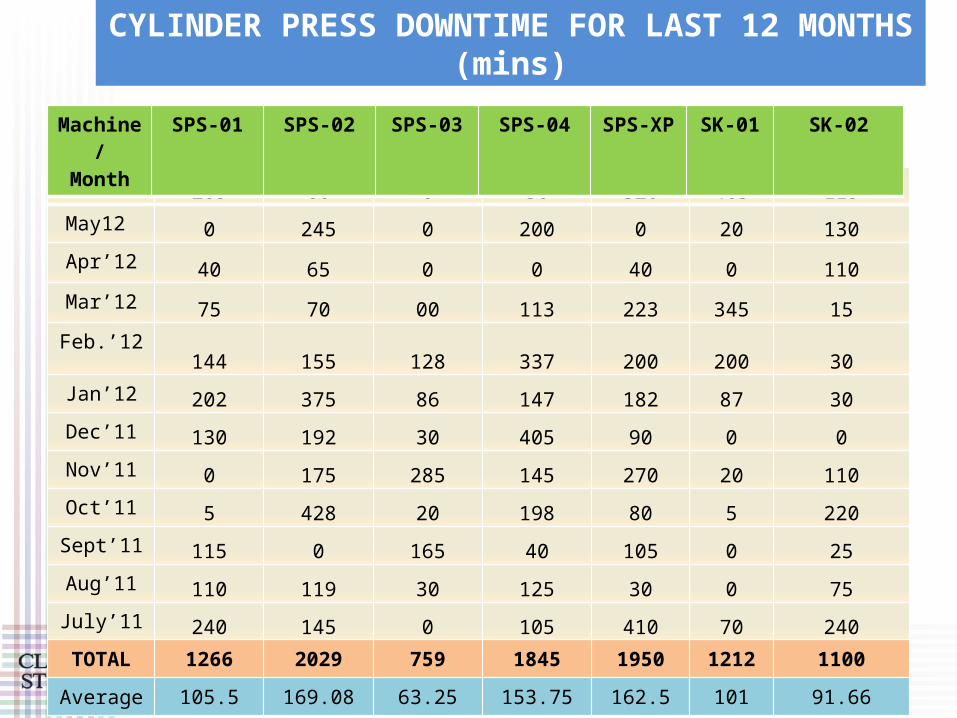
June12 205 60 0 30 320 465 115May12
0 245 0 200 0 20 130Apr’12
40 65 0 0 40 0 110Mar’12
75 70 00 113 223 345 15Feb.’12
144 155 128 337 200 200 30Jan’12
202 375 86 147 182 87 30Dec’11
130 192 30 405 90 0 0Nov’11
0 175 285 145 270 20 110Oct’11
5 428 20 198 80 5 220Sept’11
115 0 165 40 105 0 25Aug’11
110 119 30 125 30 0 75July’11
240 145 0 105 410 70 240TOTAL 1266 2029 759 1845 1950 1212 1100
Average 105.5 169.08 63.25 153.75 162.5 101 91.66
Machine/Month
SPS-01 SPS-02 SPS-03 SPS-04 SPS-XP SK-01 SK-02
CYLINDER PRESS DOWNTIME FOR LAST 12 MONTHS (mins)
48
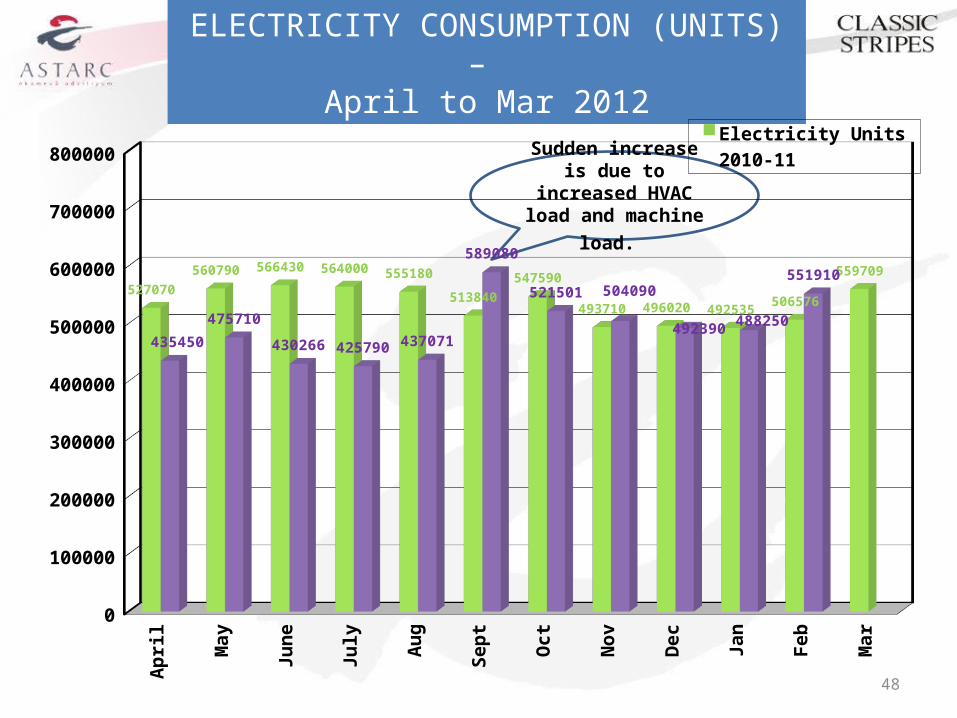
ELECTRICITY CONSUMPTION (UNITS) – April to Mar 2012
Sudden increase is due to increased HVAC load and machine load.
Ap
ril
Ma
y
Ju
ne
Ju
ly
Au
g
Se
pt
Oc
t
No
v
De
c
Ja
n
Fe
b
Ma
r0
100000
200000
300000
400000
500000
600000
700000
800000
527070
560790 566430 564000 555180
513840
547590
493710 496020 492535506576
559709
435450
475710
430266 425790 437071
589080
521501 504090
492390 488250
551910
Electricity Units 2010-11
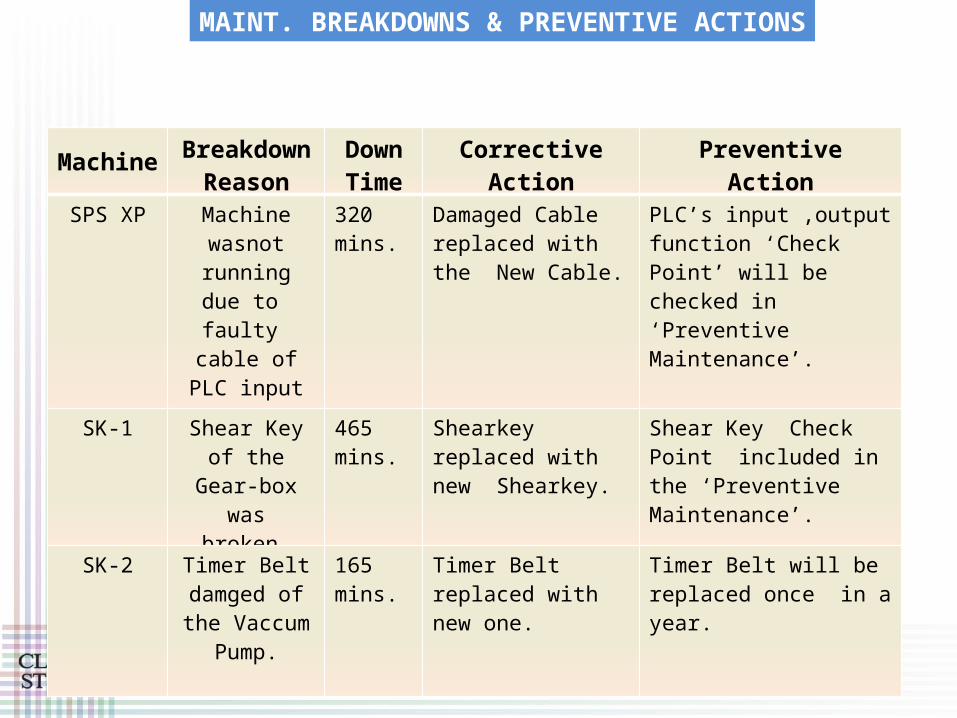
MAINT. BREAKDOWNS & PREVENTIVE ACTIONS
Machine Breakdown Reason
DownTime Corrective Action Preventive Action
SPS XP Machine wasnot running due to faulty cable of PLC
input Contacts..
320 mins.
Damaged Cable replaced with the New Cable.
PLC’s input ,output function ‘Check Point’ will be checked in ‘Preventive Maintenance’.
SK-1 Shear Key of the Gear-box was broken.
465 mins.
Shearkey replaced with new Shearkey.
Shear Key Check Point included in the ‘Preventive Maintenance’.
SK-2 Timer Belt damged of the Vaccum Pump.
165 mins.
Timer Belt replaced with new one.
Timer Belt will be replaced once in a year.

50
SALES (RS.) PER ELECTRICAL UNIT – April to Mar 2013
Ap
ril
Ma
y
Ju
ne
Ju
ly
Au
g
Se
pt
Oc
t
No
v
De
c
Ja
n
Fe
b
Ma
r0
50
100
150
200
250
300
350
400
450
500 Sales (Rs.) per Electrical Unit 2011-12Sales (Rs.) per Electrical Unit 2012-13
Monthly Target for Sales (Rs.) per Elec. Unit is Rs. 300.

51
ELECTRICAL EXPENSES % TO PRODUCTION – April to Mar 2012
Ap
ril
Ma
y
Ju
ne
Ju
ly
Au
g
Se
pt
Oc
t
No
v
De
c
Ja
n
Fe
b
Ma
r0
100000
200000
300000
400000
500000
600000
700000
800000Electricity Units 2011-12
Electricity Units 2012-13Sudden increase is due to increased HVAC load and machine load.
52
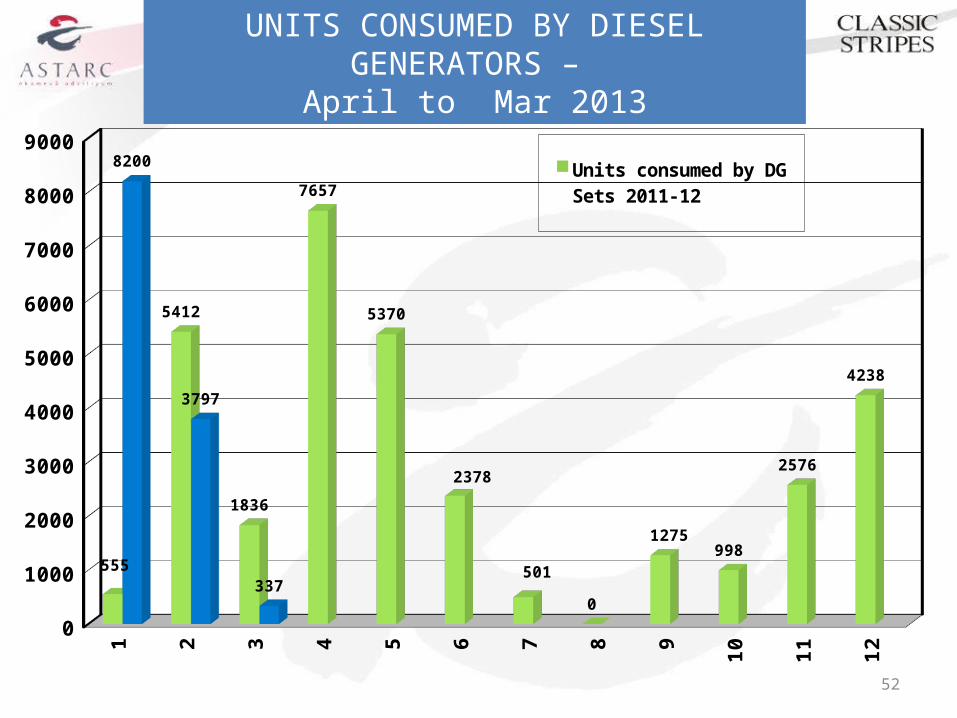
UNITS CONSUMED BY DIESEL GENERATORS – April to Mar 2013
1 2 3 4 5 6 7 8 9
10
11
12
0
1000
2000
3000
4000
5000
6000
7000
8000
9000
555
5412
1836
7657
5370
2378
501
0
1275998
2576
4238
8200
3797
337
Units consumed by DG Sets 2011-12Units consumed by DG Sets 2012-13
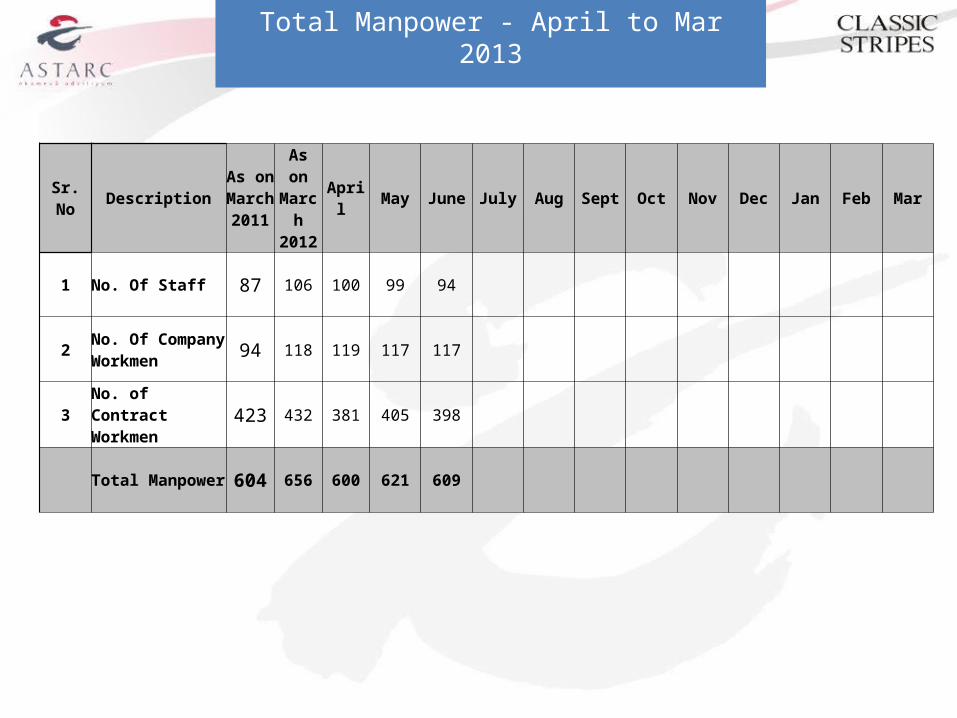
Total Manpower - April to Mar 2013
Sr. No DescriptionAs on March 2011
As on March 2012
April May June July Aug Sept Oct Nov Dec Jan Feb Mar
1 No. Of Staff 87 106 100 99 94
2No. Of Company Workmen 94 118 119 117 117
3No. of Contract Workmen 423 432 381 405 398
Total Manpower 604 656 600 621 609
54
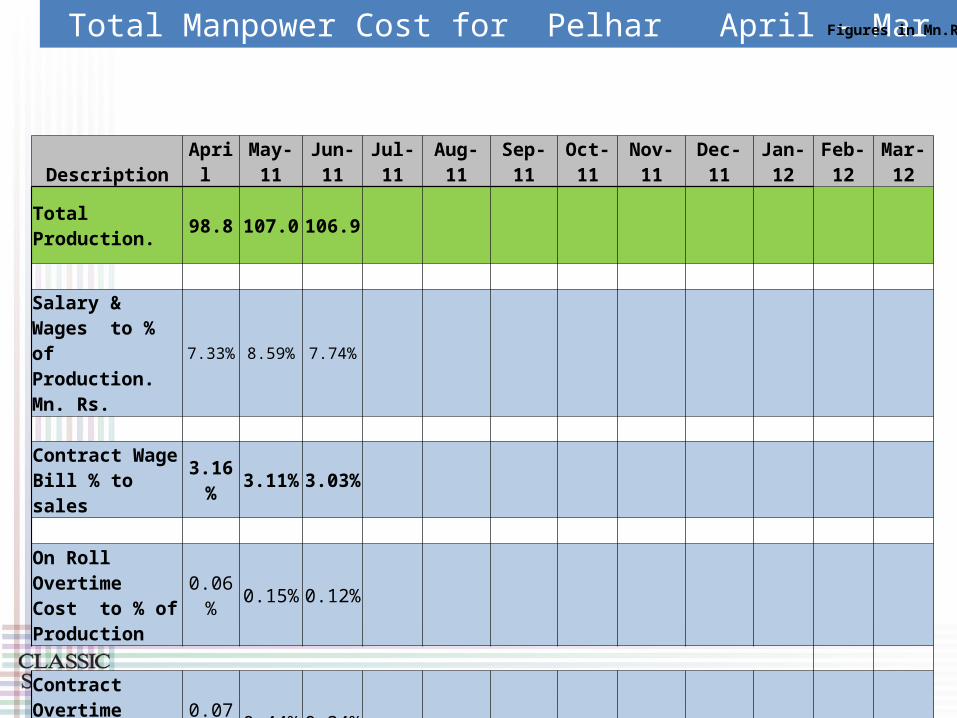
Total Manpower Cost for Pelhar April – Mar 2013
Description April May-11 Jun-11 Jul-11 Aug-11 Sep-11 Oct-11 Nov-11 Dec-11 Jan-12 Feb-12 Mar-12
Total Production. 98.8 107.0 106.9
Salary & Wages to % of Production. Mn. Rs.
7.33% 8.59% 7.74%
Contract Wage Bill % to sales 3.16% 3.11% 3.03%
On Roll Overtime Cost to % of Production
0.06% 0.15% 0.12%
Contract Overtime Cost to % of Production.
0.07% 0.44% 0.34%
Figures in Mn.Rs
55
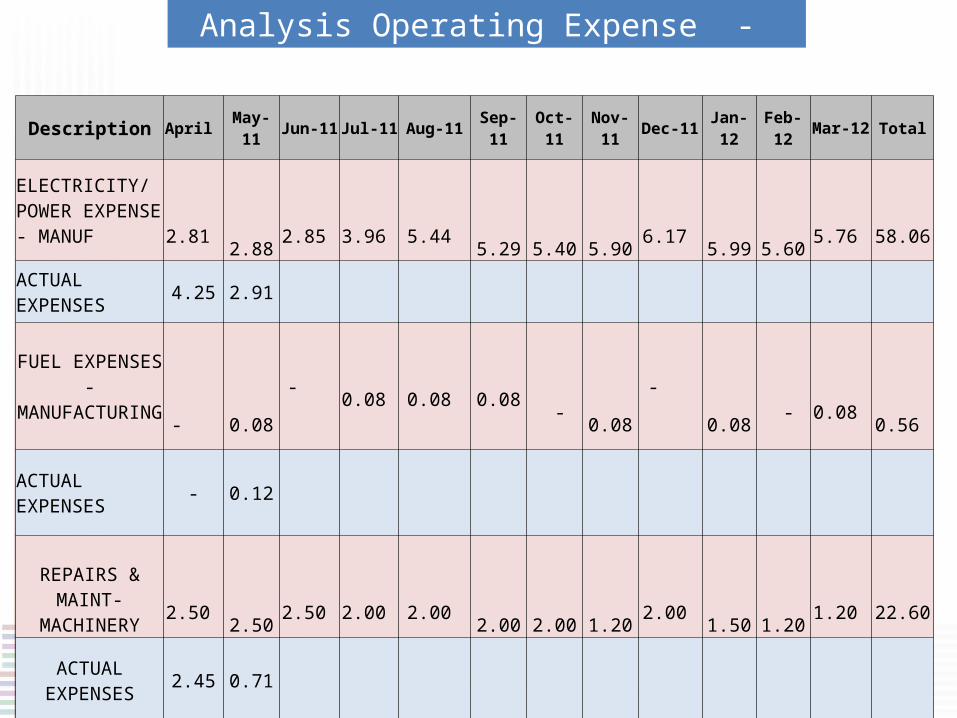
Description April May-11 Jun-11 Jul-11 Aug-11 Sep-11 Oct-11 Nov-11 Dec-11 Jan-12 Feb-12 Mar-12 Total
ELECTRICITY/POWER EXPENSE - MANUF
2.81
2.88
2.85
3.96
5.44
5.29
5.40
5.90
6.17
5.99
5.60
5.76
58.06
ACTUAL EXPENSES 4.25 2.91
FUEL EXPENSES - MANUFACTURING
-
0.08 - 0.08 0.08 0.08 -
0.08 -
0.08
- 0.08
0.56
ACTUAL EXPENSES - 0.12
REPAIRS & MAINT-MACHINERY
2.50
2.50
2.50
2.00
2.00
2.00
2.00
1.20
2.00
1.50
1.20
1.20
22.60
ACTUAL EXPENSES 2.45 0.71
Analysis Operating Expense - Engineering
56
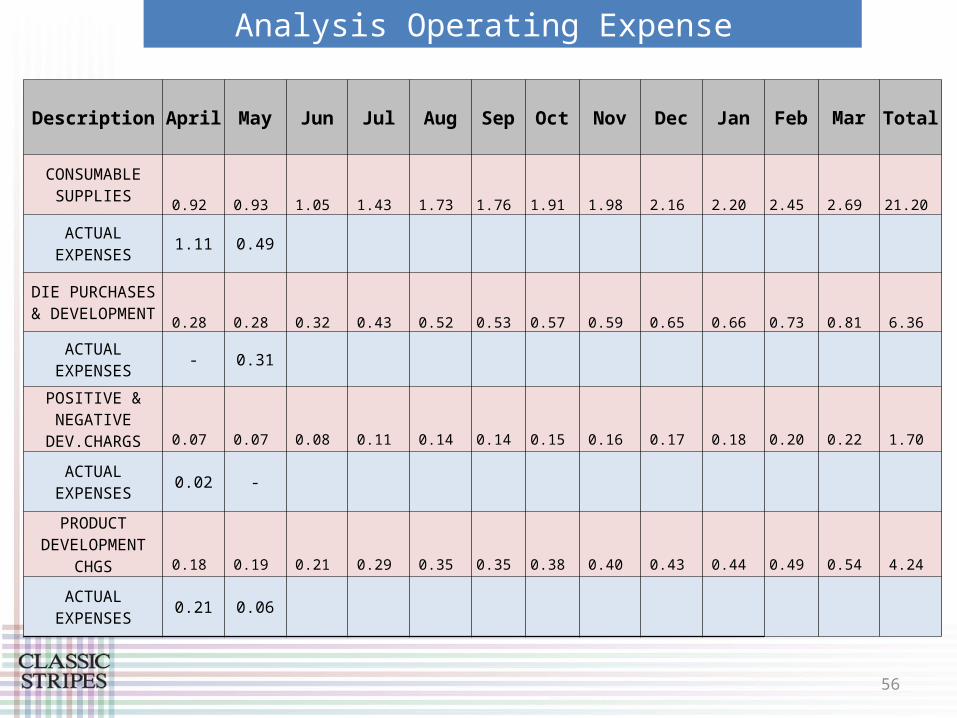
Description April May Jun Jul Aug Sep Oct Nov Dec Jan Feb Mar Total
CONSUMABLE SUPPLIES
0.92
0.93
1.05
1.43
1.73
1.76
1.91
1.98
2.16
2.20
2.45
2.69
21.20
ACTUAL EXPENSES 1.11 0.49
DIE PURCHASES & DEVELOPMENT
0.28
0.28
0.32
0.43
0.52
0.53
0.57
0.59
0.65
0.66
0.73
0.81
6.36
ACTUAL EXPENSES - 0.31
POSITIVE & NEGATIVE
DEV.CHARGS 0.07
0.07
0.08
0.11
0.14
0.14
0.15
0.16
0.17
0.18
0.20
0.22
1.70
ACTUAL EXPENSES 0.02 -
PRODUCT DEVELOPMENT
CHGS 0.18
0.19
0.21
0.29
0.35
0.35
0.38
0.40
0.43
0.44
0.49
0.54
4.24
ACTUAL EXPENSES 0.21 0.06
Analysis Operating Expense

57
Description April May-11 Jun-11 Jul-11 Aug-11 Sep-11 Oct-11 Nov-11 Dec-11 Jan-12 Feb-12 Ma-12r Total
SCREEN MAKING EXPENSES
1.01
1.02
1.16
1.57
1.90
1.93
2.10
2.17
2.38
2.42
2.69
2.96
23.32
ACTUAL EXPENSES 0.90 2.20
LABOUR CHARGES 4.46
4.46
4.48
4.83
5.35
5.99
6.02
6.50
6.85
6.77
6.99
7.04
69.73
ACTUAL EXPENSES 4.36 5.06
TRANSPORT CHARGES BY ROAD-OUTWARD
0.17
0.18
0.20
0.27
0.33
0.33
0.36
0.38
0.41
0.42
0.47
0.51
4.03
ACUTAL EXPENSES 0.03 0.11
TRANSPORT CHARGES OTHERS-OUTWARDS
0.55
0.56
0.63
0.86
1.04
1.06
1.15
1.19
1.30
1.32
1.47
1.61
12.72
ACTUAL EXPENSES 0.46 0.54
Analysis Operating Expense
58
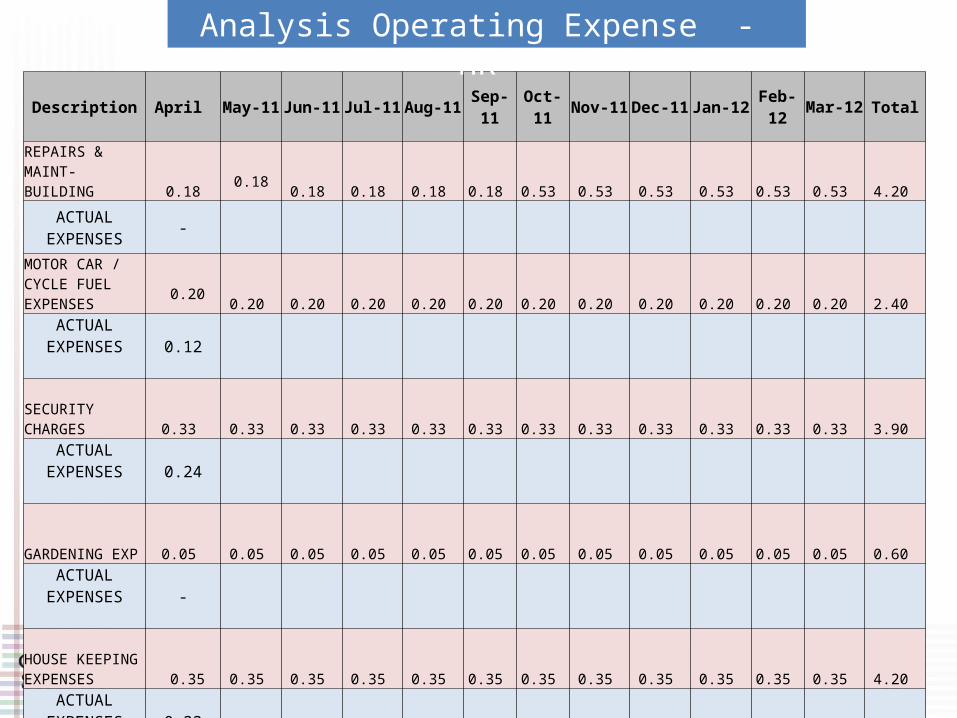
Description April May-11 Jun-11 Jul-11 Aug-11 Sep-11 Oct-11 Nov-11 Dec-11 Jan-12 Feb-12 Mar-12 Total
REPAIRS & MAINT-BUILDING
0.18
0.18
0.18
0.18
0.18
0.18
0.53
0.53
0.53
0.53
0.53
0.53
4.20
ACTUAL EXPENSES -
MOTOR CAR / CYCLE FUEL EXPENSES
0.20
0.20
0.20
0.20
0.20
0.20
0.20
0.20
0.20
0.20
0.20
0.20
2.40
ACTUAL EXPENSES 0.12
SECURITY CHARGES
0.33
0.33
0.33
0.33
0.33
0.33
0.33
0.33
0.33
0.33
0.33
0.33
3.90
ACTUAL EXPENSES 0.24
GARDENING EXP
0.05
0.05
0.05
0.05
0.05
0.05
0.05
0.05
0.05
0.05
0.05
0.05
0.60
ACTUAL EXPENSES -
HOUSE KEEPING EXPENSES
0.35
0.35
0.35
0.35
0.35
0.35
0.35
0.35
0.35
0.35
0.35
0.35
4.20
ACTUAL EXPENSES 0.33
Analysis Operating Expense - HR


