Embed Size (px)
Citation preview


Ontario A Strategic Location & Innovation Corridor
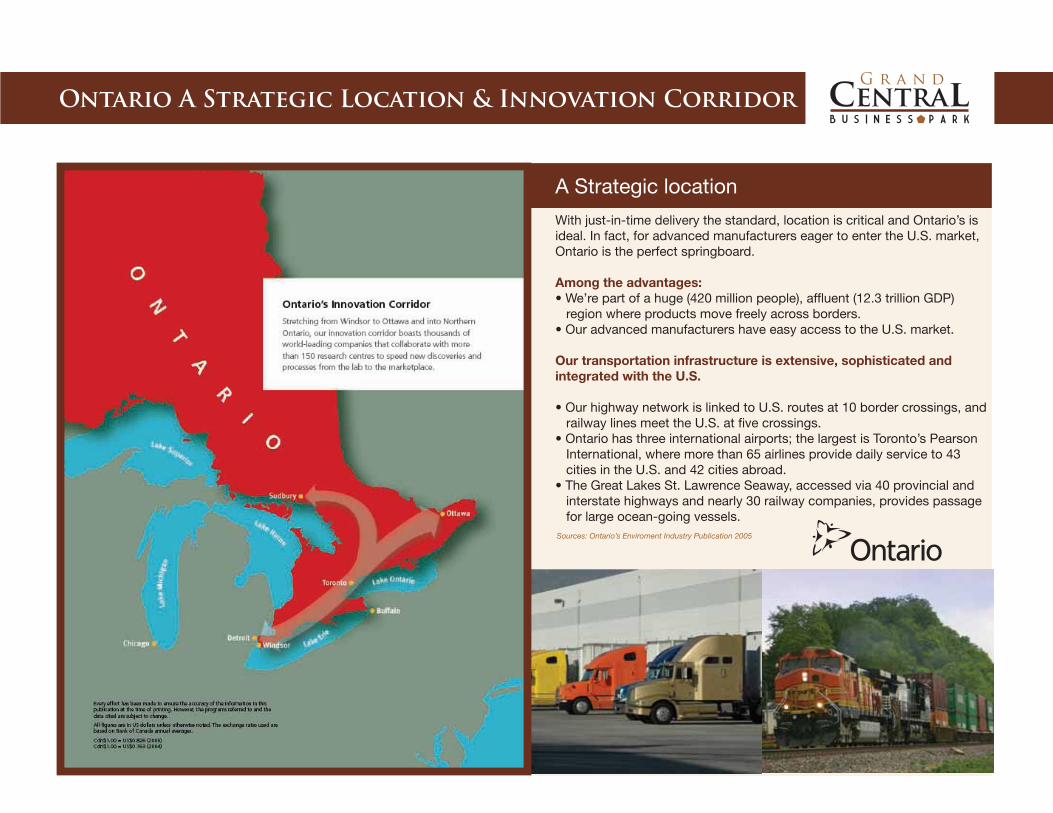
A Strategic location
With just-in-time delivery the standard, location is critical and Ontario’s is ideal. In fact, for advanced manufacturers eager to enter the U.S. market, Ontario is the perfect springboard.
Among the advantages:
region where products move freely across borders.
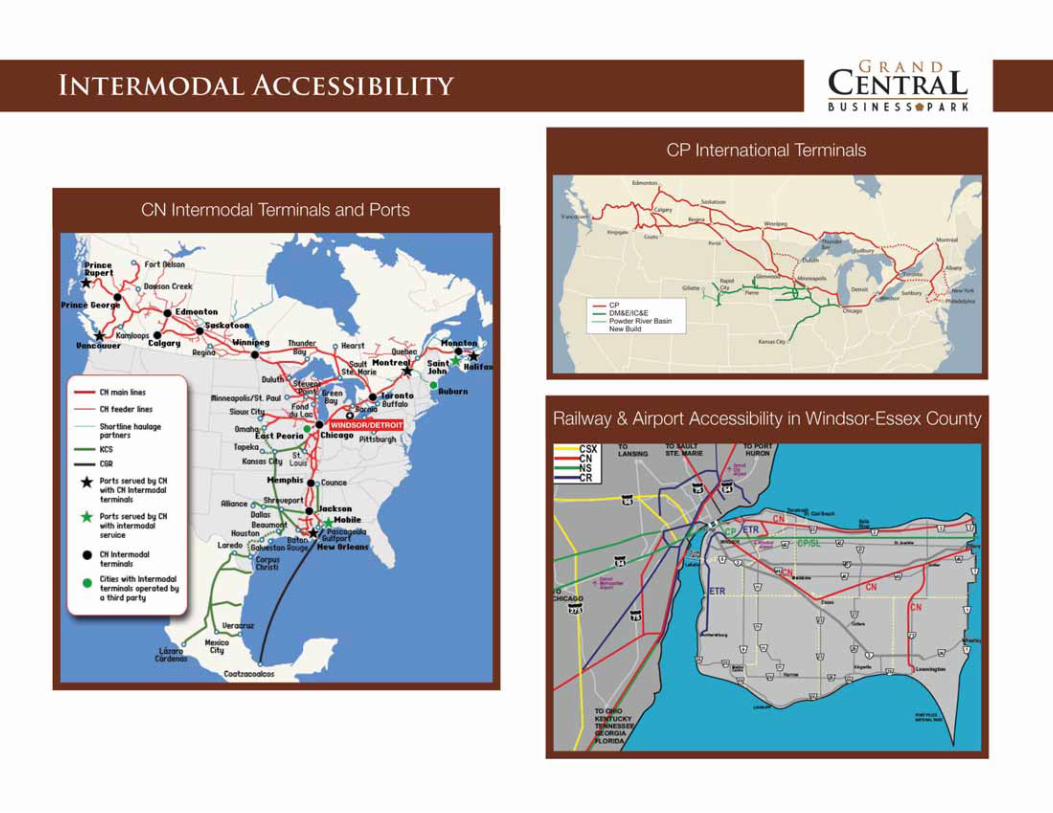
Our transportation infrastructure is extensive, sophisticated and integrated with the U.S.
railway lines meet the U.S. at five crossings.
for large ocean-going vessels.Sources: Ontario’s Enviroment Industry Publication 2005
Demographics & Labour Force
Labour force 15 years and over
All occupations
Management occupations
Business, finance & admin. occupations
Natural & applied sciences & related
Health occupations
Social science, education, govt. service & religion
Occupations in art, culture, recreation & sport
Sales and Service occupations
Trades, transport., & equip. operators, related
Unique to primary industry
Unique to processing, mfg., & utilities
195,325
192,330
15,885
26,155
10,055
10,230
11,710
2,930
46,790
31,250
5,965
20,415
98.47%
8.13%
13.39%
5.15%
5.24%
6.00%
1.50%
23.95%
16.00%
3.05%
10.45%
223,905
224,807
18,380
30,329
11,598
11,960
13,503
3,425
53,132
40,250
8,379
33,851
2001Occupation 2006Percentage
of Total 2006
96
9475
475
3
DETROIT
20 MILES
10 MILES
WINDSOR
5 MILES
BO
RD
ER
401
275
N
RAILWAY
LAKE ERIE
LAKEST. CLAIR
U.S.A
CANADA
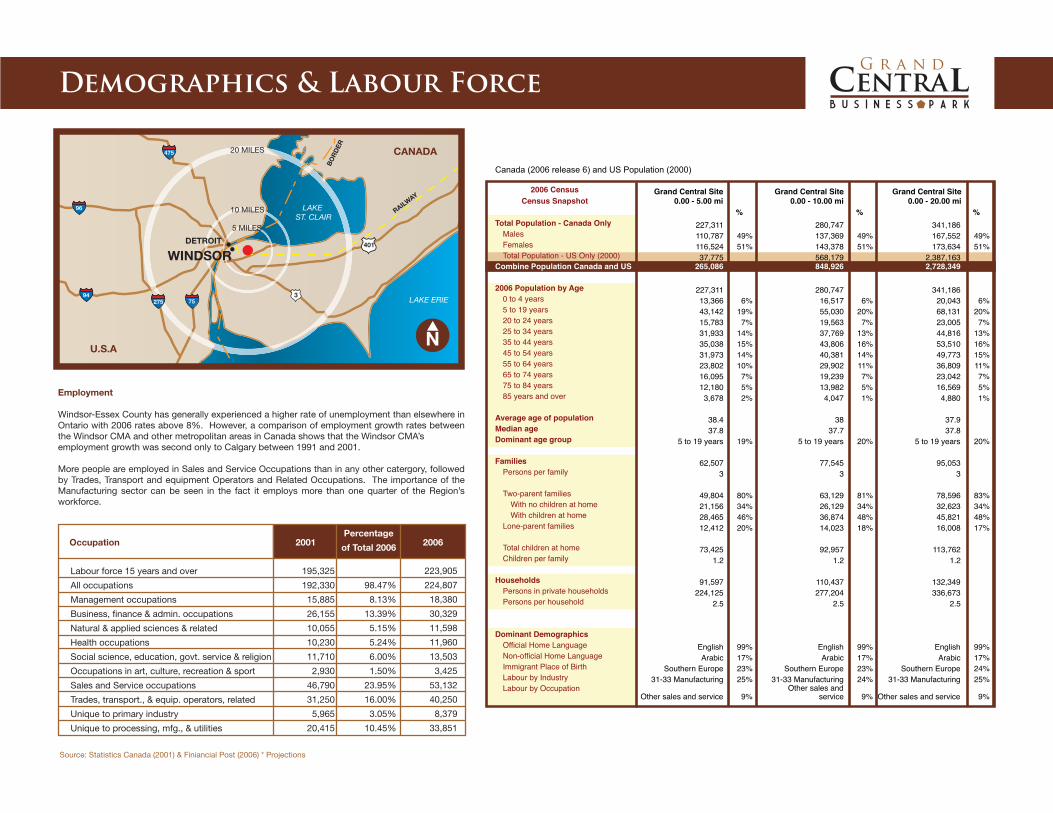
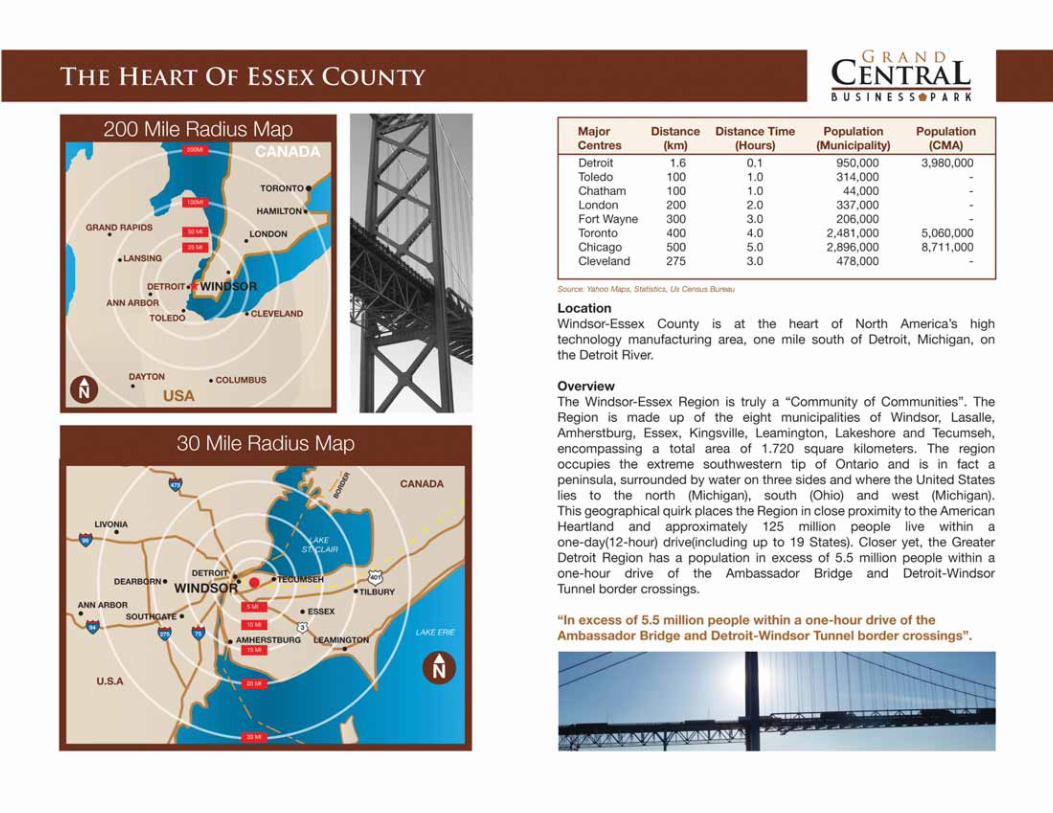
Employment
Windsor-Essex County has generally experienced a higher rate of unemployment than elsewhere in Ontario with 2006 rates above 8%. However, a comparison of employment growth rates between the Windsor CMA and other metropolitan areas in Canada shows that the Windsor CMA’s employment growth was second only to Calgary between 1991 and 2001.
More people are employed in Sales and Service Occupations than in any other catergory, followed by Trades, Transport and equipment Operators and Related Occupations. The importance of the Manufacturing sector can be seen in the fact it employs more than one quarter of the Region’s workforce.
Source: Statistics Canada (2001) & Finiancial Post (2006) * Projections
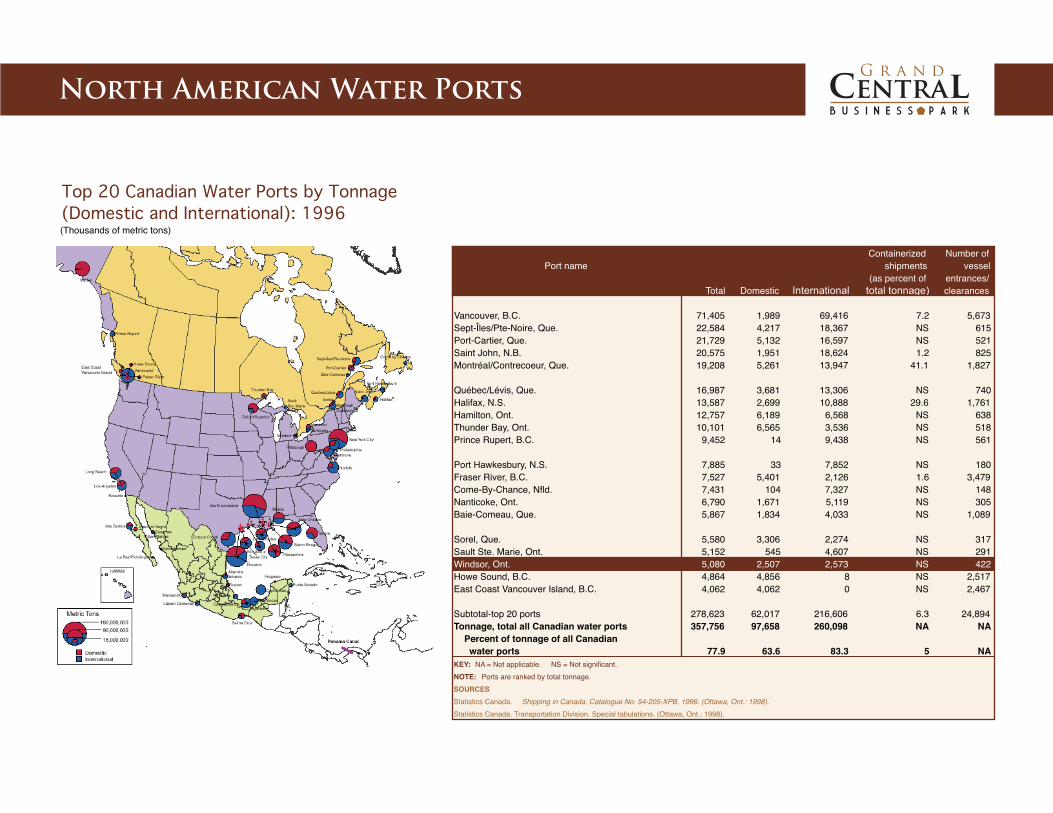
North American Water Ports
Containerized Number ofPort name shipments vessel
(as percent of entrances/Total Domestic International total tonnage) clearances
Vancouver, B.C. 71,405 1,989 69,416 7.2 5,673Sept-Îles/Pte-Noire, Que. 22,584 4,217 18,367 NS 615Port-Cartier, Que. 21,729 5,132 16,597 NS 521Saint John, N.B. 20,575 1,951 18,624 1.2 825Montréal/Contrecoeur, Que. 19,208 5,261 13,947 41.1 1,827
Québec/Lévis, Que. 16,987 3,681 13,306 NS 740Halifax, N.S. 13,587 2,699 10,888 29.6 1,761Hamilton, Ont. 12,757 6,189 6,568 NS 638Thunder Bay, Ont. 10,101 6,565 3,536 NS 518Prince Rupert, B.C. 9,452 14 9,438 NS 561
Port Hawkesbury, N.S. 7,885 33 7,852 NS 180Fraser River, B.C. 7,527 5,401 2,126 1.6 3,479Come-By-Chance, Nfld. 7,431 104 7,327 NS 148Nanticoke, Ont. 6,790 1,671 5,119 NS 305Baie-Comeau, Que. 5,867 1,834 4,033 NS 1,089
Sorel, Que. 5,580 3,306 2,274 NS 317Sault Ste. Marie, Ont. 5,152 545 4,607 NS 291Windsor, Ont. 5,080 2,507 2,573 NS 422Howe Sound, B.C. 4,864 4,856 8 NS 2,517East Coast Vancouver Island, B.C. 4,062 4,062 0 NS 2,467
Subtotal-top 20 ports 278,623 62,017 216,606 6.3 24,894Tonnage, total all Canadian water ports 357,756 97,658 260,098 NA NA Percent of tonnage of all Canadian water ports 77.9 63.6 83.3 5 NAKEY: NA = Not applicable. NS = Not significant.
NOTE: Ports are ranked by total tonnage.
SOURCES
Statistics Canada. Shipping in Canada, Catalogue No. 54-205-XPB, 1996. (Ottawa, Ont.: 1998).
Statistics Canada. Transportation Division. Special tabulations. (Ottawa, Ont.: 1998).
Top 20 Canadian Water Ports by Tonnage(Domestic and International): 1996(Thousands of metric tons)

Canada’s Best Places To Live & Do Business
RAIL YARD
Prov.City
Average Family
Income ($) Newer
carsPop.
GrowthUnemploy.
RateHomicide
rate
Discre-tionary
%
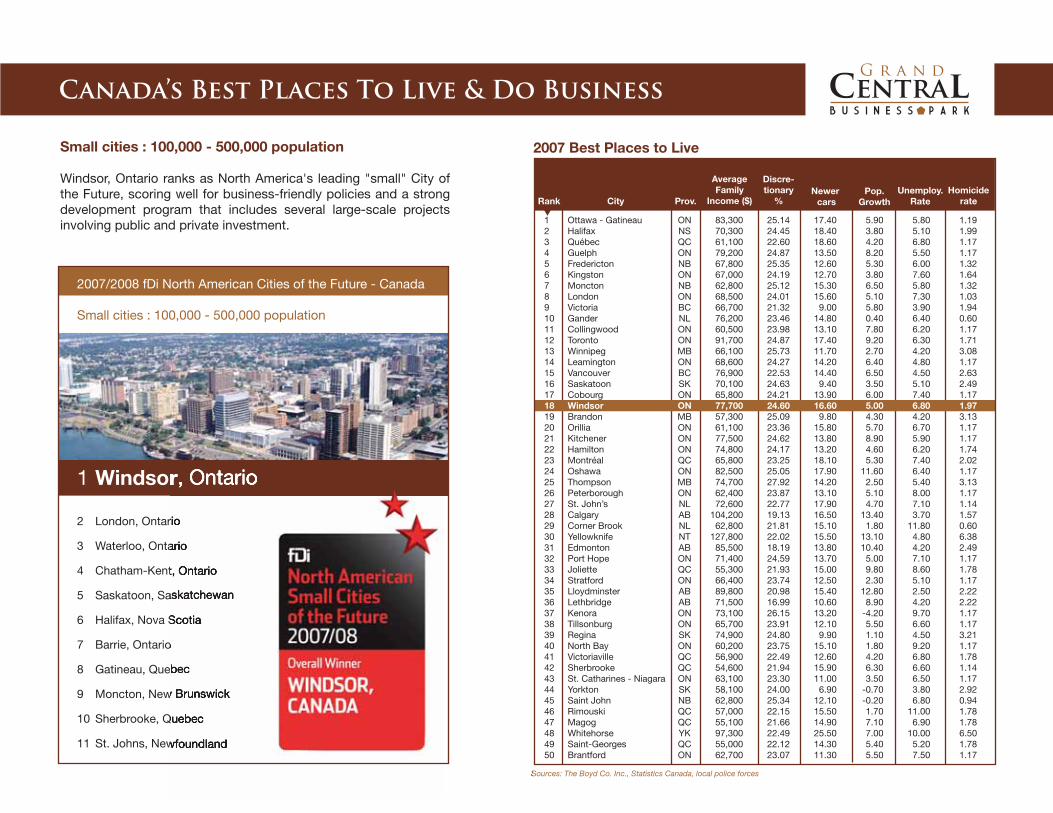
2007 Best Places to Live
Sources: The Boyd Co. Inc., Statistics Canada, local police forces
Rank
1 Ottawa - Gatineau ON 83,300 25.14 17.40 5.90 5.80 1.192 Halifax NS 70,300 24.45 18.40 3.80 5.10 1.993 Québec QC 61,100 22.60 18.60 4.20 6.80 1.174 Guelph ON 79,200 24.87 13.50 8.20 5.50 1.175 Fredericton NB 67,800 25.35 12.60 5.30 6.00 1.326 Kingston ON 67,000 24.19 12.70 3.80 7.60 1.647 Moncton NB 62,800 25.12 15.30 6.50 5.80 1.328 London ON 68,500 24.01 15.60 5.10 7.30 1.039 Victoria BC 66,700 21.32 9.00 5.80 3.90 1.9410 Gander NL 76,200 23.46 14.80 0.40 6.40 0.6011 Collingwood ON 60,500 23.98 13.10 7.80 6.20 1.1712 Toronto ON 91,700 24.87 17.40 9.20 6.30 1.7113 Winnipeg MB 66,100 25.73 11.70 2.70 4.20 3.0814 Leamington ON 68,600 24.27 14.20 6.40 4.80 1.1715 Vancouver BC 76,900 22.53 14.40 6.50 4.50 2.6316 Saskatoon SK 70,100 24.63 9.40 3.50 5.10 2.4917 Cobourg ON 65,800 24.21 13.90 6.00 7.40 1.1718 Windsor ON 77,700 24.60 16.60 5.00 6.80 1.9719 Brandon MB 57,300 25.09 9.80 4.30 4.20 3.1320 Orillia ON 61,100 23.36 15.80 5.70 6.70 1.1721 Kitchener ON 77,500 24.62 13.80 8.90 5.90 1.1722 Hamilton ON 74,800 24.17 13.20 4.60 6.20 1.7423 Montréal QC 65,800 23.25 18.10 5.30 7.40 2.0224 Oshawa ON 82,500 25.05 17.90 11.60 6.40 1.1725 Thompson MB 74,700 27.92 14.20 2.50 5.40 3.1326 Peterborough ON 62,400 23.87 13.10 5.10 8.00 1.1727 St. John’s NL 72,600 22.77 17.90 4.70 7.10 1.1428 Calgary AB 104,200 19.13 16.50 13.40 3.70 1.5729 Corner Brook NL 62,800 21.81 15.10 1.80 11.80 0.6030 Yellowknife NT 127,800 22.02 15.50 13.10 4.80 6.3831 Edmonton AB 85,500 18.19 13.80 10.40 4.20 2.4932 Port Hope ON 71,400 24.59 13.70 5.00 7.10 1.1733 Joliette QC 55,300 21.93 15.00 9.80 8.60 1.7834 Stratford ON 66,400 23.74 12.50 2.30 5.10 1.1735 Lloydminster AB 89,800 20.98 15.40 12.80 2.50 2.2236 Lethbridge AB 71,500 16.99 10.60 8.90 4.20 2.2237 Kenora ON 73,100 26.15 13.20 -4.20 9.70 1.1738 Tillsonburg ON 65,700 23.91 12.10 5.50 6.60 1.1739 Regina SK 74,900 24.80 9.90 1.10 4.50 3.2140 North Bay ON 60,200 23.75 15.10 1.80 9.20 1.1741 Victoriaville QC 56,900 22.49 12.60 4.20 6.80 1.7842 Sherbrooke QC 54,600 21.94 15.90 6.30 6.60 1.1443 St. Catharines - Niagara ON 63,100 23.30 11.00 3.50 6.50 1.1744 Yorkton SK 58,100 24.00 6.90 -0.70 3.80 2.9245 Saint John NB 62,800 25.34 12.10 -0.20 6.80 0.9446 Rimouski QC 57,000 22.15 15.50 1.70 11.00 1.7847 Magog QC 55,100 21.66 14.90 7.10 6.90 1.7848 Whitehorse YK 97,300 22.49 25.50 7.00 10.00 6.5049 Saint-Georges QC 55,000 22.12 14.30 5.40 5.20 1.7850 Brantford ON 62,700 23.07 11.30 5.50 7.50 1.17
Small cities : 100,000 - 500,000 population
Windsor, Ontario ranks as North America's leading "small" City of the Future, scoring well for business-friendly policies and a strong development program that includes several large-scale projects involving public and private investment.
2007/2008 fDi North American Cities of the Future - Canada
Small cities : 100,000 - 500,000 population
1 Windsor, Ontario
2 London, Ontario
3 Waterloo, Ontario
4 Chatham-Kent, Ontario
5 Saskatoon, Saskatchewan
6 Halifax, Nova Scotia
7 Barrie, Ontario
8 Gatineau, Quebec
9 Moncton, New Brunswick
10 Sherbrooke, Quebec
11 St. Johns, Newfoundland
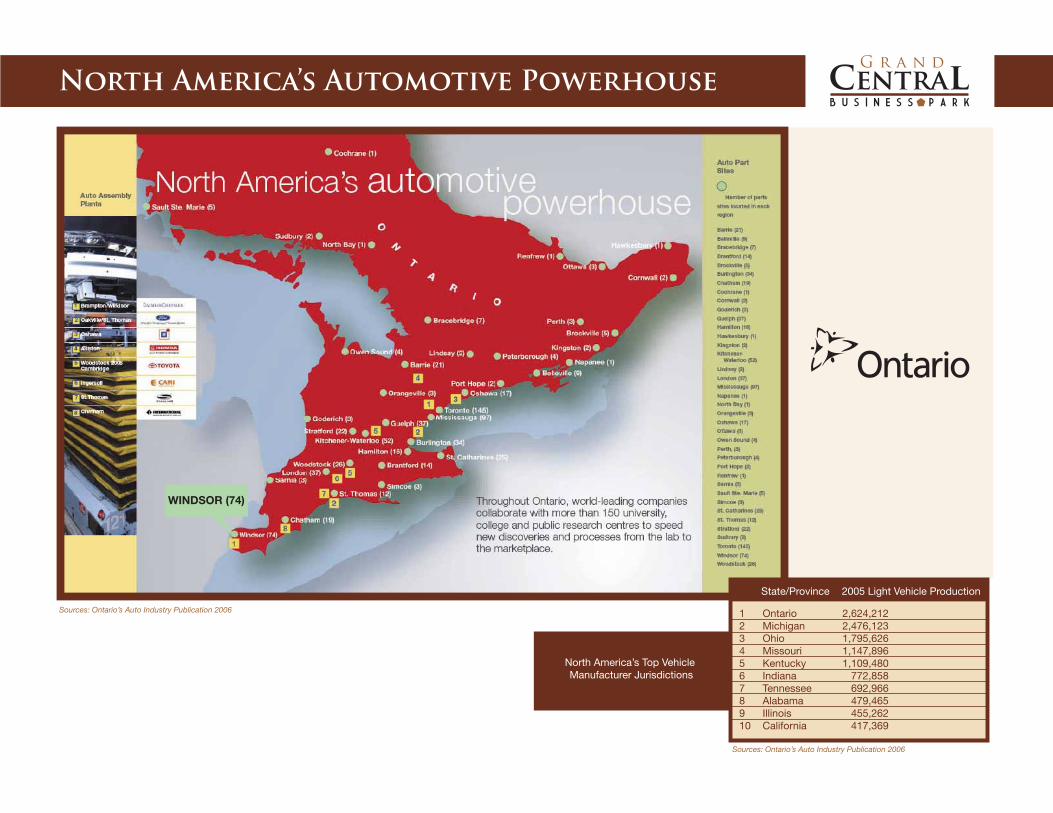
North America’s Automotive Powerhouse
1 Ontario2 Michigan3 Ohio4 Missouri5 Kentucky6 Indiana7 Tennessee8 Alabama9 Illinois10 California
2,624,2122,476,1231,795,6261,147,8961,109,480
772,858692,966479,465455,262417,369
State/Province 2005 Light Vehicle Production
North America’s Top Vehicle Manufacturer Jurisdictions
WINDSOR (74)
Sources: Ontario’s Auto Industry Publication 2006
Sources: Ontario’s Auto Industry Publication 2006

Business Costs & Development Charges
Charge Comparison
City Development Charges Per Square Foot
Barrie, ON 7.64Chatham-Kent, ON NILLondon, ON NILOttawa, ON 3.62Toronto, ON 0.22Waterloo, ON 1.82
Windsor, ON NIL
Gas Cost Comparison
City 10,000 m³ 1,000 m³
Windsor $384 $113St. Thomas $384 $113Petrolia $384 $113Toronto, ON $932 $200
Water Cost Comparison
City Cost per m³
Windsor 0.266St. Thomas 0.621Petrolia 0.900Toronto, ON 0.870
The following tables compare the costs for utilities in the Region to the costs in other Ontario communities.
Monthly Electricity Cost Comparison
Monthly Usage
796 kWh2,585 kWh49,511kWh200,000 kWh
Sarnia
$79.84$257.52
$4,356.92$17,552.07
Mississauga
$77.19$263.02
$4,246.28$18,095.75
Guelph
$84.88$262.90
$4,300.57$17,823.14
Windsor
$78.62$254.48
$4,324.53$17,466.52
TORONTO
PETROLIA
ST. THOMAS
WINDSOR
$86.00
$84,00
$82.00
$80.00
$78.00
$76.00
$74.00
$72.00
0.000
WINDSOR GUELPH MISSISSAUGA SARNIA
0.100 0.200 0.300 0.400 0.500 0.600 0.700 0.800 0.900
Water Cost Comparison
Electricity Charges Comparison Chart (796 kWh)
Source: KPMG LLP, 2008
Source: 2ontario.com
Source: ENWIN Utilities, 2004
Source: ENWIN Utilities, 2004
Source: 2ontario.com
Source: 2ontario.com

168