Embed Size (px)
Citation preview

11
AP PSY CH 1: AP PSY CH 1: Critical ThinkingCritical Thinking & &
the the ScientificScientific
(aka “empirical”)(aka “empirical”) MethodMethod in Psychology:in Psychology:

22
The Need for Psychological Science: Psy. uses scientific method to construct theories that
organize observations & imply testable hypotheses
“Common sense” & intuition? Often is contradictory & wrong EX’s: Full moon effect? Absence & love??
Hind-sight bias is a part of this—”Anybody should have figured that! …I knew it all along!”
• Can lead us to accept info b/c we are told it is true… “Sure…I knew that…”
• OR to prove what we already know…

33
Overconfidence:
We all tend to think we are right…after all, if you think you are wrong, wouldn’t you change to be right??
How long do you think it would take you to unscramble these 3 words?
Write your estimate down:
WREAT = WATER
ETRYN = ENTRY
GRABE = BARGE

44
• NOW…try these: EEPCA SONIVI TETIRB
--Did it take you longer than you thought?
P. 22, side column:
Look at some “expert’s” predictions…
• The Scientific Attitude: “Curious Skeptics”
EX: James Randi the “de-bunker”
But some strange sounding things have proven to be true (Jefferson, etc., top p. 23)
A true scientific attitude requires healthy skepticism (don’t just be a jerk) but also humility, b/c we can all be wrong
55
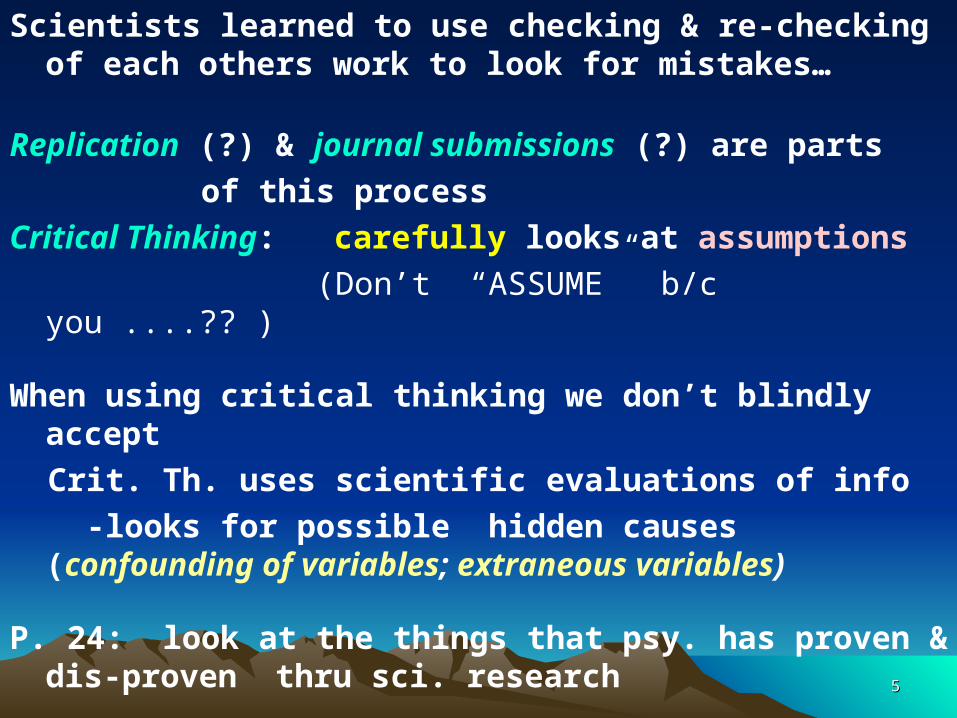
Scientists learned to use checking & re-checking of each others work to look for mistakes…
Replication (?) & journal submissions (?) are parts
of this process
Critical Thinking: carefully looks at assumptions
(Don’t “ASSUME” b/c you ....?? )
When using critical thinking we don’t blindly accept
Crit. Th. uses scientific evaluations of info
-looks for possible hidden causes (confounding of variables; extraneous variables)
P. 24: look at the things that psy. has proven & dis-proven thru sci. research

66
The Scientific Method: Use of theories, observation, & experiment to systematically look at info
• Theory: a linking of facts & bridging of basic laws & principles to organize & predict observations
Theories: NOT just “guesses”:
are linked by evidence in many areas (principles)…
EX: (p. 24) depression?
• Hypothesis: testable predictions, usually implied by a theory (“educ. guess”)

77
Important Terms to stress thisImportant Terms to stress this::
• Theories: a linking of facts & bridging of basic laws & principles to organize & predict observations
• Theories are NOT just educated guesses…they are based on previous known, researched knowledge—principles (“laws” in physics, etc.) that relate to the topic
This info is tied together to generated ideas that are interrelated in many ways & seem to be logical conclusions
88
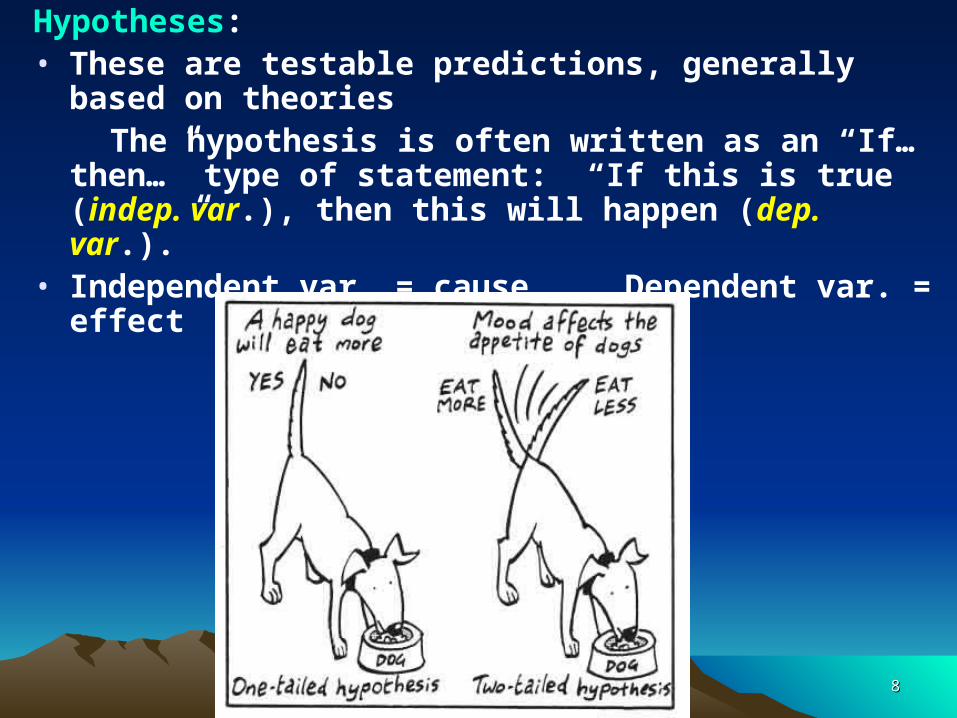
Hypotheses: • These are testable predictions, generally based on
theories The hypothesis is often written as an “If…then…” type of
statement: “If this is true (indep. var.), then this will happen (dep. var.).”
• Independent var. = cause Dependent var. = effect

99
Website for this imagesimplypsychology.pwp.blueyonder.co.uk
•Full-size image - Same sizex larger
Size: 428 × 384
Type: 19KB JPG
This image may be subject to copyright.
Website for this imagepsywww.com
•Full-size image - 2x larger
Size: 1465 × 652
Type: 135KB JPG
This image may be subject to copyright.

1010
Operational definition: the way certain terms or procedures are clearly stated to define or explain what is being looked at…such as “intelligence…what exactly do we mean by intelligence in a hypothesis when looking at this?
• How you measure and consider a phenomenon..

1111
Replication:
When another scientist or team of sci. repeat experiment using much the same techniques & operational definitions to see if they get the same type of results in a different setting w/ different researchers
It’s part of the “curiously skeptical” pattern of thought
adds validity (“valid:” is what it says it is..) to psy. science
Scientists constantly check & re-check each other for errors…
Think of proof-reading your own paper:can you miss errors?

1212
3 methods of doing research in Psych:
A) Descriptive research (3 types of these)
B) Correlational research
C) Experimental research
FYI: NOTE: If you notice some of these notes are repetitive, & you are SURE you have them elsewhere, you don’t need to re-write…Certainly may if you wish to for emphasis…

1313
DESCRIPTIVE RESEARCH: Describes behavior: 3 types A) case studies B) naturalistic observation C) surveys
A) Case Studies: in depth look at 1 individual in hopes of gaining info about folks in general
EX: See Phineas Gage: How was he injured?
How was his personality changed?
So guesses were made about what that area of brain controlled these aspects…
CAUTION! BUT…Watch out of “anecdotal evidence”
EX: “I knew 1 guy who….” Does NOT = good sci.
Recent, repetitive, or shocking info tends to stand out in our memory MORE…leads us astray!

1414
Phineas Gage: (A) What it would have looked like…& (B) his actual skull B
A

1515
1) wording effects: V. important! avoid “emotional” words EX’s? Use your critical thinking skills when you see
these in any type of study!
2) sampling: choosing a smaller group to represent the group you want to study
B) Surveys: get sampling of group & ask ?’s related to area of study
-use questionnaire• Surveys are used in both descriptive &
correlational studies --looks at behaviors & opinions by asking ?’s of respondents

1616
Avoid false consensus effect! Over-estimating the # of folks who think or behave the way we do EX:’s?
-population: group you want to find info about Ex’s?
-random sample: a section of this population; all members of the pop. should have = chance of being chosen for this random sample EX’s?
*If you have an unrepresentative sample, can you just add more people to make it better?

1717
*Watch out for you & others over-generalizing: just b/c you see 1 person from a group behaving a certain way does NOT means all members of that group are that way
BUT…our memory tries to convince us it is true..Read about Hite Report (top of p. 29: Problems w/ this study?
C) Naturalistic Observation: watching & recording behaviors while in natural environment
--could be humans or chimps or birds… *Important part of N-O is being unobtrusive
—Why?

1818
CORRELATIONAL STUDIES: When 1 trait accompanies another trait in either a
positive or negative relationship using statistics to describe how strong—or weak—a relationship is
--how it’s co-related
How strong this relationship is = ability to predict w/ a correlation
How do we write this relationship? EX: r = +0.45 [strong] (-1.00) --------0.00-------- (+1.00) [strong]
[weak]
closer to “0.0” = less relationship: -1.00= perfectly neg. relationship & + 1.00 = perfectly positive one
The strength is represented by r …so r = +0.21 is not a very strong, but r = -0 .56 is fairly strong

1919
-"co-related:“ means have some relationship
EX’s? Studying? TV? GPA?
If 1 goes up, the other goes up, this is a POSITIVE relationship: they are positively correlated
BUT…If 1 goes down & the other goes up, these 2 are negatively correlated
Get EX’s of each!

2020
So….which is a stronger correlation of the following pairs of terms (i.e., which is a better predictor)?
i) r = - 0.72 , r = + 0.48
ii) r = + 0.43, r = - 0.11
iii) r = - 0.66 , r = + 0.59
Scatterplots: p. 31, fig. 1.4: each dot = a number for data
(EX: Class scores (score for each kid) on a test)

2121

2222
• Scatter-plots:
2323
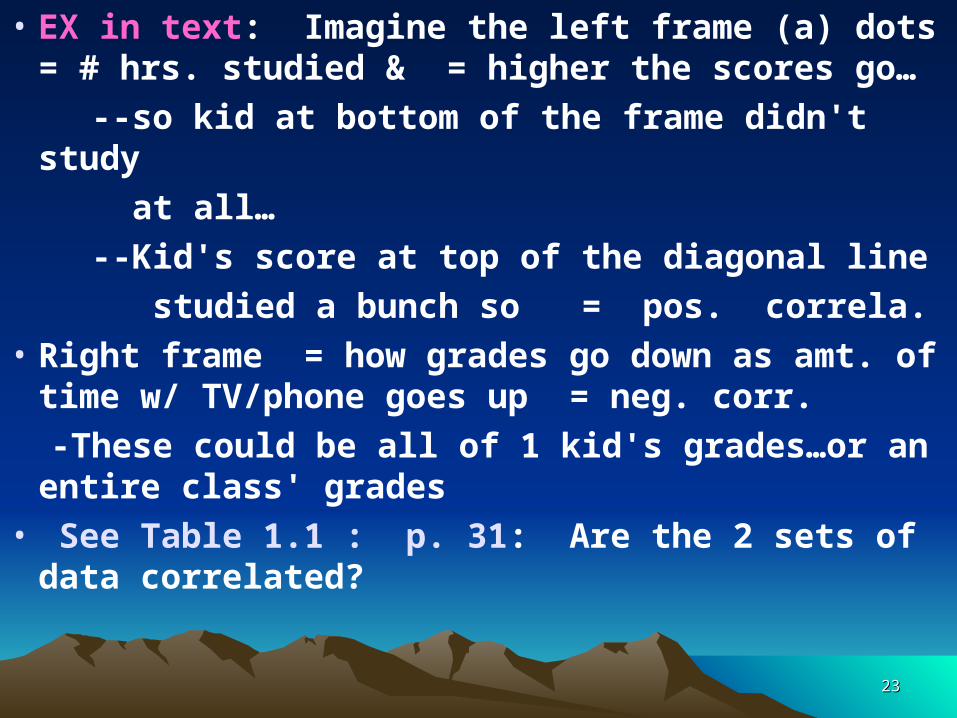
• EX in text: Imagine the left frame (a) dots = # hrs. studied & = higher the scores go…
--so kid at bottom of the frame didn't study
at all…
--Kid's score at top of the diagonal line
studied a bunch so = pos. correla.
• Right frame = how grades go down as amt. of time w/ TV/phone goes up = neg. corr.
-These could be all of 1 kid's grades…or an entire class' grades
• See Table 1.1 : p. 31: Are the 2 sets of data correlated?

2424
COPY FOLLOWING onto the 1st page of your R/W Journal & leave there…
Each time you have a R/W Journal assignment, you are put the following as a heading for your writing (or on 1st line):
Assign. # ____:
Date
Title/Topic of entry (Some will be Review PSY or Review HG)
--------------------------------------------------------------------------------------
• R/W Journal Assignment # 1: Take home, complete, return & file in date order into your folder.
• APA Scientif. Problem Solvers:
A: Read/Scan pp. 7-8 B: *Scan/Read pp. 3-6
Explain 3 degrees & psy *Choose the 6 that MOST
career Ex’s for each appeal to you as a career
1) B.A. or B.S. (Bachelor’s) *3-4 sentences explaining
2) M.A. or M.S. (Master’s) what it is & why it
3) Ph. D. (Doctorate) appeals to you

2525
• Look at p. 32, fig. 1.5..
*V. Important! Correlation does NOT = Causation!!
• That is…there COULD be other things causing something to happen…..Don't ASSUME !!!
• Could be caused by other variables that come into play…"a confounding (confusion) of variables"
• Extraneous variables: variables that you don't think about when you design research that could have caused a relationship instead of the Indep. Var. you are measuring
• Peer reviews look for these

2626
EX: Headline: "Drinking wine will make you rich!" ???
EX: Fig. 1.6: Which causes what?
• Illusory Correlations: Ideas that we have about 1 thing that causes another (often "common sense") …but have NO basis in fact EX’s:
-If you get your head wet & get chilly, will that cause a cold?
-If the weather changes for the worse, does that cause Grandpa's arthritis to act up?

2727
• Why do we develop these ideas?
• B/c humans have a "Rage for Order" which makes us see relationship--i.e., causes—where none exists…it’s same place superstitions come from
-------------------------------------

2828
• Order in Randomness: Again, we want to see some reason for something…is 1 place we get "psychic ability"
-the idea that things are left to chance is just too scary, so we have "good luck" or the ability to throw certain #’s
• Fig. 1.8: also see #'s below
-but our mind rejects that--we like order!
• Something happens to you & it is a 1 in a BILLION chance!!!!
Was it destiny??

2929
• Just remember…1 in a billion happens 6 X per day, or 2000 times per year.
----------------------------------------------------------------
2 terms you need to know for next section:
Reliability: If you do a test over & over & get same or v. similar results, it is reliable
-consistent results
Validity: If something measures (or indicates) what it is meant to measure (or indicate), then it is a valid measure
-does what is supposed to
Don’t confuse w/ variability…to be covered later….

3030
Remember: 3 types of studies…a) D b) C c) Experimentation
Experimentation: Looks at cause & effect b/c it does control (or "manipulate") variables as much as possible…
-Use exper. to explain… Best way: 1) manipulate the variable of interest (thing want to
look at…Indep. var.)2) hold constant--control--other factors -hard to do w/ humans, but often can find ways…
see study p. 38 w/ babies & formula -- It EXPLAINS….correlational PREDICTS

3131
-control condition: treated JUST like the exper. condition except it does not get the Ind. Var. as the exper. cond. does…
-has to take a pill…has to be same color, given at same time of day, etc.
-random assignment to conditions: each participant has = chance of being in either the exper. OR control condition
-helps insure each is as much the same as possible

3232
--independent variable: the thing we are looking at, are interested in…whether it is medicine, baby formula, or whatever…what we manipulate… cause
--dependent variable: part of hypothesis that occurs if the Indep. Var. is present…. effect
-it is NOT the control condition!**(M/M) We manipulate independent variable,
but MEASURE the dependent variable.• *Correl. studies uncover naturally occurring
events…look at relationships that are happening…
But experiments manipulate a factor (variable) to determine its effect

3333
• In “cause & effect” of experiments: -Cause: independent variable -Effect: dependent variable
Finding I-V & D-V: “If…then…” : Take what you want to find out (hypothesis) & write it using “If…then…” statement: “If this is done…then this will happen.” cause…effect…
EX: Are there more admissions to mental hospitals during the full moon?
What is the Hyp.:? I-V? (If…) D-V? (then…)
3434
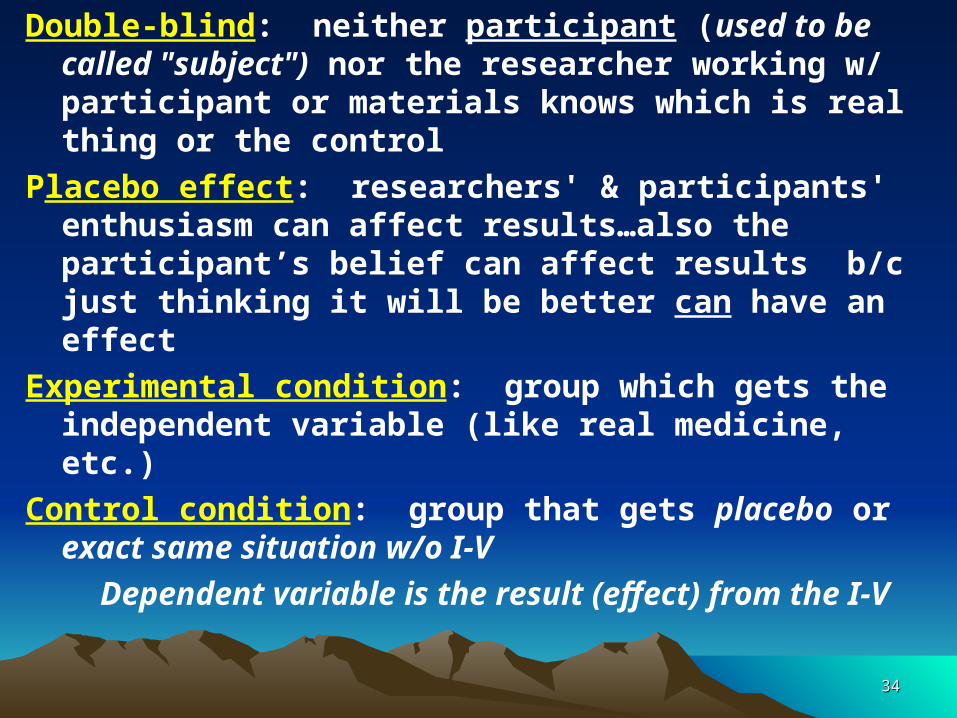
Double-blind: neither participant (used to be called "subject") nor the researcher working w/ participant or materials knows which is real thing or the control
Placebo effect: researchers' & participants' enthusiasm can affect results…also the participant’s belief can affect results b/c just thinking it will be better can have an effect
Experimental condition: group which gets the independent variable (like real medicine, etc.)
Control condition: group that gets placebo or exact same situation w/o I-V
Dependent variable is the result (effect) from the I-V

3535
------------------------------------------------------------
STATISTICAL REASONING (p. 42): How researchers who have already gathered
their info then organize, summarize, * make inferences from it using statistics

3636
1) Describing Your Data: Can organize it into "pictures" like a bar graph, pie charts, etc. or w/ #’s
A) Measures of Central tendency: mode, mean, & median figures:
Mode: most frequently occurring # -this is the simplest way Mean: what we think of as the "average": add all scores
together & divide by total # of scoresMedian: the middle score…aka the 50th percentile… --list all in # order, get the 1 in the middle, so half = higher,
& half = lower
SEE Fig. 1.12: *Imagine Bill Gates being in this study!This shows how these 3 ways of summarizing data (info
gathered) can look differently… Answer
3737
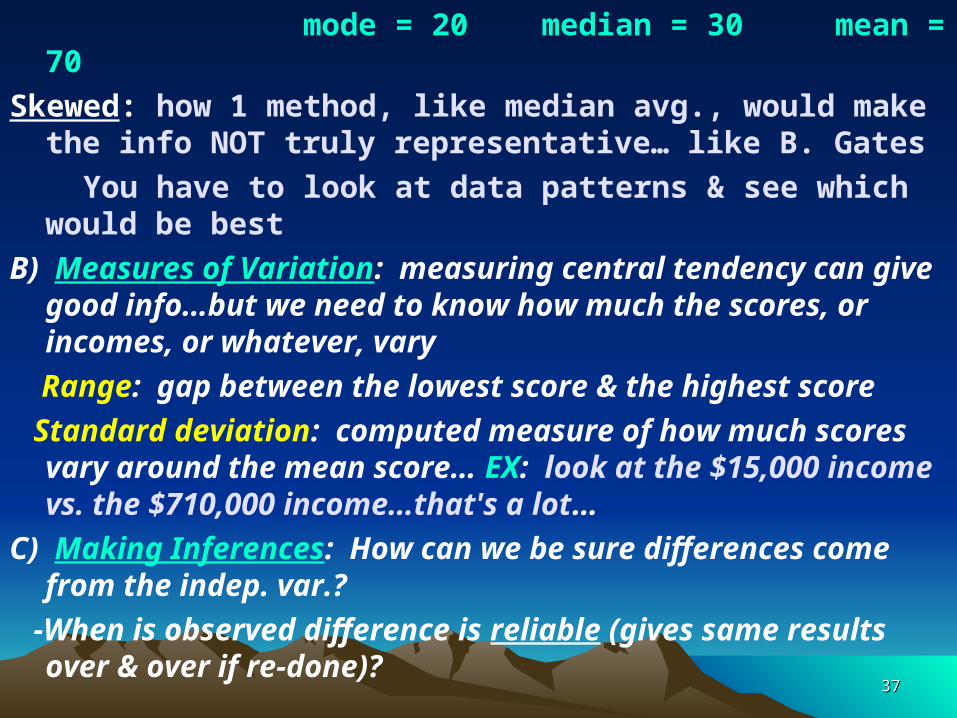
mode = 20 median = 30 mean = 70
Skewed: how 1 method, like median avg., would make the info NOT truly representative… like B. Gates
You have to look at data patterns & see which would be best
B) Measures of Variation: measuring central tendency can give good info…but we need to know how much the scores, or incomes, or whatever, vary
Range: gap between the lowest score & the highest score
Standard deviation: computed measure of how much scores vary around the mean score… EX: look at the $15,000 income vs. the $710,000 income…that's a lot…
C) Making Inferences: How can we be sure differences come from the indep. var.?
-When is observed difference is reliable (gives same results over & over if re-done)?

3838
Standard Deviation Standard Deviation Formula:Formula: (Handout: Ch 1 Notebook)
1.Which of the following is a measure of the degree of variation among a set of events? A) mean B) scatterplot C) standard deviation D) median E) correlation coefficient
2.On a 10-item test, three students in Professor Hsin's advanced chemistry seminar received scores of 2, 5, & 8, respectively. For this distribution of test scores, the standard deviation is equal to the square root of:
A) 3. B) 4. C) 5. D) 6. E) 9
2s s
3939
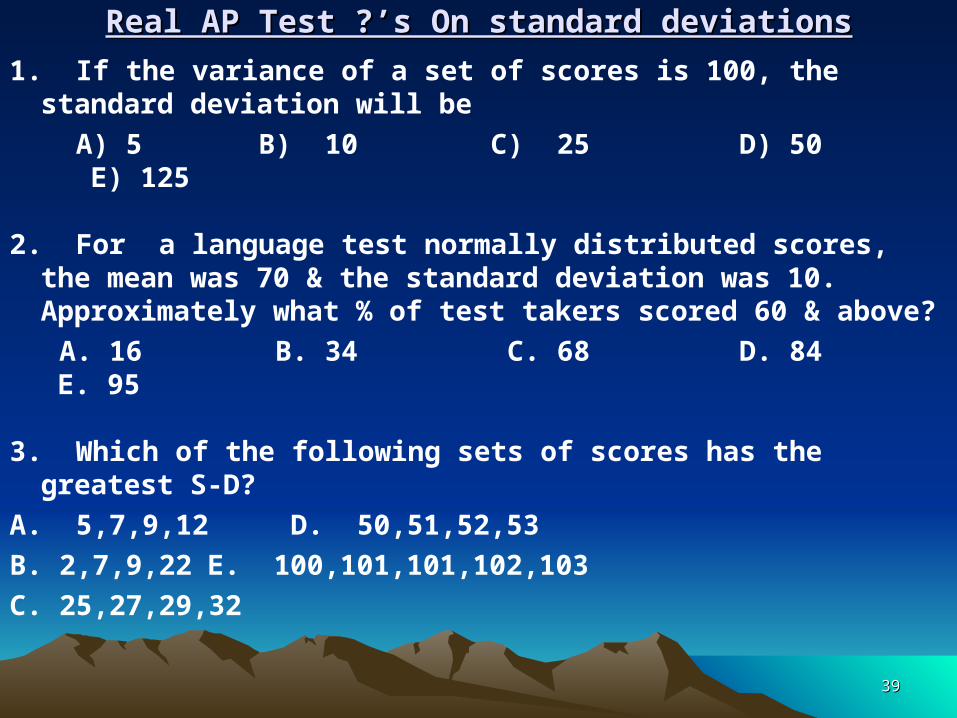
Real AP Test ?’s On standard deviationsReal AP Test ?’s On standard deviations
1. If the variance of a set of scores is 100, the standard deviation will be
A) 5 B) 10 C) 25 D) 50 E) 125
2. For a language test normally distributed scores, the mean was 70 & the standard deviation was 10. Approximately what % of test takers scored 60 & above?
A. 16 B. 34 C. 68 D. 84 E. 95
3. Which of the following sets of scores has the greatest S-D?
A. 5,7,9,12 D. 50,51,52,53
B. 2,7,9,22 E. 100,101,101,102,103
C. 25,27,29,32

4040
Evelyn wants to know how consistent her bowling scores have been during the past season. Which of the following measures would be most relevant to this specific concern?
A) mean B) median C) scatterplot D) standard deviation E) correlation coefficient-------------------------------------------------------------------------------------------------
Differences between 2 samples are least likely to be statistically significant if:
A) the samples are small & the standard deviations of the samples are small.
B) the samples are large & the standard deviations of the samples are large.
C) the samples are small & the standard deviations of the samples are large.
D) the samples are large & the standard deviations of the samples are small.

4141
*3 principles for increased reliability (p. 44):
1) representative samples are better
than biased samples
2) Less-variability = more reliability
--relates to S-D (standard deviation)
3) More cases are better than fewer (10
coin tosses = more variability;
100 = less variability, so more
reliability)
4242
*When is a difference significant? We can have confidence in samples that
1) are good samples of pop. we want to study
2) give good, consistent data, not highly variable data
3) have a lot of samples, not just a few (think about our coin toss experiment in randomness)
-statistical difference: --BUT…this is not proof…
Should be _?_ to add confidence in the data

4343
• ?’s often asked in PSY:
1) Can lab experiments relate to real life? --gain general principles--not specific
findings--that help explain behaviors
2) Behavior & culture (ideas, attitudes, behaviors, & traditions shared by large group & handed down from generation to gener.): Many attitudes & values (sex, idea of time, etc.) are strongly influenced by culture
--but often underlying behavioral processes are very similar or the same…psy use term “cross-cultural” vs. culture specific

4444
3) Behavior & gender: can and does influence
-biology determines sex, culture “bends” the gender
--be careful of exaggerating the differences b/c we tend to be more the same than different
*Which disorders or problems are related to M’s or F’s?
4) Why do psy. study w/ animals? Some want to see how specific animals behave…like chimps
--but mainly use them for experiments we can’t do on humans…they aren’t the same as humans, but do have many of same basic processes & types of basic learning & emotions EX: fear; drives for hunger, sex, etc.

4545
5) Ethics & animal research: some say should not do at all; others say is good way to get info to help humans w/o using humans for research
--psy. say only 7% of research = animals & 95% of those = rats, mice, birds, & rabbits
-when animals used, should never cause needless suffering & should minimize suffering

4646
6) Exper. On people: not allowed to use physical pain, etc.; deceive only if must, & then must tell them after (debriefing)
Ethics guidelines for APA (Amer. Psy. Assoc.) & BPA:
a) obtain informed consent from potential participants
b) protect them from harm & discomfort c) treat info about individual partic. w/
confidentiality d) fully explain research afterward e) In most universities, research goes thru
“screening committee” to make sure nothing is done unethically

4747
7) Is psy free of value judgments? Any thing done involving humans & their interests will have some biases & preferences…but psy does try to eliminate as much as possible, & tries to “catch” each other doing this by sending all research b4 published to others to read & critique
8) Is psy potentially dangerous? Can it be used to manipulate people?
-all knowledge can be used for good or for evil -can help by enlightening & gaining
understanding: -crime, family dysfunction, mental illness,
prejudice, overpopulation, war, etc.
4848
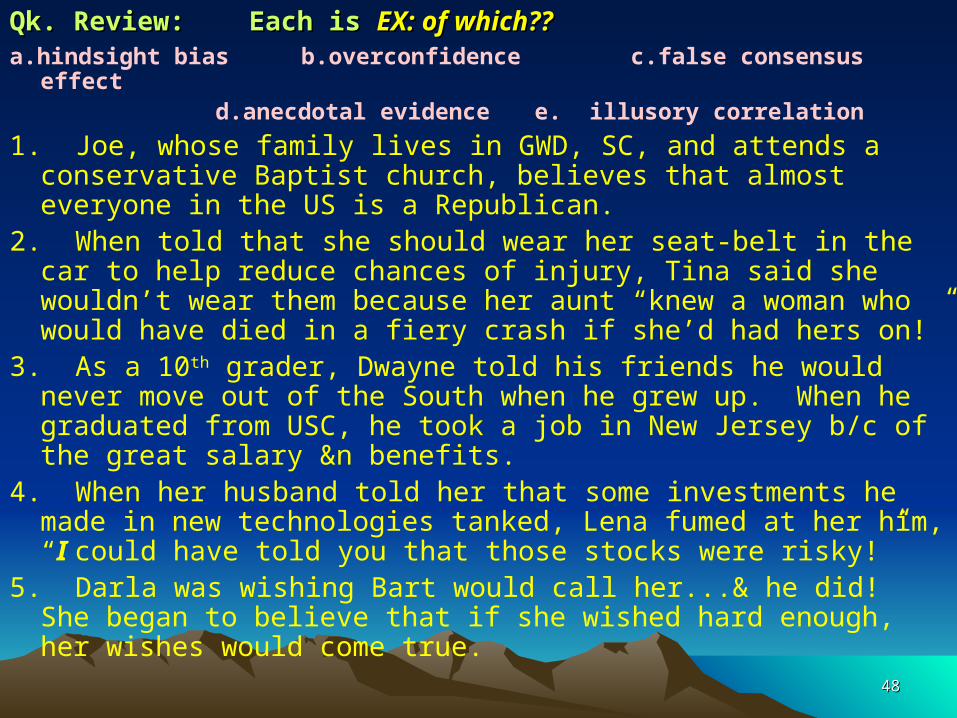
Qk. Review: Each is Qk. Review: Each is EX: of which??EX: of which??
a.hindsight bias b.overconfidence c.false consensus effect d.anecdotal evidence e. illusory correlation
1. Joe, whose family lives in GWD, SC, and attends a conservative Baptist church, believes that almost everyone in the US is a Republican.
2. When told that she should wear her seat-belt in the car to help reduce chances of injury, Tina said she wouldn’t wear them because her aunt “knew a woman who would have died in a fiery crash if she’d had hers on!”
3. As a 10th grader, Dwayne told his friends he would never move out of the South when he grew up. When he graduated from USC, he took a job in New Jersey b/c of the great salary &n benefits.
4. When her husband told her that some investments he made in new technologies tanked, Lena fumed at her him, “I could have told you that those stocks were risky!”
5. Darla was wishing Bart would call her...& he did! She began to believe that if she wished hard enough, her wishes would come true.

4949
ACTIVITY:ACTIVITY: Take each statement & form or Take each statement & form or find the following:find the following:a) hypothesis a) hypothesis b) independent var. b) independent var. c) depend. var.c) depend. var.(NOTE: “If…..then…” statements?)(NOTE: “If…..then…” statements?)
1. John wants to find out if eating chocolate will help students remember information
2. Ms. Ackers decided to study whether or not a clean classroom could influence test scores.

5050
Figure the MEAN, the MODE, and the MEDIAN for the data set of IQ scores below:
94, 99, 103, 103, 110, 125, 155
What is the range?
Which score most affects the standard deviation? Why?


![[Psy] ch03](https://img.pdfslide.net/doc/110x75/555d741ad8b42a687b8b53c6/psy-ch03.jpg)