Embed Size (px)
Citation preview
P a g e | 1
APSC100 Assignment 1: Using MS Word
and Excel
Assignment Contents
Overview and Deadline.......................................................................................................................................... 1
Specific goals ......................................................................................................................................................... 1
Relevant Resources................................................................................................................................................ 2
Required Software ................................................................................................................................................. 2
Instructions ............................................................................................................................................................ 2
Formatting Requirements ...................................................................................................................................... 3
Question 1: Luminol and Fluorescin to Detect Blood ............................................................................................. 6
Question 2: Climate Change in Kingston ................................................................................................................ 9
References ........................................................................................................................................................... 12
Overview and Deadline
The goal of this assignment is to help you create an effective technical report in Microsoft Word that
clearly communicates the analysis and conclusions from two exercises that you will perform in Microsoft
Excel. Completing this assignment will prepare you for the more detailed formatting expected for larger,
more complex documents. The report generated in this assignment can be used as a template for reports in
APSC 100. This assignment develops skills which you will use throughout your program, as most of the
principles about formatting and structure will apply to all your future courses as well.
The assignment is due by Tuesday Sept. 7 at 9am EST. This assignment is worth 2% of your final
grade in APSC 100 Module 1. Instructions for submitting the assignment will be provided the week
before it is due. The assignment must be submitted as a Word file. Excel files and PDFs will not be
marked. If you are using the online Office 365 apps, make sure to review the file when you download
before submitting to ensure the formatting hasn’t changed.
Specific goals
In assignment you should demonstrate that you can use:
• Microsoft Excel to create tables, scatter plots, and complete data analysis.
• Microsoft Word to import tables/graphs; create text, equations, captions, sample calculations, and
drawings; and use built-in tools for heading styles, citations, cross-referencing, tables of contents,
lists of figures, and lists of tables.
Upon successful completion of this assignment, students will be able to:
1. Input experimental data into Microsoft Excel.
2. Perform calculations in Microsoft Excel using both manually inputting formulas and built-in functions.
3. Generate simple and effective tables and graphs to describe experimental data in Microsoft Excel.
P a g e | 2
4. Perform basic data analysis in Microsoft Excel. Specifically, students will be able to perform
regression and residual analyses as part of a laboratory error analysis.
5. Properly format and organize a formal laboratory report in Microsoft Word.
6. Integrate both graphs and tables created in Microsoft Excel into a laboratory report in Microsoft Word.
7. Generate equations and sample calculations in Microsoft Word.
8. Correctly reference resources used in a formal laboratory report using IEEE format.
9. Critically evaluate experimental results on a basic level.
Relevant Resources
Microsoft Excel and Word tutorials, as well as Microsoft Office Learning Resources, are available at
http://my.engineering.queensu.ca/Current-Students/First-Year-Studies/excel-word-video-tutorial.html
The tutorials have been specially designed to aid you with the assignment. It is expected that you will
read these resources and refer to them when completing the assignment. If you have any additional
questions about the assignment, you may contact [email protected] for assistance until August 31.
Required Software
This assignment can be completed on both PCs and Macs. You will need the following software and
plug-ins:
1. Download and install Microsoft 365 Apps for enterprise (formerly known as “Microsoft Office 365
ProPlus”) from Queen’s University.
• Windows: https://www.queensu.ca/its/software/available-software/microsoft-365-apps-
enterprise/tutorials/office-windows
• Mac: https://www.queensu.ca/its/software/available-software/microsoft-365-apps-
enterprise/tutorials/office-mac
Microsoft Excel - Ensure the Analysis ToolPak plug-in is installed in your version. Instructions
are in the written Microsoft Excel Tutorial.
2. Microsoft Word - Ensure you have the option to use the IEEE reference style in the Word citation tool.
If you do not have your own version of Office it can be accessed through AppsAnywhere:
Log in with your NetID and password > Install it on your device > Launch Excel and Word from the list
of Apps
Instructions
This assignment contains two questions:
Question 1: Luminol and Fluorescin to Detect Blood
Question 2: Climate Change in Kingston
The questions are described in detail beginning on page 6. The specific formatting requirements are listed
on pages 3 to 5.
Saving your work
You should ensure that you have a good system for saving and organizing all your university
work. Ensure that you always store your work in a place that has backups, like your Queen’s
Microsoft OneDrive folder. If you don’t you will likely lose work, and bad habits in saving files
are not a valid excuse for late work.
P a g e | 3
Most students find that it is useful to have a single cloud folder for all academic work. We
suggest that you create a folder in your Microsoft OneDrive with a name like “Queens Courses”,
and then a subfolder for each course, e.g. “APSC100Module1”. In many cases it will help to have
a subfolder within that when there are multiple files related to an assignment, e.g. “Assignment1-
Word-Excel”. You should also get in the habit of naming each file something meaningful that you
can search for and recognize, e.g. in this case you will be asked to submit the file with the name
“Student#_LASTNAME_FIRSTNAME_APSC100_Assignment1.docx”.
Important Academic Integrity principles
Do not share your Word or Excel files with any other students. It is permitted to discuss and ask
questions with other students, but make sure that your file is all your own work. In terms of Academic
Integrity, if you share your work with other students it may be considered “facilitation.” Every year there
are students who start later and there is temptation to use someone else’s work. Remember for all
university assignments: discuss, question, talk, and help each other, but do not share. For more on
academic integrity, please review :https://engineering.queensu.ca/policy/academic-integrity
Formatting Requirements
The following are the formatting requirements for the Word document that you will submit. Ensure you
read them carefully before starting on the Word document and review them again before you submit.
1. Filename
▪ The assignment should be saved as a Word file entitled:
Student#_LASTNAME_FIRSTNAME_APSC100_Assignment1
Most of your assignments in APSC100Module 1 should use this kind of naming format.
2. Text
▪ All text should be left justified.
▪ Do not use full justification.
▪ Paragraphs should not be indented and should, instead, be separated by one blank line.
▪ Use size 11 Calibri font.
▪ Edit your writing for spelling and grammar.
▪ Write as concisely as possible.
3. Title page
▪ Include a title page with your name, student number, course number (APSC 100), and submission
date.
4. Point of view
▪ The report should be written in 3rd person. Do not use “I” or “we.”
5. Headers/page numbers
▪ Use Word Header & Footer tool to insert a header, including your last name and the page number,
positioned at the top right side of the page.
▪ Your name should be separated from the number using a vertical line, similar to “Smith | 1”.
P a g e | 4
▪ The title page should not have a page number.
▪ Use Roman numerals (i, ii, iii, etc.) for the page numbers for the Table of Contents, List of Figures,
and List of Tables pages.
▪ Arabic numbers (1, 2, 3, etc.) begin on the first page of the assignment and should be used for all
subsequent pages (including appendices when applicable).
6. Headings
▪ Use Word Styles tool to consistently format your headings for sections and subsections.
▪ At minimum, each question and the references section should have its own heading.
7. Tables and graphs
▪ Use consistent formatting for tables and graphs.
▪ Consider the following guidelines for effective graphics in a laboratory report:
7.1. Tables
1. Maximize white space.
a. Eliminate vertical lines between cells.
b. Where possible, minimize the number of horizontal lines between cells.
2. Centre text in cells.
3. Limit the use of colour where possible.
7.2. Graphs
1. Do not include chart titles. Your figure caption should sufficiently introduce the contents of
your graph.
2. Do include axis titles (with units).
3. Include line of best fit. The equation must have appropriate variables, units, and sig figs.
4. Limit the use of colour where possible.
5. When inserting graphs into a report, make sure they are an appropriate size. Graphs/Figures
should be as small as possible, while still remaining clear and legible to the naked eye. The
reader should not need to magnify (zoom in). It is appropriate to conserve space and place
figures side-by-side if they are clear, legible, and their content is related.
8. Captions
▪ Include captions below figures and above tables using the Word Captions tool.
▪ Refer to each figure and table in the body of your report using cross-referencing, also found under
the Word Captions tool. Use the “Only Label and Number” option when inserting cross-references
such that the references appear as “Table 1” or “Figure 1” in the body of the report.
9. List of Figures/List of Tables
▪ Use Word Captions to insert a List of Figures and List of Tables immediately after the Table of
Contents, generated from the captions used in the report.
▪ The Table of Contents, List of Figures, and List of Tables should not be included in the Table of
Contents.
10. Table of Contents
▪ Use Word Table of Contents tool to generate a Table of Contents page from the headings. Note that
Word will do this automatically provided that you have used Styles tool for your section headings.

P a g e | 5
11. References
▪ Use Word Citations & Bibliography tool to insert in-text citations and add a references section to the
end of your document.
▪ Reference all documents used.
▪ Citations must be in IEEE style.
▪ It is not mandatory that you use the Microsoft Word citation management tool. You are free to use
other citation management tools (such as Zotero).
▪ In-text citations are mandatory
▪ No citation management tools are perfect. It is always expected that you manually check that your
citations are generated in proper IEEE format and that you make all necessary adjustments.
12. Significant figures
▪ If not instructed otherwise, for the purposes of this assignment, report all numerical values to 2
decimal places excluding error which should be reported to 1 significant figure.
13. Numbering equations
▪ Number all equations included in the body of the report.
▪ Any equations included should be referenced at least once by number in the explanatory text.
▪ It is not expected that students use Word Captions to generate equation captions, cross-references, or
a List of Equations.
14. Sample calculations
Consider the following structure for effective sample calculations:
1. Include the generic form of the equation. Ensure the equation is numbered.
2. Define all variables.
3. Report the final answer with units.
15. Units
▪ Report units in axis titles, at the top of table columns, and in your trendlines. When reporting units,
ensure there is a space between the numerical value and the unit. However, a space should not be left
between the numerical value and the unit for percentages or degrees.
P a g e | 6
Question 1: Luminol and Fluorescin to Detect Blood
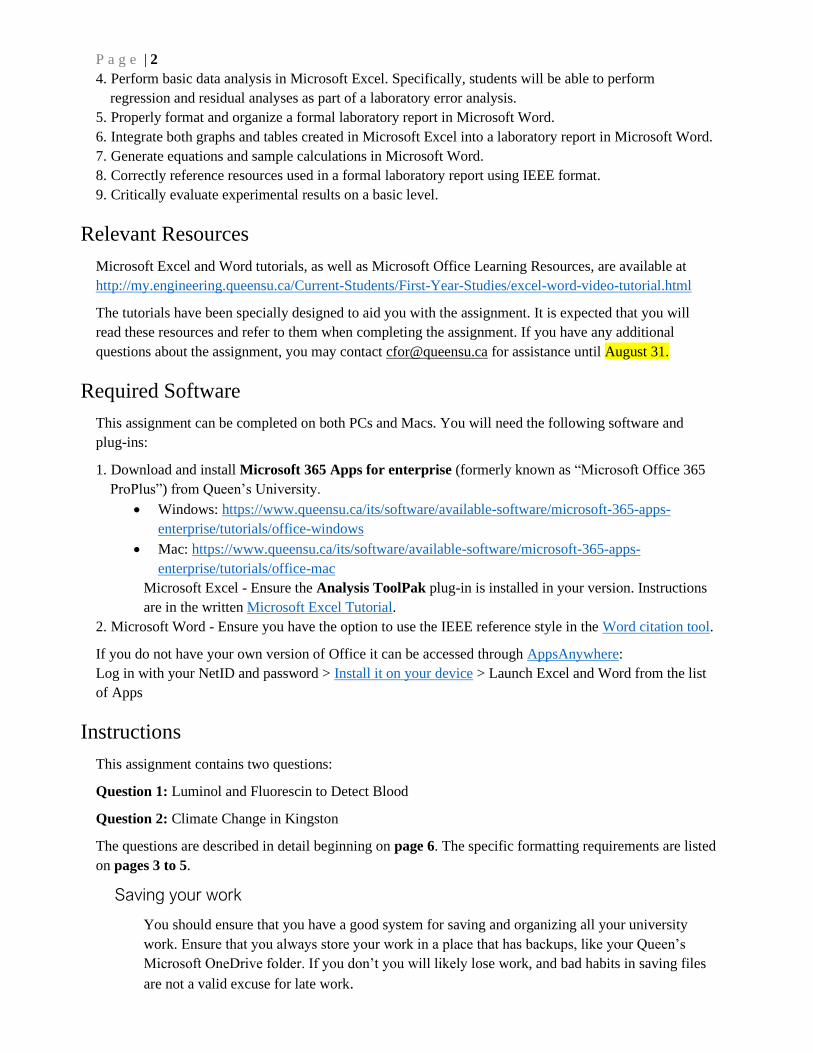
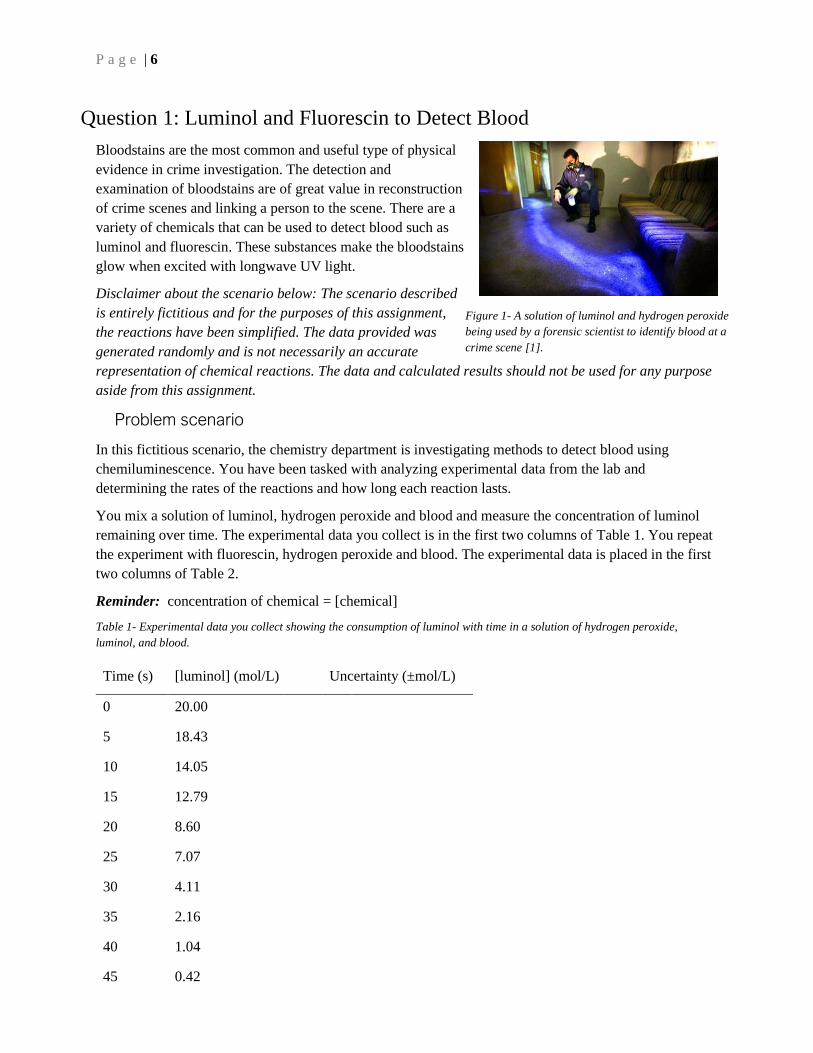
Bloodstains are the most common and useful type of physical
evidence in crime investigation. The detection and
examination of bloodstains are of great value in reconstruction
of crime scenes and linking a person to the scene. There are a
variety of chemicals that can be used to detect blood such as
luminol and fluorescin. These substances make the bloodstains
glow when excited with longwave UV light.
Disclaimer about the scenario below: The scenario described
is entirely fictitious and for the purposes of this assignment,
the reactions have been simplified. The data provided was
generated randomly and is not necessarily an accurate
representation of chemical reactions. The data and calculated results should not be used for any purpose
aside from this assignment.
Problem scenario
In this fictitious scenario, the chemistry department is investigating methods to detect blood using
chemiluminescence. You have been tasked with analyzing experimental data from the lab and
determining the rates of the reactions and how long each reaction lasts.
You mix a solution of luminol, hydrogen peroxide and blood and measure the concentration of luminol
remaining over time. The experimental data you collect is in the first two columns of Table 1. You repeat
the experiment with fluorescin, hydrogen peroxide and blood. The experimental data is placed in the first
two columns of Table 2.
Reminder: concentration of chemical = [chemical]
Table 1- Experimental data you collect showing the consumption of luminol with time in a solution of hydrogen peroxide,
luminol, and blood.
Time (s) [luminol] (mol/L) Uncertainty (±mol/L)
0 20.00
5 18.43
10 14.05
15 12.79
20 8.60
25 7.07
30 4.11
35 2.16
40 1.04
45 0.42
Figure 1- A solution of luminol and hydrogen peroxide
being used by a forensic scientist to identify blood at a
crime scene [1].
P a g e | 7
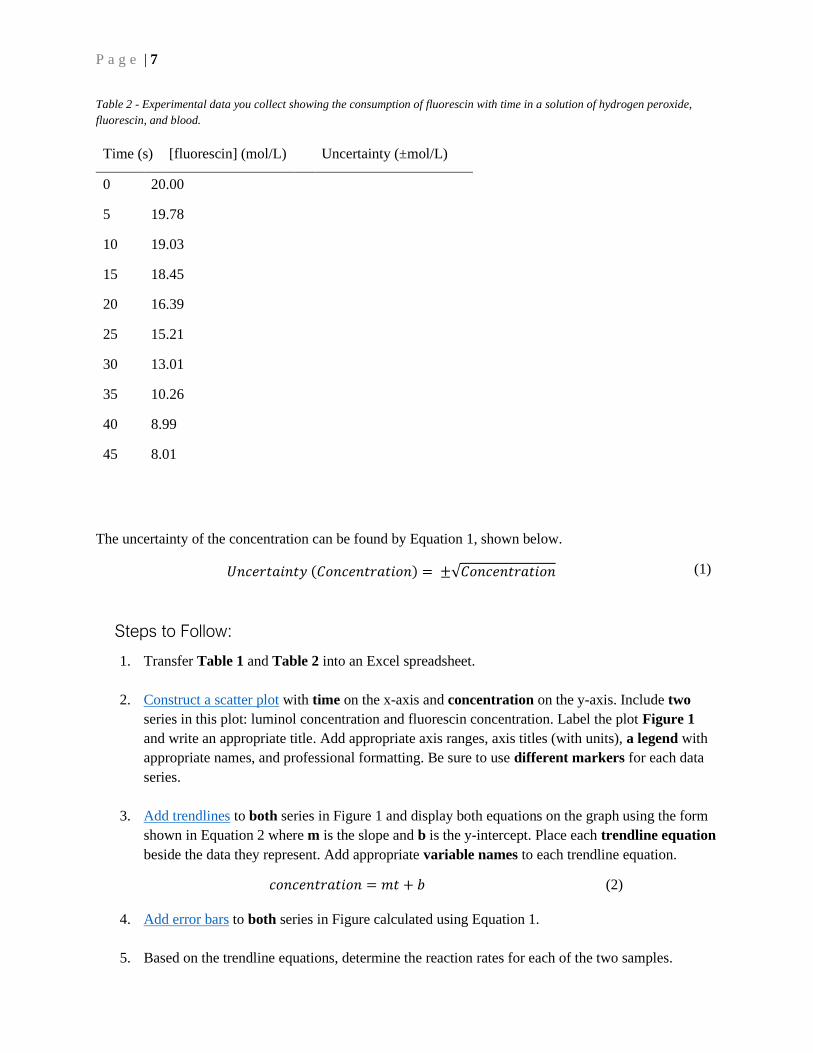
Table 2 - Experimental data you collect showing the consumption of fluorescin with time in a solution of hydrogen peroxide,
fluorescin, and blood.
Time (s) [fluorescin] (mol/L) Uncertainty (±mol/L)
0 20.00
5 19.78
10 19.03
15 18.45
20 16.39
25 15.21
30 13.01
35 10.26
40 8.99
45 8.01
The uncertainty of the concentration can be found by Equation 1, shown below.
𝑈𝑛𝑐𝑒𝑟𝑡𝑎𝑖𝑛𝑡𝑦 (𝐶𝑜𝑛𝑐𝑒𝑛𝑡𝑟𝑎𝑡𝑖𝑜𝑛) = ±√𝐶𝑜𝑛𝑐𝑒𝑛𝑡𝑟𝑎𝑡𝑖𝑜𝑛 (1)
Steps to Follow:
1. Transfer Table 1 and Table 2 into an Excel spreadsheet.
2. Construct a scatter plot with time on the x-axis and concentration on the y-axis. Include two
series in this plot: luminol concentration and fluorescin concentration. Label the plot Figure 1
and write an appropriate title. Add appropriate axis ranges, axis titles (with units), a legend with
appropriate names, and professional formatting. Be sure to use different markers for each data
series.
3. Add trendlines to both series in Figure 1 and display both equations on the graph using the form
shown in Equation 2 where m is the slope and b is the y-intercept. Place each trendline equation
beside the data they represent. Add appropriate variable names to each trendline equation.
𝑐𝑜𝑛𝑐𝑒𝑛𝑡𝑟𝑎𝑡𝑖𝑜𝑛 = 𝑚𝑡 + 𝑏 (2)
4. Add error bars to both series in Figure calculated using Equation 1.
5. Based on the trendline equations, determine the reaction rates for each of the two samples.
P a g e | 8
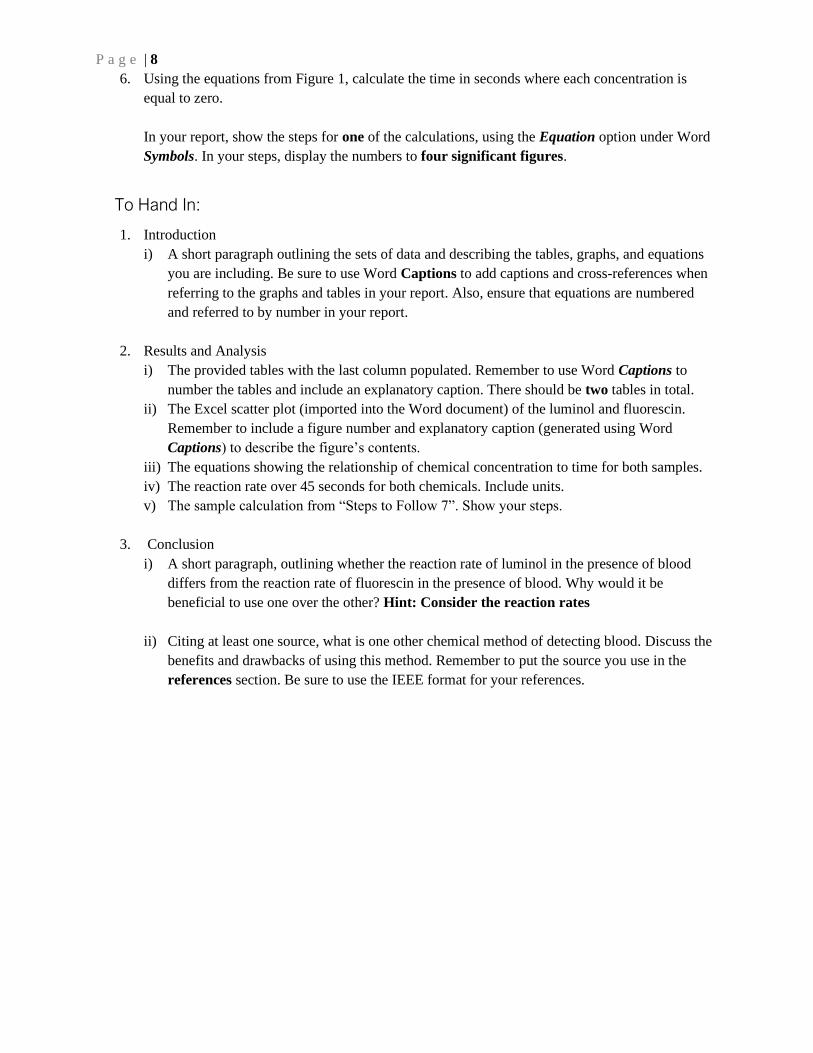
6. Using the equations from Figure 1, calculate the time in seconds where each concentration is
equal to zero.
In your report, show the steps for one of the calculations, using the Equation option under Word
Symbols. In your steps, display the numbers to four significant figures.
To Hand In:
1. Introduction
i) A short paragraph outlining the sets of data and describing the tables, graphs, and equations
you are including. Be sure to use Word Captions to add captions and cross-references when
referring to the graphs and tables in your report. Also, ensure that equations are numbered
and referred to by number in your report.
2. Results and Analysis
i) The provided tables with the last column populated. Remember to use Word Captions to
number the tables and include an explanatory caption. There should be two tables in total.
ii) The Excel scatter plot (imported into the Word document) of the luminol and fluorescin.
Remember to include a figure number and explanatory caption (generated using Word
Captions) to describe the figure’s contents.
iii) The equations showing the relationship of chemical concentration to time for both samples.
iv) The reaction rate over 45 seconds for both chemicals. Include units.
v) The sample calculation from “Steps to Follow 7”. Show your steps.
3. Conclusion
i) A short paragraph, outlining whether the reaction rate of luminol in the presence of blood
differs from the reaction rate of fluorescin in the presence of blood. Why would it be
beneficial to use one over the other? Hint: Consider the reaction rates
ii) Citing at least one source, what is one other chemical method of detecting blood. Discuss the
benefits and drawbacks of using this method. Remember to put the source you use in the
references section. Be sure to use the IEEE format for your references.
P a g e | 9
Question 2: Climate Change in
Kingston
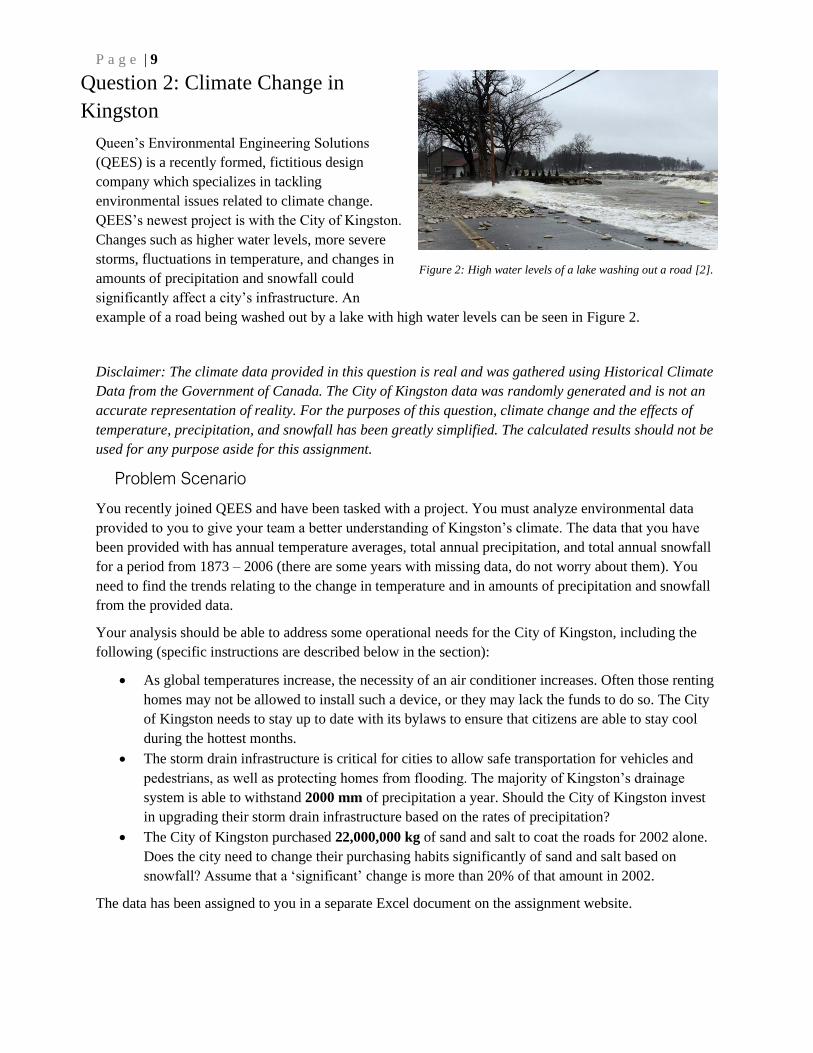
Queen’s Environmental Engineering Solutions
(QEES) is a recently formed, fictitious design
company which specializes in tackling
environmental issues related to climate change.
QEES’s newest project is with the City of Kingston.
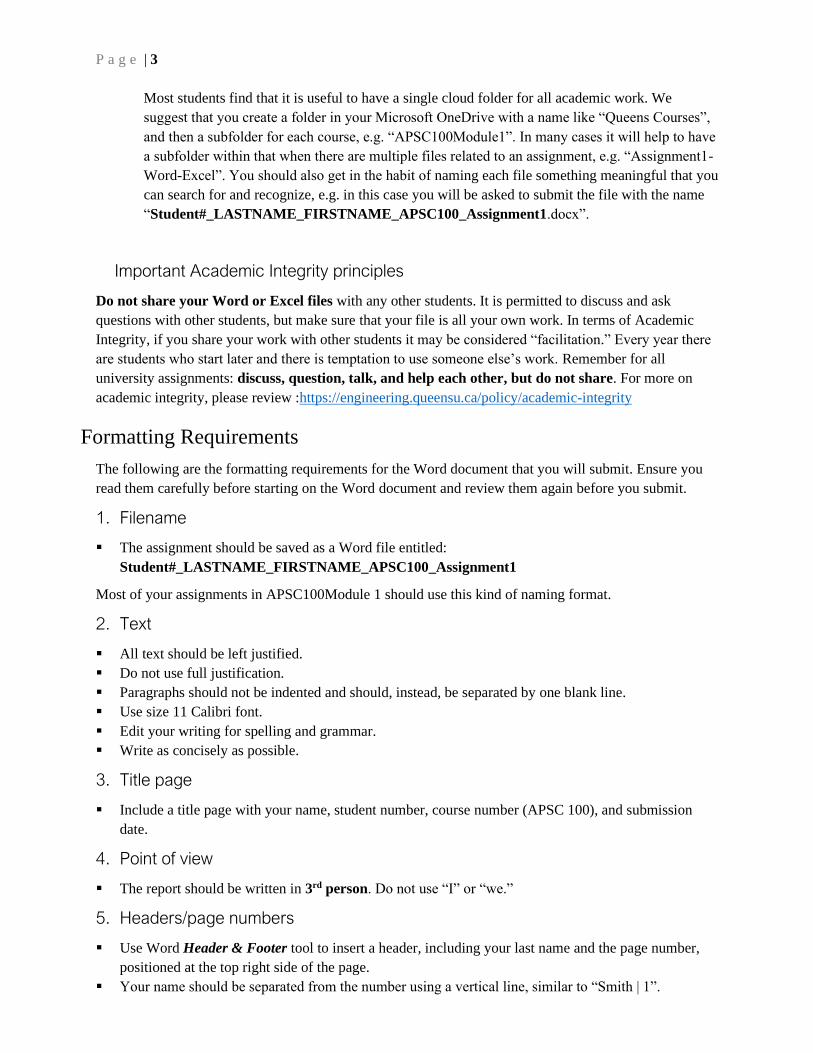
Changes such as higher water levels, more severe
storms, fluctuations in temperature, and changes in
amounts of precipitation and snowfall could
significantly affect a city’s infrastructure. An
example of a road being washed out by a lake with high water levels can be seen in Figure 2.
Disclaimer: The climate data provided in this question is real and was gathered using Historical Climate
Data from the Government of Canada. The City of Kingston data was randomly generated and is not an
accurate representation of reality. For the purposes of this question, climate change and the effects of
temperature, precipitation, and snowfall has been greatly simplified. The calculated results should not be
used for any purpose aside for this assignment.
Problem Scenario
You recently joined QEES and have been tasked with a project. You must analyze environmental data
provided to you to give your team a better understanding of Kingston’s climate. The data that you have
been provided with has annual temperature averages, total annual precipitation, and total annual snowfall
for a period from 1873 – 2006 (there are some years with missing data, do not worry about them). You
need to find the trends relating to the change in temperature and in amounts of precipitation and snowfall
from the provided data.
Your analysis should be able to address some operational needs for the City of Kingston, including the
following (specific instructions are described below in the section):
• As global temperatures increase, the necessity of an air conditioner increases. Often those renting
homes may not be allowed to install such a device, or they may lack the funds to do so. The City
of Kingston needs to stay up to date with its bylaws to ensure that citizens are able to stay cool
during the hottest months.
• The storm drain infrastructure is critical for cities to allow safe transportation for vehicles and
pedestrians, as well as protecting homes from flooding. The majority of Kingston’s drainage
system is able to withstand 2000 mm of precipitation a year. Should the City of Kingston invest
in upgrading their storm drain infrastructure based on the rates of precipitation?
• The City of Kingston purchased 22,000,000 kg of sand and salt to coat the roads for 2002 alone.
Does the city need to change their purchasing habits significantly of sand and salt based on
snowfall? Assume that a ‘significant’ change is more than 20% of that amount in 2002.
The data has been assigned to you in a separate Excel document on the assignment website.
Figure 2: High water levels of a lake washing out a road [2].
P a g e | 10
Steps to Follow:
1. Copy the data provided in the Excel file named “Provided Data.xlsx” to another Excel
spreadsheet. Be sure to include units in the column headers. There are some years missing data,
do not populate these cells.
2. Construct scatter plots of the temperature, precipitation, and snowfall data. These should all be
in separate plots (you will have three separate graphs). Your graphs should have Time (years) on
the x-axis and either Temperature (°C), Annual Precipitation (mm), or Annual Snowfall (cm)
on the y-axis. Select appropriate axis ranges, and axis titles (with units) and professional
formatting.
3. Add a trendline to each of the three data series and display the equations on the graph using
appropriate variable names. Note that the Excel trendline is the result of a linear regression,
which places a line of best fit to the data.
4. Use Excel Analysis to complete a regression analysis of the temperature data with a 68%
confidence level. Produce both residuals and a residual plot for the data series. Do not force the
regression through the origin. Reminder: You cannot access Excel Analysis unless you have
enabled the “Analysis ToolPak” plug-in. Do not worry if you do not understand the meaning of
the confidence level. Confidence levels are related to standard error and will be explored in APSC
100 Module 2.
Refer to this video for more information regarding data analysis in Excel:
https://youtu.be/o4s6vm7m1QY
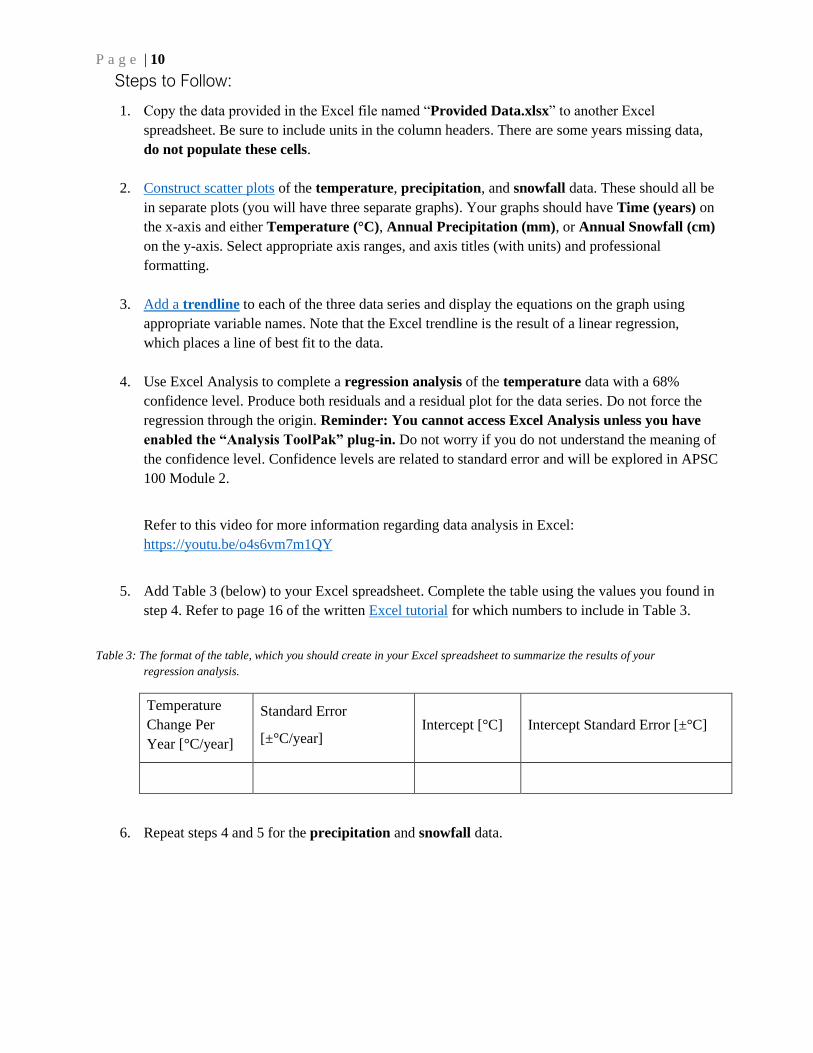
5. Add Table 3 (below) to your Excel spreadsheet. Complete the table using the values you found in
step 4. Refer to page 16 of the written Excel tutorial for which numbers to include in Table 3.
Table 3: The format of the table, which you should create in your Excel spreadsheet to summarize the results of your
regression analysis.
Temperature
Change Per
Year [°C/year]
Standard Error
[±°C/year] Intercept [°C] Intercept Standard Error [±°C]
6. Repeat steps 4 and 5 for the precipitation and snowfall data.
P a g e | 11
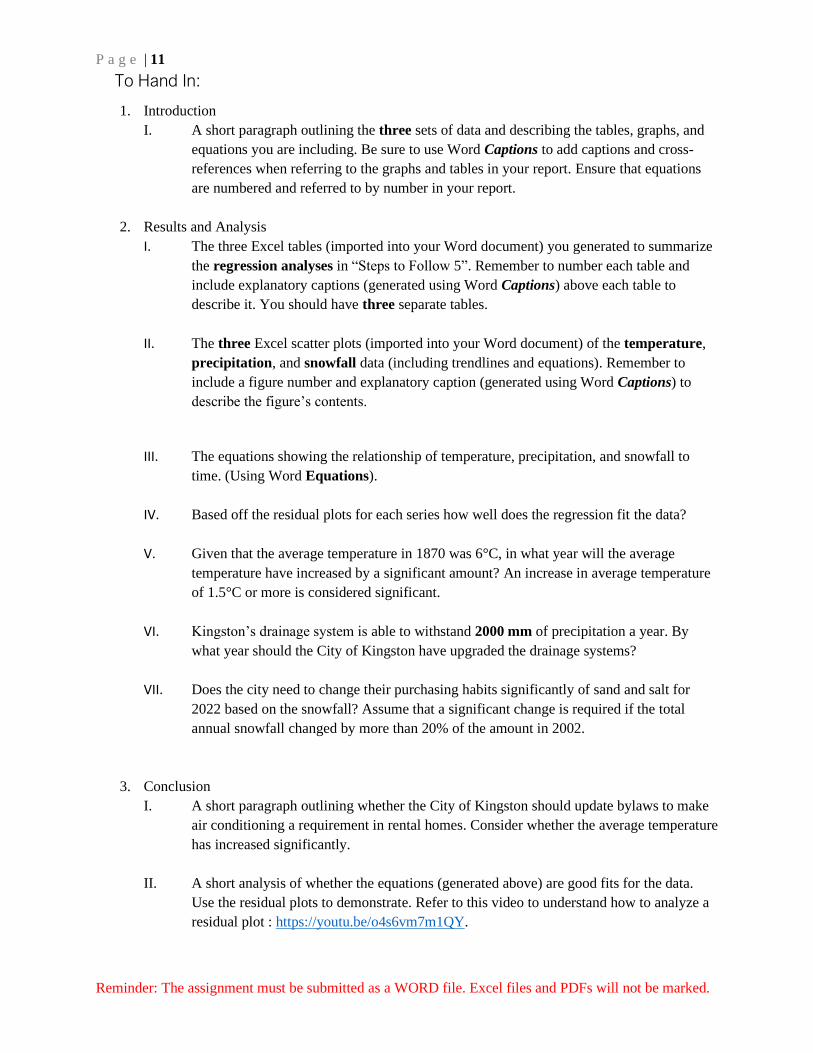
To Hand In:
1. Introduction
I. A short paragraph outlining the three sets of data and describing the tables, graphs, and
equations you are including. Be sure to use Word Captions to add captions and cross-
references when referring to the graphs and tables in your report. Ensure that equations
are numbered and referred to by number in your report.
2. Results and Analysis
I. The three Excel tables (imported into your Word document) you generated to summarize
the regression analyses in “Steps to Follow 5”. Remember to number each table and
include explanatory captions (generated using Word Captions) above each table to
describe it. You should have three separate tables.
II. The three Excel scatter plots (imported into your Word document) of the temperature,
precipitation, and snowfall data (including trendlines and equations). Remember to
include a figure number and explanatory caption (generated using Word Captions) to
describe the figure’s contents.
III. The equations showing the relationship of temperature, precipitation, and snowfall to
time. (Using Word Equations).
IV. Based off the residual plots for each series how well does the regression fit the data?
V. Given that the average temperature in 1870 was 6°C, in what year will the average
temperature have increased by a significant amount? An increase in average temperature
of 1.5°C or more is considered significant.
VI. Kingston’s drainage system is able to withstand 2000 mm of precipitation a year. By
what year should the City of Kingston have upgraded the drainage systems?
VII. Does the city need to change their purchasing habits significantly of sand and salt for
2022 based on the snowfall? Assume that a significant change is required if the total
annual snowfall changed by more than 20% of the amount in 2002.
3. Conclusion
I. A short paragraph outlining whether the City of Kingston should update bylaws to make
air conditioning a requirement in rental homes. Consider whether the average temperature
has increased significantly.
II. A short analysis of whether the equations (generated above) are good fits for the data.
Use the residual plots to demonstrate. Refer to this video to understand how to analyze a
residual plot : https://youtu.be/o4s6vm7m1QY.
Reminder: The assignment must be submitted as a WORD file. Excel files and PDFs will not be marked.
P a g e | 12
References
[1] G. Miller, "Infrared-Based Imaging in Forensics," March 2017. [Online]. Available:
https://possibility.teledyneimaging.com/infrared-based-imaging-forensics/.
[2] K. Reardon, "Erie Island flooding caused by rain, large seiche. What is it?," January 2019. [Online].
Available: https://www.cleveland.com/weather/blog/2018/04/put-in-bay_flooding_caused_not.html.