Embed Size (px)
Citation preview

1
Clinical Investigation and Outcomes Research
Health Outcomes Research
Marcia A. Testa, MPH, PhD
Department of Biostatistics
Harvard School of Public Health

2
The Discipline of Health The Discipline of Health Outcomes ResearchOutcomes Research
• Scientific inquiry evaluating the results of medical interventions and health care services.
• Outcomes data are direct measures of whether medical treatments are beneficial

3
How Are Outcomes Results Used?
• “Outcomes research seeks to understand the end results of particular health care practices and interventions.
• Used to provide information on the quality of care so that it can be improved by determining– which health care services influence the probability of
optimal patient outcomes – which produce optimal improvement in the patient's
physiologic status, physical function, emotional and intellectual performance and comfort (comparative effectiveness research)
1. Outcomes Research Resource Guide, 1996/97 Edition, American Medical Association

4
Measuring Outcomes
• Outcomes are a function of – baseline health status – patient clinical characteristics – patient demographics– psychosocial characteristics – treatment – health care setting
• The GOAL of health outcomes research analysis is to isolate the relationship between outcomes and treatment.

5
Outcome Measures
• Mortality – Survival time, Death event• Morbidity – Time to an Occurrence of a Clinical
Events (e.g., Stroke, MI, Cancer)• Health Status – Physical, Mental and Emotional
Health Functioning• Quality of Life – Health Status as Perceived by the
Individual• Patient Satisfaction – Distance between Quality of
Life and Individual Expectations • Health Economic Outcomes – Cost utility, cost
effectiveness

6
Hematologic Malignancies & Anemia Comparative Effectiveness Trial

7
Hb Changes
Figure 2. Mean hemoglobin (Hb) change (intent-to-treat; n = 269). aP < .0001 early versus late group. Postrandomization Months 1, 2, 3, and 4 values correspond with mean Hb between Weeks 0 (baseline) to Weeks 4, 5-9, 10-14, and 15-20, respectively.
a P < 0.0001

8
Treatment, Fatigue, Symptoms
bP < .01 late vs. early treatment. cP < .05 late vs. early treatment.

9
Treatment and Health Status
bP < .01 late vs. early treatment. cP < .05 late vs. early treatment.
10
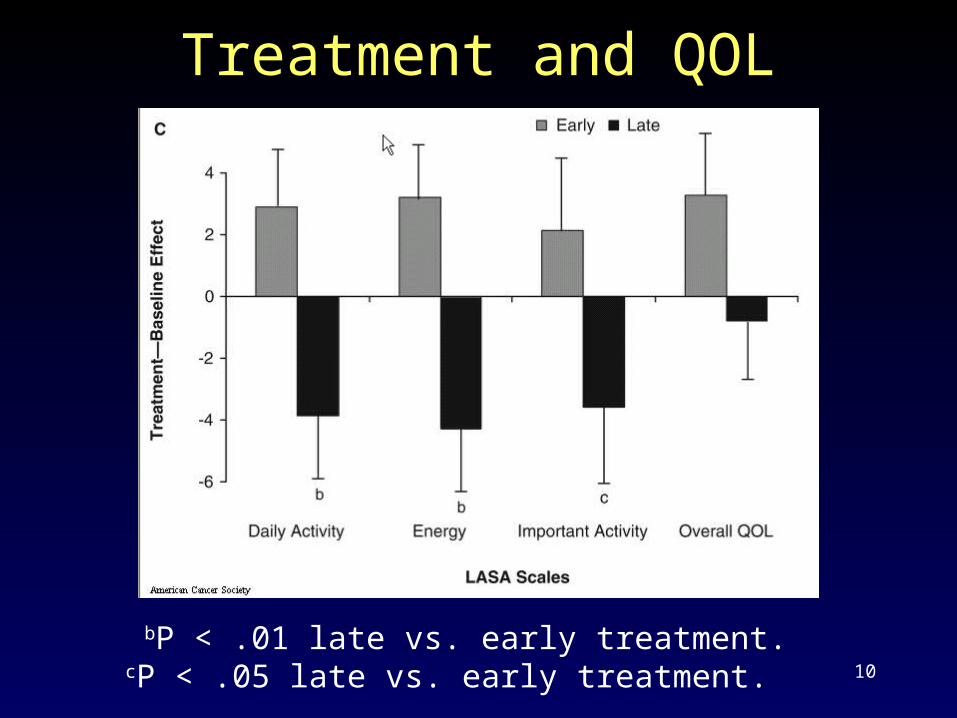
Treatment and QOL
bP < .01 late vs. early treatment. cP < .05 late vs. early treatment.

11
Measuring Outcomes
Death Full Health Outcome

12
Measuring Outcomes, Measuring Performance
Measurement
Improving Process (how we perform)
Improving Outcomes (the results of our performance)

13
Clinical
Economic
The Consequences of Health Care and Medical Intervention
PatientCentered

14
Clinical
The Consequences of Health Care and Medical Intervention –Types of Outcomes
Labs, Clinical Events, Physician Assessments

15
PatientCentered
The Consequences of Health Care and Medical Intervention –Types of Outcomes
Symptom reports, health status, quality of life, patient satisfaction

16
Well-beingWell-being
Mental andMental and
EmotionalEmotional
Physical/Physical/
SymptomsSymptoms
Work/SocialWork/Social
CognitiveCognitive
GeneralGeneral
PerceivedPerceived
HealthHealth
Multi-faceted QOL Domains

17
Outcomes Research - 1996QOL is Recognized as Important
18
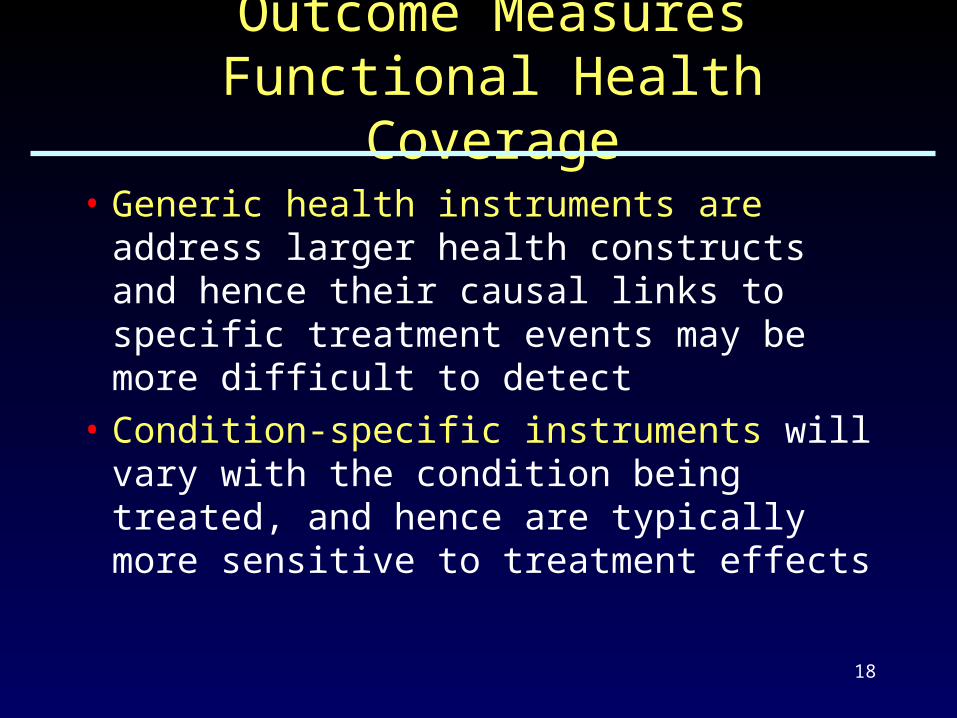
Outcome MeasuresFunctional Health Coverage
• Generic health instruments are address larger health constructs and hence their causal links to specific treatment events may be more difficult to detect
• Condition-specific instruments will vary with the condition being treated, and hence are typically more sensitive to treatment effects

19
Outcome MeasuresFormat Influencing Coverage
• Fixed-Length or “Static” – number of questions is fixed – greater coverage requires greater number of questions
• Dynamic instruments - use computer adaptive testing to restrict items based upon a Bayesian approach which selects the next question based upon the answer to the previous question
• Combines the practicality of short form instruments with the sensitivity and target coverage of condition-specific instruments

20
Questionnaires and SurveysGeneric Instruments
• Some outcomes survey questions, commonly referred to as “instruments”, focus on describing how individuals rate their health overall – or generic instruments
• General health surveys such as the SF-36 are now used in research studies, population surveys, and some health plans to assess patients' overall level of functioning.
• Translation of SF-36 into Arabic and the translation methods references are given in the Additional Resources Section of the Website.

21
Questionnaires and Surveys Condition-Specific Instruments
• Developing outcome instruments for specific diseases has been an especially prolific research area
• Such instruments are more likely than general health survey measures to be able to detect changes in the disease due to treatment

22
Steps in Designing an Outcome Research Study
• Define a researchable question• Develop a conceptual model• Identify the critical dependent and independent
variables• Identify appropriate measures for each• Develop an analysis plan• Indicate what is believed to cause the outcome• Identify critical pathways and what other factors are
likely to affect the outcome• Identify which variables (in the outcomes function
equation) are relevant to your hypothesis
23
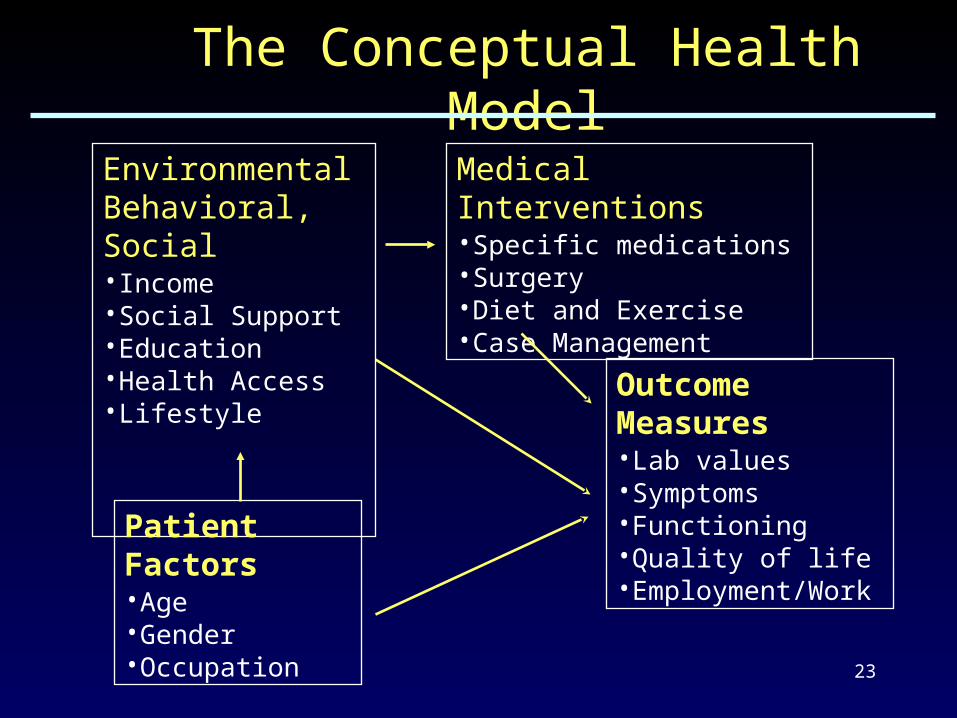
The Conceptual Health Model
Environmental Behavioral, Social•Income•Social Support•Education•Health Access•Lifestyle
Patient Factors•Age•Gender•Occupation
Medical Interventions•Specific medications•Surgery•Diet and Exercise•Case Management
Outcome Measures•Lab values•Symptoms•Functioning•Quality of life•Employment/Work

24
The Outcomes Model
Patient Characteristics
Structure (Setting)
Process (Treatment)
OUTCOME
Change
Change
Risk Adjustment
Measurement
25
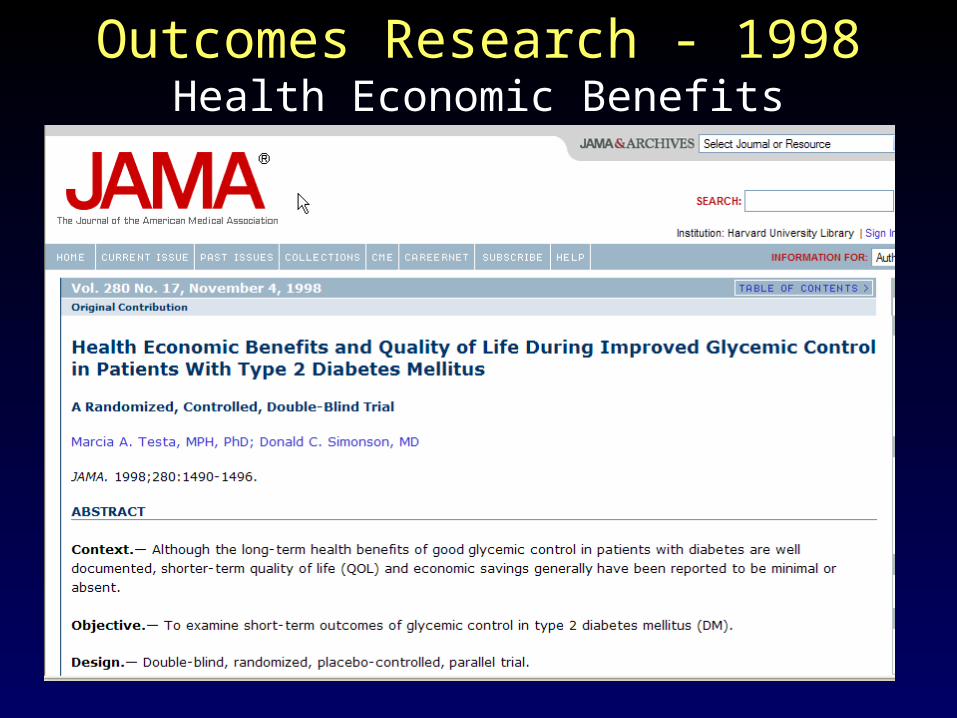
Outcomes Research - 1998Health Economic Benefits
26
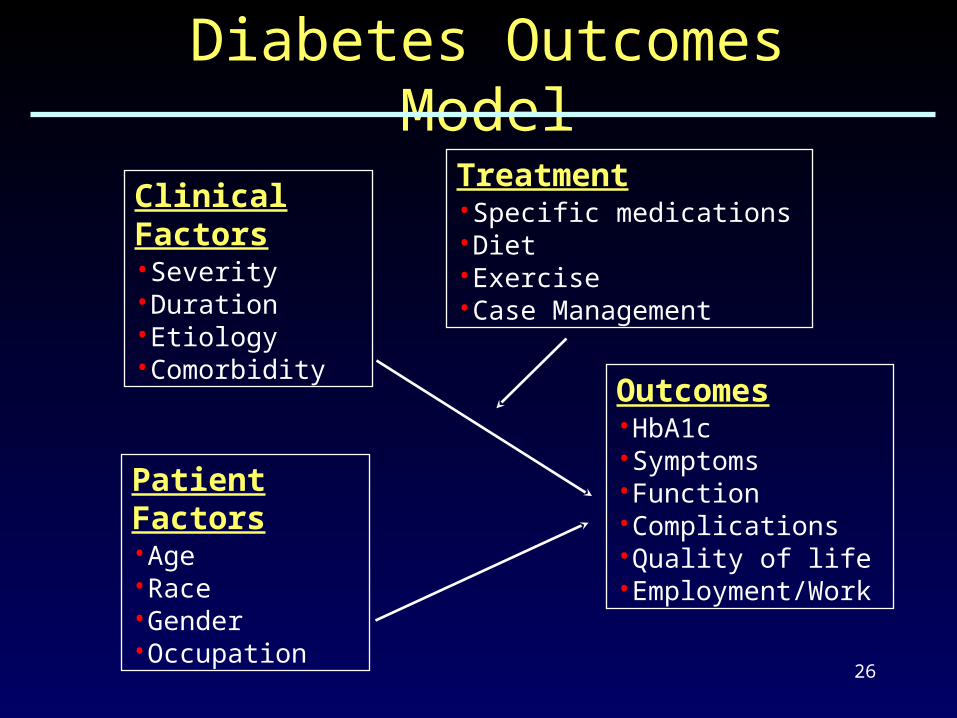
Diabetes Outcomes Model
Clinical Factors•Severity•Duration•Etiology•Comorbidity
Patient Factors•Age•Race•Gender•Occupation
Treatment•Specific medications•Diet•Exercise•Case Management
Outcomes•HbA1c•Symptoms•Function•Complications•Quality of life•Employment/Work

27
Understanding Causal Pathways
EFFICACY
• Clinical 1c
QUALITY OF LIFE
• Functional status• Physical, Mental,Cognitive, Social
SIDE EFFECTS
•Adverse reactions
REGIMEN BURDEN
• Pain, Life-style,discomfort
HEALTH STATUS
• Self-ReportedSymptom distress
HEALTH ECONOMICS
• Productivity
• Health Care UtilizationTreatment Satisfaction
Adherence
28
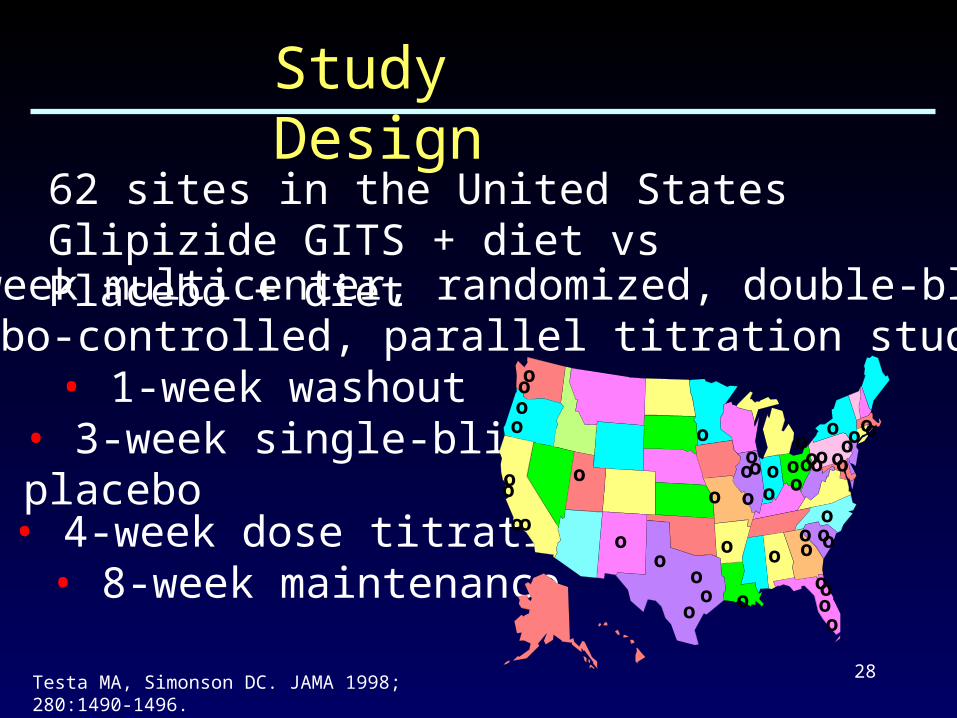
Study Design
62 sites in the United StatesGlipizide GITS + diet vs Placebo + diet16-week multicenter, randomized, double-blind, placebo-controlled, parallel titration study
• 1-week washout• 3-week single-blindplacebo• 4-week dose titration• 8-week maintenance
o
o
o
o
oo
oo
oo
oo
oo
o
o
o
o
o
o
o
o
o oo
o oo
oo o
o
oo
o
ooo
oooooo
o
ooo
Testa MA, Simonson DC. JAMA 1998; 280:1490-1496.

29
Study Design
Screening / washout
Single-blind placebo
Dose titration 5-20 mg
Maintenance
Week -1 0 1 2 3 4 5 6 7 8 9 10 11 12 13 14 15
Maintenance
Randomization to placebo & diet orGlipizide GITS & diet (1:2)
Clinical and Laboratory Assessment
Health Economic Assessment
■
Testa MA, Simonson DC. JAMA 1998; 280:1490-1496.
■ ■ ■ ■
■

30
Multicenter, Random ized C linical Trial
W eek 4 ,8 ,n = 1 7 8 ,1 6 9
E arly W ith d raw a l
W eek 1 2n = 1 5 8
C om p le te rs
D ie t & P laceb oIn e lig . Q O L : n = 9
E lig ib le Q O L : n = 1 9 2
W eek 4 ,8n = 3 4 9 ,3 4 0
E arly W ith d raw a l
W eeK 1 2n = 3 3 3
C om p le te rs
D ie t an d G L ip iz id e G ITSIn e lig Q O L : n = 1 6E lig ib le : n = 3 7 7
S c reen ed /P laceb o W ashN = 1 0 0 7
E lig ib le fo r C lin ica l S tu d yn = 5 9 4

31
Patient Population
Baseline Clinical Characteristics
Placebo Glipizide GITS
Number of Patients 201 393
Gender (M / F) (%) 60 / 40 55 / 45
Race (W / B / O) (%) 70 / 18 / 12 70 / 18 / 12
Emp / Ret / Unemp(%) 50 / 38 / 12 48 / 40 / 12
Age (yrs) 58 ± 12 59 ± 11
Duration DM (yrs) 5 ± 5 6 ± 6
FPG (mg / dL) 231 ± 66 218 ± 62
HbA1c (%) 8.7 ± 1.4 8.5 ± 1.5
Testa MA, Simonson DC. JAMA 1998; 280:1490-1496.

32
Clinical Results
End of Week 15
Placebo Glipizide GITS P-Value
FPG (mg / dL) 224 ± 66 161 ± 41 < 0.001
HbA1c (%) 9.3 ± 1.9 7.5 ± 1.2 < 0.001
Hypoglycemic Symptoms (%)
4.8 6 NS
Glucose < 55mg / dL (%)
0 0 NS
Testa MA, Simonson DC. JAMA 1998; 280:1490-1496.

33
HbA1c and Symptom Distress
HEALTH STATUS
• Self-Reported Symptom distress
EFFICACY
• HbA1c

34
Pharmacological SideEffects and Symptom Distress
HEALTH STATUS
• Self-reported Symptom distress
EFFICACY
• HbA1c
SIDE EFFECTS
•Adverse reactions

35SD UnitsSD Units
Mean HbAMean HbA1c1c: 9.3 : 9.3 1.9% 7.5 1.9% 7.5 1.2%1.2%TremblingTrembling
Low blood sugar reactionLow blood sugar reactionFast pulse, rapid heartbeat, palpitationsFast pulse, rapid heartbeat, palpitations
HeartburnHeartburnWheezing or difficulty breathingWheezing or difficulty breathing
Gaining weightGaining weightCold hands or feetCold hands or feetFeeling overweightFeeling overweight
ConstipationConstipationSwelling of feet or anklesSwelling of feet or ankles
Abdominal crampsAbdominal crampsSkin rashSkin rash
Decrease in appetiteDecrease in appetiteMood swingsMood swingsLosing weightLosing weight
Flushing, sensation of heatFlushing, sensation of heatShortness of breath or breathing hardShortness of breath or breathing hard
Increase in hungerIncrease in hungerInability to sleep, insomniaInability to sleep, insomnia
Pains in legs or calvesPains in legs or calvesLightheadednessLightheadedness
Lethargy, no energy to do thingsLethargy, no energy to do thingsNumbness or tingling of hands or feetNumbness or tingling of hands or feet
VomitingVomitingNauseous, queasy, sick to stomachNauseous, queasy, sick to stomach
DiarrheaDiarrheaItching, scratchingItching, scratching
Heart pounding, beating hardHeart pounding, beating hardNightmaresNightmaresHeadachesHeadaches
Impaired or worsening visionImpaired or worsening visionTired, feeling wearyTired, feeling weary
Muscle crampsMuscle crampsVertigo, sensation of spinningVertigo, sensation of spinning
Dizziness when standing upDizziness when standing upTightness,pain in chest Tightness,pain in chest
Drowsy or sleepyDrowsy or sleepyCold sweat, clammy skinCold sweat, clammy skin
Sugar in urineSugar in urineFoot cramps, foot painFoot cramps, foot pain
Sweating, perspiringSweating, perspiringConfusionConfusion
General weakness or fatigueGeneral weakness or fatigueNumbness of lips or mouthNumbness of lips or mouth
Blurred or double visionBlurred or double visionCrabby, short-temperedCrabby, short-tempered
Getting up often during the night to urinateGetting up often during the night to urinateBeing ThirstyBeing Thirsty
Having to urinate frequentlyHaving to urinate frequentlySweet taste in mouthSweet taste in mouthDrinking a lot of fluidsDrinking a lot of fluids
Dryness of mouth, eyes or noseDryness of mouth, eyes or noseHigh blood sugarHigh blood sugar
00 0.20.2 0.40.4 0.60.6 0.80.8 11-0.2-0.2
P < .05P < .05
P < .001P < .001
P < .01P < .01
P = N.S.P = N.S.
Symptom Worsening Symptom Worsening With Glucose With Glucose LoweringLowering
Symptom Symptom Improvement With Improvement With Glucose LoweringGlucose Lowering
Testa MA, Simonson DC. JAMA 1998; 280:1490-1496.
Hypoglycemic Hypoglycemic symptoms, weight gain,symptoms, weight gain, feeling overweightfeeling overweight
Hyperglycemic Hyperglycemic symptoms,symptoms,thirst, nocturia, thirst, nocturia, blurred vision, blurred vision, fatiguefatigue
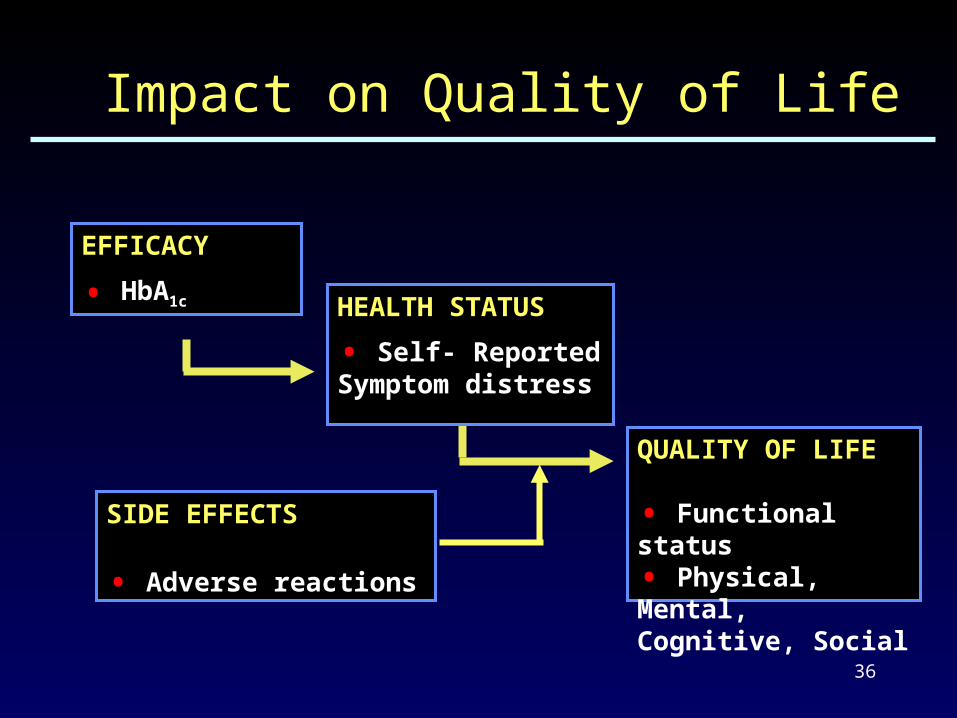
36
EFFICACY
• HbA1c HEALTH STATUS
• Self- Reported Symptom distress
QUALITY OF LIFE
• Functional status• Physical, Mental, Cognitive, Social
Impact on Quality of Life
SIDE EFFECTS
• Adverse reactions

37
Change In QOL Scales With Therapy in Type 2 Diabetes
-0.3-0.3
-0.2-0.2
-0.1-0.1
00
0.10.1
0.20.2
0.30.3
0.40.4
PlaceboPlacebo Glipizide GITSGlipizide GITS
QO
L S
core
(S
D u
nit
s)Q
OL
Sco
re (
SD
un
its)
Overall RatingOverall RatingMental HealthMental HealthCognitive FunctionCognitive FunctionPerceived HealthPerceived HealthSymptom DistressSymptom Distress
* P < 0.05** P < 0.01*** P < 0.001
*****
***
Testa MA, Simonson DC. JAMA 1998; 280:1490-1496.

38
Change in HbA1c and QOL
In Patients with NIDDM
*
0
0.2
-0.2
-0.4
-0.6
-0.8 QO
L G
loba
l Ou
tco
me
(Z
-sco
re)
>1.5 1.5 to .5 .5 to -.5 -.5 to -1.5 <-1.5ImprovedHbA1c
WorsenedHbA1c HbA 1 c (%) Change from Baseline
log-linear regression, r = .95, p < .01
Favorable QOL Response
Unfavorable QOL Response
No Change in HbA1c*
** *
No Change in QOL
Testa MA, Simonson DC. JAMA 1998; 280:1490-1496.

39
Understanding Causal Pathways
EFFICACY
• Clinical 1c
QUALITY OF LIFE
• Functional status• Physical, Mental,Cognitive, Social
SIDE EFFECTS
•Adverse reactions
REGIMEN BURDEN
• Pain, Life-style,discomfort
HEALTH STATUS
• Self-ReportedSymptom distress
HEALTH ECONOMICS
• Productivity
• Health Care UtilizationTreatment Satisfaction
Adherence
40
$ Loss$ Loss
$ Savings$ Savings
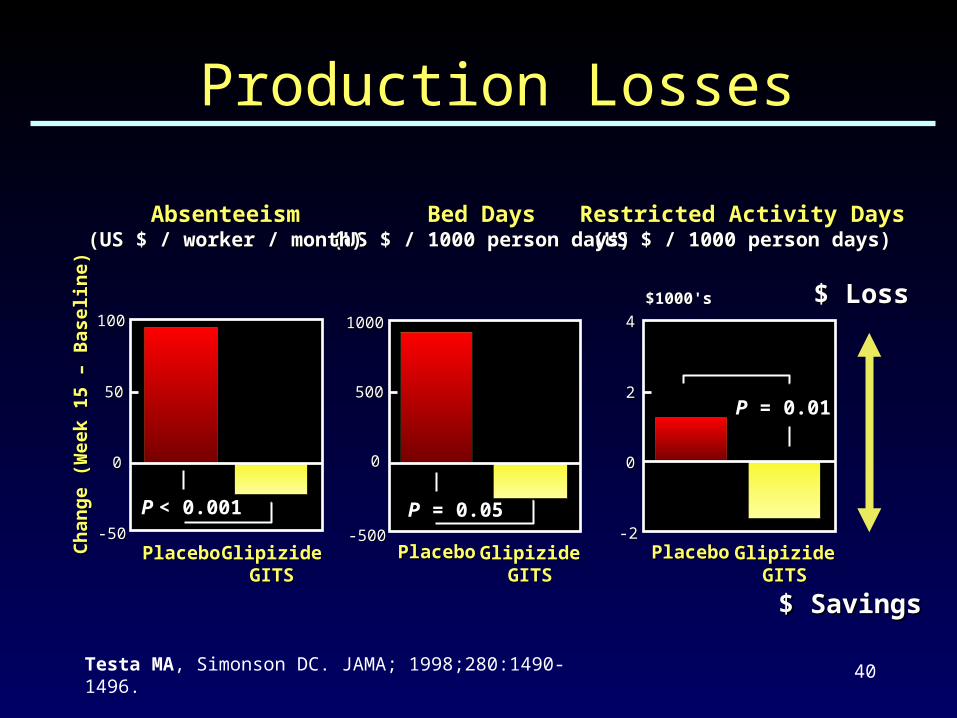
Production Losses
PlaceboPlacebo GlipizideGlipizideGITSGITS
00
22
44
-2-2
P = 0.01
Restricted Activity DaysRestricted Activity Days(US $ / 1000 person days)(US $ / 1000 person days)
$1000's$1000's
PlaceboPlacebo
00
500500
10001000
-500-500
P = 0.05
Bed DaysBed Days(US $ / 1000 person days)(US $ / 1000 person days)
GlipizideGlipizideGITSGITS
PlaceboPlacebo
00
5050
100100
-50-50
P < 0.001
AbsenteeismAbsenteeism(US $ / worker / month)(US $ / worker / month)
Ch
ang
e (
Wee
k 1
5 –
Bas
elin
e)C
han
ge
(W
eek
15
– B
asel
ine)
GlipizideGlipizideGITSGITS
Testa MA, Simonson DC. JAMA; 1998;280:1490-1496.
41
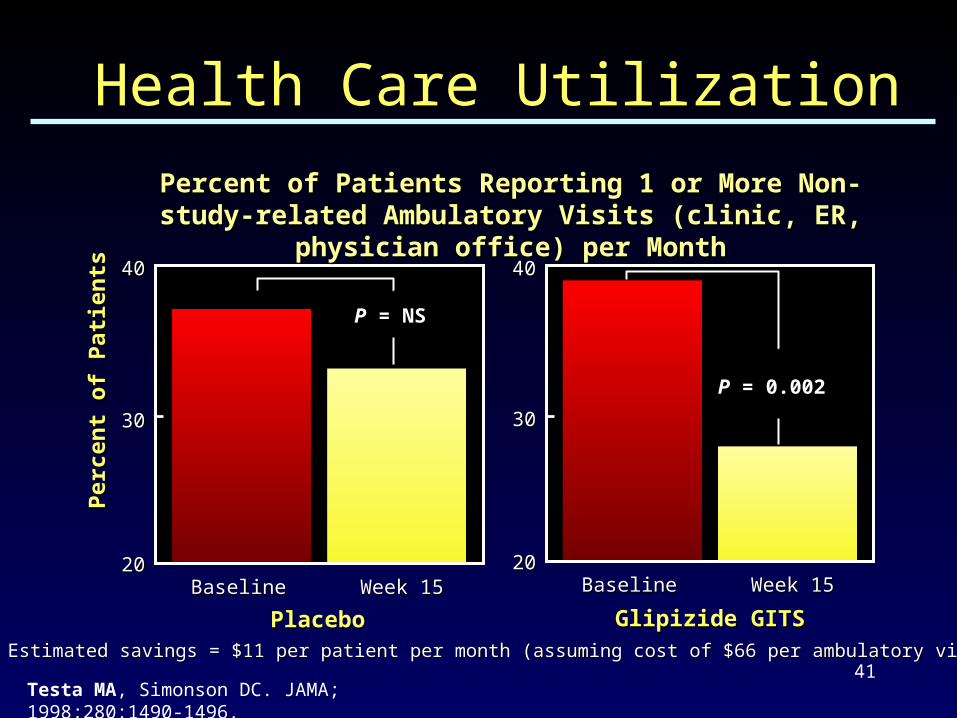
BaselineBaseline Week 15Week 152020
3030
4040
PP = NS = NS
Pe
rcen
t o
f P
ati
ents
Pe
rcen
t o
f P
ati
ents
BaselineBaseline Week 15Week 152020
3030
4040
P = 0.002
Percent of Patients Reporting 1 or More Non-study-Percent of Patients Reporting 1 or More Non-study-related Ambulatory Visits (clinic, ER, physician office) related Ambulatory Visits (clinic, ER, physician office)
per Monthper Month
Estimated savings = $11 per patient per month (assuming cost of $66 per ambulatory visit)Estimated savings = $11 per patient per month (assuming cost of $66 per ambulatory visit)
PlaceboPlacebo Glipizide GITSGlipizide GITS
Health Care Utilization
Testa MA, Simonson DC. JAMA; 1998;280:1490-1496.

42
Summary
• Use Outcomes Research to – Improve the quality of health care by changing
treatment and services and by promoting preventive strategies
• Outcomes are “probability statements”– Multifaceted– Requires integrating and consolidating many
different components of health functioning
• Outcomes may take time to develop, use intermediate outcomes if necessary
43
Summary
• Use Outcomes Research to – Improve the quality of health care by changing
treatment and services and by promoting preventive strategies
• Outcomes are “probability statements”– Multifaceted– Requires integrating and consolidating many
different components of health functioning
• Outcomes may take time to develop, use an intermediate outcomes

44
Additional Resources and References
• Online Questionnaires: SF12, LASA, EQ-5D. • SF-36 translated into Arabic by Saud Abdulaziz bin Al
Abdulmoshin, 1997• Coons SJ, Reliability of an Arabic Version of the
RAND-36 Health Survey and Its Equivalence to the US English Version
• Testa and Simonson, NEJM, 1996• Testa and Simonson, JAMA, 1998• Straus, Testa, Sarokhan et al., Cancer 2006