Embed Size (px)
Citation preview
1
Developing a Methodology for Road Network Vulnerability
Analysis
Erik JeneliusDiv. of Transport and Location Analysis
Dept. of Transport and EconomicsRoyal Institute of Technology (KTH), Stockholm
Nectar Cluster 1 Seminar, 12th – 13th May 2006, Molde University College
2
Summary
• Description of new project“Vulnerability Analyses of Road Networks”- Problem- Aim- Method
• Review of pilot study (Jenelius et al, 2006)
- Concepts- Application examples
3
Why study road network vulnerability?
• Welfare of citizens• Development and competitiveness of industry• Efficient commuting• Efficient logistics (just-in-time)• Regional development• Infrastructure repairs• …
• Which roads are particularly important?• Which regions are particularly exposed?
4
New Project: Aims
• Develop indicators of vulnerability and methods by which the effects of various actions could be assessed
• Develop tools to describe the functioning of the road system for the communication with the business community, regional representatives and different groups of users
• Connect to cost-benefit analysis so that it will be possible to analyse how the vulnerability could be reduced given limited budget for investments, operations and maintenance.
5
Method
• Primarily develop ideas from previous pilot study (Jenelius et al, 2006)
• Develop a new modelling tool- increase speed- include possibilities to handle scenarios (storms, floods, …)- integrate with GIS for visualization and scenario building
• In case of available data and time:- model and estimate weakness of links from historical incident data
6
Desired outcomes
• Perform study for the whole Swedish road network
• Study sub-network that complies with certain bearing capacity
• Study specific group such as timber transports• Scenario models:
- thaw, floods, extreme weather, accidents, …
7
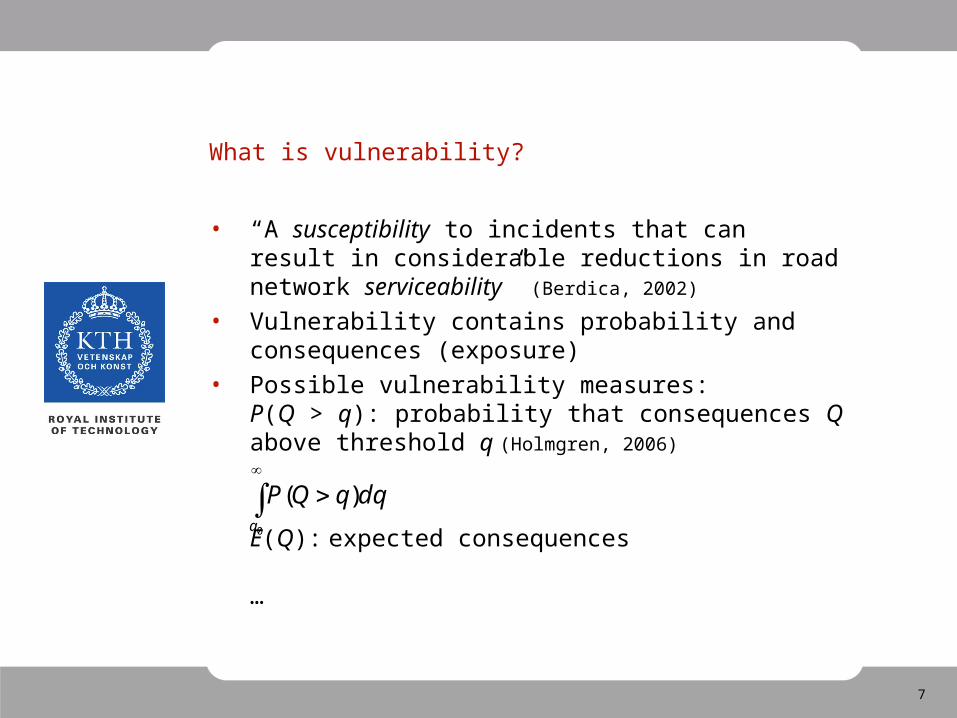
What is vulnerability?
• “A susceptibility to incidents that can result in considerable reductions in road network serviceability” (Berdica, 2002)
• Vulnerability contains probability and consequences (exposure)
• Possible vulnerability measures:P(Q > q): probability that consequences Q above threshold q (Holmgren, 2006)
E(Q): expected consequences
…
0
)(q
dqqQP
8
Consequences: Importance and exposure
• The weakness of a link is the probability of a failure
• The importance of a link are the consequences of failure
• The criticality is a combination of weakness and importance
• The exposure of a region to a certain harmful event is the consequences of that event for that region
• Link k important to region R Region R exposed to failure of link k
9
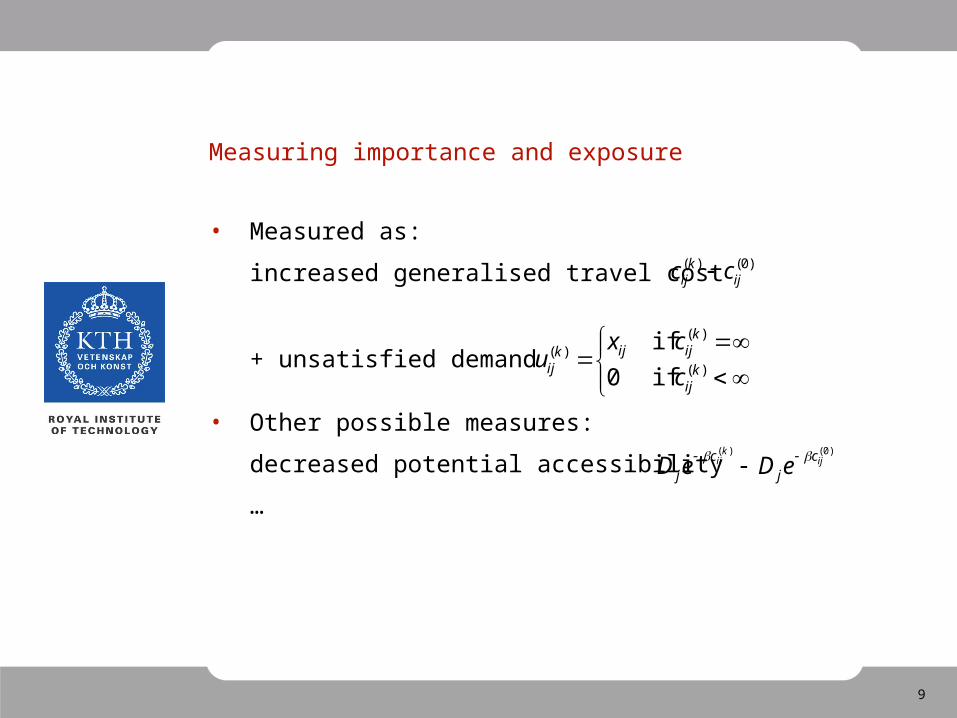
Measuring importance and exposure
• Measured as:
increased generalised travel cost
+ unsatisfied demand
• Other possible measures:
decreased potential accessibility
…
)0()(ij
kij c
jc
j eDeD
if0
if)(
)()(
kij
kijijk
ij c
cxu
)0()(ij
kij cc
10
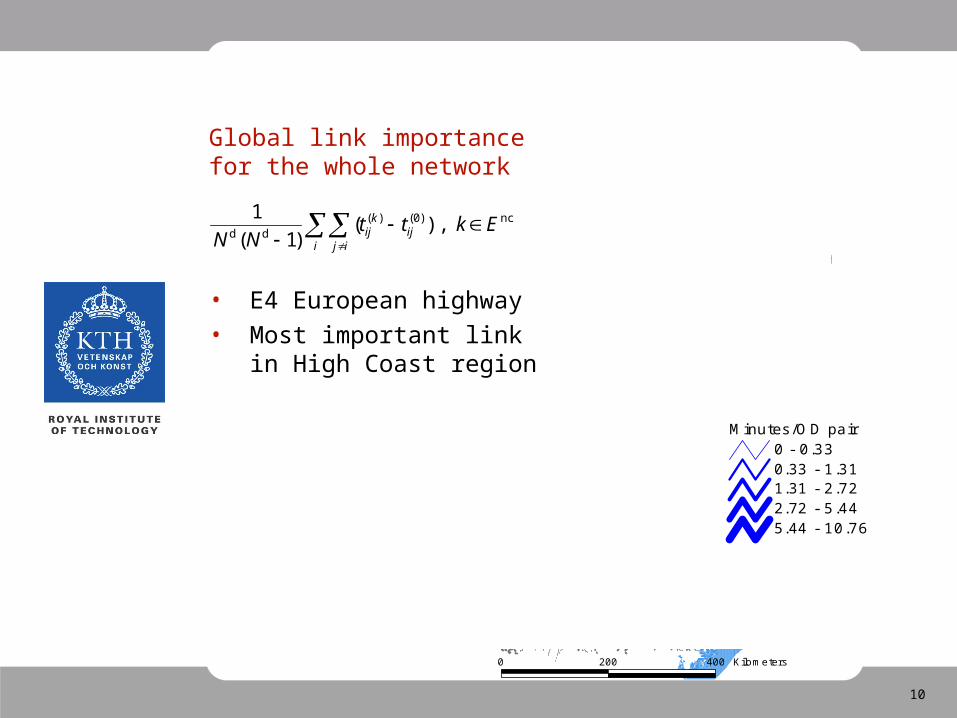
Global link importancefor the whole network
• E4 European highway• Most important link in
High Coast region
Minutes/OD pair0 - 0.330.33 - 1.311.31 - 2.722.72 - 5.445.44 - 10.76
0 200 400 Kilometers
i ij
ijkij Ektt
NNnc)0()(
dd),(
)1(
1
11
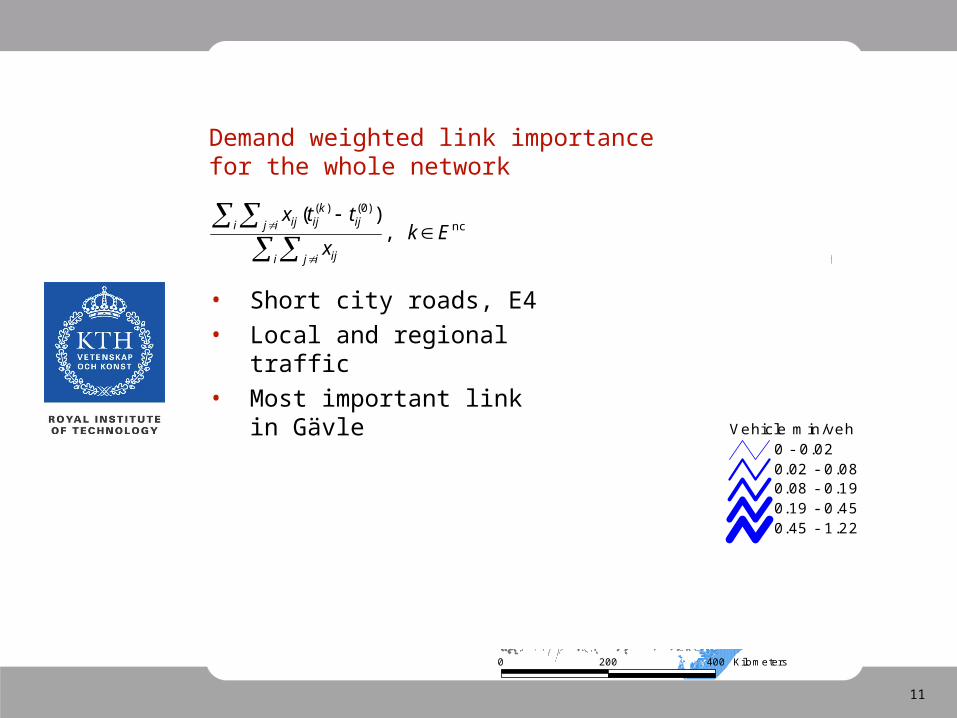
Demand weighted link importancefor the whole network
• Short city roads, E4• Local and regional traffic• Most important link
in GävleVehicle min/veh
0 - 0.020.02 - 0.080.08 - 0.190.19 - 0.450.45 - 1.22
0 200 400 Kilometers
nc
)0()(
,)(
Ekx
ttx
i ij ij
i ij ijkijij
12
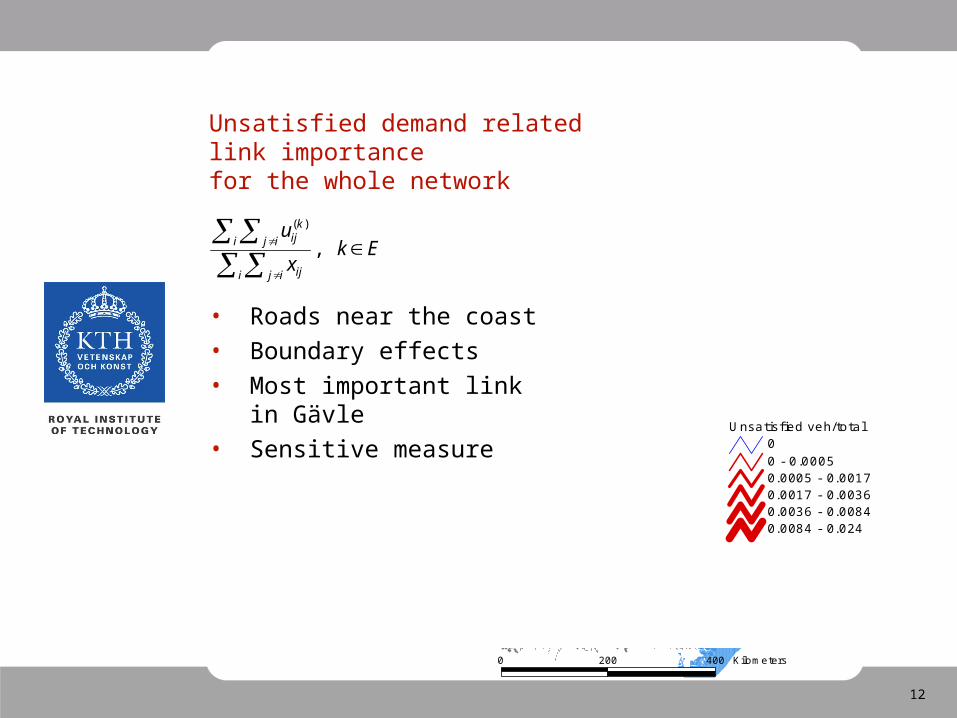
Unsatisfied demand related link importancefor the whole network
• Roads near the coast• Boundary effects• Most important link
in Gävle• Sensitive measure
Unsatisfied veh/total00 - 0.00050.0005 - 0.00170.0017 - 0.00360.0036 - 0.00840.0084 - 0.024
0 200 400 Kilometers
Ekx
u
i ij ij
i ij
kij
,)(
13
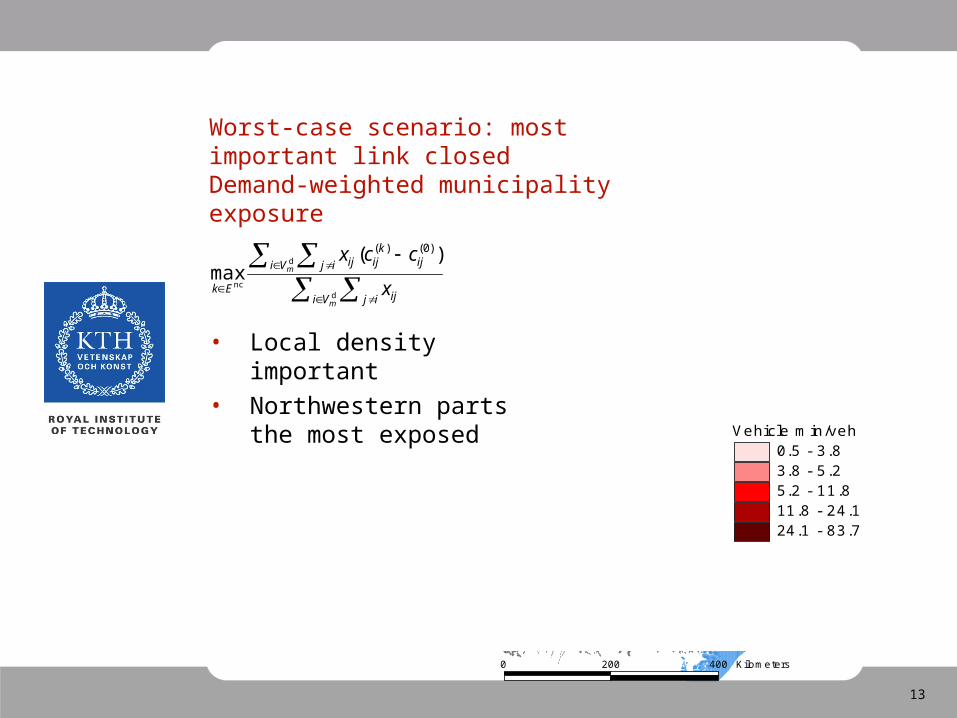
Worst-case scenario: most important link closedDemand-weighted municipality exposure
• Local density important
• Northwestern parts the most exposed Vehicle min/veh
0.5 - 3.83.8 - 5.25.2 - 11.811.8 - 24.124.1 - 83.7
0 200 400 Kilometers
d
d
nc
)(max
)0()(
m
m
Vi ij ij
Vi ij ijkijij
Ek x
ccx
14
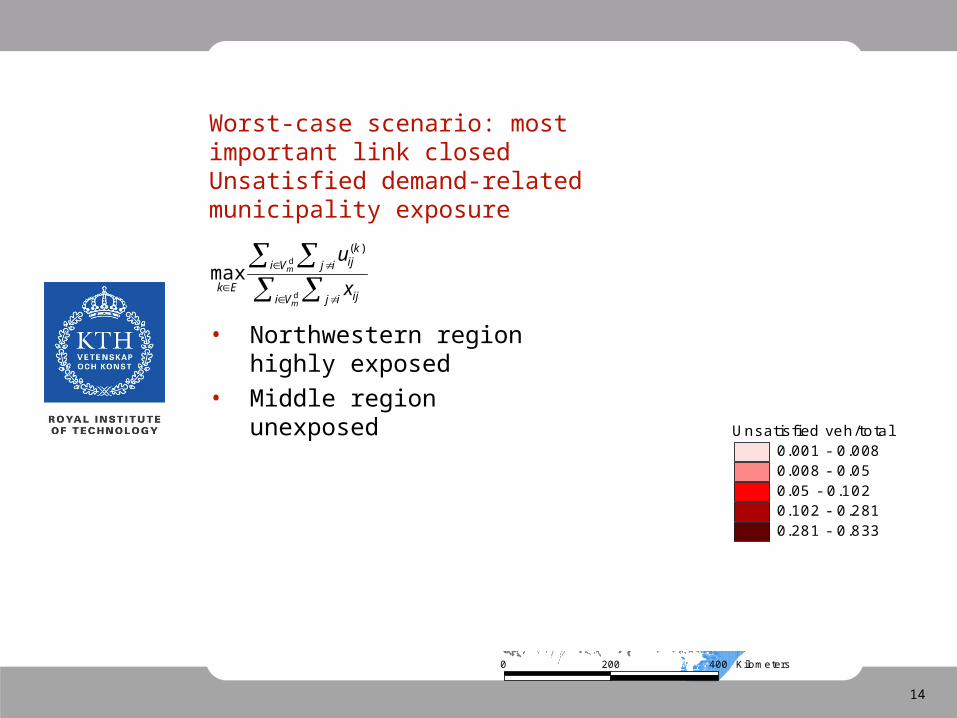
Worst-case scenario: most important link closedUnsatisfied demand-relatedmunicipality exposure
• Northwestern region highly exposed
• Middle region unexposed Unsatisfied veh/total
0.001 - 0.0080.008 - 0.050.05 - 0.1020.102 - 0.2810.281 - 0.833
0 200 400 Kilometers
d
d
)(
maxm
m
Vi ij ij
Vi ij
kij
Ek x
u