Embed Size (px)
Citation preview

1
Geography and road network
vulnerability
Erik JeneliusDiv. of Transport and Location Analysis
Royal Institute of Technology (KTH), Stockholm

2
Aims of the presentation
• Study the vulnerability of different geographic regions in Sweden’s road network
• Assess the regional equity of the road network in terms of vulnerability
• Find properties of geography, network and traffic that explain regional differences, develop proxy variables
3
Road network vulnerability
• Vulnerability is a susceptibility to incidents that can result in considerable reductions in road network serviceability (Berdica, 2002)
• Typical scenarios: Extreme weather, landslides, major accidents, malevolent attacks
• Vulnerability analysis should contain both probability/frequency and consequence
• In the following, we focus on consequence (conditional vulnerability)
4
Consequence measure (1)
• Considered incident: A single road link is completely cut off/blocked/closed a certain period
• Some assumptions:
1. Changes only in route and departure time choices, not in trip generation, destination or mode choices
2. Users choose shortest route
3. Perfect information on the incident
4. Constant demand/hr
• Consequence measure: Increased travel time/delayed arrival for car users

5
Consequence measure (2)
• Two possibilities during closure:
1. No alt. routes: Users wait until link reopened
xod = demand/hr, topen = closure duration
2. Alt. routes: Users take new shortest route, or if better, wait
• Value of alt. routes increases with closure duration
2
2opentx
T odkod
. if2
, if2
openopen
open
2open
ttx
ttx
Tkod
kodk
odod
kod
od
kod

6
Regional exposure (conditional vulnerability)
• The average-case exposure of a region is the expected consequences for the region of a randomly located link closure
• Two variants:
1. User exposure: The average increase in travel time per user starting in the region
2. Total exposure: The total increase in travel time for all users starting in the region (socio-economic consequence)
ro od
odk ro od
kodk txTwrUE open)(
k ro od
kodk TwrTE )(

7
Regional inequity
• Large regional disparities in exposure indicate spatial inequity between users and regions
• A measure of equity: Gini coefficient G
G = 0: perfect equity
G = 1: perfect inequity
8
Case study: Sweden
• Two closure durations: 30 minutes and 48 hours
• Average-case user and total exposure of every municipality (289)
• Network, O-D demand and equilibrium link travel times from SAMPERS
• No congestion effects - underestimation in dense areas
• 77,769 nodes, 174,046 links, 8,764 centroids
9
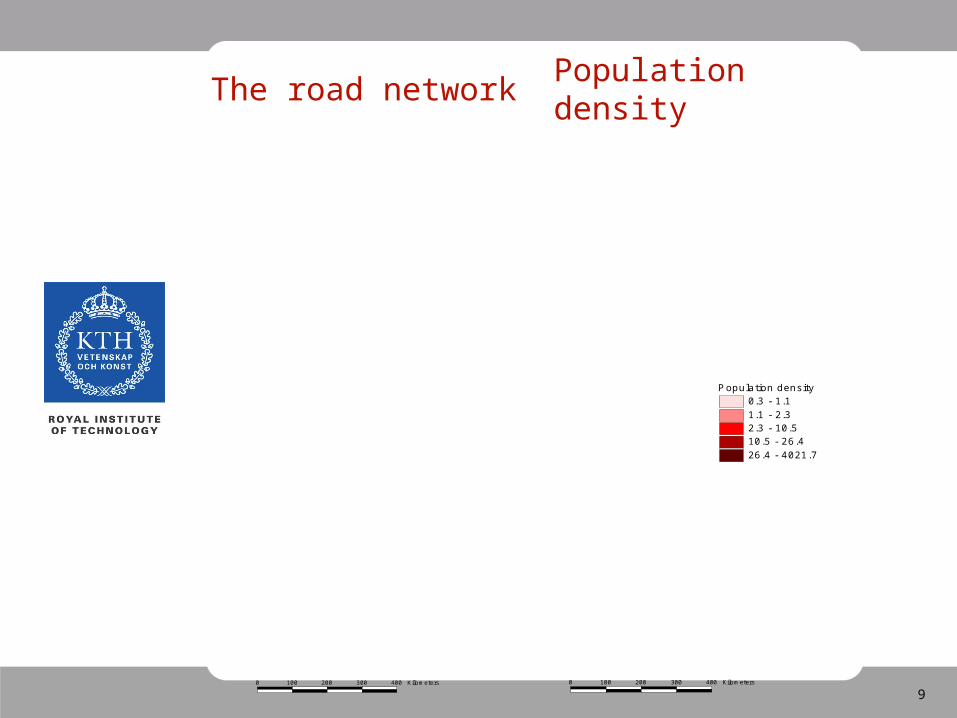
The road network
0 100 200 300 400 Kilometers
Population density
0 100 200 300 400 Kilometers
Population density0.3 - 1.11.1 - 2.32.3 - 10.510.5 - 26.426.4 - 4021.7
10
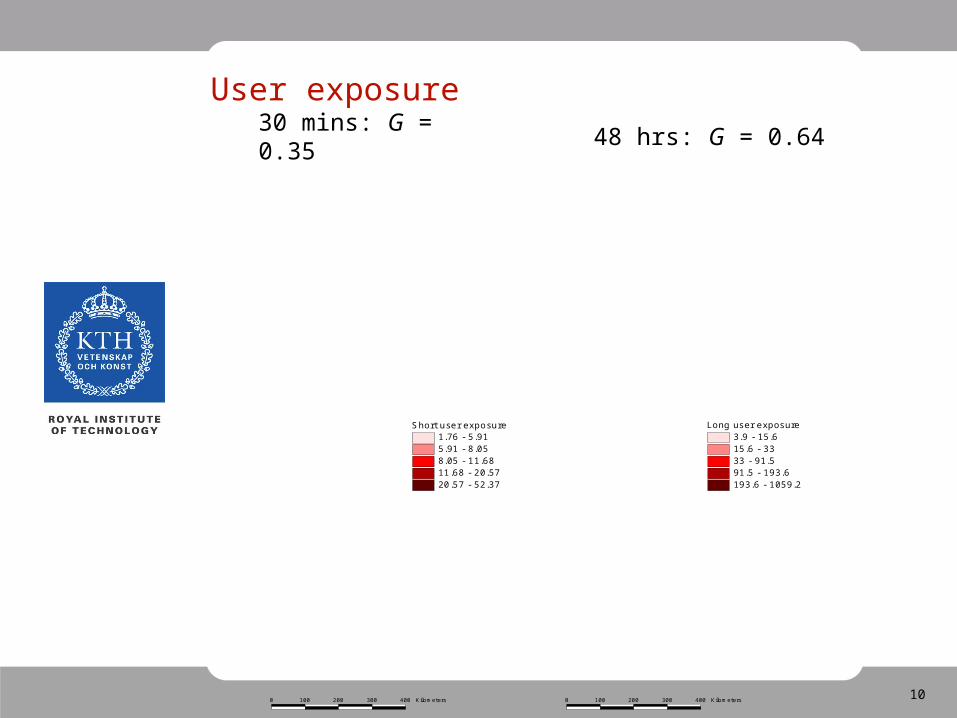
User exposure30 mins: G = 0.35
0 100 200 300 400 Kilometers
Short user exposure1.76 - 5.915.91 - 8.058.05 - 11.6811.68 - 20.5720.57 - 52.37
0 100 200 300 400 Kilometers
Long user exposure3.9 - 15.615.6 - 3333 - 91.591.5 - 193.6193.6 - 1059.2
48 hrs: G = 0.64

11
Total exposure30 mins: G = 0.43 48 hrs: G = 0.71
0 100 200 300 400 Kilometers
Short total exposure0.34 - 0.910.91 - 1.561.56 - 2.542.54 - 3.233.23 - 31.84
0 100 200 300 400 Kilometers
Long total exposure0.06 - 0.310.31 - 0.710.71 - 1.191.19 - 4.594.59 - 28.09
12
Proxy variables (1)
• What affects the regional disparities in user and total exposure?
• Long closure: Location of cut links
• Short closure:
1. sparsity of the regional road network
2. average/total initial travel times of the users

13
Proxy variables (2)
• Two measures of road network sparsity:
1. Geographic sparsity:
2. Network sparsity:
where Ar = surface area, Lr = length of road, lr = average link length, r = links-to-nodes ratio of region r
r
rr L
AGS
r
rr
lNS
14
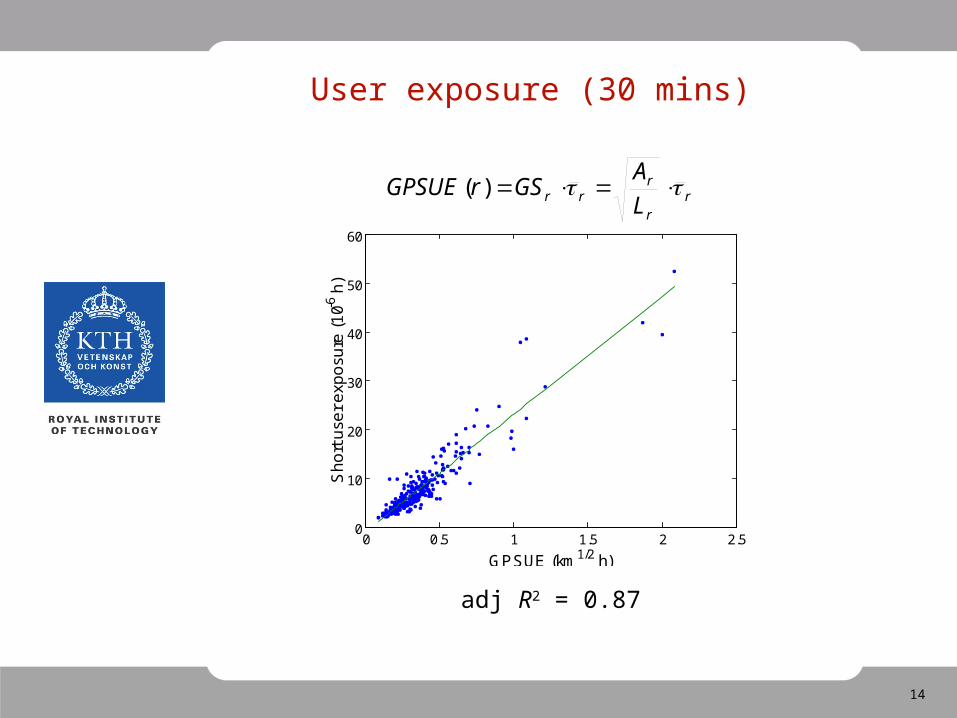
User exposure (30 mins)
adj R2 = 0.87
0 0.5 1 1.5 2 2.50
10
20
30
40
50
60
GPSUE (km1/2 h)
Sh
ort
use
r e
xpo
sure
(1
0-6 h
)
rr
rrr L
AGSrGPSUE )(
15
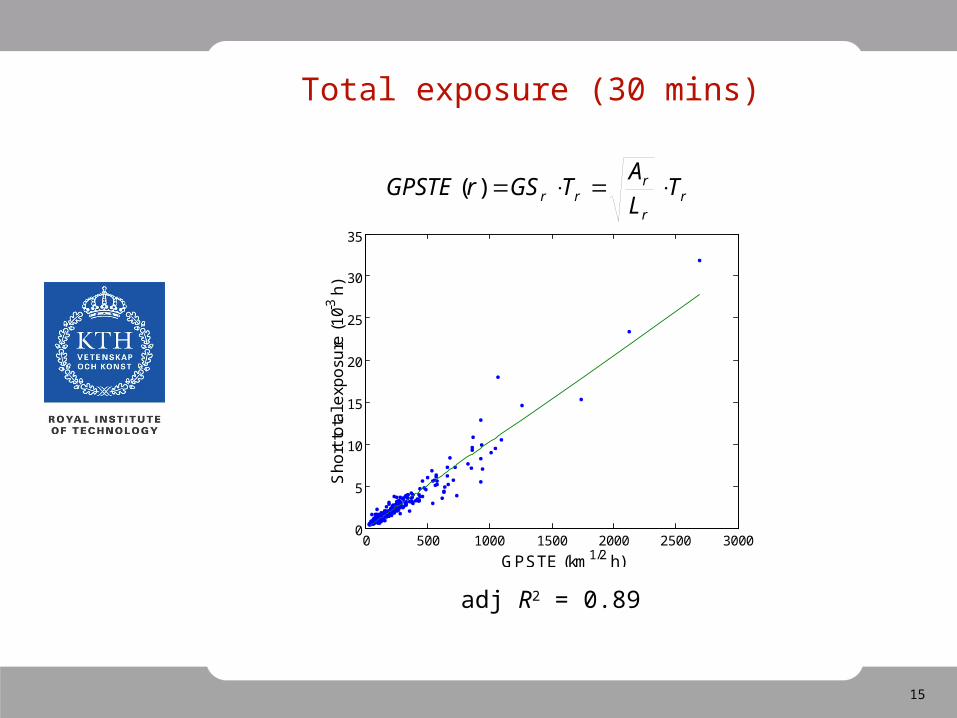
Total exposure (30 mins)
adj R2 = 0.89
0 500 1000 1500 2000 2500 30000
5
10
15
20
25
30
35
GPSTE (km1/2 h)
Sh
ort
tota
l exp
osu
re (
10-3
h)
rr
rrr T
L
ATGSrGPSTE )(
16
Conclusions
• Considerable regional disparities in exposure and importance, larger for longer closures
• Results are robust to change of partition
• Interesting topics for further research:
• How would congestion effects, more realistic closure probabilities etc affect the results?
• Compare with other countries
• Universality of proxy variables?
17
Thank you