Embed Size (px)
Citation preview
1
Experiences from extracting large data sets from Swedish public offices
Fredrik Liljeros
Outline•Why use data sets from public offices?
•Three example of available Swedish datasetsWorkplace and household dataIn-patient dataData of suspected criminals
•Problems with Swedish public office data
Sociological data
• Expensive to collect
• Time consuming (Especially time series)
• Low response rate
• Network data are associated with special problems
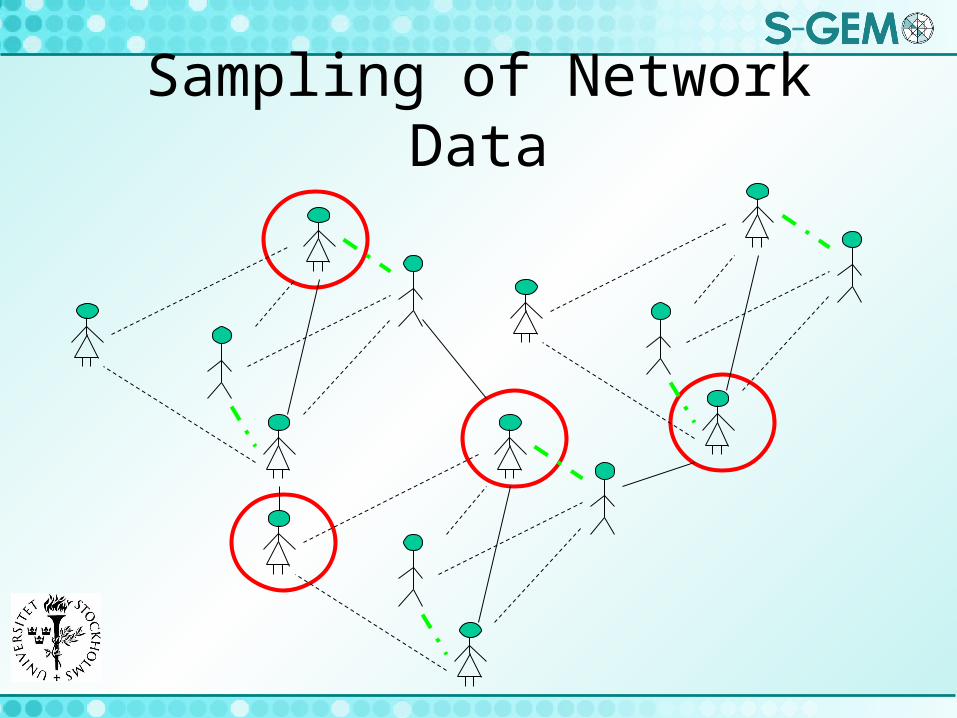
Sampling of Network Data
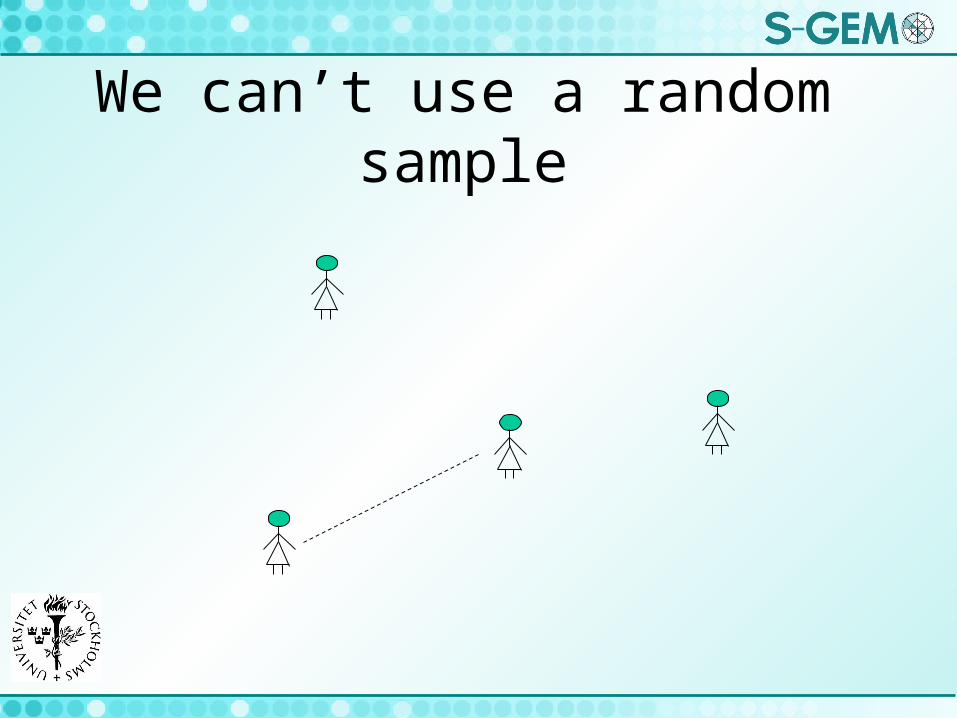
We can’t use a random sample
Extracting data from existing databases!
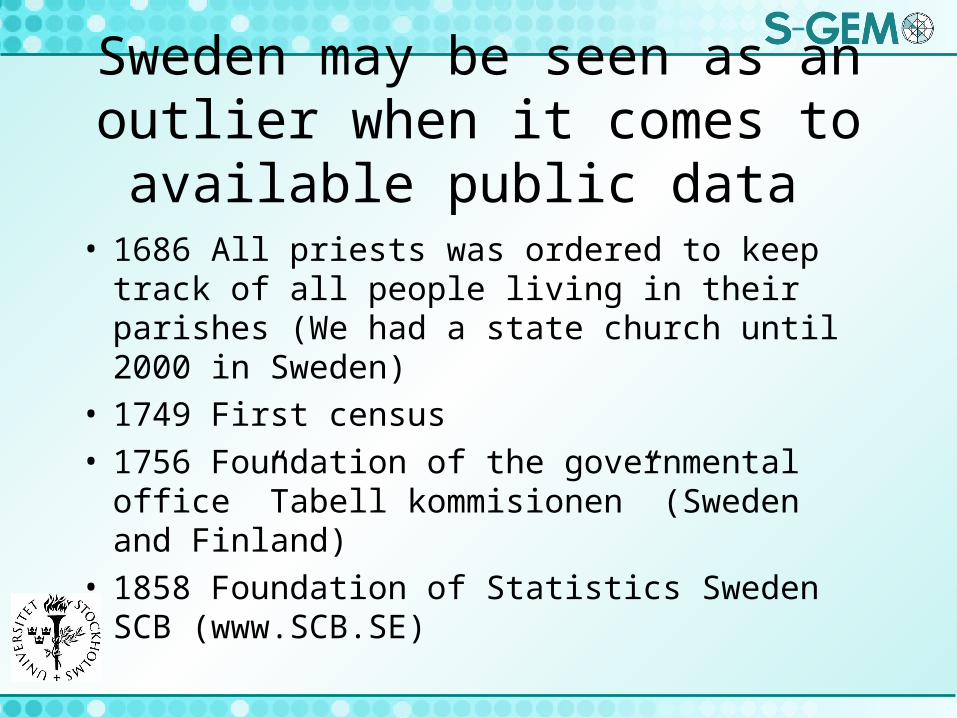
Sweden may be seen as an outlier when it comes to available public data
• 1686 All priests was ordered to keep track of all people living in their parishes (We had a state church until 2000 in Sweden)
• 1749 First census• 1756 Foundation of the governmental office
”Tabell kommisionen” (Sweden and Finland)• 1858 Foundation of Statistics Sweden SCB
(www.SCB.SE)
All individuals officially living in Sweden have an unique identifier
”personnummer”
700209-0960
Example 1
The Sweden database
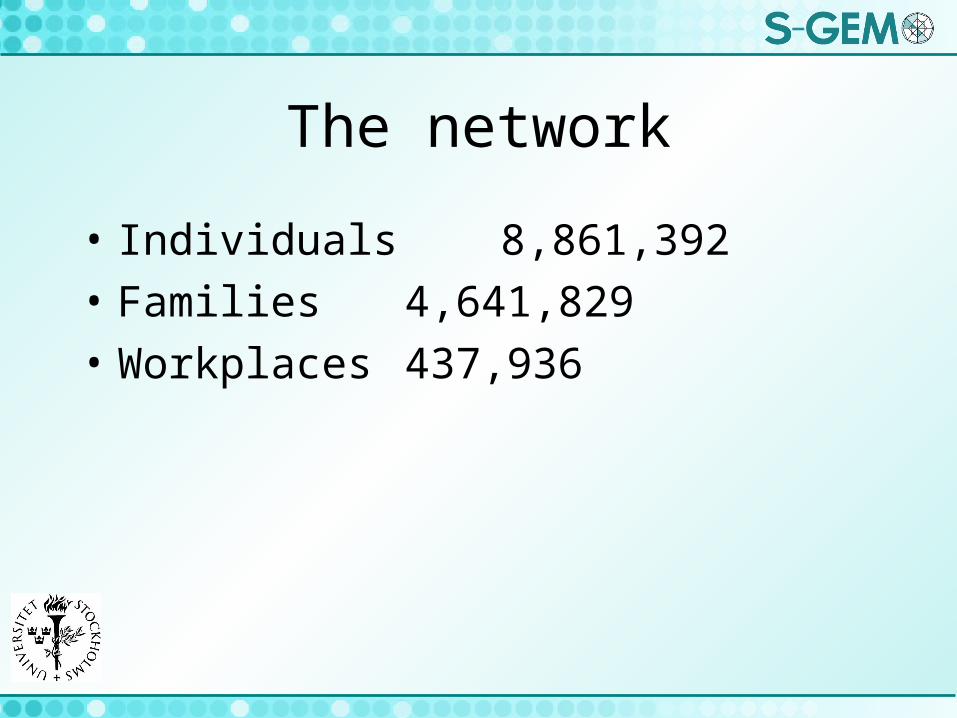
The network
• Individuals 8,861,392
• Families 4,641,829
• Workplaces 437,936
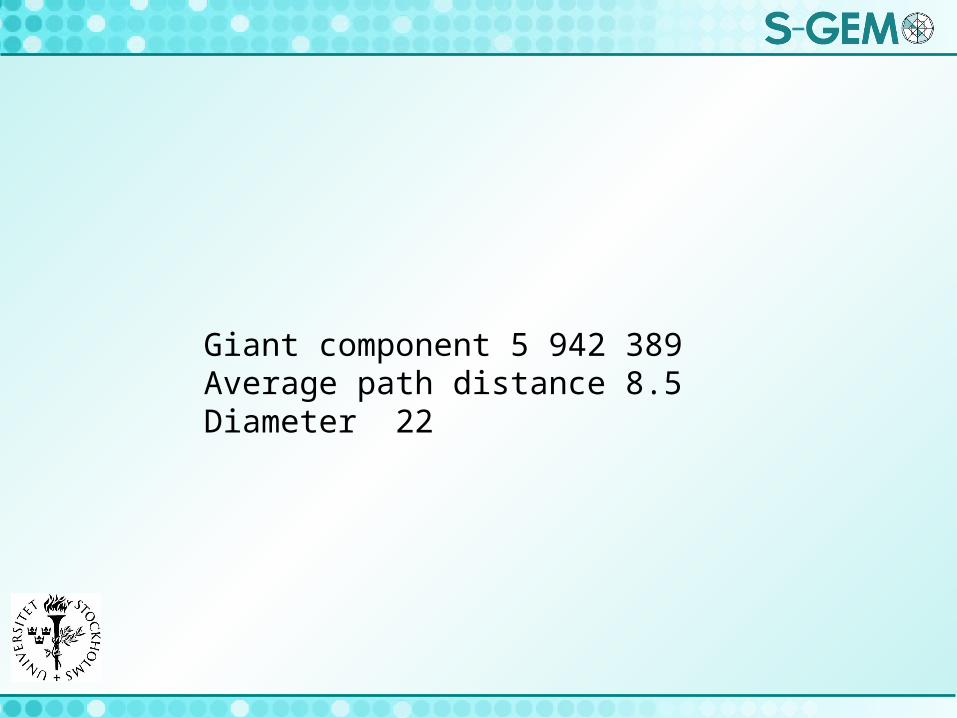
Giant component 5 942 389Average path distance 8.5Diameter 22
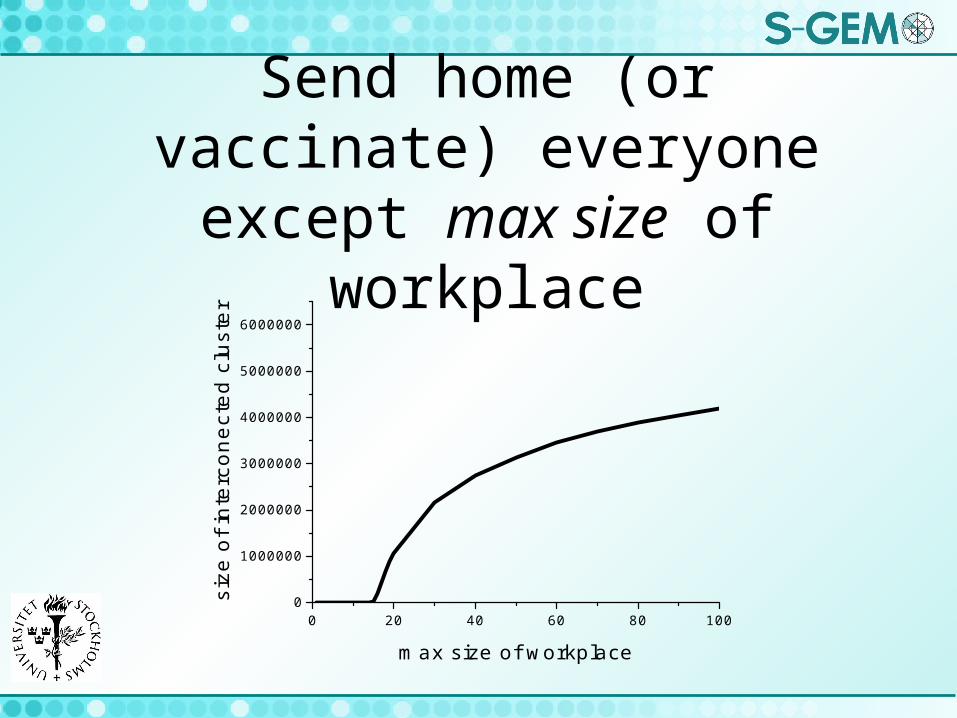
Send home (or vaccinate) everyone except max size of
workplace
0 20 40 60 80 1000
1000000
2000000
3000000
4000000
5000000
6000000
size
of i
nter
cone
cted
clu
ster
max size of workplace
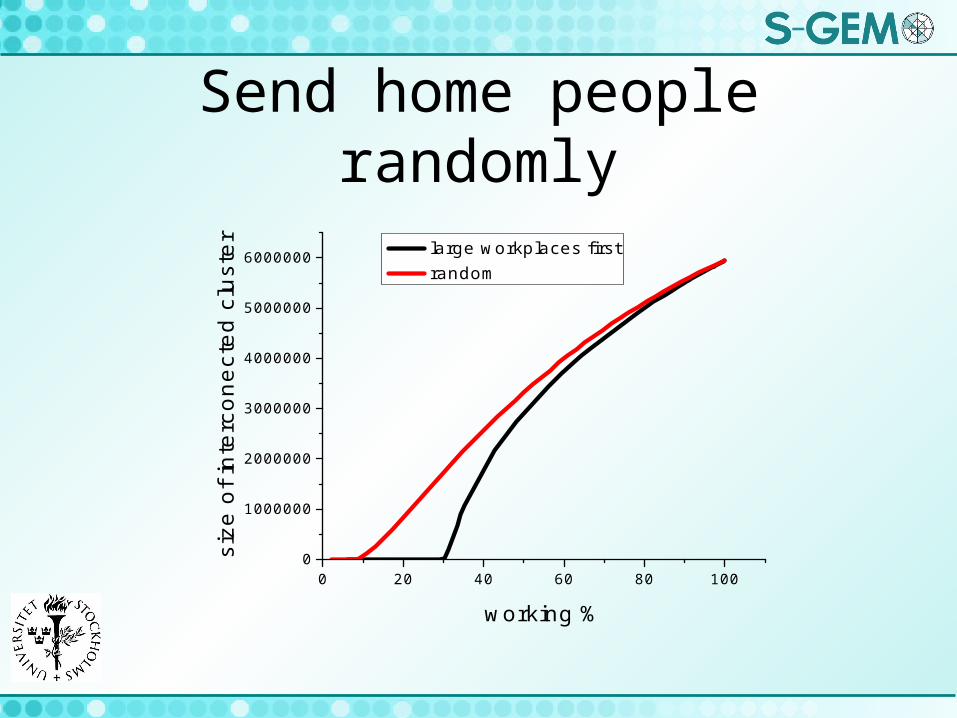
Send home people randomly
0 20 40 60 80 1000
1000000
2000000
3000000
4000000
5000000
6000000
size
of i
nter
cone
cted
clu
ster
working %
large workplaces first random
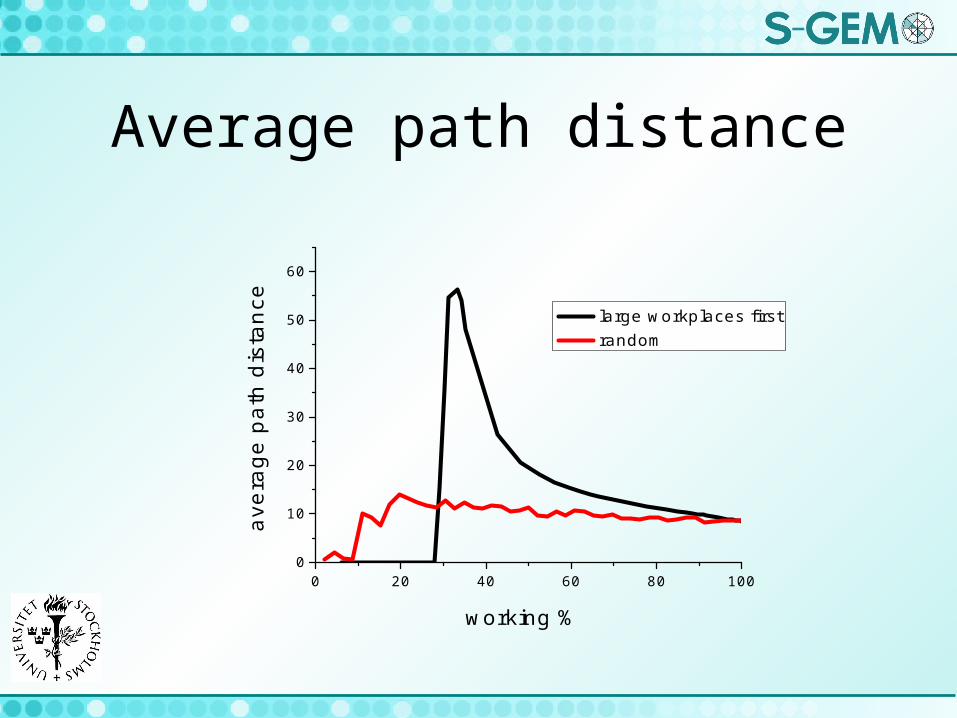
Average path distance
0 20 40 60 80 1000
10
20
30
40
50
60av
erag
e pa
th d
ista
nce
working %
large workplaces first random
Example 2
Data about suspected criminals
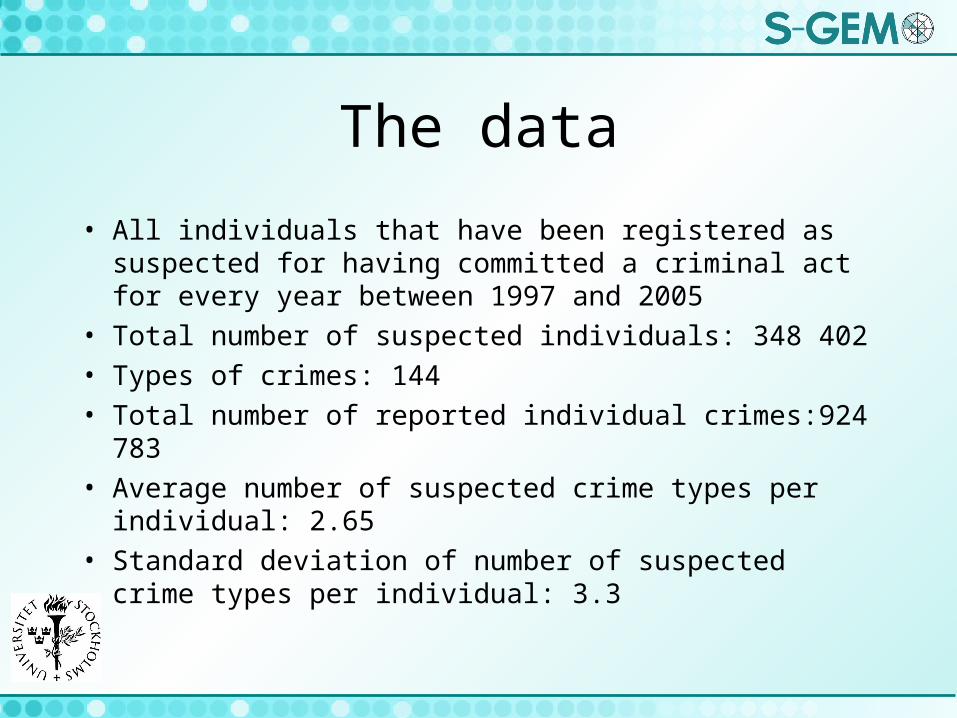
The data
• All individuals that have been registered as suspected for having committed a criminal act for every year between 1997 and 2005
• Total number of suspected individuals: 348 402• Types of crimes: 144• Total number of reported individual crimes:924 783• Average number of suspected crime types per
individual: 2.65• Standard deviation of number of suspected crime
types per individual: 3.3
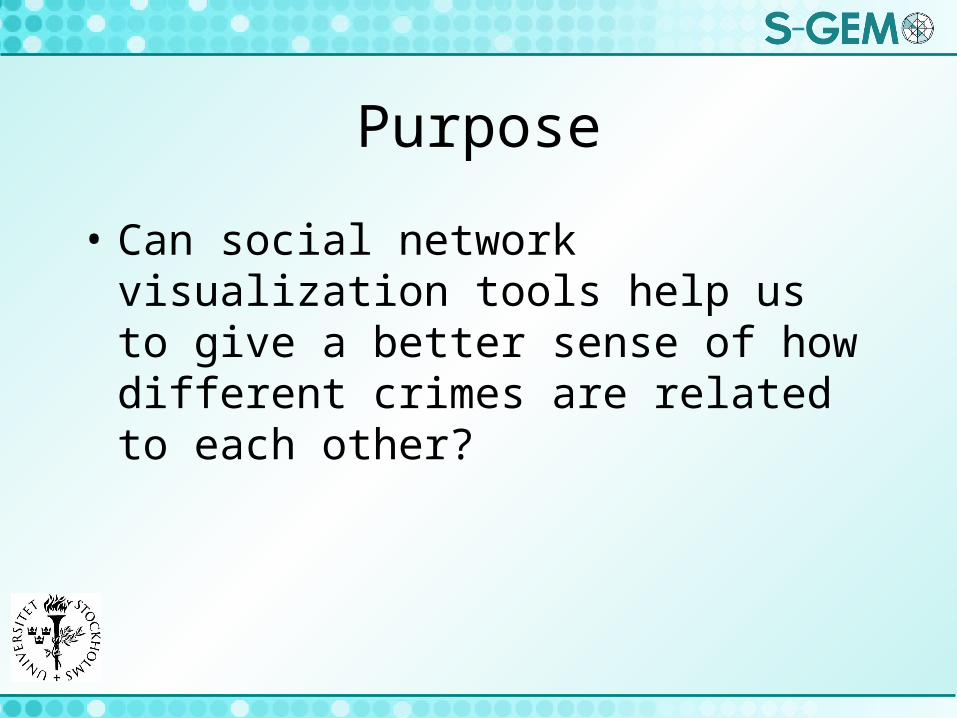
Purpose
• Can social network visualization tools help us to give a better sense of how different crimes are related to each other?
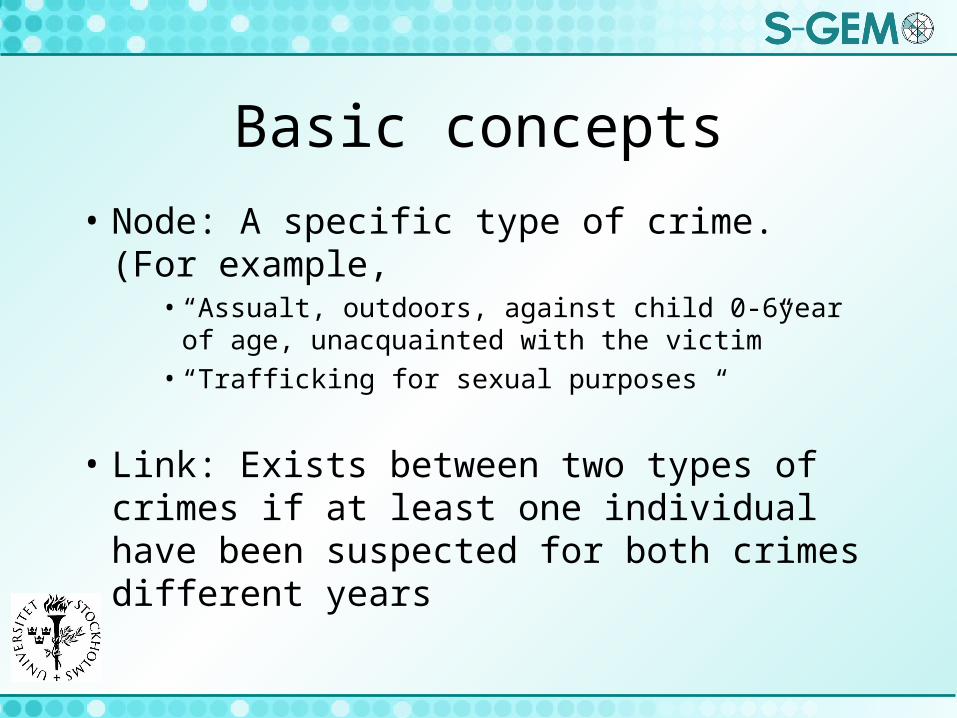
Basic concepts
• Node: A specific type of crime. (For example,
• “Assualt, outdoors, against child 0-6year of age, unacquainted with the victim”
• “Trafficking for sexual purposes “
• Link: Exists between two types of crimes if at least one individual have been suspected for both crimes different years
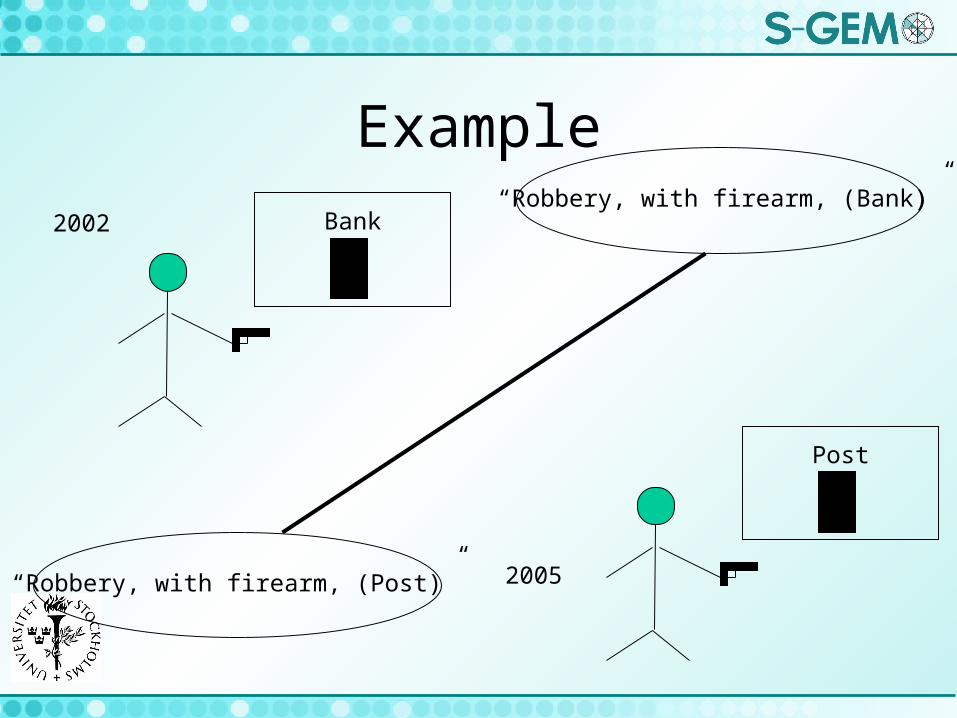
Example
2002 Bank“Robbery, with firearm, (Bank)”
2005
Post
“Robbery, with firearm, (Post)”
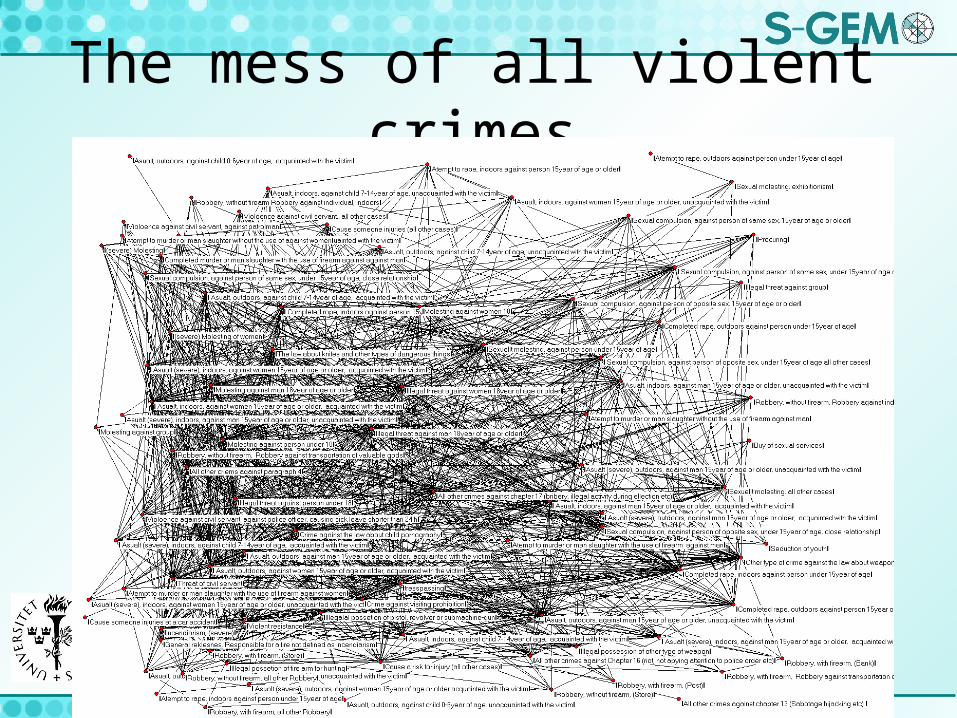
The mess of all violent crimes

A minimum spanning tree

What is a minimum spanning tree?
1
2
3
4
5
26

A B
Number of mutual links
Number of mutual links may not be a good measure
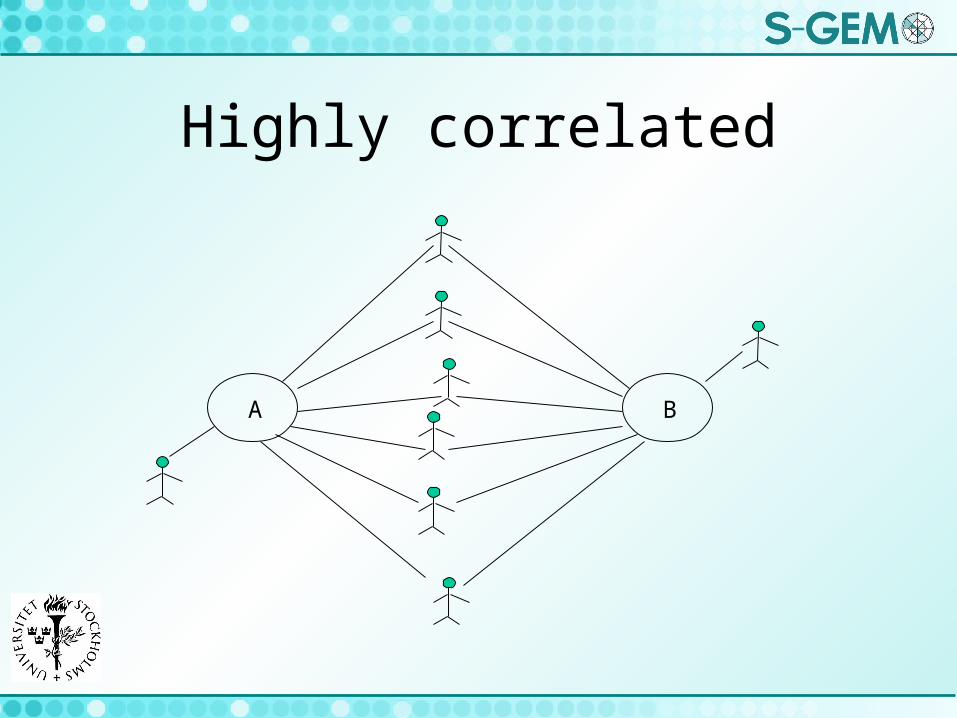
A B
Highly correlated
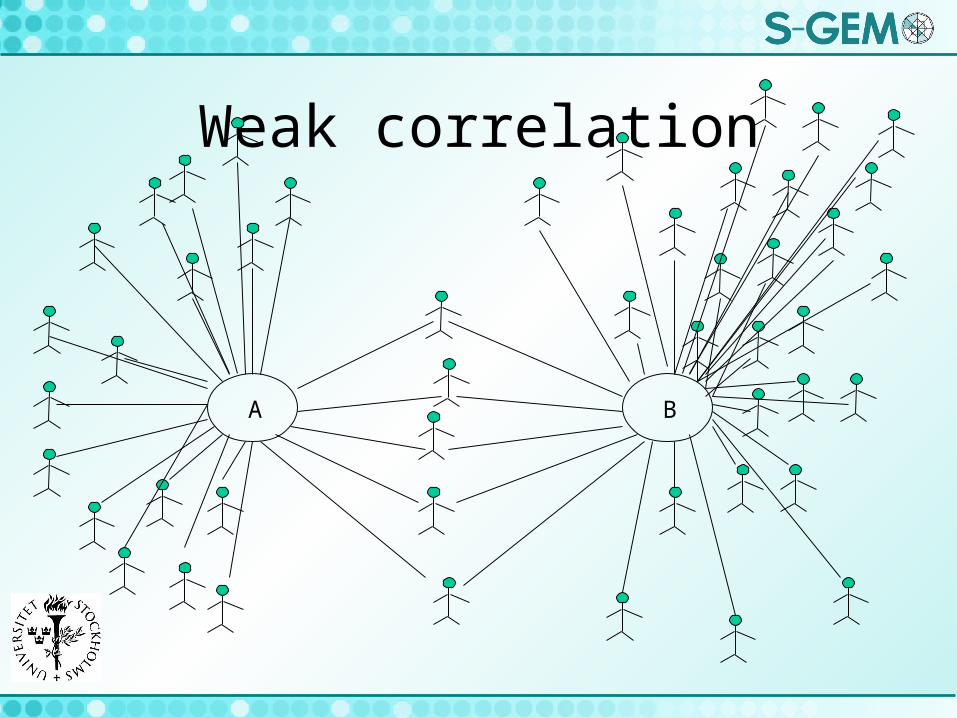
A B
Weak correlation
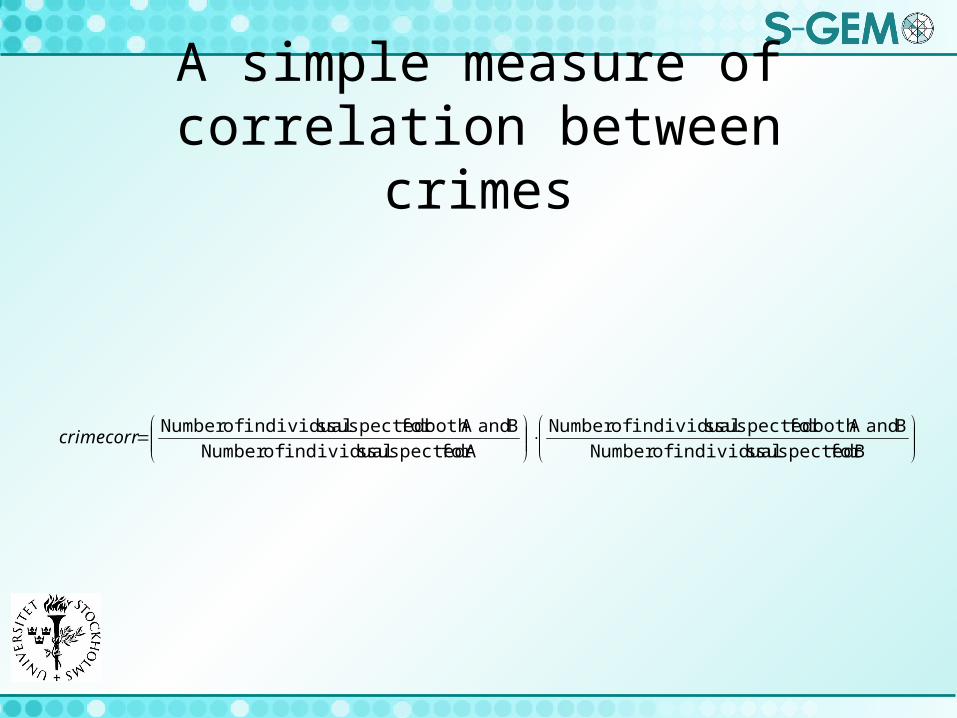
A simple measure of correlation between crimes
Bfor suspected sindividual ofNumber
B andA both for suspected sindividual ofNumber
Afor suspected sindividual ofNumber
B andA both for suspected sindividual ofNumber crimecorr
A B
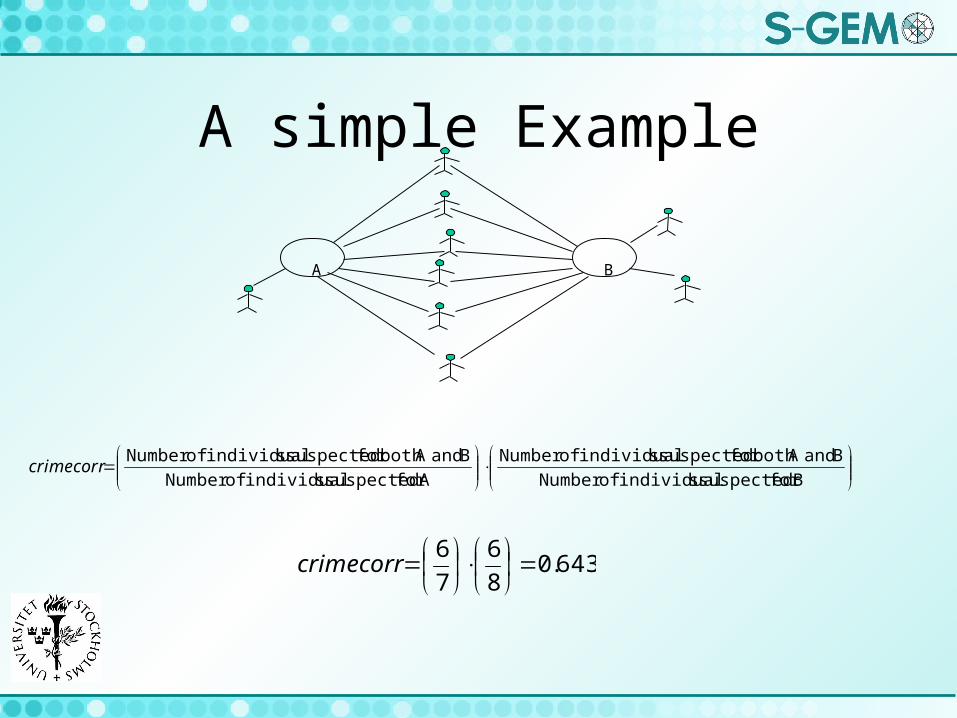
A simple Example
Bfor suspected sindividual ofNumber
B andA both for suspected sindividual ofNumber
Afor suspected sindividual ofNumber
B andA both for suspected sindividual ofNumber crimecorr
643.08
6
7
6
crimecorr
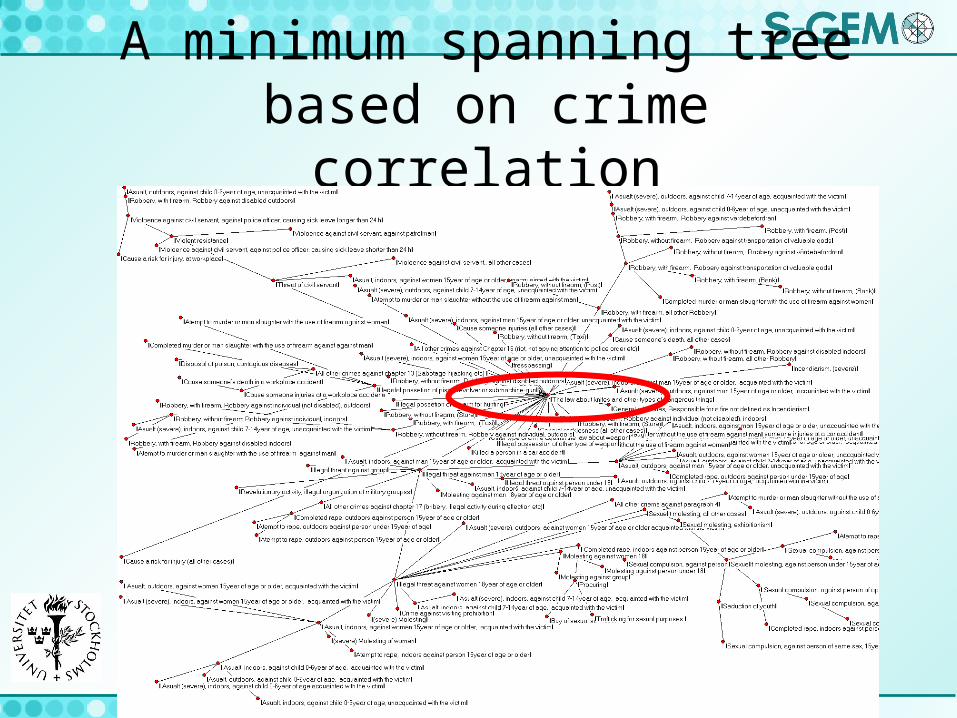
A minimum spanning tree based on crime correlation
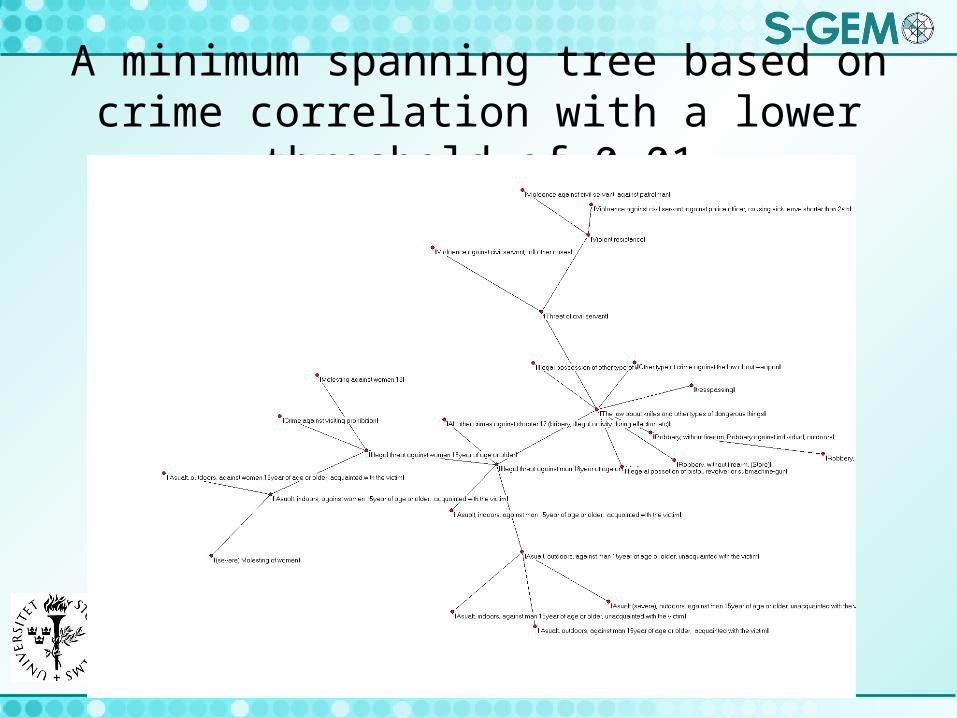
A minimum spanning tree based on crime correlation with a lower threshold of 0.01
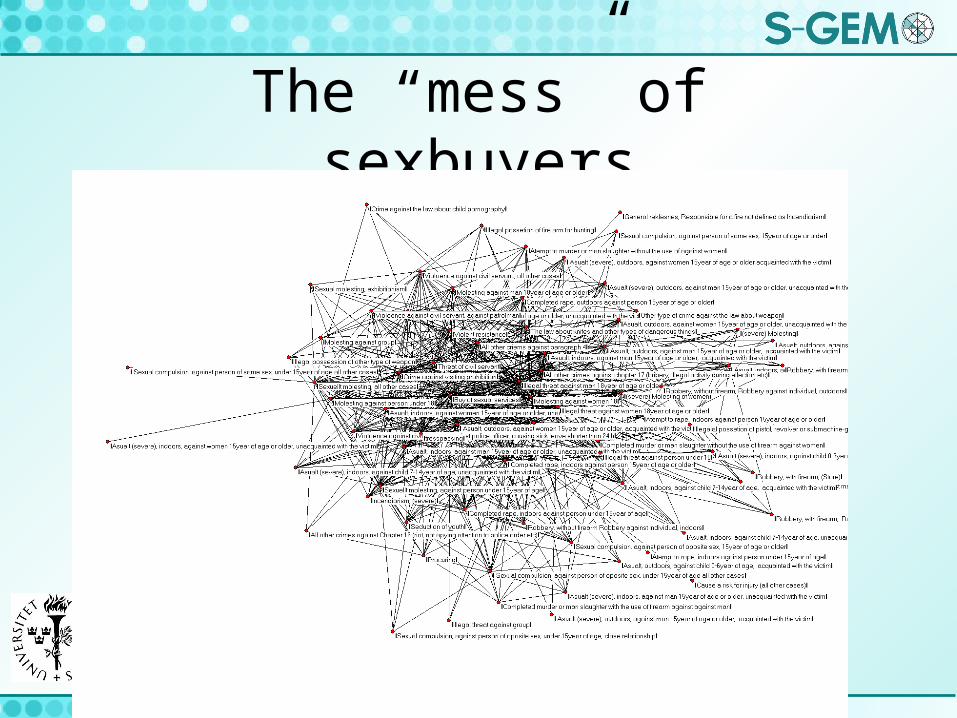
The “mess” of sexbuyers
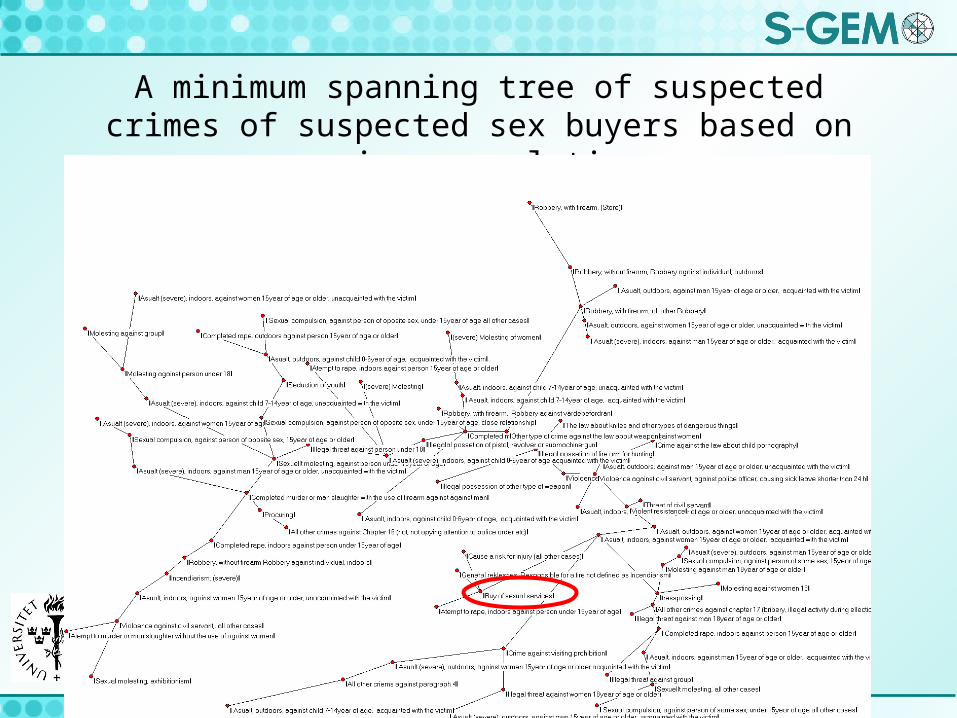
A minimum spanning tree of suspected crimes of suspected sex buyers based on crime correlation
Conclusion
• To play with different graphs may give a good first picture of how different crimes are associated with each other
• We still need traditional statistical techniques to test hypotheses
• Existing software package are not very user friendly (Three different softwares was needed to produce these pictures Windows SQL server, Mathcad and Pajek)
Example 3
Data about inpatients in a hospital system
The hospital network
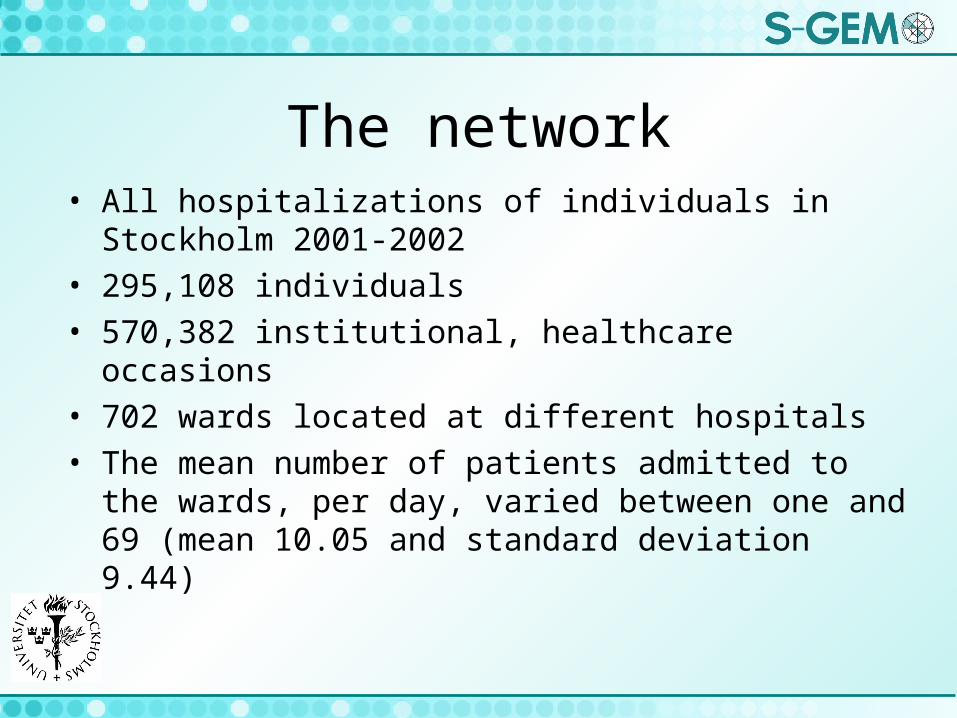
The network• All hospitalizations of individuals in Stockholm 2001-
2002• 295,108 individuals• 570,382 institutional, healthcare occasions• 702 wards located at different hospitals• The mean number of patients admitted to the wards, per
day, varied between one and 69 (mean 10.05 and standard deviation 9.44)
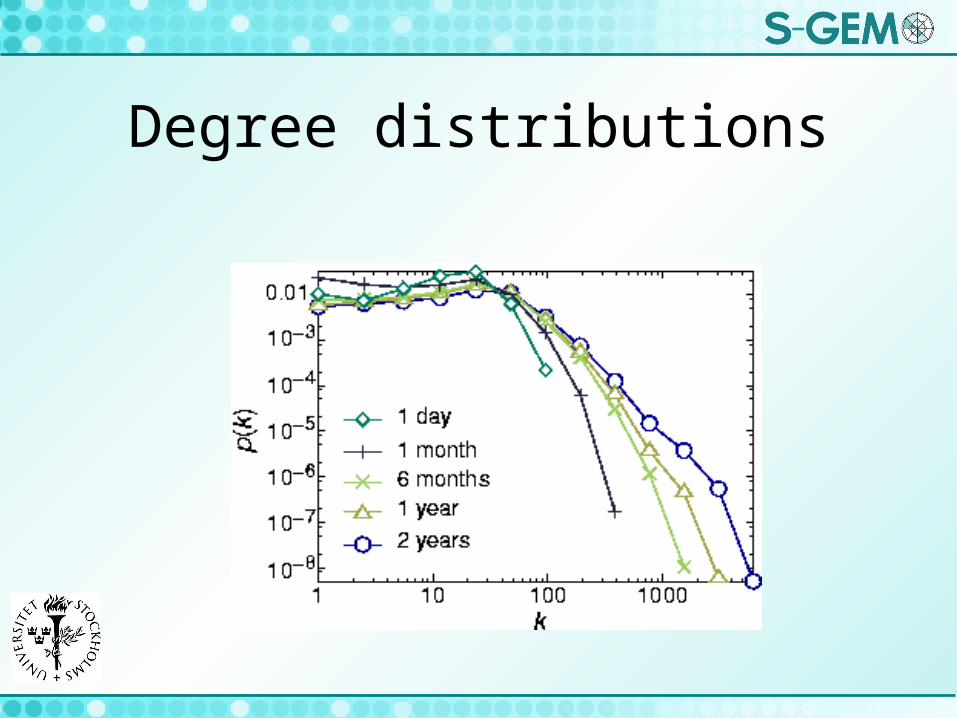
Degree distributions
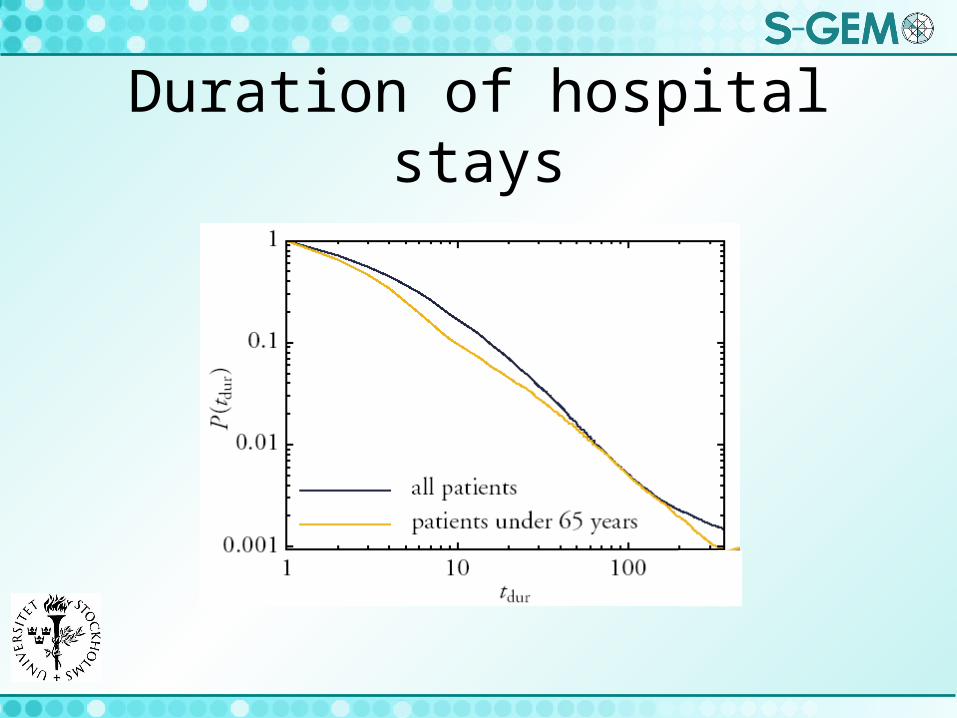
Duration of hospital stays
Problem with Swedish public office data
• You usually have to pay for the data
• You are only allowed to use the data for the purpose you bought i for
• You can’t share the data for free
• Swedish data may not be of general interest

A last animation

Relevant publications
Liljeros, F., J. Giesecke, and P. Holme. (2007). "The contact network of inpatients in a regional healthcare system. A longitudinal case study." Mathematical Population Studies 14:269-284 Chen Y, Paul G, Cohen R, Havlin S, Borgatti SP, et al. 2007. Percolation theory applied to measures of fragmentation in social networks. Phys Rev E Stat Nonlin Soft Matter Phys 75:04610 Gallos L. K., Liljeros F, Argyrakis P, Bunde A, Havlin S. 2007. Improving immunization strategies. Phys Rev E Stat Nonlin Soft Matter Phys 75:045104 Camitz, M. and F. Liljeros (2006). "The effect of travel restrictions on the spread of a moderately contagious disease." BMC Medicine 2006 4(32): 1-10. Edling, C. R and F. Liljeros (2003) “Spatial Diffusion of Social Organizing: Modelling Trade Union Growth in Sweden, 1890-1940” Geography and Strategy vol. 20 267-192.