Embed Size (px)
Citation preview
1
Interdistrict Magnet Schools in Connecticut
Barbara Q. Beaudin, Ed. D.Division of Evaluation and ResearchConnecticut State Department of Education

2
Mission
• Reducing racial, ethnic, and economic isolation
– Students– Professional Staff
• Offering high quality and special programs:– Improve student academic performance
– Provide innovative, unique curriculum and instruction
3
Magnet School Evaluation Questions
1) What characteristics define interdistrict magnet schools and how do interdistrict magnet schools differ from other public schools?
2) What impact have interdistrict magnet schools had on reducing the racial, ethnic, and economic isolation of CT students?

4
3) What impact have interdistrict magnet schools had on reducing the racial, ethnic, and economic isolation of students within the magnet school itself?
4) How does the performance of interdistrict magnet school students compare with that of public school students state-wide?

5
• How consistent are students, parents, and public school professional staff in their perception of the effectiveness of their magnet schools?
• What characteristics do the highly successful magnet schools share?
6
Data Sources
• CSDE Staff File
• Strategic School Profile Data File
• CMT and CAPT Data
• Graduate Follow-up Data
• Magnet School Annual Reports
• Meetings with Magnet School Personnel
• Parent, Teacher, and Student Surveys
7
Defining Characteristics/Role of CT Interdistrict Magnet School Programs
Interdistrict magnet schools and programs:• Reduce racial, ethnic, and economic isolation• Offer a special and high quality program• Increase student achievement• Provide parents and students an educational choice• Must restrict enrollment from any participating
district to 80% of the total enrollment in the school or program
• Require students to attend at least half time
8
The Evolution of Interdistrict Magnet Schools and Programs in Connecticut
• 31 interdistrict magnet schools and programs operated in Connecticut last year, serving 10,700 students, from approximately 100 public school districts.
• The first interdistrict magnet school program began in 1989, GHAA.
• 17 interdistrict magnet schools opened during
the 1990s.• 13 interdistrict magnet schools began operating
since 2000.
9
• For the 2003-04 school year, approximately 12,000 public school students will be enrolled in 39 interdistrict magnet schools.
• Students are selected by lottery and wait lists are established to fill vacancies occurring after the beginning of the school year.
• The typical magnet school drew students from 11 public school districts; the range was from two to 46 districts.
10
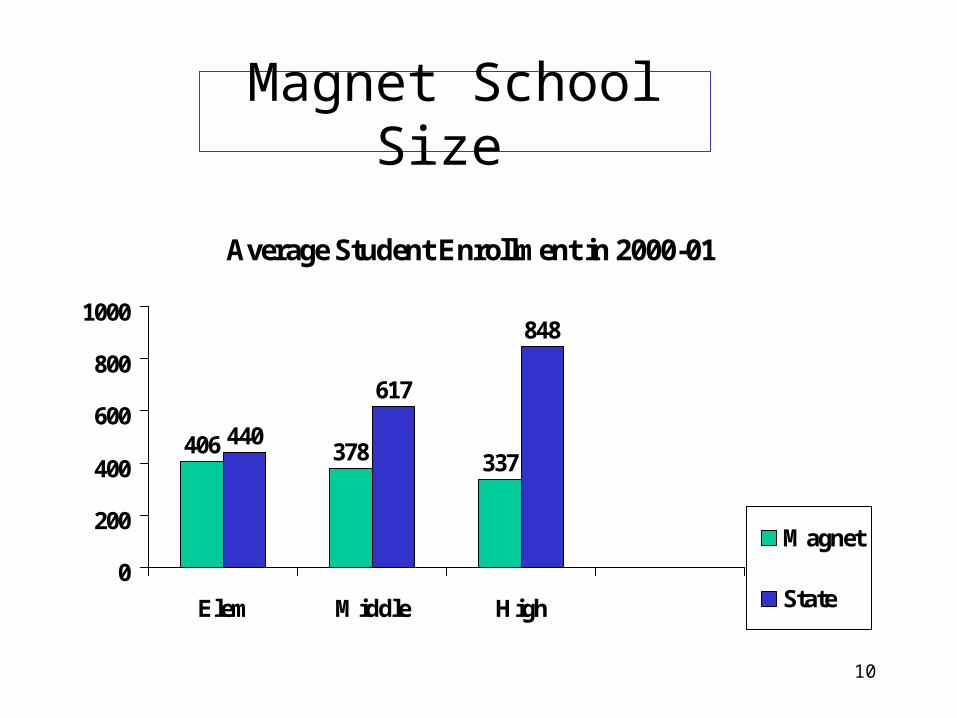
Magnet School Size
Average Student Enrollment in 2000-01
406 378 337440
617
848
0
200
400
600
800
1000
Elem Middle High
Magnet
State
11
Education Reference Groups
• Nine clusters (A – I) of public school districts with similar characteristics based on indicators of student need, socio-economic status, and district size.
• ERG A consists of the state’s most affluent communities, most located in lower Fairfield County.
• ERG I consists of seven large urban districts.• Magnet schools draw students from districts in all
nine ERGs.
12
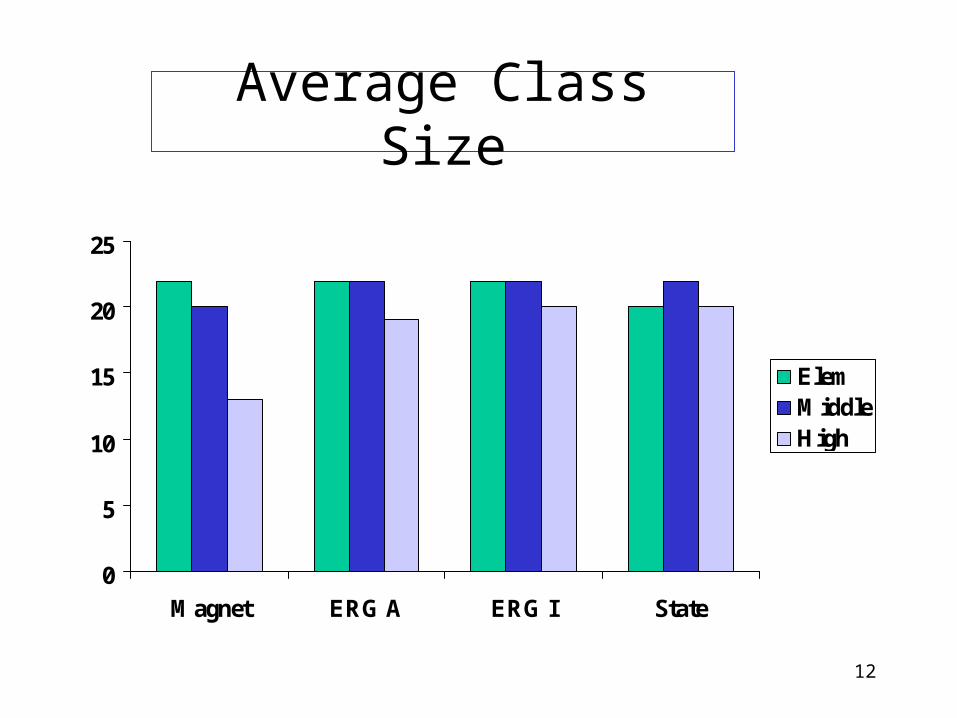
Average Class Size
0
5
10
15
20
25
Magnet ERG A ERG I State
ElemMiddleHigh
13
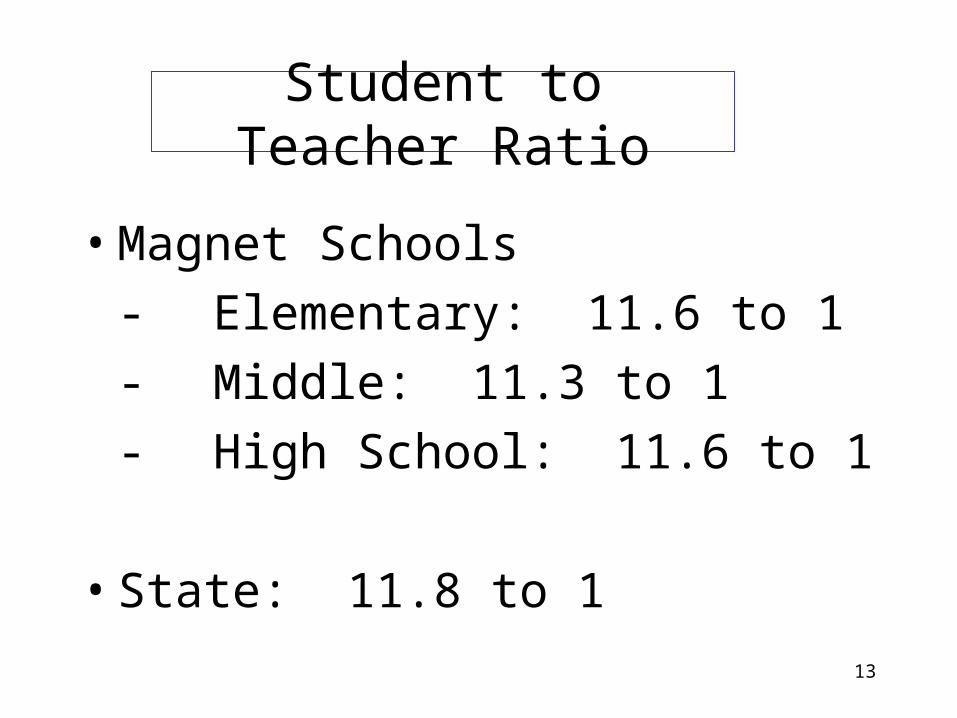
Student to Teacher Ratio
• Magnet Schools
- Elementary: 11.6 to 1
- Middle: 11.3 to 1
- High School: 11.6 to 1
• State: 11.8 to 1
14
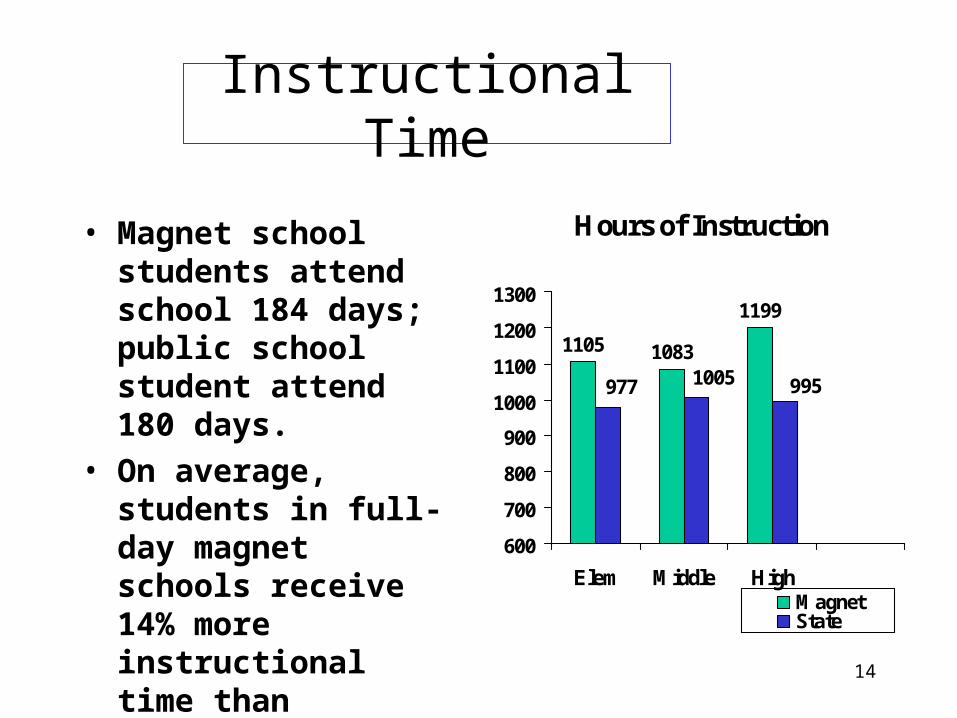
Instructional Time
• Magnet school students attend school 184 days; public school student attend 180 days.
• On average, students in full-day magnet schools receive 14% more instructional time than students in the state’s other public schools.
Hours of Instruction
1083
1199
1105
1005 995977
600
700
800
900
1000
1100
1200
1300
Elem Middle HighMagnetState
15
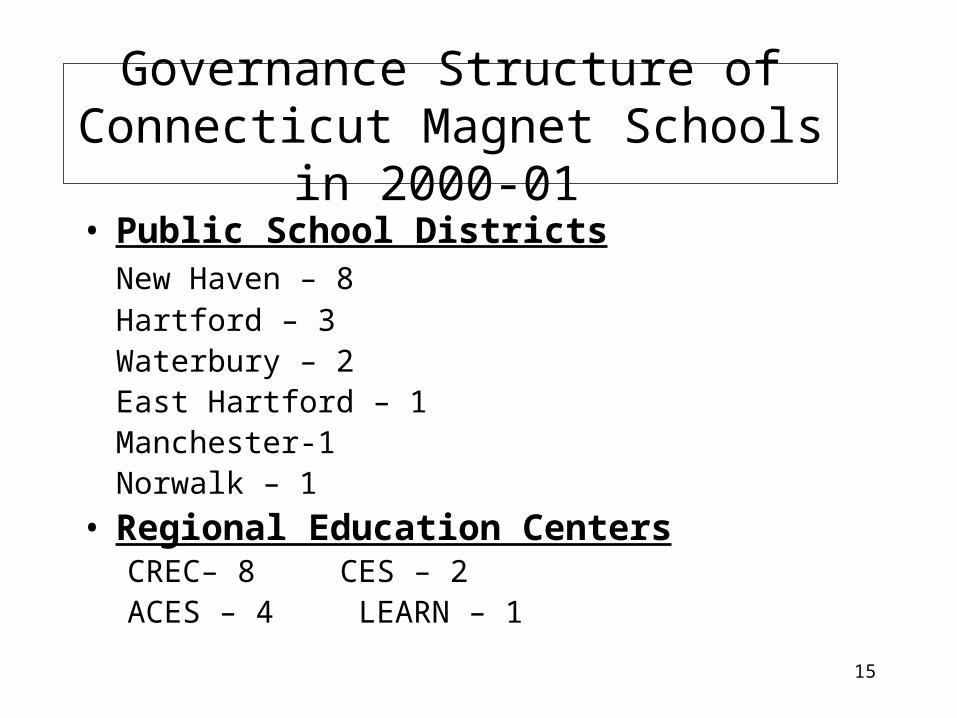
Governance Structure of Connecticut Magnet Schools in 2000-01
• Public School DistrictsNew Haven – 8Hartford – 3Waterbury – 2East Hartford – 1Manchester-1Norwalk – 1
• Regional Education Centers CREC– 8 CES – 2ACES – 4 LEARN – 1
16
• A governing board, consisting of representatives from member districts, determines the level of involvement and responsibility in the school’s operation.
17
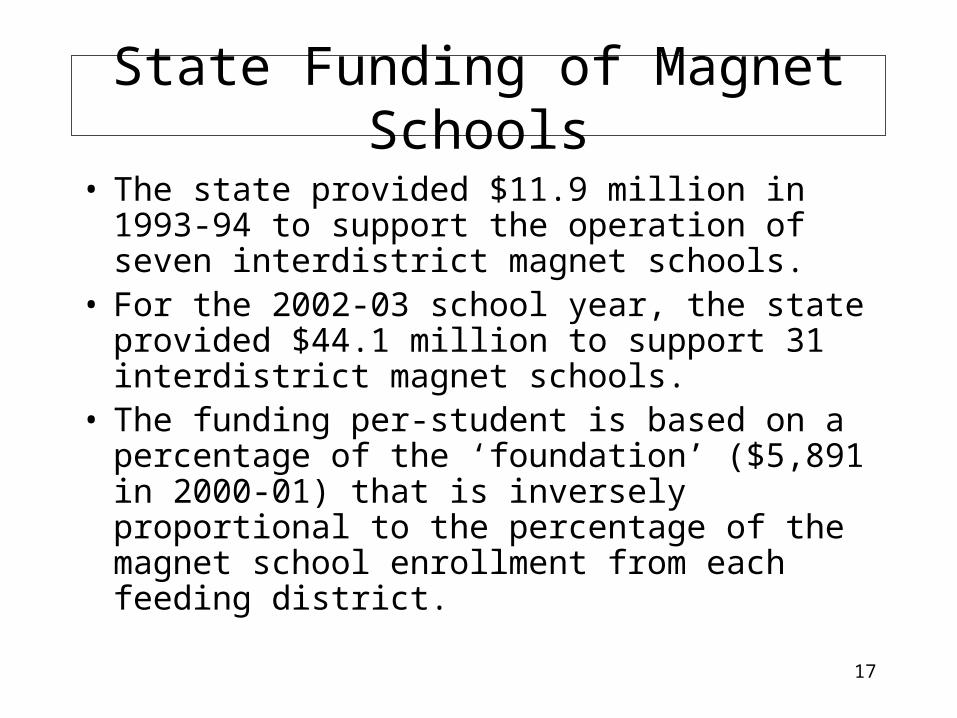
State Funding of Magnet Schools
• The state provided $11.9 million in 1993-94 to support the operation of seven interdistrict magnet schools.
• For the 2002-03 school year, the state provided $44.1 million to support 31 interdistrict magnet schools.
• The funding per-student is based on a percentage of the ‘foundation’ ($5,891 in 2000-01) that is inversely proportional to the percentage of the magnet school enrollment from each feeding district.
18
Funding for Transportation
• The local district in which the magnet school is located must provide transportation for magnet school students who reside in the district.
• Districts or schools which provide transportation for out-of-district students are eligible for reimbursement up to $1,200 per student.

19
Funding Capital Costs
• State school construction aid at 100% (95% beginning in 2003) was available to fund building construction or renovation.
• About 75% of construction funds would have been allocated to the same districts for public school building projects

20
Reducing Racial, Ethnic, and Economic Isolation
21
Connecticut’s Dichotomy
• Poverty-ridden cities lie in close proximity to affluent suburbs.
• Segregation in Connecticut is not as much within districts, as it is between districts that vary in the racial, ethnic, and economic composition of the students they enroll.
• Nearly 600,000 students currently are enrolled in Connecticut public schools.
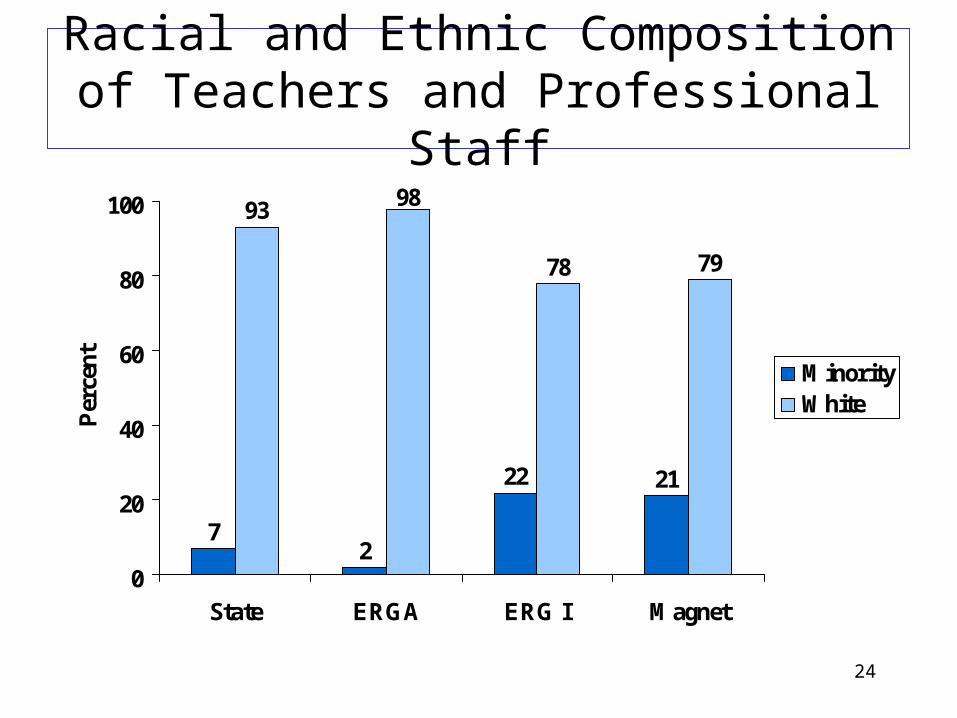
• Composition of Connecticut public schools: 30% of the students and 7% of the teachers are racial or ethnic minorities.
22
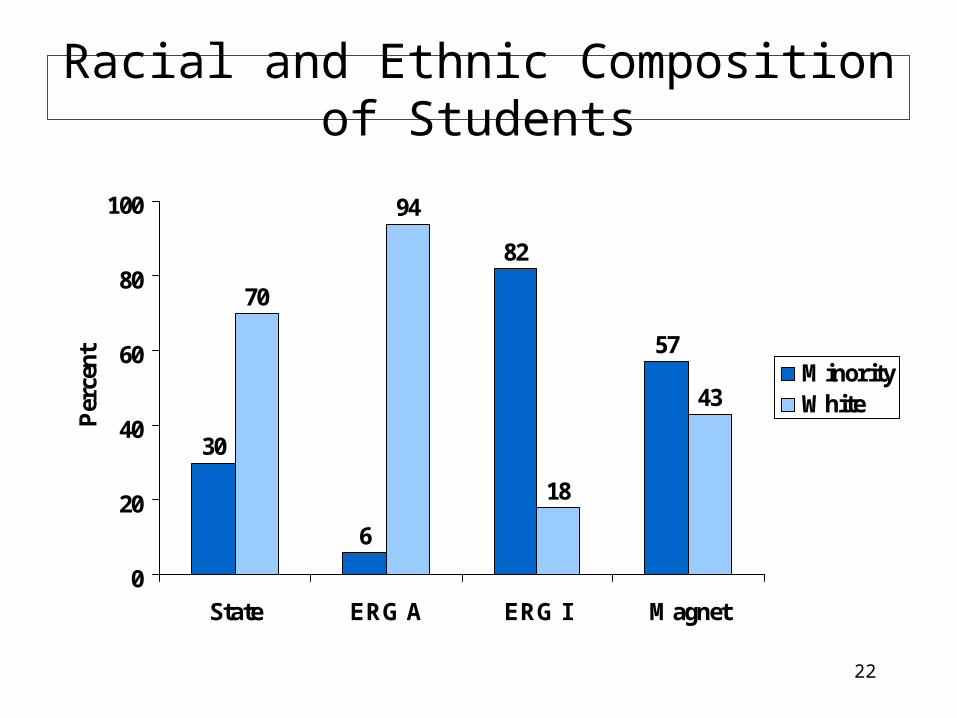
Racial and Ethnic Composition of Students
30
6
82
57
70
94
18
43
0
20
40
60
80
100
State ERG A ERG I Magnet
Per
cent Minority
White
23
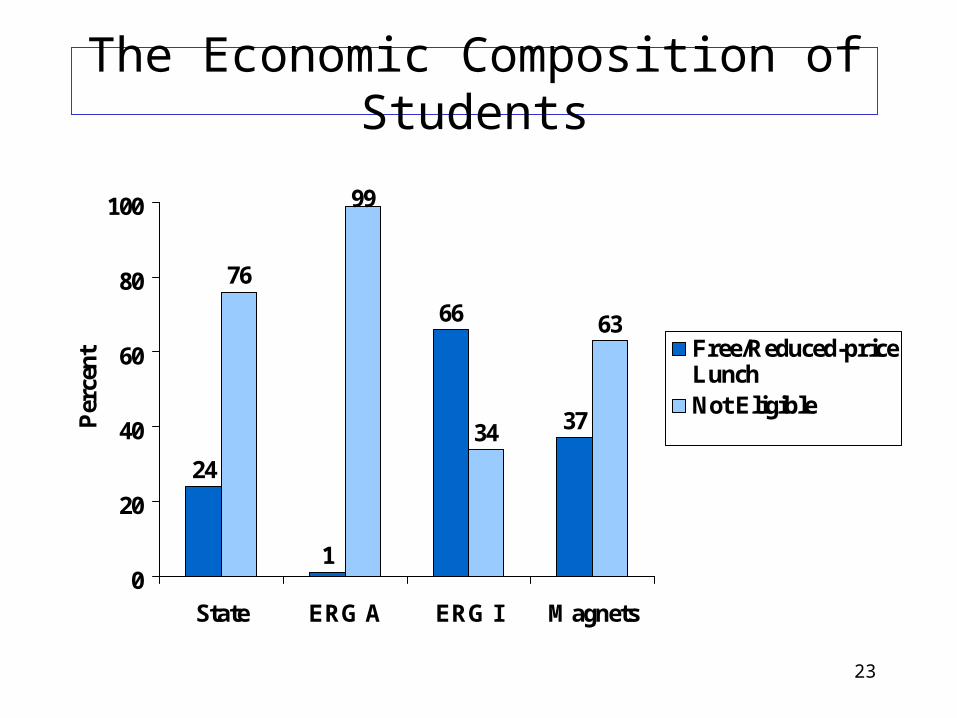
The Economic Composition of Students
24
1
66
37
76
99
34
63
0
20
40
60
80
100
State ERG A ERG I Magnets
Per
cent Free/Reduced-price
LunchNot Eligible
24
Racial and Ethnic Composition of Teachers and Professional Staff
72
22 21
93 98
78 79
0
20
40
60
80
100
State ERGA ERG I Magnet
Per
cent Minority
White
25
Perceptions of Diversity in Magnet Schools
• 95% of parents and teachers, and 93% of the students, believe their magnet schools and programs are diverse learning communities.
• 87% of the parents, 98% of the teachers, and 85% of the students agree that students from different backgrounds work together on academic projects in school.
• 97% of the teachers believe that the school provides appropriate educational opportunities for all students, regardless of background.

26
Student Academic Performance
Elementary and Middle Schools
27
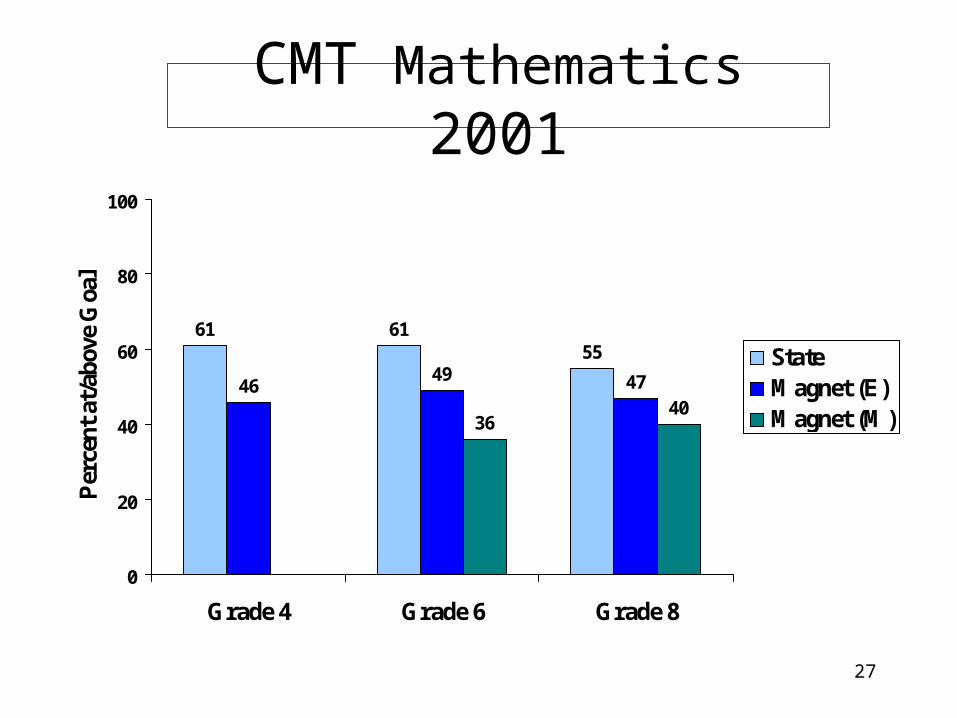
CMT Mathematics 2001
61 6155
4649 47
3640
0
20
40
60
80
100
Grade 4 Grade 6 Grade 8
Per
cent
at/
abov
e G
oal
StateMagnet (E)Magnet (M)
28
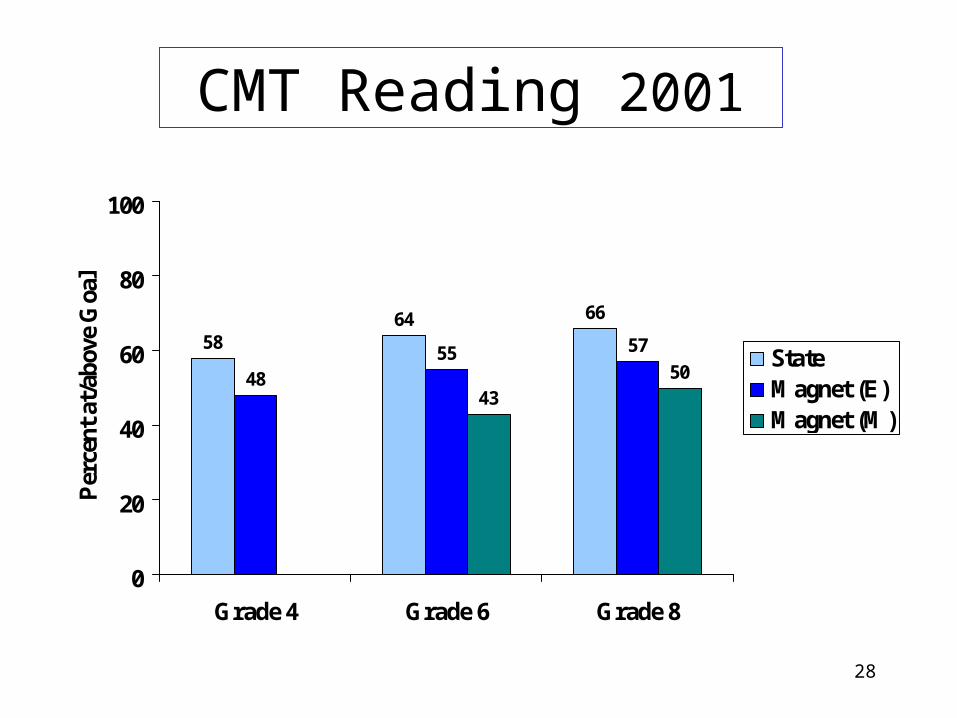
CMT Reading 2001
5864 66
4855 57
4350
0
20
40
60
80
100
Grade 4 Grade 6 Grade 8
Per
cent
at/
abov
e G
oal
StateMagnet (E)Magnet (M)
29
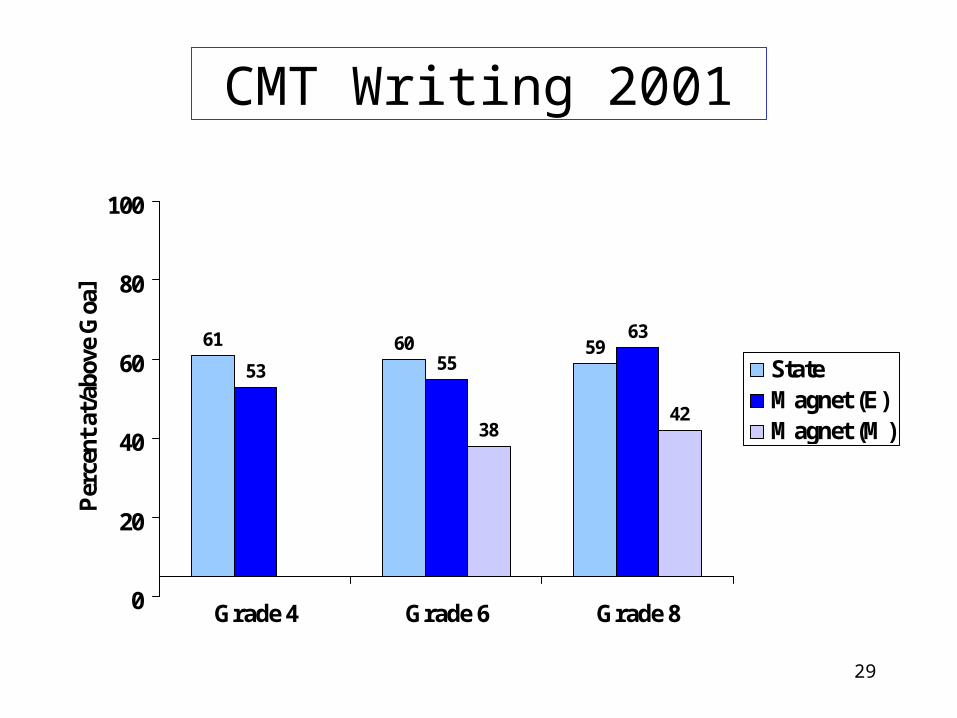
CMT Writing 2001
61 60 5953 55
63
3842
0
20
40
60
80
100
Grade 4 Grade 6 Grade 8
Per
cent
at/
abov
e G
oal
StateMagnet (E)Magnet (M)
30
Perceptions of Academic Program Quality: Elementary and Middle Magnet Schools
• 90% of the parents and teachers believe that their magnet schools have high expectations for students’ academic performance.
• Over 90% of the parents selected the magnet school because of its challenging academic program, quality teachers, and quality administrators.
• At least 95% of the students agree that teachers expect them to do their best work.

31
Student Academic Performance
High Schools
32
Connecticut Academic Performance Test (CAPT): Grade 10
• Since 1998, no more than 15% of IDMHS students met the state goal in mathematics, compared with 45% statewide
• Since 1998, no more than 18% of IDMHS students met the state goal in language arts, compared with 45% statewide
• Results are similar for science and writing• Large proportions of IDMHS students are
academically at-risk in grade 10.
33
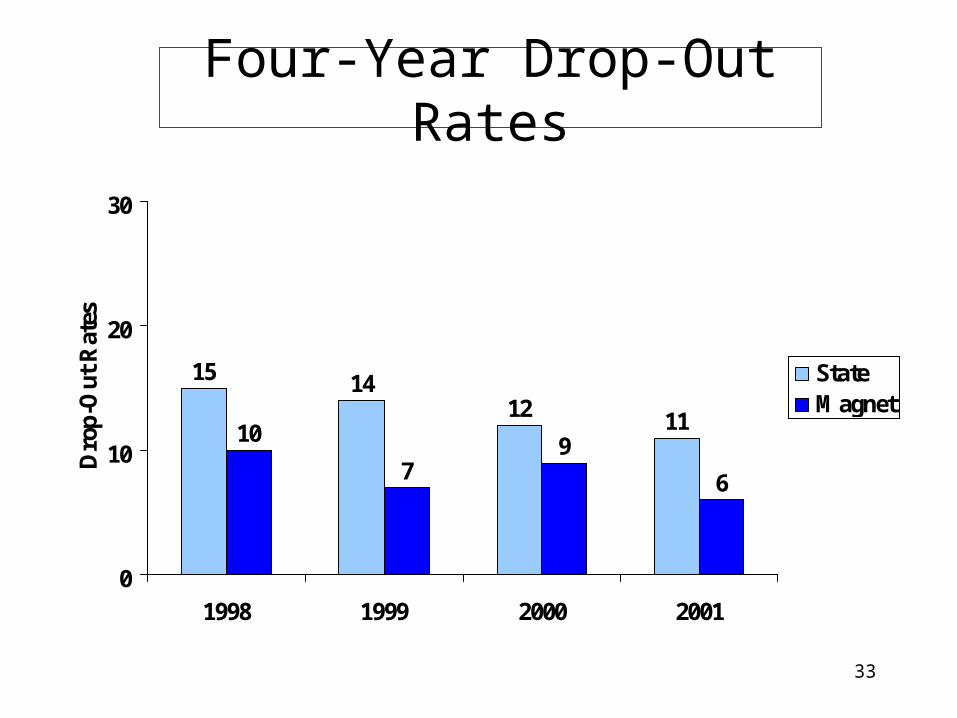
Four-Year Drop-Out Rates
15 1412 1110
79
6
0
10
20
30
1998 1999 2000 2001
Dro
p-O
ut R
ates
StateMagnet
34
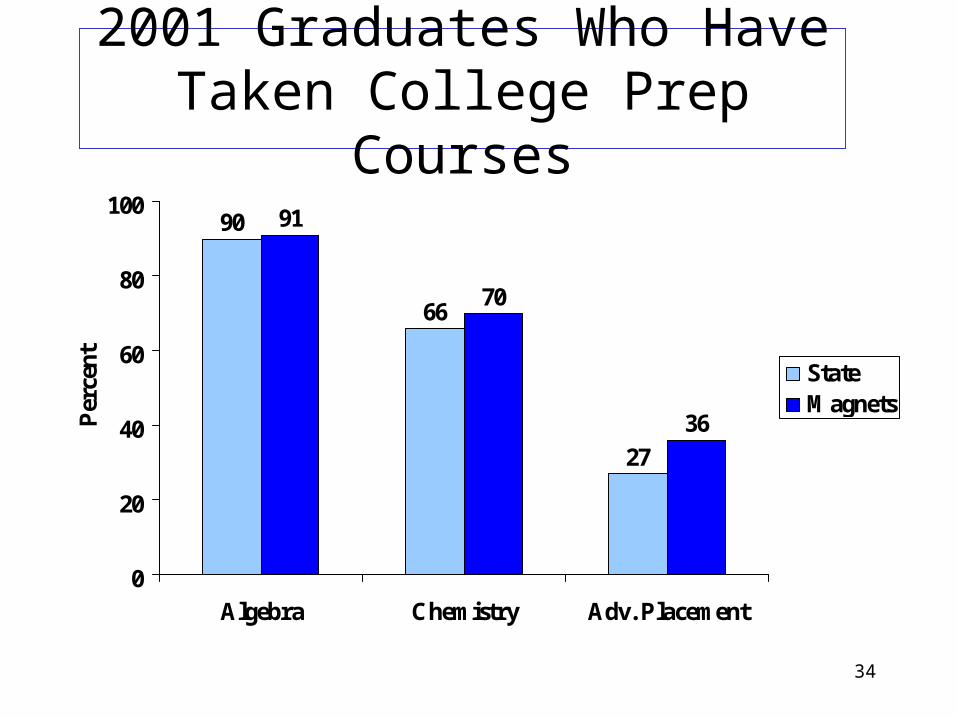
2001 Graduates Who Have Taken College Prep Courses
90
66
27
91
70
36
0
20
40
60
80
100
Algebra Chemistry Adv. Placement
Per
cent State
Magnets
35
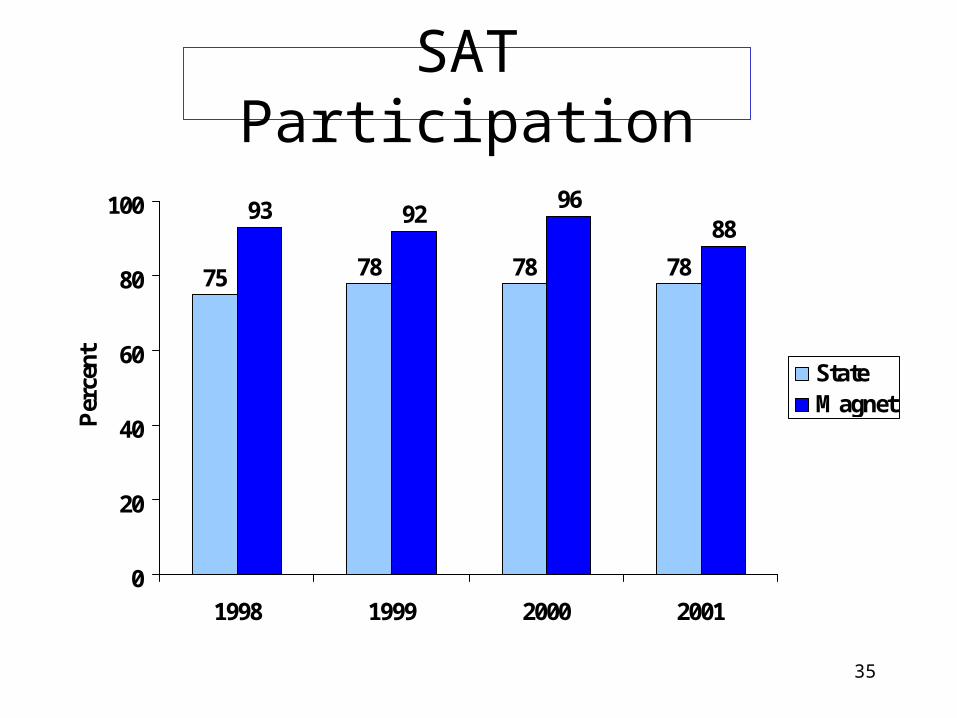
SAT Participation
75 78 78 78
93 9296
88
0
20
40
60
80
100
1998 1999 2000 2001
Per
cent State
Magnet
36
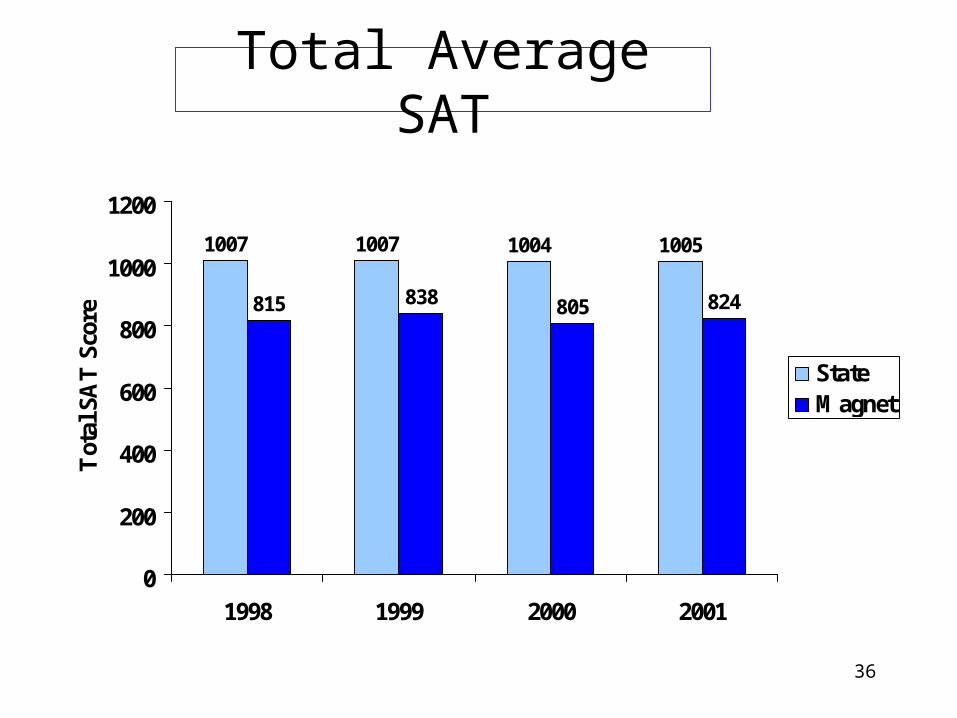
Total Average SAT
1007 1007 1004 1005
815 838 805 824
0
200
400
600
800
1000
1200
1998 1999 2000 2001
Tot
al S
AT
Sco
re
StateMagnet
37
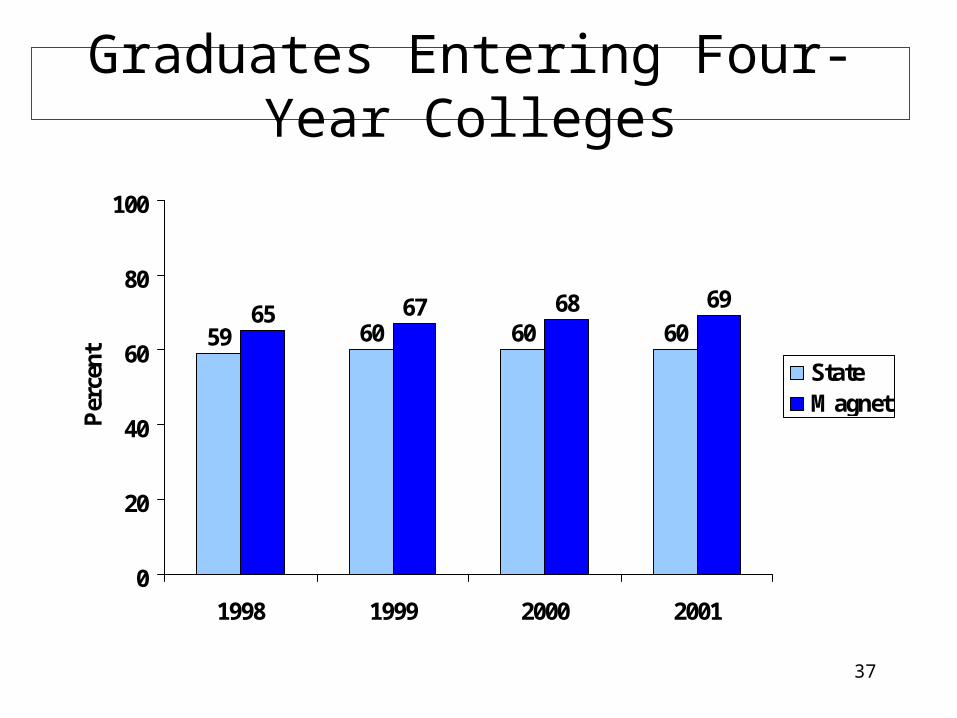
Graduates Entering Four-Year Colleges
59 60 60 6065 67 68 69
0
20
40
60
80
100
1998 1999 2000 2001
Per
cent State
Magnet

38
High School Students’ Comments
“I like the unlimited opportunities of there being something more challenging in this school, for example college classes”
“This school gives students that little extra help they need to be successful and proud of the work they do.”
39
Interdistrict Magnets Offer Special Programs
40
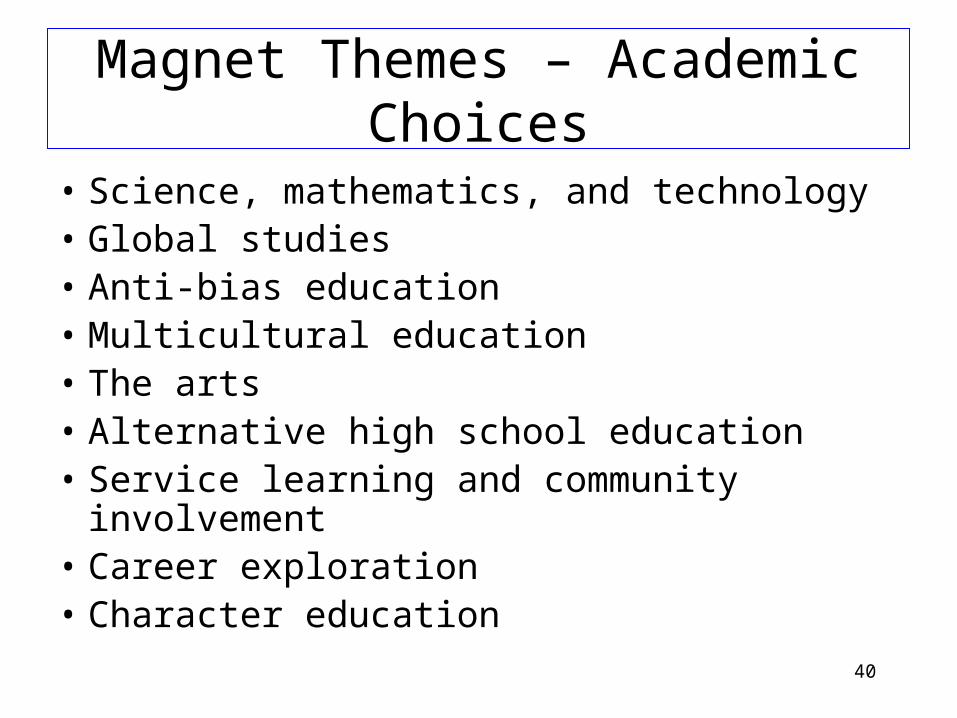
Magnet Themes – Academic Choices
• Science, mathematics, and technology• Global studies• Anti-bias education• Multicultural education• The arts• Alternative high school education• Service learning and community involvement• Career exploration• Character education
41
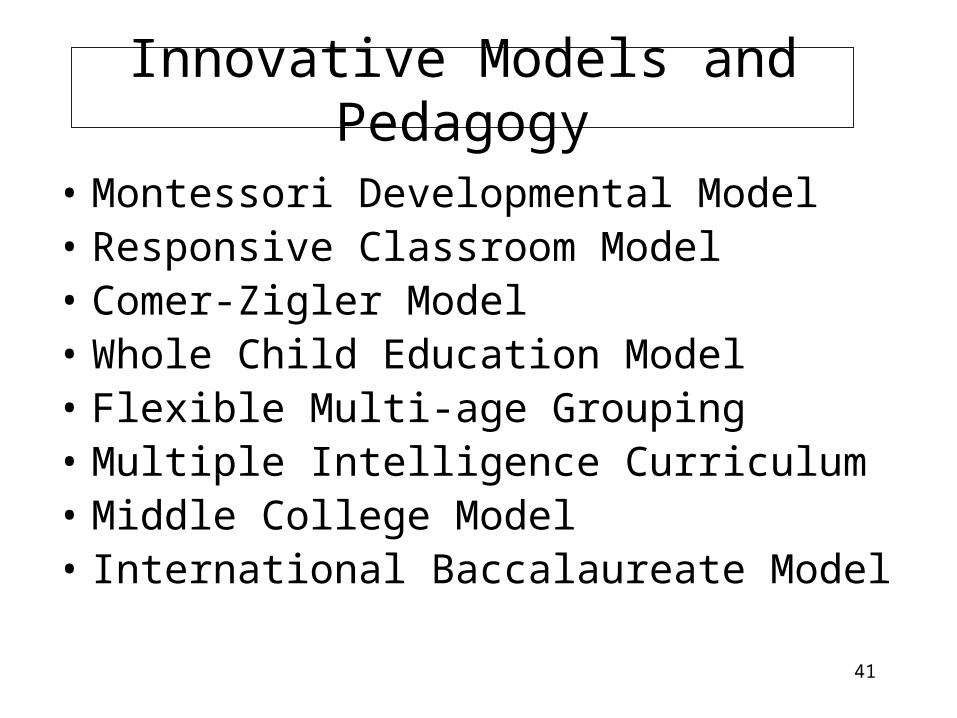
Innovative Models and Pedagogy
• Montessori Developmental Model • Responsive Classroom Model• Comer-Zigler Model• Whole Child Education Model• Flexible Multi-age Grouping• Multiple Intelligence Curriculum• Middle College Model• International Baccalaureate Model

42
What Makes a Difference?Teacher Survey Results
At least 90% of teachers agreeing:
• their schools provide safe and secure environments that foster learning,
• their schools promote innovation,
• their principal is an effective instructional leader,
• teachers and administrators share a common mission, and
• they are satisfied with their magnet school position.

43
A Teacher’s Comment
“ I selected this magnet school– and have wished to remain here– not because its location is convenient or its compensation is competitive, but because I feel that the school has the best opportunity to offer students a well-rounded education.”
44
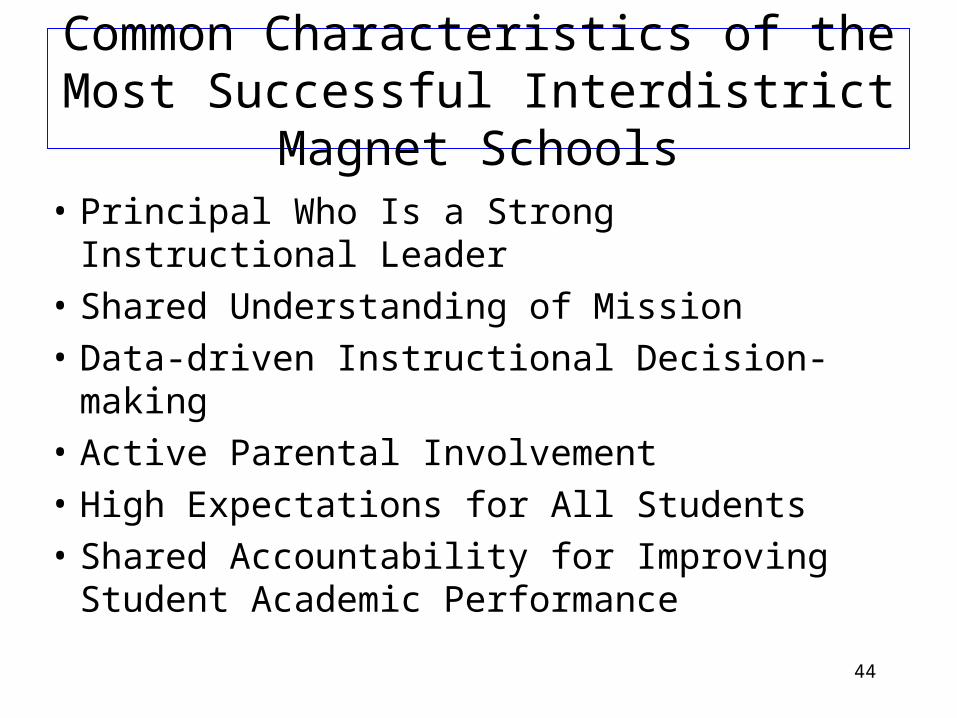
Common Characteristics of the Most Successful Interdistrict Magnet Schools
• Principal Who Is a Strong Instructional Leader
• Shared Understanding of Mission
• Data-driven Instructional Decision-making
• Active Parental Involvement
• High Expectations for All Students
• Shared Accountability for Improving Student Academic Performance
45
What Have Interdistrict Magnet Schools Accomplished in CT?
• Created school communities with diverse student and professional staff populations
• Reduced the gap in elementary and middle school CMT performance for students in progressively higher grades
• Low four-year high school drop-out rates, high participation in college-preparation courses and SAT, high entrance into four year colleges for students who were academically high-risk in grade 10
• High constituent satisfaction with school diversity and academic programs
• Model thematic and pedagogical programs that merit replication

46
The End