Embed Size (px)
Citation preview

1
ECN
Introduction (10 min)
Experimental Activities (60 min)• 3.1 Injector geometry assessment
Yongjin Jung* (KAIST/Sandi), Peter Hutchins (Infineum/ESRF)
• 3.2 Rate-of-injection Raul Payri* (CMT), Scott Parrish (GM)
• 3.3 Spray Visualization (liquid/vapor penetration & angle) Julien Manin* (SNL), Gilles Bruneaux (IFPEN), Scott Parrish (GM), Luigi Allocca (IM), Josh Lacey (Melbourne)
• 3.4 Drop size measurement (Phase Doppler Interferometry) Scott Parrish* (GM)
Modeling Activities (40 min)• 3.5 Internal flow modeling using ideal geometry
Ron Grover* (GM) • 3.6 Spray modeling
Noah Van Dam* (UW), Tommaso Lucchini (Politecnico di Milano), Sibendu Som (ANL)
Future activities (10 min)
*Discussion Leader
ECN3 – Spray G Preliminary Program
2
ECN
Gasoline Spray (Spray G)Topic 3.2 Rate-of-injection
Raul Payri* (CMT)Scott Parrish (GM)
Spray G – Rate of Injection

3
ECN Spray G – Injection Rate
• Control of command signals with Delphi driver + pulse generator. • Injector body temperature control.
CMT Setup GM Setup
Fuel is accumulated in a big volumeSystem for injector temperature control

4
ECN Spray G – Injection Rate (CMT)
• Methodology• Experimental instruments
– A commercial EVI-IAV system (Bosch method) is used.
– Pressure regulated in the rail.– Additional pressure is
measured in the rail with a Kistler sensor
– Control of command signals of the injector with driver + pulse generator.
• Outputs– Injection rate shape.– Total amount of fuel injected.

5
ECN Spray G – Injection Rate (CMT)
0 0.001 0.002 0.003 0.004Tiem po [s ]
0
10
20
30
40
Ta
sa
de
iny
ec
ció
n [
g/s
] C iclos
Media
Mass measured with a gravimetric scale
0 0.001 0.002 0.003 0.004Tiem po [s ]
0
10
20
30
PE
VI
[ba
r]
Time [s]
ΔPEV
I [ba
r]
Inje
ction
rate
[g/s
]Mass-flow meter output signal
50 injections
a
PA
dt
dm EVIt
At: EVI mass flow metera: speed of sound f(p,T)
Time [s]
Inje
ction
rate
[g/s
]
comparison with
Averaged injected mass - EVI
dta
PAdt
dtdm
m EVIt

6
ECN Spray G – Injection Rate Shot to shot dispersion on GM injector 28
• Similar results obtained for all injectors in GM or CMT
0 0.5 1 1.5 2 2.5-5
0
5
10
15
20
Time (ms)
Cur
rent
(A
)
0 0.5 1 1.5 2 2.5-5
0
5
10
15
20
Time (ms)
Inje
ctio
n R
ate
(mg/
ms)
≈ 310 µs ≈ 780 µs
Injector 28, Spray G Conditions – Iso-Octane, 20 MPa, 90C, 680 µs, 6 bar column pressure. Rate Meter: IAV (rate tube method)

7
ECN Spray G – Injection Rate (CMT)
0 0.2 0.4 0.6 0.8 1 1.2 1.4 1.6 1.8 2
-2
0
2
4
6
8
10
12
14
16
18200Bar_6bar_680us_1Hz
GM Injector 16 avg_rate6 Bar, 1 Hz 10.39mg
GM Injector 16 avg_rate6 Bar, 20 Hz. 10.95mg
GM Injector 28 avg_rate6 Bar, 1 Hz. 10.09mg
CMT injector 26 6Bar, 1Hz 10.1mg
CMT injector 26 6Bar, 10Hz 10.2mg
Time (ms)
Inje
ction
Rat
e (m
g/s)
Nominal point comparison

8
ECN Rail pressure Influence for injector #26
Spray G – Injection Rate (CMT)

9
ECN Back pressure Influence for injector #26
Spray G – Injection Rate (CMT)
Small variations in BP affect injection dynamics but barely change the total injected mass. A high BP “smoothes” the opening and closing of the injector.

10
ECN Spray G – Injection Rate (CMT) Frequency Influence on injection rate
At 1Hz (red signal) the injector closes sooner for any ET.

11
ECN Spray G – Injection Rate (CMT)
Frequency Influence CMT vs GM
Injector 16 GM Injector 26 CMT
12
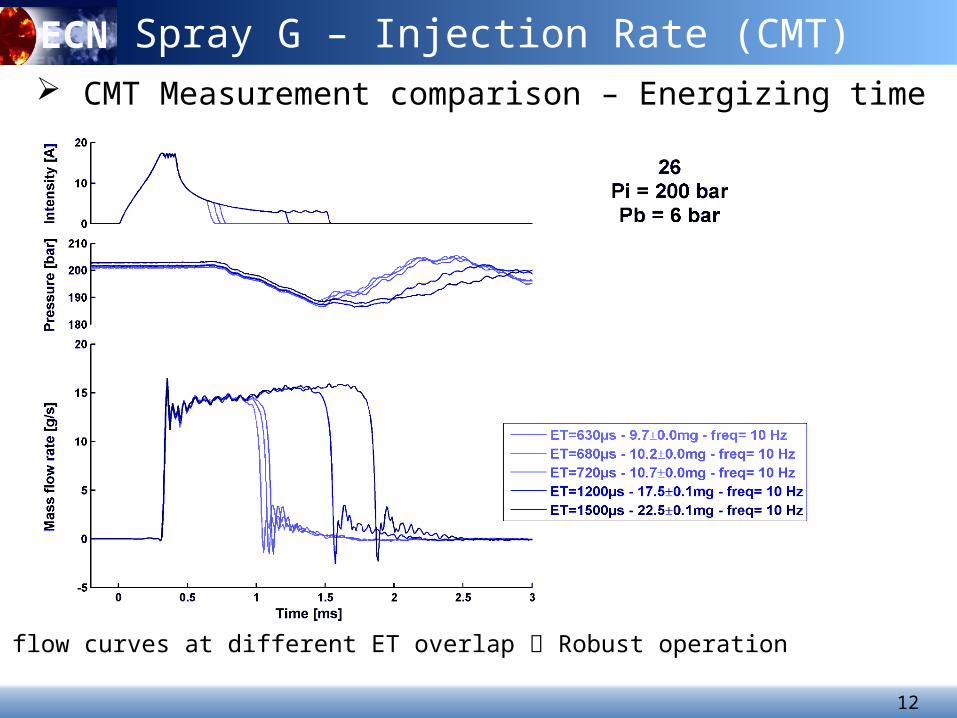
ECN CMT Measurement comparison – Energizing time
Spray G – Injection Rate (CMT)
Mass flow curves at different ET overlap Robust operation

13
ECN Use of Delphi ECU to assure equal electrical signals in all research
participant groups Injector temperature control is important Spray “G” injectors perform very well in terms of shot to shot
dispersion (all units) Similar injected quantities for the different injectors, it will be
possible to adjust slightly the ET to inject 10 mg in all the cases if it is necessary
Known influence of injection pressure or Energizing Time Back pressure affects the dynamics of the injector (specially at 20
bar) Small effect of injection frequency on injection rate
Probably this effect is due to thermal issues in the injector Very difficult to properly measure 1Hz injection frequency with a
gravimetric balance due to the small injected quantity
Spray G – Injection Rate (Conclusions)

14
ECN
CMT will construct a test rig to measure spray momentum for Spray “G” injector
Compare injection rate derived from spray momentum and measured with injection rate
Periodic check of injection rate after extensive campaigns are performed in high pressure and high temperature vessels
Understand differences in injected quantities between different injector samples (when differences are the order of more than 5%)
Determination of a different energizing time for each injector so that exactly 10 mg/st could be injected
Possible generation of a virtual injector “clean signal” so that modelers could use it
Spray G – Injection Rate (Future work)