Embed Size (px)
Citation preview

1 | P a g e

i | P a g e
POLICY SUMMARY
Key recommendations for improved project performance of land reform projects supported by the
department from 2009 to 2013 through the Comprehensive Agricultural Support Programme (CASP)
and/or Ilima-Letsema, as noted from the project performance evaluation undertaken are:
Utilise agricultural economists to investigate potential for viability at project start-up: The
department needs to ensure that beneficiaries are not set up for failure by involving
agricultural economists from project start-up to ensure that projects have a reasonable
chance of success prior to providing support and establishing a false sense of hope among
beneficiaries. If potential for viability exists, the agricultural economists need to identify and
quantify the critical support areas required, such as determining the group size that a project
can successfully sustain. The requirements should be contained in farm business plans.
Support formalisation and organisation of businesses prior to rollout of further support: A
business-oriented approach will assist project farms in progressing from a subsistence
orientation to an economic one. These aspects are to be considered prerequisites for further
support: registered business, bank account, tax compliance, VAT registration, labour law
compliance, record keeping, etc. Financial and non-financial record keeping facilitates better
monitoring of project farms and enables beneficiaries to operate their farming practices as
businesses. Project farms need to be organised to offset their market disadvantages. Contract
farming arrangements with large farms or marketing agents all require formalisation.
Business plans and regular business planning: Regular business planning of these components
that are typically contained in a business plan needs to be a critical focus area of support from
the Unit of Technical Assistance: trend and feasibility analysis, production and sales forecasts,
capital need projections, risk amelioration, income and expenditure projections, market
access, etc. If they are contained in the business plan at project start-up, a good basis for at
least yearly business planning can be nurtured.
Match beneficiaries own capital and physical contribution to the department’s financial and
non-financial support: If beneficiaries make their own capital contributions to projects, this
ensures greater commitment and enables them to gain experience in creating value.
Agriculturally experienced beneficiaries are more motivated to work hard, have realistic
expectations of benefits, and reveal patience for the time horizons for such benefits.
Beneficiaries’ financial and non-financial support (in the form of hard work and prior
agricultural experience) must be matched with the department’s support.
Encourage a multiplicity of income sources at project start-up: Both off-farm and on-farm
income sources are needed as possible sources of income to support eventual full-scale and
full-time farming involvement. This will ensure that there is a safety net in that beneficiaries are
not solely dependent on the farm, are less likely to jeopardise the farm’s future, and are better
able to pay for seasonal and day-to-day expenses, which they are then motivated to recoup
through farm activities.
Greater partnership among support providers: The department needs to play a pivotal role in
ensuring that government, NGOs, the private sector and donors work together in a
coordinated manner to create a more equitable and enabling environment.
Greater focus on environmentally sustainable patterns of production: Climate change places
an urgent call for the kinds of sustainable intensification that significantly raise land and labour
productivity, while reversing environmental degradation. This requires the best of modern
science and indigenous knowledge, as well as an enabling policy environment.
Monitoring progress of projects and that of FSD officers and other support service providers: The
project performance rating system that is designed should be used to collect project
performance information against outcome indicators to enable the department to determine
whether a project is on an upward/downward growth trajectory. The department could
develop a farmer support tracking and referral system to enable joint tracking and monitoring
of both the quantity and quality of support provided by departmental and non-departmental
agencies (financial and non-financial) to project farms.

ii | P a g e
EXECUTIVE SUMMARY
The purpose of this evaluation is to determine the success of a sample of 246 agricultural land
reform projects supported by the department from 1 April 2009 to 31 March 2013 through the
Comprehensive Agricultural Support Programme (CASP) and/or Ilima-Letsema. The performance
evaluation seeks to answer questions to determine the level of success of project farms, such as the
ability of project farms to re-invest finances, the existence of market access contracts, etc.
The evaluation approach, as detailed in Section 3 of the main evaluation report, entailed:
Step 1: Project initiation: this entailed an inception meeting and finalisation of study outcomes
Step 2: Reference group consultation: a steering committee ensured constant review
Step 3: Compliance framework and research design: literature and previous evaluation studies
were reviewed and translated into various ‘criteria for success’. Details of the literature review
are contained in Section 2 of the main evaluation report. Key dimensions of success included
environmental, socio-economic and economic viability. An evaluation framework was
designed to gauge the success of land reform projects and to frame and analyse relevant
evaluation questions contained in the project and beneficiary questionnaires/evaluation tools.
Sampling ensured provincial spread and distribution of size of project farms in terms of number
of beneficiaries. An inception report was also prepared.
Step 4: Data collection: agricultural graduates were sourced and trained, utilising a detailed
training manual, to undertake the following multi-method evaluation approaches: site visits
and observations, document/record analysis, interviews with project leaders and farmer
support and development (FSD) officials, and beneficiary interviews. The evaluation tools were
incorporated into a digital format, which was accessed and completed through logging into a
tablet. In total 153 land reform projects were evaluated.
Step 5: Analysis of success and sustainability: Various components for success were identified
and compiled into a project performance rating system. Project farms were ranked and
classified, based on standard scores, into these categories: highly successful, moderately
successful, challenged, and failed. To determine success factors, correlations between the
dependent variable (rating) and the independent variables (factors obtained from the survey)
was undertaken in order to verify their positive or negative relationship.
Step 6: Project evaluation report
The evaluation problems/issues/challenges/limitations included the following hitches:
Scheduling evaluations proved difficult owing to the time of month/year/harvests
Some farms were inaccessible owing to excessive rain. These were evaluated off-site
Financial data were not always available. Auditors were cited as keeping financial records
Farm production, income, etc, was often based on opinion without documentary proof
Commonages/food security/subsistence projects required their own success indicators
Some projects were too immature to enable determining success
A multiplicity of factors made each project unique and difficult to classify into typologies
Numerous sampled projects had to be replaced
Limited beneficiary surveys were done, although five beneficiaries were requested:
Project leaders were unwilling to allow interviews owing to time off from work
Many beneficiaries are inactive and were not present at the project site
Section 4 of the main report profiles the project farms based on the project farm questionnaire. A
total of 153 project farms were evaluated per region, as shown below.
District No. of projects No. evaluated Representation
Cape Metropole 11 6 55%
Cape Winelands 87 53 61%
Central Karoo 36 22 61%
Eden 39 26 67%
Overberg 33 21 64%
West Coast 40 25 63%
TOTAL 246 153 62%

iii | P a g e
Key project farm profiles entail these aspects, inter alia:
On average, the project farms have 78 beneficiaries each. The majority of beneficiaries are
not actively involved (60%), followed by 30% that are actively involved on a day-to-day
basis, and 10% that are actively involved on a part-time basis.
The gender distribution of beneficiaries is relatively even, with females accounting for 51%
of beneficiaries and males 49%.
Approximately half of the beneficiaries are the youth (18‒35 years of age) or younger.
The agricultural experience of beneficiaries at the project start is as follows: more than 5
years’ experience (58%), no agricultural experience (31%), and fewer than 5 years’
experience (11%).
The average number of full-time employees per project farm is 13.
Approximately 60% of all full-time employees are males, while 40% are females. Female
representation in project farms is relatively high, compared with other sectors.
The average minimum daily wage paid to farm workers is R100 per day, although 78% of
project farms evaluated pay R105 per farm worker or more.
Approximately 69% of projects have been able to re-invest finance into their businesses.
Section 5 of the main report profiles the 245 beneficiaries, based on administering the beneficiary
questionnaire. The impact on beneficiaries’ quality of life, employment and household income as
brought about by project farms reveals that:
Multiple household income sources are common, and project income on average contributes
more than half to the household’s income.
Marginal increase is noted (from prior to the project to the current rating) in the overall rating of
levels of satisfaction with life, even if the overall rating is still mostly neutral.
A direct relationship is noted between income and the way beneficiaries’ rate their levels of
satisfaction and quality of life improvements.
Furthermore, levels of satisfaction with the anticipated future financial situation reveal that
nearly three quarters anticipate high or very high future financial situations.
Access to a better physical living environment has improved slightly in comparison with the
situation prior to the project. The beneficiaries that changed their place of residence from prior
to joining the project to their current residence have mostly reported their physical and living
environments to have improved or remained the same.
Approximately 60% of beneficiaries’ household income increased owing to the project farms,
whereas 40% of the beneficiaries’ household incomes decreased.
The overall performance evaluations of the project farm are detailed in Section 6 of the main
report. Eleven of the project farm beneficiaries occupied their land only in 2011, and mostly started
with operations only in 2012/13. The evaluation team considered the period insufficient to provide a
meaningful evaluation of performance. A further 17 of the project farms were classified as
commonages, food security projects or subsistence farms. As a large percentage of the evaluation
system was devoted to economic success, the evaluation team rated these projects according the
following variables, which are more in line with the project’s objectives:
Degree of internal conflict among beneficiaries
Percentage female and youth representation of beneficiaries
Access to food in order to meet the needs of the households
Satisfaction with change in beneficiaries health as brought about by the project farm
Satisfaction with beneficiaries life as brought about by the project farm
There was a relatively even distribution among the commonages, food security projects, and
subsistence farms projects that have scored above average and below average. The highest
scoring commonage/food security/subsistence farming projects received 67%, whereas the lowest
received 33%, which shows that none of the commonage/food security/subsistence projects are
doing exceptionally well or exceptionally poorly.

iv | P a g e
To determine the extent to which the remaining 135 projects (153 project farms evaluated minus 11
new projects, minus 17 commonage/subsistence/food security projects, plus 10 projects that have
closed down) are successful and sustainable or, on the other side of the spectrum, a total failure,
the following project performance rating system was designed.
# SUB-INDEX INDICATORS SCORE
1
Impact on
natural
resources
Percentage of farming electricity from renewable/green energy 2
10
2 Degree of water contamination from farming practices 2
3 Sewerage disposal efficiency 2
4 Waste recycling/re-use 2
5 Project evaluators observation on condition of soil and erosion 2
Environmental dimension total 10
6 Benefi-
ciaries &
workforce
Share of inactive beneficiaries 2
6 7 Value of beneficiaries’ contribution per beneficiary 2
8 Internal conflict between beneficiaries 2
9 Empowerment
targets
Percentage female beneficiaries 2 4
10 Percentage youth beneficiaries 2
11 Labour
law
Workers UIF registered 2 4
12 Minimum wage 2
13 Quality
of life
Standard of physical living environment 2 4
14 Access to food to feed household needs 2
15 House-
hold
income
Level of satisfaction with availability of money 2
6 16 Change in income regularity and consistency 2
17 Change in anticipated future financial situation 2
Socio-economic dimension 24
18 Business
formalisation
Registered company and bank account 2
6 19 Business plan in place and rating of four components 2
20 Tax registered 2
21
Expertise and
Management
Share of beneficiaries more than 5 yrs agri. experience at start 2
8 22 Success of overall PM, marketing & financial management 2
23 Sound financial management and record-keeping system 2
24 Income and expenditure projections 2
25 Support &
skills
development
Sufficiency of FSD support 2
4 26 Skills development plan in place and implementing 2
27
Production
Sufficiency of equipment and machinery for production 2
8
28 Production records 2
29 Rating of current production: combination of farming types 2
30 Farm utilised to full potential 2
31 Future anticipated production growth 2
32 Market
access
Percentage market access: combination of farming types 2
6 33 Market access contracts: combination of farming types 2
34 Project evaluator observation of condition of internal roads 2
35
Income,
expenditure
and debt
Capable of servicing debts 2
10
36 Ability to reinvest finances into the farm/project 2
37 Is project viable or profitable 2
38 Sufficiency of financial support received 2
39 Future anticipated profit growth 2
Economic viability dimension 44
TOTAL PERFORMANCE RATING SCORE 78
To determine the class breaks between the classifications, various accepted methodologies were
identified, scrutinised and analysed in terms of their applicability, which included investigating
methodologies utilised in relevant evaluations covered in the literature review. Discussions with
other knowledgeable evaluation experts were also undertaken and standard scores were chosen
as the preferred method of determining the class breaks.

v | P a g e
The overall project performance rating results are as follows:
CLASSIFICATION NUMBER OF PROJECT FARMS SHARE
Highly successful (score: 73%–100%) 15 project farms 11%
Moderately successful (53%–72%) 69 project farms 51%
SUCCESSFUL (53%–100%) Sub-total: 84 project farms 62%
Challenged (33%–52%) 32 project farms 24%
Failed (0%–32%) 19 project farms 14%
UNSUCCESSFUL (0%–52%) Sub-total: 51 project farms 38%
TOTAL 135 project farms 100%
The table below shows the average score (out of 100%) per classified project for each of the
dimensions, namely environmental, socio-economic, and economic viability:
PROJECT CLASSIFICATION DIMENSION
Environmental Socio-economic Economic viability
Highly successful 59% 63% 86%
Moderately successful 42% 55% 72%
Challenged 35% 45% 47%
Failed 14% 11% 14%
TOTAL 38% 48% 59%
The top 5 average scoring indicators, in order of importance, are:
Capable of servicing debts 88%
Percentage market access 81%
Sewerage disposal efficiency 80%
Sufficiency of FSD support 80%
Future anticipated production growth 80%
The 5 lowest average scoring indicators, in order of importance, are
Percentage of farming electricity from renewable/green energy 6%
Degree of water contamination from farming practices 9%
Waste recycling/re-use 23%
Value of beneficiaries contribution per beneficiary 26%
Farm utilised to full potential 26%
The project performance rating system was further used to determine the relationships among
various independent variables obtained from the evaluation framework and data from the project
performance rating system to determine correlations with success.
None of the failed projects had any of the following aspects, which reveals that these aspects
correlate most with failed projects and thus are likely to be key reasons contributing to failure:
No beneficiaries previously resident on the farm
No market access contracts in place
No operational loans
No skills development plan in place
No mentorship or commodity committee support received
No production records in place
No beneficiaries anticipate improvements in regularity and consistency of household income
No beneficiaries experienced very good/good change in access to food to feed family
No beneficiaries experienced very good/good change in standard of physical living
No beneficiaries experienced very good/good change in satisfaction with availability of
money for household

vi | P a g e
All highly successful projects have the following aspects in place:
Registered farm business, VAT and tax registered, bank account holders
Beneficiaries anticipate their future financial situation to improve
Compliant with labour law in terms of minimum wage and registration for UIF
Market access of all produce
Good/very good rated support: training courses, mentors, FSD advice, market access
Water from a reliable source for farming practices
Key task execution for marketing rated as very good/good
Business plan exists for current farming practices at start-up
Sound financial management record-keeping systems and cash flow
Record keeping: monthly income and expenditure statements, production records, annual
financial statements, projections of income and expenditure
In conclusion the main report suggests the following aspects for improved performance:
Project leaders need greater assistance in understanding the legal status of their entity
The type of farming activity needs to match the resources
Beneficiary pre-selection needs greater consideration for agricultural skills and experience
Monitoring is required of not only quantity, but quality of support provided by FSD officers
Project farms need to be better organised and formalised to access markets
Project leaders need greater assistance with understanding their business plans so that they
can implement proper business planning, cash flow management, risk amelioration, etc
Greater focus on basic record keeping and business formalisation is essential
FSD officers should be trained adequately in conflict resolution
Critical human development requirements include financial management, farm production
management, marketing/market access, and human resource management
A skills development plan should be a prerequisite for project farm selection
Beneficiaries could benefit from networking with beneficiaries from other project farms
Regular collection of project performance information is required
The critical recommendations with which the department is in a pivotal position to assist include:
Utilising agricultural economists to investigate potential for viability at project planning/start-up
Supporting formalisation and organisation of businesses prior to rollout of further support
Providing greater support with business plans and regular business planning
Matching beneficiaries own capital and physical contribution to the department’s support
Encouraging a multiplicity of income sources at project start-up
Co-ordinating greater partnership among support providers
Ensuring greater focus on environmentally sustainable patterns of production
Monitoring progress of projects and that of FSD officers and other support service providers
The department is also recommended to develop exit strategies for cessation of support both for
existing projects that can succeed on their own and project farms that have failed to such an
extent that continued support is no longer justified. Aspects to be considered are detailed, such as
evaluating productivity levels, profitability, cash flow, etc, for three consecutive years.
Through CASP and Ilima-Letsema, the department has recognised that the private sector cannot
do it all, and is bridging the gap in areas which market actors are not. Competent FSD advisors,
mentors, financial and non-financial support, etc, have enabled more than 60% of the land reform
project farms to be classified as successful. Most importantly, though, without the support of CASP
and Ilima-Letsema, the current success rate and hope for land reform projects would be dire. So
many solutions to problems faced by the project farms have their roots in the support from CASP
and Ilima-Letsema. The expectations of CASP and Ilima-Letsema have started to bear fruit, and
some of the project farms have not only succeeded in developing an economic performance that
matches expectations, but have alleviated poverty, improved the livelihoods of beneficiaries, and
created jobs, which indirectly benefits a much wider range of poor than just the direct
beneficiaries. The challenge now is to help more project farms to follow a business-oriented growth
approach in order to reap the rewards from investments and sow enhanced contributions.
Essentially, what is mostly needed is the scaling up of successful experiences, as noted from the
successful project farms.
vii | P a g e
CONTENTS
1. EVALUATION SCOPE AND PURPOSE ............................................................................. 1
2. EVALUATION APPROACH .............................................................................................. 2
3. OVERVIEW OF PROJECT FARMS AND BENEFICIARIES .................................................. 4
3.1 OVERVIEW OF PROJECT FARMS .................................................................................................................. 4
3.2 OVERVIEW OF BENEFICIARIES AND EMPLOYEES ...................................................................................... 6
3.3 BENEFICIARY PERCEPTIONS ......................................................................................................................... 7
4. EVALUATION OF PROJECT’S PERFORMANCE ............................................................... 8
5. FACTORS FOR SUCCESS .............................................................................................. 13
6. KEY RECOMMENDATIONS FOR IMPROVED PERFORMANCE ..................................... 17
ANNEXURE 1: COMPREHENSIVE EVALUATION REPORT

1 | P a g e
1. EVALUATION SCOPE AND PURPOSE
In South Africa, access to and redistribution of land is a key imperative to securing democratic
stability. However, in line with government’s outcomes-based approach, the number of farms
and associated transferred hectares is less important than the actual performance of the
project farms. As such, the purpose of this evaluation is to determine the success of a sample of
150 of the 246 agricultural land reform projects (smallholder and commercial farmers) supported
by the department from 1 April 2009 to 31 March 2013 through the Comprehensive Agricultural
Support Programme (CASP) and/or Ilima-Letsema.
The project performance evaluation seeks to answer various questions, inter alia, to determine
the level of success of the project farms in terms of aspects such as the ability of projects to re-
invest finances into the business, to comply with labour law requirements, to secure access to
markets, to develop production and/or sales records, and to reveal the existence of a business
plan.
This report, submitted by Kayamandi Development Services (Pty) Ltd, serves as a main summary
report for the project performance evaluation, on behalf of the Unit for Technical Assistance
(UTA) an initiative of the Provincial Department of Agriculture: Western Cape, administered by
the Cape Agency for Sustainable Integrated Development (Casidra) (Pty) Ltd.
The following sections form part of this report:
Evaluation approach
Overview of project farms and beneficiaries
Evaluation of projects’ performance
Factors for success
Key recommendations for improved performance
The Comprehensive Evaluation Report is annexed to this report.

2 | P a g e
2. EVALUATION APPROACH
The evaluation was conducted according to these main steps as shown below.
STEP 6: LAND REFORM PROJECT SUCCESS REPORT
Comprehensive analytical report
Policy recommendations
Draft and final report
Presentations of results
STE
P 2
: REFER
EN
CE G
RO
UP
CO
NSU
LTATIO
N
STEP 1: PROJECT INITIATION
Inception meeting
Finalise study goal and objectives
STEP 3: COMPLIANCE FRAMEWORK & RESEARCH DESIGN
Literature review–to identify assessment criteria
Evaluation framework and parameters of compliance
Data collection tools: beneficiary and project farm questionnaires
Sampling: representative of district, municipality, and project size
Inception report and work plan
STEP 4: DATA COLLECTION
Pilot of primary data collection tools to determine suitability
Appointment of agricultural graduates as evaluators
Training of evaluators
Multi-method primary data collection and evaluation approach:
o Site visits and observations
o Document/record analysis
o Interviews with project leaders
o Interviews with farmer support development (FSD) officials
o Beneficiary interviews
STEP 5: ANALYSIS OF SUCCESS AND SUSTAINABILITY
Profiling of sampled projects and beneficiaries
Project performance rating system
Classification and rating of project farms
Success correlations
3 | P a g e
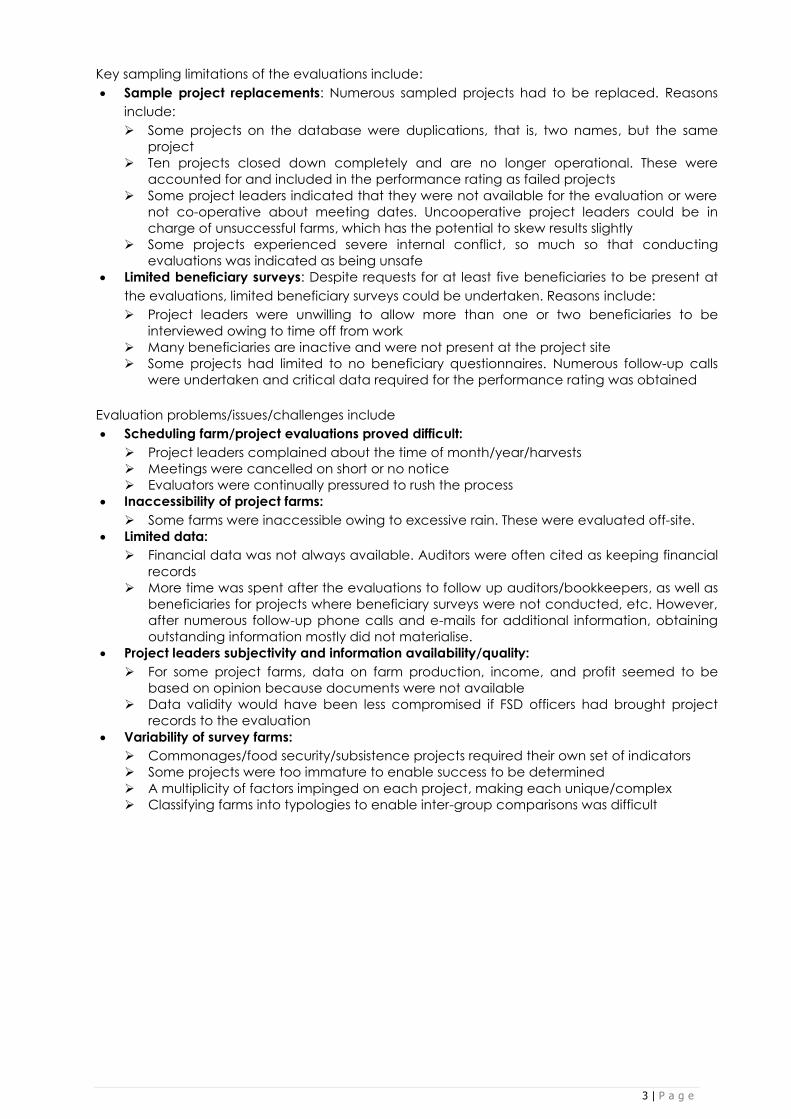
Key sampling limitations of the evaluations include:
Sample project replacements: Numerous sampled projects had to be replaced. Reasons
include:
Some projects on the database were duplications, that is, two names, but the same
project
Ten projects closed down completely and are no longer operational. These were
accounted for and included in the performance rating as failed projects
Some project leaders indicated that they were not available for the evaluation or were
not co-operative about meeting dates. Uncooperative project leaders could be in
charge of unsuccessful farms, which has the potential to skew results slightly
Some projects experienced severe internal conflict, so much so that conducting
evaluations was indicated as being unsafe
Limited beneficiary surveys: Despite requests for at least five beneficiaries to be present at
the evaluations, limited beneficiary surveys could be undertaken. Reasons include:
Project leaders were unwilling to allow more than one or two beneficiaries to be
interviewed owing to time off from work
Many beneficiaries are inactive and were not present at the project site
Some projects had limited to no beneficiary questionnaires. Numerous follow-up calls
were undertaken and critical data required for the performance rating was obtained
Evaluation problems/issues/challenges include
Scheduling farm/project evaluations proved difficult:
Project leaders complained about the time of month/year/harvests
Meetings were cancelled on short or no notice
Evaluators were continually pressured to rush the process
Inaccessibility of project farms:
Some farms were inaccessible owing to excessive rain. These were evaluated off-site.
Limited data:
Financial data was not always available. Auditors were often cited as keeping financial
records
More time was spent after the evaluations to follow up auditors/bookkeepers, as well as
beneficiaries for projects where beneficiary surveys were not conducted, etc. However,
after numerous follow-up phone calls and e-mails for additional information, obtaining
outstanding information mostly did not materialise.
Project leaders subjectivity and information availability/quality:
For some project farms, data on farm production, income, and profit seemed to be
based on opinion because documents were not available
Data validity would have been less compromised if FSD officers had brought project
records to the evaluation
Variability of survey farms:
Commonages/food security/subsistence projects required their own set of indicators
Some projects were too immature to enable success to be determined
A multiplicity of factors impinged on each project, making each unique/complex
Classifying farms into typologies to enable inter-group comparisons was difficult

4 | P a g e
3. OVERVIEW OF PROJECT FARMS AND BENEFICIARIES
This section provides an overview of:
Project farms
Beneficiaries and employees
Beneficiaries’ perceptions
3.1 OVERVIEW OF PROJECT FARMS
In total 153 project farm evaluations were undertaken as shown below.
Table 1: District representation of projects sampled and evaluated
District Total no. of projects No. evaluated Representation
Cape Metropole 11 6 55%
Cape Winelands 87 53 61%
Central Karoo 36 22 61%
Eden 39 26 67%
Overberg 33 21 64%
West Coast 40 25 63%
TOTAL 246 153 62% Source: DoA database of supported land reform projects and Kayamandi Calculations, 2013
The average size of project farms evaluated is 781 hectares (ha), although 25% of the project
farms are small and less than 10 ha in size. The distribution of main type of farming undertaken by
the projects, in order of importance, is:
Animal production 31%
Horticulture 27%
Vegetable farming 22%
Crops 8%
Production of products (milk, eggs, wine, etc) 8%
Other activities (honey, aquaculture, etc) 4%
Other than for horticultural farming, market access contracts are limited. The distribution of market
access and existence of market access contracts per farming type is shown below.
Table 2: Percentage distribution of type of market access per type of farming
Ma
rke
t a
cc
ess
Farm gate 42% 6% 42% 14% 31%
Suppliers 42% 49% 39% 40% 58%
Export 0% 33% 3% 0% 2%
On-farm value-adding 2% 5% 4% 36% 2%
No market access 14% 6% 12% 10% 7%
TOTAL 100% 100% 100% 100% 100%
Source: Kayamandi Project Survey, 2013
MARKET ACCESS
COMPONENTS
TYPE OF FARMING
An
ima
l
pro
du
ctio
n
Ho
rtic
ultu
re
Ve
ge
tab
les
Cro
ps
Pro
du
cts
Market access contracts exist 16% 80% 24% 28% 36%
No market access contracts 84% 20% 76% 72% 64%
TOTAL 100% 100% 100% 100% 100%

5 | P a g e
On average there are slightly more than two key project management roles/positions for each
project farm. These are mostly beneficiary filled (70%), followed by externally filled full time (22%)
and externally filled part time (8%). There is regular consultation with beneficiaries and the average
number of beneficiary meetings per annum is approximately 15 per project farm. In other words, on
average beneficiaries are mostly consulted three times every two months. However, approximately
57% of project farms have four or fewer meetings per annum and thus consult less regularly than
once a quarter.
Much debate takes place in policy on the value of mentors, FSD advice and other non-financial
support. One would anticipate these areas of support to be critical in order to ensure the success of
projects. On average each project farm received three forms of non-financial support, although 5%
of project farms revealed that they have not obtained any non-financial support.
Project leaders have mostly rated their non-financial support as being sufficient and either good/ or
very good. See table below.
Table 3: Percentage distribution of rating and sufficiency of support received
SUPPORT
RATING SUFFICIENCY
Ve
ry b
ad
Ba
d
Ac
ce
pta
ble
Go
od
Ve
ry g
oo
d
TOTA
L
Su
ffic
ien
t
Insu
ffic
ien
t
TOTA
L
Training courses 0% 1% 16% 53% 30% 100% 84% 16% 100%
Mentorship 1% 2% 7% 62% 28% 100% 94% 6% 100%
FSD advice 2% 2% 11% 47% 38% 100% 89% 11% 100%
Market access support 0% 1% 10% 60% 29% 100% 90% 10% 100%
Commodity committee 0% 0% 10% 69% 21% 100% 93% 7% 100%
Source: Kayamandi Project Survey, 2013
In order to compare the value of financial support obtained over the years, the value of the
financial support from years prior to 2013 has been transformed to a 2013 value, by accounting
for consumer price index (CPI). The 2013 average value of financial support obtained per
project farm which obtained financial support is as follows:
Average value of capital loans R3 284 650
Average value of capital grants R4 829 118
Average value of operational loans R2 459 625
Average value of operational grants R726 704
Total average value of financial support R3 094 298
Slightly more than half (56%) of the beneficiary groups of the project farms contributed none of
their own capital to the farm’s financial kitty, despite this being a requirement for attainment of
support.
Project farms are indebted by an average of R1.85 million, which includes those project farms
with no debt (65%). For the project farms that have debts, the majority (89%) have indicated
that they are capable of servicing their debts. Approximately 69% of project farms have also
revealed that they are able to re-invest finances into their business, which is a positive indication
for successful undertakings.

6 | P a g e
3.2 OVERVIEW OF BENEFICIARIES AND EMPLOYEES
On average the project farms have 78 beneficiaries each, of whom the majority are not actively
involved (60%), as shown below.
Table 4: Percentage distribution of level of beneficiary involvement
Beneficiary level of involvement TOTAL Average number of
beneficiaries per project
Active on day-to-day basis 30% 24
Active on part-time basis 10% 15
Not actively involved 60% 96
TOTAL 100% 78
Source: Kayamandi Beneficiary Survey, 2013
The gender distribution of beneficiaries is relatively even, with females accounting for 51% and
males 49%. Approximately 1.5% of project beneficiaries are disabled, which suggests a
concerted effort to integrate disabled persons into the project farms. The majority of
beneficiaries of the project farms evaluated are Coloured, which accounts for 82% of the
beneficiaries, followed by 18% that are Black African. The age distribution of beneficiaries is as
follows:
School-going (0–17) 28%
Youth (18–35) 21%
Middle age (36–59) 40%
Old age (60+) 11%
Project farms with large numbers of beneficiaries that are 60 years and older need to ensure that
they have beneficiary succession plans in place, especially in the smaller project farms. The
relatively high proportion of the youth and school-going-age beneficiaries reveals that the
department is drawing a new generation of farmers to the projects, in light of the knowledge
that in the main, involvement in a primary economic sector is not high on the agenda of the
youth.
The agricultural experience of beneficiaries at project start is as follows:
No agricultural experience 31%
Less than five years’ experience 11%
More than five years’ experience 58%
Whereas formal education is low as shown below:
None 23%
Grade 7/Std 5 47%
Grade 10/Std 8 18%
Grade 12/Std 10 9%
Diploma 2%
Degree 1%
The average number of full-time employees per project farm is 13, whereas the project farms
employ an average of 11 casual/seasonal labourers per annum. The average number of full-
time employees increases with the number of beneficiaries per project farm. Approximately 60%
of all full-time employees are males, while 40% are females. Compared with other economic
sectors, and the agricultural sector as a whole, female representation in project farms is
relatively high. The racial distribution of full-time employees is as follows:
Coloured 65%
Black African 31%
White 4%
The average minimum daily wage paid to farm workers is R100 per day, although 78% of project
farms pay R105 per farm worker or more, which is the 2013 legally required minimum daily wage.
7 | P a g e
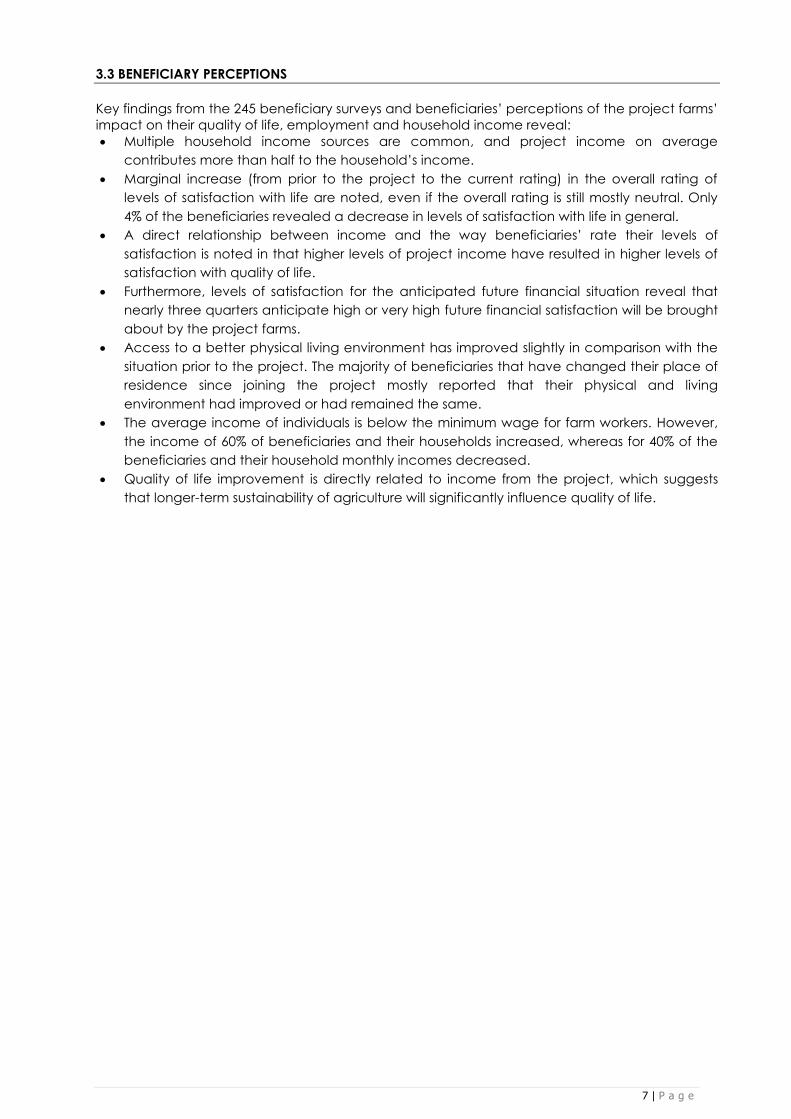
3.3 BENEFICIARY PERCEPTIONS
Key findings from the 245 beneficiary surveys and beneficiaries’ perceptions of the project farms’
impact on their quality of life, employment and household income reveal:
Multiple household income sources are common, and project income on average
contributes more than half to the household’s income.
Marginal increase (from prior to the project to the current rating) in the overall rating of
levels of satisfaction with life are noted, even if the overall rating is still mostly neutral. Only
4% of the beneficiaries revealed a decrease in levels of satisfaction with life in general.
A direct relationship between income and the way beneficiaries’ rate their levels of
satisfaction is noted in that higher levels of project income have resulted in higher levels of
satisfaction with quality of life.
Furthermore, levels of satisfaction for the anticipated future financial situation reveal that
nearly three quarters anticipate high or very high future financial satisfaction will be brought
about by the project farms.
Access to a better physical living environment has improved slightly in comparison with the
situation prior to the project. The majority of beneficiaries that have changed their place of
residence since joining the project mostly reported that their physical and living
environment had improved or had remained the same.
The average income of individuals is below the minimum wage for farm workers. However,
the income of 60% of beneficiaries and their households increased, whereas for 40% of the
beneficiaries and their household monthly incomes decreased.
Quality of life improvement is directly related to income from the project, which suggests
that longer-term sustainability of agriculture will significantly influence quality of life.

8 | P a g e
4. EVALUATION OF PROJECT’S PERFORMANCE
Eleven of the project farms occupied their land only in 2011 and mostly started with operations
only in 2012/13. The evaluation team considered the period insufficient to provide a meaningful
evaluation of performance. Nonetheless, the initial ratings for the new projects revealed that
two thirds scored above average, and initially appear to be successful, albeit too early to draw
real conclusions.
A further 17 of the project farms were classified as commonages, food security projects or
subsistence farms. Because a large percentage of the evaluation system was devoted to
economic success, which is not a real part of the projects, the evaluation team utilised these
variables, which are more in line with the project’s objectives:
Degree of internal conflict among beneficiaries
Percentage female and youth representation of beneficiaries
Access to food in order to meet the needs of households
Satisfaction with change in beneficiaries’ health as brought about by the project farm
Satisfaction with beneficiaries life as brought about by the project farm
The commonage/food security/subsistence farming projects scored relatively evenly between
the number of projects classified as being above and below average. Note, however, that the
highest scoring commonage/food security/subsistence farming projects received 67%, whereas
the lowest scoring received 33%. This shows that none of the projects are doing exceptionally
well or poorly.
A project performance rating system was designed to determine the extent to which the
remaining 135 projects (153 project farms evaluated minus 11 new projects, minus 17
commonage/subsistence/food security projects, plus 10 projects that have closed down) are
successful and sustainable or, on the other side of the spectrum, a total failure.
The project performance rating system comprises 39 indicators that have been selected to best
indicate the project’s success, rather than a single determinant.
Sensitivity analysis was applied to test different weightings, and the sensitivity analysis revealed
that the most reliable result entailed scoring each indicator out of two, and using equal weights
per indicator. The highest score attainable for any project was measured out of a maximum
attainable score of 78.
The representation of indicators per dimension in the project performance rating system is:
Environmental dimension: 5 indicators 13%
Socio-economic dimension: 12 indicators 31%
Economic viability dimension: 22 indicators 56%
TOTAL: 39 indicators 100%
The project performance rating system showing the 39 indicators with their scores per each of
the dimensions and sub-indexes is depicted below.

9 | P a g e
Table 6: Project performance rating framework
SUB-INDEX # INDICATORS SCORE
Impact on
natural
resources
1 Percentage of farming electricity from renewable/green energy 2
10
2 Degree of water contamination from farming practices 2
3 Sewerage disposal efficiency 2
4 Waste recycling/re-use 2
5 Project evaluators observation on condition of soil and erosion 2
Environmental dimension total 10
Benefi-
ciaries and
workforce
6 Share of inactive beneficiaries 2
6 7 Value of beneficiaries’ contribution per beneficiary 2
8 Internal conflict between beneficiaries 2
Empowerment
targets
9 Percentage female beneficiaries 2 4
10 Percentage youth beneficiaries 2
Labour
law
11 Workers UIF registered 2 4
12 Minimum wage 2
Quality
of life
13 Standard of physical living environment 2 4
14 Access to food to feed household needs 2
Household
income
15 Level of satisfaction with availability of money 2
6 16 Change in income regularity & consistency 2
17 Change in anticipated future financial situation 2
Socio-economic dimension 24
Business
formalisation
18 Registered company and bank account 2
6 19 Business plan in place and rating of four components 2
20 Tax registered 2
Expertise and
Management
21 Share of beneficiaries more than five yrs’ agri. experience at start 2
8 22 Success of overall PM, marketing & financial management 2
23 Sound financial management and record-keeping system 2
24 Income and expenditure projections 2
Support &
skills
development
25 Sufficiency of FSD support 2 4
26 Skills development plan in place and implementing 2
Production
27 Sufficiency of equipment and machinery for production 2
8
28 Production records 2
29 Rating of current production: combination of farming types 2
30 Farm utilised to full potential 2
31 Future anticipated production growth 2
Market
access
32 Percentage market access: combination of farming types 2
6 33 Market access contracts: combination of farming types 2
34 Project evaluator observation on condition of internal roads 2
Income,
expenditure
and debt
35 Capable of servicing debts 2
10
36 Ability to reinvest finances into the farm/project 2
37 Is project viable or profitable 2
38 Sufficiency of financial support 2
39 Future anticipated profit growth 2
Economic viability dimension 44
TOTAL PERFORMANCE RATING SCORE 78

10 | P a g e
Instead of merely providing projects with a single score, the projects were categorised into four
classifications of success based on their score share. In order to determine the class breaks
between the classifications, various accepted methodologies were identified, scrutinised and
analysed in terms of their applicability, which included investigating methodologies utilised in
relevant evaluations covered in the literature review. Discussions with other knowledgeable
evaluation experts were undertaken in order to ascertain the most acceptable methodology.
The following classification methodologies were short-listed and tested in order to determine the
class breaks between the classifications:
Equal Interval: In equal interval classifications, the data range for all classes are the same. In
other words, the range of the entire data set is divided by the desired number of data
classes, such that each class occupies an equal interval along the range of data values.
The distribution of the data is not taken into consideration when determining class breaks for
the intervals, only the lower and upper values of the data are used.
Standard score percentile rank: This entails determining the average score and the
standard deviation. Failed projects score less than the average minus the standard
deviation. Challenged projects score less than the average, but more than the average
minus the standard deviation. Moderately successful projects score more than the average,
but less than the average plus the standard deviation. Highly successful projects score more
than the average plus the standard deviation.
Both methods provided similar results for ranking successful and unsuccessful projects, although
standard scores provided a greater variance between very successful and moderately
successful projects, as well as challenged and unsuccessful. Furthermore, the resultant
classifications using standard scores provided more acceptable correlations and alignment with
the data and project farm information.
Based on the sensitivity analysis of the classification results and discussions with other
knowledgeable evaluation experts, standard scores was chosen as the preferred method for
determining the class breaks. The project farms scored 53% on average (average percentage
out of a maximum of 78 points of all project farms), and using standard scores, the resultant class
breaks between the classifications are as follows: Highly successful: 73%‒100%
Moderately successful: 53%–72%
Challenged: 33%–52%
Failed: 0%–32%
By grouping highly successful and moderately successful farms, 62% of the project farms are
classified as being successful, whereas 38% are classified as unsuccessful (when grouping
challenged and failed project farms). The overall project performance rating results are as
follows:
Table 6: Project performance rating results per classification
CLASSIFICATION NUMBER OF PROJECT FARMS SHARE
Highly successful 15 project farms 11%
Moderately successful 69 project farms 51%
SUCCESSFUL Sub-total: 84 project farms 62%
Challenged 32 project farms 24%
Failed 19 project farms 14%
UNSUCCESSFUL Sub-total: 51 project farms 38%
TOTAL 135 project farms 100%
Approximately half of the project farms are classified as doing moderately well, followed by a
quarter that are classified as being challenged, 14% that have failed, and 11% that are classified
as being highly successful.

11 | P a g e
The table below shows the average score (out of 100%) per classified projects for each of the
dimensions, namely environmental, socio-economic, and economic viability:
Table 7: Average project scores per classification and dimension
PROJECT CLASSIFICATION DIMENSION
Environmental Socio-economic Economic viability
Highly successful 59% 63% 86%
Moderately successful 42% 55% 72%
Challenged 35% 45% 47%
Failed 14% 11% 14%
TOTAL 38% 48% 59%
On average, the environmental dimension scored the least, with only 38% of its potential score
obtained. Only highly successful project farms on average scored more than half of the
potential score for the environmental dimension. The environmental dimension is considered a
key requirement for sustainability owing to its impact on natural resources. It is recommended
the projects obtain greater support, in particular to ensure decreased water contamination from
farming practices, and improved waste recycling/re-use as these aspects are critical for
environmental sustainability and can have negative impacts on the natural resource base. This is
especially necessary for failed and challenged projects, which mostly have lower consideration
for environmental components.
The socio-economic dimension on average scored half (48%) of its potential score and
evidently both moderately successful and highly successful farms scored more than half of
potential scores for the socio-economic dimension. Challenged projects also did relatively well
in the socio-economic dimension.
The sub-index categories of the socio-economic dimension scored as follows on average:
Empowerment 51%
Labour law 48%
Beneficiaries and workforce 46%
Quality of life 46%
Household income 42%
The economic viability dimension obtained the highest score of all three dimensions and all
project farms on average scored 59% for economic viability. Highly successful farms scored the
highest with an average of 86% for economic viability. Moderately successful farms also score
high at an average 72% for economic viability. Challenged farms on average score nearly half
of the potential score for economic viability, which is a positive indication, in that challenged
farms are slightly more impeded by environmental and socio-economic components than
economic viability.
The sub-index categories of the economic viability dimension scored as follows on average:
Income, expenditure, debt 72%
Expertise and management 62%
Support and skills development 56%
Business formalisation 54%
Production 53%
Market access 53%

12 | P a g e
The top ten highest average scoring indicators, in order of importance, are:
Capable of servicing debts 88%
Percentage market access 81%
Sewerage disposal efficiency 80%
Sufficiency of FSD support received 80%
Future anticipated production growth 80%
Future anticipated profit growth 79%
Success of overall PM, marketing and financial management 73%
Project evaluators observation veld/orchards/crop condition 71%
Sound financial management and record-keeping system 71%
Business plan in place and rating of four components 67%
The ten lowest average scoring indicators, in order of importance, are:
Percentage of farming electricity from renewable/green energy 6%
Degree of water contamination from farming practices 9%
Waste recycling/re-use 23%
Value of beneficiaries contribution per beneficiary 26%
Farm utilised to full potential 26%
Market access contracts combination of farming types 26%
Skills development plan in place and implementing 32%
Change in regularity and consistency of income 40%
Change in level of satisfaction with availability of money 44%
Change in access of food to meet the needs of the household 45%
13 | P a g e
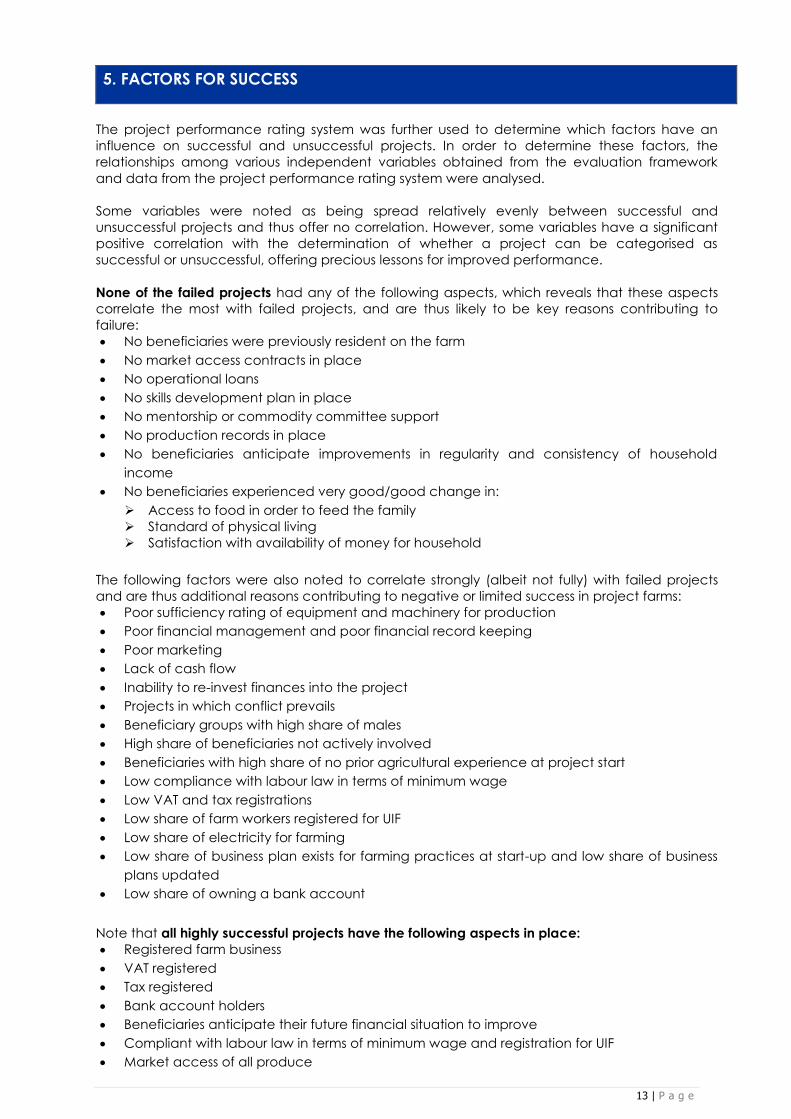
5. FACTORS FOR SUCCESS
The project performance rating system was further used to determine which factors have an
influence on successful and unsuccessful projects. In order to determine these factors, the
relationships among various independent variables obtained from the evaluation framework
and data from the project performance rating system were analysed.
Some variables were noted as being spread relatively evenly between successful and
unsuccessful projects and thus offer no correlation. However, some variables have a significant
positive correlation with the determination of whether a project can be categorised as
successful or unsuccessful, offering precious lessons for improved performance.
None of the failed projects had any of the following aspects, which reveals that these aspects
correlate the most with failed projects, and are thus likely to be key reasons contributing to
failure:
No beneficiaries were previously resident on the farm
No market access contracts in place
No operational loans
No skills development plan in place
No mentorship or commodity committee support
No production records in place
No beneficiaries anticipate improvements in regularity and consistency of household
income
No beneficiaries experienced very good/good change in:
Access to food in order to feed the family
Standard of physical living
Satisfaction with availability of money for household
The following factors were also noted to correlate strongly (albeit not fully) with failed projects
and are thus additional reasons contributing to negative or limited success in project farms:
Poor sufficiency rating of equipment and machinery for production
Poor financial management and poor financial record keeping
Poor marketing
Lack of cash flow
Inability to re-invest finances into the project
Projects in which conflict prevails
Beneficiary groups with high share of males
High share of beneficiaries not actively involved
Beneficiaries with high share of no prior agricultural experience at project start
Low compliance with labour law in terms of minimum wage
Low VAT and tax registrations
Low share of farm workers registered for UIF
Low share of electricity for farming
Low share of business plan exists for farming practices at start-up and low share of business
plans updated
Low share of owning a bank account
Note that all highly successful projects have the following aspects in place:
Registered farm business
VAT registered
Tax registered
Bank account holders
Beneficiaries anticipate their future financial situation to improve
Compliant with labour law in terms of minimum wage and registration for UIF
Market access of all produce

14 | P a g e
Good/very good rated non-financial support obtained for: training courses, mentors, FSD
advice, market access
Water from a reliable source for farming practices
Key task execution for marketing rated as very good/good
Business plan exists for current farming practices at start-up
Sound financial management record-keeping systems exist
Cash flow exists
Record keeping:
Monthly income and expenditure statements
Production records
Annual financial statements
Projections of income and expenditure
Furthermore, the following additional factors correlate strongly with highly successful projects
(albeit not fully):
Skills development plan in place
Electricity for farming
Market access contracts in place
Cell phone reception
Updated business plans
Very good/good sufficiency rating of equipment and machinery for production
Recycling/re-use of nutrients/water from waste
Good internal beneficiary working relationship with very positive or positive impacts
Very good/good condition of sheds/barns
Very good/good condition of fencing
The table below lists various components, whether they be problems or opportunities, noted
from the evaluations or suggestions for improved performance that flow from there:
Table 7: Evaluation findings and suggestions
COMPONENT FINDINGS AND SUGGESTIONS
Legal status
Project leaders often do not understand the legal status of their entity or
choice of entity. Projects need greater assistance
Farm type
selection
The type of farming activity needs to match the resources available.
Greater consideration is needed for project types with less risks
Existing challenged animal and vegetable production farms need
immediate support
Beneficiary
competence
levels
(experience)
Beneficiary pre-selection criteria should have greater concern for
beneficiaries with prior agricultural skills, qualifications, and/or experience
FSD officers
The support obtained from FSD advisors, in failed projects, have mostly
been rated as neutral/bad
Greater implementation of the ‘agricultural knowledge triangle’ is required
until farmers are able to continue on their own
Greater active involvement of officers and monitoring of not only the
quantity, but the quality of the support is required

15 | P a g e
COMPONENT FINDINGS AND SUGGESTIONS
Market
access
Consider central market access infrastructure such as collection points or
shared transport
Consider group action of project farms jointly accessing markets
FSD officers should be able to supply farmers with more adequate
marketing information
Future land acquisitions should be in closer proximity to towns to improve
market access distance
Business
plans
Only a small share of unsuccessful project farms had business plans
Consider the establishment of a business plan development office at the
department to assist with formalisation of business plans. Even though this
component exists under the Unit for Technical Assistance (UTA), project
farm leaders are not sufficiently aware of this
Beneficiaries should understand their business plans so that they are able to
implement them, and undertake future projections, etc
Condition of
machinery
and quality
of
infrastructure
On average, only approximately half of the project farms (even the highly
successful project farms) scored their condition of machinery, equipment,
implements as being very good/good
Water and electricity supply is a key indicator for successful farming
development. Greater partnerships with local communities and farmers
should be established for water and electricity access
Financial
factors
There is a definite lack of understanding of the importance of record
keeping in unsuccessful project farms
Half of unsuccessful projects did not have a registered farm business, no
bank account, and were not VAT/Tax registered. Greater enforcement
needed prior to committing to provision of support
Most of the projects could do with more mentoring on financial
management
Greater focus on basic record keeping and business formalisation is
needed
Agricultural economists should be involved prior to support provision to
analyse viability and ensure projects have a reasonable chance of success
Conflict
resolution
FSD officers should be trained adequately in conflict resolution
Ensure obligations/privileges of active and non-active beneficiaries are
contractually specified
Training on group dynamics should be a prerequisite for beneficiary groups
Support from FSD officers is needed in community conflict resolution
Human
capacity
development
Lack of technical and managerial skills were found to be obstacles to
success
Critical human capacity development requirements include financial
management, farm management, marketing/market access/ sales,
production management, and human resource/conflict management

16 | P a g e
COMPONENT FINDINGS AND SUGGESTIONS
None of the failed projects had a skills development plan in place. A skills
development plan should be a prerequisite for project farm selection
Network of
projects
Project farms have limited to no networks with other project farms
Beneficiaries could benefit from contact with beneficiaries from other
projects within similar commodities in order to share lessons, experience,
etc
Project farms could be clustered geographically
Project farms can develop farmers’ associations, participate jointly in
agricultural shows, undertake farmer-to-farmer extension, etc
Environment
al factors
A greater focus on ensuring production in an environmentally sustainable
manner is required. Economic viability and socio-economic factors should
not be the only considerations
Monitoring
progress
Regular collection of performance information can be inexpensively rolled
out by FSD officers
Setting of targets is required to enable earlier identification of whether
project farms are on an upward/downward trajectory

17 | P a g e
6. KEY RECOMMENDATIONS FOR IMPROVED PERFORMANCE
While every project farm has its own set of requirements for success, the following critical
recommendations, with which the department is in a pivotal position to assist in order to ease
the constraints and hasten the success rate, are:
Utilise agricultural economists to investigate potential for viability at project start-up: It is
regarded as critical that the department does not misguidedly set beneficiaries up for
failure, and should therefore ensure that a project has a reasonable chance of success prior
to providing support and establishing a false sense of hope among beneficiaries. It is
recommended that agricultural economists should be more involved from project start-up.
Their role initially would be to establish the potential for viability and sustainability. If potential
for viability exists, the agricultural economists should identify and quantify the critical support
areas required for success. The quantification by the agricultural economists should include
identification of the value of financial support, what should be acquired with the financial
support attained, the length and type of training requirements, etc. Quantification by the
agricultural economist of the group size that a project can successfully sustain is critical, so
that the gains are not diluted to the point of being insignificant to the livelihoods of
beneficiaries. This should be captured in the project farms’ business plans.
Support formalisation and organisation of businesses prior to rollout of further support: Many
unsuccessful projects did not have a registered farm business or a bank account, were not
VAT/Tax registered, etc. Individually these components do not ensure success, although the
joint outcomes of formal practices do. Take for instance that being VAT registered forces
businesses to keep records, and keeping records forces farmers to be more involved with
the financial affairs of the business. While businesses with turnover lower than R300 000 may
register voluntarily for VAT, if farmers want to do businesses with large companies, larger
companies prefer to do business with VAT-registered businesses. In other words, the
administrative and cash-flow burdens of VAT have added advantages for record keeping
and enabling doing business with larger companies. Overall, higher standards of
administration and record keeping should be attained if the projects are to be more
successful. There is a definite need for project farms to understand the importance of record
keeping. Lack of accounting knowledge is a key reason that beneficiaries are failing to
keep proper financial and other records. It is critical that beneficiaries should become
financially involved in their farming activities instead of just ‘trying their best’. Financial and
non-financial records (minutes of meetings, etc) help to facilitate better monitoring on
project farms and enable beneficiaries to operate their farming practices as businesses. A
business-oriented approach will assist in progressing from a subsistence orientation to an
economic one. In short, these aspects are to be considered prerequisites for further support:
Registered business
Bank account
Tax compliance
VAT registered
Registration of farm labours with the Department of Labour
Record keeping: minutes, production records, sales records, etc
While it is expected that project leaders should respond spontaneously to market
opportunities, continued education and training and support with organisation into
producer groups can be important for project farms as they struggle to adjust to more
commercial and competitive business environments. Project farms need to be organised in
order to offset their disadvantages in the market place. Although local market outlets exist,
the best business opportunities lie with farmers who can organise for urban and export
markets. Organisation is also important if project farms are to obtain access to other non-

18 | P a g e
government financial services (credit, risk management, savings), modern inputs, and to
achieve political clout. Contract farming arrangements with large farms or marketing and
processing agents, marketing cooperatives, etc, all require formalisation. Ultimately, it is the
farmers themselves who need to organise themselves for the market and to obtain greater
political voice. Others should play supporting and enabling roles, but successful farm growth
depends on unleashing the entrepreneurship of the farmers themselves so that they can
grow and prosper, despite inevitable changes in their markets and climate.
Business plans and regular business planning: Through the support provided by the Unit for
Technical Assistance, many of the project farms have more than just project plans (focused
on CASP infrastructure attainment). This shows that there is no longer a focus solely on
immediate outputs in the form of land reform support, but on the longer-term outcome of
sustainable farming businesses. Nonetheless, the majority of failed projects did not have a
business plan. The business plan document itself is less of a requirement for success, and
many project farms do not regularly use/consult/update business plans. However, regular
business planning of these components typically contained in a business plan is critical to
success:
Trend and feasibility analysis
Demand and supply assessments of potential markets
Short and long-term production and sales forecasts
Production and sales records
Capital need projections for viability
Risk analysis and risk amelioration
Access to markets
Income and expenditure projections
Cash flow management/projections
Existence of production and/or sales records
These aspects are deemed critical to success. If they are contained in the business plan at
project start-up, a good basis for at least yearly business planning can be nurtured.
Match beneficiaries own capital and physical contribution to the department’s financial and
non-financial support: Projects in which beneficiaries make their own capital contributions
ensure not only that beneficiaries are more committed to the success of the project farm
because they have something of their own to lose, but that beneficiaries gain experience in
creating value. Furthermore, projects in which project leaders and beneficiaries have
greater agricultural experience are noted for having project leaders and beneficiaries that
are more motivated to continue functioning, have more realistic expectations of financial
and non-financial benefits, and have a greater understanding of the time horizons for such
benefits. Patience and hard work are key requirements in agricultural-related projects and
the sense of realism and continued optimism (following from experience and hard work)
noted at leadership level in the successful projects provides for a new sense of hope in
CASP and Ilima-Letsema supported projects that has not been noted previously by the
evaluators in other government-supported projects. It is thus considered critical that greater
matching of beneficiaries’ financial and non-financial support (in the form of both hard
work and prior agricultural experience) with the department’s support needs to be ensured.
Encourage a multiplicity of income sources at project start-up: Both off-farm and on-farm
income sources need to be investigated as possible sources of income to support eventual
full-scale and full-time farming involvement. Only 10% of beneficiaries of the project farms
are involved on a part-time basis. The use of non-farm income to get started in agriculture is
quite common. Beneficiaries who are actively involved on a part-time basis are not heavily
dependent on the farm and are less likely to jeopardise its future, are better able to pay for

19 | P a g e
seasonal and day-to-day expenses, which they are then motivated to recoup through the
activities on the farm. More part-time involvement initially with the aim of being a full-time
farmer should be supported. Essentially, there are both pros and cons to part-time
involvement. A part-time farmer will have a different livelihood strategy from a full-time
farmer, with less time for farm work, but also less financial dependence on farming income.
These factors may contribute to reduced productivity and technical efficiency, although
less time for farming may induce a need for more effective production and more intensive
labour and capital use. Furthermore, and most importantly, support payments can positively
affect cash flow and other inputs in the frontier production function. Essentially, sideline
business opportunities to boost farm income, moving into higher value agriculture, or
supplementing farm income from part-time non-farm sources to enable greater capital
input into the farm should be considered. This is needed in order to ensure that farmers do
not become more dependent on relief and safety net programmes for their survival, a
situation that may prove neither socially nor financially sustainable. A revived
reconsideration of many traditional approaches to assisting farms is thus suggested by
emphasising:
Helping more small farms capture new business opportunities in farming, especially for
higher value products and value addition activities
Promoting opportunities within the rural nonfarm economy for greater income
diversification and part time farming
Ensuring continuous nurturing/mentoring through supporting activities of large private
firms and NGOs, or organised into producer groups of their own.
Assisting those small farmers who want to exit so that they can do so with dignity
The encouragement of a multiplicity of income sources at project start-up is intended to
support eventual full-time farming once the project farm is able to sustain this. The
multiplicity of income sources also acts as a safety net in that project beneficiaries do not
‘put all their eggs in one basket’ and focus all their resources on one possibility/avenue of
success. If this is done, as with some of the project farms noted, beneficiaries are not able to
exit with dignity, and little to nothing can be done to salvage losses. This situation needs to
be avoided at all costs. Key interventions are required to encourage entrepreneurship
across the market chain, which includes training in business skills, backed by innovative
partnerships for investment and credit access, mechanisms for risk management, and
leveraging the collective power of marketing and producer groups, etc.
Greater partnership amongst support providers: Smaller farms are losing out prematurely to
larger commercial farms owing to economies of scale and because they face a tilted
playing field in accessing inputs, credit, technology, and markets. These problems are not
new, but have become more pronounced with market and trade liberalisation, and the
increasing integration of market chains, etc, hence the introduction of programmes such as
the CASP. If more of the land reform farms are to have a viable future, then there is need for
a concerted effort by governments, NGOs, the private sector and donors to create a more
equitable and enabling economic environment for their development. Private financial
institutions, NGOs, relief agencies, and community and producer organisations have
emerged as important players in supporting land reform farms. The department needs to
play a pivotal role in ensuring that these agencies work together in a coordinated way so
that project farms being supported do not fall between the cracks and receive the support
they need to operate as successful farmers. First, greater clarity is needed on the different
agencies operating in the Western Cape, followed by the relevant roles of these agencies,
and how they might work more effectively together. Essentially, returns to government,
private sector and donor investments in agriculture can be significantly improved by
focusing much more attention on better coordination and management to ensure that
inputs, including credit, and marketed outputs, get to the right place at the right time ‒ a

20 | P a g e
situation that is much more the exception than the norm in most development projects.
Governments and donors need to invest in strengthening the local private sector (eg agro
dealer networks, traders and processors) and in supporting financial institutions so that they
can take more risk in lending to farmers. Innovative approaches such as credit guarantees,
smart subsidies, index insurance and public-private partnerships seem promising.
Greater focus on environmental sustainable patterns of production: Production needs to be
raised through access to better technologies and management practices, while at the
same time achieving more environmentally sustainable patterns of production. Many of the
farms are battling to provide a viable livelihood, and smallness in combination with poverty
can, over time, cause downward spirals of worsening environmental degradation, causing
farmland to be derelict. There is thus urgent need for the kinds of sustainable intensification
that significantly raise land and labour productivity while reversing environmental
degradation. This will require the best of modern science and indigenous knowledge. This
kind of knowledge intensive farming requires new approaches to research and extension, as
well as an enabling policy environment. Climate change is increasing the urgency of this
kind of farming.
Monitoring progress of projects and that of FSD officers and other support service providers:
A dynamic outcome-based project success-monitoring tool is required to collect project
performance information against outcome indicators. It is suggested that the project
success rating system could be used. Regular collection of project performance information
can be inexpensively rolled -out by the FSD officers. The project data obtained for each
project should be investigated in detail and the FSD officers need to be informed of the
priority actions that are needed to improve success of each project, especially as a first
priority for those projects that have been classified as being challenged. However, not only
should project performance be better monitored, but so too should FSD officers and other
support service providers. Greater active involvement of officers and monitoring not only of
the quantity but also of the quality of support are required. Setting targets is necessary to
enable earlier identification of whether project farms are on an upward/downward
trajectory. The department should consider incentivising FSD officers to achieve project
success. The department could also consider developing a farmer support referral and
tracking system to enable joint tracking and monitoring of both departmental and non-
departmental support (financial and non-financial) to farmers. This will assist in monitoring
progress of support, enabling measuring the impact of the support on the project farmers,
ensure that support providers are not merely ‘shooting blanks’, and hence enable reporting
on success stories and lessons learnt. Lastly, this will ensure that overconcentration of support
to limited number of project farms does not occur and that cross-referrals can be
undertaken to ensure that all potential support services are made available to a particular
project farm.
Lastly, the department needs to develop exit strategies for the cessation of support both for
existing projects that can be classified as being able to succeed on their own with no further
support and for project farms that have failed to such an extent that continued support from the
department is no longer justified. Concerning termination of support of failed projects, the
department needs to ensure that all avenues of support have been examined and, as far as
possible, that beneficiaries are able to exit without personal cost. If project farms to be
supported are identified through agricultural economists, better monitored over time, etc, as
suggested above, the likelihood of project farms failing will be minimised.

21 | P a g e
A combination of these aspects points to the need for the department to terminate is support to
a project farm:
Internal conflict between beneficiaries with negative impact
Workers not registered for UIF and no minimum wage compliance
Beneficiaries unsatisfied (within reason) with available money
Company not yet registered, no bank account, not VAT and tax registered
Business plan not in place
A large share of the beneficiaries have no agriculture experience
Financial and non-financial support avenues have been exhausted, yet financial and non-
financial support is not sufficient
Misappropriation of financial and non-financial support
Equipment and machinery for production not maintained to levels for sufficient production
Lack of financial management and record-keeping system
Non-productive for three consecutive years
No market access for more than 75% of produce for three consecutive years
No market access contracts
Negative income and expenditure balance for three consecutive years
Cash flow insufficient for three consecutive years
No profits for five consecutive years
Not capable of servicing debts (if any)
Not able to reinvest finances in the farm/project
Some of the aspects that need to be considered to enable the department to exit with
confidence in the knowledge that the project farm should be able to continue on the path of
success include:
Good working relation between beneficiaries with positive impact
Workers registered for UIF and minimum wage compliance
Beneficiaries satisfied (within reason) with available money
Registered company, bank account, VAT and tax registered
Business plan in place
Large share of the beneficiaries have agriculture experience
Sufficient financial and non-financial support obtained
Sufficient of equipment and machinery for production
Sound financial management and record-keeping system in place
Three years’ consecutive market access for more than 75% of produce
Market access contracts in place for at least half of produce
Three years’ consecutive positive (and growing if possible) production records
Three years’ consecutive positive income and expenditure (and growth)
Three years’ consecutive sufficient cash flow
Profitable for three consecutive years (and growth)
Dividends paid out for three consecutive years
Capable of servicing debts (if any)
Ability to reinvest finances in the farm/project
Of course, project farms that do not have many of these aspects in place require continued
support. Essentially, it needs to be ensured that project farms have a sustainable business model
and that their business is expanding slowly over time. Three years’ consecutive success and
sustainability need to ensured, which essentially entails ascertaining that inputs and costs such as
monetary, health, environmental expenses are less than the benefits. The project farms need to
work on the premise that they should not get any bigger until they cannot get any better, and
of course the project farms should not grow more than they can sell.

22 | P a g e
The department, through CASP and Ilima-Letsema, has recognised that the private sector
cannot do it all, and through its involvement is bridging the gap in areas that market actors are
not covering, as in research, extension services, natural resource management, and the
availability of finance targeted to the diverse characteristics of the smallholder and commercial
land reform projects. Competent mentors, FSD advisors, commodity support, etc, have enabled
that more than 60% of the land reform project farms are classified as successful. Most importantly
though is that without the support of CASP and Ilima-Letsema, the current success rate and
hope for land reform projects would be dire. So many solutions to problems faced by the project
farms have their roots in the support obtained from CASP and Ilima-Letsema, so much so that it is
a determining factor for success. The more successful the project farms, the higher the rating of
good or very good for sufficiency of financial support, training courses, mentor, FSD advice,
market access support, etc.
In short, the expectations of the CASP and Ilima-Letsema have started bearing fruit, and some of
the project farms have succeeded not only in developing an economic performance that
matches expectations, but have also helped to alleviate poverty, created job, and improved
livelihoods of beneficiaries. The challenge now is to help more of the project farms to follow a
more business-oriented growth approach to reap the rewards from investments and sow
enhanced contributions in increasing food supplies, promoting economic growth and rising
living standards, and indirectly benefiting a much wider range of rural and urban poor than just
the direct beneficiaries. Essentially, what is mostly needed is the scaling up of successful
experiences as noted from the evaluation of the successful project farms.

ANNEXURE 1: COMPREHENSIVE EVALUATION REPORT
See separate Comprehensive Evaluation report, available for viewing at the Department of
Agriculture.