Embed Size (px)
Citation preview

1
Systems Analysis Advisory Committee (SAAC)
Friday, November 22, 2002Michael Schilmoeller
John Fazio
Northwest Power Planning Council
2
Original Agenda
• Natural gas prices– Sumas, AECO, Rocky mountains– historical and monthly forwards and volatilities– correlations with other variables– subjective forwards
• Hydro generation– historical and monthly forwards and volatilities– correlations with other variables
Outcomes and Milestones

Northwest Power Planning Council
3
Revised Agenda
• Approval of the Oct 24 meeting minutes• Review and questions from the last meeting
– Representation of dispatchable resources in the portfolio model
– Metrics
• Representations in the portfolio model– Price responsive demand– Renewables and conservation
• Hydro• Loads• Natural gas prices
Northwest Power Planning Council
4
Revised Agenda
• Approval of the Oct 24 meeting minutes• Review and questions from the last meeting
– Representation of dispatchable resources in the portfolio model
– Metrics
• Representations in the portfolio model– Price responsive demand– Renewables and conservation
• Hydro• Loads• Natural gas prices
Northwest Power Planning Council
5
Revised Agenda
• Approval of the Oct 24 meeting minutes• Review and questions from the last meeting
– Representation of dispatchable resources in the portfolio model
– Metrics
• Representations in the portfolio model– Price responsive demand– Renewables and conservation
• Hydro• Loads• Natural gas prices
Review
Northwest Power Planning Council
6
October 24 Agenda
• Metrics– Stakeholders– Risk measures– Timing
• Representations in the portfolio model– thermal generation– hydro generation– conservation and renewables– loads– contracts– reliability– ** Plan Issues **
Review
Northwest Power Planning Council
7
Revised October 24 Agenda
• Approval of the Oct 4 meeting minutes• Price Processes• Representations in the portfolio model
– thermal generation
• Metrics– Stakeholders– Risk measures– Timing
• Representations in the portfolio model– ** Plan Issues ** : price responsive demand
Review

Northwest Power Planning Council
8
Plan Issues
• incentives for generation capacity• price responsiveness of demand• sustained investment in efficiency• information for markets• fish operations and power• transmission and reliability• resource diversity• role of BPA• global change
Review

Northwest Power Planning Council
9
Representation of dispatchables
• Main Conclusions– Option calculation of capacity factor and plant value over the
month should be identical with hourly dispatch result when prices are lognormally distributed. Consequently,
– Option model should give a reasonable representation of dispatchable plant performance and value
– Volatility in the option model represents both variation within the month and uncertainty
– Where uncertainty dominates, temporal variation become unimportant
Review
Northwest Power Planning Council
10
Review of Results
• Examine gas and power prices from 1999• How good is the lognormal assumption?• Comparison of option model with hourly dispatch
against lognormally distributed prices• Comparison of option model and hourly dispatch of
actual dispatch for Beaver in 1999• Impact of future uncertainty on capacity factor and
value of Beaver
Review

Northwest Power Planning Council
11
Price Duration Curve
• If we assume each hour’s dispatch is independent, we can ignore the chronological structure. Sorting by price yields the market price duration curve (MCD)
0
5
10
15
20
25
30
35
40
1 25 49 73 97 121
145
169
193
217
241
265
289
313
337
361
385
409
433
457
481
505
529
553
577
601
625
649
Hour
Mar
ket
Pri
ce $
/MW
h
0.00
5.00
10.00
15.00
20.00
25.00
30.00
35.00
40.00
Count of Hours
$/M
Wh
Value V is this area
operatorn expectatio theis (672) period in the hours ofnumber theis
where])()(,0[max
or
)()(,0max
)()(,0max
EN
hphpECNV
N
hphpCN
hphpCV
H
geH
H
Hhge
H
Hhge
Review
Northwest Power Planning Council
12
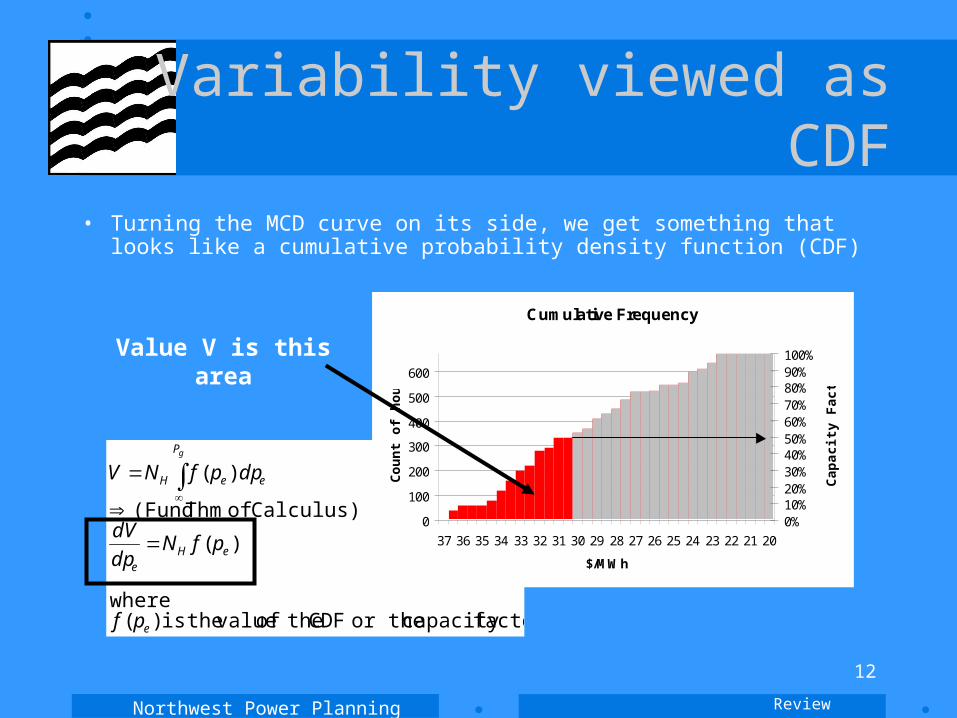
Variability viewed as CDF
• Turning the MCD curve on its side, we get something that looks like a cumulative probability density function (CDF)
Value V is this area
factorcapacity or the CDF theof value theis )(where
)(
Calculus) of Thm (Fund
)(
e
eHe
e
P
eH
pf
pfNdp
dV
dppfNVg
Cumulative Frequency
0
100
200
300
400
500
600
37 36 35 34 33 32 31 30 29 28 27 26 25 24 23 22 21 20
$/MWh
Co
un
t o
f h
ou
rs
0%10%20%30%40%50%60%70%80%90%100%
Cap
acit
y F
acto
r
Review
Northwest Power Planning Council
13
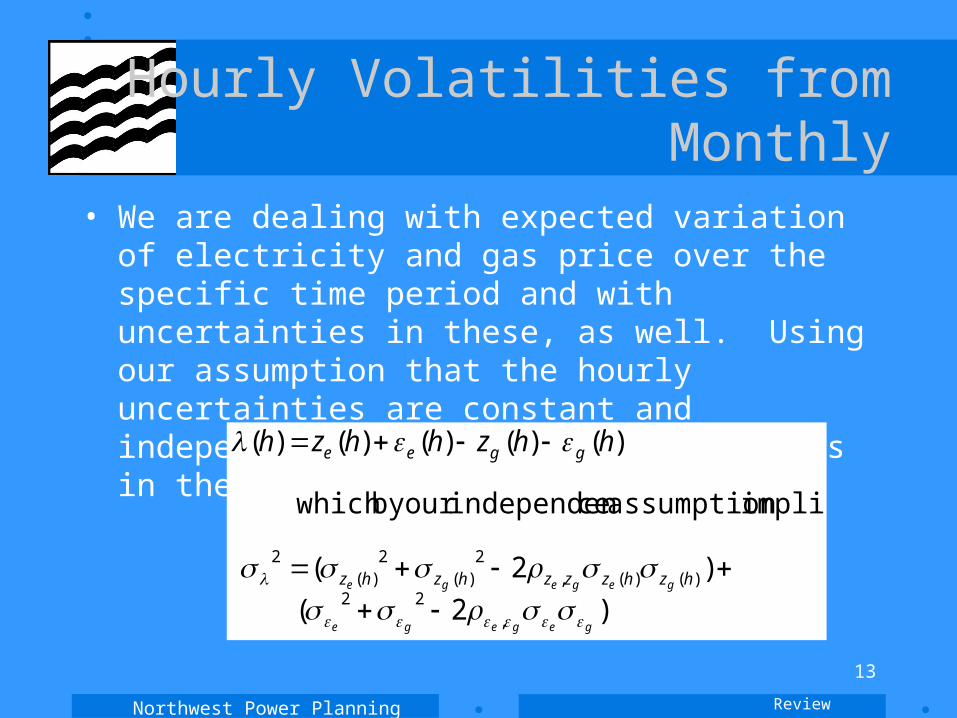
Hourly Volatilities from Monthly
• We are dealing with expected variation of electricity and gas price over the specific time period and with uncertainties in these, as well. Using our assumption that the hourly uncertainties are constant and independent of the temporal variations in the respective commodities,
)2(
)2(
implies assumption ceindependenour by which
)()()()()(
,22
)()(,2
)(2
)(2
gegege
gegege hzhzzzhzhz
ggee hhzhhzh
Review
Northwest Power Planning Council
14
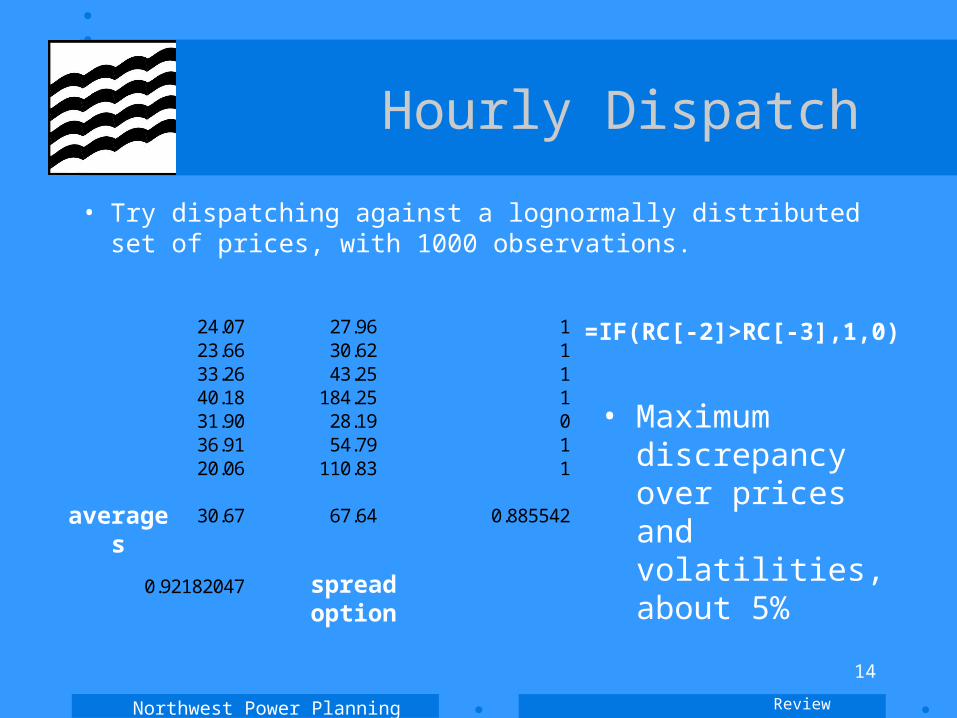
Hourly Dispatch
• Try dispatching against a lognormally distributed set of prices, with 1000 observations.
24.07 27.96 123.66 30.62 133.26 43.25 140.18 184.25 131.90 28.19 036.91 54.79 120.06 110.83 1
30.67 67.64 0.885542
0.92182047
=IF(RC[-2]>RC[-3],1,0)
• Maximum discrepancy over prices and volatilities, about 5%
averages
spread option
Review
Northwest Power Planning Council
15
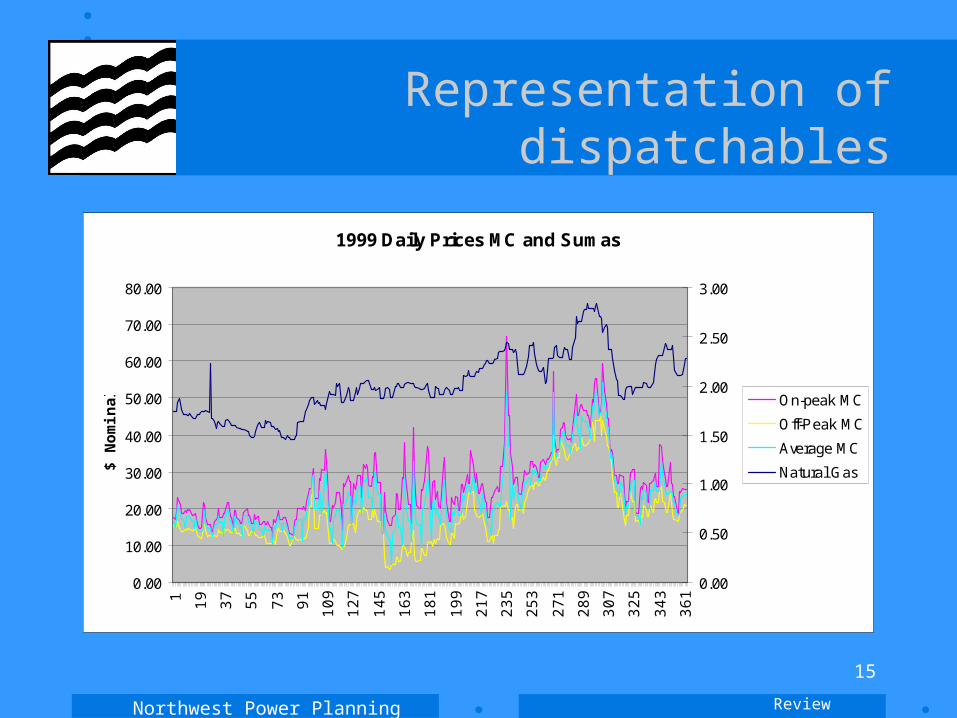
Representation of dispatchables
1999 Daily Prices MC and Sumas
0.00
10.00
20.00
30.00
40.00
50.00
60.00
70.00
80.00
1 19 37 55 73 91 109
127
145
163
181
199
217
235
253
271
289
307
325
343
361
$ N
om
inal
0.00
0.50
1.00
1.50
2.00
2.50
3.00
On-peak MC
Off-Peak MC
Average MC
Natural Gas
Review

Northwest Power Planning Council
16
Representation of dispatchables
0
1
2
3
4
5
1 35 69 103
137
171
205
239
273
307
341
Days
ln(n
om
inal
pri
ce-$
)
Natural Gas
On-Peak MC
Off-PeakMCAverage MC
Review

Northwest Power Planning Council
17
Representation of dispatchables
Average (Flat) MC
0
10
20
30
40
50
60
1 3 5 7 9
11 13
15
17
19
ln(p
ric
e)
0
5
10
15
20
Review
Northwest Power Planning Council
18
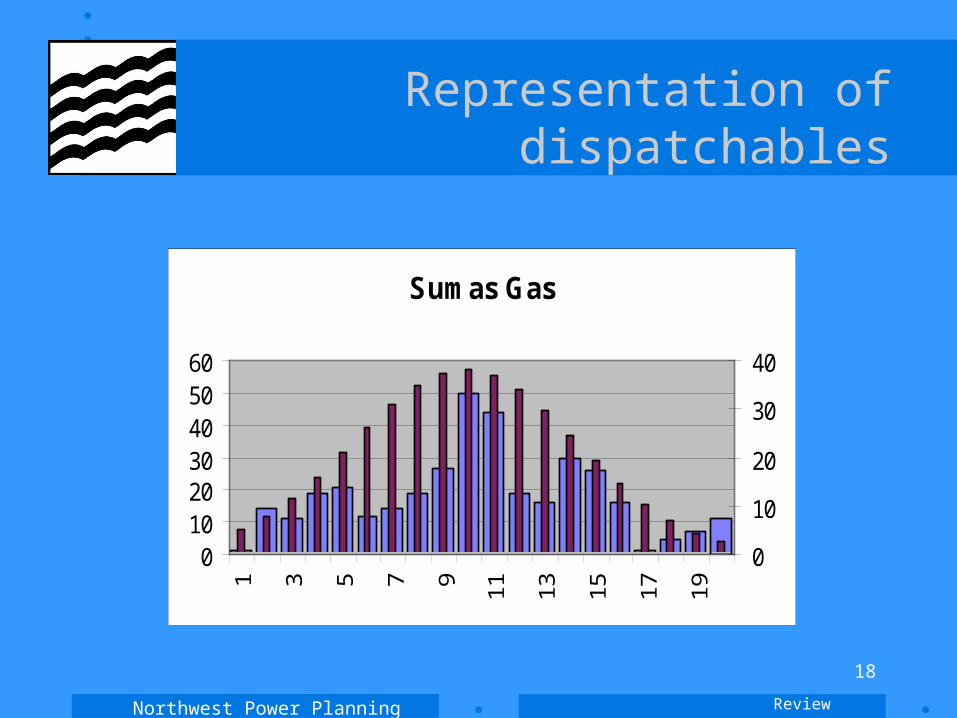
Representation of dispatchables
Sumas Gas
0102030405060
1 3 5 7 9 11 13 15 17 19
0
10
20
30
40
Review
Northwest Power Planning Council
19
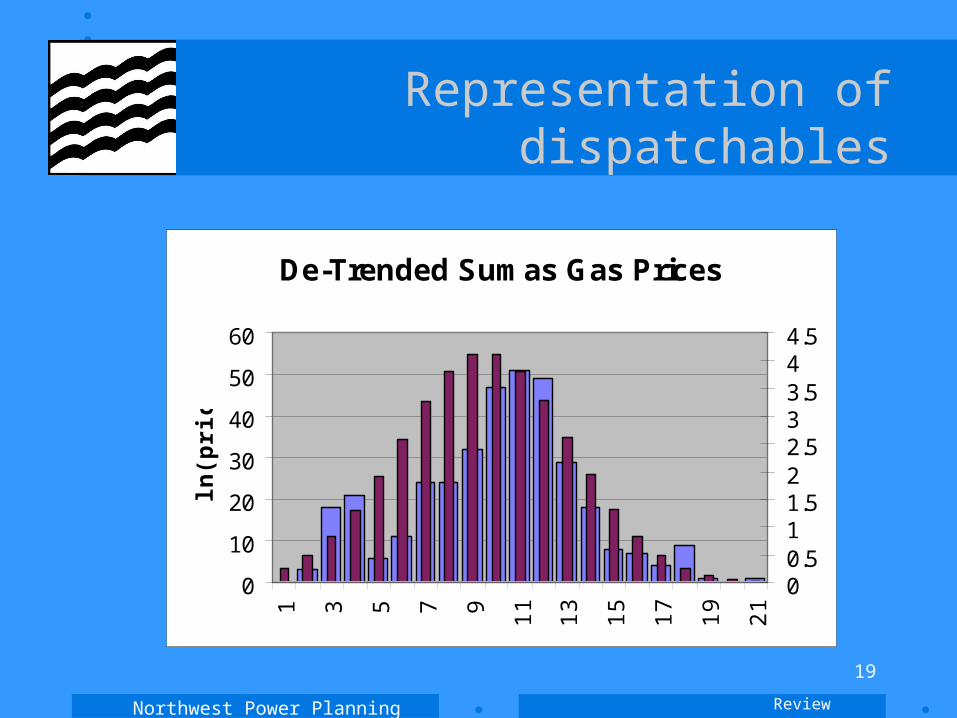
Representation of dispatchables
De-Trended Sumas Gas Prices
0
10
20
30
40
50
60
1 3 5 7 9
11 13
15
17
19
21
ln(p
ric
e)
00.511.522.533.544.5
Review

Northwest Power Planning Council
20
Representation of dispatchables
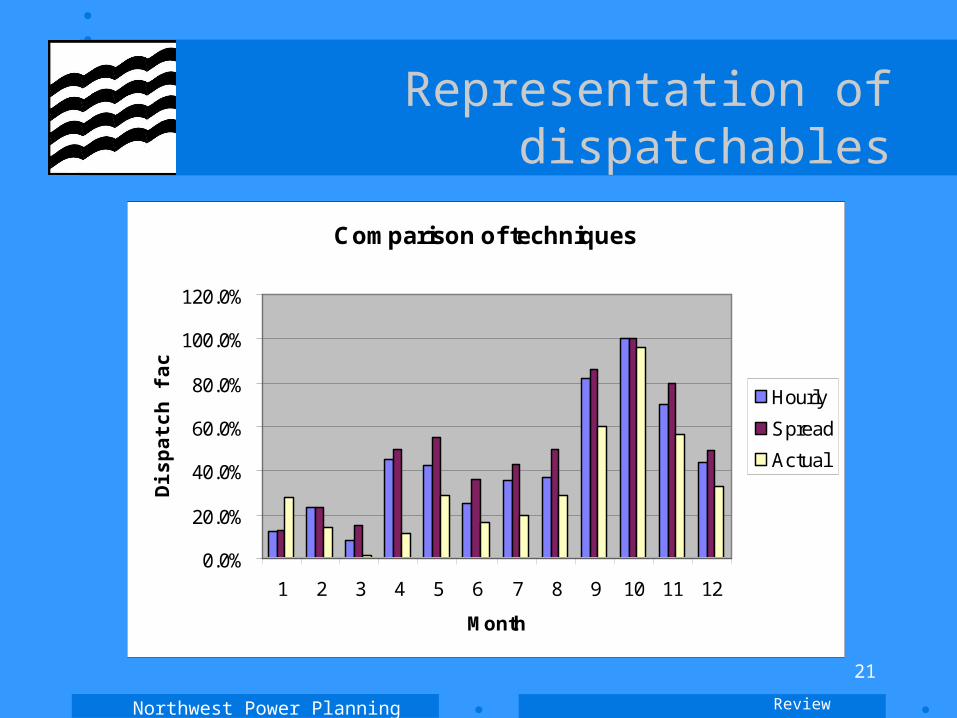
• Beaver– 9000 BTU/kWh– $4.00/MWh for VOM, variable fuel transportation– Did not incorporate forced outage estimate,
maintenance– Assumed 500MW capacity– “Hourly” dispatch was on daily on- and off-peak
only (would understate volatility)
Review
Northwest Power Planning Council
21
Representation of dispatchables
Comparison of techniques
0.0%
20.0%
40.0%
60.0%
80.0%
100.0%
120.0%
1 2 3 4 5 6 7 8 9 10 11 12
Month
Dis
pat
ch f
acto
r
Hourly
Spread
Actual
Review
Northwest Power Planning Council
22
Representation of dispatchables
• To show: The main driver of value is not expected variation in price, it is uncertainty
• What is the 1 sigma in daily (hourly?) electricity and gas prices over the next several years?
Review
Northwest Power Planning Council
23
0
5
10
15
20
25
30
35
1990 1995 2000 2005 2010 2015 2020
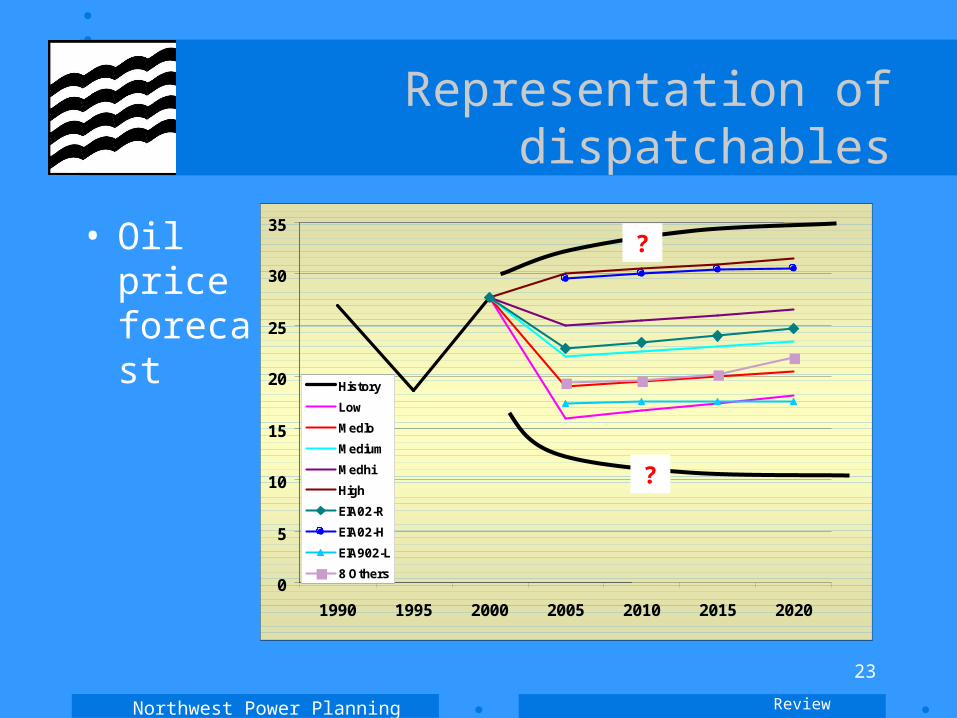
History
Low
Medlo
Medium
Medhi
High
EIA02-R
EIA02-H
EIA902-L
8 Others
Representation of dispatchables
• Oil price forecast
?
?
Review

Northwest Power Planning Council
24
Representation of dispatchables
• NG price forecast
0
0.5
1
1.5
2
2.5
3
3.5
4
4.5
1995 2000 2005 2010 2015 2020 2025
20
00
$/M
MB
tu
History
Low
Medlo
Medium
Medhi
High
EIA-Ref
EIA-Low
EIA-High
DRI-WEFA
GRI
CEC
ICF
?
?
Review
Northwest Power Planning Council
25
Mid-Columbia price forecastAverage annual w/comparisons
$0
$5
$10
$15
$20
$25
$30
$35
$40
$45
$50
$55
2001 2002 2003 2004 2005 2006 2007 2008 2009 2010 2011 2012 2013 2014 2015 2016 2017 2018 2019 2020
Pri
ce
(2
00
0$
/MW
h)
Current Trends Hi Shape (092702)
5th Plan corrected transfer (062402).
Adequacy & Reliability Study (Feb 2000)
?
?
Review
Northwest Power Planning Council
26
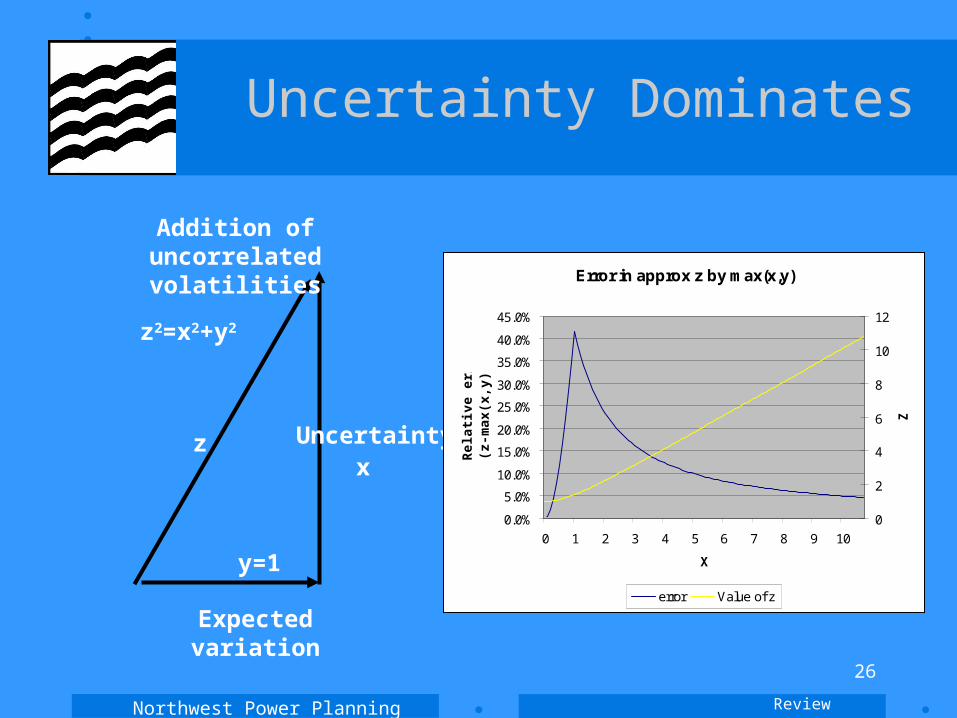
Uncertainty Dominates
Expected variation
Uncertainty
Addition of uncorrelated
volatilities
x
y=1
z2=x2+y2
z
Error in approx z by max(x,y)
0.0%
5.0%
10.0%
15.0%
20.0%
25.0%
30.0%
35.0%
40.0%
45.0%
0 1 2 3 4 5 6 7 8 9 10
X
Rel
ativ
e er
ror
(z-m
ax(x
,y))
/z
0
2
4
6
8
10
12
Z
error Value of z
Review
Northwest Power Planning Council
27
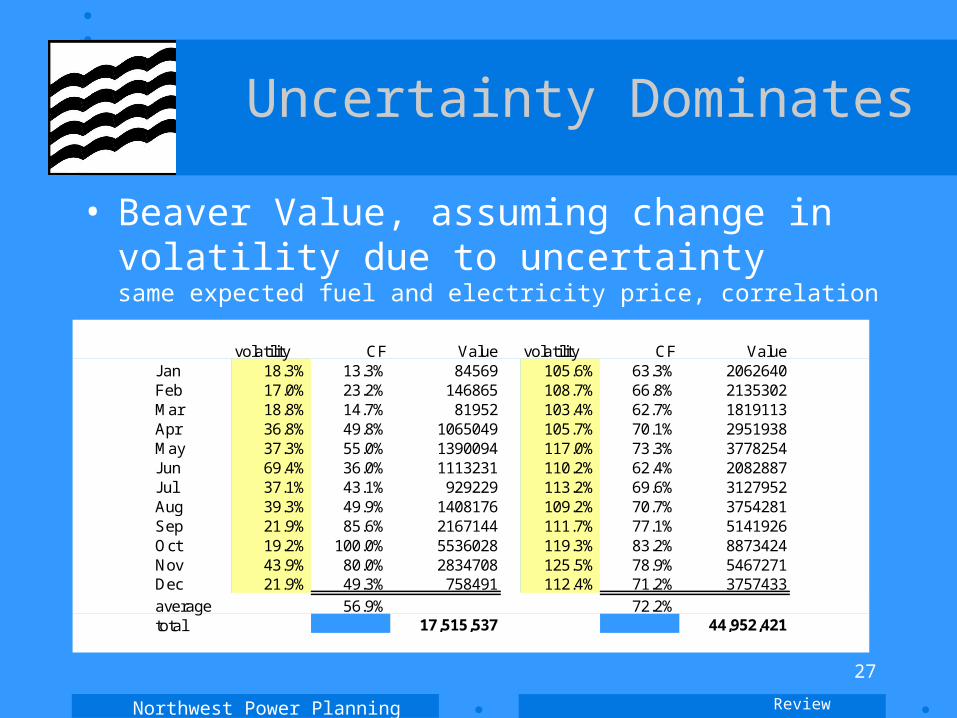
Uncertainty Dominates
• Beaver Value, assuming change in volatility due to uncertaintysame expected fuel and electricity price, correlation
volatility CF Value volatility CF ValueJan 18.3% 13.3% 84569 105.6% 63.3% 2062640Feb 17.0% 23.2% 146865 108.7% 66.8% 2135302Mar 18.8% 14.7% 81952 103.4% 62.7% 1819113Apr 36.8% 49.8% 1065049 105.7% 70.1% 2951938May 37.3% 55.0% 1390094 117.0% 73.3% 3778254Jun 69.4% 36.0% 1113231 110.2% 62.4% 2082887Jul 37.1% 43.1% 929229 113.2% 69.6% 3127952Aug 39.3% 49.9% 1408176 109.2% 70.7% 3754281Sep 21.9% 85.6% 2167144 111.7% 77.1% 5141926Oct 19.2% 100.0% 5536028 119.3% 83.2% 8873424Nov 43.9% 80.0% 2834708 125.5% 78.9% 5467271Dec 21.9% 49.3% 758491 112.4% 71.2% 3757433
average 56.9% 72.2%total 17,515,537 44,952,421
Review
Northwest Power Planning Council
28
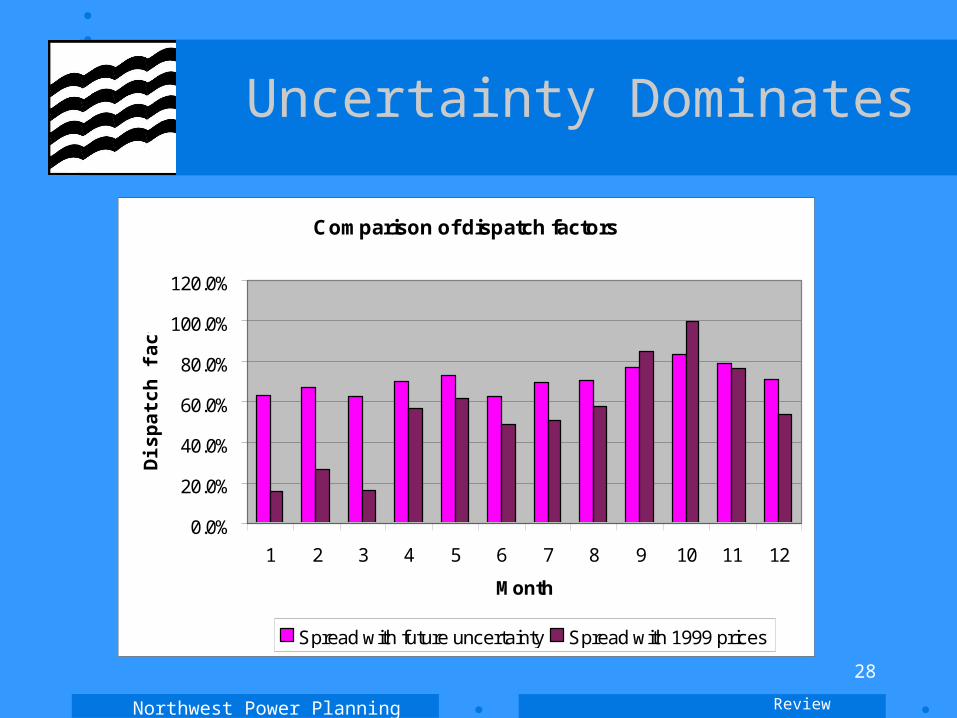
Uncertainty Dominates
Comparison of dispatch factors
0.0%
20.0%
40.0%
60.0%
80.0%
100.0%
120.0%
1 2 3 4 5 6 7 8 9 10 11 12
Month
Dis
pat
ch f
acto
r
Spread with future uncertainty Spread with 1999 prices
Review
Northwest Power Planning Council
29
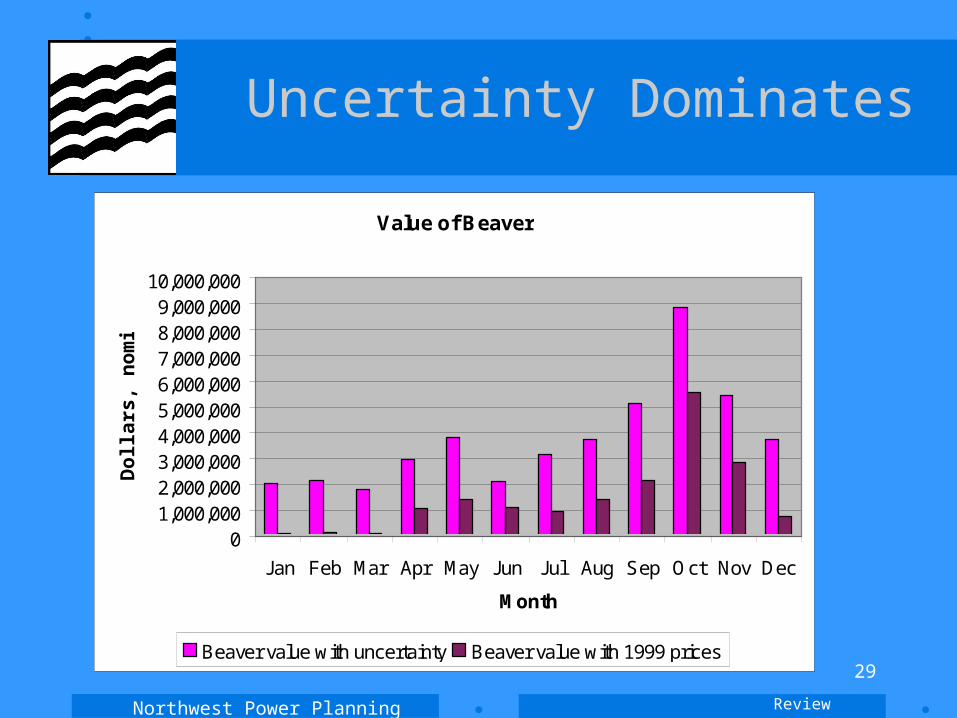
Uncertainty Dominates
Value of Beaver
01,000,0002,000,0003,000,0004,000,0005,000,0006,000,0007,000,0008,000,0009,000,000
10,000,000
Jan Feb Mar Apr May Jun Jul Aug Sep Oct Nov Dec
Month
Do
llars
, no
min
al
Beaver value with uncertainty Beaver value with 1999 prices
Review
Northwest Power Planning Council
30
European Call Option
0
2
4
6
8
10
12
20 21 22 23 24 25 26 27 28 29 30 31 32 33 34 35 36 37 38 39 40
Price of underlying
Val
ue
of
Op
tio
n (
$)
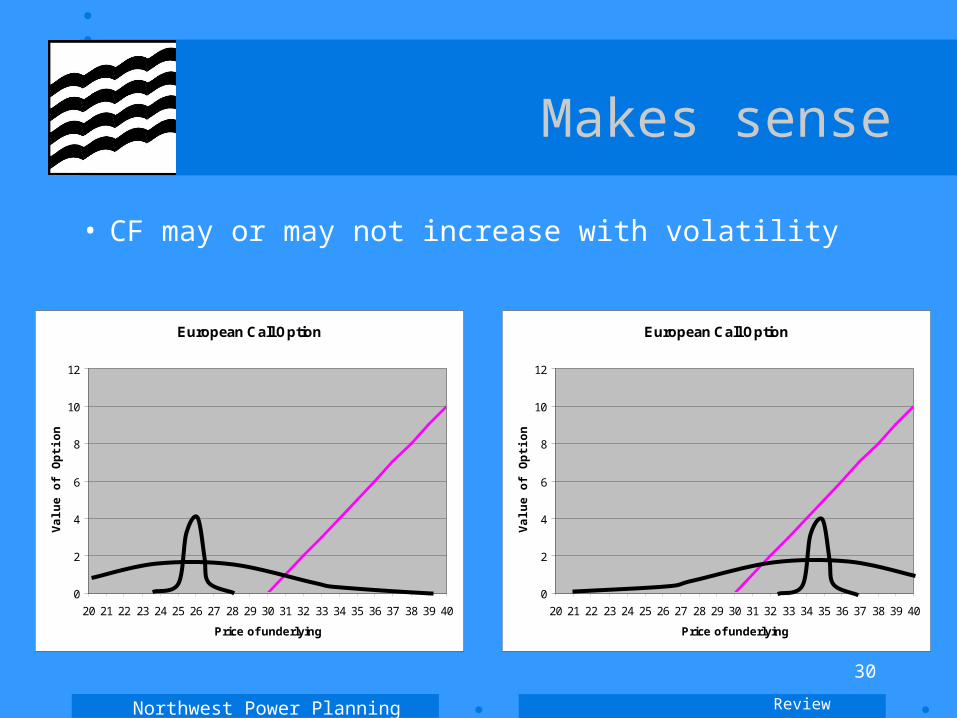
Makes sense
• CF may or may not increase with volatility
Review
European Call Option
0
2
4
6
8
10
12
20 21 22 23 24 25 26 27 28 29 30 31 32 33 34 35 36 37 38 39 40
Price of underlying
Val
ue
of
Op
tio
n (
$)

Northwest Power Planning Council
31
European Call Option
0
2
4
6
8
10
12
20 21 22 23 24 25 26 27 28 29 30 31 32 33 34 35 36 37 38 39 40
Price of underlying
Val
ue
of
Op
tio
n (
$)
Makes sense
• Value increases with volatility
Review
European Call Option
0
2
4
6
8
10
12
20 21 22 23 24 25 26 27 28 29 30 31 32 33 34 35 36 37 38 39 40
Price of underlying
Val
ue
of
Op
tio
n (
$)

Northwest Power Planning Council
32
Makes sense
• Value increases with volatility
Review
Cumulative FrequencySingle, fixed hour
0
0.2
0.4
0.6
0.8
1
40.00 38.00 36.00 34.00 32.00 30.00 28.00 26.00 24.00 22.00 20.00
$/MWhP
rob
of
pri
ce
e
xc
ee
din
g p
A
B
)),0(max(
,particularIn )(
so
1)(
But)()(
1)()()(
1
11
xxEA
BAxxE
BAn
xx
xxExxEn
xxXxPxx
i
i
n
ii
ii
n
ii
n
iii
Northwest Power Planning Council
33
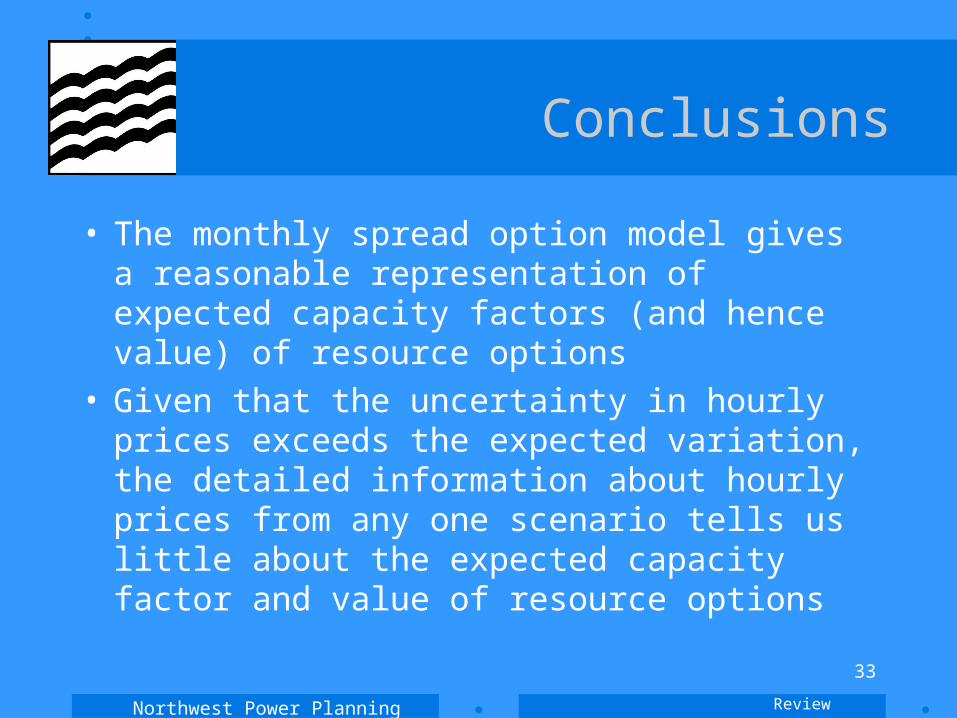
Conclusions
• The monthly spread option model gives a reasonable representation of expected capacity factors (and hence value) of resource options
• Given that the uncertainty in hourly prices exceeds the expected variation, the detailed information about hourly prices from any one scenario tells us little about the expected capacity factor and value of resource options
Review

Northwest Power Planning Council
34
Revised Agenda
• Approval of the Oct 24 meeting minutes• Review and questions from the last meeting
– Representation of dispatchable resources in the portfolio model
– Metrics
• Representations in the portfolio model– Price responsive demand– Renewables and conservation
• Hydro• Loads• Natural gas prices
Northwest Power Planning Council
35
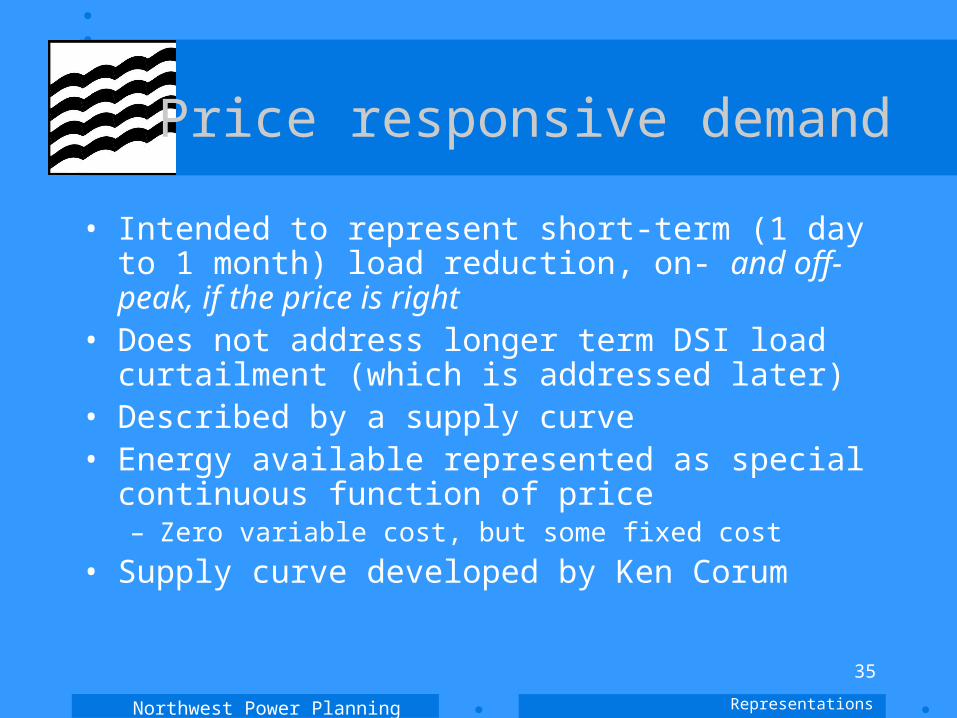
Price responsive demand
• Intended to represent short-term (1 day to 1 month) load reduction, on- and off-peak, if the price is right
• Does not address longer term DSI load curtailment (which is addressed later)
• Described by a supply curve• Energy available represented as special continuous
function of price– Zero variable cost, but some fixed cost
• Supply curve developed by Ken Corum
Representations
Northwest Power Planning Council
36
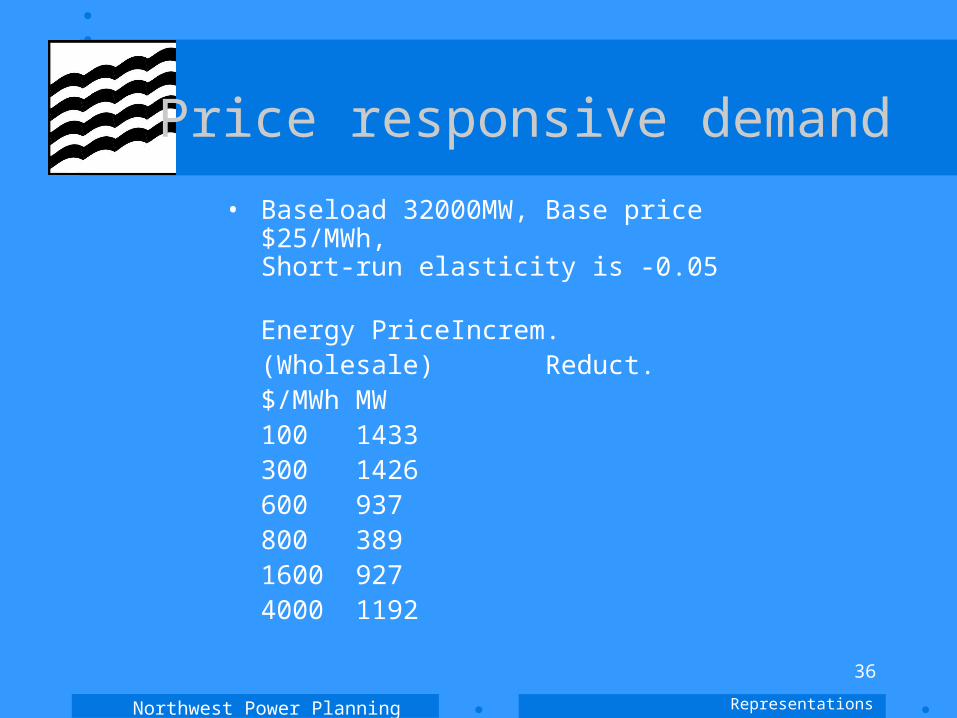
Price responsive demand
• Baseload 32000MW, Base price $25/MWh, Short-run elasticity is -0.05
Energy Price Increm.(Wholesale) Reduct.$/MWh MW100 1433300 1426600 937800 3891600 9274000 1192
Representations

Northwest Power Planning Council
37
Price responsive demand
• Side observation: Much of the value of PRD is driven by peak prices. The price of electricity in the portfolio model is subjective, but so are curtailment block prices in our other models. At right, the value of PRD is determined by those prices, the marginal costs in hour segments A and B.
Curtailment block 2
Curtailment block 1Peaker 3
Peaker 2Peaker 1
Price responsive demand
CCCT 2
CCCT 1
Coal 2
Coal 1
HydroHours
Load Curve
A B C D E F
Stack Model
Representations
Northwest Power Planning Council
38
Conservation & Renewables
• Represent as non-dispatchable energy• Supply curve for conservation developed by
Tom Eckman• Renewables cost and operating
characteristics assembled by Jeff King
Representations
Northwest Power Planning Council
39
C&R Weaknesses
• Lack of short term operating flexibility– If market prices fall below the dispatch cost of a
traditional resource, the unavoidable cost of a dispatchable resource is limited to fixed cost (typically 10% to 30% of total cost); Conservation and renewables’ costs are largely capital and unavoidable
– Makes C&R less attractive when resource portfolio capacity exceeds loads
• Some financial risks– Conservation and renewables have higher up-front cost.
If resource disappears (failure, technological obsolescence,…), the owner stands to lose more.
Representations
Northwest Power Planning Council
40
C&R Strengths
• “Real option” (modularity) value– C&R can be added incrementally and with a
shorter lead time than conventional resources.
• Fuel Price risk mitigation• Emission cost risk mitigation• Conservation may have lower availability
risk• Conservation may have lower credit risk
than fixed price forward contracts.
Representations

Northwest Power Planning Council
41
NPPC Analysis
• Credit and availability advantages can be valued by adding these uncertainties to alternatives, such as contracts
• Modularity benefits require a new approach
• Example of Sustained Orderly Development (SOD)
Representations
Northwest Power Planning Council
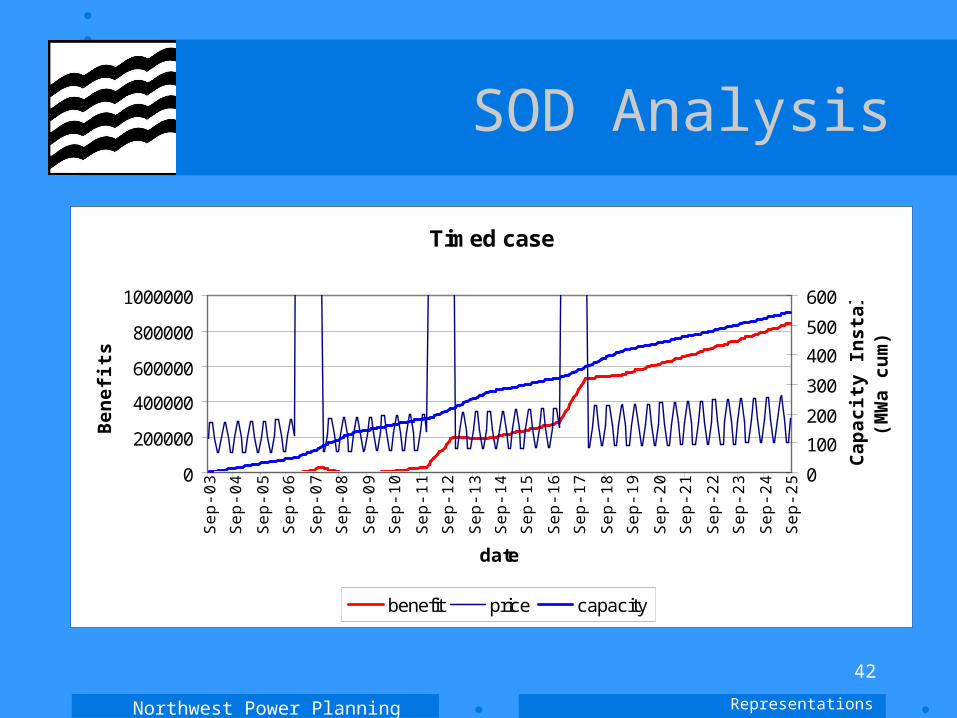
42
SOD Analysis
Timed case
0
200000
400000
600000
800000
1000000
Sep
-03
Sep
-04
Sep
-05
Sep
-06
Sep
-07
Sep
-08
Sep
-09
Sep
-10
Sep
-11
Sep
-12
Sep
-13
Sep
-14
Sep
-15
Sep
-16
Sep
-17
Sep
-18
Sep
-19
Sep
-20
Sep
-21
Sep
-22
Sep
-23
Sep
-24
Sep
-25
date
Ben
efit
s ($
)
0
100
200
300
400
500
600
Cap
acit
y In
stal
led
(M
Wa
cum
)
benefit price capacity
Representations
Northwest Power Planning Council
43
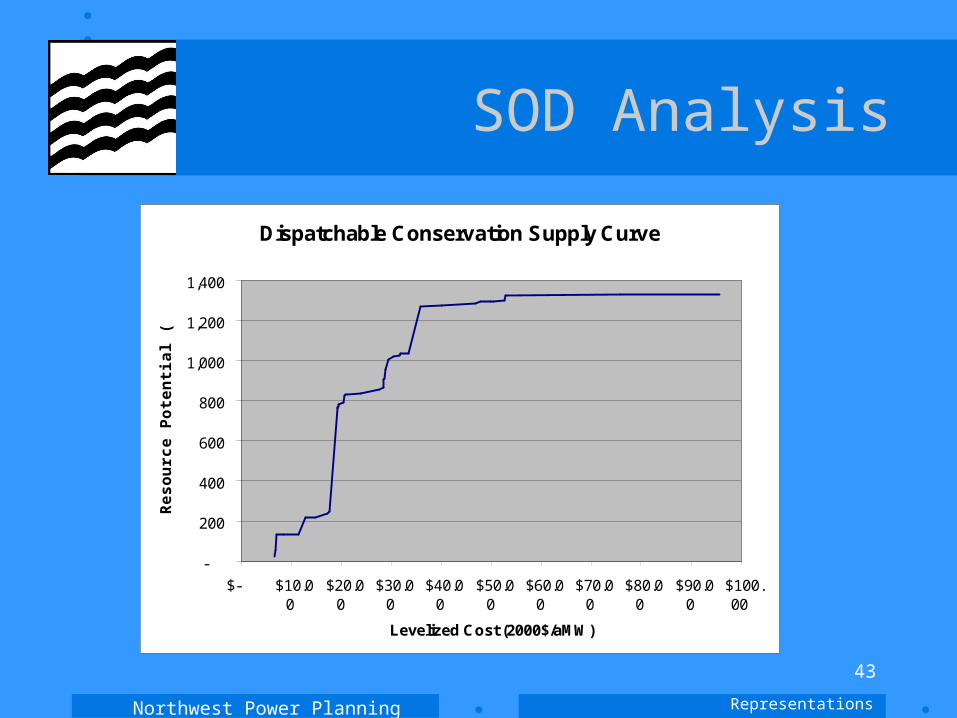
SOD Analysis
Dispatchable Conservation Supply Curve
-
200
400
600
800
1,000
1,200
1,400
$- $10.00
$20.00
$30.00
$40.00
$50.00
$60.00
$70.00
$80.00
$90.00
$100.00
Levelized Cost (2000$/aMW)
Re
so
urc
e P
ote
nti
al (
aM
W)
Representations
Northwest Power Planning Council
44
SOD Analysis
• There is only a weak relationship between ramp rates (up or down) and utility conservation acquisition costs.
• Utility conservation acquisition costs ($/aMW) may lower when ramping up than when ramping down, due to:
– Outstanding contracts– “Lags” in personnel changes– Desire to maintain stable infrastructure
• Assumption –– Assume same cost/aMW during ramp down than ramp
up.
Representations

Northwest Power Planning Council
45
SOD Analysis
• Conservation has been ramped up and down within a range of +/- 10 aMW
• Assumption – Constrain ramp rate to “monthly availability” of each conservation cost block (e.g. maximum annual change = 12x monthly availability).
Representations
Northwest Power Planning Council
46
SOD Analysis
• Wholesale market prices will fluctuate as a result of:–Over/Under building–Extreme weather events (hot or cold)–Hydro-system availability–Short-run economic/business cycles
Assumption:“Randomize” the forecast of future “price spikes” in response to hydro-system availability, ignore “short-run” weather & business cycles
Representations
Northwest Power Planning Council
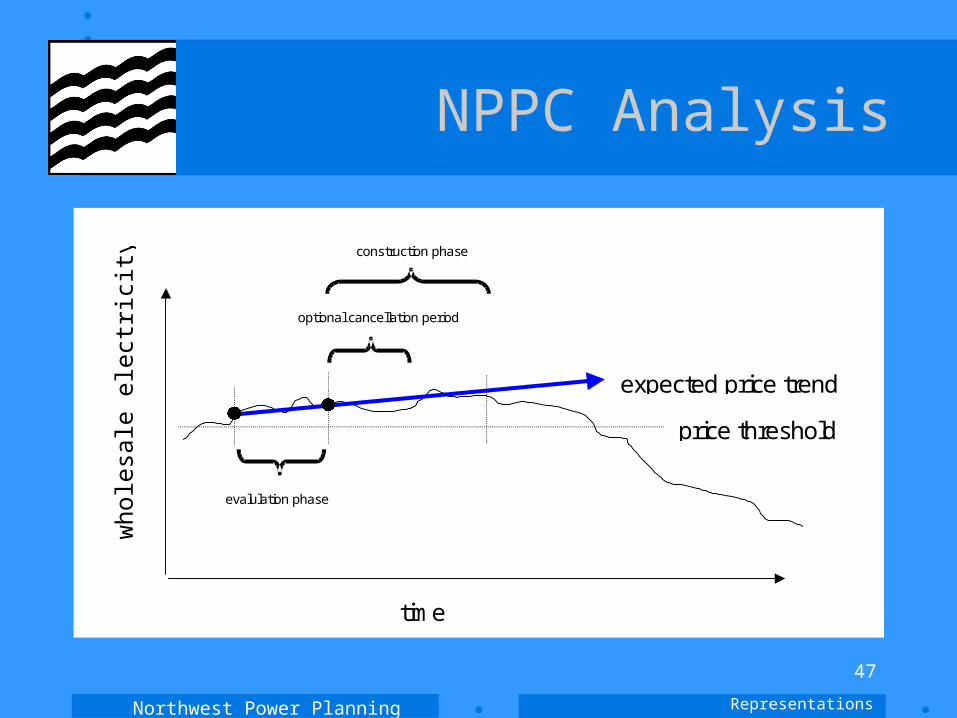
47
NPPC Analysis
construction phase
optional cancellation period
evalulation phase
time
wh
ole
sale
ele
ctri
city
ma
rke
t
price threshold
expected price trend
Representations
Northwest Power Planning Council
48
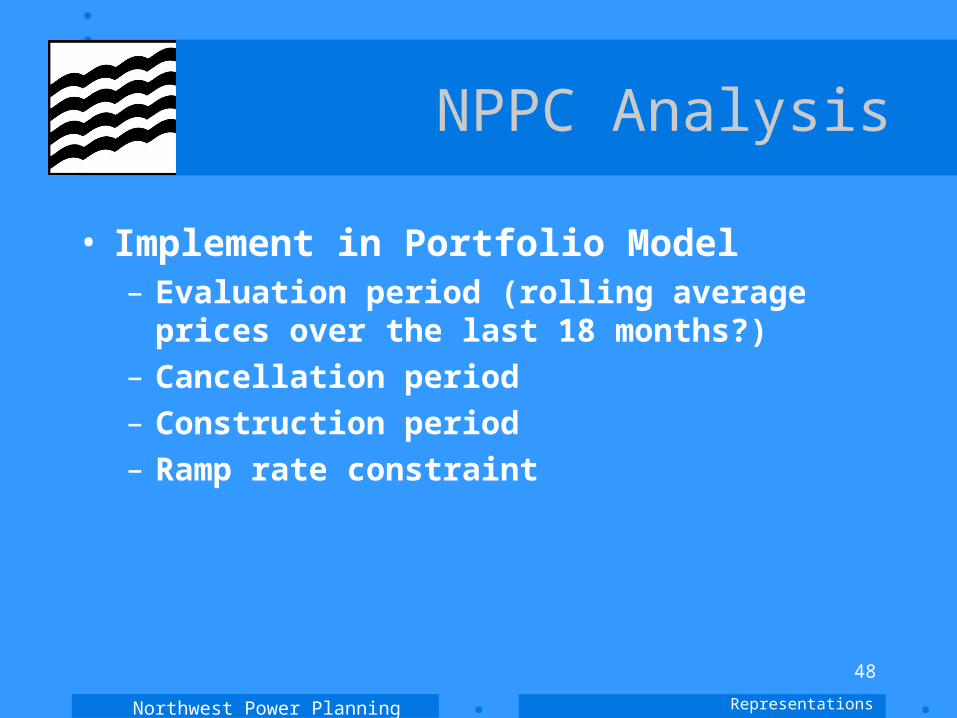
NPPC Analysis
• Implement in Portfolio Model– Evaluation period (rolling average prices
over the last 18 months?)– Cancellation period– Construction period– Ramp rate constraint
Representations
Northwest Power Planning Council
49
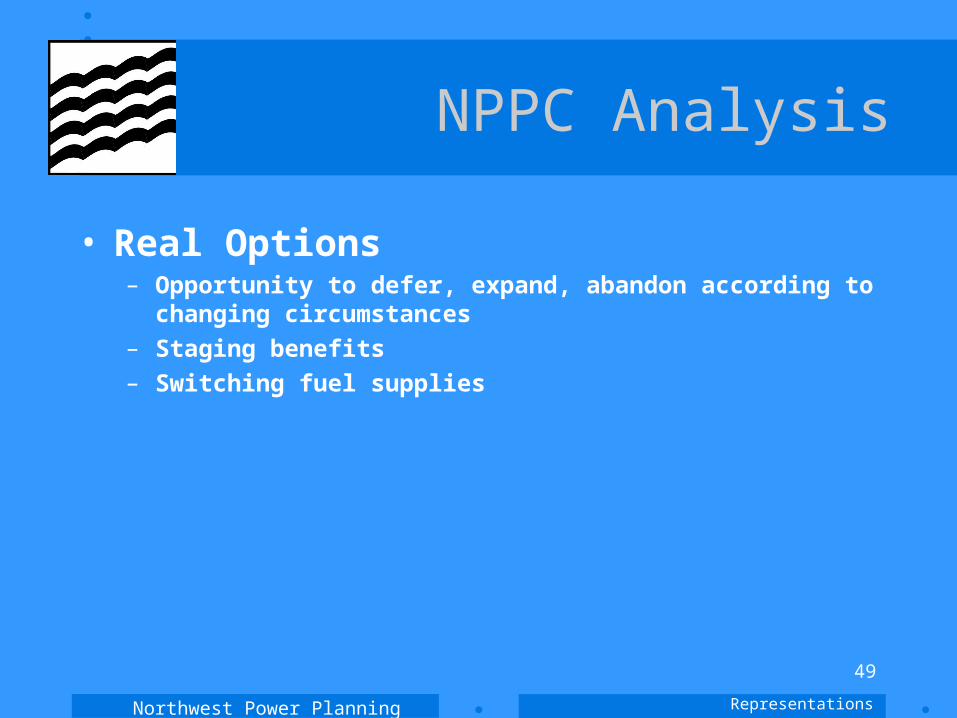
NPPC Analysis
• Real Options– Opportunity to defer, expand, abandon according to
changing circumstances– Staging benefits– Switching fuel supplies
Representations
Northwest Power Planning Council
50
NPPC Analysis
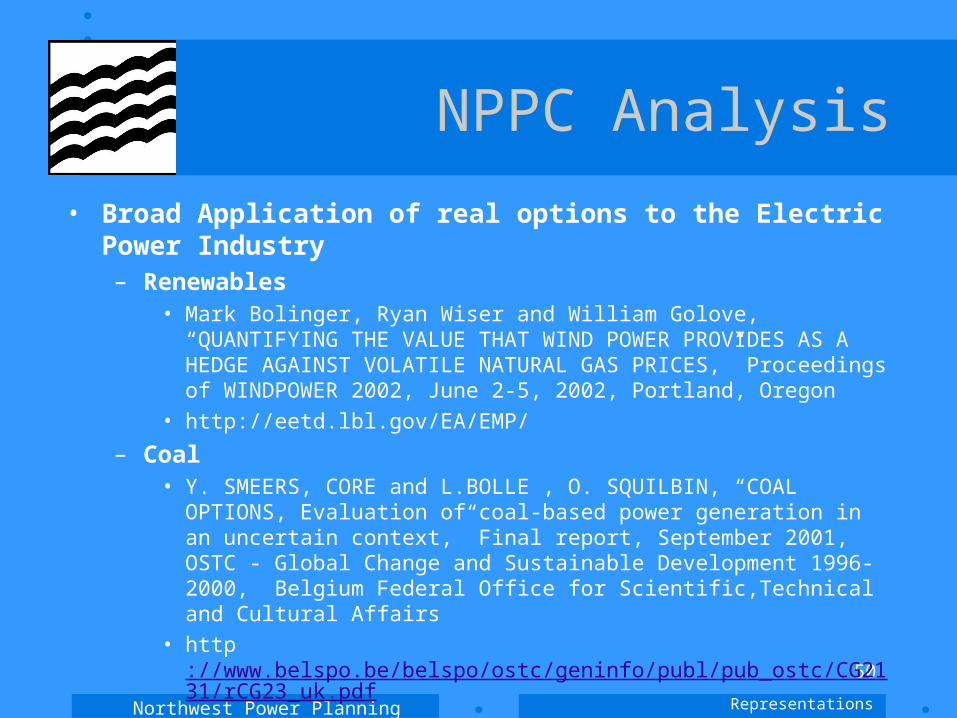
• Broad Application of real options to the Electric Power Industry– Renewables
• Mark Bolinger, Ryan Wiser and William Golove, “QUANTIFYING THE VALUE THAT WIND POWER PROVIDES AS A HEDGE AGAINST VOLATILE NATURAL GAS PRICES,” Proceedings of WINDPOWER 2002, June 2-5, 2002, Portland, Oregon
• http://eetd.lbl.gov/EA/EMP/
– Coal• Y. SMEERS, CORE and L.BOLLE , O. SQUILBIN, “COAL OPTIONS,
Evaluation of coal-based power generation in an uncertain context,” Final report, September 2001, OSTC - Global Change and Sustainable Development 1996-2000, Belgium Federal Office for Scientific,Technical and Cultural Affairs
• http://www.belspo.be/belspo/ostc/geninfo/publ/pub_ostc/CG2131/rCG23_uk.pdf
Representations

Northwest Power Planning Council
51
NPPC Analysis
• Broad Application of real options to the Electric Power Industry– R&D expenditures
• Graham A. Davis, Brandon Owens, “Optimizing the Level of Renewable Electric R&D Expenditures Using Real Options Analysis,” National Renewable Energy Laboratory,Golden, CO 80401 December 18, 2001
– Distribution Systems• Costing Methodology for Electric Distribution System Planning November 9, 2000
Prepared for: The Energy Foundation Prepared by: Energy & Environmental Economics, Inc. Karl E. Knapp, Jennifer Martin, Snuller Price, And Pacific Energy Associates Frederick M. Gordon
• http://www.energyfoundation.org/documents/CostMethod.pdf
Representations
Northwest Power Planning Council
52
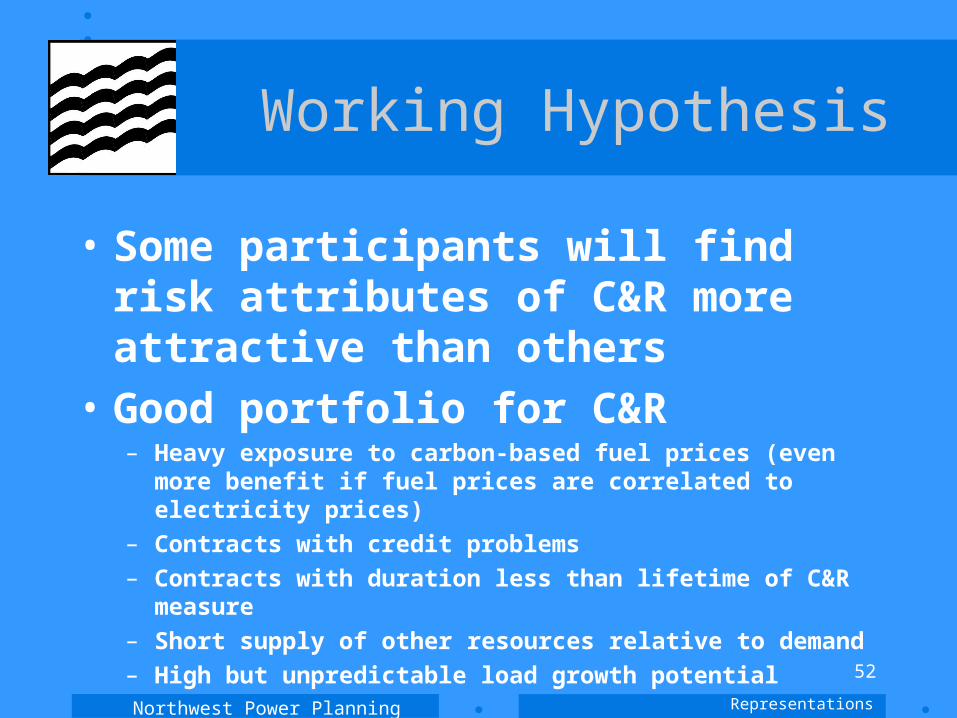
Working Hypothesis
• Some participants will find risk attributes of C&R more attractive than others
• Good portfolio for C&R– Heavy exposure to carbon-based fuel prices (even
more benefit if fuel prices are correlated to electricity prices)
– Contracts with credit problems– Contracts with duration less than lifetime of C&R
measure– Short supply of other resources relative to demand– High but unpredictable load growth potential
Representations

Northwest Power Planning Council
53
Working Hypothesis
• Some participants will find risk attributes of C&R more attractive than others
• Poor portfolios for C&R– Low exposure to carbon-based fuel prices, e.g., high-
quality forward contracts with terms comparable to lifetime of C&R measures
– Long supply of resources relative to demand• Made worse if portfolio has hydro generation and
market prices are negatively correlated with hydro generation
– Stagnant or decreasing loads expectedRepresentations

Northwest Power Planning Council
54
NPPC Analysis
• If C&R are beneficial from the standpoint of cost and risk, what is the best strategy to deploy?
• What is the value of SOD, and to which measures is SOD beneficially applicable?
• What are the technology-specific risk attributes for solar, wind, geothermal, biomass, low-head run-of-river hydro?
Representations

Northwest Power Planning Council
55
Revised Agenda
• Approval of the Oct 24 meeting minutes• Review and questions from the last meeting
– Representation of dispatchable resources in the portfolio model
– Metrics
• Representations in the portfolio model– Price responsive demand– Renewables and conservation
• Hydro• Loads• Natural gas prices
Northwest Power Planning Council
56
Hydrogeneration
• Excel Add-in has 50-year record
Demonstrate:– Parameters to pull out different data– Use as random draw & correlation with other
assumptions– Use of function to pull out specific year
• Reflects 10-hour sustained peaking capability from the trapazoidal approximation studies
Hydrogeneration
Northwest Power Planning Council
57
Hydrogeneration
Hydrogeneration
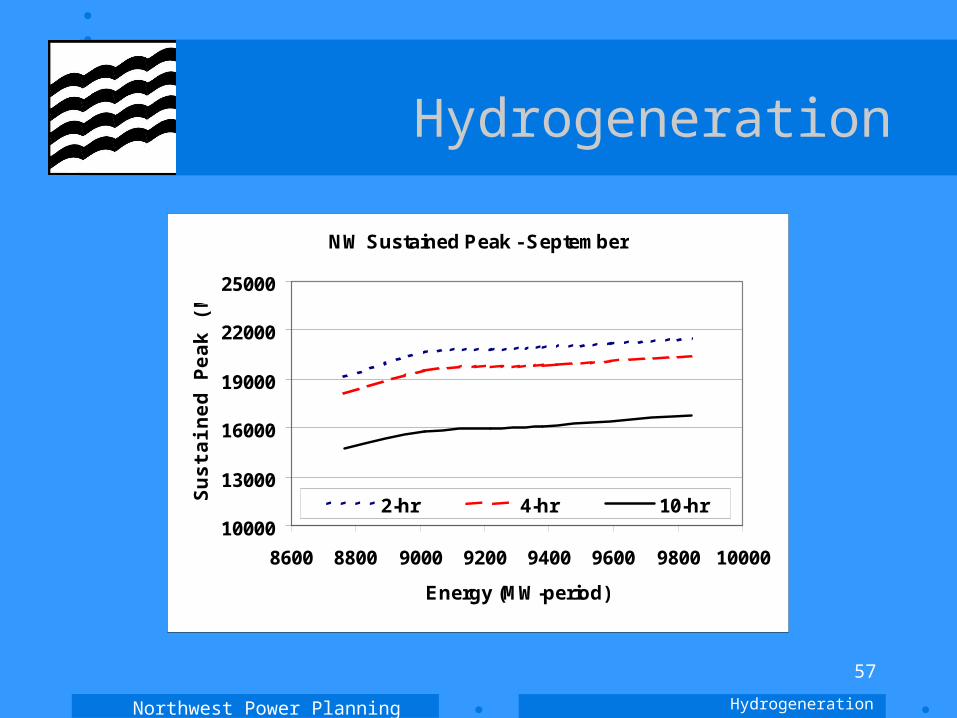
NW Sustained Peak - September
10000
13000
16000
19000
22000
25000
8600 8800 9000 9200 9400 9600 9800 10000
Energy (MW-period)
Su
sta
ine
d P
ea
k (
MW
)
2-hr 4-hr 10-hr
Northwest Power Planning Council
58
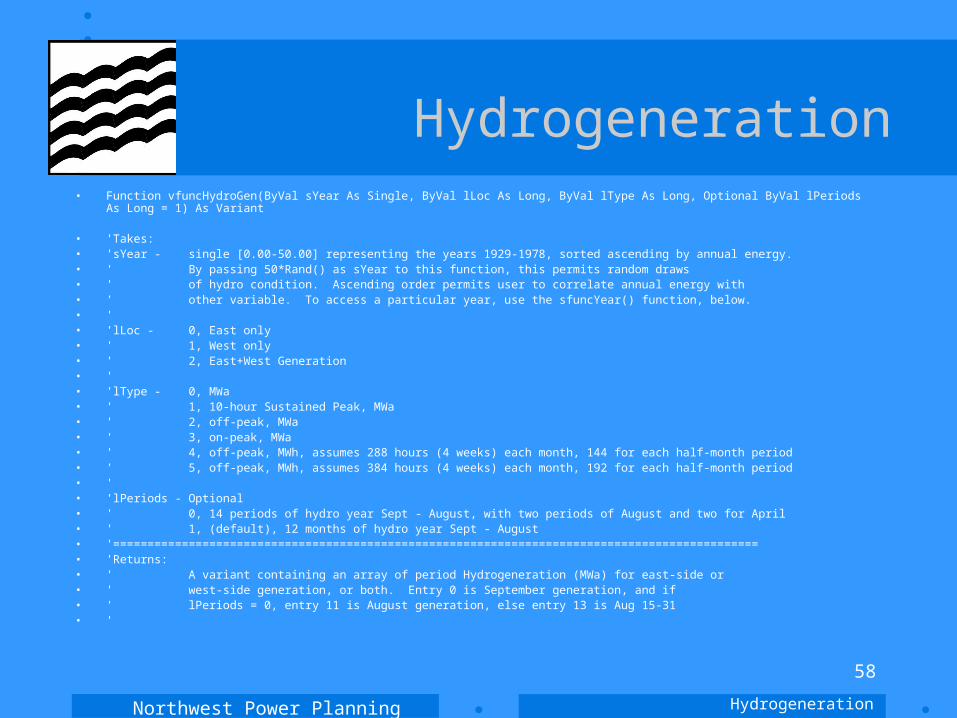
Hydrogeneration• Function vfuncHydroGen(ByVal sYear As Single, ByVal lLoc As Long, ByVal lType As Long, Optional ByVal lPeriods As Long = 1) As Variant
• 'Takes:• 'sYear - single [0.00-50.00] representing the years 1929-1978, sorted ascending by annual energy.• ' By passing 50*Rand() as sYear to this function, this permits random draws• ' of hydro condition. Ascending order permits user to correlate annual energy with• ' other variable. To access a particular year, use the sfuncYear() function, below.• '• 'lLoc - 0, East only• ' 1, West only• ' 2, East+West Generation• '• 'lType - 0, MWa• ' 1, 10-hour Sustained Peak, MWa• ' 2, off-peak, MWa• ' 3, on-peak, MWa• ' 4, off-peak, MWh, assumes 288 hours (4 weeks) each month, 144 for each half-month period• ' 5, off-peak, MWh, assumes 384 hours (4 weeks) each month, 192 for each half-month period• '• 'lPeriods - Optional• ' 0, 14 periods of hydro year Sept - August, with two periods of August and two for April• ' 1, (default), 12 months of hydro year Sept - August• '==============================================================================================• 'Returns:• ' A variant containing an array of period Hydrogeneration (MWa) for east-side or• ' west-side generation, or both. Entry 0 is September generation, and if• ' lPeriods = 0, entry 11 is August generation, else entry 13 is Aug 15-31• '
Hydrogeneration
Northwest Power Planning Council
59
Hydrogeneration
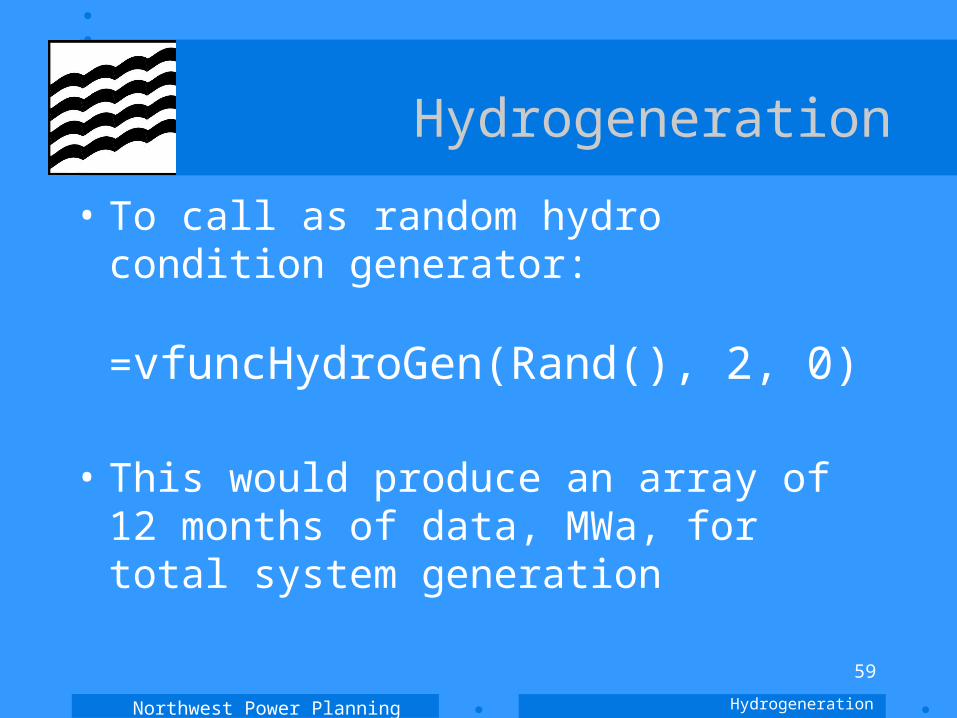
• To call as random hydro condition generator:
=vfuncHydroGen(Rand(), 2, 0)
• This would produce an array of 12 months of data, MWa, for total system generation
Hydrogeneration
Northwest Power Planning Council
60
Hydrogeneration
Hydrogeneration
• Function sfuncYear(ByVal lYear As Long, ByVal lType As Long) As Single
• 'Takes a calendar year, e.g., 1937, and returns a real single with a value in the
• 'middle of the correct "bin" for that year, for use as input to vfuncHydroGen.
• 'For example, 1937 is the second lowest year for Eastside Hydro, in terms of
• 'annual energy and is therefore the second entry in vfuncHydroGen(*,0). Then
• 'sfuncYear(1937,0) = 1.5 (The first bin is [0,1), the second is [1,2), etc.
• 'lType - 0, East Generation only
• ' 1, West Generation only
• ' 2, East+West Generation
Northwest Power Planning Council
61
Hydrogeneration
• Emphasize– 4-week convention for lType options
4 and 5 of vfuncHydroGen
• Demonstrate– ..\..\..\Hydro General\HydroGen AddIn\HydroAddIn
.xls
Hydrogeneration

Northwest Power Planning Council
62
Revised Agenda
• Approval of the Oct 24 meeting minutes• Review and questions from the last meeting
– Representation of dispatchable resources in the portfolio model
– Metrics
• Representations in the portfolio model– Price responsive demand– Renewables and conservation
• Hydro• Loads• Natural gas prices
Northwest Power Planning Council
63
Loads
• Non-DSI Loads– Calibrate with data from NWPP– Short-term uncertainty driven by random
temperatures (HELM)– Long term uncertainty from Terry Morlan’s
work
• DSI Loads– Terry Morlan’s aluminum industry model
Loads

Northwest Power Planning Council
64
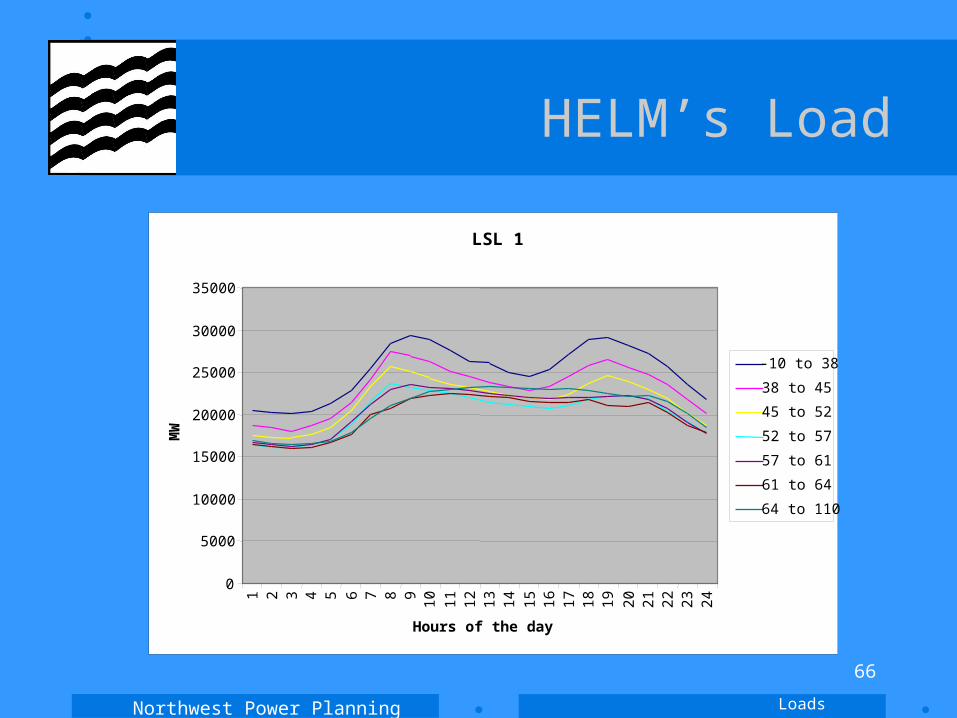
Loads
• Non-DSI Loads– Develop monthly on- and off-peak energy
values from an hourly model– Calibrated to most recent NPPC forecasts– Access to function to permit coordination
with hydro condition
Loads
Northwest Power Planning Council
65
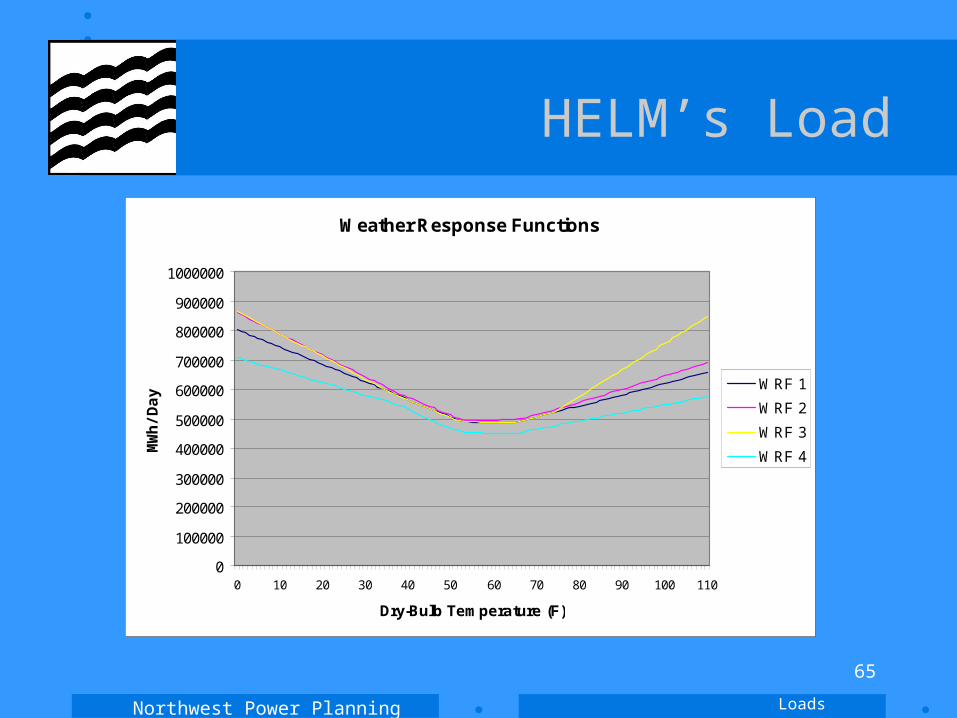
HELM’s Load
Weather Response Functions
0
100000
200000
300000
400000
500000
600000
700000
800000
900000
1000000
0 10 20 30 40 50 60 70 80 90 100 110
Dry-Bulb Temperature (F)
MW
h/D
ay
WRF 1
WRF 2
WRF 3
WRF 4
Loads
Northwest Power Planning Council
66
HELM’s Load
LSL 1
0
5000
10000
15000
20000
25000
30000
35000
1 2 3 4 5 6 7 8 9 10 11 12 13 14 15 16 17 18 19 20 21 22 23 24
Hours of the day
MW
-10 to 38
38 to 45
45 to 52
52 to 57
57 to 61
61 to 64
64 to 110
Loads
Northwest Power Planning Council
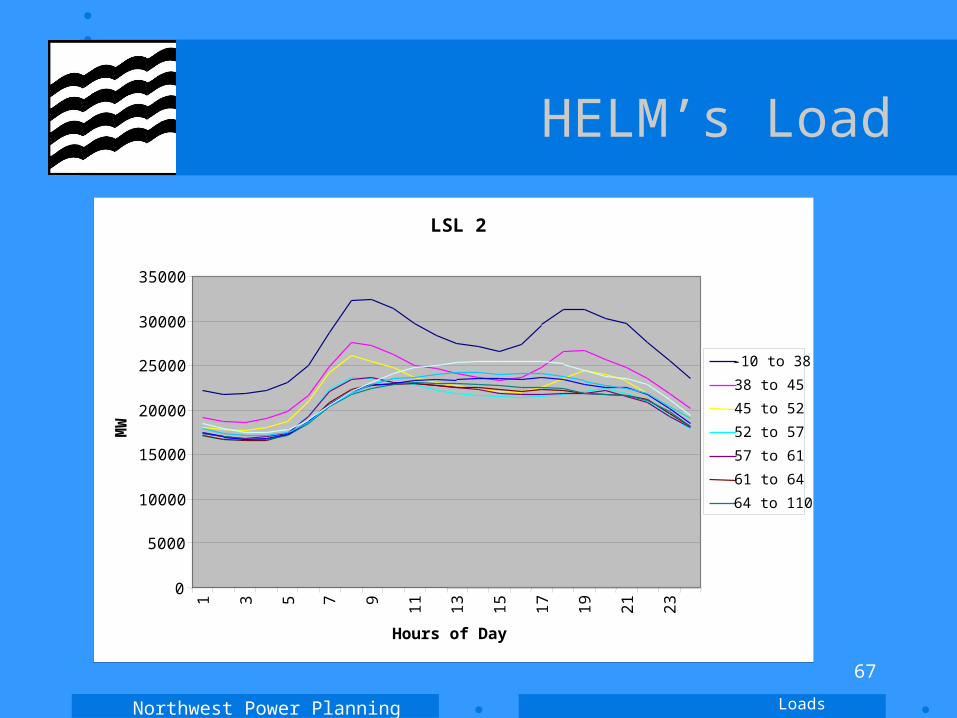
67
HELM’s Load
LSL 2
0
5000
10000
15000
20000
25000
30000
35000
1 3 5 7 9 11
13
15
17
19
21
23
Hours of Day
MW
-10 to 38
38 to 45
45 to 52
52 to 57
57 to 61
61 to 64
64 to 110
Loads
Northwest Power Planning Council
68
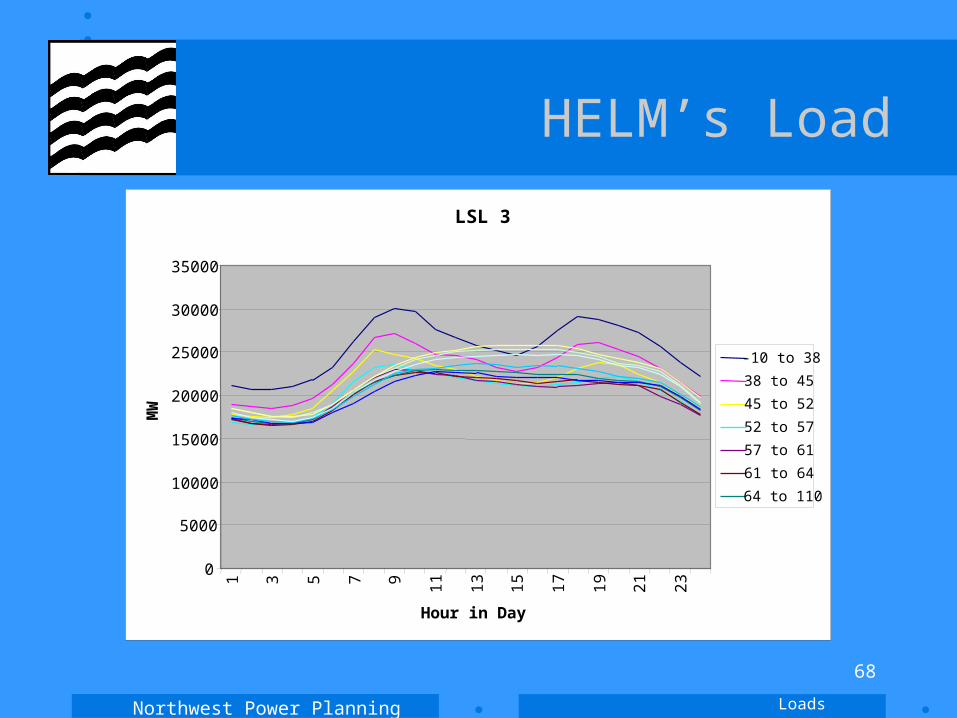
HELM’s Load
LSL 3
0
5000
10000
15000
20000
25000
30000
35000
1 3 5 7 9 11
13
15
17
19
21
23
Hour in Day
MW
-10 to 38
38 to 45
45 to 52
52 to 57
57 to 61
61 to 64
64 to 110
Loads
Northwest Power Planning Council
69
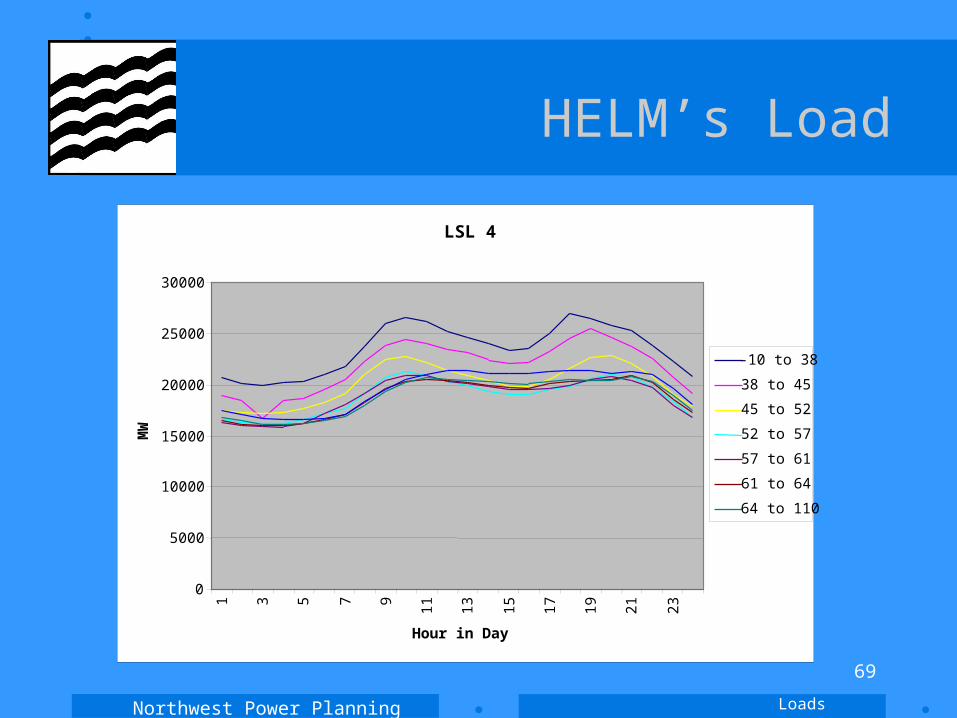
HELM’s Load
LSL 4
0
5000
10000
15000
20000
25000
30000
1 3 5 7 9
11 13 15 17 19 21 23
Hour in Day
MW
-10 to 38
38 to 45
45 to 52
52 to 57
57 to 61
61 to 64
64 to 110
Loads
Northwest Power Planning Council
70
Non-DSI Loads
• Short-term uncertainty:
Use 50-year record of daily temperatures to create estimates of on- and off-peak loads by month. Draw randomly.
• Long-term uncertainty:
Make the long-term uncertainty consistent with Terry Morlan’s estimates
Loads
Northwest Power Planning Council
71
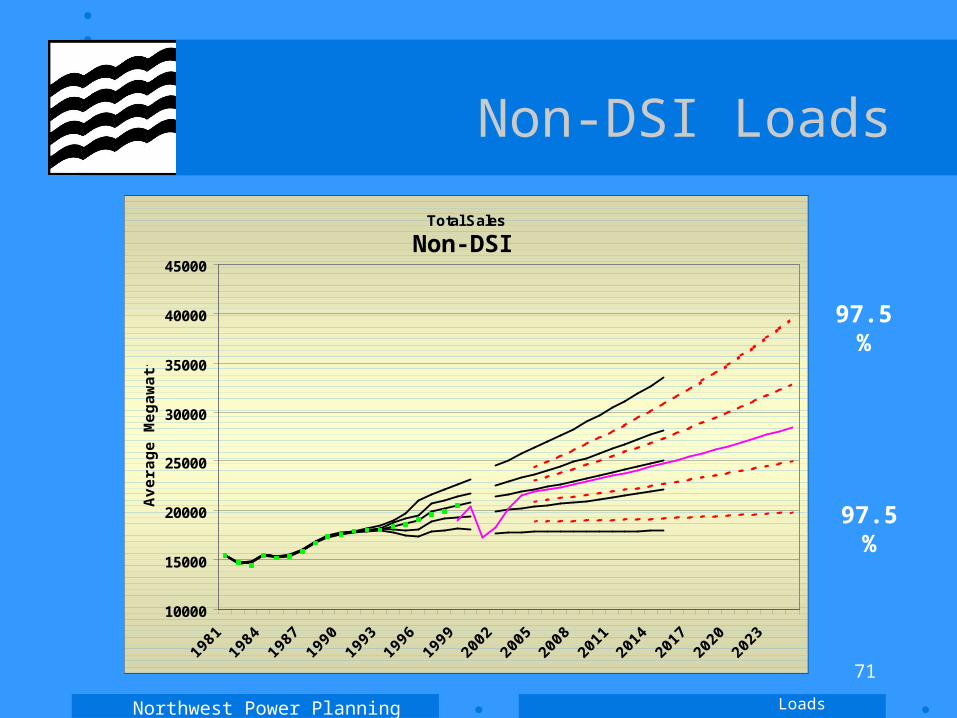
Non-DSI Loads
Total Sales
10000
15000
20000
25000
30000
35000
40000
45000
1981
1984
1987
1990
1993
1996
1999
2002
2005
2008
2011
2014
2017
2020
2023
Av
era
ge
Me
ga
wa
tts
Non-DSI
Loads
97.5%
97.5%
Northwest Power Planning Council
72
DSI Loads
• Terry Morlan’s model
• Inspired by Robin Adams, Resource Strategies, CRU Group
Loads
Northwest Power Planning Council
73
DSI Loads
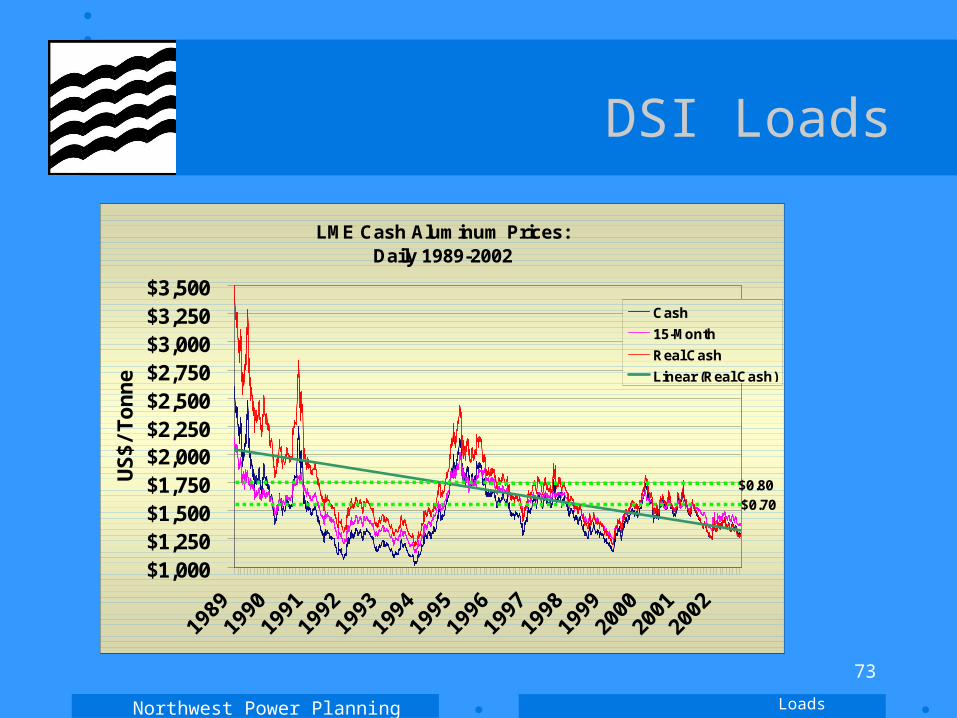
LME Cash Aluminum Prices:Daily 1989-2002
$1,000$1,250$1,500$1,750$2,000$2,250$2,500$2,750$3,000$3,250$3,500
1989
1990
1991
1992
1993
1994
1995
1996
1997
1998
1999
2000
2001
2002
US
$/To
nn
e
Cash
15-Month
Real Cash
Linear (Real Cash)
$0.70 $0.80
Loads

Northwest Power Planning Council
74
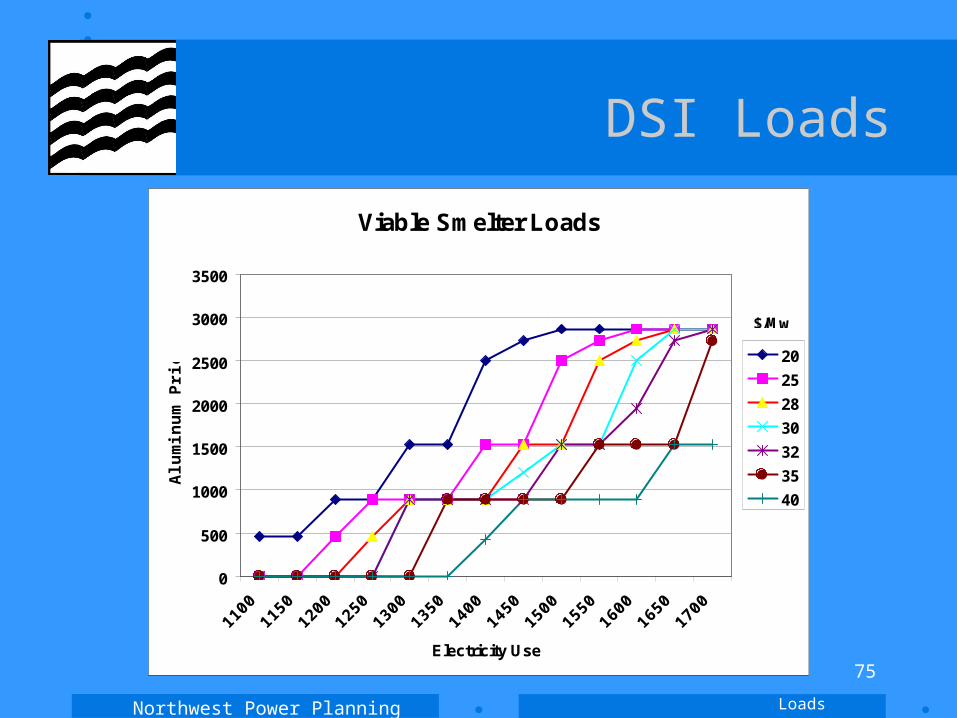
DSI LoadsAluminum Price 1550Premium Rate 0.03BPA Rate 23BPA Allocation 100
Mwh/Tonne 13.199Plant A
(modern prebake)Potential Demand 457Cost Components Alumina 403 Carbon 90 Labor/Other 400 Sustaining Capital 80
Electricity Cost Max 623.5
Electricity Price Max 47.24
Electricity Price$30
Demand @ Price 457
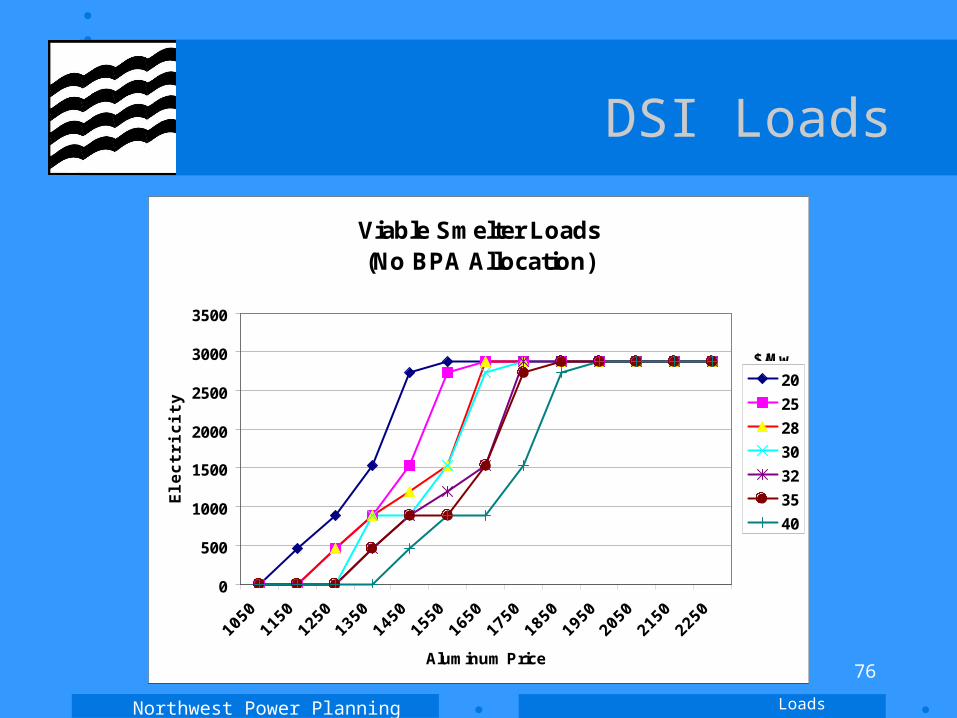
• Compute break-even price for each of nine PNW aluminum plants
• Assume plant will leave the system if the spread between aluminum prices and electricity cost component gets too small
• Examine the impact of 100 MW allocation of BPA power at various prices
Loads
Northwest Power Planning Council
75
DSI Loads
Viable Smelter Loads
0
500
1000
1500
2000
2500
3000
3500
1100
1150
1200
1250
1300
1350
1400
1450
1500
1550
1600
1650
1700
Electricity Use
Alu
min
um
Pri
ce
20
25
28
30
32
35
40
$/Mw
Loads
Northwest Power Planning Council
76
DSI Loads
Viable Smelter Loads(No BPA Allocation)
0
500
1000
1500
2000
2500
3000
3500
1050
1150
1250
1350
1450
1550
1650
1750
1850
1950
2050
2150
2250
Aluminum Price
Ele
ctr
icit
y U
se
20
25
28
30
32
35
40
$/Mw
Loads
Northwest Power Planning Council
77
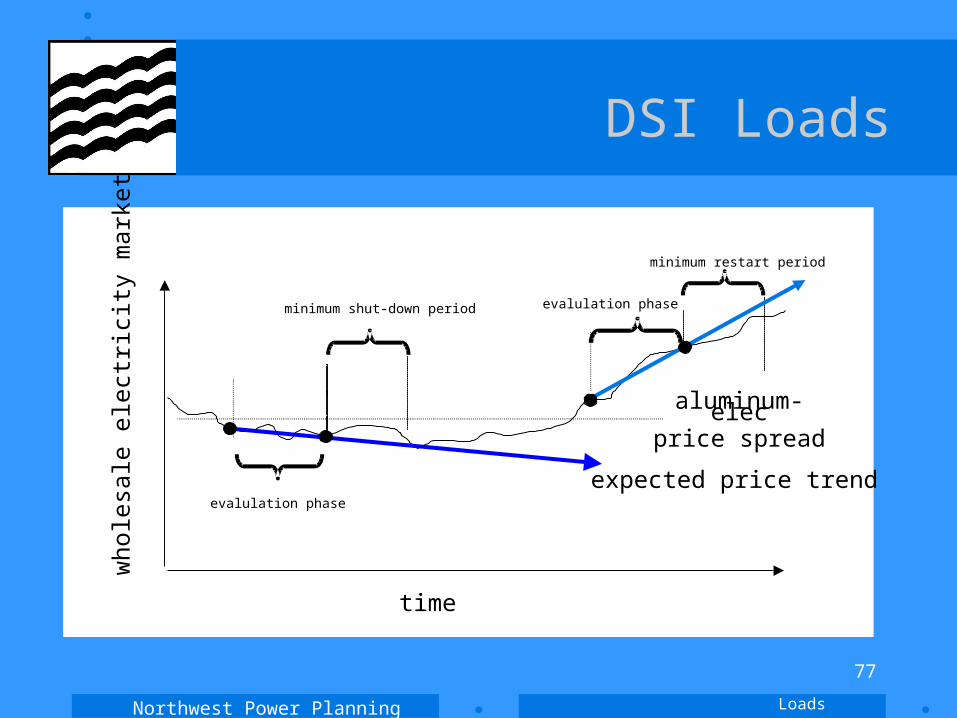
DSI Loads
minimum shut-down period
evalulation phase
time
who
lesa
le e
lect
ricity
mar
ket
aluminum-elecprice spread
expected price trend
minimum restart period
evalulation phase
Loads

Northwest Power Planning Council
78
DSI Loads
• Model DSI load as a function of electricity prices and aluminum prices.
• Represents monthly response. Would stay down for several months and take several months to bring back on-line.
• Has value as a exchange option or spread option.
Loads
Northwest Power Planning Council
79
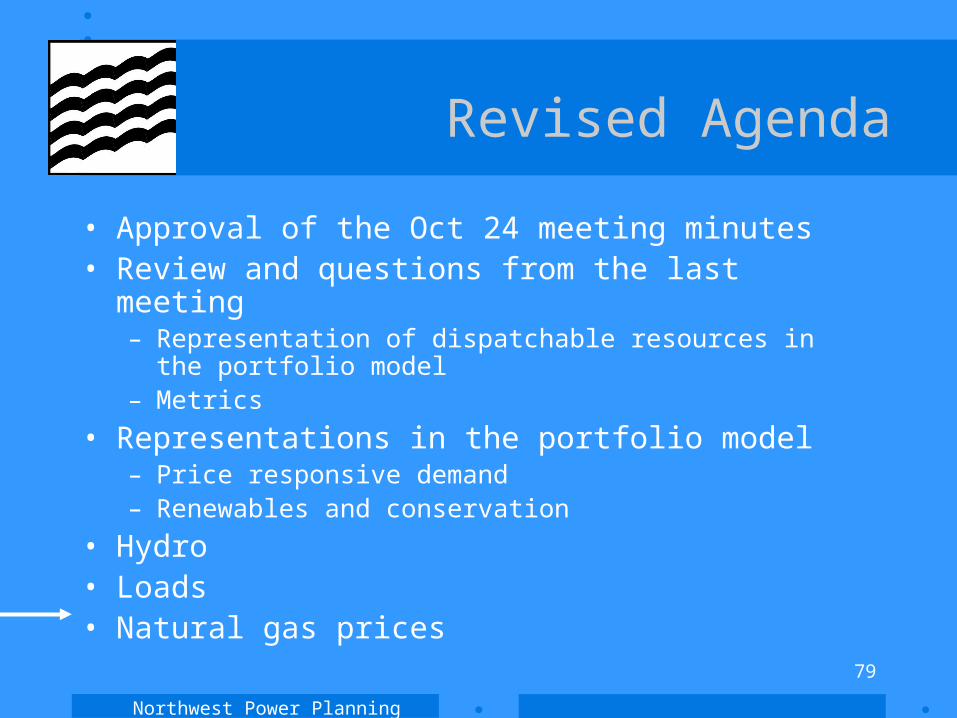
Revised Agenda
• Approval of the Oct 24 meeting minutes• Review and questions from the last meeting
– Representation of dispatchable resources in the portfolio model
– Metrics
• Representations in the portfolio model– Price responsive demand– Renewables and conservation
• Hydro• Loads• Natural gas prices
Northwest Power Planning Council
80
Natural Gas Prices
• Data from Gas Daily• Statistics?
– Historical Dailies– Price processes– Distributions within the month, year– Future uncertainties (Terry)– Reasons for variation over time– Correlation with electricity, load, temperature,
aluminum prices, hydro
Natural Gas Prices
Northwest Power Planning Council
81
Natural Gas Prices
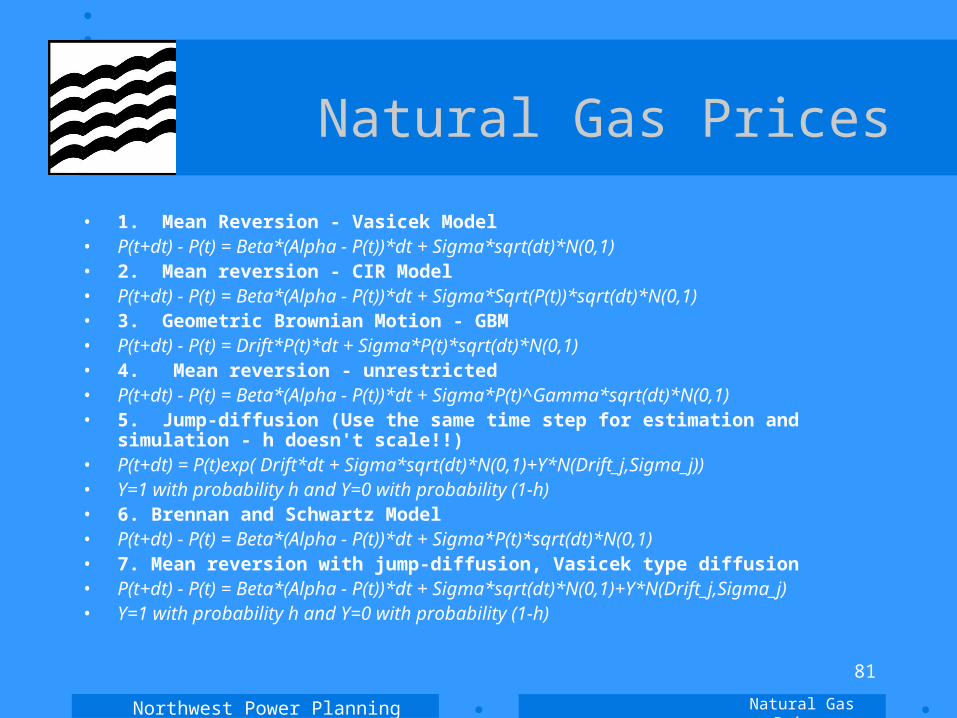
• 1. Mean Reversion - Vasicek Model• P(t+dt) - P(t) = Beta*(Alpha - P(t))*dt + Sigma*sqrt(dt)*N(0,1)• 2. Mean reversion - CIR Model• P(t+dt) - P(t) = Beta*(Alpha - P(t))*dt + Sigma*Sqrt(P(t))*sqrt(dt)*N(0,1)• 3. Geometric Brownian Motion - GBM• P(t+dt) - P(t) = Drift*P(t)*dt + Sigma*P(t)*sqrt(dt)*N(0,1)• 4. Mean reversion - unrestricted • P(t+dt) - P(t) = Beta*(Alpha - P(t))*dt + Sigma*P(t)^Gamma*sqrt(dt)*N(0,1)• 5. Jump-diffusion (Use the same time step for estimation and simulation - h doesn't
scale!!)• P(t+dt) = P(t)exp( Drift*dt + Sigma*sqrt(dt)*N(0,1)+Y*N(Drift_j,Sigma_j))• Y=1 with probability h and Y=0 with probability (1-h)• 6. Brennan and Schwartz Model• P(t+dt) - P(t) = Beta*(Alpha - P(t))*dt + Sigma*P(t)*sqrt(dt)*N(0,1)• 7. Mean reversion with jump-diffusion, Vasicek type diffusion• P(t+dt) - P(t) = Beta*(Alpha - P(t))*dt + Sigma*sqrt(dt)*N(0,1)+Y*N(Drift_j,Sigma_j)• Y=1 with probability h and Y=0 with probability (1-h)
Natural Gas Prices
Northwest Power Planning Council
82
Natural Gas Prices
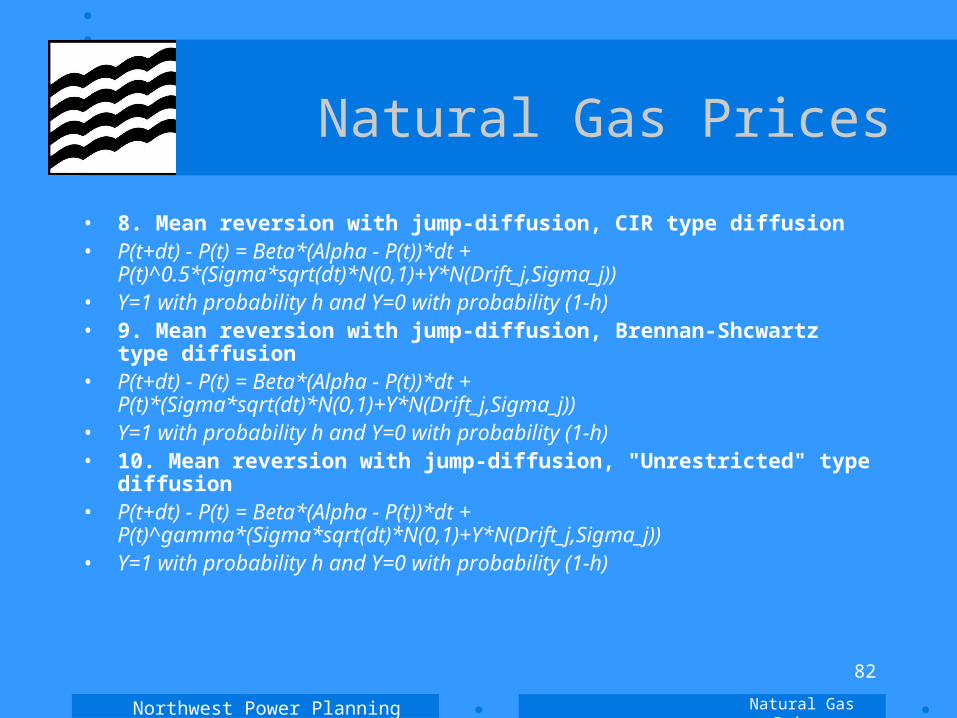
• 8. Mean reversion with jump-diffusion, CIR type diffusion• P(t+dt) - P(t) = Beta*(Alpha - P(t))*dt +
P(t)^0.5*(Sigma*sqrt(dt)*N(0,1)+Y*N(Drift_j,Sigma_j))• Y=1 with probability h and Y=0 with probability (1-h)• 9. Mean reversion with jump-diffusion, Brennan-Shcwartz type diffusion• P(t+dt) - P(t) = Beta*(Alpha - P(t))*dt +
P(t)*(Sigma*sqrt(dt)*N(0,1)+Y*N(Drift_j,Sigma_j))• Y=1 with probability h and Y=0 with probability (1-h)• 10. Mean reversion with jump-diffusion, "Unrestricted" type diffusion• P(t+dt) - P(t) = Beta*(Alpha - P(t))*dt +
P(t)^gamma*(Sigma*sqrt(dt)*N(0,1)+Y*N(Drift_j,Sigma_j))• Y=1 with probability h and Y=0 with probability (1-h)
Natural Gas Prices
Northwest Power Planning Council
83
Next Meeting
• Natural Gas Prices• Electricity• Statistics
– Historical Dailies– Price processes– Distributions within the month, year– Reasons for variation over time– Correlation among electricity, load, temperature,
aluminum prices, hydro, natural gas prices
Northwest Power Planning Council
84
Almost there...
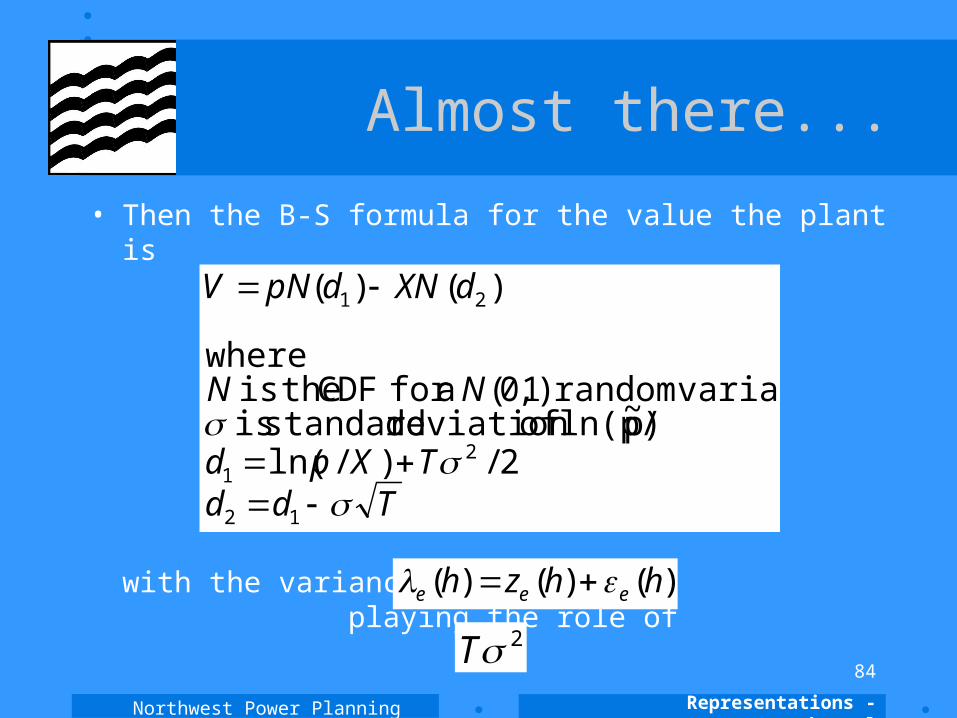
• Then the B-S formula for the value the plant is
Representations - thermal
TddTXpd
NN
dXNdpNV
12
21
21
2/)/ln()p~ln(p/ ofdeviation standard is variablerandom )1,0( afor CDF theis
where
)()(
with the variance of playing the role of)()()( hhzh eee
2T

Northwest Power Planning Council
85
The payoff
• The B.S. formula for the capacity factor the plant is
Representations - thermal
2/)()/ln(2/)/ln(
where
)(
22
21
1
ezge epp
TXpd
dNp
Vf

Northwest Power Planning Council
86
European spread option
• The Margrabe pricing formula for the value of a spread option, assuming no yields
Representations - thermal
212,12
22
12
12
212
1
2112
2
2/)/ln(where
)()(
TddT
Tppd
dNpdNpV