Embed Size (px)
Citation preview

1
Systems Analysis Advisory Committee (SAAC)
Tuesday February 10, 2004Michael Schilmoeller
John Fazio
Northwest Power and Conservation Council
2
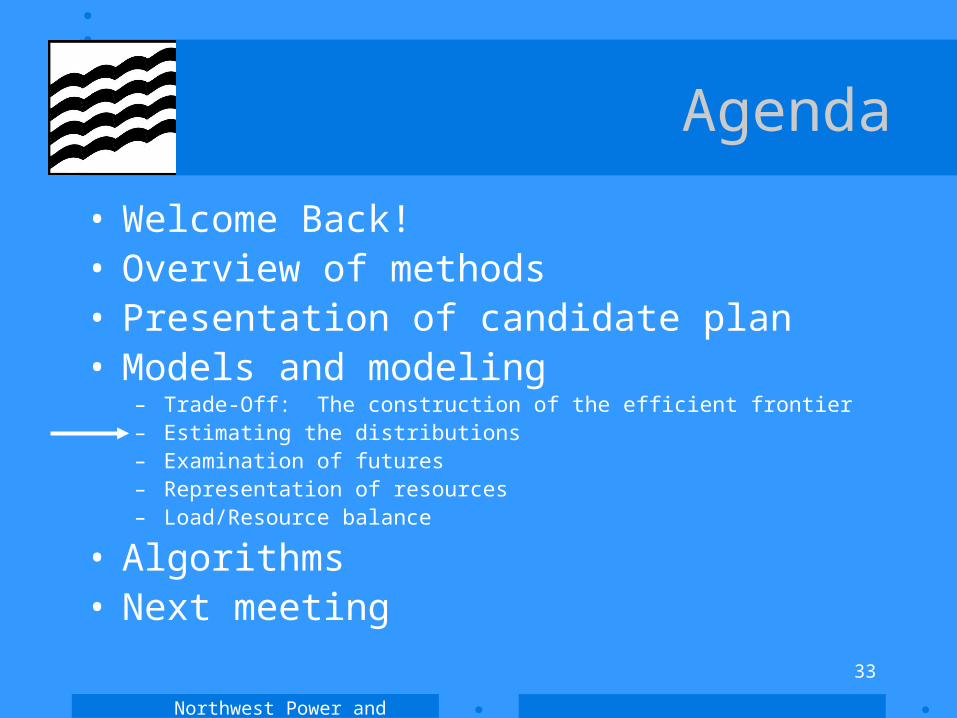
Agenda
• Welcome Back!
• Overview of methods
• Presentation of candidate plan
• Models and modeling
• Algorithms
• Next meeting
Northwest Power and Conservation Council
3
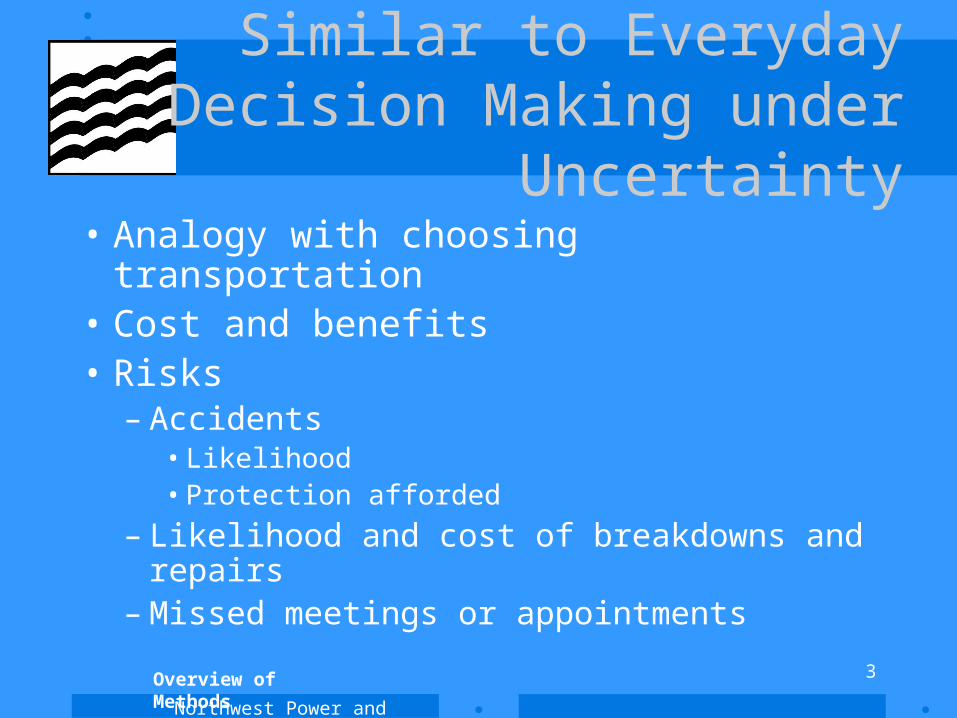
Similar to Everyday Decision Making under Uncertainty
• Analogy with choosing transportation• Cost and benefits• Risks
– Accidents• Likelihood• Protection afforded
– Likelihood and cost of breakdowns and repairs– Missed meetings or appointments
Overview of Methods
Northwest Power and Conservation Council
4
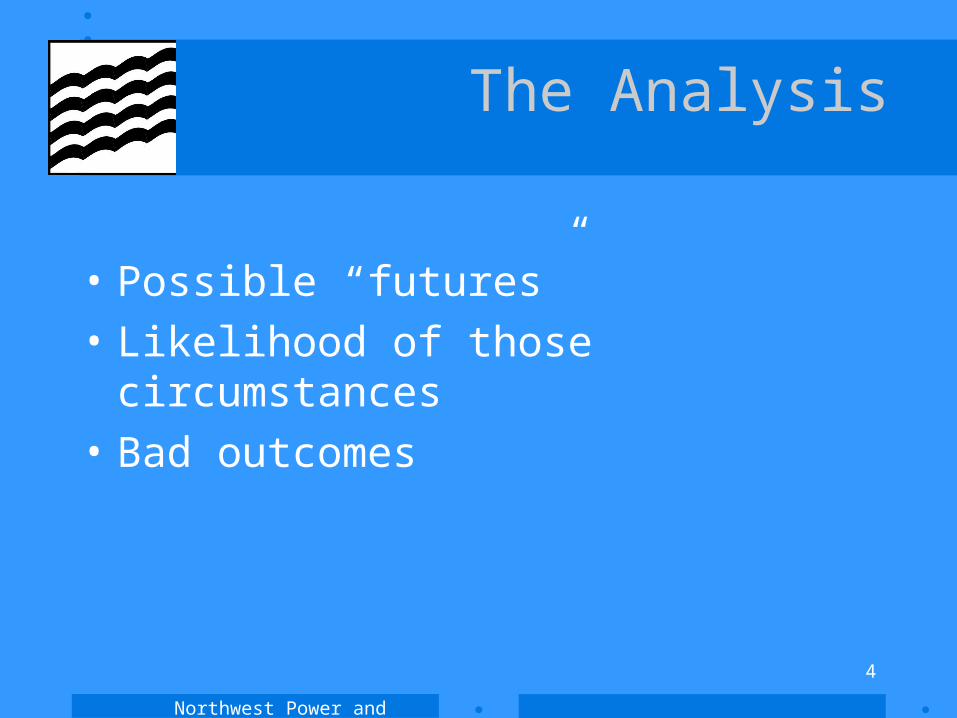
The Analysis
• Possible “futures”
• Likelihood of those circumstances
• Bad outcomes
Northwest Power and Conservation Council
5
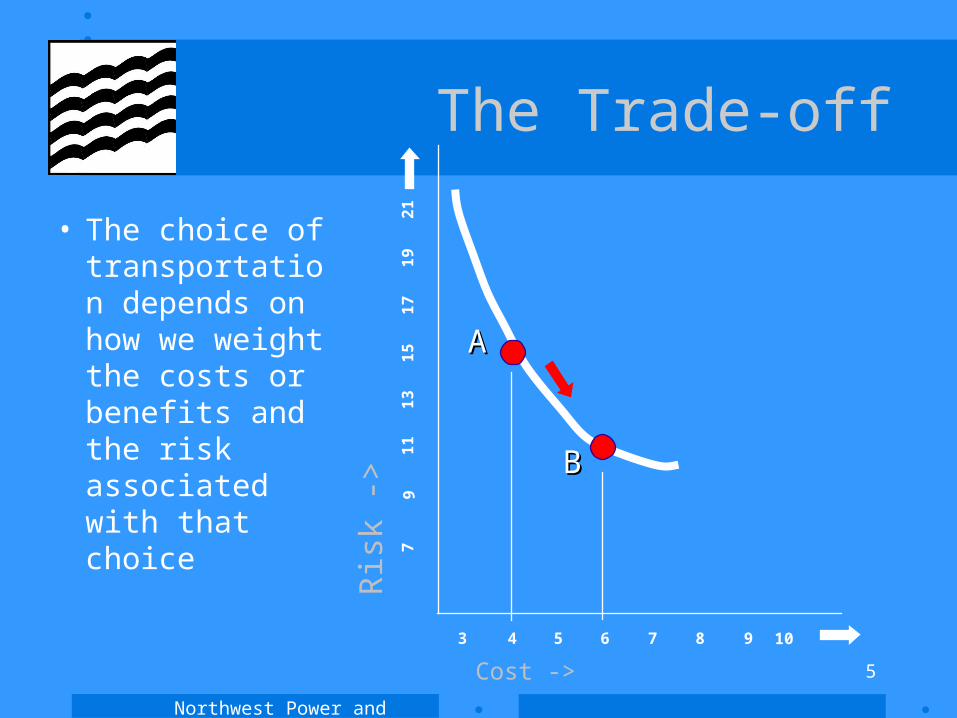
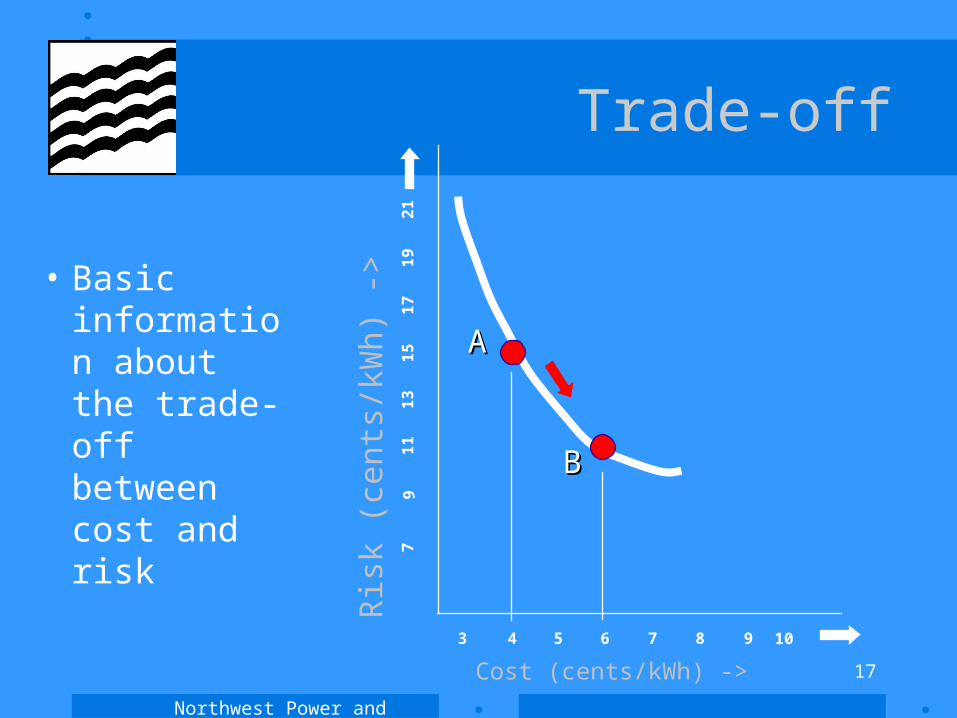
The Trade-off
• The choice of transportation depends on how we weight the costs or benefits and the risk associated with that choice
3 4 5 6 7 8 9 10
Cost ->
79
1113
1517
1921
Ris
k ->
AA
BB
Northwest Power and Conservation Council
6
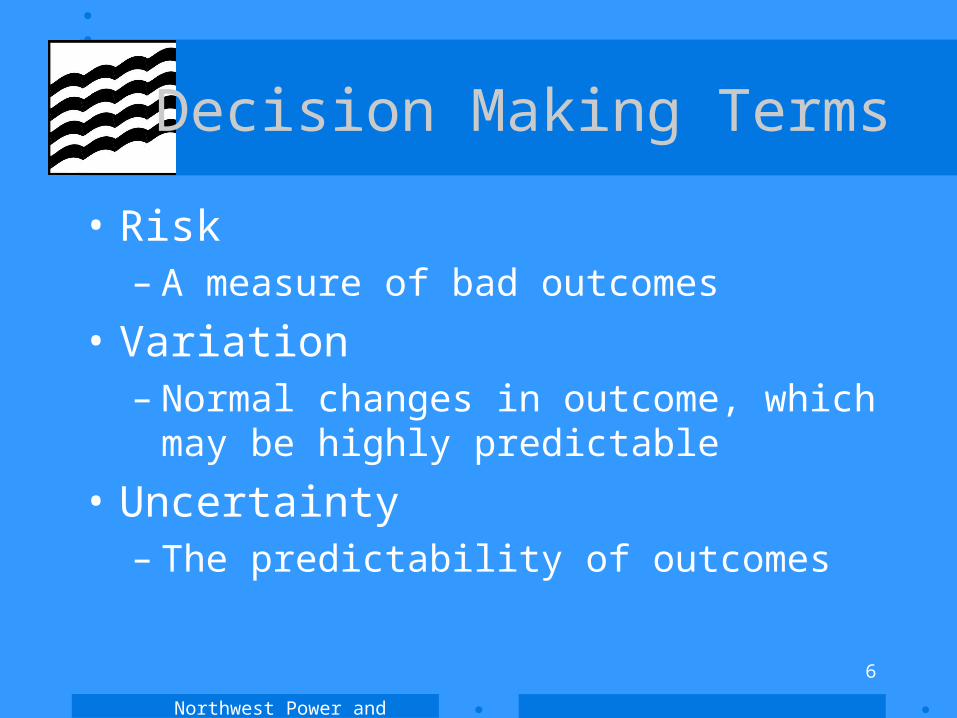
Decision Making Terms
• Risk– A measure of bad outcomes
• Variation– Normal changes in outcome, which may be
highly predictable
• Uncertainty– The predictability of outcomes
Northwest Power and Conservation Council
7
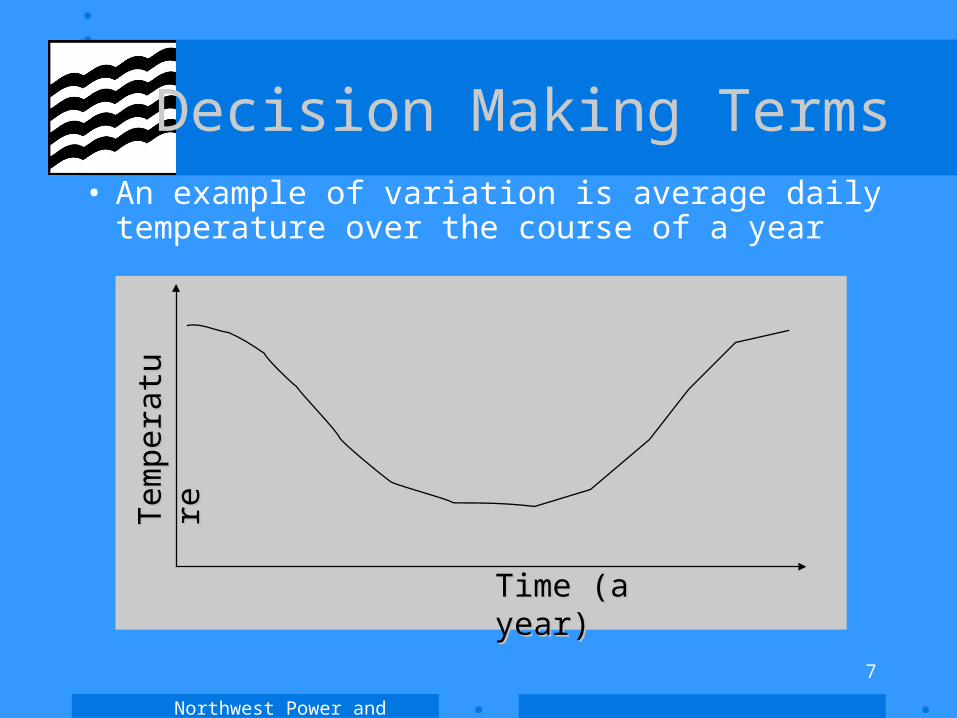
Decision Making Terms• An example of variation is average daily temperature
over the course of a year
Time (a year)Time (a year)
Tem
pera
ture
Tem
pera
ture

Northwest Power and Conservation Council
8
Decision Making Terms
• For any particular day, the uncertainty in daily temperature can be large.
Time (a year)Time (a year)
Tem
pera
ture
Tem
pera
ture
??
Northwest Power and Conservation Council
9
Decision Making Terms
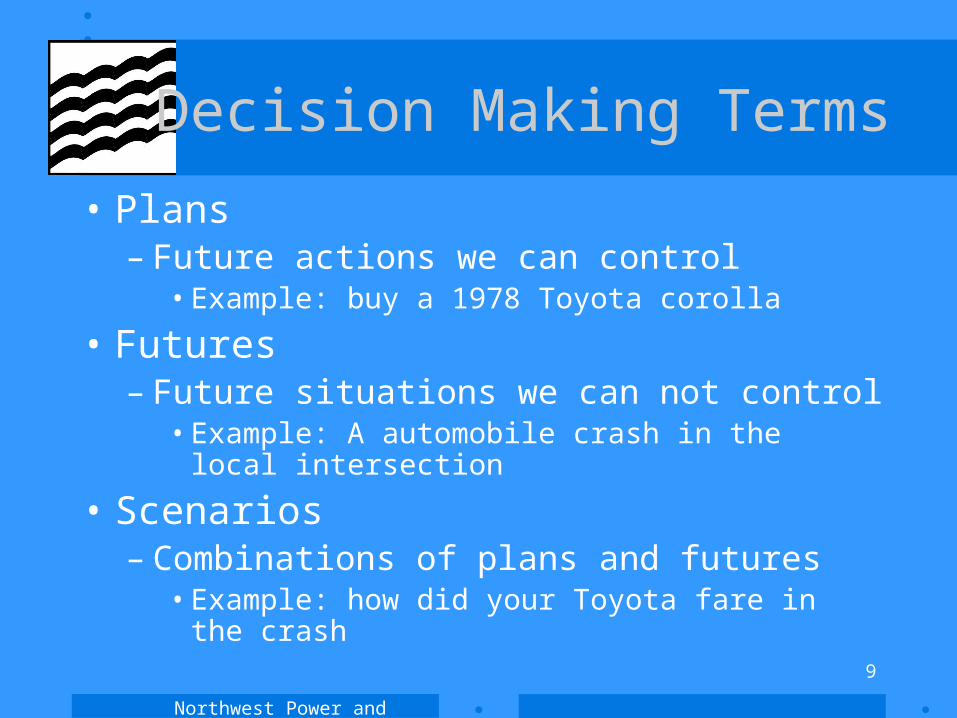
• Plans– Future actions we can control
• Example: buy a 1978 Toyota corolla
• Futures– Future situations we can not control
• Example: A automobile crash in the local intersection
• Scenarios– Combinations of plans and futures
• Example: how did your Toyota fare in the crash
Northwest Power and Conservation Council
10
Power Plan Futures
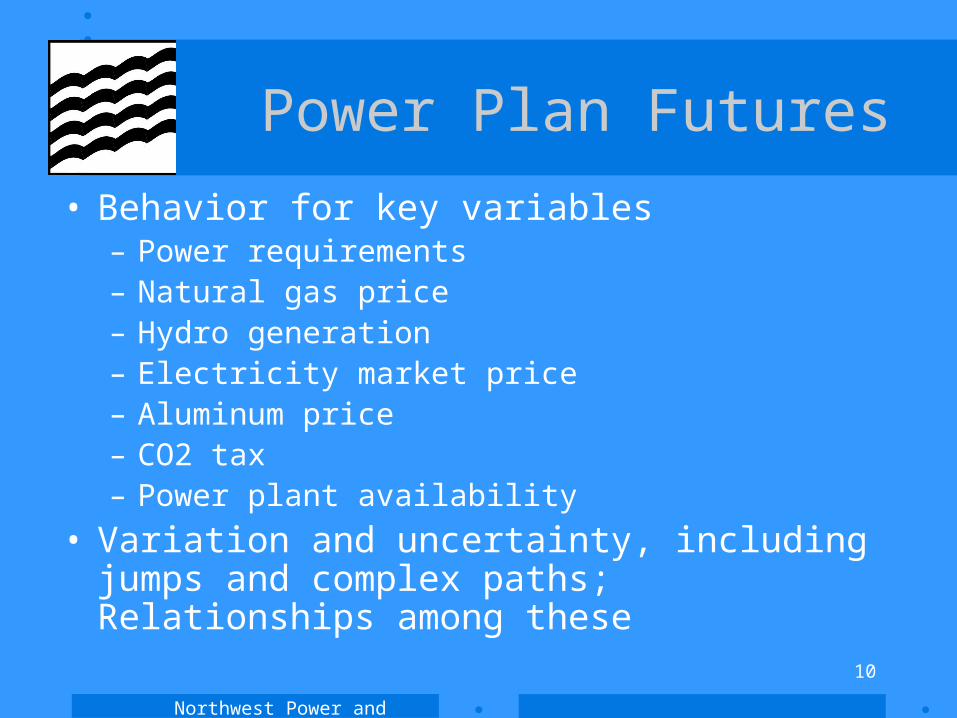
• Behavior for key variables – Power requirements– Natural gas price– Hydro generation– Electricity market price– Aluminum price– CO2 tax– Power plant availability
• Variation and uncertainty, including jumps and complex paths; Relationships among these
Northwest Power and Conservation Council
11
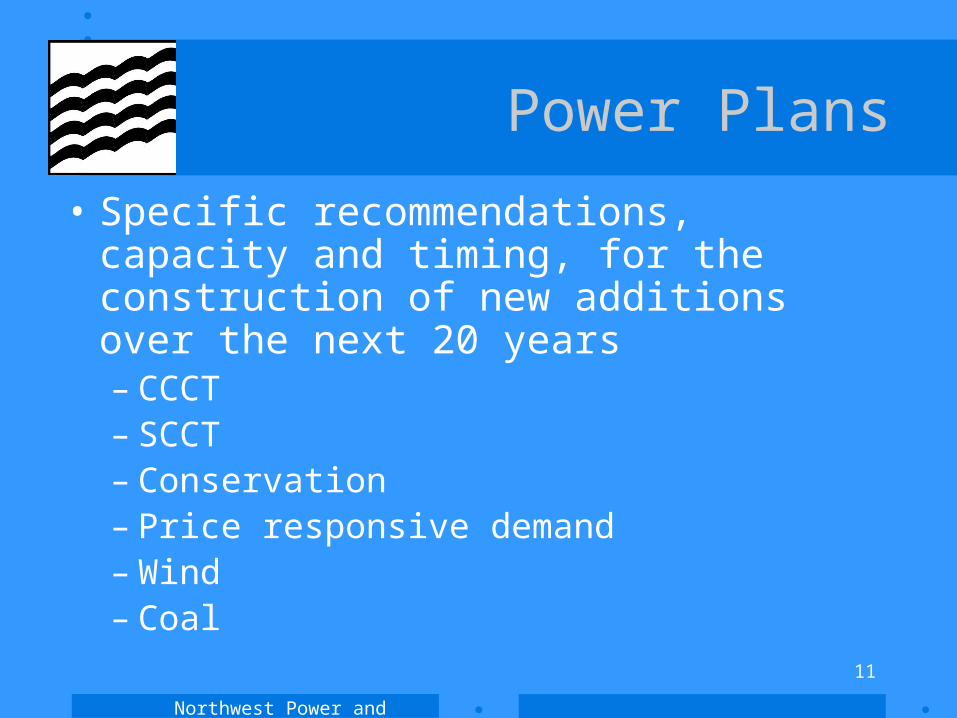
Power Plans
• Specific recommendations, capacity and timing, for the construction of new additions over the next 20 years– CCCT– SCCT– Conservation– Price responsive demand– Wind– Coal
Northwest Power and Conservation Council
12
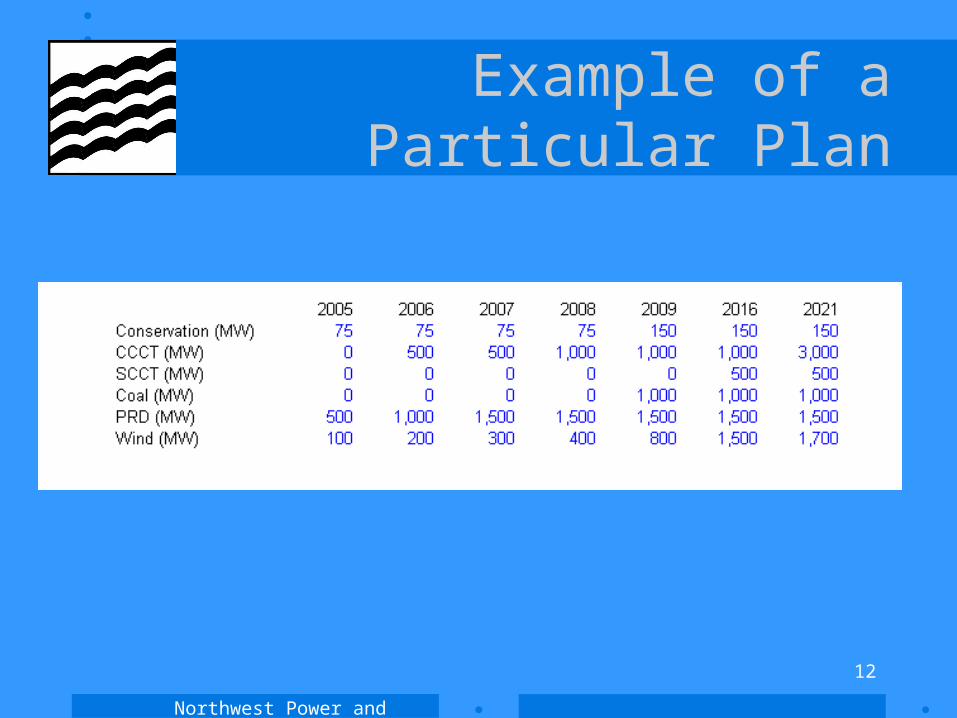
Example of aParticular Plan
Northwest Power and Conservation Council
13
Power Plans
• We do not make decisions before we need to do so. We want as much information as possible before making a commitment
• Therefore, we want to focus on the “Implementation Plan” that identifies actions over the next three to five years.
• Preparing a 20-year plan enables us to assure our short-term implementation plan create no long-term risk and does not preclude important long-term planning options. (We want to understand the strategic significance of our short-term actions.)
Northwest Power and Conservation Council
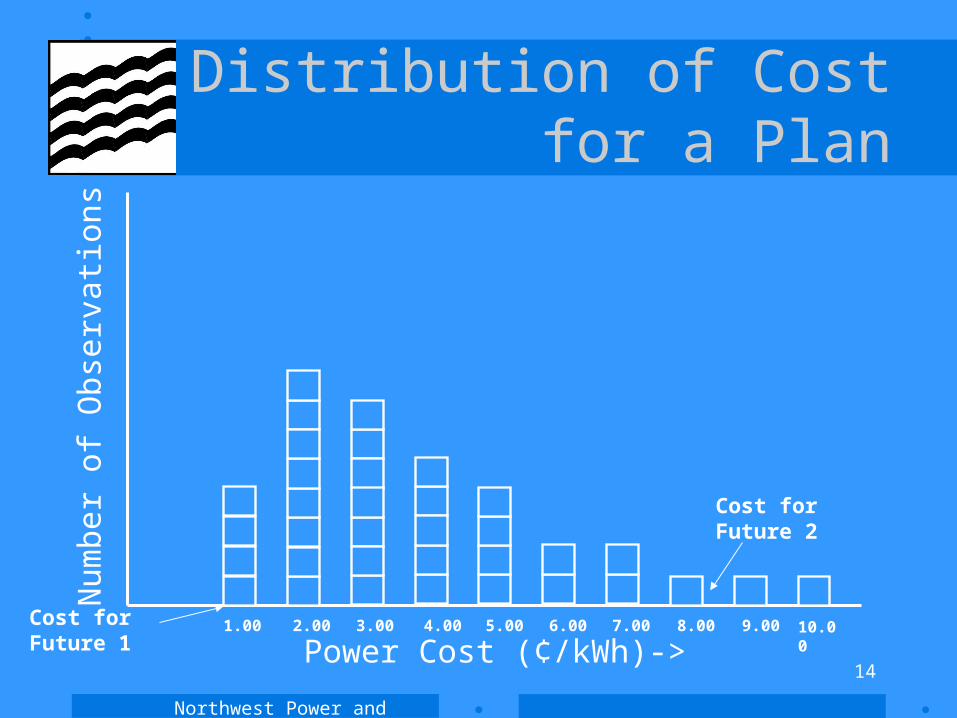
14Power Cost (¢/kWh)->
Nu
mb
er
of
Ob
serv
ati
ons
Cost for Future 2
Cost for Future 1
Distribution of Cost for a Plan
1.00 2.00 3.00 4.00 5.00 6.00 7.00 8.00 9.00 10.00
Northwest Power and Conservation Council
15
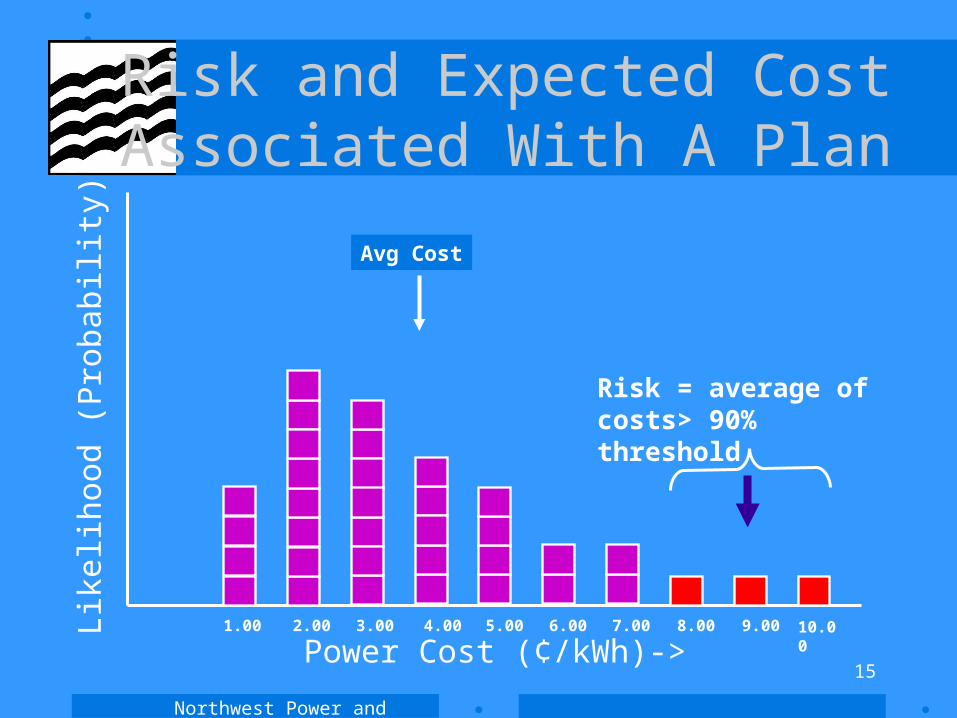
Risk and Expected Cost Associated With A Plan
Like
lihood
(Pro
bab
ility
)
Avg Cost
1.00 2.00 3.00 4.00 5.00 6.00 7.00 8.00 9.00 10.00
Power Cost (¢/kWh)->
Risk = average ofcosts> 90% threshold
Northwest Power and Conservation Council
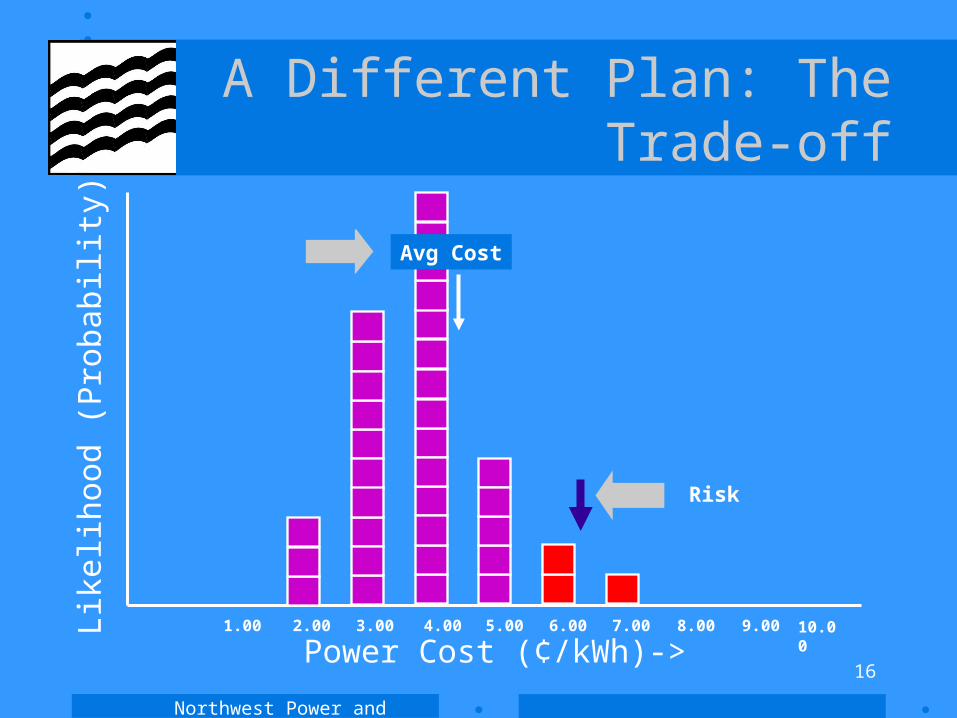
16
A Different Plan: The Trade-offLi
kelih
ood
(Pro
bab
ility
)
Risk
Avg Cost
1.00 2.00 3.00 4.00 5.00 6.00 7.00 8.00 9.00 10.00
Power Cost (¢/kWh)->
Northwest Power and Conservation Council
17
Trade-off
• Basic information about the trade-off between cost and risk
3 4 5 6 7 8 9 10
Cost (cents/kWh) ->
79
1113
1517
1921
Ris
k (c
en
ts/k
Wh
) ->
AA
BB
Northwest Power and Conservation Council
18
Insights
• Insights into– What a plan costs– How we expect it to perform– What the risks are
• How does the plan perform under specific futures?
• What are the chances we may see these futures?
Northwest Power and Conservation Council
19
Agenda
• Welcome Back!
• Overview of methods
• Presentation of candidate plan
• Models and modeling
• Algorithms
• Next meeting
Northwest Power and Conservation Council
20
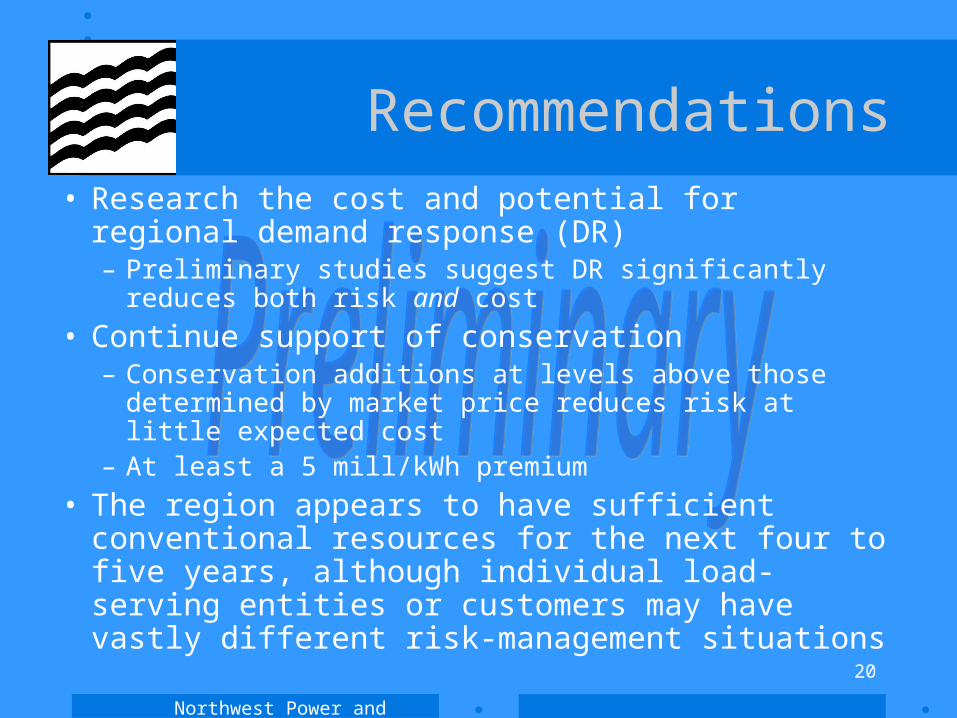
• Research the cost and potential for regional demand response (DR)– Preliminary studies suggest DR significantly reduces both
risk and cost
• Continue support of conservation– Conservation additions at levels above those determined
by market price reduces risk at little expected cost– At least a 5 mill/kWh premium
• The region appears to have sufficient conventional resources for the next four to five years, although individual load-serving entities or customers may have vastly different risk-management situations
Recommendations
Northwest Power and Conservation Council
21
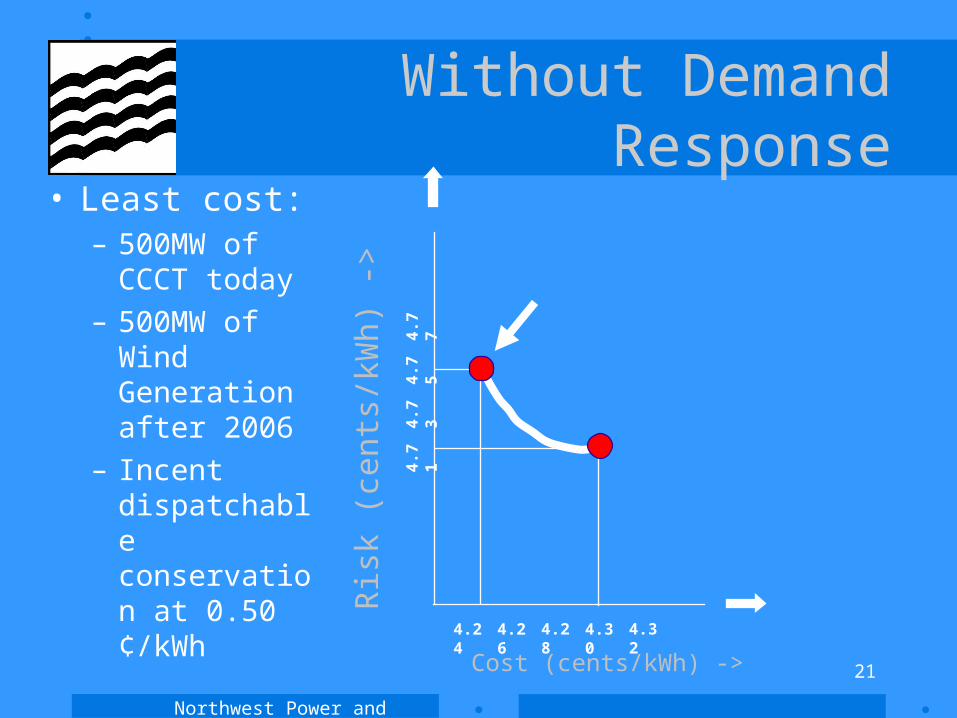
Without Demand Response
4.24
Cost (cents/kWh) ->
Ris
k (c
en
ts/k
Wh
) ->
4.26 4.28 4.30 4.32
4.71
4.73
4.75
4.77
• Least cost:– 500MW of
CCCT today
– 500MW of Wind Generation after 2006
– Incent dispatchable conservation at 0.50 ¢/kWh
Northwest Power and Conservation Council
22
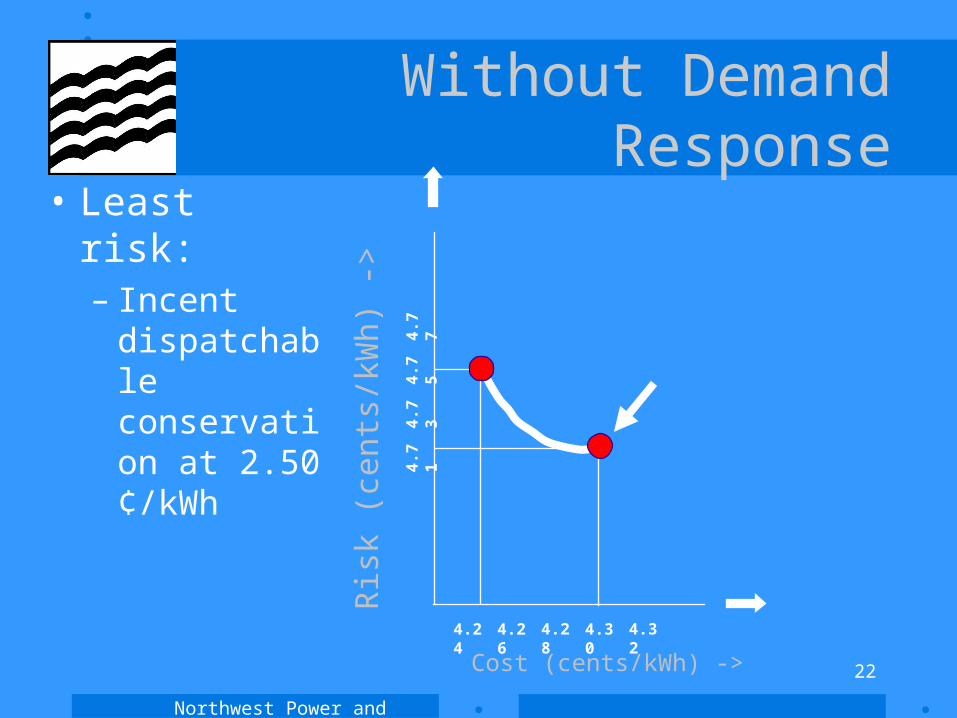
Without Demand Response
4.24
Cost (cents/kWh) ->
Ris
k (c
en
ts/k
Wh
) ->
4.26 4.28 4.30 4.32
4.71
4.73
4.75
4.77
• Least risk:– Incent
dispatchable conservation at 2.50 ¢/kWh
Northwest Power and Conservation Council
23
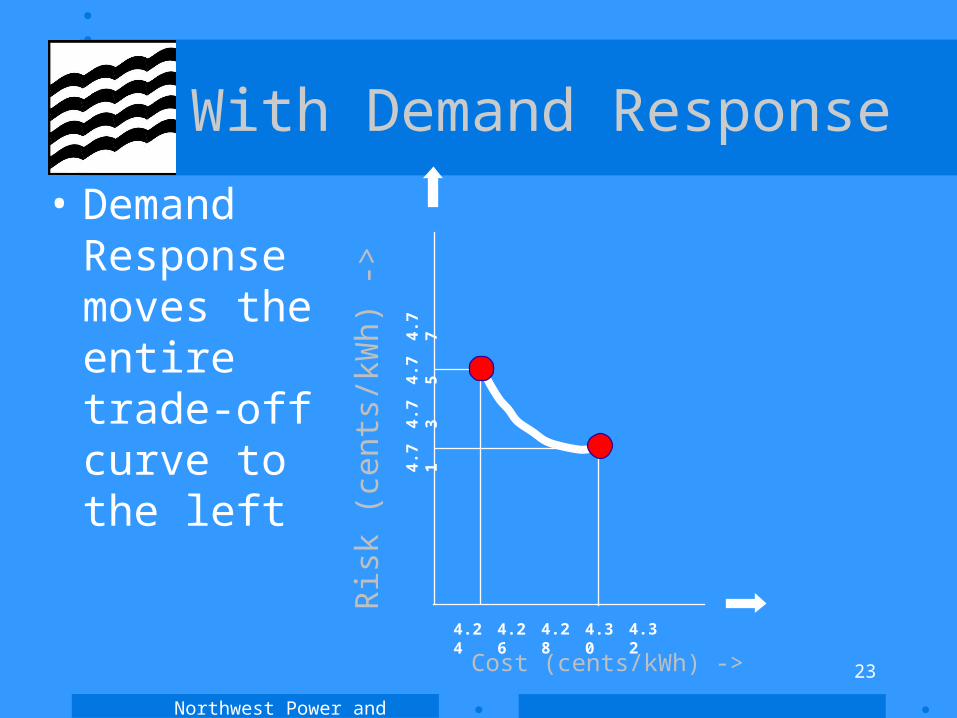
With Demand Response
4.24
Cost (cents/kWh) ->
Ris
k (c
en
ts/k
Wh
) ->
4.26 4.28 4.30 4.32
4.71
4.73
4.75
4.77
• Demand Response moves the entire trade-off curve to the left
Northwest Power and Conservation Council
24
Agenda
• Welcome Back!• Overview of methods• Presentation of candidate plan• Models and modeling
– Trade-Off: The construction of the efficient frontier– Estimating the distributions– Examination of futures– Representation of resources– Load/Resource balance
• Algorithms• Next meeting

Northwest Power and Conservation Council
25
Risk and Expected Cost Associated With A Plan
Like
lihood
(Pro
bab
ility
)
Avg Cost
1.00 2.00 3.00 4.00 5.00 6.00 7.00 8.00 9.00 10.00
Power Cost (¢/kWh)->
Risk = average ofcosts> 90% threshold
Northwest Power and Conservation Council
26
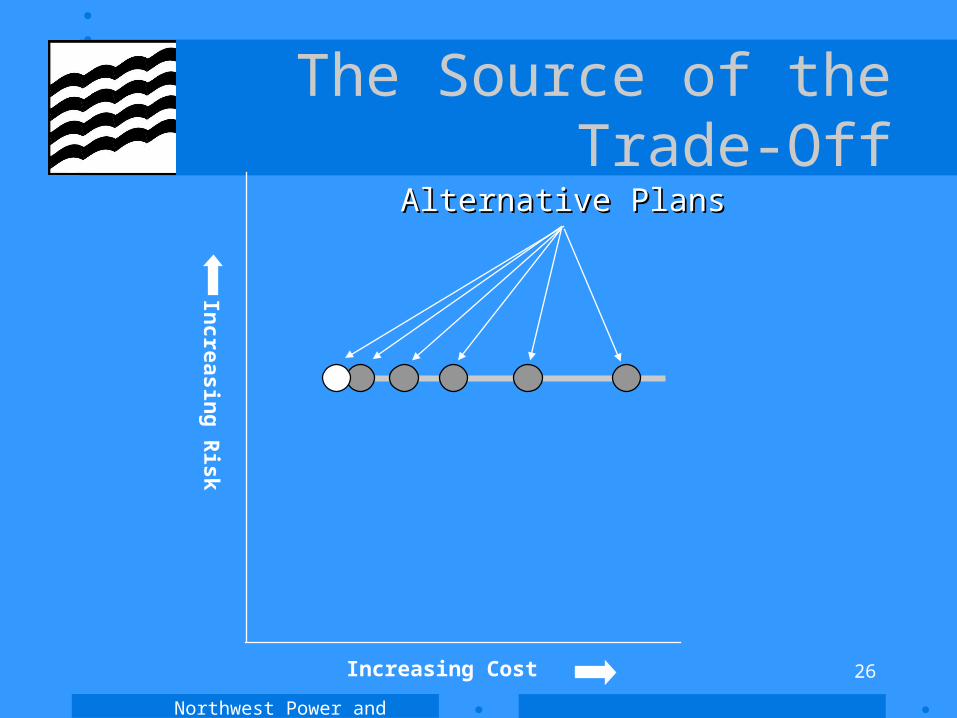
The Source of the Trade-Off
Increasing Cost
Incre
asin
g R
isk
Alternative PlansAlternative Plans
Northwest Power and Conservation Council
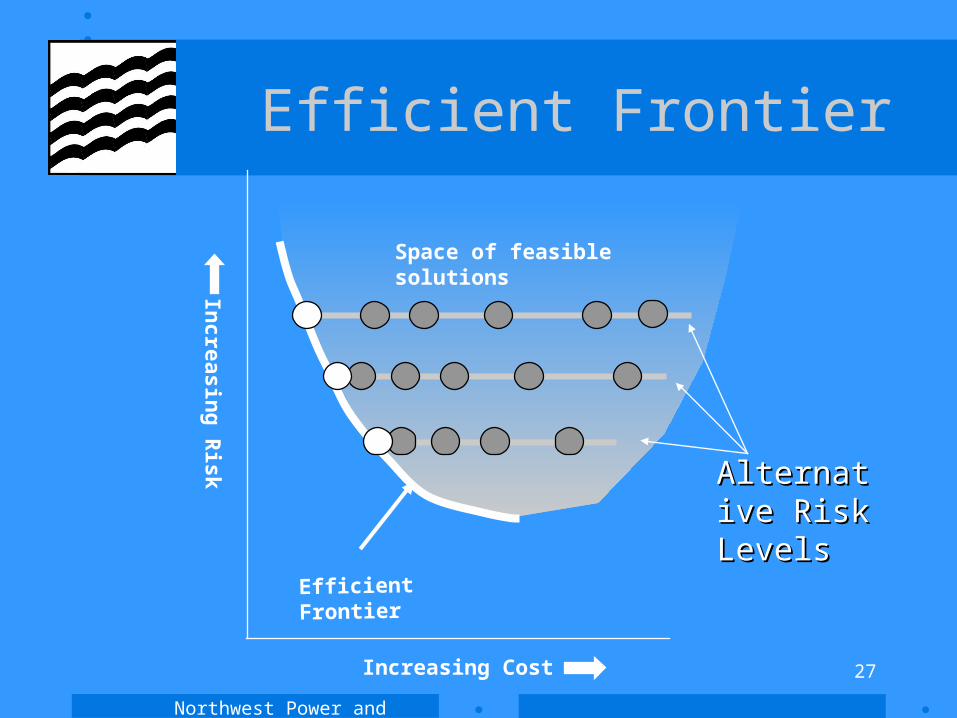
27
Space of feasible solutions
Efficient Frontier
Incre
asin
g R
isk
Increasing Cost
Alternative Alternative Risk LevelsRisk Levels
Efficient Frontier
Northwest Power and Conservation Council
28
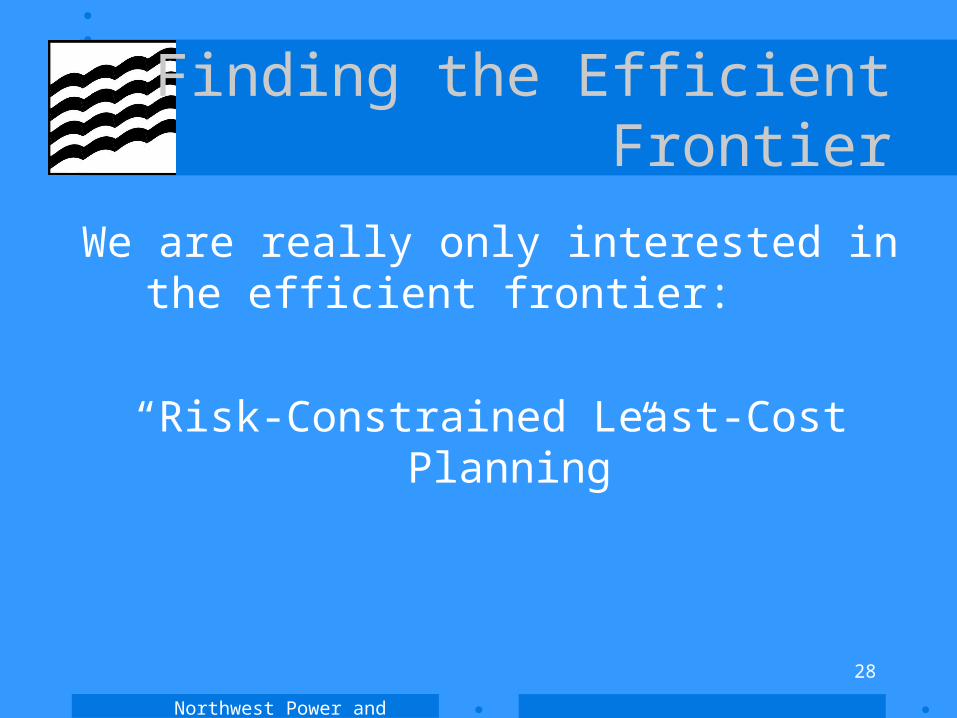
Finding the Efficient Frontier
We are really only interested in the efficient frontier:
“Risk-Constrained Least-Cost Planning”
Northwest Power and Conservation Council
29
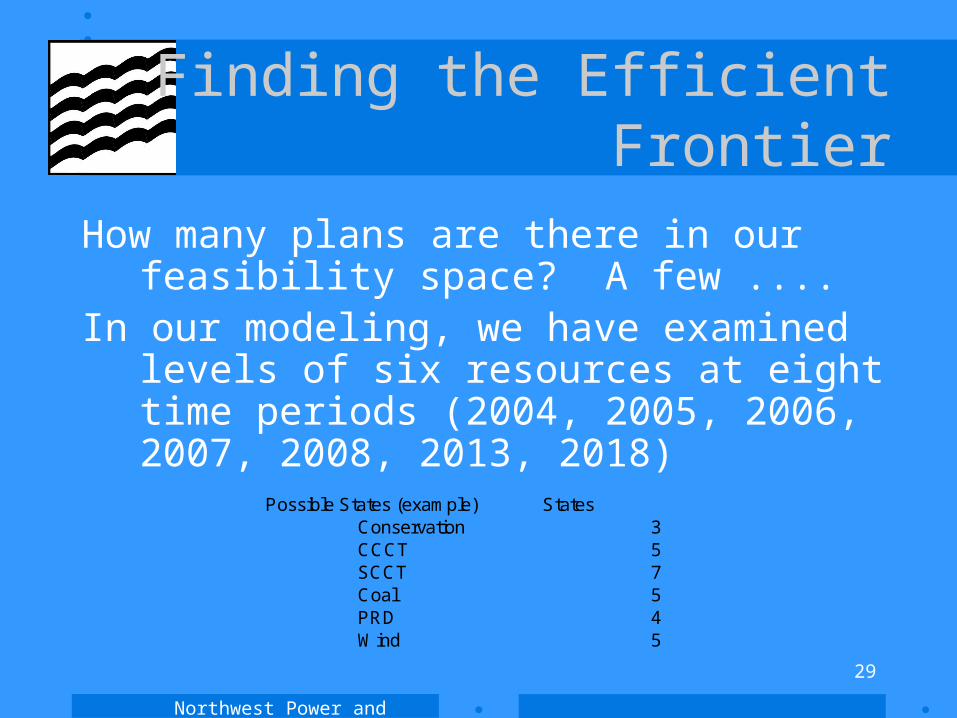
Finding the Efficient Frontier
How many plans are there in our feasibility space? A few ....
In our modeling, we have examined levels of six resources at eight time periods (2004, 2005, 2006, 2007, 2008, 2013, 2018)
Possible States (example) StatesConservation 3CCCT 5SCCT 7Coal 5PRD 4Wind 5
Northwest Power and Conservation Council
30
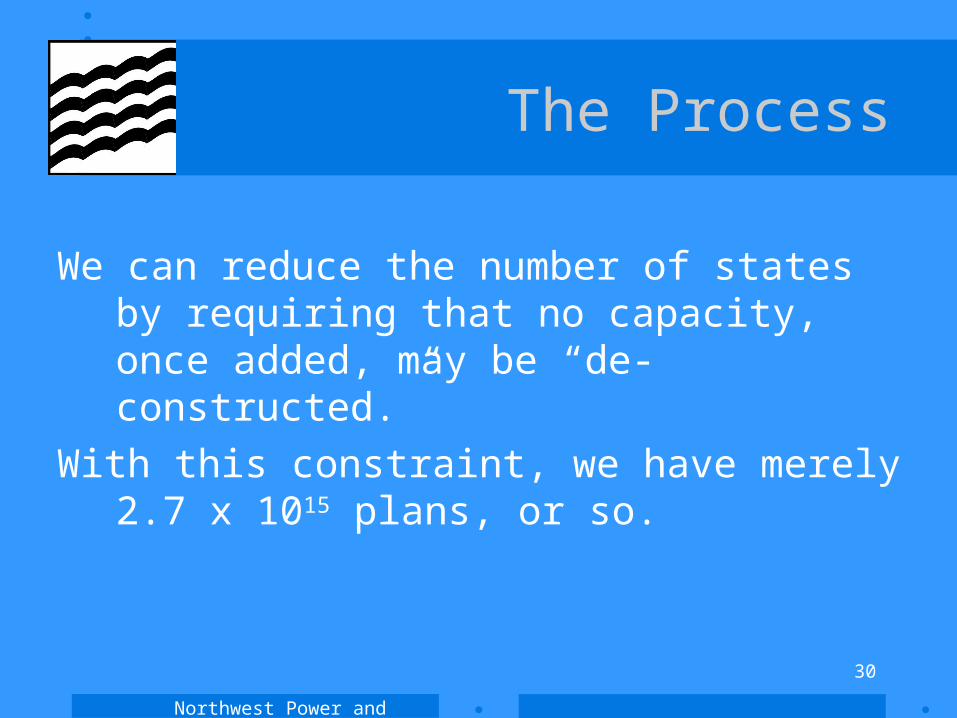
The Process
We can reduce the number of states by requiring that no capacity, once added, may be “de-constructed.”
With this constraint, we have merely 2.7 x 10¹⁵ plans, or so.

Northwest Power and Conservation Council
31
Finding the Efficient Frontier
The solution?
Use a stochastic optimization program
Northwest Power and Conservation Council
32
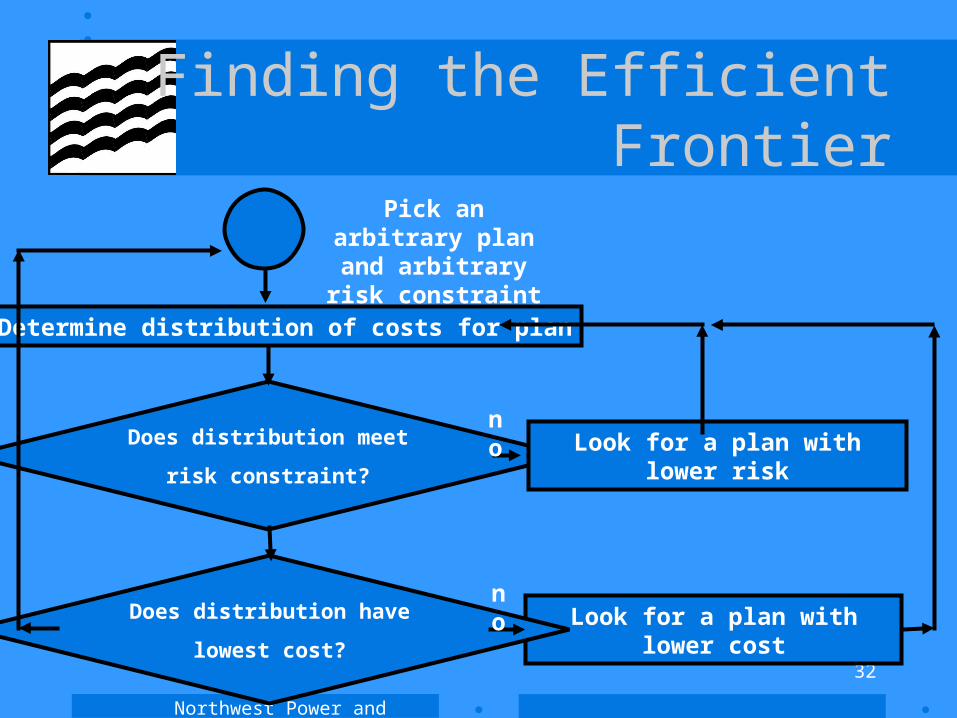
Finding the Efficient Frontier
Does distribution meet
risk constraint?
Pick an arbitrary plan and arbitrary
risk constraint
Determine distribution of costs for plan
Look for a plan with lower cost
Look for a plan with lower risk
Does distribution have
lowest cost?
no
no
Northwest Power and Conservation Council
33
Agenda
• Welcome Back!• Overview of methods• Presentation of candidate plan• Models and modeling
– Trade-Off: The construction of the efficient frontier– Estimating the distributions– Examination of futures– Representation of resources– Load/Resource balance
• Algorithms• Next meeting
Northwest Power and Conservation Council
34
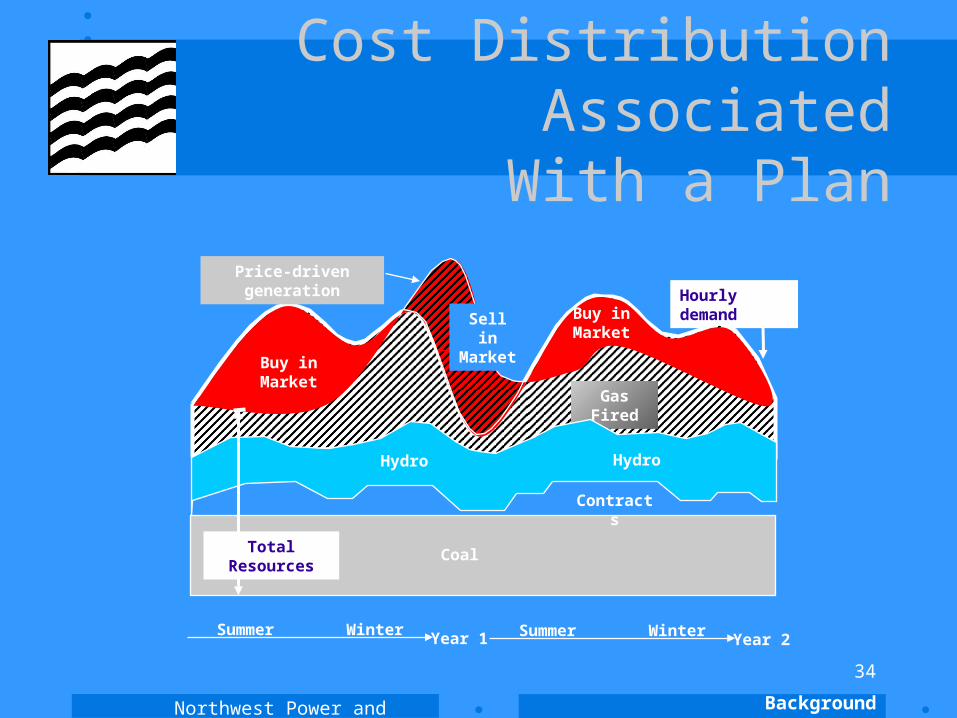
Cost Distribution AssociatedWith a Plan
Hourly demand
Coal
Buy in Market
Buy in Market
Sell in Market
Gas Fired
Price-driven generation
Hydro
Contracts
Hydro
Total Resources
Year 1Summer Winter
Year 2Summer Winter
Background
Northwest Power and Conservation Council
35
Modeling Issues
• In principle, we could perform our calculation on an hour-by-hour basis
• Time to make one of those “order-of-magnitude” calculations!
Northwest Power and Conservation Council
36
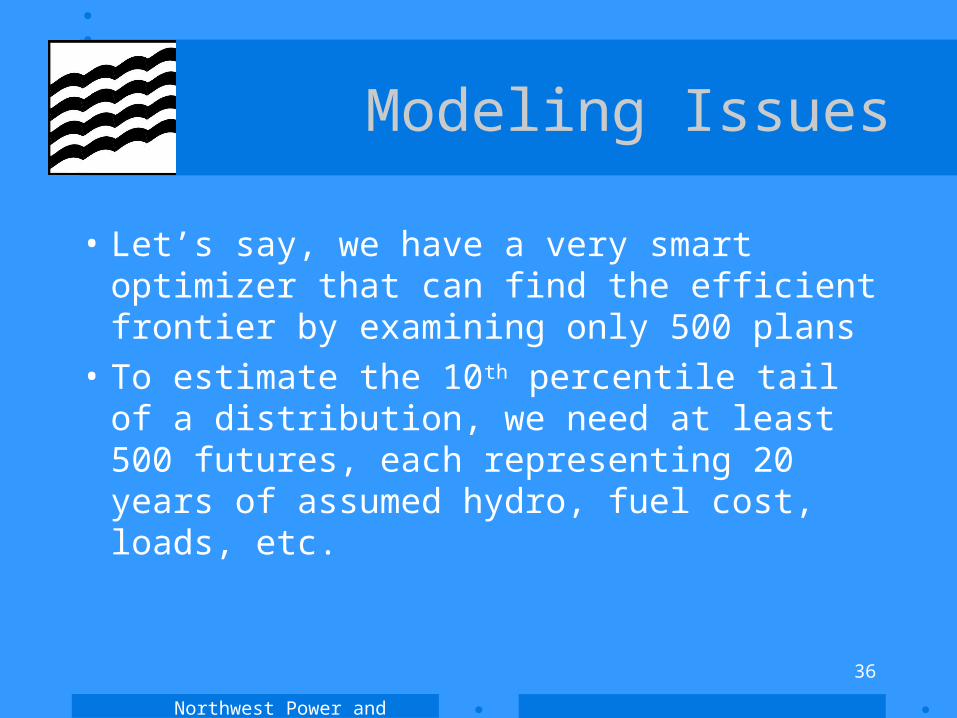
Modeling Issues
• Let’s say, we have a very smart optimizer that can find the efficient frontier by examining only 500 plans
• To estimate the 10th percentile tail of a distribution, we need at least 500 futures, each representing 20 years of assumed hydro, fuel cost, loads, etc.
Northwest Power and Conservation Council
37
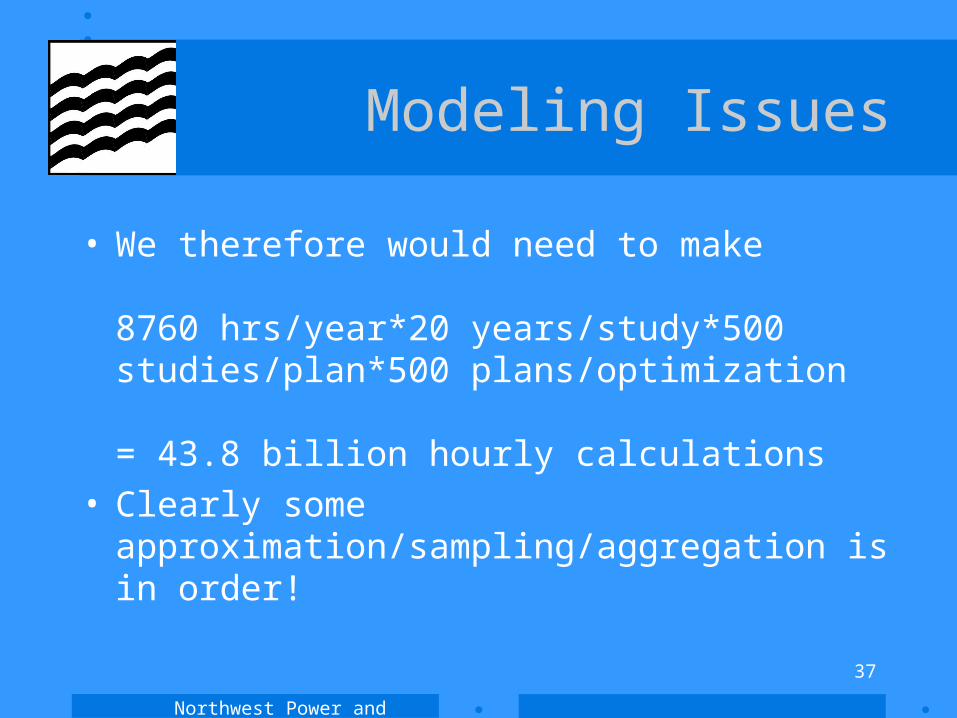
Modeling Issues
• We therefore would need to make
8760 hrs/year*20 years/study*500 studies/plan*500 plans/optimization
= 43.8 billion hourly calculations• Clearly some approximation/sampling/aggregation
is in order!
Northwest Power and Conservation Council
38
Modeling Issues
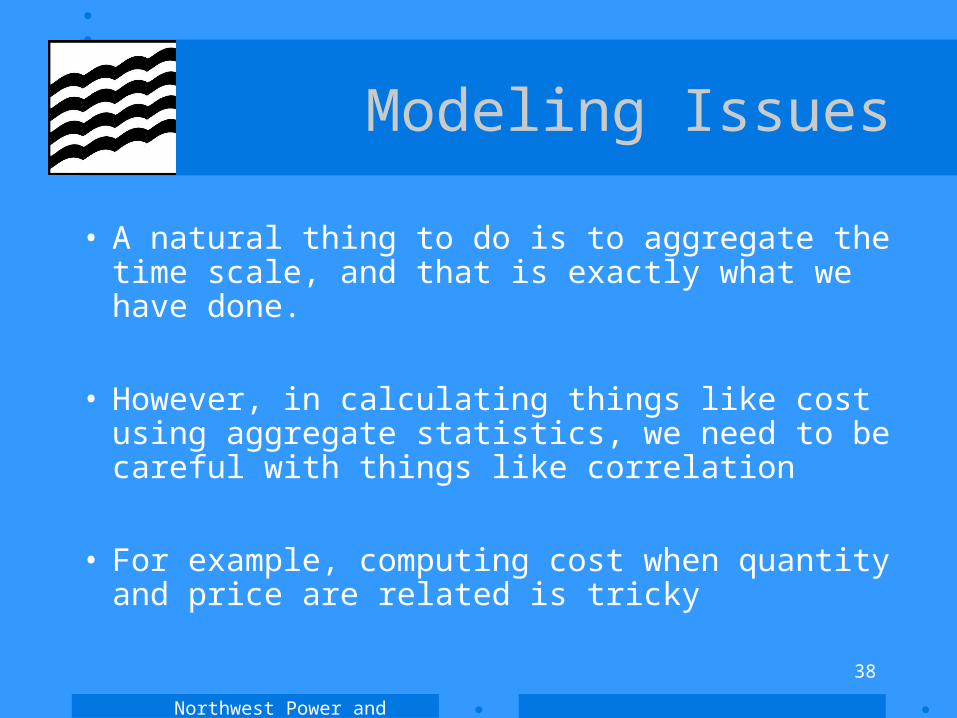
• A natural thing to do is to aggregate the time scale, and that is exactly what we have done.
• However, in calculating things like cost using aggregate statistics, we need to be careful with things like correlation
• For example, computing cost when quantity and price are related is tricky
Northwest Power and Conservation Council
39
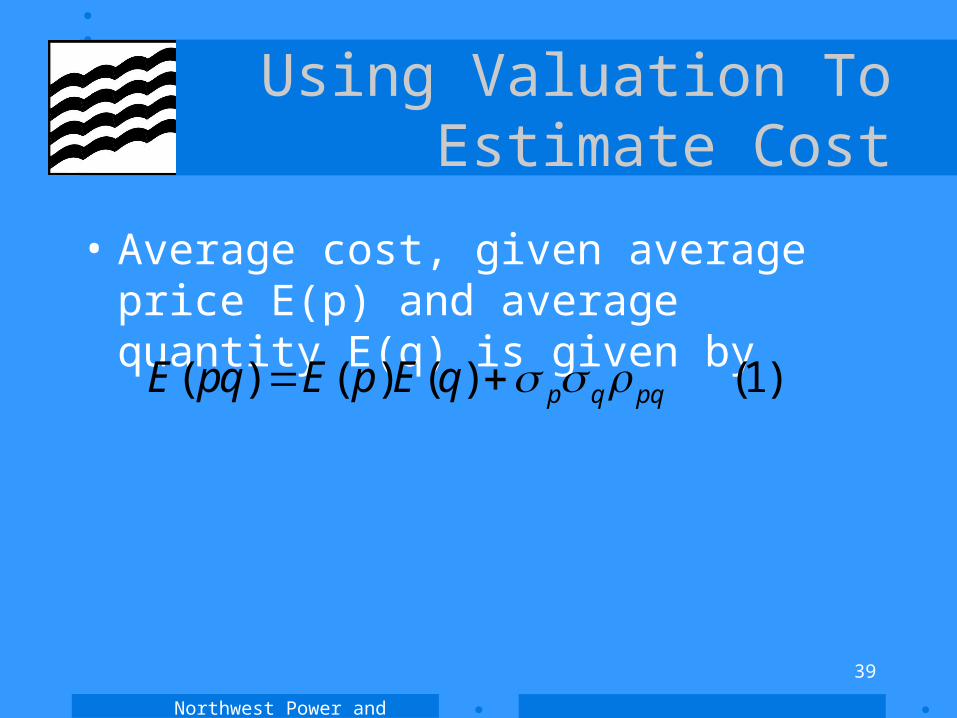
Using Valuation ToEstimate Cost
• Average cost, given average price E(p) and average quantity E(q) is given by
(1) )()()( pqqpqEpEpqE
Northwest Power and Conservation Council
40
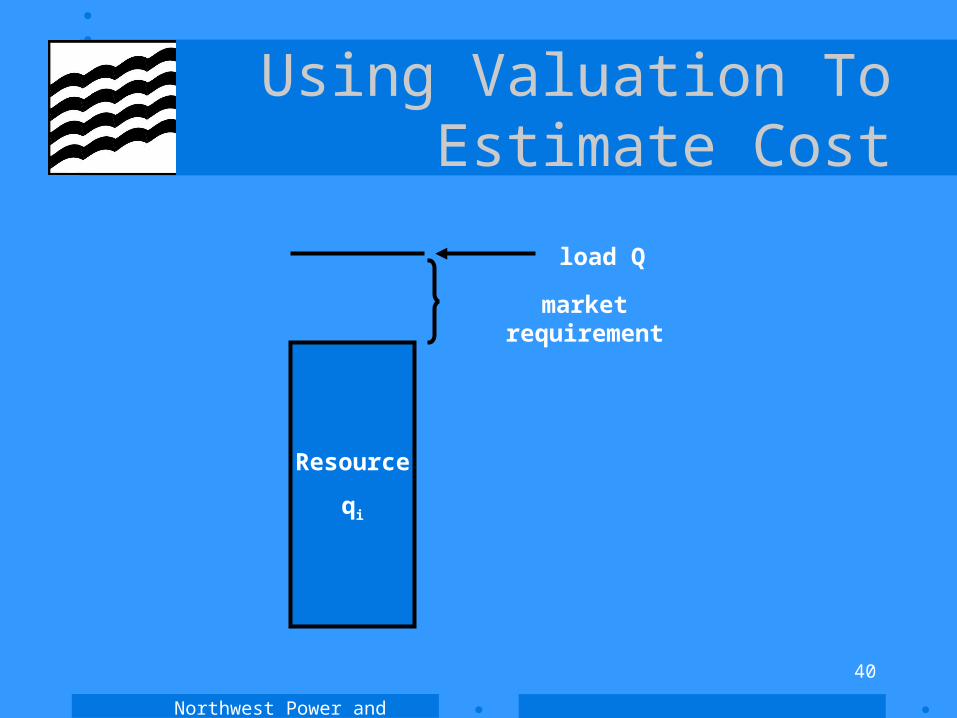
Using Valuation ToEstimate Cost
Resource
qi
load Q
market requirement
Northwest Power and Conservation Council
41
Using Valuation ToEstimate Cost
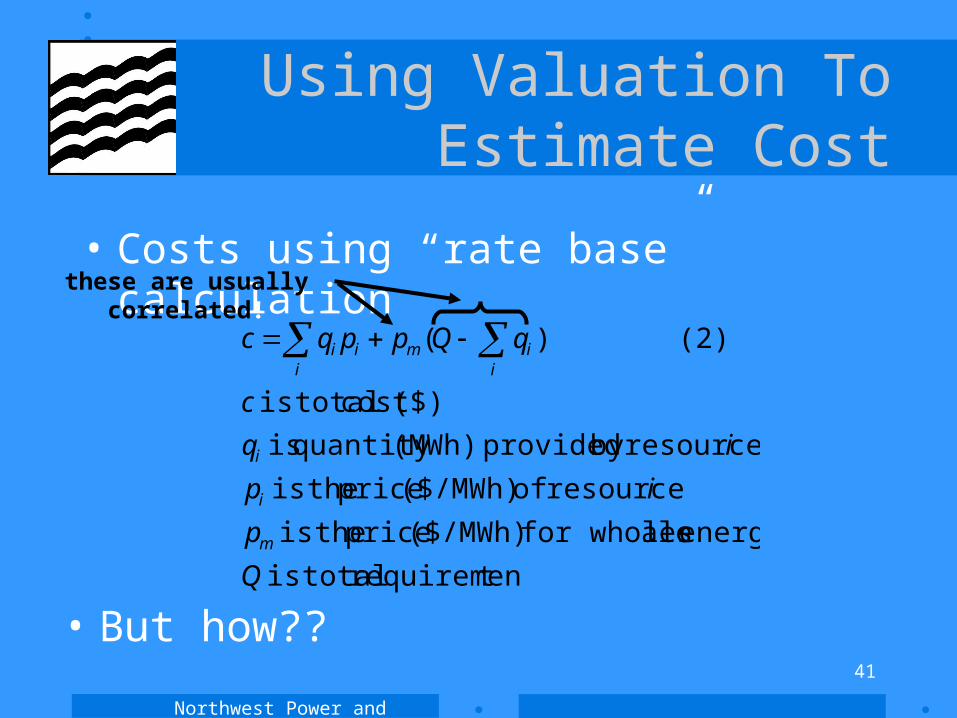
• Costs using “rate base” calculation
trequiremen totalis
energy alefor wholes ($/MWh) price theis
resource of ($/MWh) price theis
resourceby provided (MWh)quantity is
($)cost totalis
(2) )(
Q
p
ip
iq
c
qQppqc
m
i
i
iim
iii
these are usually correlated!
• But how??
Northwest Power and Conservation Council
42
Using Valuation ToEstimate Cost
• Costs using “valuation” calculation
)(
*
)(
imi
im
iii
iimm
iim
iii
ppqQp
pqqpQp
qQppqc
Northwest Power and Conservation Council
43
Using Valuation ToEstimate Cost
• The valuation formula simplifies the cost calculation, because we only have to consider how each resource’s cost and dispatch relate to the market (rather than to each other)– electric market price to total loads (probably strongly
positively correlated)– electric market price to wind generation (uncorrelated)– electric market price to turbine generation (directly
related to correlation with fuel price)
Northwest Power and Conservation Council
44
Our calculation times
• Recall the purpose of all this was to make our calculation times more manageable....
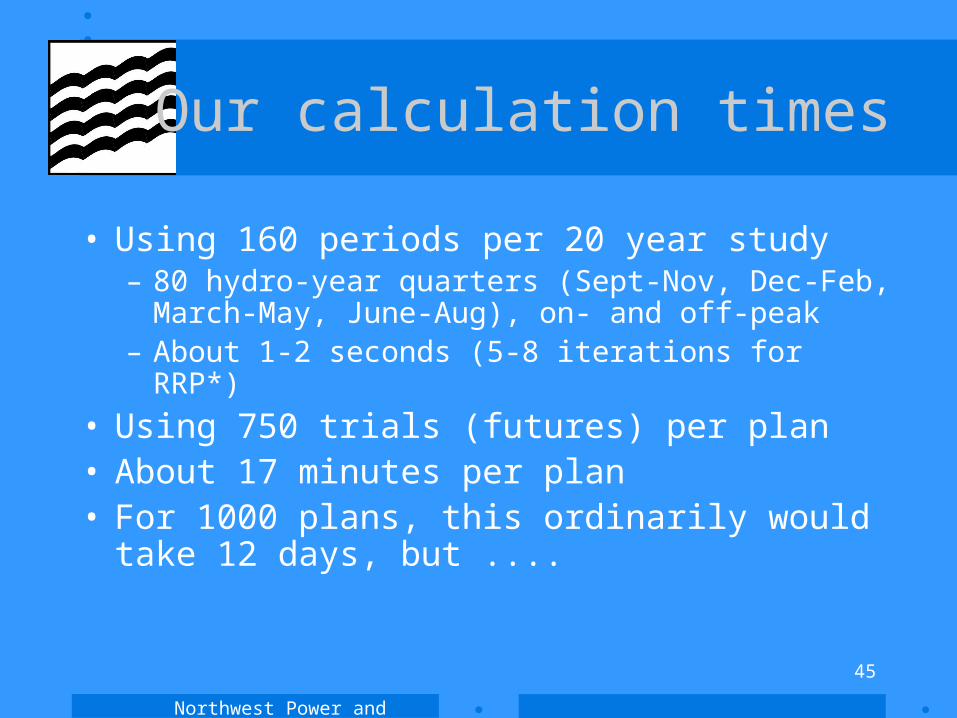
Northwest Power and Conservation Council
45
Our calculation times
• Using 160 periods per 20 year study– 80 hydro-year quarters (Sept-Nov, Dec-Feb, March-May,
June-Aug), on- and off-peak– About 1-2 seconds (5-8 iterations for RRP*)
• Using 750 trials (futures) per plan• About 17 minutes per plan• For 1000 plans, this ordinarily would take 12 days,
but ....
Northwest Power and Conservation Council
46
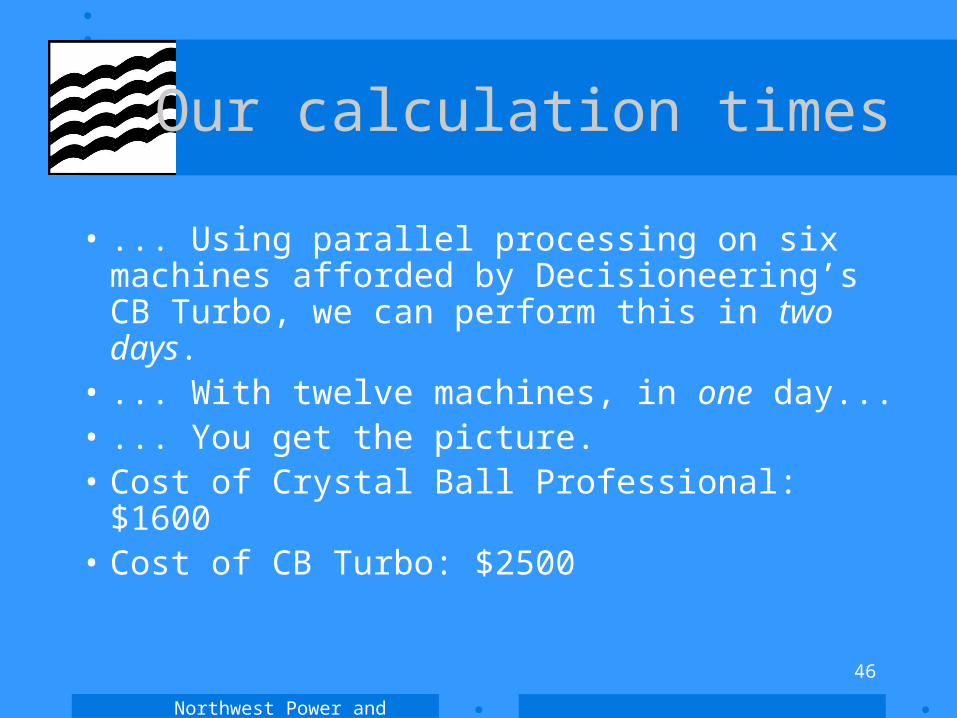
Our calculation times
• ... Using parallel processing on six machines afforded by Decisioneering’s CB Turbo, we can perform this in two days.
• ... With twelve machines, in one day...• ... You get the picture.• Cost of Crystal Ball Professional: $1600• Cost of CB Turbo: $2500
Northwest Power and Conservation Council
47
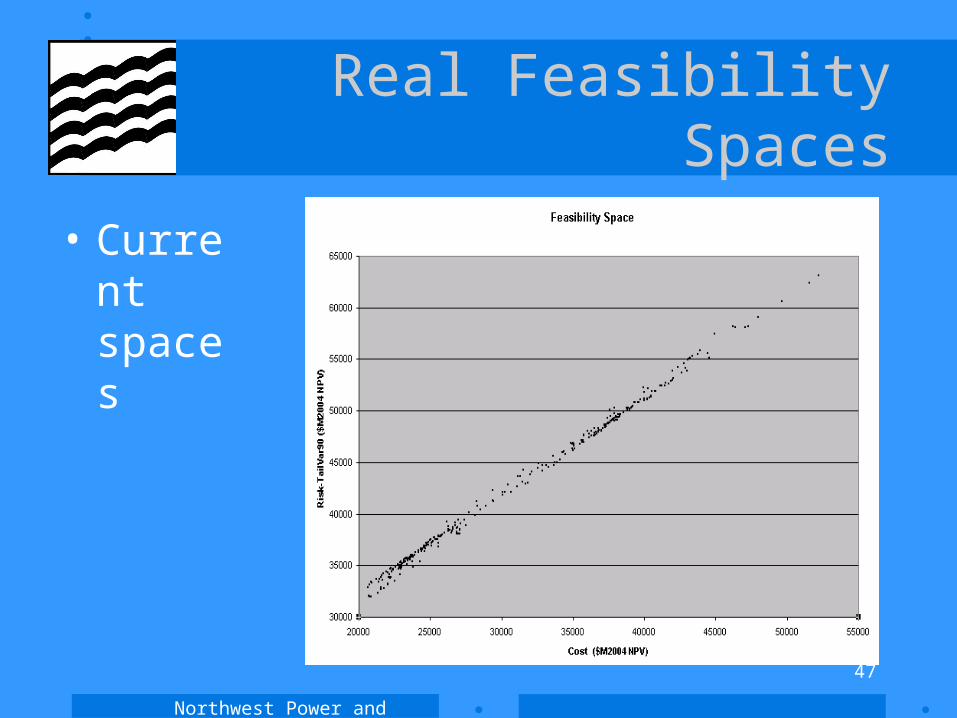
Real Feasibility Spaces
• Current spaces
Northwest Power and Conservation Council
48
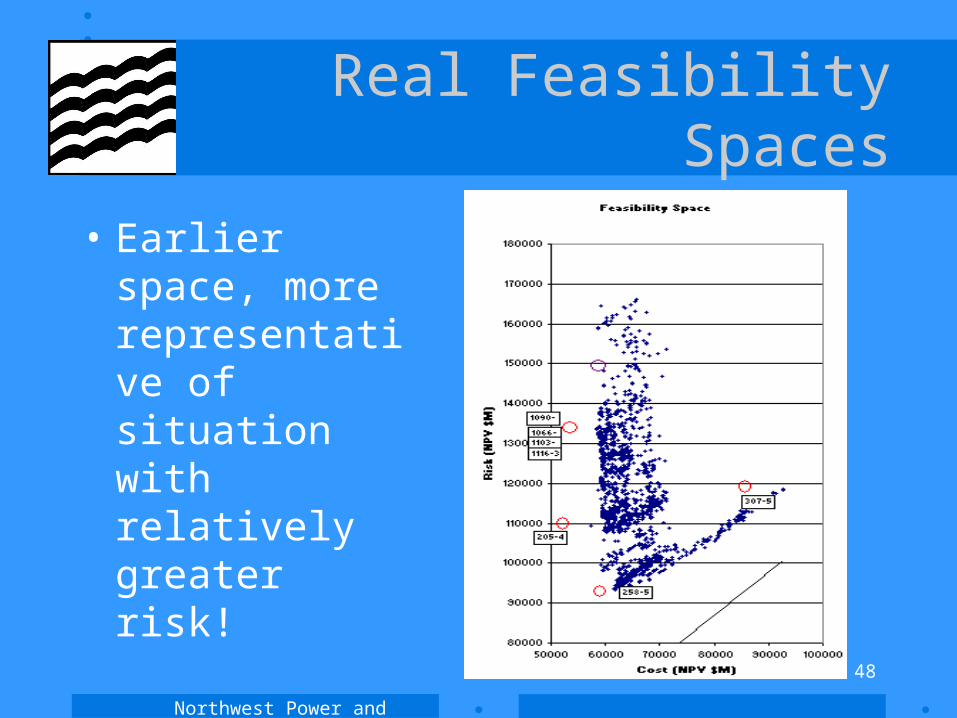
Real Feasibility Spaces
• Earlier space, more representative of situation with relatively greater risk!
Northwest Power and Conservation Council
49
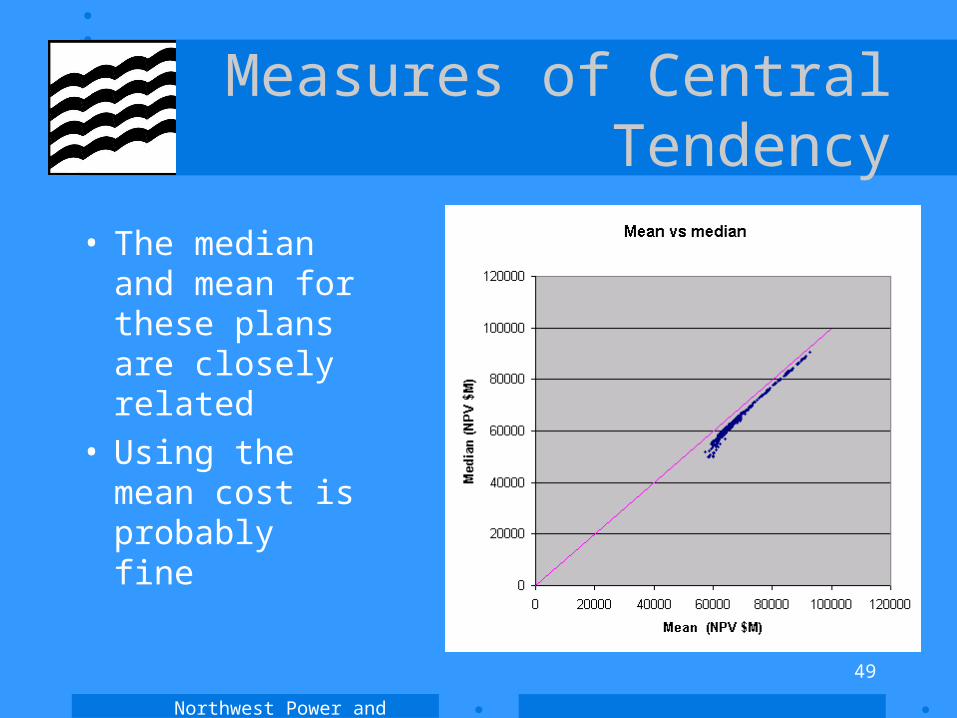
Measures of Central Tendency
• The median and mean for these plans are closely related
• Using the mean cost is probably fine
Northwest Power and Conservation Council
50
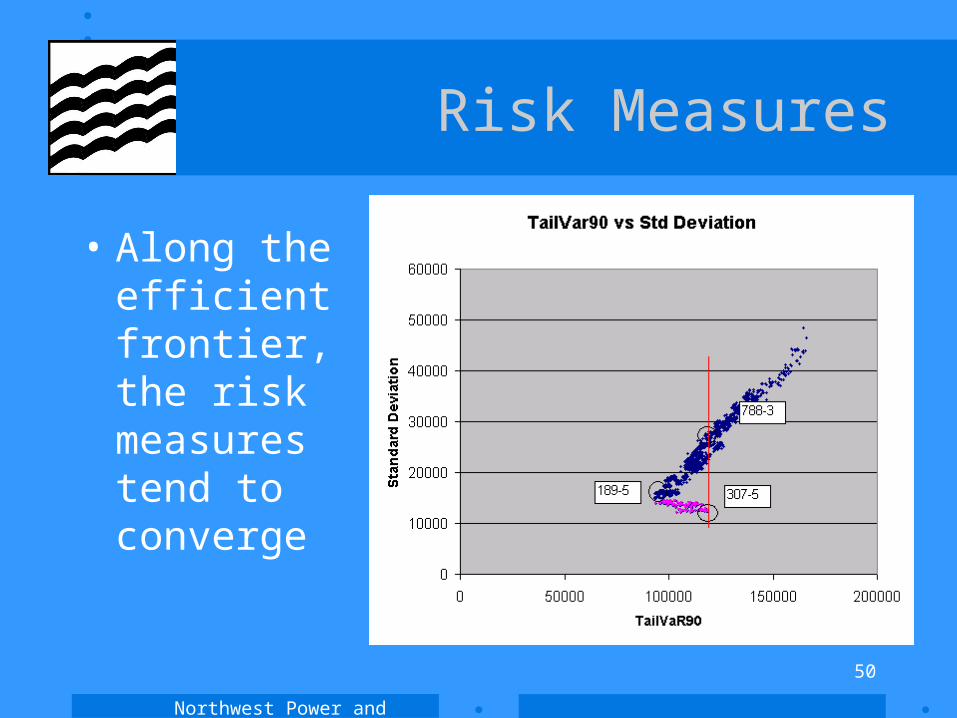
Risk Measures
• Along the efficient frontier, the risk measures tend to converge
Northwest Power and Conservation Council
51
Risk Measures
• Along the efficient frontier, the risk measures tend to converge

Northwest Power and Conservation Council
52
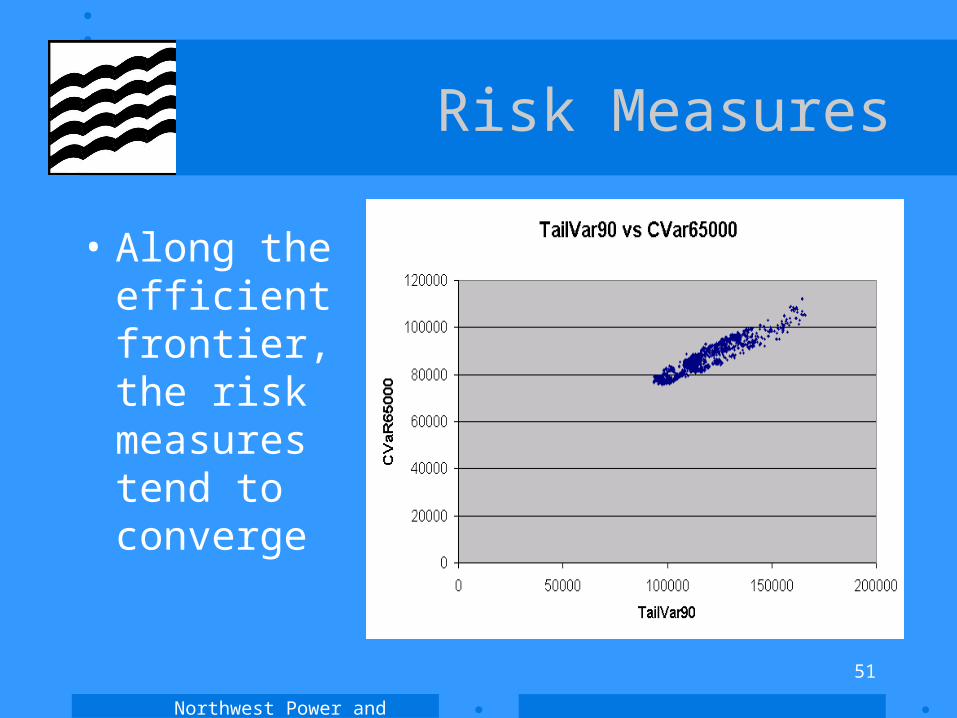
Risk Measures
• Along the efficient frontier, the risk measures tend to converge
Northwest Power and Conservation Council
53
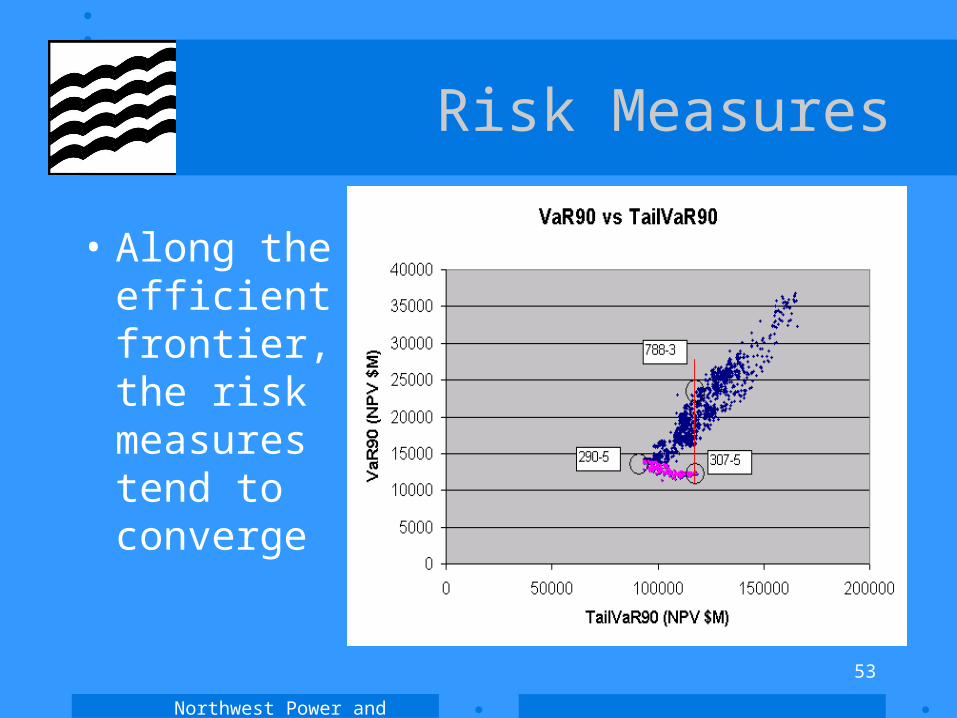
Risk Measures
• Along the efficient frontier, the risk measures tend to converge
Northwest Power and Conservation Council
54
Our Models
• The meta-model: Olivia
• The portfolio model: Olivia’s “daughter”
Northwest Power and Conservation Council
55
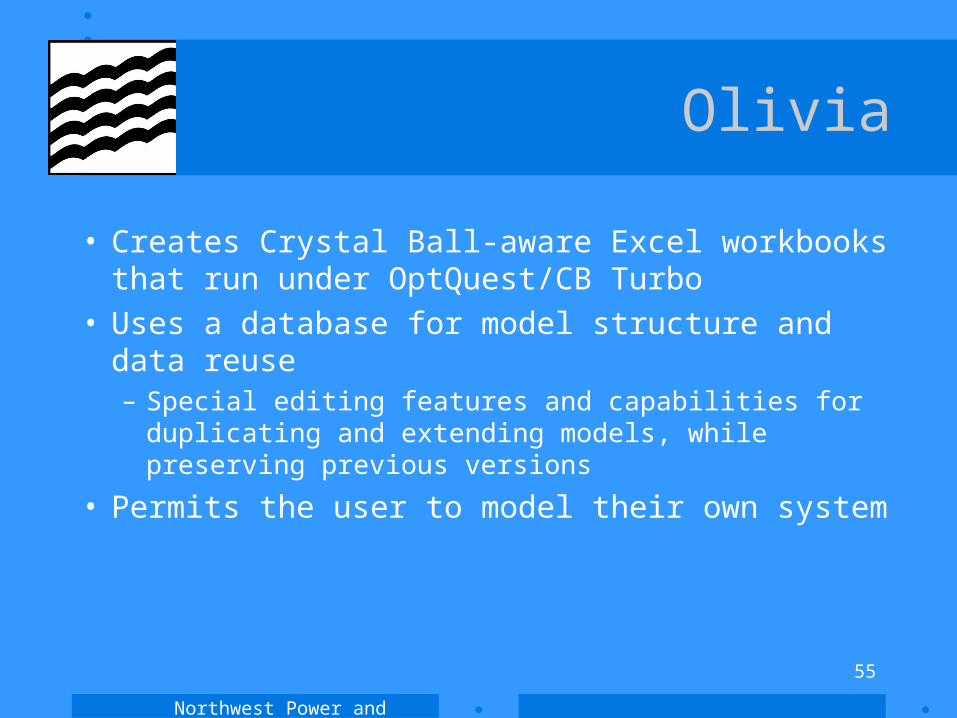
Olivia
• Creates Crystal Ball-aware Excel workbooks that run under OptQuest/CB Turbo
• Uses a database for model structure and data reuse– Special editing features and capabilities for duplicating
and extending models, while preserving previous versions
• Permits the user to model their own system
Northwest Power and Conservation Council
56
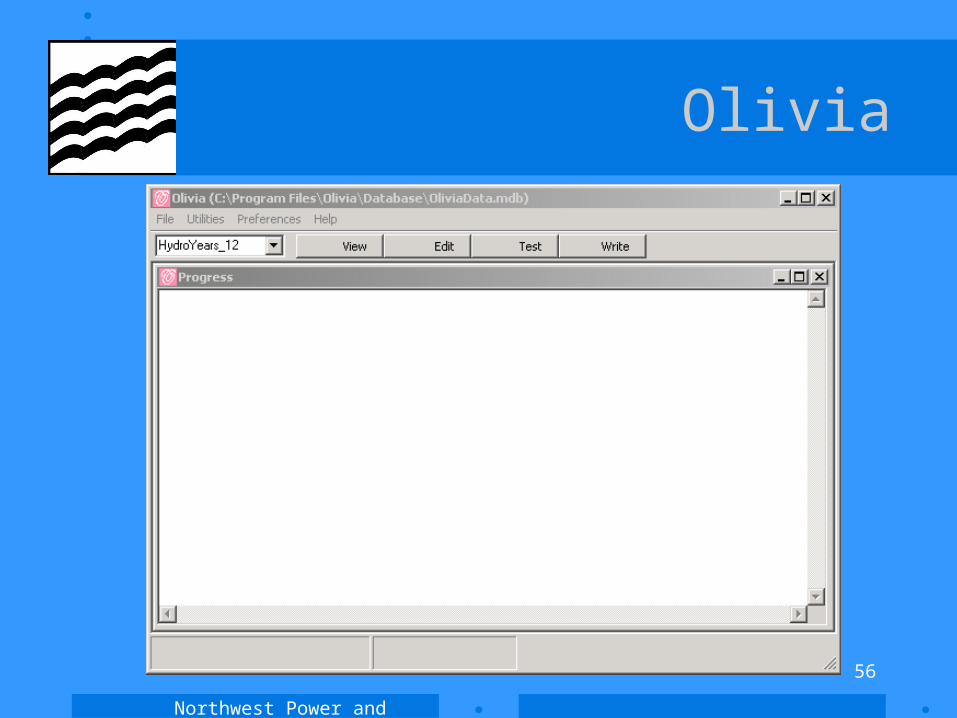
Olivia
Northwest Power and Conservation Council
57
Olivia
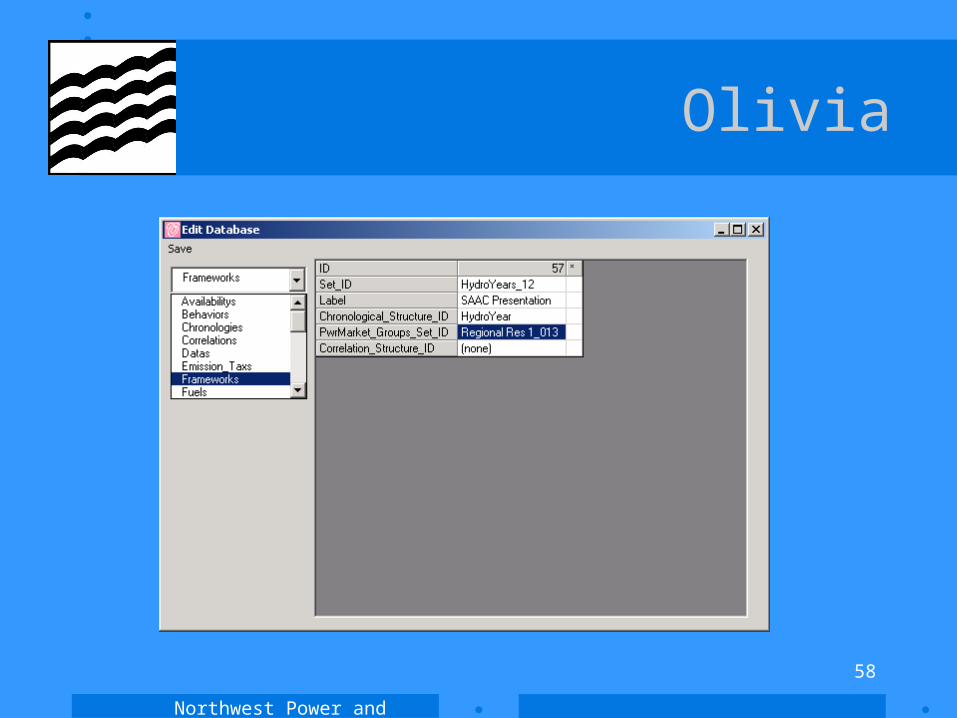
Northwest Power and Conservation Council
58
Olivia
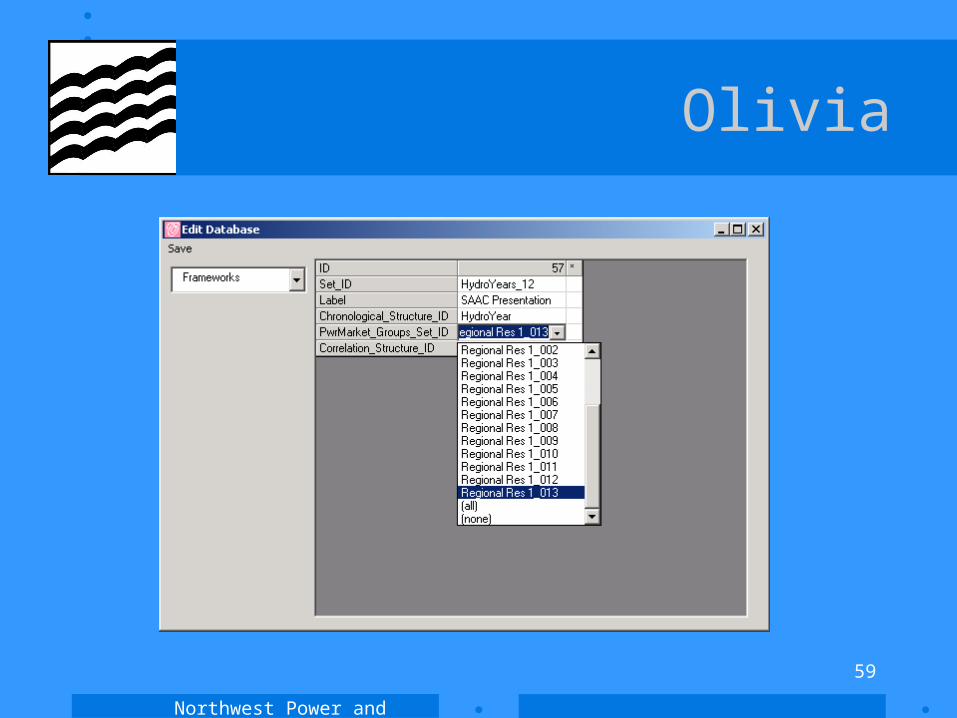
Northwest Power and Conservation Council
59
Olivia
Northwest Power and Conservation Council
60
Olivia
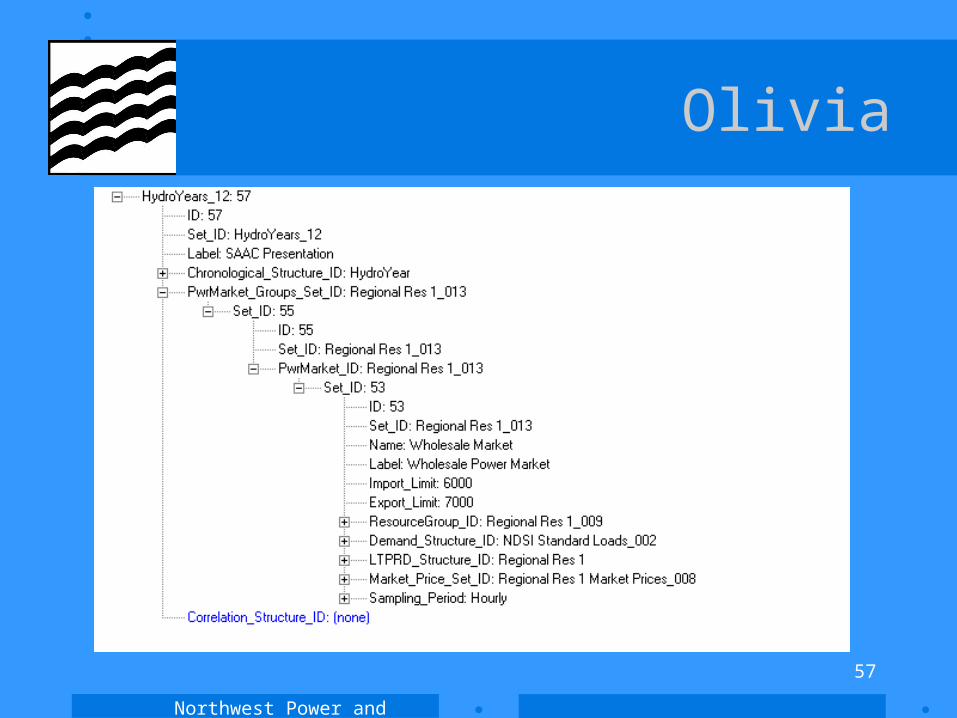
• The relationship among records in the database reflects the structure of calculations in an Excel workbook Structure.pdf
Northwest Power and Conservation Council
61
Olivia’s Daughter
• The Crystal Ball-aware Excel workbook that run under OptQuest/CB Turbo is the “Portfolio model,” or “Olivia’s daughter”
• Current regional model (L4.xls) has– 80 hydro quarters, on- and off-peak– One region– Imports and exports of 4000 MWa– 30 resources, including hydro, commercial hydro response,
conservation supply curves for lost opportunity conservation and “dispatchable” conservation, smelter response to aluminum and power prices, planning flex .....

Northwest Power and Conservation Council
62
Agenda
• Welcome Back!• Overview of methods• Presentation of candidate plan• Models and modeling
– Trade-Off: The construction of the efficient frontier– Estimating the distributions– Examination of futures– Representation of resources– Load/Resource balance
• Algorithms• Next meeting
Northwest Power and Conservation Council
63
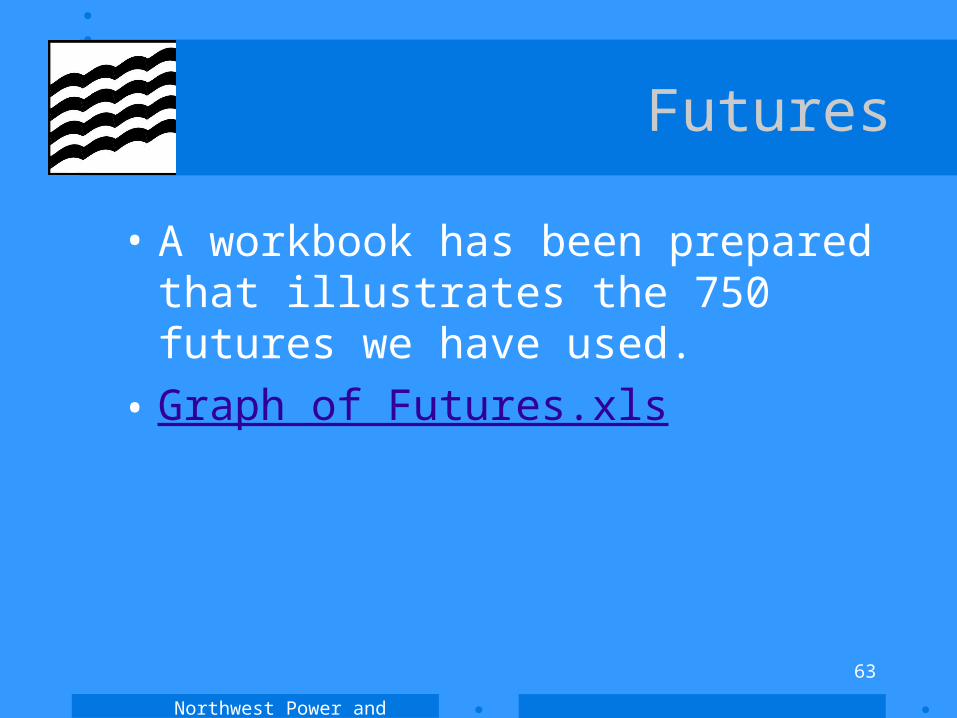
Futures
• A workbook has been prepared that illustrates the 750 futures we have used.
• Graph of Futures.xls

Northwest Power and Conservation Council
64
Agenda
• Welcome Back!• Overview of methods• Presentation of candidate plan• Models and modeling
– Trade-Off: The construction of the efficient frontier– Estimating the distributions– Examination of futures– Representation of resources– Load/Resource balance
• Algorithms• Next meeting
Northwest Power and Conservation Council
65
Representation of resources
• How are the main resource candidates represented in this model?
Northwest Power and Conservation Council
66
Agenda
• Welcome Back!• Overview of methods• Presentation of candidate plan• Models and modeling
– Trade-Off: The construction of the efficient frontier– Estimating the distributions– Examination of futures– Representation of resources– Load/Resource balance
• Algorithms• Next meeting
Northwest Power and Conservation Council
67
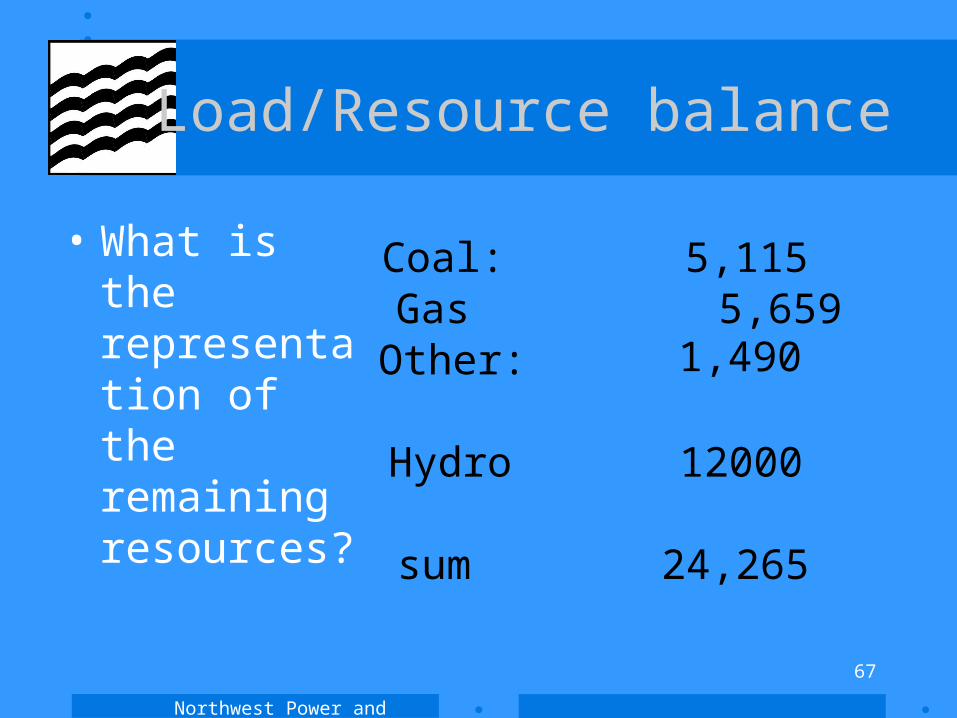
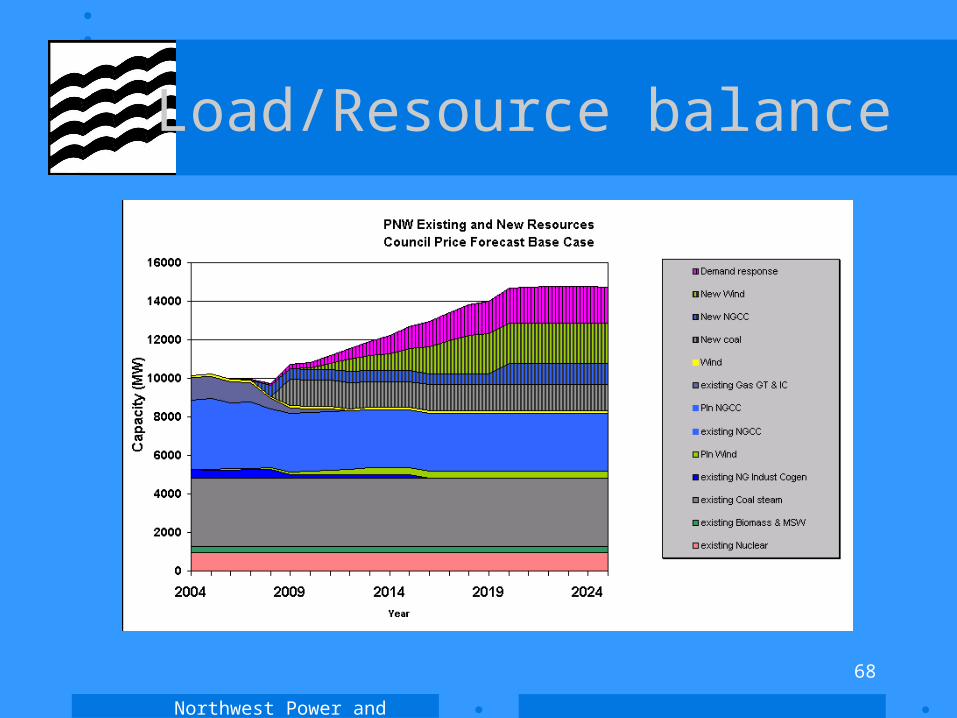
Load/Resource balance
• What is the representation of the remaining resources?
Coal: 5,115Gas 5,659Other: 1,490
Hydro 12000
sum 24,265
Northwest Power and Conservation Council
68
Load/Resource balance
Northwest Power and Conservation Council
69
Agenda
• Welcome Back!• Overview of methods• Presentation of candidate plan• Models and modeling• Algorithms
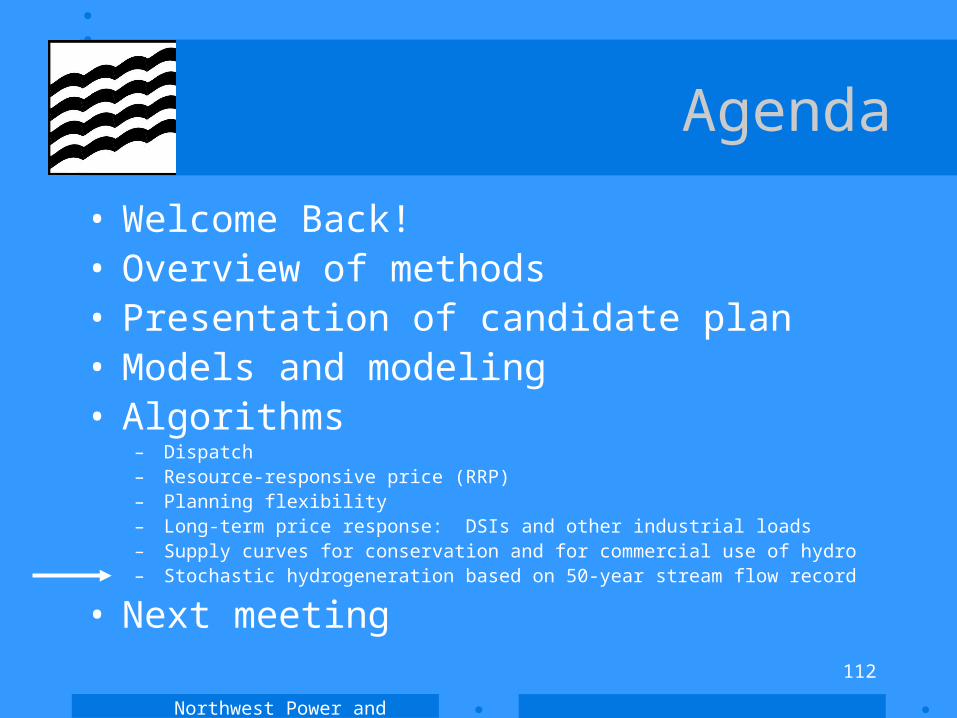
– Dispatch– Resource-responsive price (RRP)– Planning flexibility– Long-term price response: DSIs and other industrial loads– Supply curves for conservation and for commercial use of hydro– Stochastic hydrogeneration based on 50-year stream flow record
• Next meeting
Northwest Power and Conservation Council
70
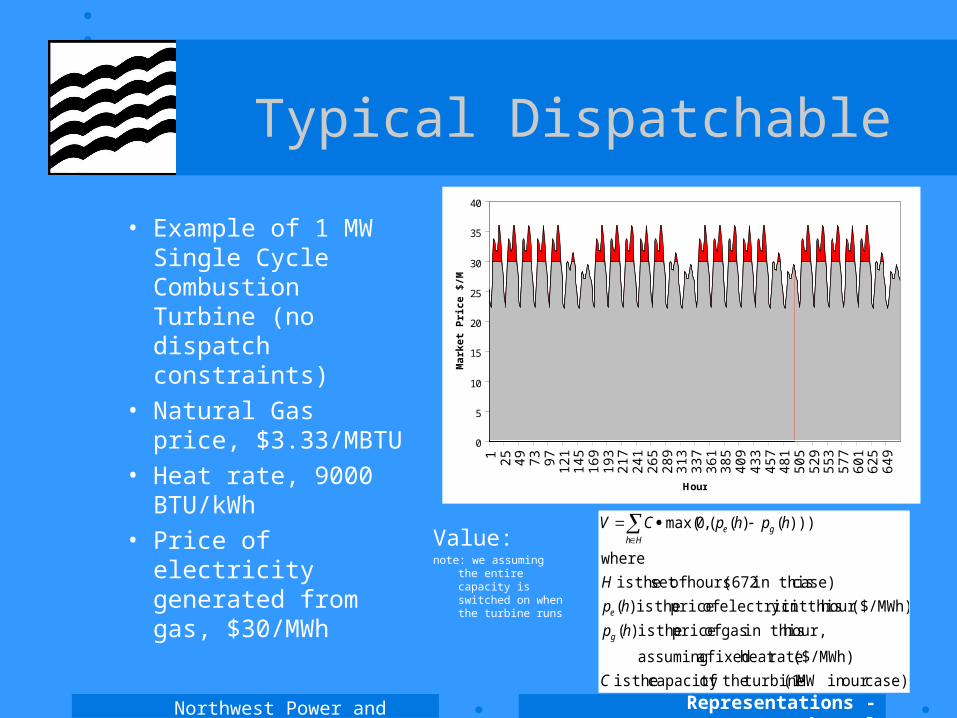
Typical Dispatchable
• Example of 1 MW Single Cycle Combustion Turbine (no dispatch constraints)
• Natural Gas price, $3.33/MBTU
• Heat rate, 9000 BTU/kWh
• Price of electricity generated from gas, $30/MWh
Representations - thermal
0
5
10
15
20
25
30
35
40
1 25 49 73 97 121
145
169
193
217
241
265
289
313
337
361
385
409
433
457
481
505
529
553
577
601
625
649
Hour
Mar
ket
Pri
ce $
/MW
h
Value:note: we assuming the
entire capacity is switched on when the turbine runs
case)our in MW (1 turbine theofcapacity theis
($/MWh) rateheat fixed a assuming
hour, in this gas of price theis )(
($/MWh)hour in thisy electricit of price theis )(
case) in this (672 hours ofset theis
where
)))()((,0max(
C
hp
hp
H
hphpCV
g
e
Hhge
Northwest Power and Conservation Council
71
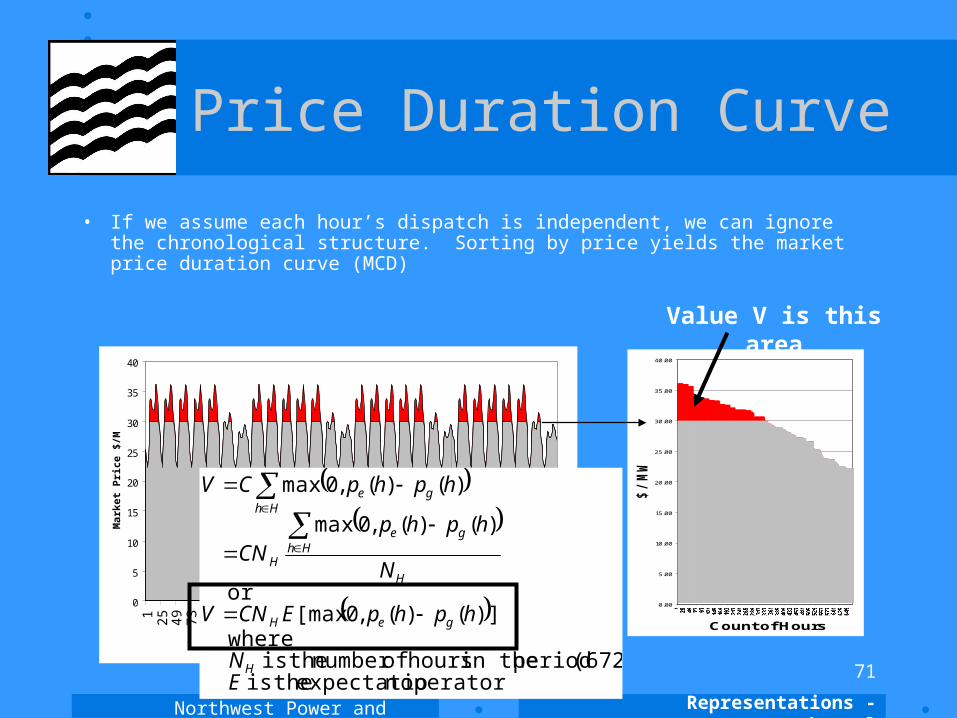
Price Duration Curve
• If we assume each hour’s dispatch is independent, we can ignore the chronological structure. Sorting by price yields the market price duration curve (MCD)
0
5
10
15
20
25
30
35
40
1 25 49 73 97 121
145
169
193
217
241
265
289
313
337
361
385
409
433
457
481
505
529
553
577
601
625
649
Hour
Mar
ket
Pri
ce $
/MW
h
0.00
5.00
10.00
15.00
20.00
25.00
30.00
35.00
40.00
Count of Hours
$/M
Wh
Value V is this area
Representations - thermal
operatorn expectatio theis (672) period in the hours ofnumber theis
where])()(,0[max
or
)()(,0max
)()(,0max
EN
hphpECNV
N
hphpCN
hphpCV
H
geH
H
Hhge
H
Hhge
Northwest Power and Conservation Council
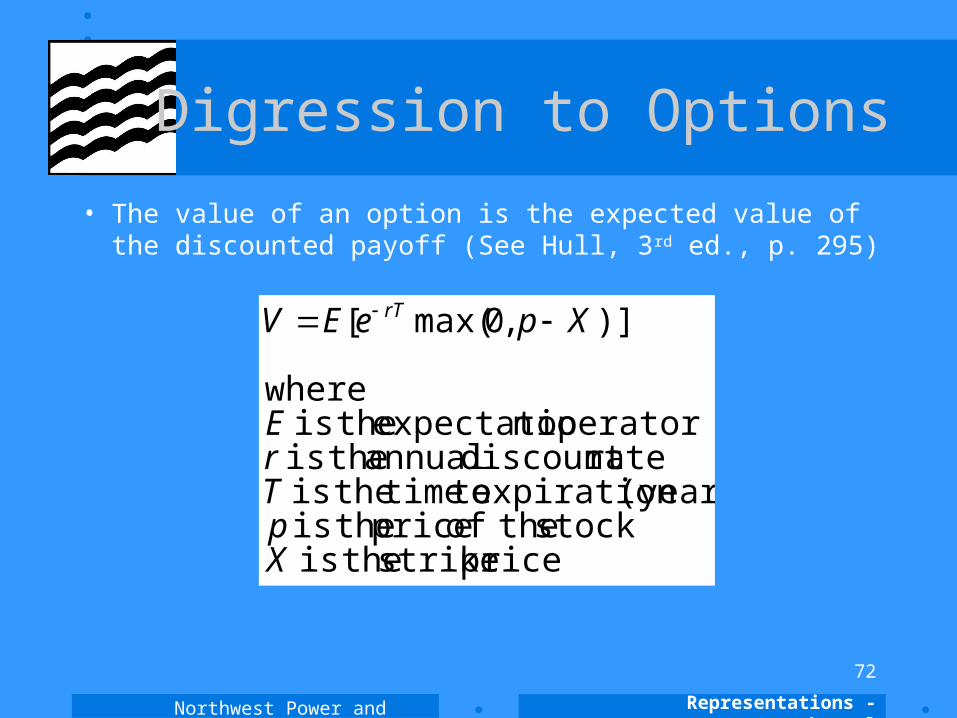
72
Digression to Options
• The value of an option is the expected value of the discounted payoff (See Hull, 3rd ed., p. 295)
Representations - thermal
price strike theis stock theof price theis
(years) expiration to time theis ratediscount annual theis
operatorn expectatio theis where
)],0max([
XpTrE
XpeEV rT
Northwest Power and Conservation Council
73
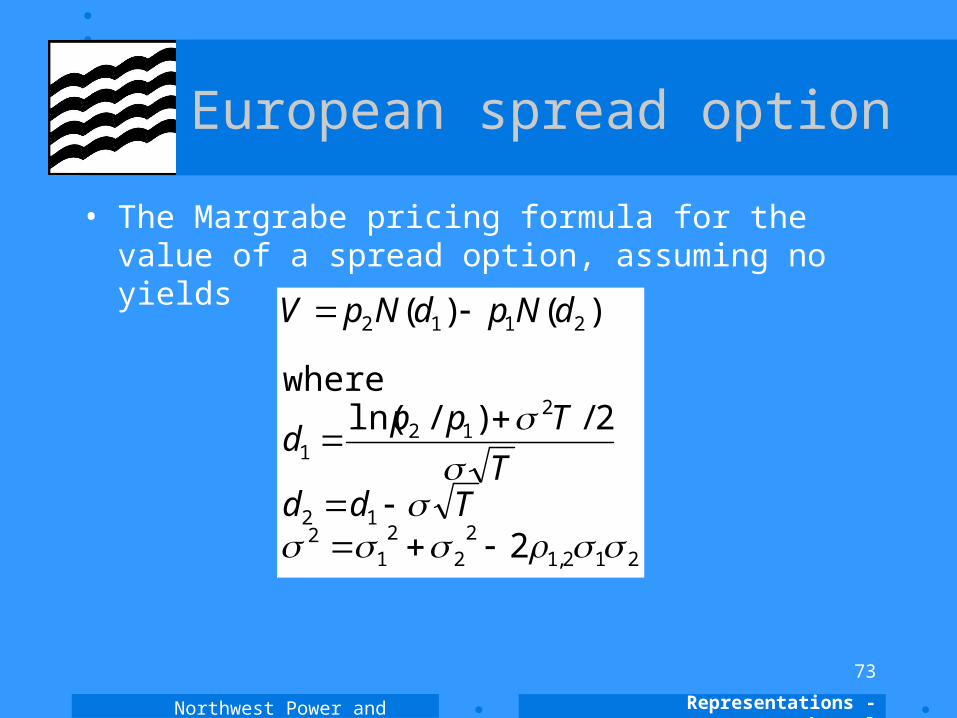
European spread option
• The Margrabe pricing formula for the value of a spread option, assuming no yields
Representations - thermal
212,12
22
12
12
212
1
2112
2
2/)/ln(where
)()(
TddT
Tppd
dNpdNpV
Northwest Power and Conservation Council
74
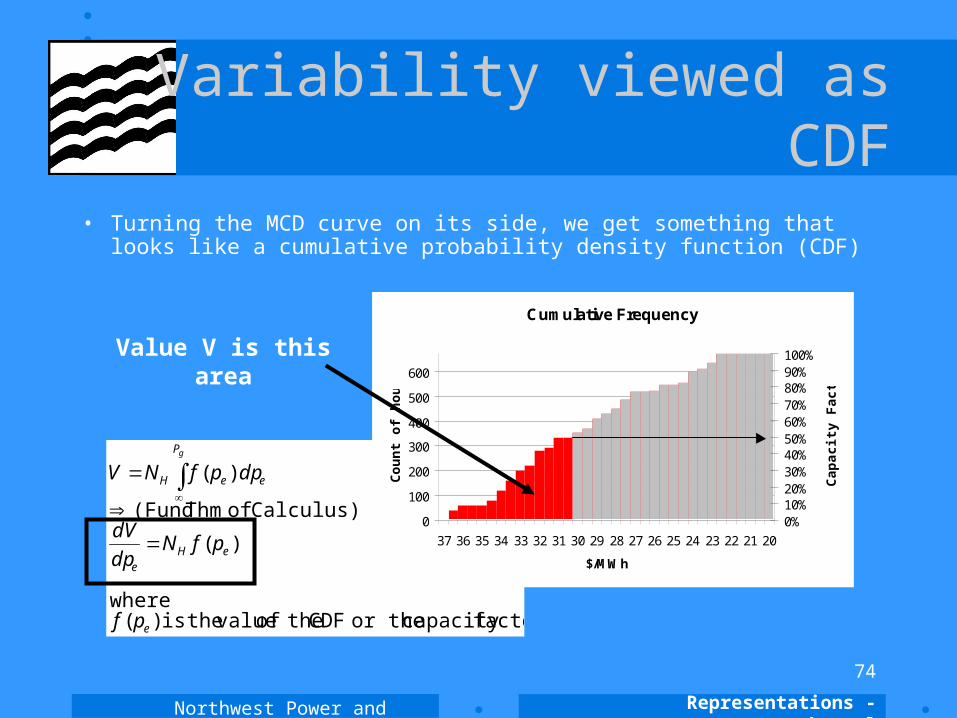
Variability viewed as CDF
• Turning the MCD curve on its side, we get something that looks like a cumulative probability density function (CDF)
Value V is this area
factorcapacity or the CDF theof value theis )(where
)(
Calculus) of Thm (Fund
)(
e
eHe
e
P
eH
pf
pfNdp
dV
dppfNVg
Cumulative Frequency
0
100
200
300
400
500
600
37 36 35 34 33 32 31 30 29 28 27 26 25 24 23 22 21 20
$/MWh
Co
un
t o
f h
ou
rs
0%10%20%30%40%50%60%70%80%90%100%
Cap
acit
y F
acto
r
Representations - thermal
Northwest Power and Conservation Council
75
Dispatch Model: Conclusion
– Thermal dispatch can be reasonably well using a spread call option on electricity and gas
– The monthly capacity factor of the thermal unit is provided by the “delta” of the option, that is, the change in the option’s price (value) with respect to the underlying spread
– The standard Black-Scholes model for option pricing gives a good estimate of the plant value and capacity factor, with these adjustments:
• The risk free discount rate r is 0• Time to maturity T=1• The hourly price volatility on ln(pt/pt-1) is
Representations - thermal
Northwest Power and Conservation Council
76
Example of Spread Option

Northwest Power and Conservation Council
77
Agenda
• Welcome Back!• Overview of methods• Presentation of candidate plan• Models and modeling• Algorithms
– Dispatch– Resource-responsive price (RRP)– Planning flexibility– Long-term price response: DSIs and other industrial loads– Supply curves for conservation and for commercial use of hydro– Stochastic hydrogeneration based on 50-year stream flow record
• Next meeting
Northwest Power and Conservation Council
78
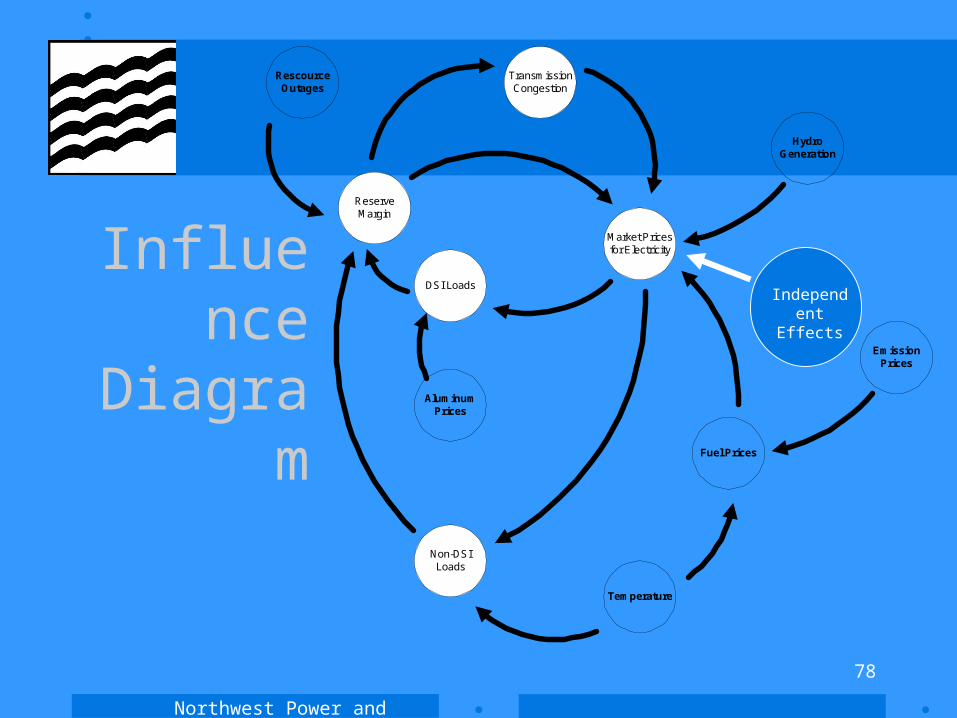
Influence Diagram
RescourceOutages
HydroGeneration
DSI Loads
Non-DSILoads
Market Pricesfor Electricity
AluminumPrices
ReserveMargin
Temperature
Fuel Prices
TransmissionCongestion
EmissionPrices
Independent Effects
Northwest Power and Conservation Council
79
Dependence on Influences
• Wholesales power prices as we currently model them reflect changes in– Natural Gas Prices in the PNW– Loads in the PNW (specifically on-peak loads)– Hydrogeneration
• Modeled as a sensitivity to these
Northwest Power and Conservation Council
80
Role of Independent Term
• Jumps and excursions unrelated to key fundamental drivers
• Unincorporated fundamental influences– e.g., new technology
• Unanticipated non-fundamentals– Policy changes
• e.g., price caps
– Psychology in the markets
Northwest Power and Conservation Council
81
Consequence of Independent Term
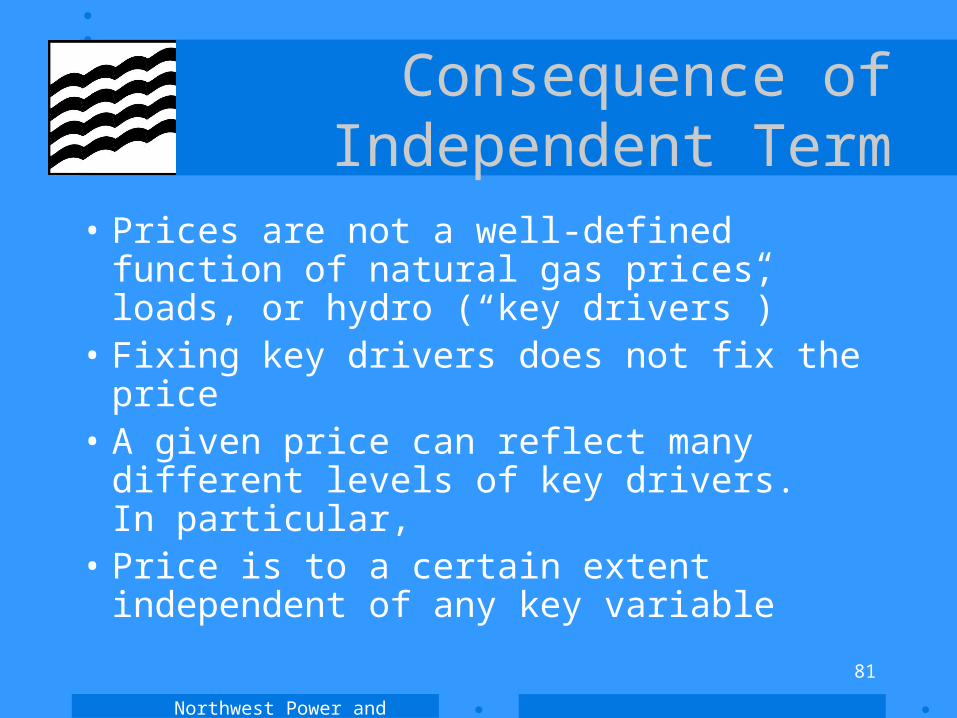
• Prices are not a well-defined function of natural gas prices, loads, or hydro (“key drivers”)
• Fixing key drivers does not fix the price• A given price can reflect many different
levels of key drivers. In particular,• Price is to a certain extent independent of
any key variable
Northwest Power and Conservation Council
82
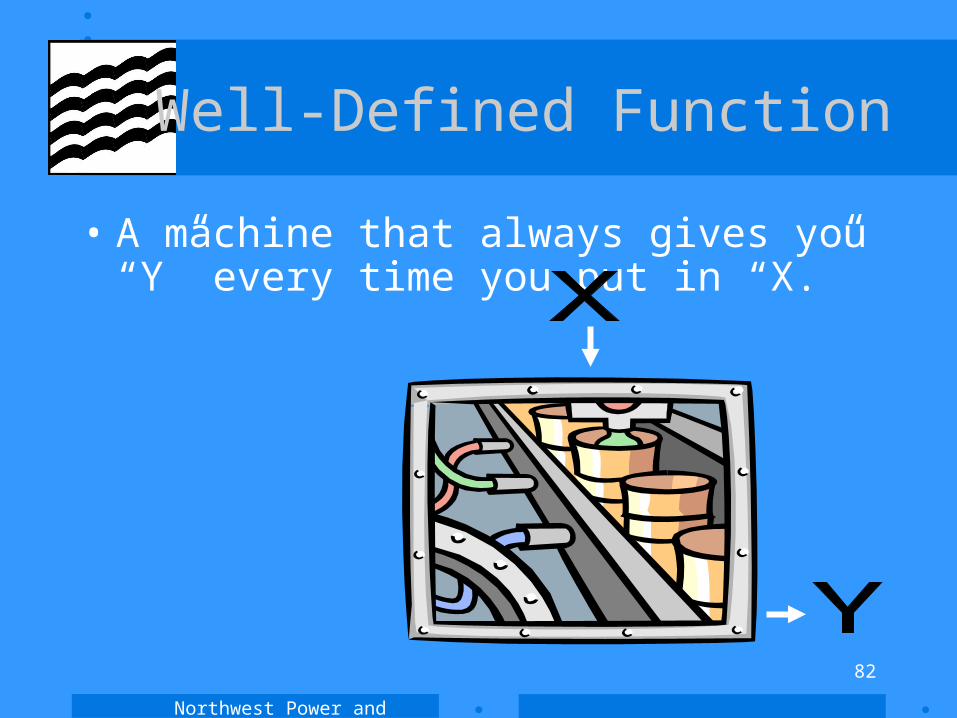
Well-Defined Function
• A machine that always gives you “Y” every time you put in “X.”
Northwest Power and Conservation Council
83
Problems
• In an open system, such as for a single market participant, who is a price taker, all this works fine. But...
• Intuition tells us that in a closed, or partially closed system, price should be a function of resources available.
• If resource generation is responsive to price, and prices are not driven by supply and demand balance, we will violate the first law of thermodynamics.
• If capacity expansion decisions are made based on revenues in the market, there is no self-limiting due to over building.
Northwest Power and Conservation Council
84
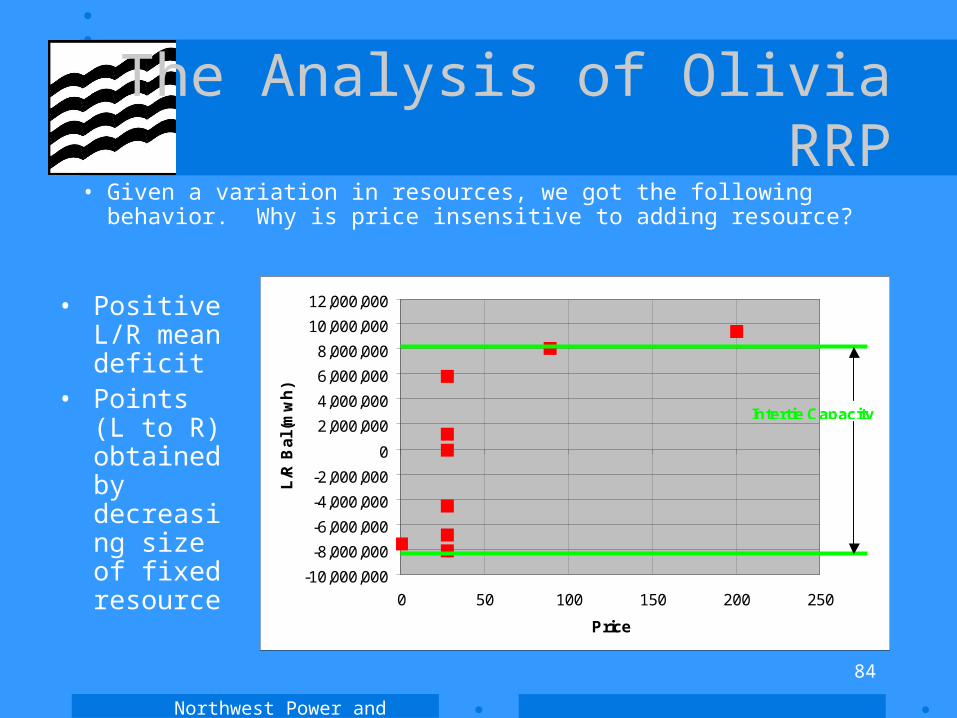
The Analysis of Olivia RRP• Given a variation in resources, we got the following
behavior. Why is price insensitive to adding resource?
-10,000,000
-8,000,000
-6,000,000
-4,000,000
-2,000,000
0
2,000,000
4,000,000
6,000,000
8,000,000
10,000,000
12,000,000
0 50 100 150 200 250
Price
L/R
Ba
l (m
wh
)
Intertie Capacity
• Positive L/R mean deficit
• Points (L to R) obtained by decreasing size of fixed resource
Northwest Power and Conservation Council
85
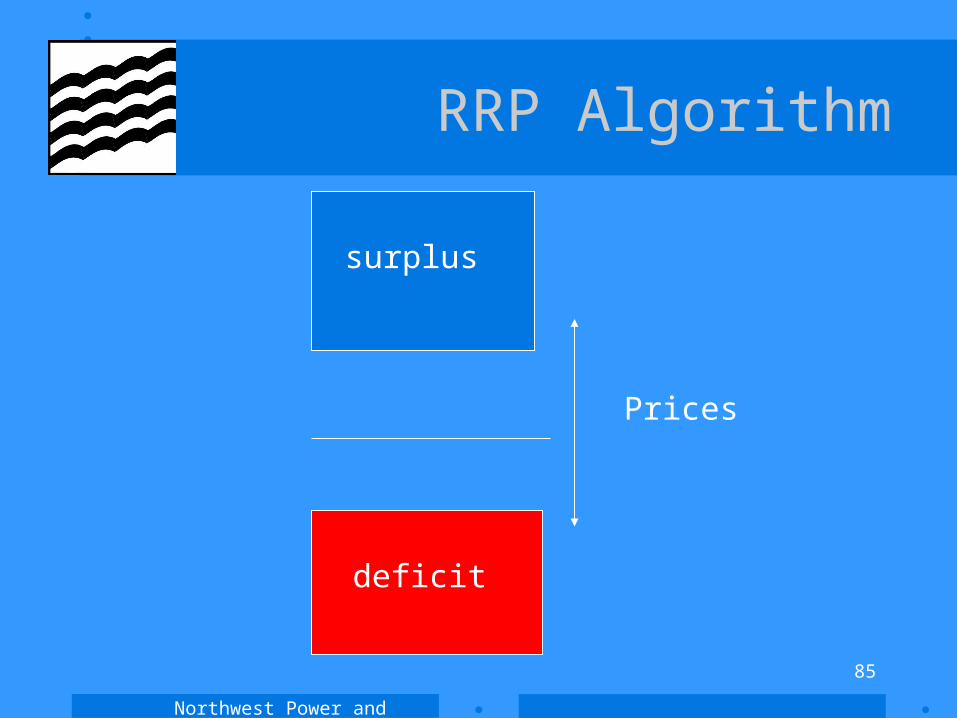
RRP Algorithm
Prices
surplus
deficit
Northwest Power and Conservation Council
86
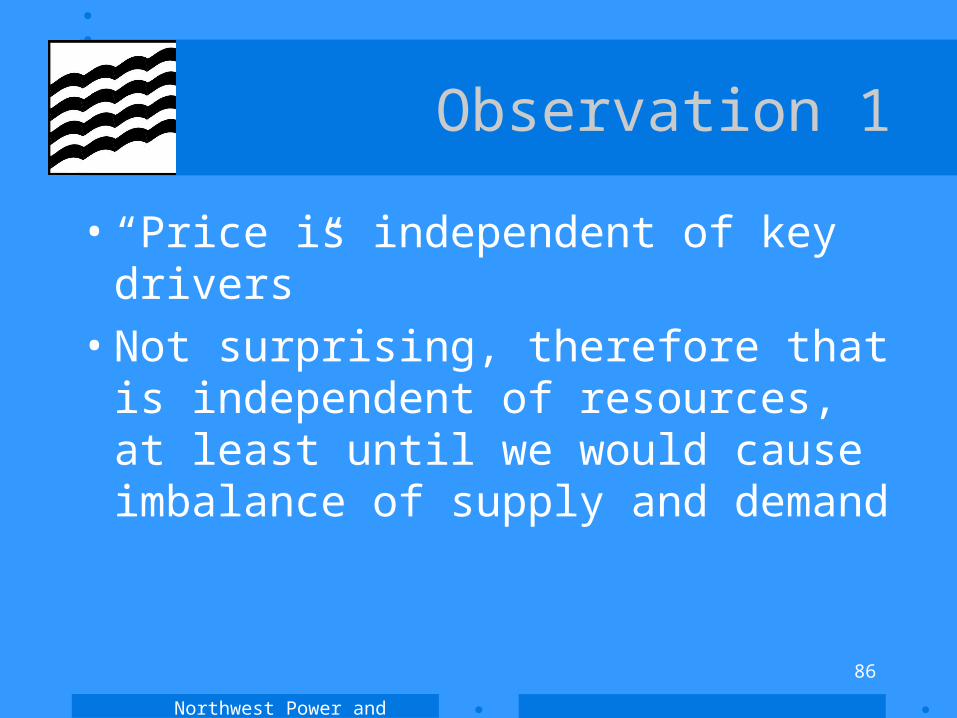
Observation 1
• “Price is independent of key drivers”
• Not surprising, therefore that is independent of resources, at least until we would cause imbalance of supply and demand
Northwest Power and Conservation Council
87
Proposition
• Independence of price from resource generation levels is necessary for the existence of an independent electricity term
Northwest Power and Conservation Council
88
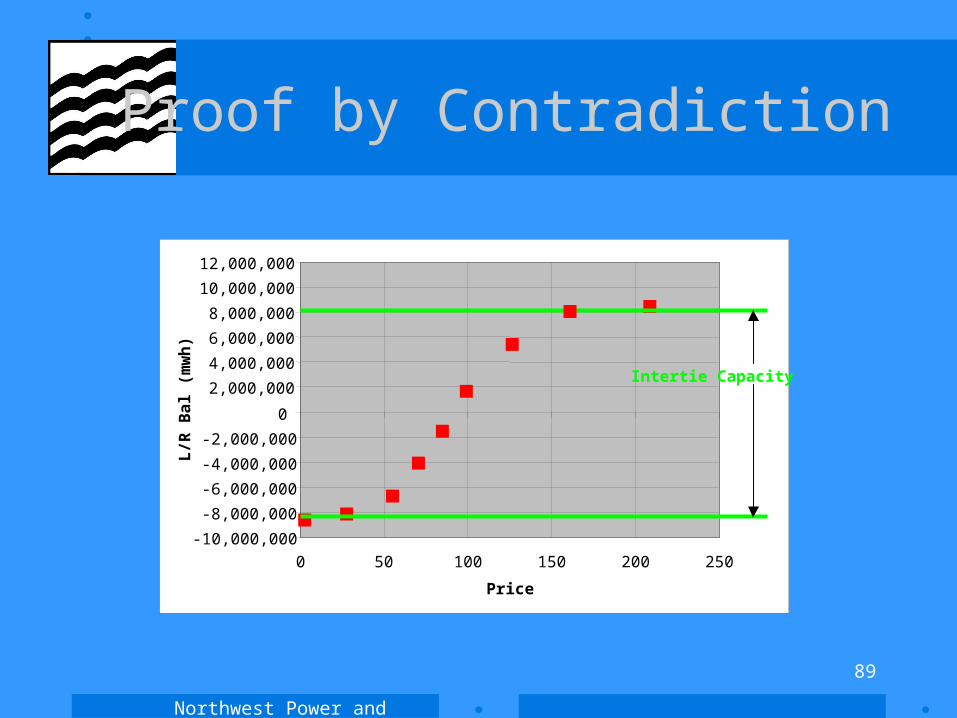
Proof by Contradiction
• So assume that prices did have to increase under all conditions when we decreased resources
Northwest Power and Conservation Council
89
Proof by Contradiction
-10,000,000
-8,000,000
-6,000,000
-4,000,000
-2,000,000
0
2,000,000
4,000,000
6,000,000
8,000,000
10,000,000
12,000,000
0 50 100 150 200 250
Price
L/R
Ba
l (m
wh
)
Intertie Capacity
Northwest Power and Conservation Council
90
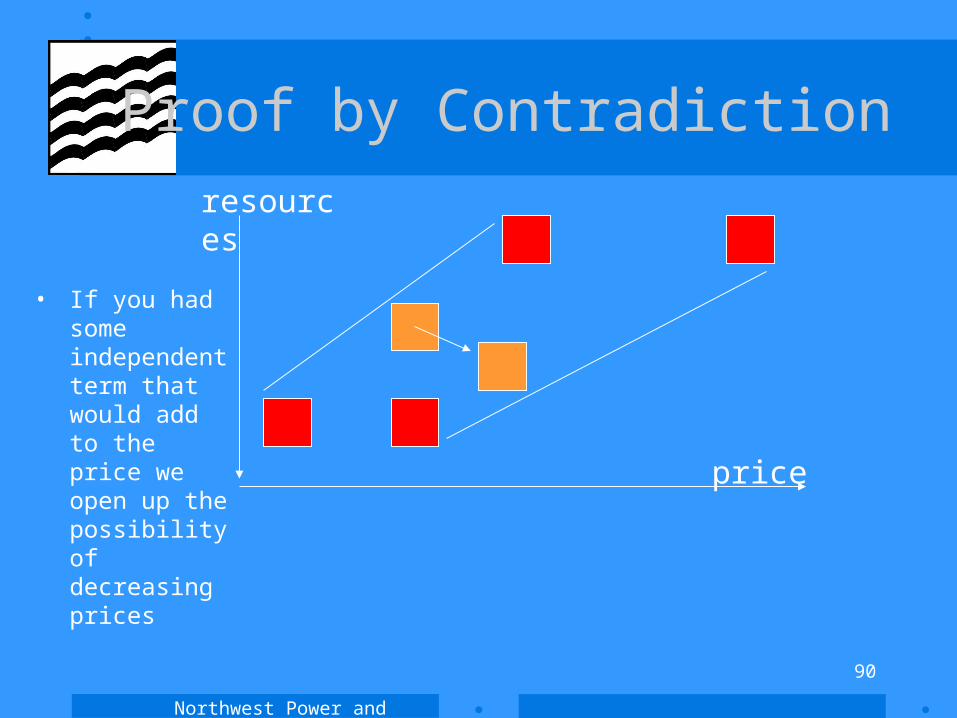
Proof by Contradiction
• If you had some independent term that would add to the price we open up the possibility of decreasing prices
price
resources
Northwest Power and Conservation Council
91
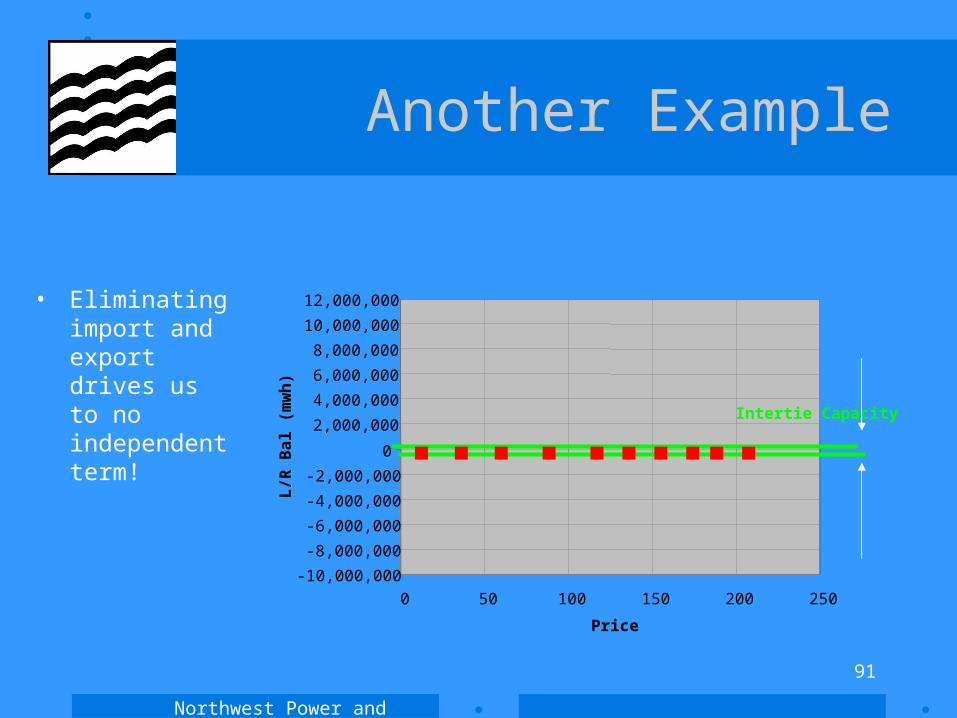
Another Example
• Eliminating import and export drives us to no independent term!
-10,000,000
-8,000,000
-6,000,000
-4,000,000
-2,000,000
0
2,000,000
4,000,000
6,000,000
8,000,000
10,000,000
12,000,000
0 50 100 150 200 250
Price
L/R
Ba
l (m
wh
)
Intertie Capacity
Northwest Power and Conservation Council
92
Finally, Some Computational Considerations
• Computation time is dramatically increased when we try to fine-tune RRP
• Computation time is increased when we reduce imports and exports
Northwest Power and Conservation Council
93
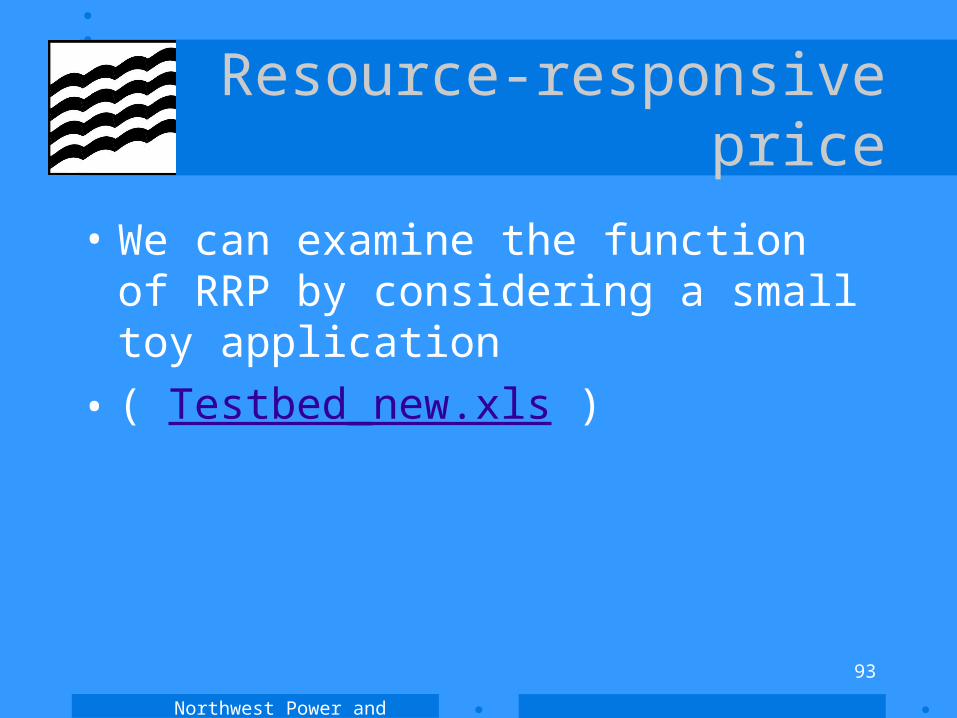
Resource-responsive price
• We can examine the function of RRP by considering a small toy application
• ( Testbed_new.xls )

Northwest Power and Conservation Council
94
Agenda
• Welcome Back!• Overview of methods• Presentation of candidate plan• Models and modeling• Algorithms
– Dispatch– Resource-responsive price (RRP)– Planning flexibility– Long-term price response: DSIs and other industrial loads– Supply curves for conservation and for commercial use of hydro– Stochastic hydrogeneration based on 50-year stream flow record
• Next meeting
Northwest Power and Conservation Council
95
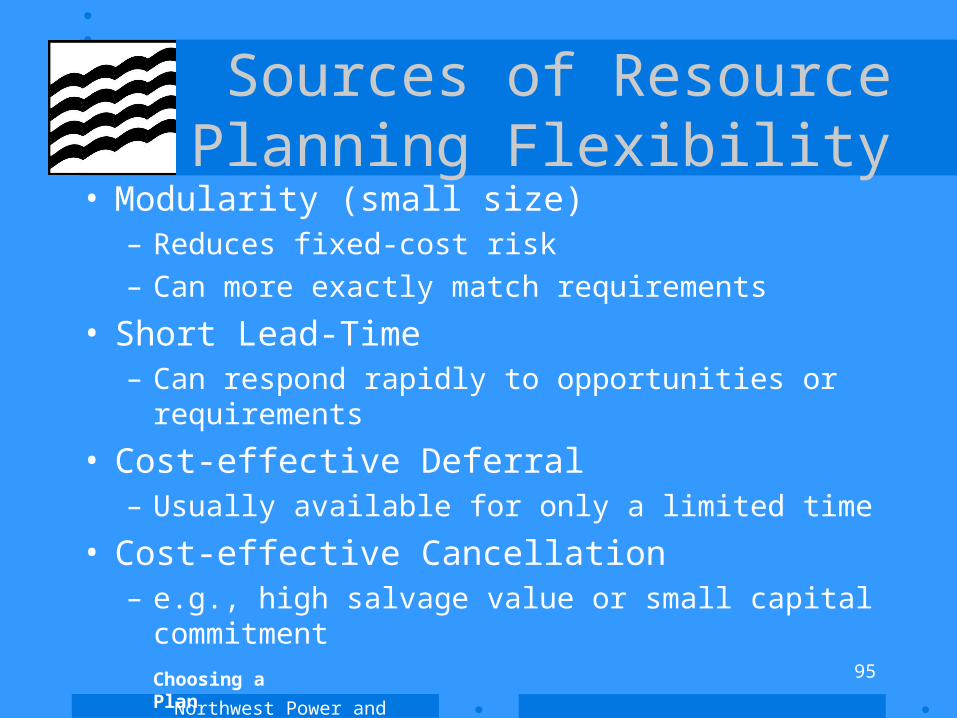
Sources of ResourcePlanning Flexibility
• Modularity (small size)– Reduces fixed-cost risk
– Can more exactly match requirements
• Short Lead-Time– Can respond rapidly to opportunities or requirements
• Cost-effective Deferral– Usually available for only a limited time
• Cost-effective Cancellation– e.g., high salvage value or small capital commitment
Choosing a Plan
Northwest Power and Conservation Council
96
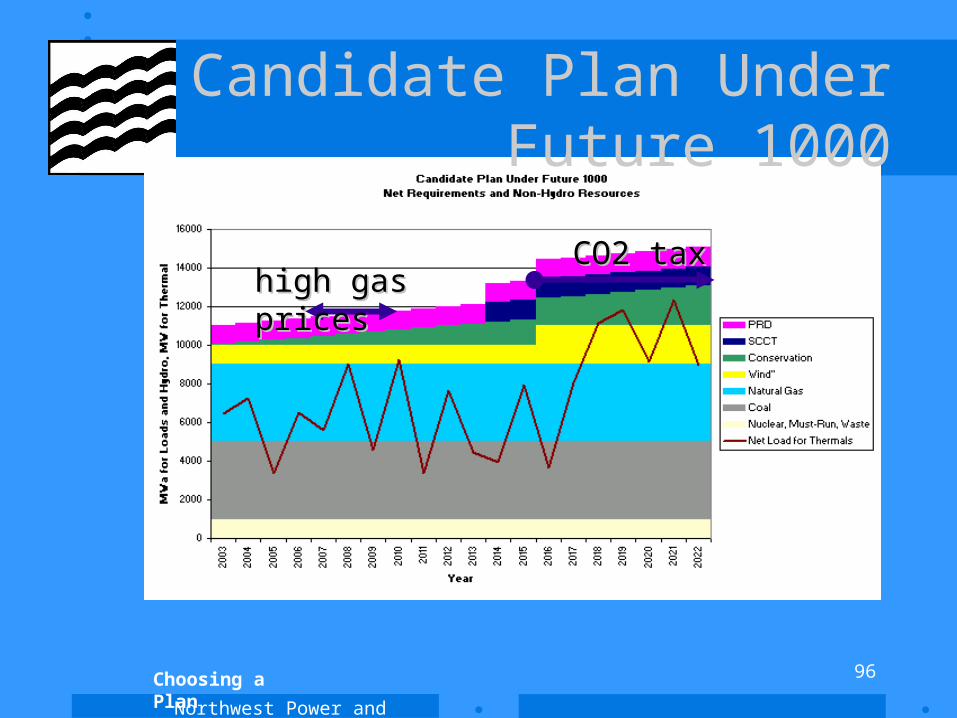
Candidate Plan Under Future 1000
Choosing a Plan
CO2 taxCO2 taxhigh gas priceshigh gas prices
Northwest Power and Conservation Council
97
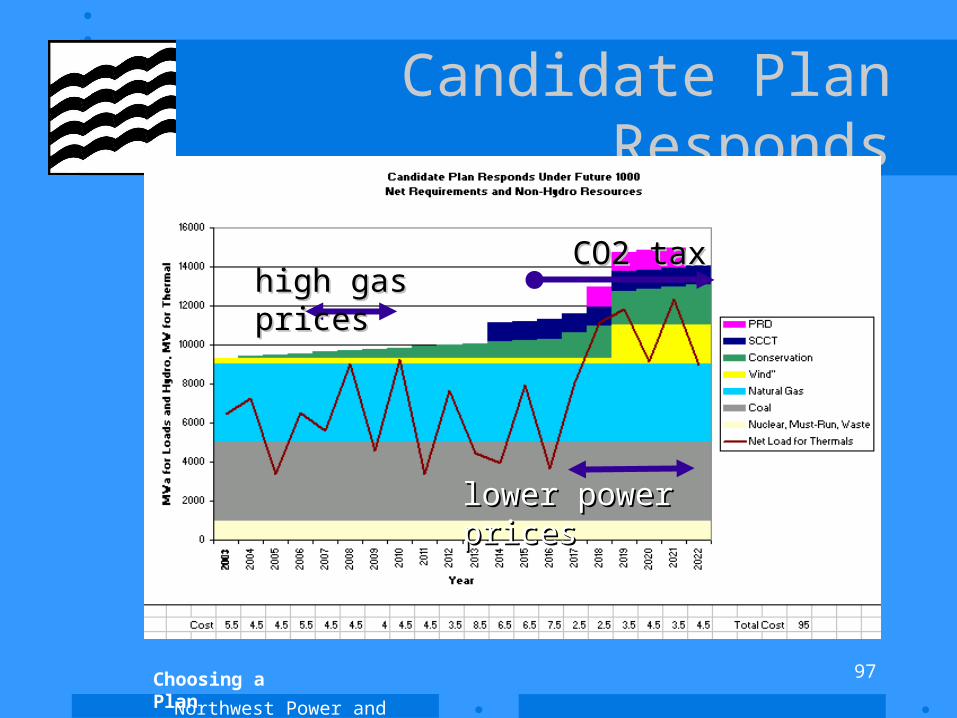
Candidate Plan Responds
Choosing a Plan
CO2 taxCO2 taxhigh gas priceshigh gas prices
lower power priceslower power prices
Northwest Power and Conservation Council
98
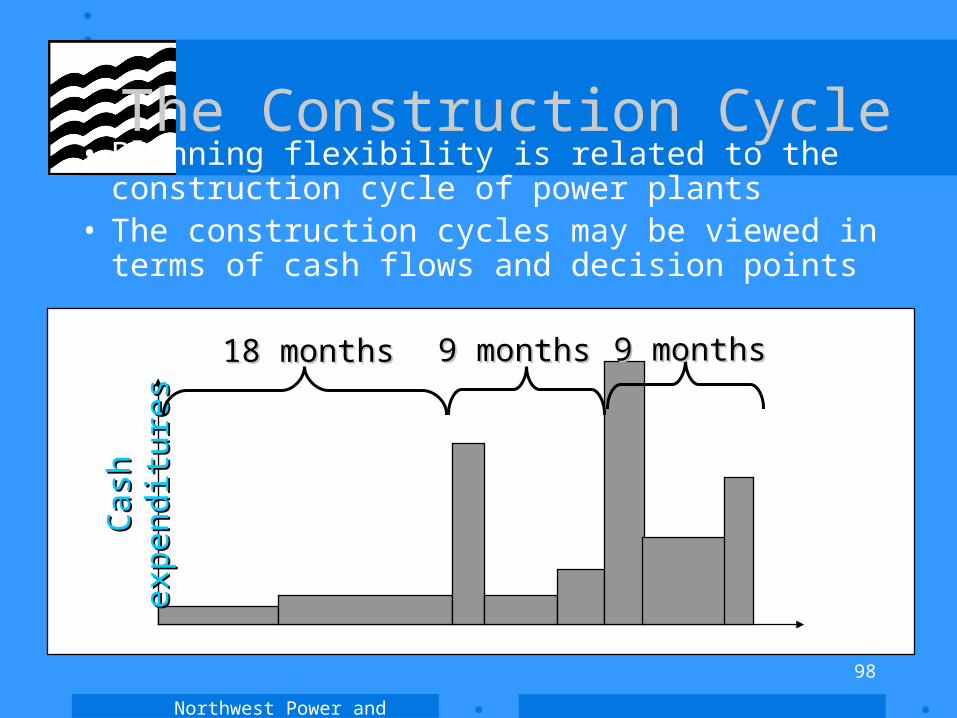
The Construction Cycle• Planning flexibility is related to the construction
cycle of power plants• The construction cycles may be viewed in terms of
cash flows and decision points
Cas
h ex
pend
itur
esC
ash
expe
ndit
ures
18 months18 months 9 months9 months 9 months9 months
Northwest Power and Conservation Council
99
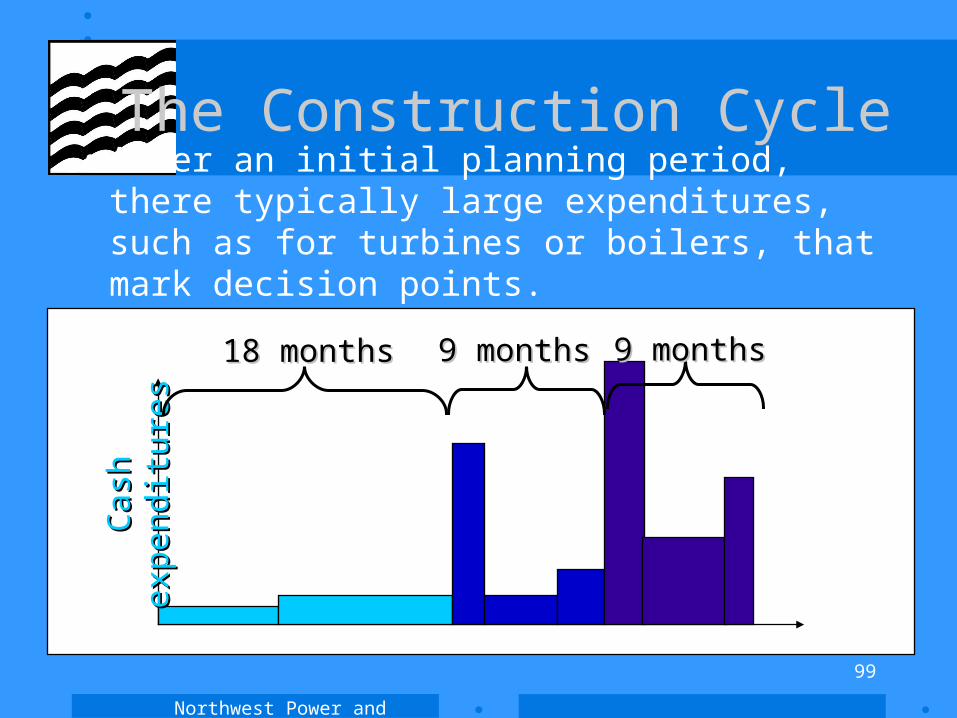
The Construction Cycle• After an initial planning period, there
typically large expenditures, such as for turbines or boilers, that mark decision points.
Cas
h ex
pend
itur
esC
ash
expe
ndit
ures
18 months18 months 9 months9 months 9 months9 months
Northwest Power and Conservation Council
100
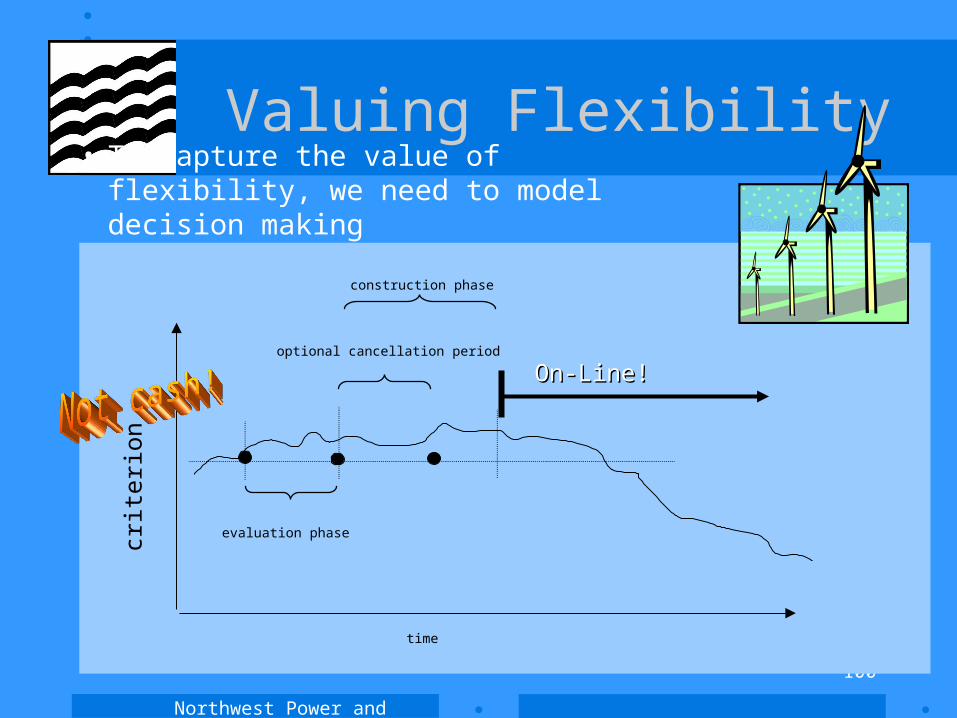
Valuing Flexibility
construction phase
optional cancellation period
evaluation phase
time
crite
rion
• To capture the value of flexibility, we need to model decision making
On-Line!On-Line!
Northwest Power and Conservation Council
101
Planning flexibility
The function that performs planning flexibility can be examined as a standalone routine in ( PlanningFlex.xls )

Northwest Power and Conservation Council
102
Agenda
• Welcome Back!• Overview of methods• Presentation of candidate plan• Models and modeling• Algorithms
– Dispatch– Resource-responsive price (RRP)– Planning flexibility– Long-term price response: DSIs and other industrial loads– Supply curves for conservation and for commercial use of hydro– Stochastic hydrogeneration based on 50-year stream flow record
• Next meeting
Northwest Power and Conservation Council
103
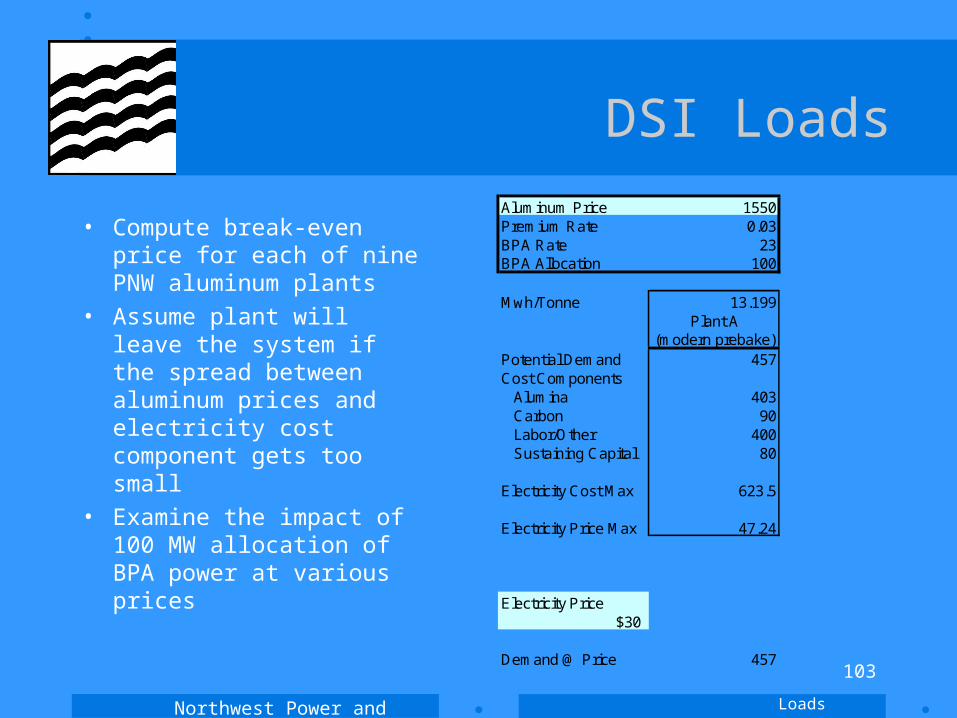
DSI LoadsAluminum Price 1550Premium Rate 0.03BPA Rate 23BPA Allocation 100
Mwh/Tonne 13.199Plant A
(modern prebake)Potential Demand 457Cost Components Alumina 403 Carbon 90 Labor/Other 400 Sustaining Capital 80
Electricity Cost Max 623.5
Electricity Price Max 47.24
Electricity Price$30
Demand @ Price 457
• Compute break-even price for each of nine PNW aluminum plants
• Assume plant will leave the system if the spread between aluminum prices and electricity cost component gets too small
• Examine the impact of 100 MW allocation of BPA power at various prices
Loads
Northwest Power and Conservation Council
104
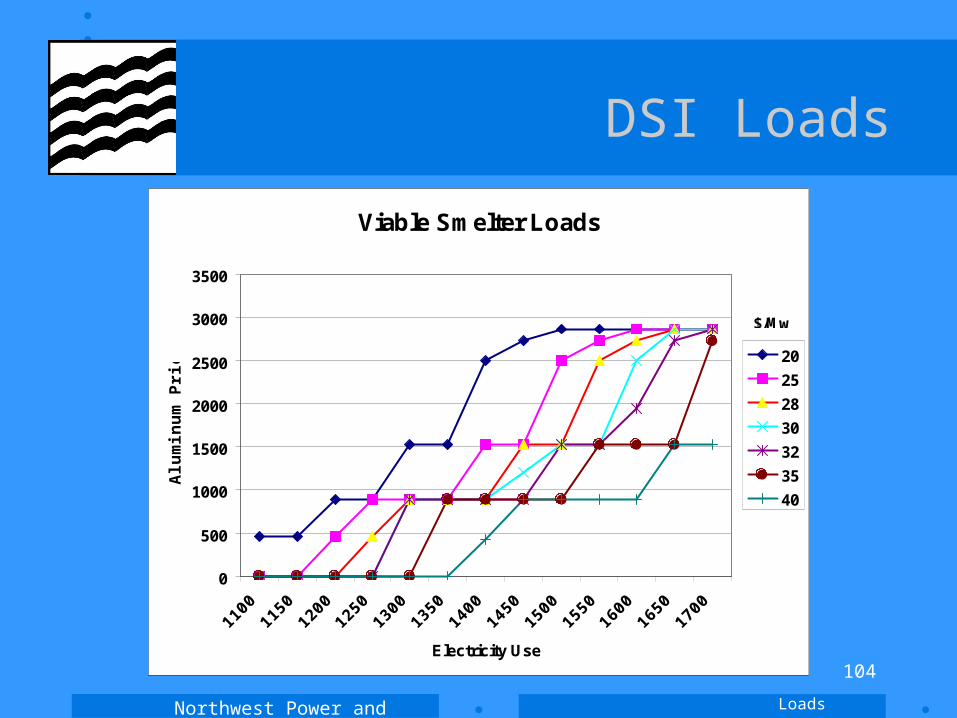
DSI Loads
Viable Smelter Loads
0
500
1000
1500
2000
2500
3000
3500
1100
1150
1200
1250
1300
1350
1400
1450
1500
1550
1600
1650
1700
Electricity Use
Alu
min
um
Pri
ce
20
25
28
30
32
35
40
$/Mw
Loads
Northwest Power and Conservation Council
105
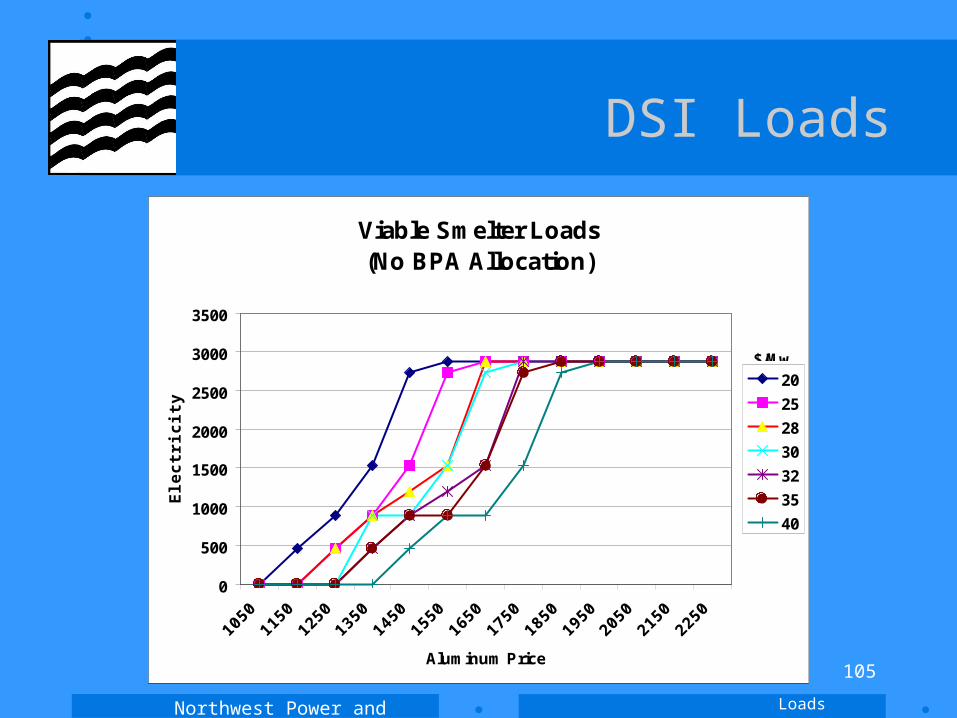
DSI Loads
Viable Smelter Loads(No BPA Allocation)
0
500
1000
1500
2000
2500
3000
3500
1050
1150
1250
1350
1450
1550
1650
1750
1850
1950
2050
2150
2250
Aluminum Price
Ele
ctr
icit
y U
se
20
25
28
30
32
35
40
$/Mw
Loads
Northwest Power and Conservation Council
106
DSI Loads
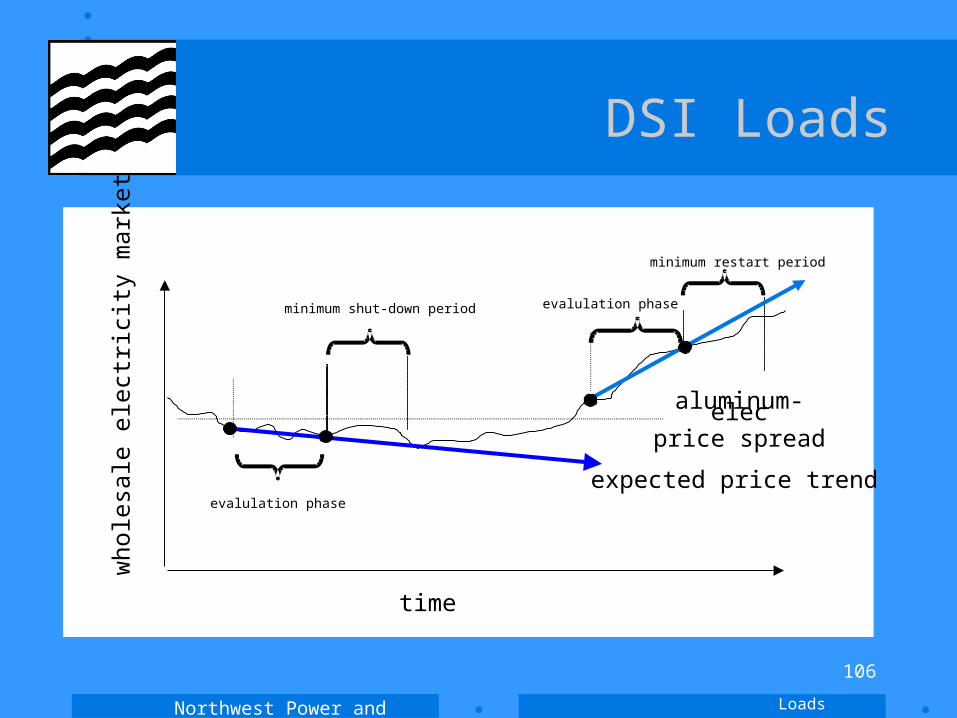
minimum shut-down period
evalulation phase
time
who
lesa
le e
lect
ricity
mar
ket
aluminum-elecprice spread
expected price trend
minimum restart period
evalulation phase
Loads
Northwest Power and Conservation Council
107
DSI Loads
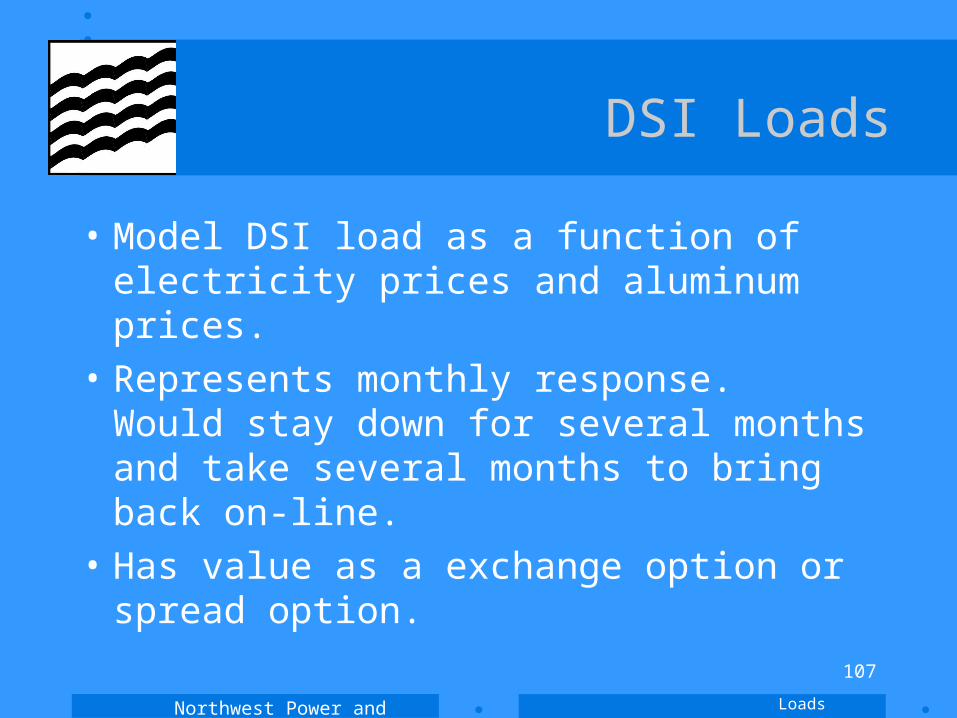
• Model DSI load as a function of electricity prices and aluminum prices.
• Represents monthly response. Would stay down for several months and take several months to bring back on-line.
• Has value as a exchange option or spread option.
Loads
Northwest Power and Conservation Council
108
Long-term price response
See the RRP model for an example of the function of the DSI LTPRD function

Northwest Power and Conservation Council
109
Agenda
• Welcome Back!• Overview of methods• Presentation of candidate plan• Models and modeling• Algorithms
– Dispatch– Resource-responsive price (RRP)– Planning flexibility– Long-term price response: DSIs and other industrial loads– Supply curves for conservation and for commercial use of hydro– Stochastic hydrogeneration based on 50-year stream flow record
• Next meeting
Northwest Power and Conservation Council
110
Supply curves
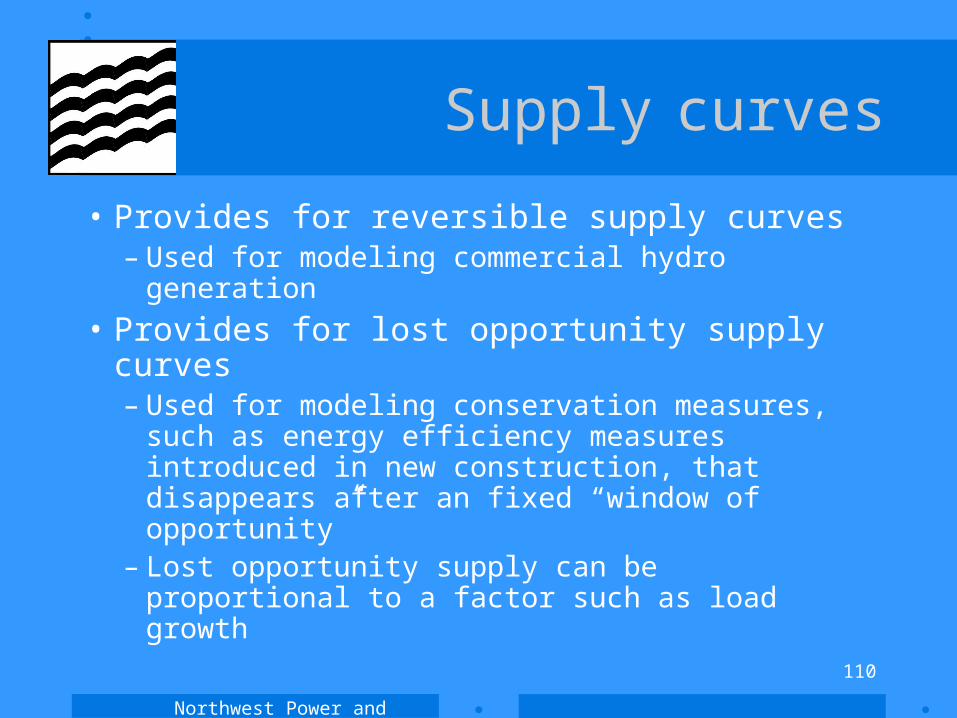
• Provides for reversible supply curves– Used for modeling commercial hydro
generation
• Provides for lost opportunity supply curves– Used for modeling conservation measures,
such as energy efficiency measures introduced in new construction, that disappears after an fixed “window of opportunity”
– Lost opportunity supply can be proportional to a factor such as load growth
Northwest Power and Conservation Council
111
Supply curves
• Can represent either incremental energy and costs, or cumulative energy and real levelized costs
• A workbook illustrating the supply curve logic appears in ( Supply Curve.xls )
Northwest Power and Conservation Council
112
Agenda
• Welcome Back!• Overview of methods• Presentation of candidate plan• Models and modeling• Algorithms
– Dispatch– Resource-responsive price (RRP)– Planning flexibility– Long-term price response: DSIs and other industrial loads– Supply curves for conservation and for commercial use of hydro– Stochastic hydrogeneration based on 50-year stream flow record
• Next meeting
Northwest Power and Conservation Council
113
Stochastic hydrogeneration
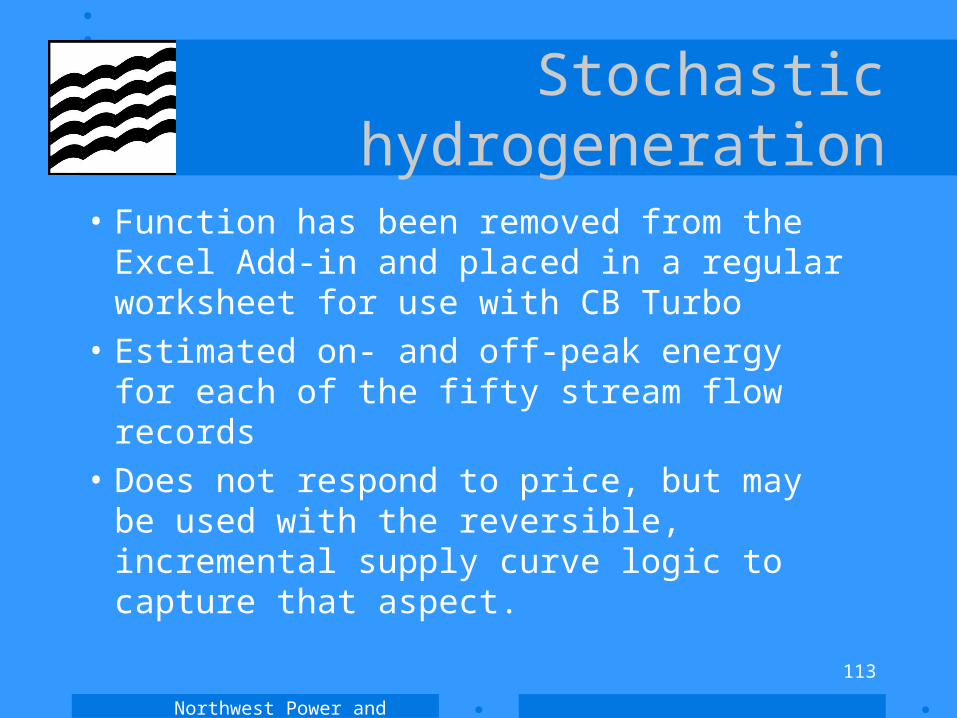
• Function has been removed from the Excel Add-in and placed in a regular worksheet for use with CB Turbo
• Estimated on- and off-peak energy for each of the fifty stream flow records
• Does not respond to price, but may be used with the reversible, incremental supply curve logic to capture that aspect.

Northwest Power and Conservation Council
114
Agenda
• Welcome Back!
• Overview of methods
• Presentation of candidate plan
• Models and modeling
• Algorithms
• Next meeting
Northwest Power and Conservation Council
115
End