Embed Size (px)
Citation preview

1
The impact of employee share plans on productivity
Damian Carnell GEO Conference - Netherlands 22/23 April 2001 Towers Perrin

Agenda
1 The aims
2 The types of plan
3 Costing/NPV analysis
4 Academic and survey support
5 Optimising the result
6 The future

Aims
An Informed Board Decision
An Effective Share Plan
Multiple Intangible Benefits
Enhanced Shareholder Value
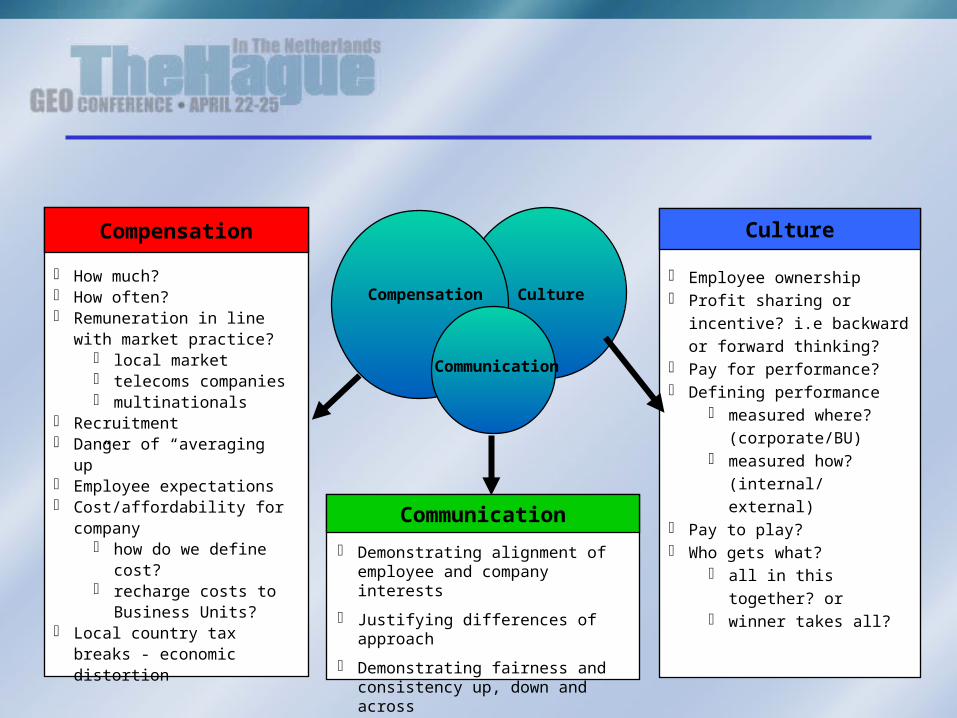
Culture
Employee ownership Profit sharing or incentive?
i.e backward or forward thinking?
Pay for performance? Defining performance
measured where? (corporate/BU)
measured how? (internal/ external)
Pay to play? Who gets what?
all in this together? or winner takes all?
Compensation
How much? How often? Remuneration in line with
market practice? local market telecoms companies multinationals
Recruitment Danger of “averaging up” Employee expectations Cost/affordability for
company how do we define
cost? recharge costs to
Business Units? Local country tax breaks -
economic distortion
Culture
Communication
Compensation
Communication
Demonstrating alignment of employee and company interests
Justifying differences of approach
Demonstrating fairness and consistency up, down and across
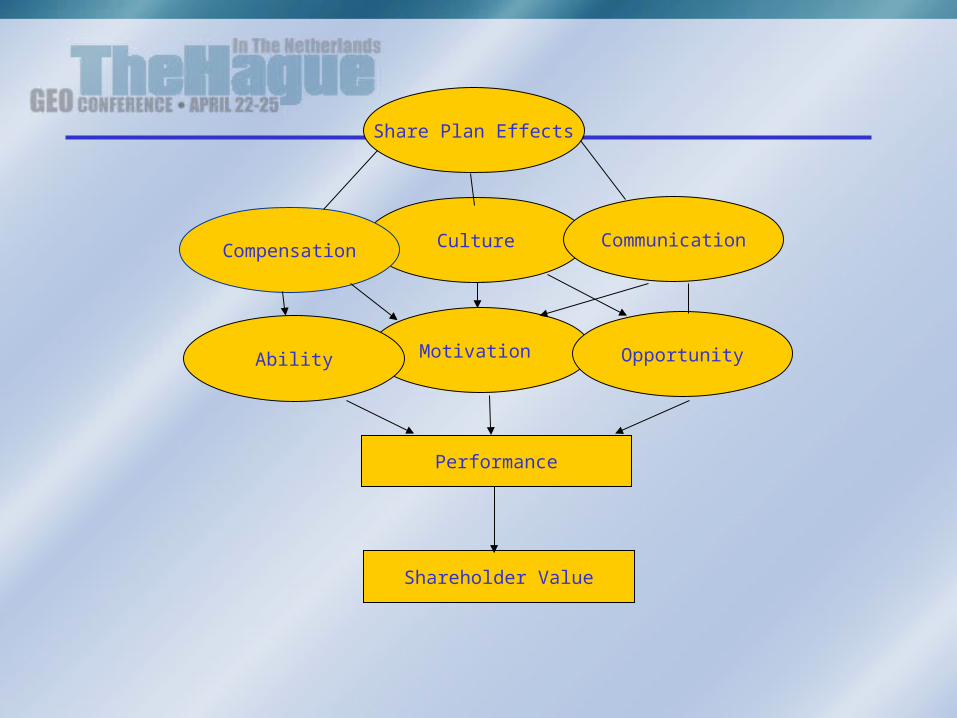
Culture
Share Plan Effects
Motivation
Communication
Opportunity
Compensation
Ability
Performance
Shareholder Value
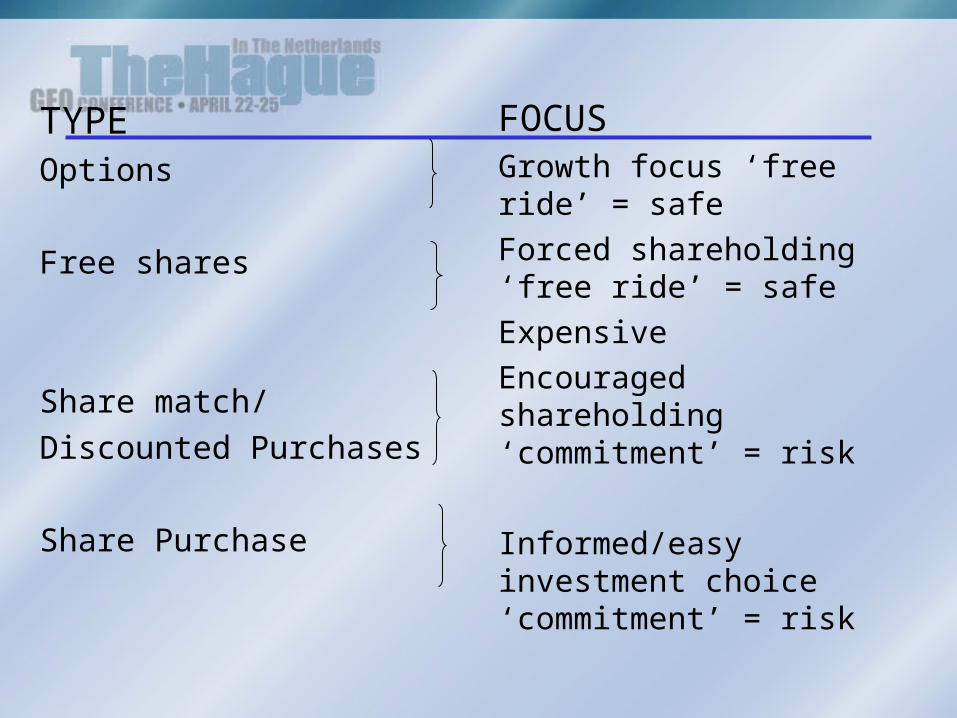
TYPEOptions
Free shares
Share match/Discounted Purchases
Share Purchase
FOCUSGrowth focus ‘free ride’ = safeForced shareholding ‘free ride’ = safeExpensiveEncouraged shareholding ‘commitment’ = risk
Informed/easy investment choice ‘commitment’ = risk
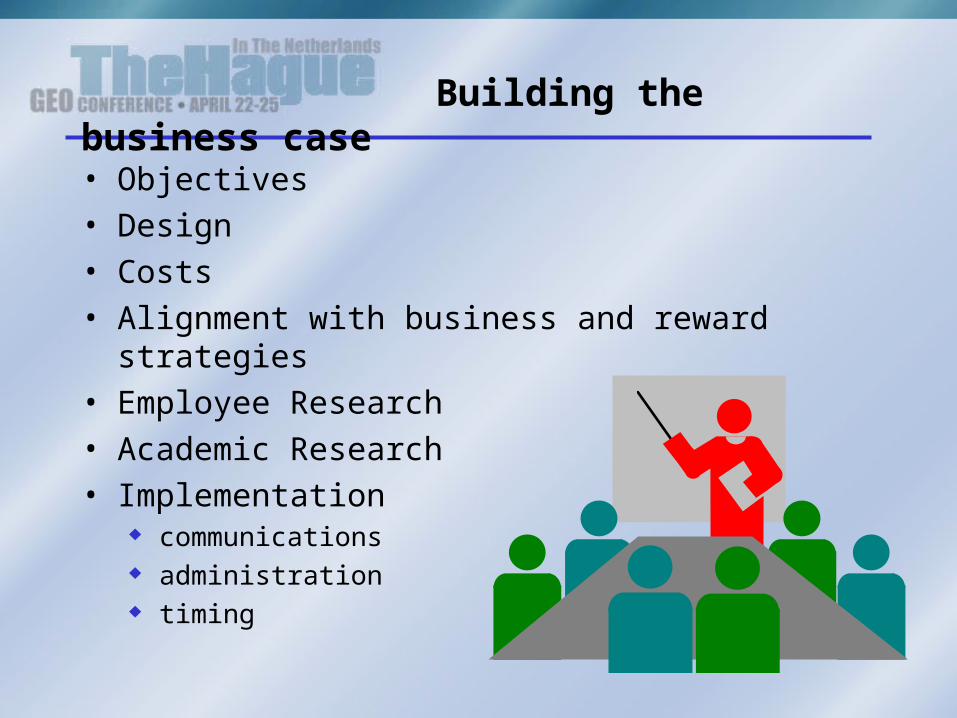
Building the business case• Objectives• Design• Costs• Alignment with business and reward strategies• Employee Research• Academic Research• Implementation
communications administration timing
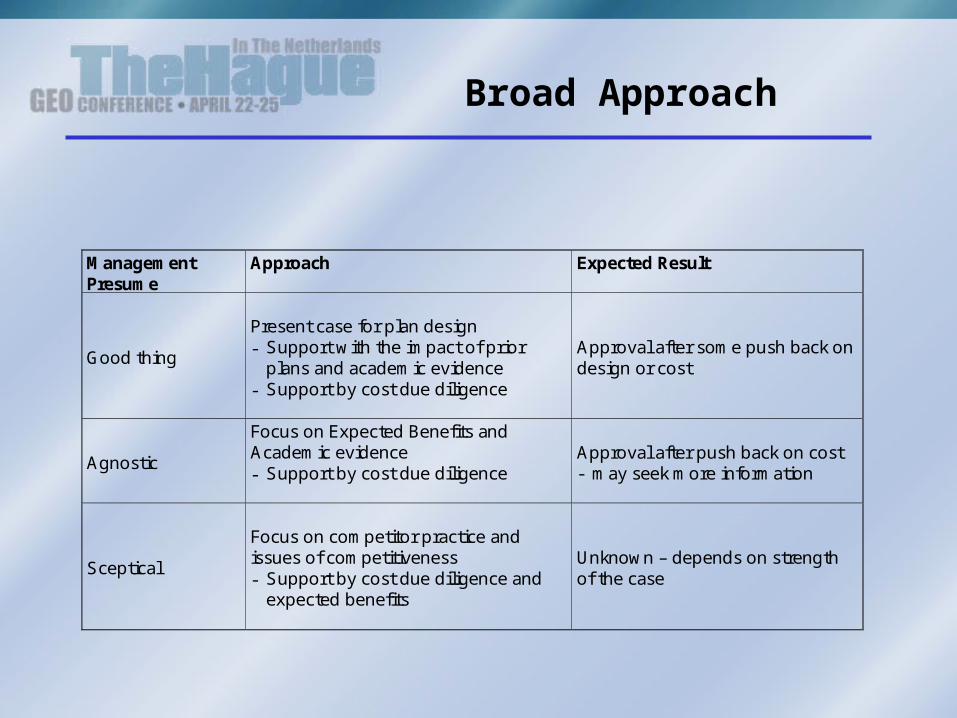
ManagementPresume
Approach Expected Result
Good thing
Present case for plan design- Support with the impact of prior
plans and academic evidence- Support by cost due diligence
Approval after some push back ondesign or cost
Agnostic
Focus on Expected Benefits andAcademic evidence- Support by cost due diligence
Approval after push back on cost- may seek more information
Sceptical
Focus on competitor practice andissues of competitiveness- Support by cost due diligence and
expected benefits
Unknown – depends on strengthof the case
Broad Approach
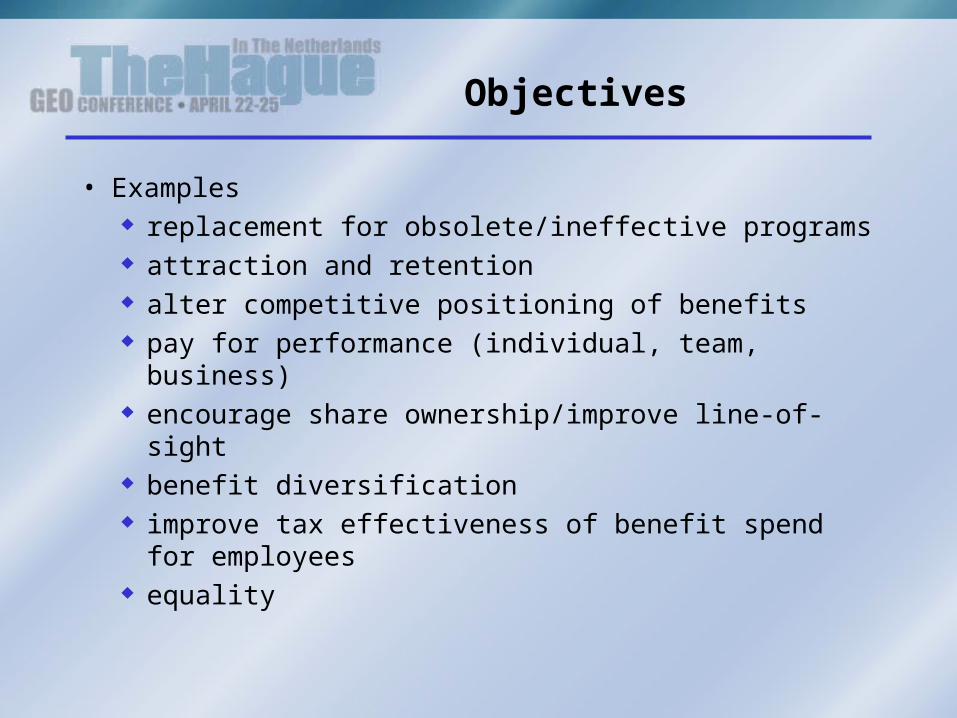
Objectives
• Examples replacement for obsolete/ineffective programs attraction and retention alter competitive positioning of benefits pay for performance (individual, team, business) encourage share ownership/improve line-of-
sight benefit diversification improve tax effectiveness of benefit spend for
employees equality
Costing/NPV Analysis
• Valid to make cost clear• New issue of shares - assess on a B/S
basis• Sensitivity analysis• NPV negative - as no benefits factored
in, but helps funding/share choice• Benefits fall outside cost/NPV analysis
and must be assessed separately
Benefit Costs
• For a given design, may vary according to participation rates
- contribution levels- performance- timing of share purchase
• Essential to understand potential variation in costs- projections under various scenarios- provide information on potential range as well as expected costs
Benefit costs
• Design and cost analysis go hand-in-hand a variety of design structures may be
provided for a given cost results of cost projections may impact
on design

Peoplestrategies
and the deal
Employer perspective:Employer perspective:Increasing shareholder Increasing shareholder
valuevalue
StrategyOrganisati
oncapabilitie
s
Organisation
values
Employee perspective:Employee perspective:Meaningful, rewarding workMeaningful, rewarding work
DemographicsCompetencie
s
Values
Aligned employee behaviours that yield improved business resultsAligned employee behaviours that yield improved business results
Externalinfluences
Internalinfluences
Total rewards strategy
Pay Benefits
Learning and Development
Work Environment
Alignment: Business Performance
FrameworkPeople
strategies and the
deal
Staffing and selection strategy
Change management and communication strategy
Academic Evidence
• Almost all positive• Various methodologies/performance
indicators• Mainly Anglo-Saxon• Recent studies available…...
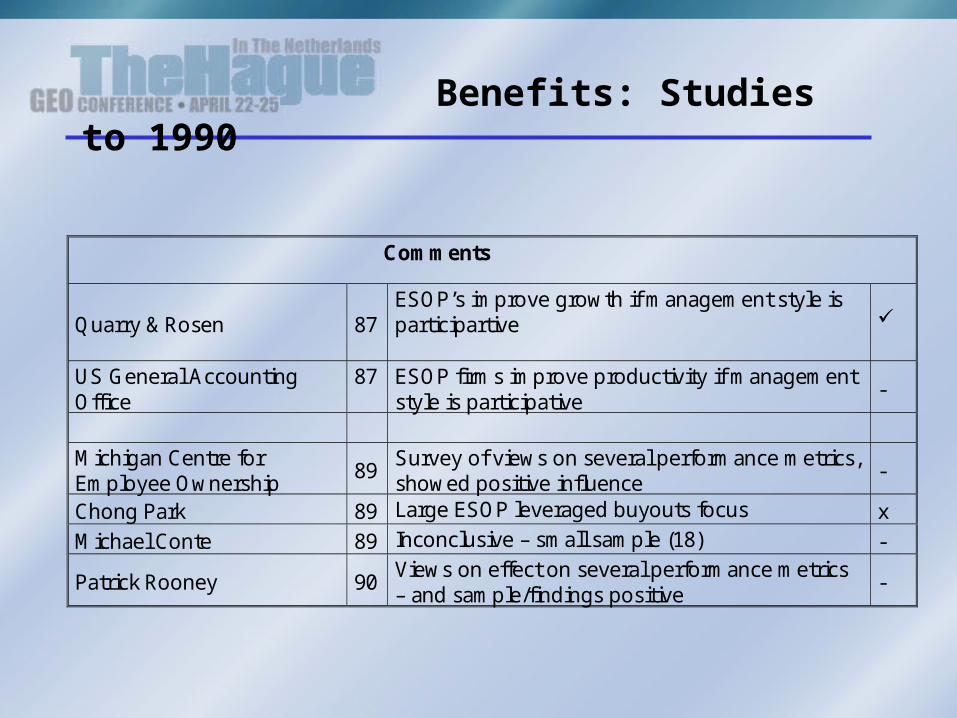
Comments
Quarry & Rosen 87ESOP’s improve growth if management style isparticipartive
US General AccountingOffice
87 ESOP firms improve productivity if managementstyle is participative
-
Michigan Centre forEmployee Ownership
89Survey of views on several performance metrics,showed positive influence
-
Chong Park 89 Large ESOP leveraged buyouts focus xMichael Conte 89 Inconclusive – small sample (18) -
Patrick Rooney 90Views on effect on several performance metrics– and sample/findings positive
-
Benefits: Studies to 1990
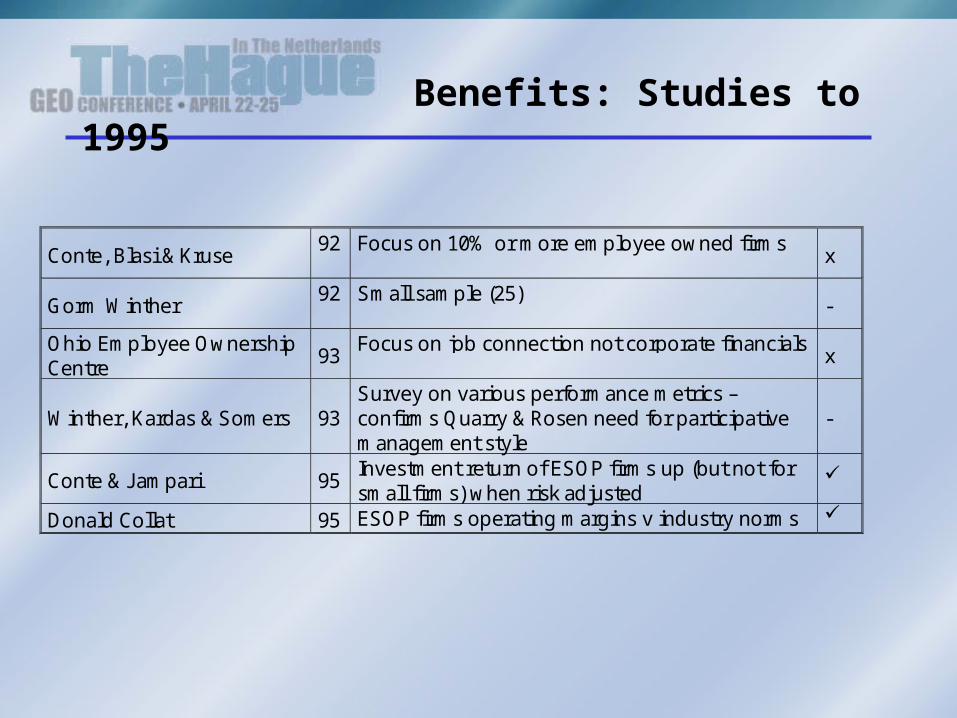
Conte, Blasi & Kruse92 Focus on 10% or more employee owned firms
x
Gorm Winther92 Small sample (25)
-
Ohio Employee OwnershipCentre
93Focus on job connection not corporate financials
x
Winther, Kardas & Somers 93Survey on various performance metrics –confirms Quarry & Rosen need for participativemanagement style
-
Conte & J ampari 95Investment return of ESOP firms up (but not forsmall firms) when risk adjusted
Donald Collat 95 ESOP firms operating margins v industry norms
Benefits: Studies to 1995
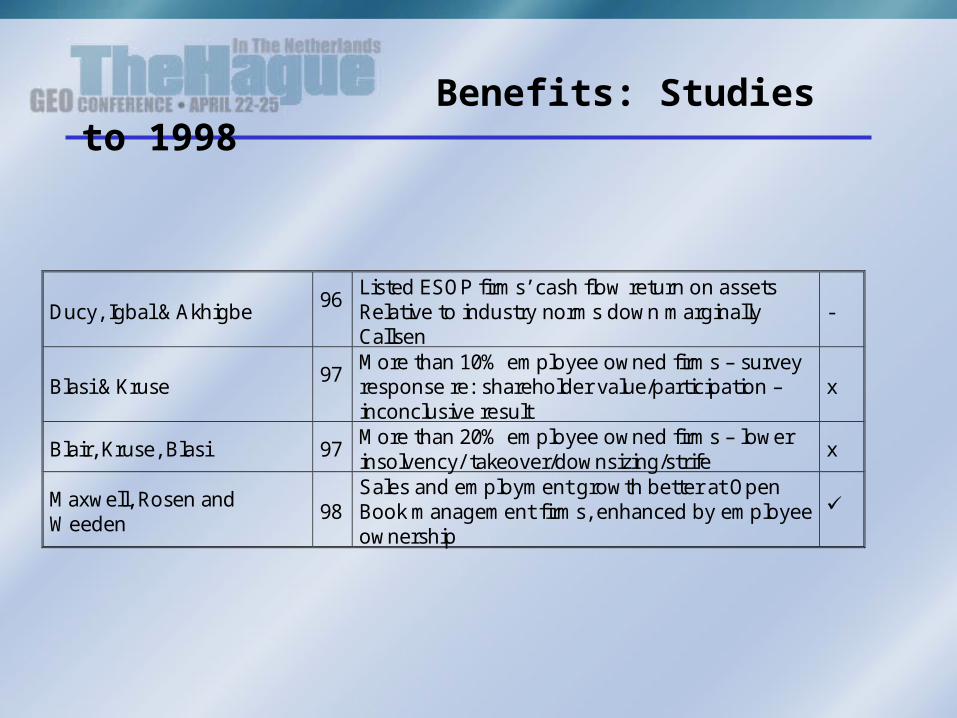
Ducy, Igbal & Akhigbe96
Listed ESOP firms’ cash flow return on assetsRelative to industry norms down marginallyCallsen
-
Blasi & Kruse97
More than 10% employee owned firms – surveyresponse re: shareholder value/participation –inconclusive result
x
Blair, Kruse, Blasi 97More than 20% employee owned firms – lowerinsolvency/ takeover/downsizing/strife
x
Maxwell, Rosen andWeeden
98Sales and employment growth better at OpenBook management firms, enhanced by employeeownership
Benefits: Studies to 1998
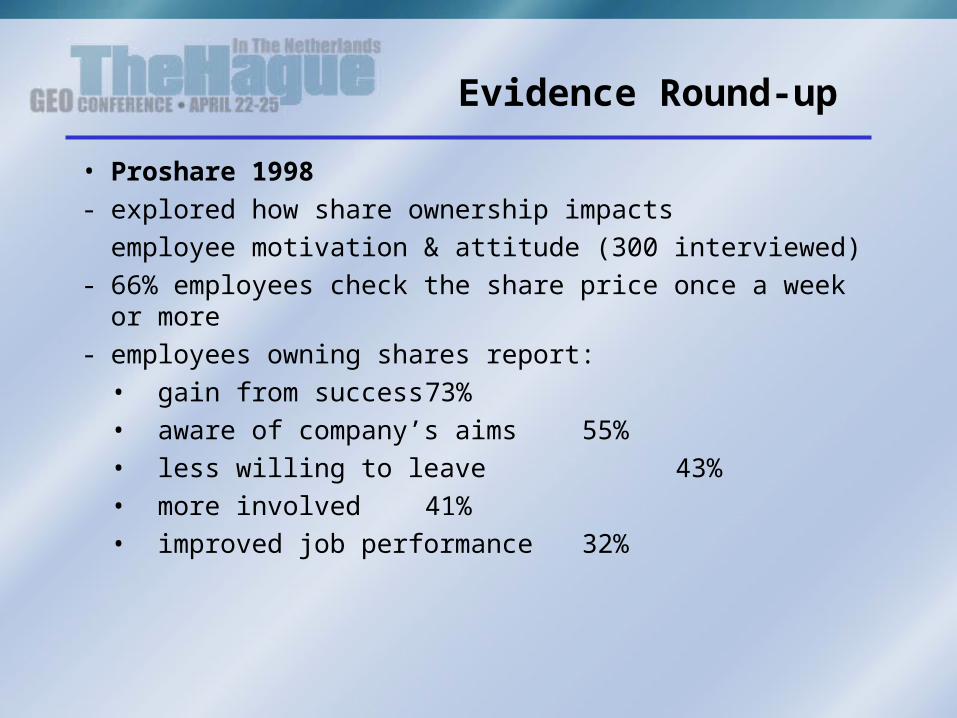
Evidence Round-up
• Proshare 1998- explored how share ownership impacts
employee motivation & attitude (300 interviewed)- 66% employees check the share price once a week or
more- employees owning shares report:
• gain from success 73%• aware of company’s aims 55%• less willing to leave 43%• more involved 41%• improved job performance 32%
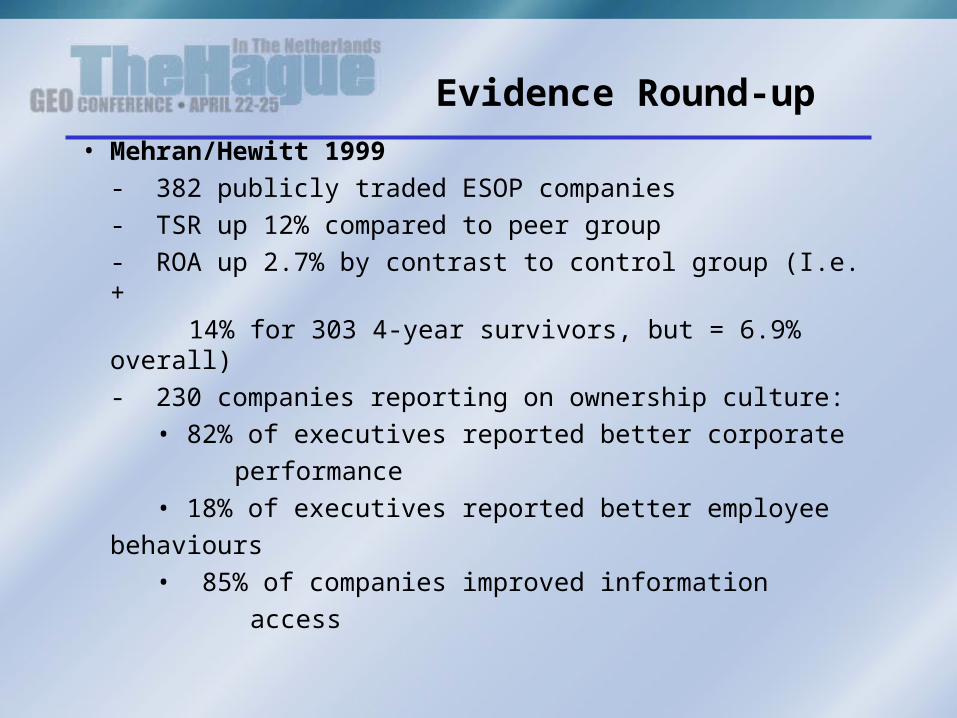
Evidence Round-up
• Mehran/Hewitt 1999- 382 publicly traded ESOP companies- TSR up 12% compared to peer group- ROA up 2.7% by contrast to control group (I.e. +
14% for 303 4-year survivors, but = 6.9% overall)- 230 companies reporting on ownership culture: • 82% of executives reported better corporate
performance • 18% of executives reported better employee
behaviours • 85% of companies improved information
access
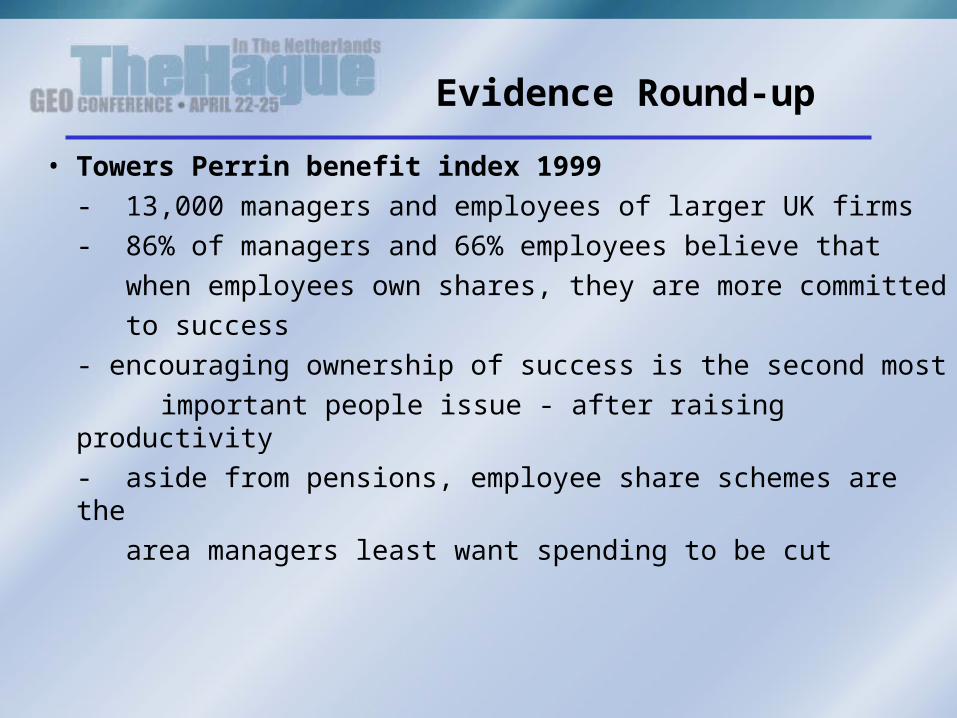
Evidence Round-up
• Towers Perrin benefit index 1999- 13,000 managers and employees of larger UK firms- 86% of managers and 66% employees believe that when employees own shares, they are more committed to success- encouraging ownership of success is the second most
important people issue - after raising productivity- aside from pensions, employee share schemes are the area managers least want spending to be cut
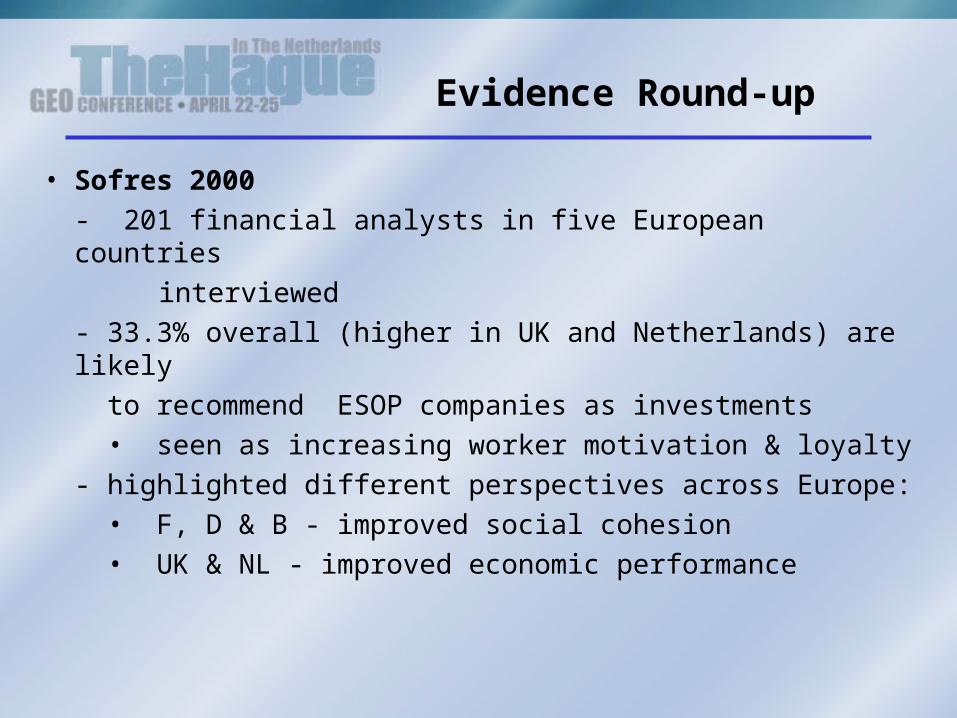
Evidence Round-up
• Sofres 2000- 201 financial analysts in five European countries
interviewed- 33.3% overall (higher in UK and Netherlands) are likely to recommend ESOP companies as investments • seen as increasing worker motivation & loyalty- highlighted different perspectives across Europe: • F, D & B - improved social cohesion • UK & NL - improved economic performance
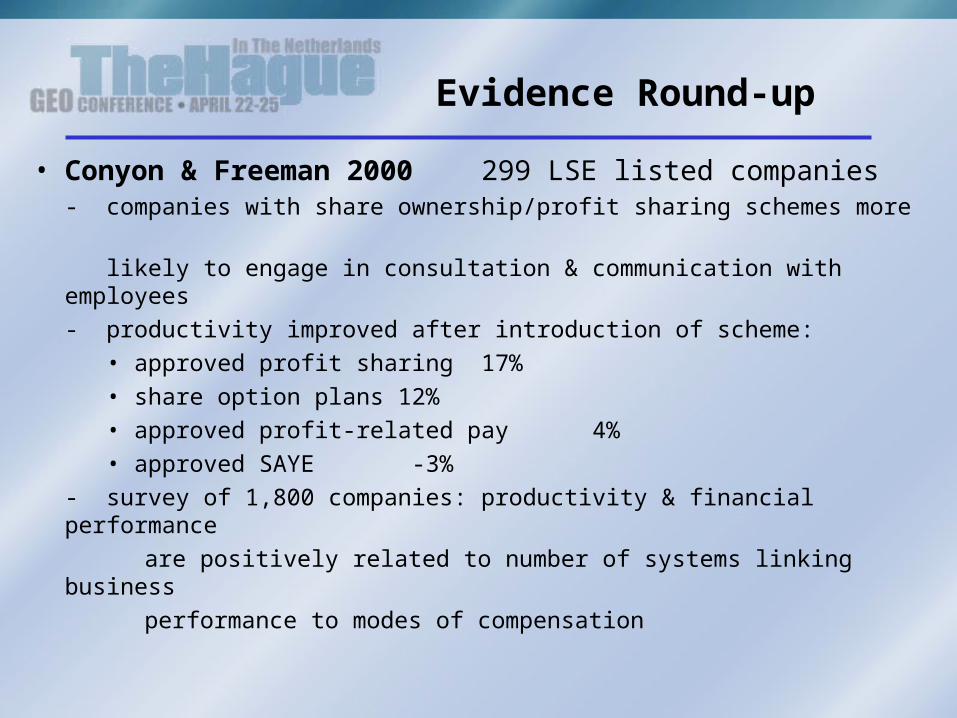
Evidence Round-up
• Conyon & Freeman 2000 299 LSE listed companies- companies with share ownership/profit sharing schemes more likely to engage in consultation & communication with employees- productivity improved after introduction of scheme: • approved profit sharing 17% • share option plans 12% • approved profit-related pay 4% • approved SAYE -3%- survey of 1,800 companies: productivity & financial performance
are positively related to number of systems linking business performance to modes of compensation

Optimising the Result
• Improved compensation• Align employee behaviour with company values• Attract and retain talent in a competitive
market• Be seen as a ‘good’ employer• Help to change the culture of the company• Tax efficiency
What is your main focus?
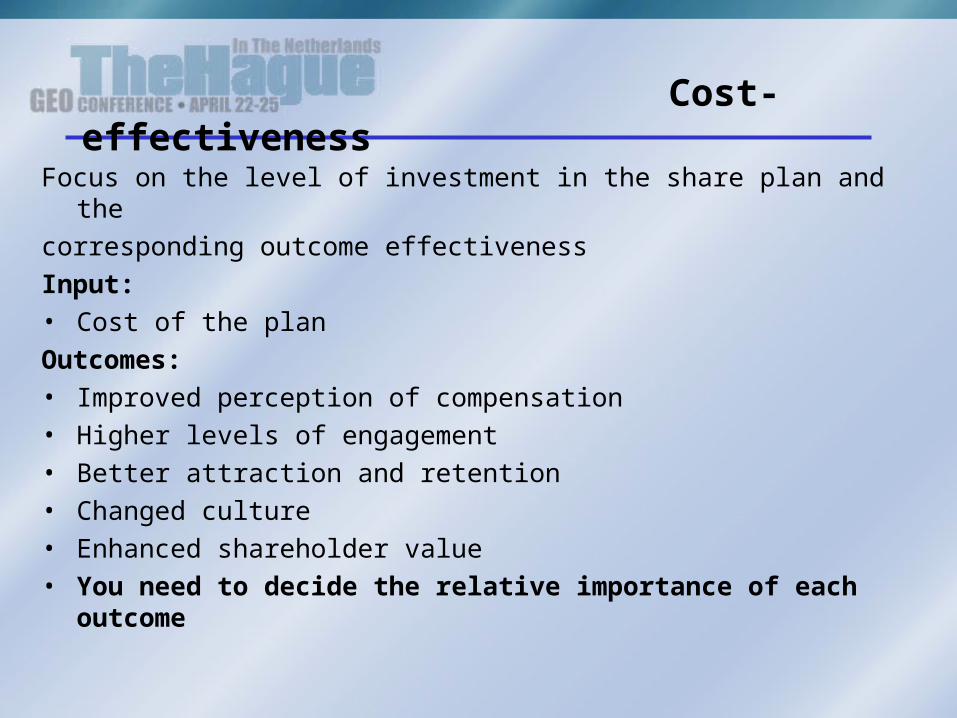
Cost-effectiveness
Focus on the level of investment in the share plan and the corresponding outcome effectivenessInput:• Cost of the planOutcomes:• Improved perception of compensation• Higher levels of engagement• Better attraction and retention• Changed culture• Enhanced shareholder value• You need to decide the relative importance of each
outcome
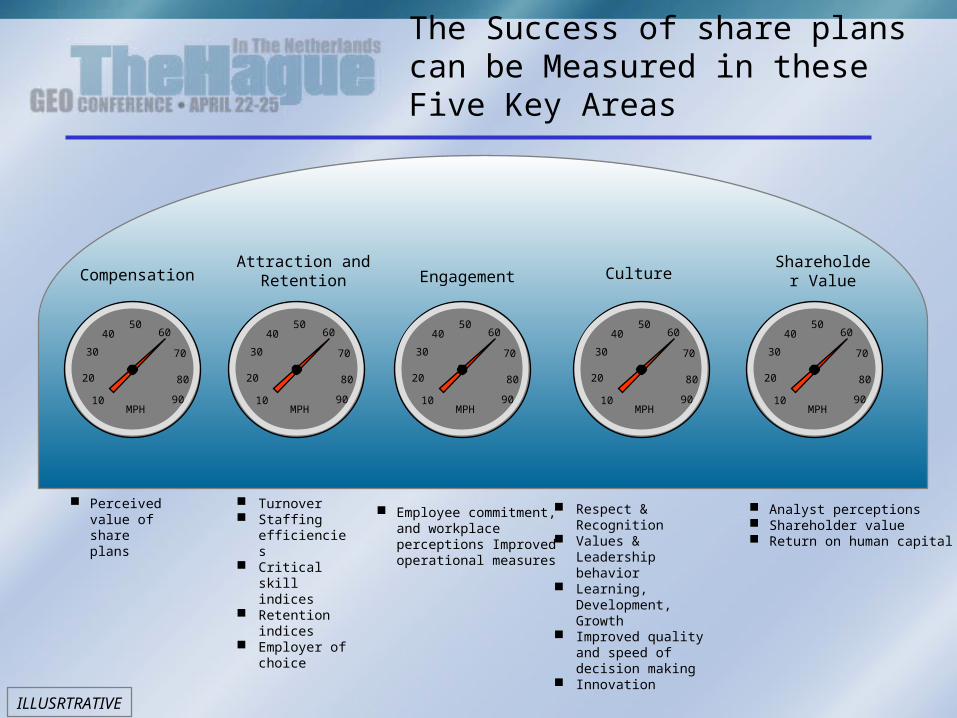
The Success of share plans can be Measured in these Five Key Areas
10
20
30
4050
60
70
80
90MPH
Culture
ILLUSRTRATIVE
Analyst perceptions Shareholder value Return on human capital
Employee commitment, and workplace perceptions Improved operational measures
CompensationAttraction and
Retention Engagement
10
20
30
4050
60
70
80
90MPH
10
20
30
4050
60
70
80
90MPH
10
20
30
4050
60
70
80
90MPH
10
20
30
4050
60
70
80
90MPH
Shareholder Value
Respect & Recognition
Values & Leadership behavior
Learning, Development, Growth
Improved quality and speed of decision making
Innovation
Turnover Staffing
efficiencies Critical skill
indices Retention
indices Employer of
choice
Perceived value of share plans
The Measurement Process
Two stages:
• design of an optimally effective share plan
• tracking its effectiveness
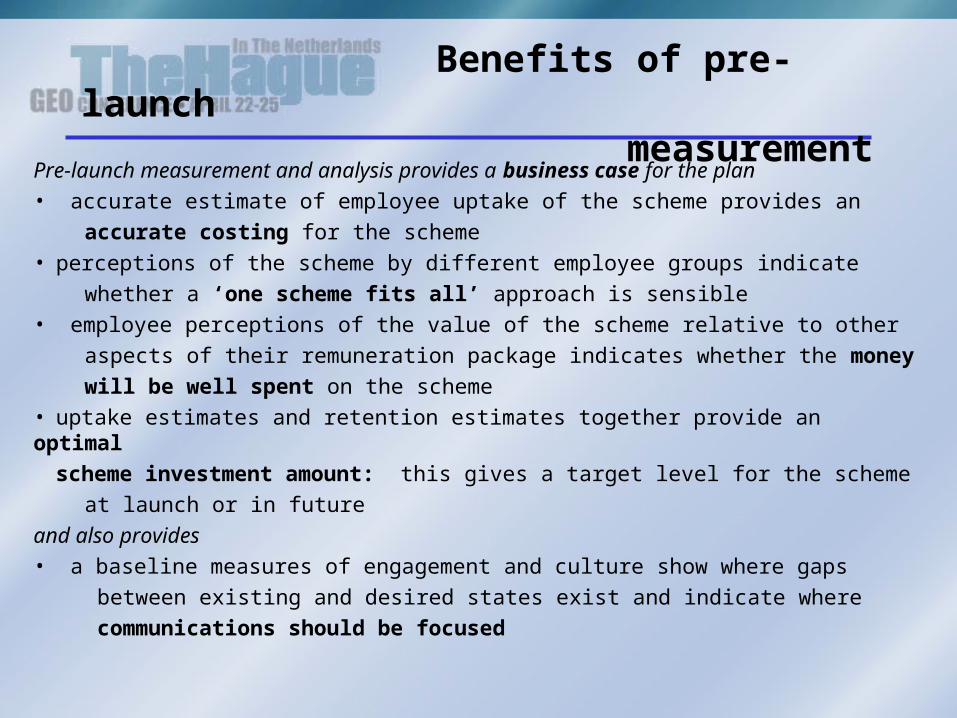
Benefits of pre-launch measurement
Pre-launch measurement and analysis provides a business case for the plan• accurate estimate of employee uptake of the scheme provides an
accurate costing for the scheme• perceptions of the scheme by different employee groups indicate
whether a ‘one scheme fits all’ approach is sensible• employee perceptions of the value of the scheme relative to other
aspects of their remuneration package indicates whether the money
will be well spent on the scheme • uptake estimates and retention estimates together provide an optimal
scheme investment amount: this gives a target level for the scheme
at launch or in future
and also provides• a baseline measures of engagement and culture show where gaps
between existing and desired states exist and indicate where
communications should be focused
Benefits of Measurement After Implementation of the Plan
The post launch measures provide a balanced scorecard of outcomes that enables management to:• know whether initial employee expectations of the plan have been met• quantify in £ terms the effect on attraction and retention• know whether engagement has increased as a result of the plan• know whether targeted culture changes have occurred• quantify in £ terms changes in shareholder value• know whether understanding and administration of the share plan is satisfactory or if further effort is required• know if special attention is needed for specific employee groups
The Future
• Equity Pay will grow - a function of: - the new economy
- new ways of working- retreat of paternalism
• in consequence, money dedicated to plans will increase overtime, perhaps dramatically
• because of heavier weight of money and because of its role in creating competitive advantage, the rigour with which proposals are tested will rise
• old basis for plan approval will change - there will be more reliance on measurement, academic input and cost/benefit analysis