Embed Size (px)
Citation preview

1
Unemployment and Inflation
CHAPTER
8
© 2003 South-Western/Thomson Learning

2
Measuring Unemployment
Civilian Noninstitutional Adult Population
All civilians 16 years of age and olderExcludes institutionalized in prisons or mental hospitalsExcludes those in military
Labor forceThose in the adult population who are either working or looking for work
UnemployedThose with no job who are looking for work

3
Measuring Unemployment
Civilian Noninstitutional Adult Population
Labor Force Not In Labor Force
Employed Unemployed

4
Measuring Unemployment
Unemployment rateMeasures the percentage of those in the labor force who are unemployedEquals the number unemployed divided by the number in the labor forceDoes not include discouraged workers
Discouraged workersThose who are no longer looking for work but are unemployed
Labor Force Participation RateThe number in the labor force divided by the adult population
5
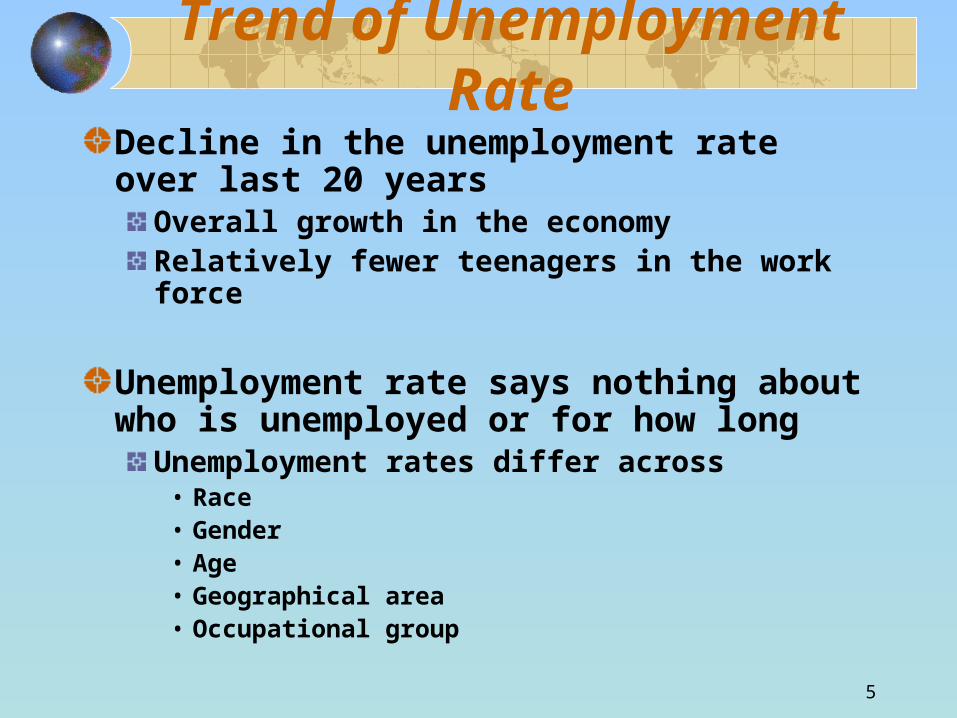
Trend of Unemployment RateDecline in the unemployment rate over last 20 years
Overall growth in the economyRelatively fewer teenagers in the work force
Unemployment rate says nothing about who is unemployed or for how long
Unemployment rates differ across• Race• Gender• Age• Geographical area• Occupational group

6
Types of Unemployment
Four sources of unemployment
Frictional unemployment
Structural unemployment
Seasonal unemployment
Cyclical unemployment

7
Frictional Unemployment
Time required to bring together labor suppliers and labor demanders
Employers need time to learn about the talent availableJob seekers need time to learn about employment opportunities
Generally short-term and voluntary

8
Structural Unemployment
Exists because unemployed workers often
do not have the skills demanded by employers, ordo not live where their skills are in demand
• That is, there is a mismatch of skills or geographic location
• More of a problem than is frictional unemployment
Occurs because changes in tastes, technology, taxes, or competition reduce the demand for certain skills and increase the demand for other skills
9
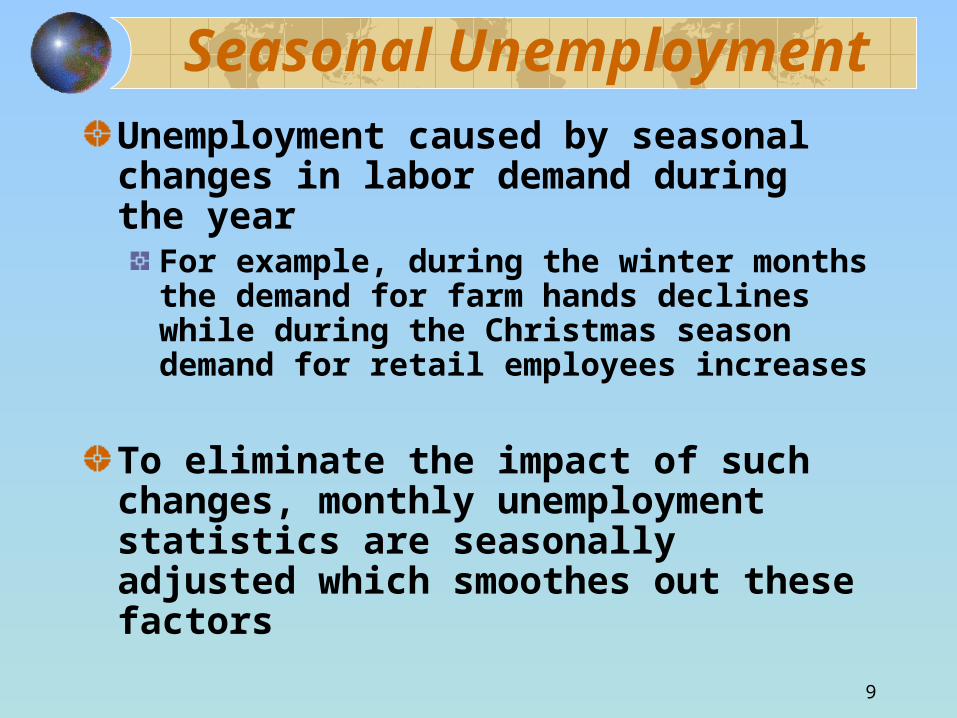
Seasonal UnemploymentUnemployment caused by seasonal changes in labor demand during the year
For example, during the winter months the demand for farm hands declines while during the Christmas season demand for retail employees increases
To eliminate the impact of such changes, monthly unemployment statistics are seasonally adjusted which smoothes out these factors
10
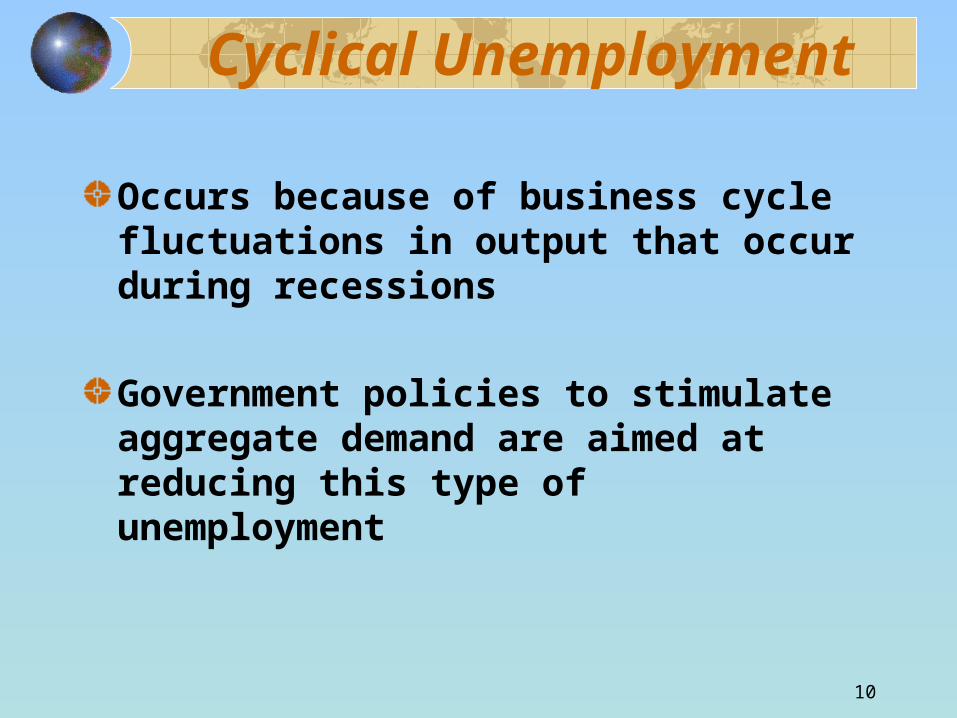
Cyclical Unemployment
Occurs because of business cycle fluctuations in output that occur during recessions
Government policies to stimulate aggregate demand are aimed at reducing this type of unemployment
11
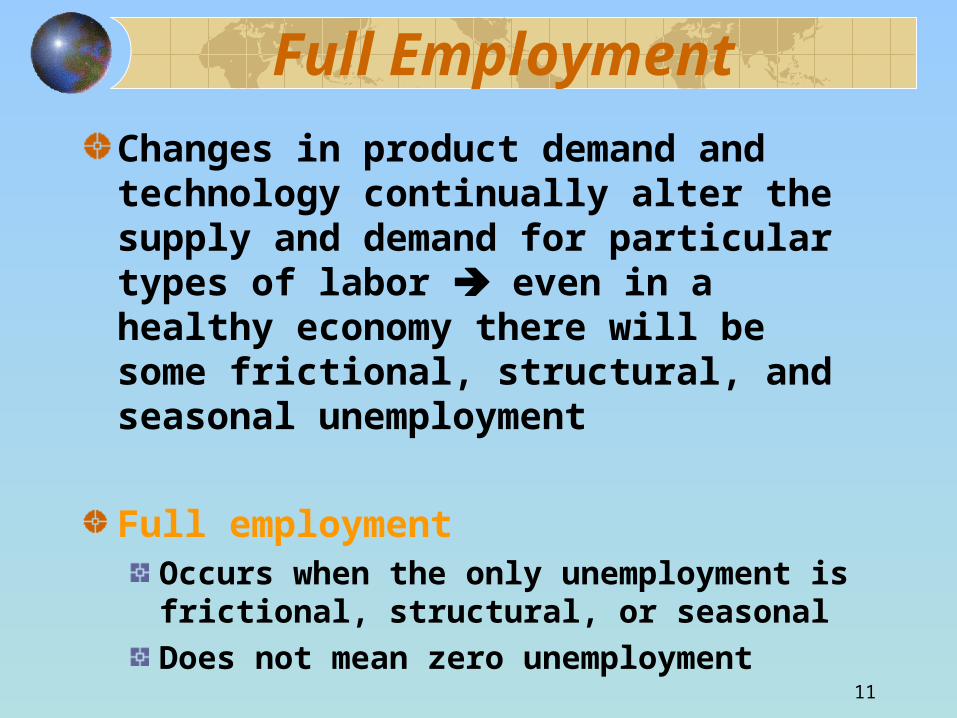
Full Employment
Changes in product demand and technology continually alter the supply and demand for particular types of labor even in a healthy economy there will be some frictional, structural, and seasonal unemployment
Full employment Occurs when the only unemployment is frictional, structural, or seasonalDoes not mean zero unemployment
12
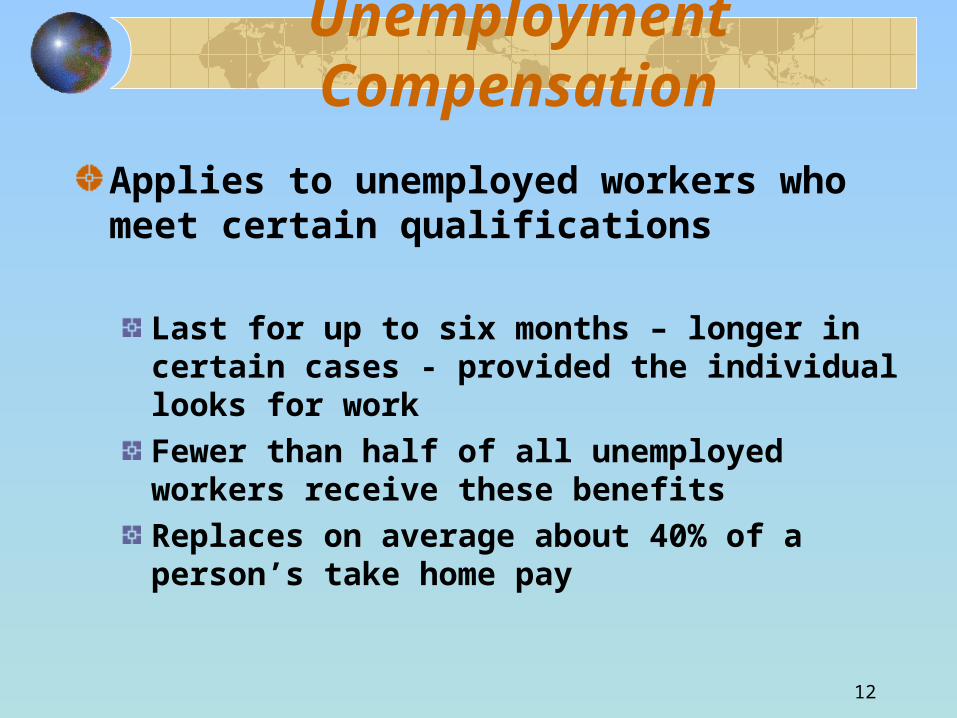
Unemployment Compensation
Applies to unemployed workers who meet certain qualifications
Last for up to six months – longer in certain cases - provided the individual looks for workFewer than half of all unemployed workers receive these benefitsReplaces on average about 40% of a person’s take home pay

13
Unemployment Compensation
Problems with unemployment compensation
Evidence suggests that unemployed workers who receive benefits tend to search less actively than those who don’tMay reduce the urgency of finding work thereby increasing the average duration of unemployment and unemployment rate
On the plus side, it allows for a higher-quality job search

14
0
2
4
6
8
10
12
1983 1985 1987 1989 1991 1993 1995 1997 1999 2001
Per
cent
Une
mpl
oyed
Exhibit 4: Unemployment Rates
Japan
Europe
United States
In the last two decades, the unemployment rate:
Remained high in Europe Fell in the U.S. Rose in Japan

15
Problems with Unemployment Figures
Unemployment figures understate the actual amount of unemployment because of discouraged workers and underemployment
Discouraged workers are those who have stopped looking for workUnderemployment occurs when
• People are counted as employed even if they can find only part-time jobs or
• Are vastly overqualified for their job

16
Problems with Unemployment Figures
Official figures tend to overstate unemployment because
Some people may act as if they are looking for work just to qualify for welfare and unemployment insuranceSome who would prefer to work part time can find only full time workSome are forced to work overtime and weekends but would prefer to work fewer hoursPeople in the underground economy may not readily acknowledge such jobs since their intent is to evade taxes
17
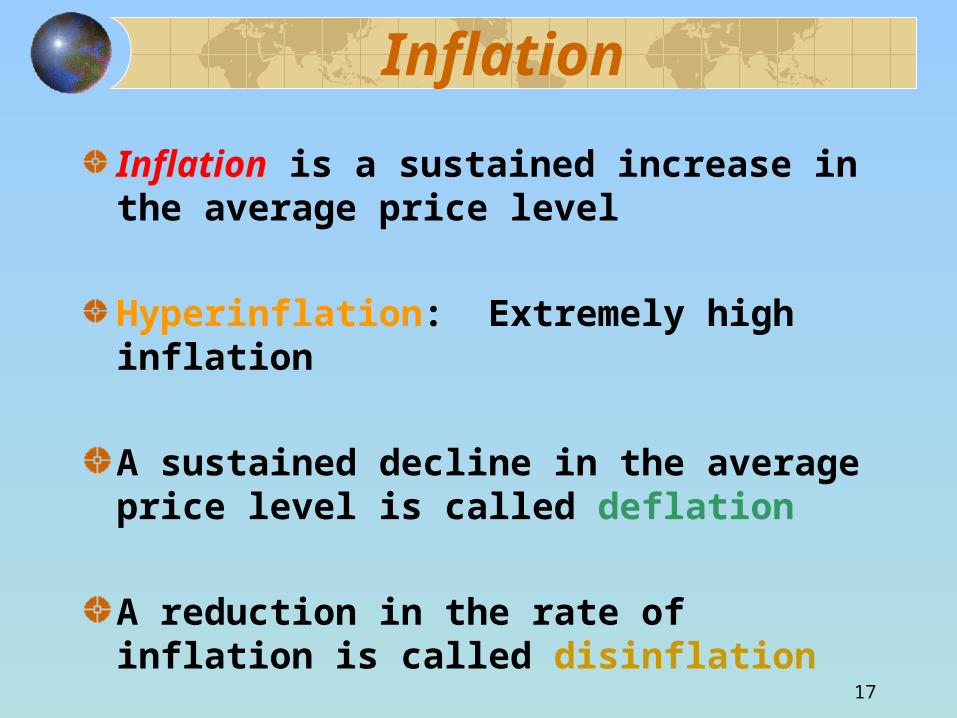
Inflation
Inflation is a sustained increase in the average price level
Hyperinflation: Extremely high inflation
A sustained decline in the average price level is called deflation
A reduction in the rate of inflation is called disinflation

18
Inflation
Typically measure inflation on an annual basis
Annual inflation rate is the percentage increase in the average price level from one year to the next
Two sources of inflationDemand-pull inflationCost-push inflation

19
Exhibit 5a: Sources of Inflation
PriceLevel
P
Aggregate output
AS
AD
A) Demand-pull inflation: inflation induced by an increase in aggregate demand
0
The increase in the aggregate demand curve pulls up the price level. To generate continuousdemand-pull inflation, the aggregate demand curve would have to keep shifting outward along a given aggregate supply curve
AD'
P'

20
Exhibit 5b: Sources of Inflation
PriceLevel
P
Aggregate output
AS
AD
0
AS'
P'
The increase in costs of
productionpush up the price
level. To generate
continuouscost-push
inflation, the aggregate
supply curve would have to
keepshifting to the left
along a givenaggregate
demand curve.
B) Cost-push inflation:Inflation induced by a decrease in aggregate supply

21
Exhibit 6a: Consumer Price Index CPI, consumer price index, measures the cost of a “marketbasket” of consumer goods and services over time.
0
20
40
60
80
100
120
140
160
180
200
Con
sum
er p
rice
inde
x (1
982-
1984
= 1
00)
Source: The CPI Home page of the U.S. Bureau of Labor Statistics at http:\\ftp.bls.gov\pub\special requests.cpi\cpia.html
22
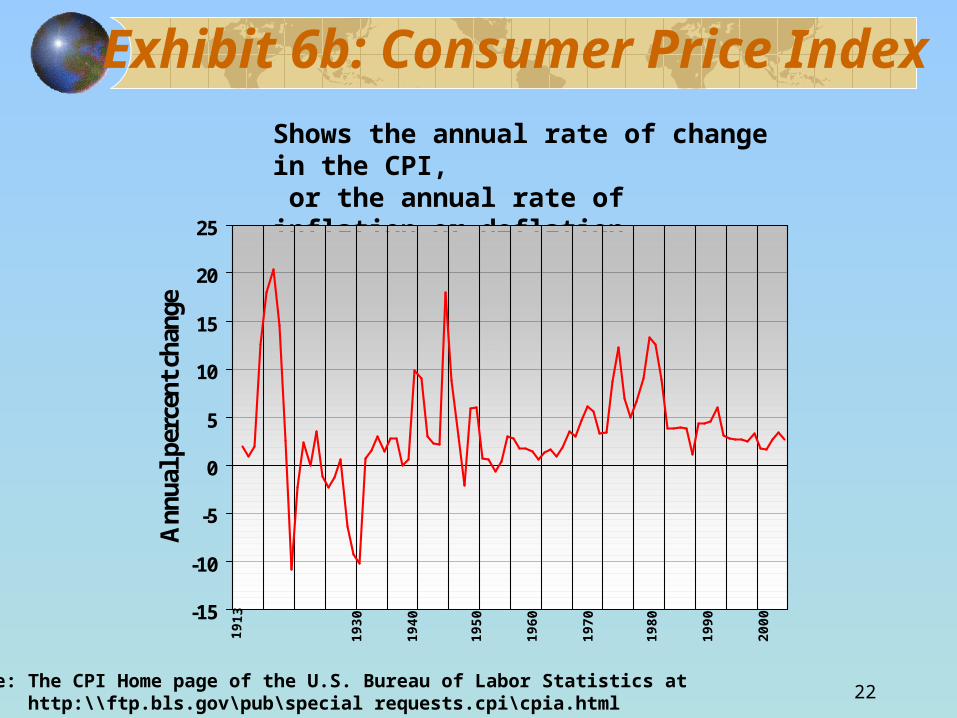
Exhibit 6b: Consumer Price Index Shows the annual rate of change in the CPI, or the annual rate of inflation or deflation
-15
-10
-5
0
5
10
15
20
25
Ann
ual p
erce
nt c
hang
e
1913
194 0
195 0
196 0
197 0
198 0
199 0
200 0
193 0
Source: The CPI Home page of the U.S. Bureau of Labor Statistics at http:\\ftp.bls.gov\pub\special requests.cpi\cpia.html
23
Anticipated versus Unanticipated Inflation
Unanticipated inflation creates more problems for the economy than does anticipated inflation
To the extent that inflation is higher or lower than anticipated, it arbitrarily creates winners and losers

24
Transaction Costs of Inflation
When prices are stable, people correctly believe that they can predict future prices and can therefore plan accordingly
But, if inflation changes unexpectedly, planning gets harder which undermines the ability of money to serve as a link between the present and the future
25
Obscures Relative Price Changes
Relative Prices
The workings of supply and demand mean that the prices of some goods increase while some decrease, e.g., the relative prices of goods and services change

26
Obscures Relative Price Changes
Inflation does not necessarily cause the change in relative prices, but it can obscure them
Since prices usually do not move in unison, tying a particular product’s price to the overall inflation rate may result in a price that is too high or too low based on market conditions

27
Exhibit 7: Inflation Rates in Major Economies Have Trended Lower in Last Two Decades
-1
1
3
5
7
9
11
13
15
19811985
19901995
2000
Ann
ual P
erce
nt I
nfla
tion
Japan
Europe
United States
Developed from annual CPI inflation reported in OECD Economic Outlook, 69 (June 2001). Annex Table 16. Europe averages France, Germany, Italy, and U.K. For latest data go to www.oecd.org/eco/.
28
Inflation and Interest Rates
Nominal interest rateMeasures interest in terms of the current dollars paidAppears on the borrowing agreementThe rate quoted in the news media
Real interest rateEquals the nominal rate of interest minus the inflation rate
29
Why is Inflation Unpopular?
Problems with unanticipated inflationIt hits those whose incomes are fixed in nominal termsArbitrarily redistributes income and wealth from one group to anotherReduces the ability to make long-term plans
• The more variable and unpredictable inflation is, the greater the difficulty of negotiating long-term contracts
Forces buyers and sellers to pay more attention to prices
• Because people must spend more time coping with uncertainty created by inflation, they have less time for production overall productivity of economy falls