Embed Size (px)
Citation preview

10-1 Quality Control
William J. Stevenson
Operations Management
8th edition

10-2 Quality Control
CHAPTER10
Quality Control
McGraw-Hill/IrwinOperations Management, Eighth Edition, by William J. StevensonCopyright © 2005 by The McGraw-Hill Companies, Inc. All rights
reserved.

10-3 Quality Control
Phases of Quality AssurancePhases of Quality Assurance
Acceptancesampling
Processcontrol
Continuousimprovement
Inspectionbefore/afterproduction
Inspection andcorrective
action duringproduction
Quality builtinto theprocess
The leastprogressive
The mostprogressive
Figure 10.1

10-4 Quality Control
InspectionInspection
How Much/How Often Where/When Centralized vs. On-site
Inputs Transformation Outputs
Acceptancesampling
Processcontrol
Acceptancesampling
Figure 10.2

10-5 Quality Control
Co
st
OptimalAmount of Inspection
Inspection CostsInspection Costs
Cost of inspection
Cost of passingdefectives
Total Cost
Figure 10.3

10-6 Quality Control
Where to Inspect in the ProcessWhere to Inspect in the Process
Raw materials and purchased parts
Finished products
Before a costly operation
Before an irreversible process
Before a covering process

10-7 Quality Control
Examples of Inspection PointsExamples of Inspection Points
Type ofbusiness
Inspectionpoints
Characteristics
Fast Food CashierCounter areaEating areaBuildingKitchen
AccuracyAppearance, productivityCleanlinessAppearanceHealth regulations
Hotel/motel Parking lotAccountingBuildingMain desk
Safe, well lightedAccuracy, timelinessAppearance, safetyWaiting times
Supermarket CashiersDeliveries
Accuracy, courtesyQuality, quantity
Table 10.1

10-8 Quality Control
Statistical Process Control: Statistical evaluation of the output of a process during production
Quality of Conformance:A product or service conforms to specifications

10-9 Quality Control
Control ChartControl Chart
Control Chart
Purpose: to monitor process output to see if it is random
A time ordered plot representative sample statistics obtained from an on going process (e.g. sample means)
Upper and lower control limits define the range of acceptable variation

10-10 Quality Control
Control ChartControl Chart
0 1 2 3 4 5 6 7 8 9 10 11 12 13 14 15
UCL
LCL
Sample number
Mean
Out ofcontrol
Normal variationdue to chance
Abnormal variationdue to assignable sources
Abnormal variationdue to assignable sources
Figure 10.4

10-11 Quality Control
Statistical Process ControlStatistical Process Control
The essence of statistical process control is to assure that the output of a process is random so that future output will be random.
10-12 Quality Control
Statistical Process ControlStatistical Process Control
The Control Process Define Measure Compare Evaluate Correct Monitor results

10-13 Quality Control
Statistical Process ControlStatistical Process Control
Variations and Control Random variation: Natural variations in the
output of a process, created by countless minor factors
Assignable variation: A variation whose source can be identified
10-14 Quality Control
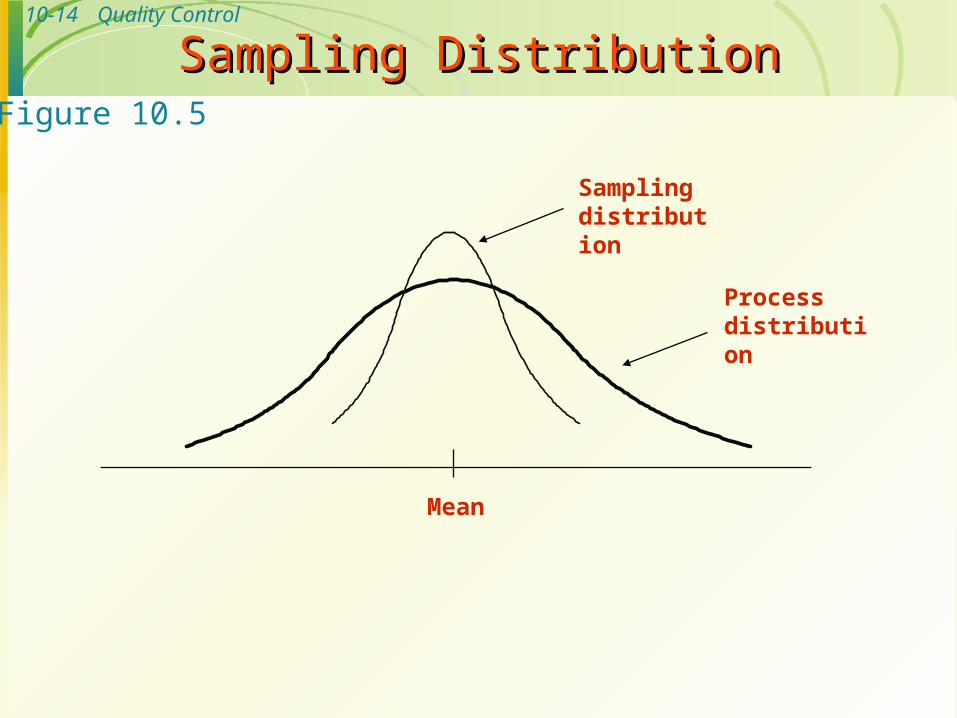
Sampling DistributionSampling Distribution
Samplingdistribution
Processdistribution
Mean
Figure 10.5

10-15 Quality Control
Normal DistributionNormal Distribution
Mean
95.44%
99.74%
Standard deviation
Figure 10.6

10-16 Quality Control
Control LimitsControl Limits
Samplingdistribution
Processdistribution
Mean
Lowercontrol
limit
Uppercontrol
limit
Figure 10.7

10-17 Quality Control
Control Charts for VariablesControl Charts for Variables
Mean control charts
Used to monitor the central tendency of a process.
X bar charts
Range control charts
Used to monitor the process dispersion
R charts
Variables generate data that are Variables generate data that are measuredmeasured..

10-18 Quality Control
Mean and Range ChartsMean and Range Charts
UCL
LCL
UCL
LCL
R-chart
x-Chart Detects shift
Does notdetect shift
Figure 10.10A
(process mean is shifting upward)
SamplingDistribution

10-19 Quality Control
x-Chart
UCL
Does notreveal increase
Mean and Range ChartsMean and Range Charts
UCL
LCL
LCL
R-chart Reveals increase
Figure 10.10B
(process variability is increasing)SamplingDistribution

10-20 Quality Control
Control Chart for AttributesControl Chart for Attributes
p-Chart - Control chart used to monitor the proportion of defectives in a process
c-Chart - Control chart used to monitor the number of defects per unit
Attributes generate data that are Attributes generate data that are countedcounted..

10-21 Quality Control
Use of p-ChartsUse of p-Charts
When observations can be placed into two categories. Good or bad Pass or fail Operate or don’t operate
When the data consists of multiple samples of several observations each
Table 10.3

10-22 Quality Control
Use of c-ChartsUse of c-Charts
Use only when the number of occurrences per unit of measure can be counted; non-occurrences cannot be counted. Scratches, chips, dents, or errors per item Cracks or faults per unit of distance Breaks or Tears per unit of area Bacteria or pollutants per unit of volume Calls, complaints, failures per unit of time
Table 10.3

10-23 Quality Control
Use of Control ChartsUse of Control Charts
At what point in the process to use control charts
What size samples to take
What type of control chart to use
Variables
Attributes

10-24 Quality Control
Tolerances or specifications
Range of acceptable values established by engineering design or customer requirements
Process variability
Natural variability in a process
Process capability
Process variability relative to specification
Process CapabilityProcess Capability

10-25 Quality Control
Process CapabilityProcess Capability
LowerSpecification
UpperSpecification
A. Process variability matches specifications
LowerSpecification
UpperSpecification
B. Process variability well within specifications
LowerSpecification
UpperSpecification
C. Process variability exceeds specifications
Figure 10.15
10-26 Quality Control
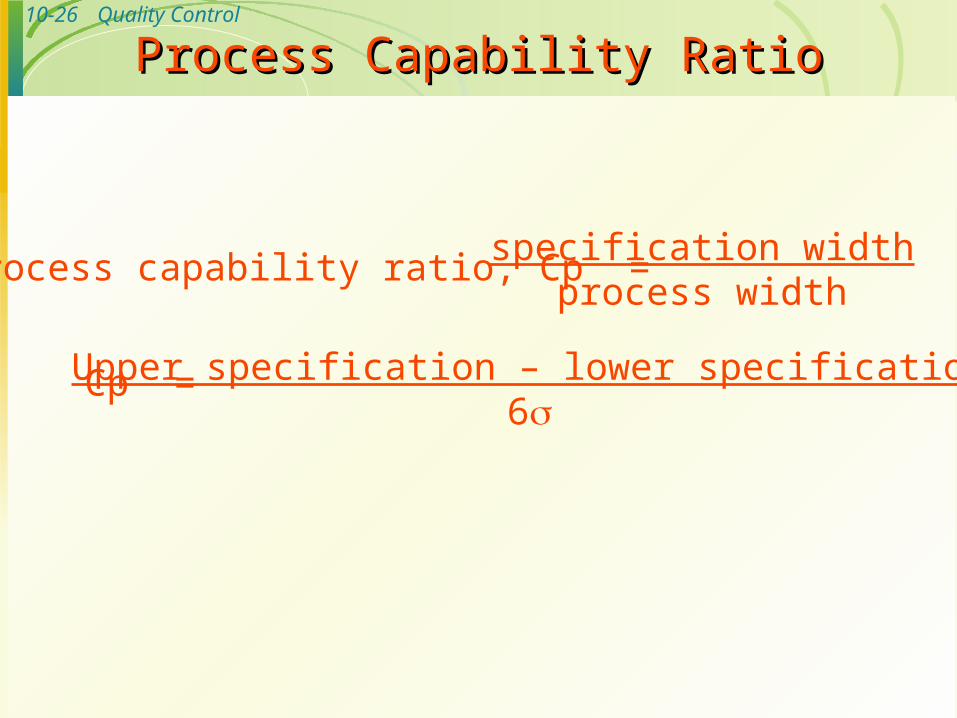
Process Capability RatioProcess Capability Ratio
Process capability ratio, Cp = specification widthprocess width
Upper specification – lower specification6
Cp =
10-27 Quality Control
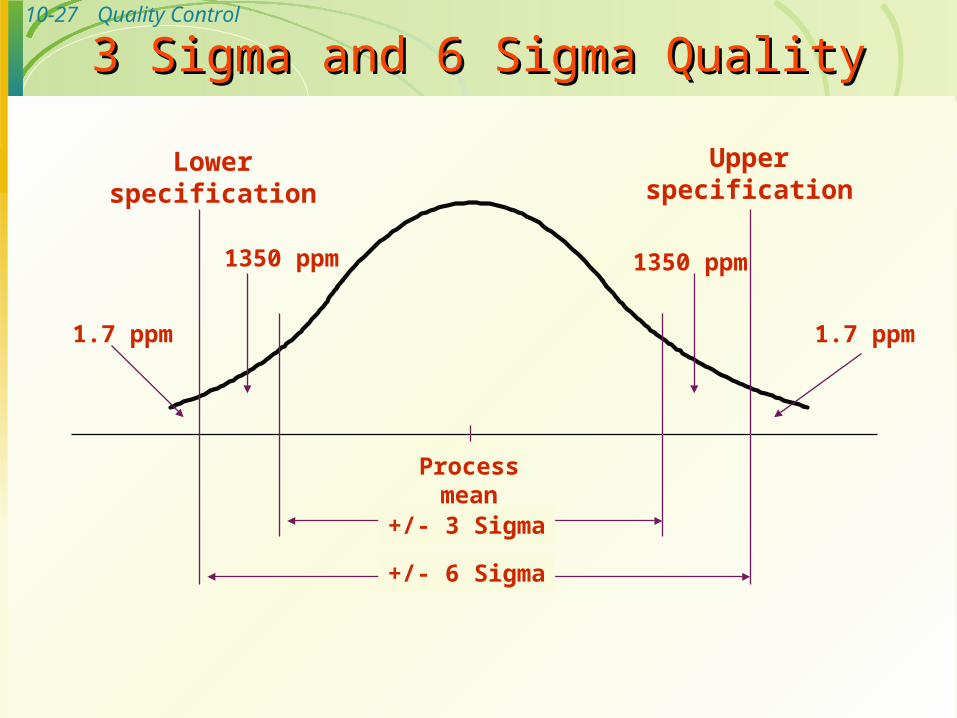
Processmean
Lowerspecification
Upperspecification
1350 ppm 1350 ppm
1.7 ppm 1.7 ppm
+/- 3 Sigma
+/- 6 Sigma
3 Sigma and 6 Sigma Quality3 Sigma and 6 Sigma Quality
10-28 Quality Control
Improving Process CapabilityImproving Process Capability
Simplify Standardize Mistake-proof Upgrade equipment Automate

10-29 Quality Control
Limitations of Capability IndexesLimitations of Capability Indexes
1. Process may not be stable
2. Process output may not be normally distributed
3. Process not centered but Cp is used

10-30 Quality Control
Additional PowerPoint slides contributed by Geoff Willis, University of Central Oklahoma.
CHAPTER10

10-31 Quality Control
Control Charts in GeneralControl Charts in General
Are named according to the statistics being plotted, i.e., X bar, R, p, and c
Have a center line that is the overall average Have limits above and below the center line
at ± 3 standard deviations (usually)
Center line
Lower Control Limit (LCL)
Upper Control Limit (UCL)
10-32 Quality Control
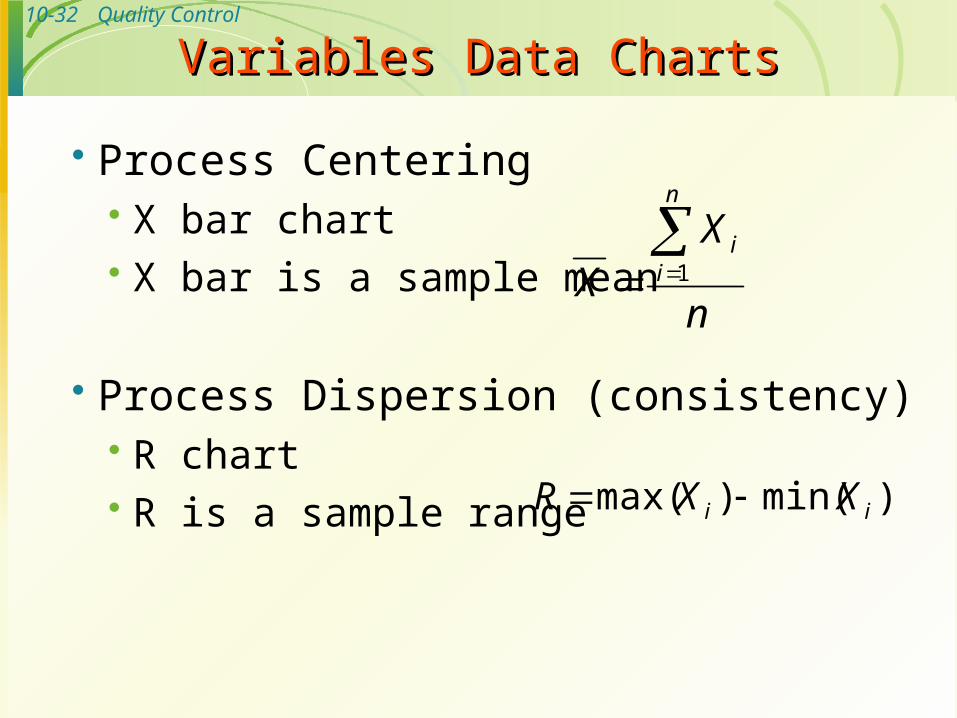
Variables Data ChartsVariables Data Charts
Process Centering X bar chart X bar is a sample mean
Process Dispersion (consistency) R chart R is a sample range
n
XX
n
ii
1
)min()max( ii XXR

10-33 Quality Control
X bar chartsX bar charts
Center line is the grand mean (X double bar) Points are X bars
xzXUCL
nx
/
xzXLCL
m
X
X
m
jj
1
RAXUCL 2 RAXLCL 2
-OR-

10-34 Quality Control
R ChartsR Charts
Center line is the grand mean (R bar) Points are R D3 and D4 values are tabled according to n
(sample size)
RDUCL 4 RDLCL 3

10-35 Quality Control
Use of X bar & R chartsUse of X bar & R charts
Charts are always used in tandem Data are collected (20-25 samples) Sample statistics are computed All data are plotted on the 2 charts Charts are examined for randomness If random, then limits are used “forever”

10-36 Quality Control
Attribute ChartsAttribute Charts
c charts – used to count defects in a constant sample size
centerlinem
cc
n
i 1
czcUCL
czcLCL

10-37 Quality Control
Attribute ChartsAttribute Charts
p charts – used to track a proportion (fraction) defective
centerlinenm
x
m
pp ij
m
j
1
n
ppzpUCL
)1( n
ppzpLCL
)1(
n
xp
n
ii
i
1

10-38 Quality Control
Process CapabilityProcess Capability
The ratio of process variability to design specifications
Upper
Spec
Lower
Spec
Natural data spread
The natural spread of the data is 6σ-1σ +2σ-2σ +1σ +3σ-3σ µ

10-39 Quality Control
TrainingTraining
MQ4
Job rotation/quality fatigue at Honda

10-40 Quality Control
Quality MeasurementQuality Measurement
STA10
Monitoring
10-41 Quality Control
Services/MeasurementServices/Measurement
STAO3
Survey/Efficiency, Admission/Discharge


![[John Grainger, William D. Stevenson] Power System(BookZZ.org)](https://img.pdfslide.net/doc/110x75/55cf916d550346f57b8d7bbf/john-grainger-william-d-stevenson-power-systembookzzorg.jpg)