Embed Size (px)
Citation preview
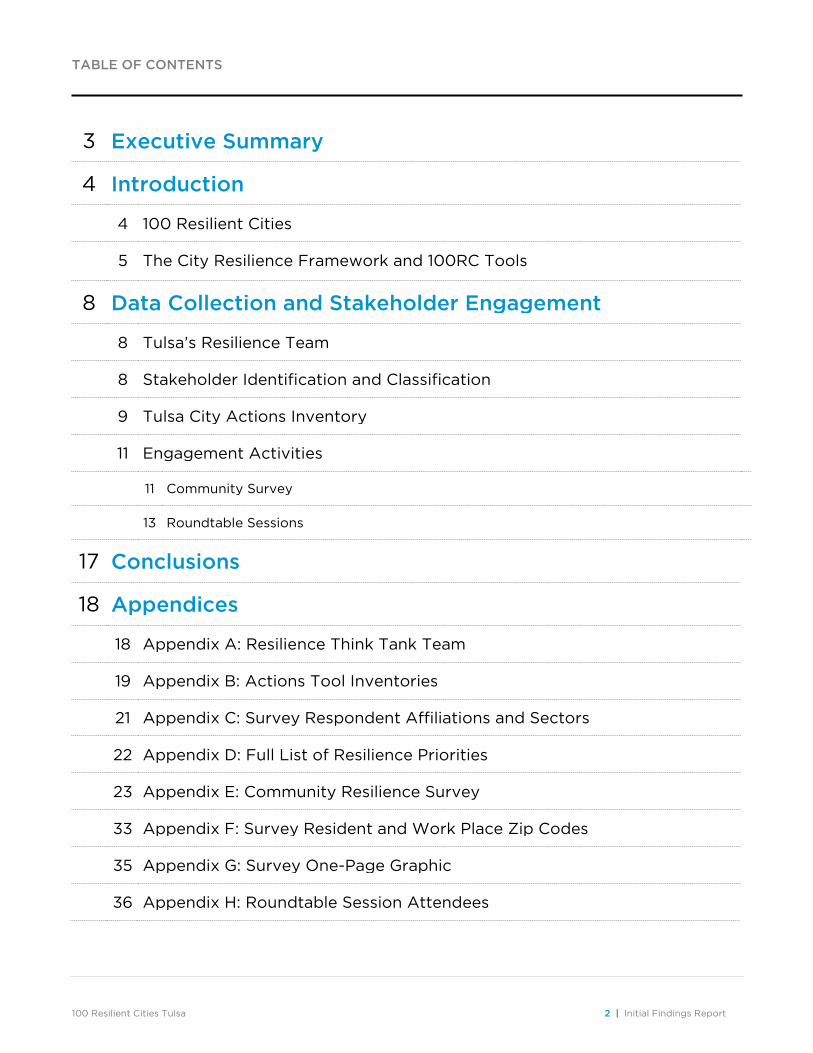
TABLE OF CONTENTS
100 Resilient Cities Tulsa 2 | Initial Findings Report
3 Executive Summary
4 Introduction
4 100 Resilient Cities
5 The City Resilience Framework and 100RC Tools
8 Data Collection and Stakeholder Engagement
8 Tulsa’s Resilience Team
8 Stakeholder Identification and Classification
9 Tulsa City Actions Inventory
11 Engagement Activities
11 Community Survey
13 Roundtable Sessions
17 Conclusions
18 Appendices
18 Appendix A: Resilience Think Tank Team
19 Appendix B: Actions Tool Inventories
21 Appendix C: Survey Respondent Affiliations and Sectors
22 Appendix D: Full List of Resilience Priorities
23 Appendix E: Community Resilience Survey
33 Appendix F: Survey Resident and Work Place Zip Codes
35 Appendix G: Survey One-Page Graphic
36 Appendix H: Roundtable Session Attendees
EXECUTIVE SUMMARY
100 Resilient Cities Tulsa 3 | Initial Findings Report
Executive Summary
100 Resilient Cities (100RC) – pioneered by The Rockefeller Foundation, is a two-year grant program to support cities around the world to become more resilient to the physical, social, and economic challenges that are a growing part of the 21st century.
The City of Tulsa, which applied in 2014, was selected as one of the one hundred cites supported by the Foundation to develop a citywide Resilience Strategy. The City, led by the Chief Resilience Officer (CRO) and the core resilience team (RT3), has begun efforts to fully understand the complex challenges and potential approaches to its common shocks and stresses. The research and perception-gathering to date has provided a foundation for future work in 2017. As part of this foundational work, the CRO and RT3 have:
• Compiled and organized current Actions / Plans into the Actions Inventory Tool;
• Tabulated a list of key stakeholders from across several sectors;
• Developed and conducted a public Community Survey; and
• Facilitated a series of roundtable discussions with community stakeholders to gather additional key perceptions.
From the findings of these initiatives, the following preliminary priority areas identified are:
• Mobility and Transit: Transportation received the highest number of responses for “needs improvement” from respondents in the public survey - over 60% of survey respondents agree that both transport infrastructure and transport networks “need to do better.” Related to this, Tulsa’s rating of resilience priorities in the public survey indicated the top resilience priority was to address was “Aging Infrastructure.” While INCOG is currently implementing the GO Plan, a regional bicycle and pedestrian master planning initiative, organizers of this and similar plans would benefit from coordinating with the City’s resilience team to ensure the promotion of multiple benefits and Actions that truly improve resilience;
• Social Stability, Security and Justice: These indicators received the highest number of respondents of any driver in the public survey. Additionally, this driver ranked the lowest in terms of number of programs listed in the City Actions Inventory, and 66% of survey respondents said this area “needs to do better”. These survey responses on social stability and justice reinforce today’s common headlines and the challenges surrounding law enforcement and community relations; it is therefore critical that the City continue to improve these indicators.
• Public Health: Over 46% of survey respondents noted that indicators such as access to medical facilities and emergency health care “need to do better.” The Tulsa City Actions Inventory did not note a significant presence of currently existing public health services actions. With the growing role of healthcare as an economic driver in communities around the country, more research and analysis should be undertaken in this area.
With the understanding that developing a meaningful Resilience Strategy is an inclusive community-wide process that no one party can undertake in isolation, this Initial Findings Report documents the approach which stakeholders’ perspectives from across Tulsa were gathered and the preliminary findings from those efforts. This report aims to create a foundation to inform future work undertaken through the new administration in 2017 as part of the effort to develop Tulsa’ Resilience Strategy.
INTRODUCTION
100 Resilient Cities Tulsa 4 | Initial Findings Report
100 Resilient Cities
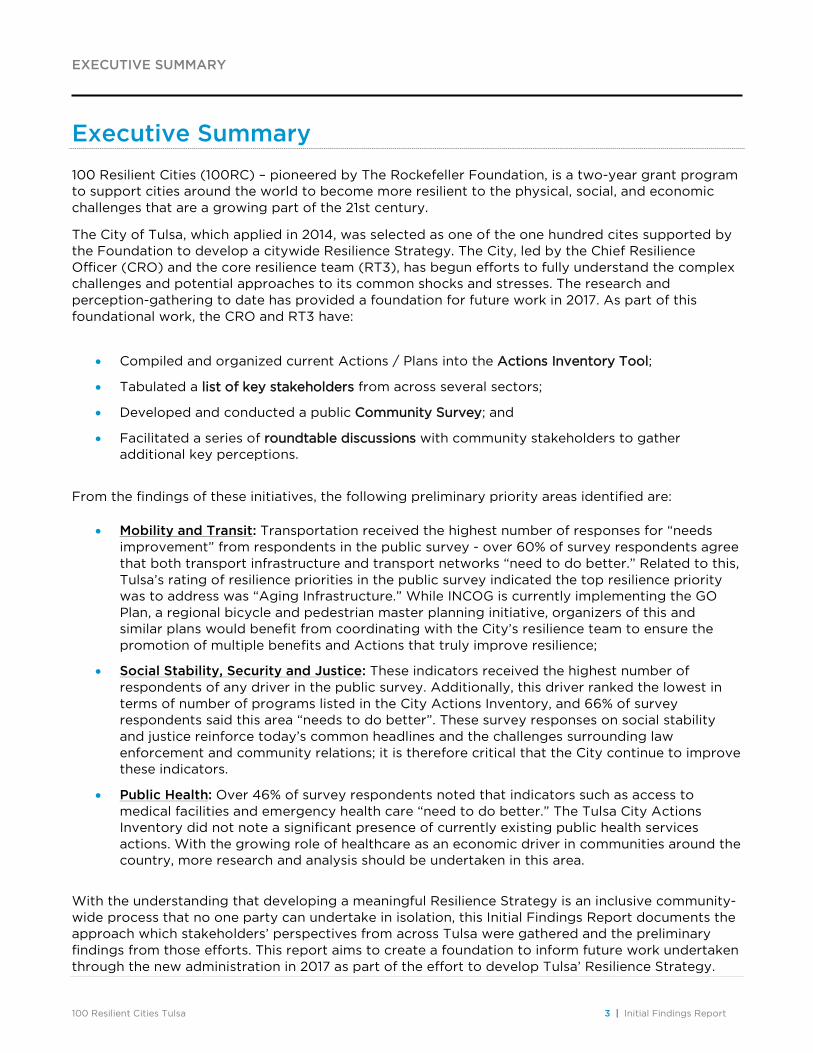
Figure 1: Resilience Strategy Plan
Source: 100RC
The 100 Resilient Cities (100RC) – pioneered by The Rockefeller Foundation, is a two-year grant program that supports cities around the world become more resilient to the physical, social, and economic challenges facing modern urban centers. This includes not only the shocks that cities must grapple with, but long-term stresses that weaken cities over generations. 100RC acts through four main resources pathways:
• Financial and logistical guidance: Establishes, in coordination with city leadership, a Chief Resilience Officer who is charged with leading the city’s resilience efforts;
• Supervisory expertise: Provides 100RC and strategy partner staff to assist each city tailor and develop its Resilience Strategy;
• Access to resources: Facilitates access to solutions, service providers, and public and private partners who assist in the Resilience Strategy process; and
• Membership: Unlocks a global network of member cities who can learn from one another.
All cities participating in the 100RC program develop their Resilience Strategy through an agenda setting workshop and two phases of work that result in a strategy that addresses, in specific measurable action-items, how they can proactively prepare for and react to major challenges affecting the city. The agenda setting workshop and two phases of the Resilience Strategy development are described in more detail below:
• Agenda Setting Workshop: On September 25, 2015, the City of Tulsa, 100RC, and HR&A
Advisors convened 57 stakeholders from a multitude of public and private institutions, along with 100RC Platform Partner representatives, at The Helmerich Center for American Research
at the Gilcrease Museum to engage in a dialogue about Tulsa’s resilience, focused on four goals:
Introduce Tulsa to the 100 Resilient Cities initiative; Familiarize participants with the City Resilience Framework and resilience concepts;
INTRODUCTION
100 Resilient Cities Tulsa 5 | Initial Findings Report
Identify Tulsa’s resilience issues; and Connect stakeholders.
The workshop was successful in achieving these objectives. In particular, it brought together a broad range of stakeholders who will be critical to the success of the 100RC initiative in Tulsa, including representatives from City and regional government, local nonprofits, the private sector, faith-based organizations, academic institutions, and philanthropic groups.
• Phase I: Establishing the Foundation for Building Resilience: In this phase, the City and
100RC begin the strategy process and hire the CRO. The CRO mobilizes a team to build a support network comprised of public and private institutions and stakeholders, collect and organize relevant data to diagnose the City’s Resilience context, and develop a custom scope of work for Phase I.
• Phase II: New Analysis, Opportunities, and Partnerships: Building on the stakeholder engagement and data analysis of Phase I, Phase II involves the exploration of bigger citywide challenges and an expansion of the resilience team and supporters. The end result of Phase II is a citywide Resilience Strategy.
The City Resilience Framework and 100RC Tools
All cities are exposed to a large spectrum of natural and man-made stresses that can potentially cause detrimental systemic problems such as economic decline or physical decay. The City Resilience Framework (CRF) is a unique framework developed by Arup and supported by the Rockefeller Foundation as a means for understanding urban complexities, as well as the drivers that contribute to a city’s resilience. In this vein, it serves as the basis for a series of tools used throughout the 100RC process to measure resilience. The Actions tool, which enables the city to capture relevant information about the resilience of the city through the existing and proposed plans and initiatives, uses the CRF to divide actions into overarching dimensions, drivers and indicators. The City of Tulsa’s initial Actions Tool inventory can be seen on pages 9-10 and Appendix B. The Perceptions Tool, another resource employing the CRF, enables a city to capture relevant information about the resilience of the city through the perceptions of a broad range of stakeholders, is detailed on pages 14-16.
INTRODUCTION
100 Resilient Cities Tulsa 6 | Initial Findings Report
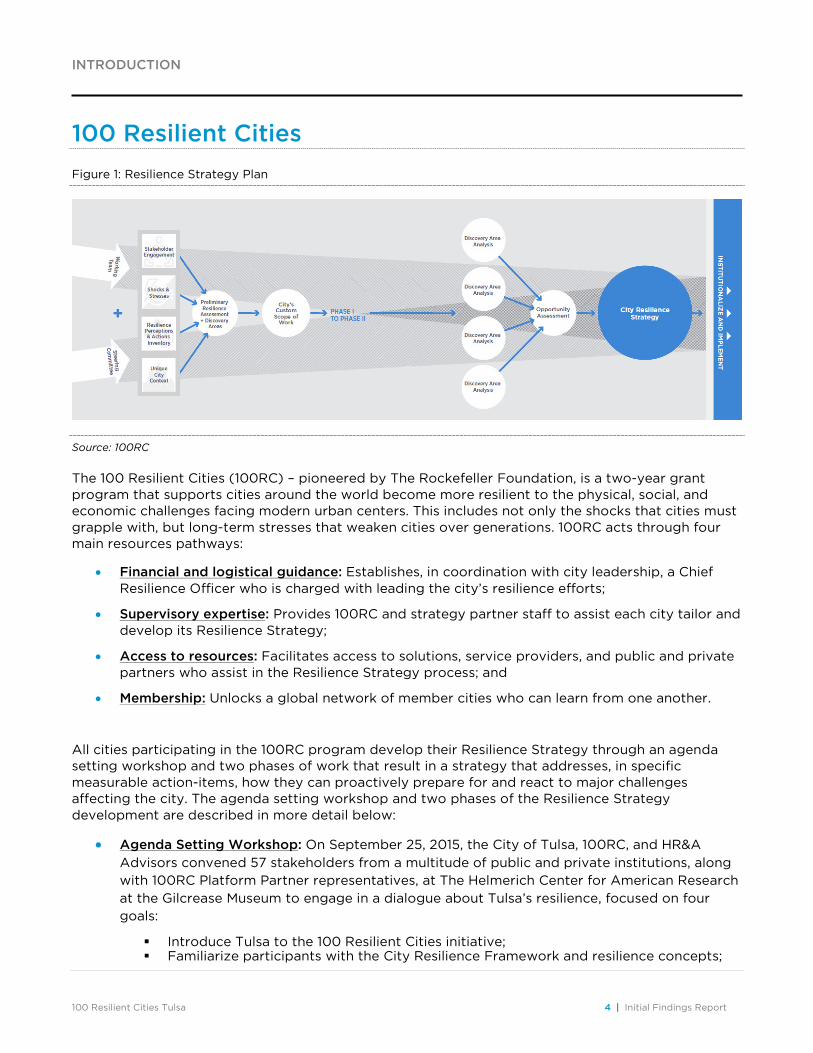
Figure 2: City Resilience Framework Wheel
Source: 100RC Tulsa The CRF Wheel is structured on four overarching dimensions, with three drivers defining each dimension, and a number of indicators specific to each driver. The dimensions, drivers and indicators on the following page cover the range of factors contributing to a city’s resilience.
INTRODUCTION
100 Resilient Cities Tulsa 7 | Initial Findings Report
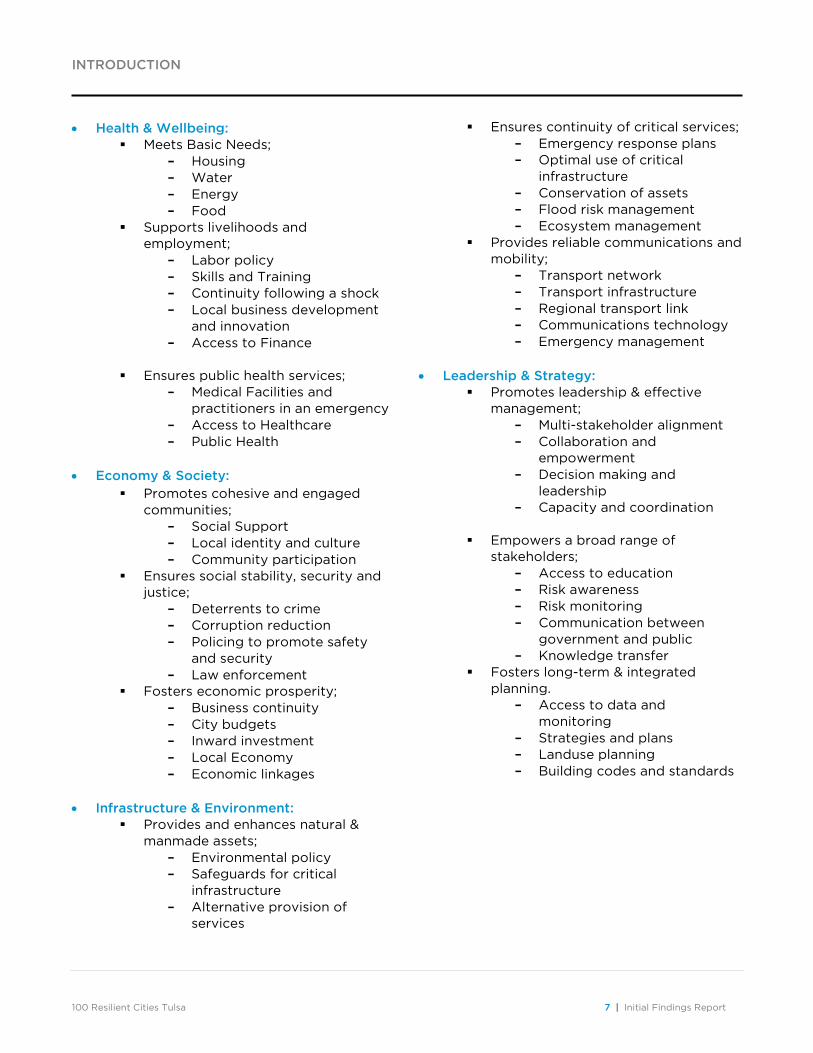
• Health & Wellbeing: Meets Basic Needs;
– Housing – Water – Energy – Food
Supports livelihoods and employment;
– Labor policy – Skills and Training – Continuity following a shock – Local business development
and innovation – Access to Finance
Ensures public health services;
– Medical Facilities and practitioners in an emergency
– Access to Healthcare – Public Health
• Economy & Society:
Promotes cohesive and engaged communities;
– Social Support – Local identity and culture – Community participation
Ensures social stability, security and justice;
– Deterrents to crime – Corruption reduction – Policing to promote safety
and security – Law enforcement
Fosters economic prosperity; – Business continuity – City budgets – Inward investment – Local Economy – Economic linkages
• Infrastructure & Environment:
Provides and enhances natural & manmade assets;
– Environmental policy – Safeguards for critical
infrastructure – Alternative provision of
services
Ensures continuity of critical services; – Emergency response plans – Optimal use of critical
infrastructure – Conservation of assets – Flood risk management – Ecosystem management
Provides reliable communications and mobility;
– Transport network – Transport infrastructure – Regional transport link – Communications technology – Emergency management
• Leadership & Strategy:
Promotes leadership & effective management;
– Multi-stakeholder alignment – Collaboration and
empowerment – Decision making and
leadership – Capacity and coordination
Empowers a broad range of
stakeholders; – Access to education – Risk awareness – Risk monitoring – Communication between
government and public – Knowledge transfer
Fosters long-term & integrated planning.
– Access to data and monitoring
– Strategies and plans – Landuse planning – Building codes and standards
DATA COLLECTION AND STAKEHOLDER ENGAGEMENT
100 Resilient Cities Tulsa 8 | Initial Findings Report
Tulsa’s Resilience Team
The Resilience Think Tank Team In May 2016, the City’s CRO, supported by 100RC and HR&A, convened a group of individuals to act as the core team supporting the City’s efforts during the 100RC process. This group, collectively known as the Resilient Think Tank Team (RT3) – with members from City government, private practice and the non-profit realm – were assembled to act as a sounding-board and support system for the CRO throughout the program. The members of the team were selected because of their commitment to resilience and the future development of the City of Tulsa and bring a set of diverse perspectives and thoughtful insight to the strategy development process. The RT3 team regularly convenes to collaborate and provide ongoing support and expertise to the City and the CRO. A full listing of the team members may be found in Appendix A.
Stakeholder Identification and Classification
Identification As part of the development of a Resilience Strategy, the 100RC program strives to garner input from a variety of stakeholders across the government, business, non-profit and community spectrum, incorporating perspectives from sectors of the community often overlooked and underrepresented. As part of the process, a series of stakeholder engagement activities occurs, some of which, including roundtable discussions and a public community survey, have already occurred. To develop a single listing of potential stakeholders, the RT3 used data from the Agenda-Setting Workshop to create a comprehensive stakeholder list of 534 representatives from the following category sectors:
Animal Protection Neighborhood Organizations Arts & Culture Nonprofits Aviation and Aerospace Oil & Gas City of Tulsa Councilors Philanthropic Foundations City of Tulsa Department Heads and Staff Retail Communications Real Estate Construction Regional Partners Design professionals Religious Economic Development Social Services Education State Government Environmental Agencies Tourism Financial Services Transportation Food Securities Tribes Healthcare Utilities Housing Volunteers Insurance Workforce Training Media Youth Organizations
DATA COLLECTION AND STAKEHOLDER ENGAGEMENT
100 Resilient Cities Tulsa 9 | Initial Findings Report
Classification Using the CRF, the selected stakeholders were then classified into one of the four CRF dimensions, in order understand if adequate representation on all dimensions existed:
1. Health & Wellbeing;
2. Economy & Society;
3. Infrastructure & Environment; and
4. Leadership & Strategy.
The classification of stakeholders into one of the CRF dimensions helps to ensure that data collected comes from a comprehensive range of influence and expertise. While this is important, it is also essential to ensure our stakeholders come from a range of visibility, including major public and private stakeholders as well as underrepresented populations and organizations. Additional stakeholders may be added to this document as the program progresses.
Tulsa City Actions Inventory
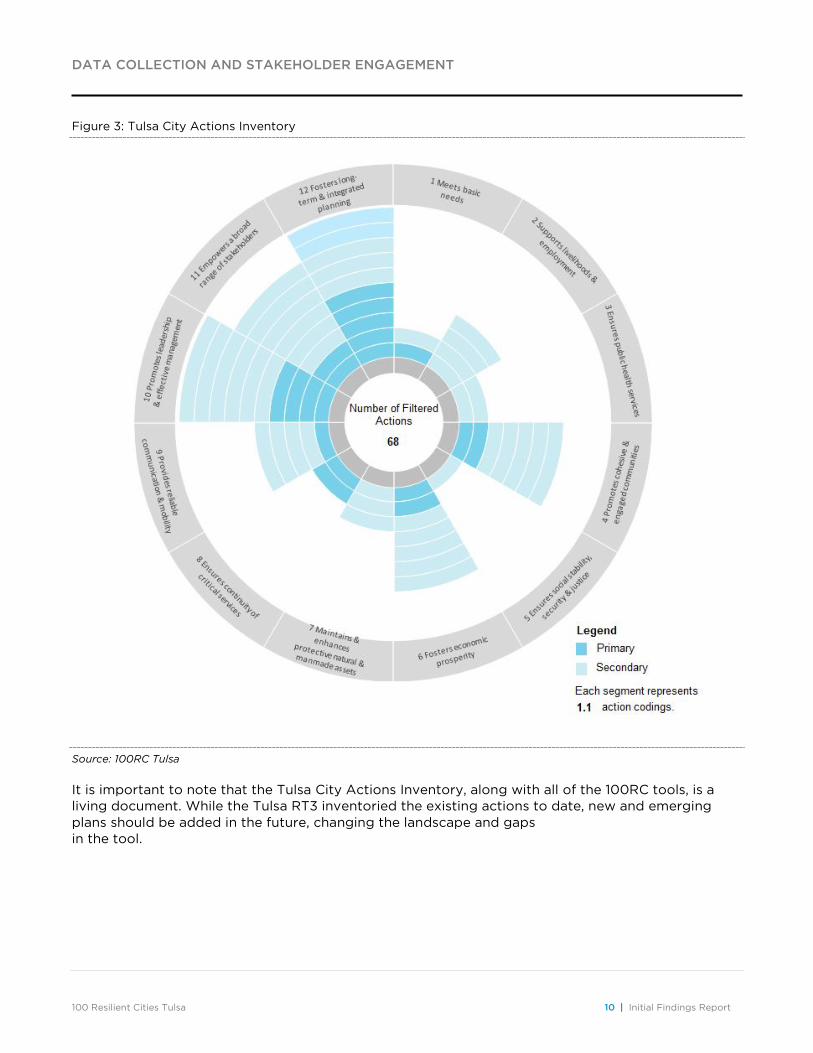
The RT3 collected and tabulated the City’s current Actions which are programs, plans, policies and initiatives that the City, the private sector, and the non-profit realm are currently planning or undertaking and coded the findings into the relevant drivers and indicators of the CRF. This exercise, the City Actions Inventory, allowed the RT3 to understand how existing Actions contribute to the current state of Tulsa’s resilience. The RT3 gathered and coded 68 individual plans for this tool through a combination of reviewing existing City of Tulsa planning documents and consulting with local agencies and foundations. A full list of these documents, agencies and foundations can be found in Appendix B.
The purpose of the Actions Inventory Tool is to provide insight into what areas the City is currently focusing efforts and where improvement should be made. The output of the tool, shown in Figure 3, indicates that each of the 12 resilience drivers are represented, although there is a wide discrepancy between those plans that represent drivers with a large amount of focus and those with very little focus. Certain areas such as social justice and public health services, are underrepresented in the Actions inventory, potentially indicating a great need to focus on these critical constituencies in the future.
DATA COLLECTION AND STAKEHOLDER ENGAGEMENT
100 Resilient Cities Tulsa 10 | Initial Findings Report
Figure 3: Tulsa City Actions Inventory
Source: 100RC Tulsa
It is important to note that the Tulsa City Actions Inventory, along with all of the 100RC tools, is a living document. While the Tulsa RT3 inventoried the existing actions to date, new and emerging plans should be added in the future, changing the landscape and gaps in the tool.
DATA COLLECTION AND STAKEHOLDER ENGAGEMENT
100 Resilient Cities Tulsa 11 | Initial Findings Report
Engagement Activities
Engaging with a diverse group of stakeholders within the broader Tulsa community is essential to the success of the 100RC program. Throughout the summer of 2016, the RT3 engaged with a variety of public and private stakeholders using two engagement methods: a public community survey and a series of roundtable discussions. The ultimate goal of these, and future engagement activities, is to gather comprehensive and accurate perceptions of the city’s current strengths and weaknesses. Information gathered from these activities was entered into the Perceptions Tool, detailed in Figures 4 and 5, which standardizes and analyzes stakeholder perceptions regarding the resilience of Tulsa.
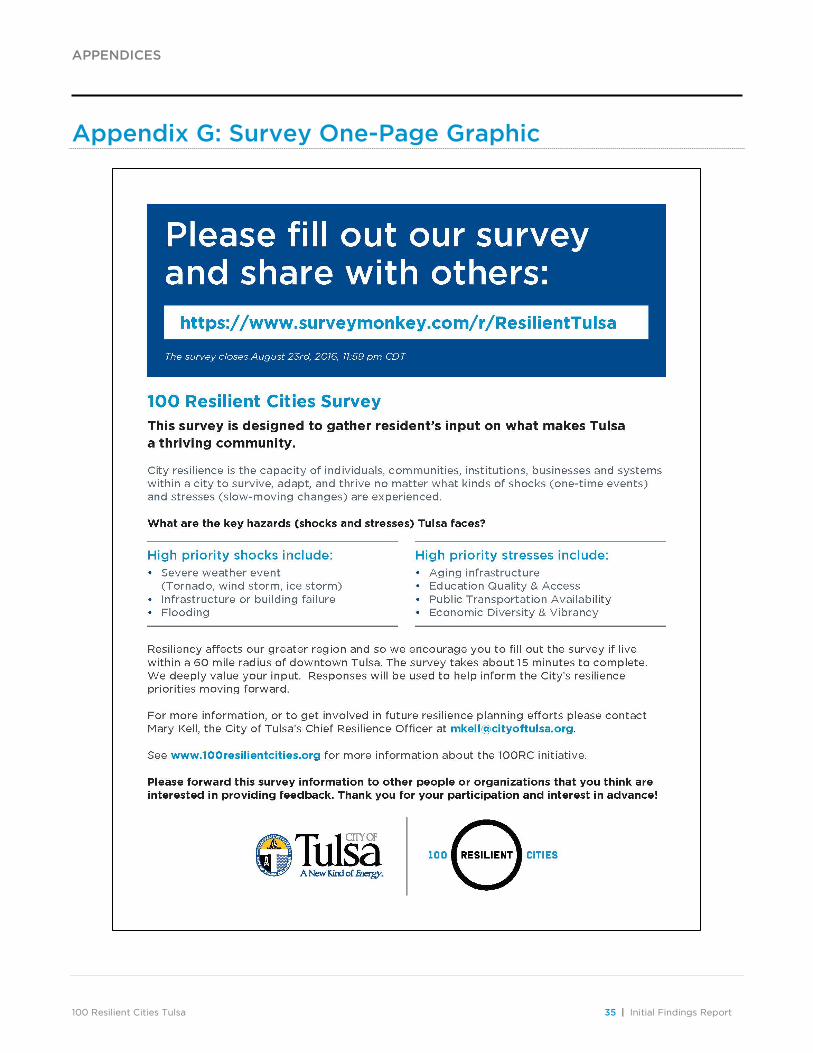
Community Survey The City conducted an online community survey from July 19th through August 23rd, 2016, in an attempt to gather a wide range of community perceptions regarding Tulsa’s baseline resilience and future resilience goals. The survey was distributed through a variety of outlets including local TV, print media, the City’s website, and social media. The survey consisted of three key focus areas:
1. Self-identification of respondents;
2. Rating Tulsa’s resilience indicators; and
3. Rating Tulsa’s resilience priorities.
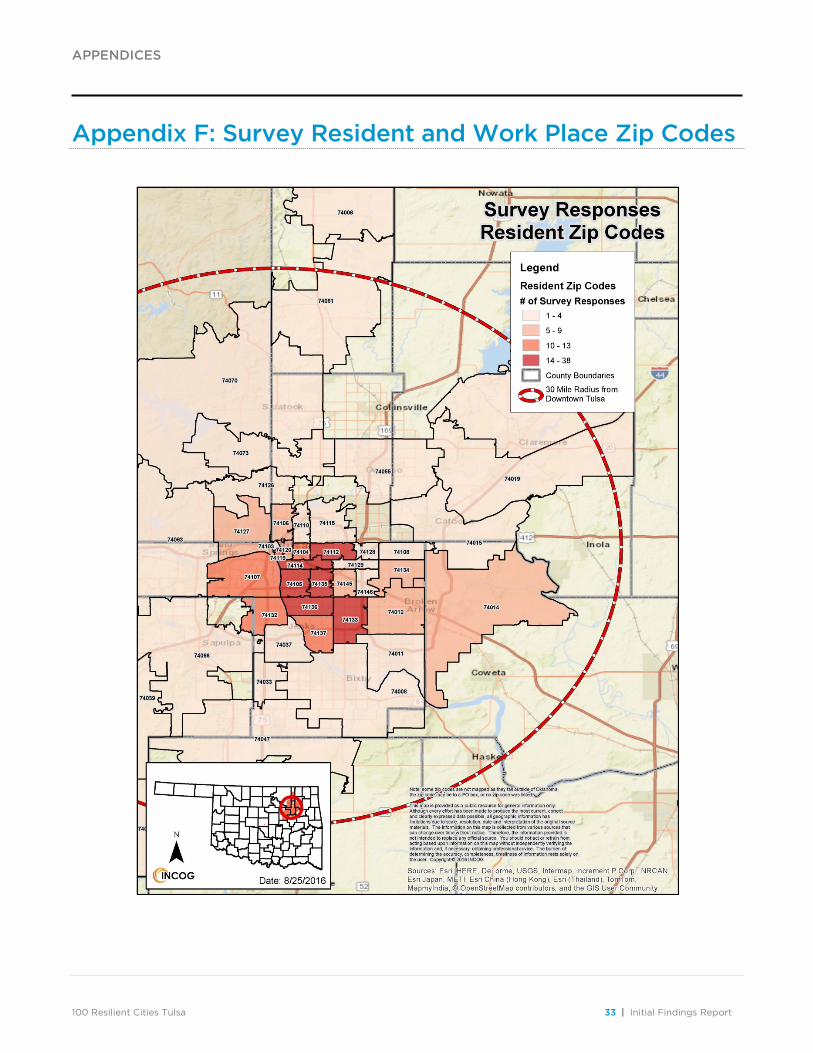
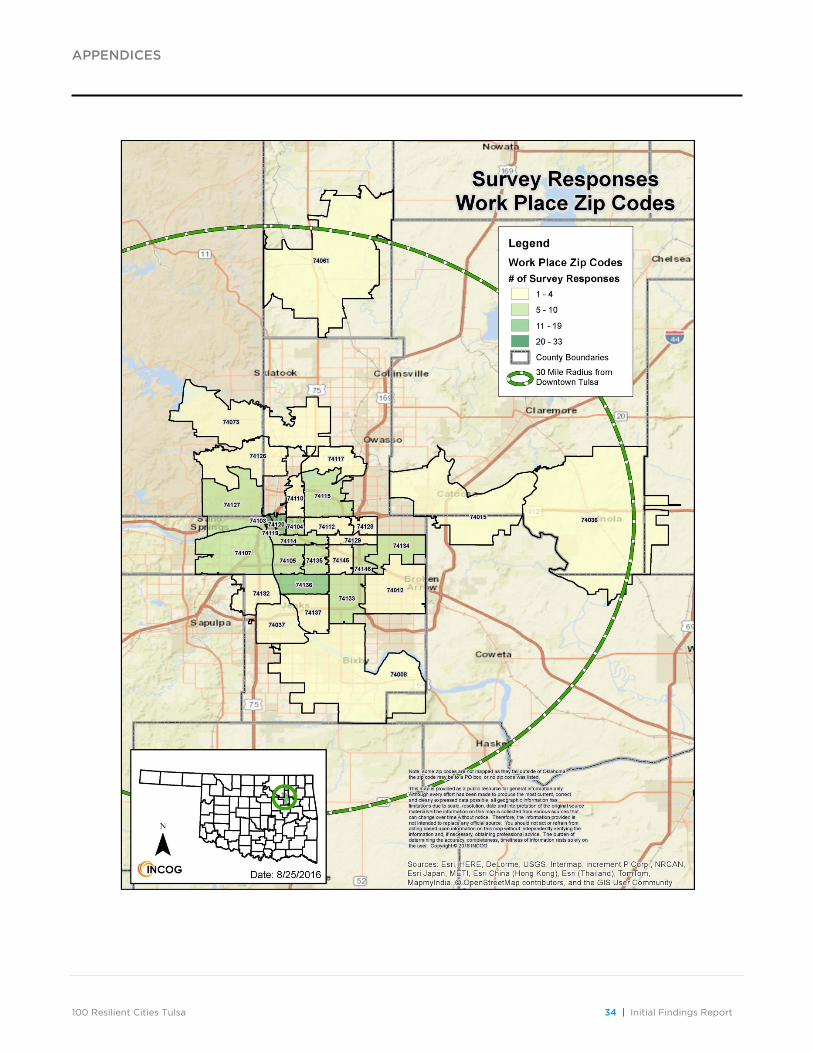
A total of 557 people responded to the survey. As a goal to include a wider area of Tulsa residents and not just those in the City of Tulsa city limits, it was requested in the lead-in statement of the survey that survey responses were desired from residents living and working in Tulsa within a 60 mile radius of downtown Tulsa. Responses received were closer to the 30 -35 mile radius. With very few exceptions, the zip codes represent a largely contiguous area in both categories. Appendix F shows the location and quantity of the 314 home zip code responses received, and the location and quantity of the 219 work zip code responses received.
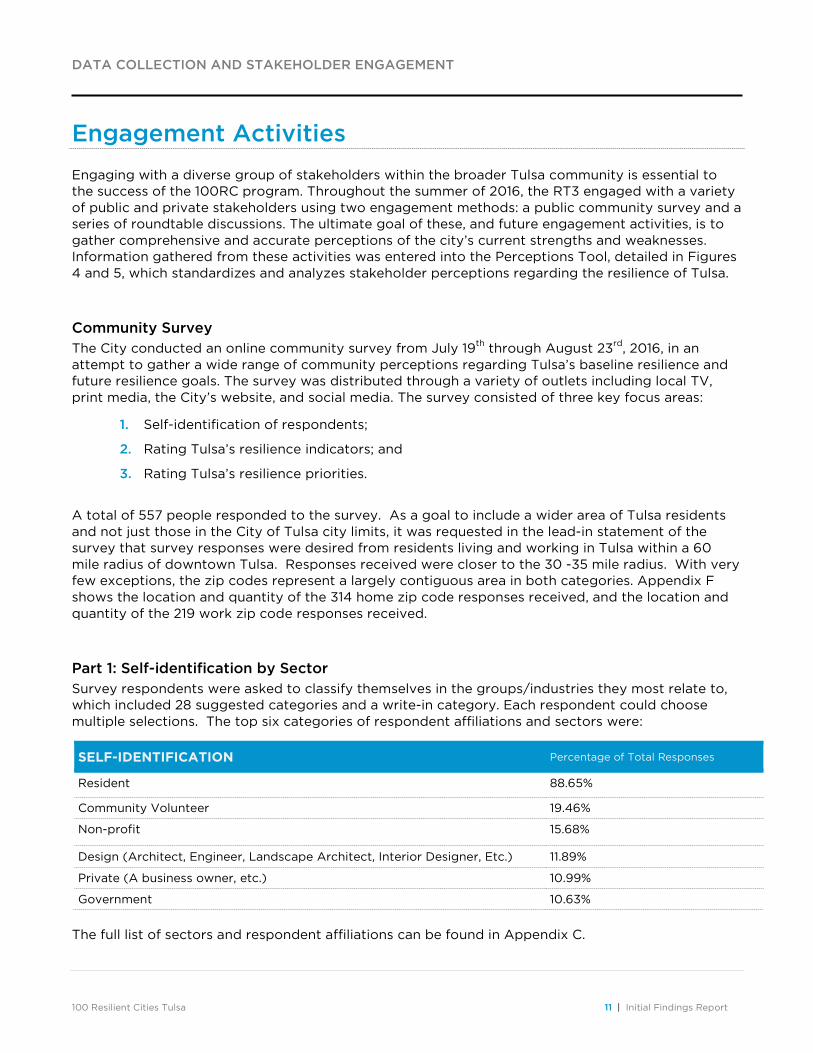
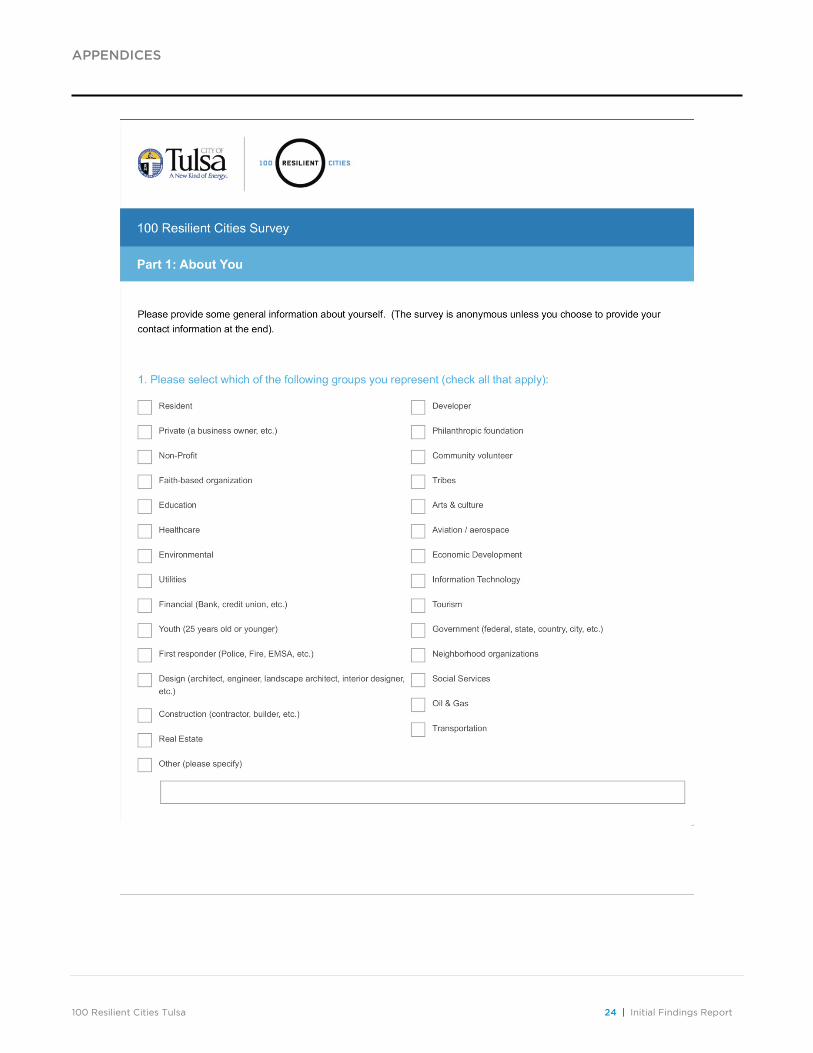
Part 1: Self-identification by Sector Survey respondents were asked to classify themselves in the groups/industries they most relate to, which included 28 suggested categories and a write-in category. Each respondent could choose multiple selections. The top six categories of respondent affiliations and sectors were:
SELF-IDENTIFICATION Percentage of Total Responses
Resident 88.65%
Community Volunteer 19.46%
Non-profit 15.68%
Design (Architect, Engineer, Landscape Architect, Interior Designer, Etc.) 11.89%
Private (A business owner, etc.) 10.99%
Government 10.63%
The full list of sectors and respondent affiliations can be found in Appendix C.
DATA COLLECTION AND STAKEHOLDER ENGAGEMENT
100 Resilient Cities Tulsa 12 | Initial Findings Report
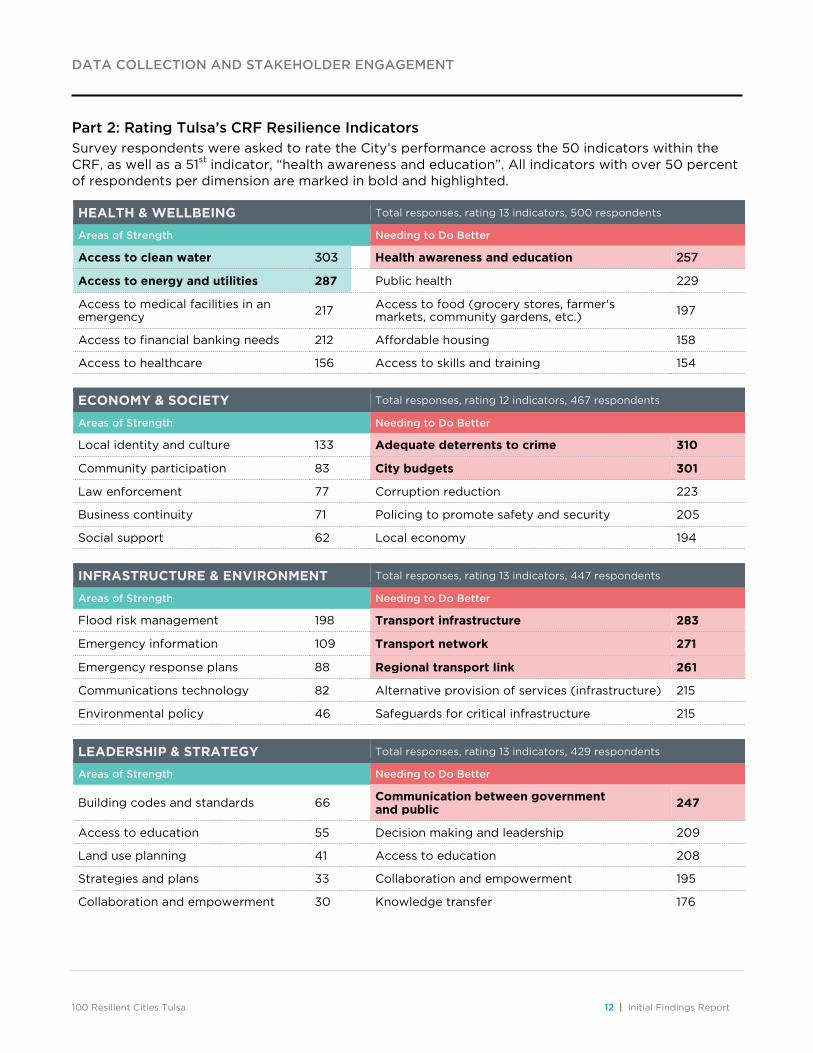
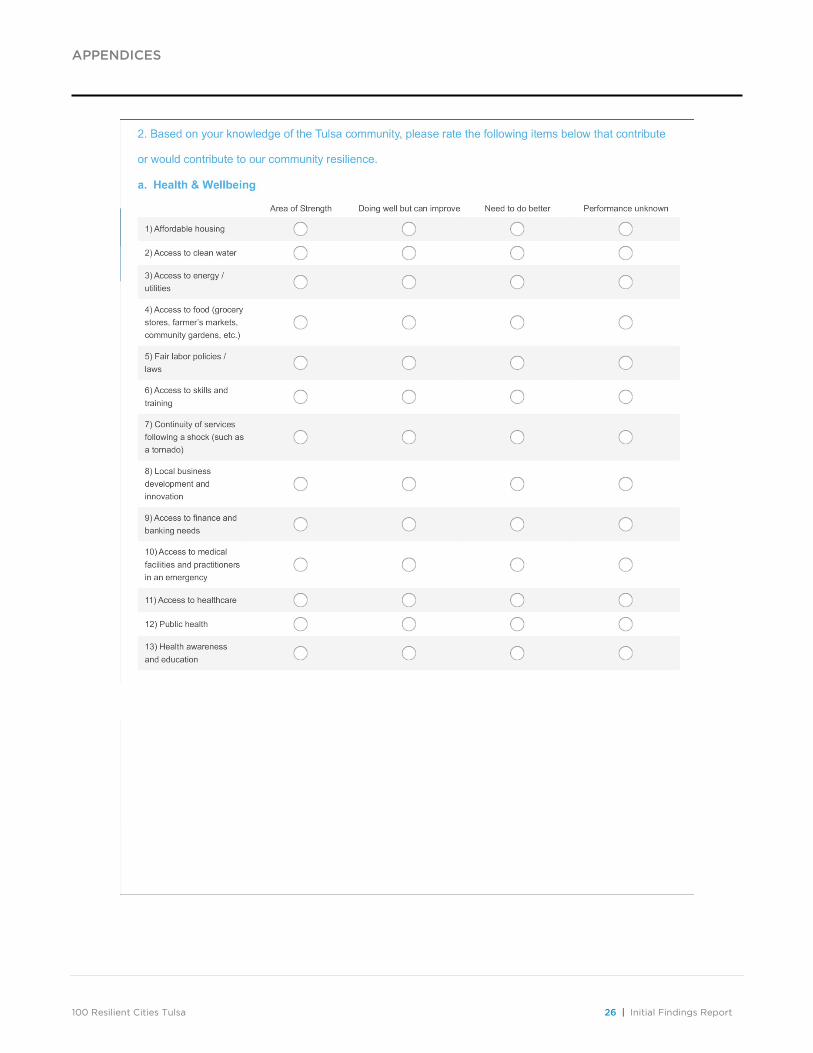
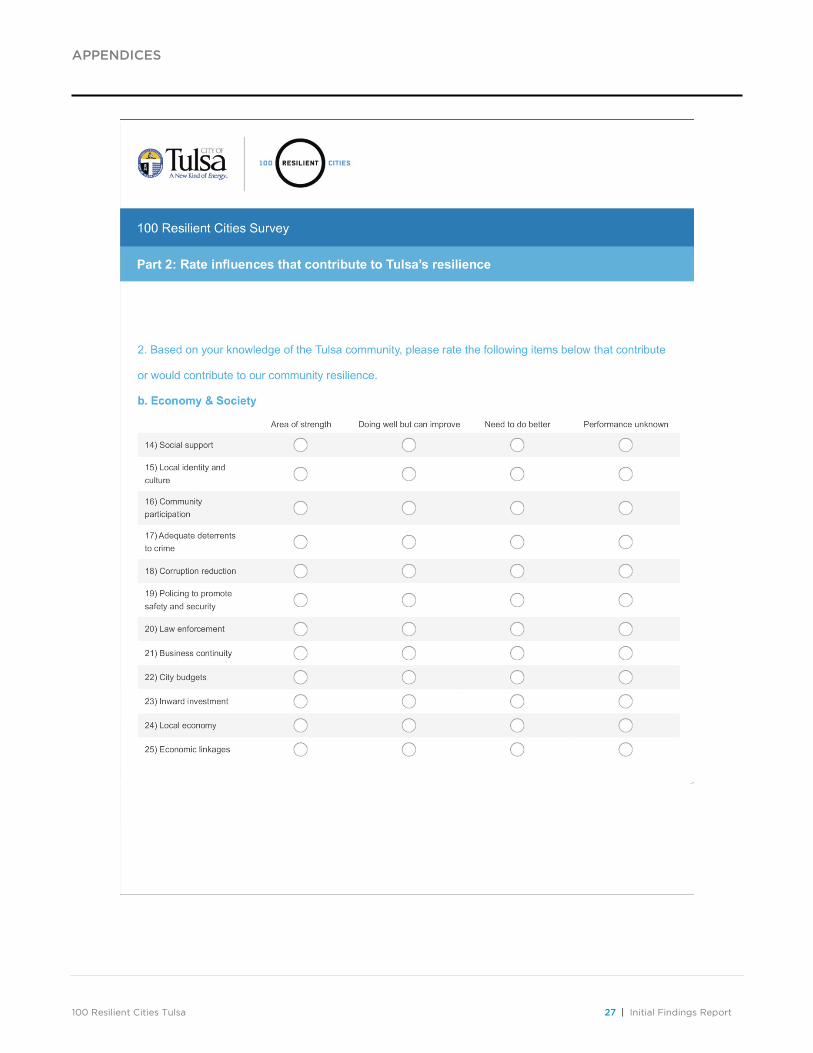
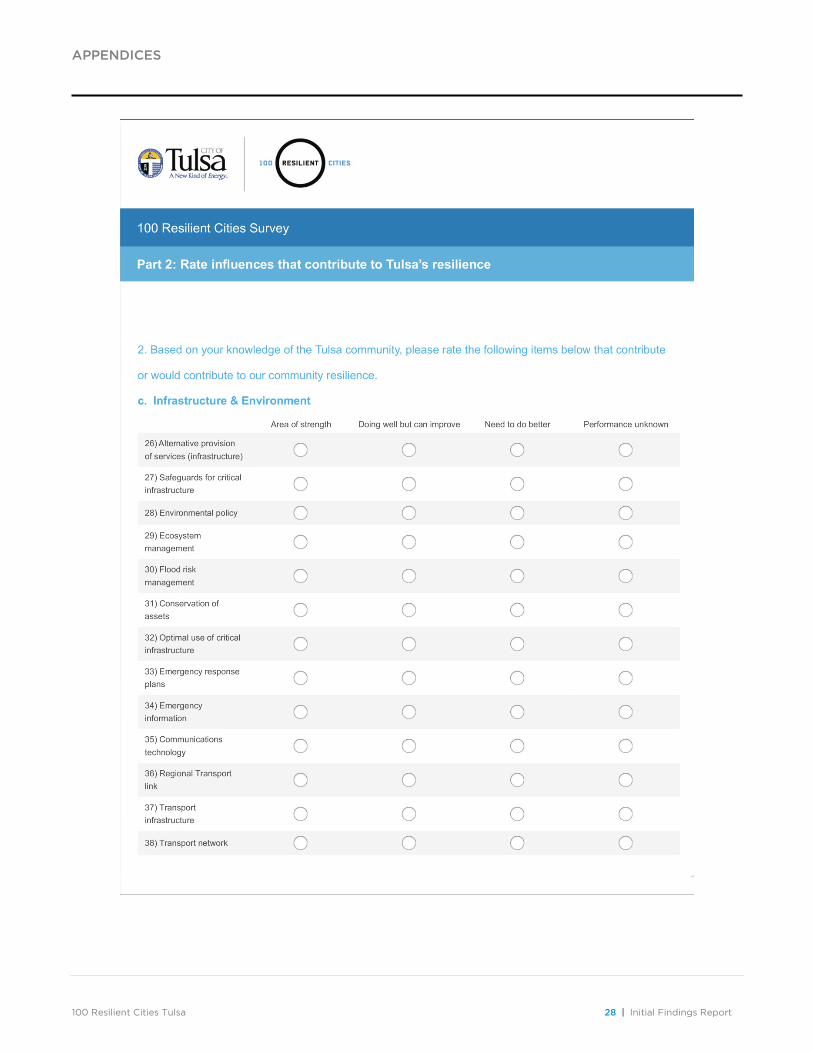
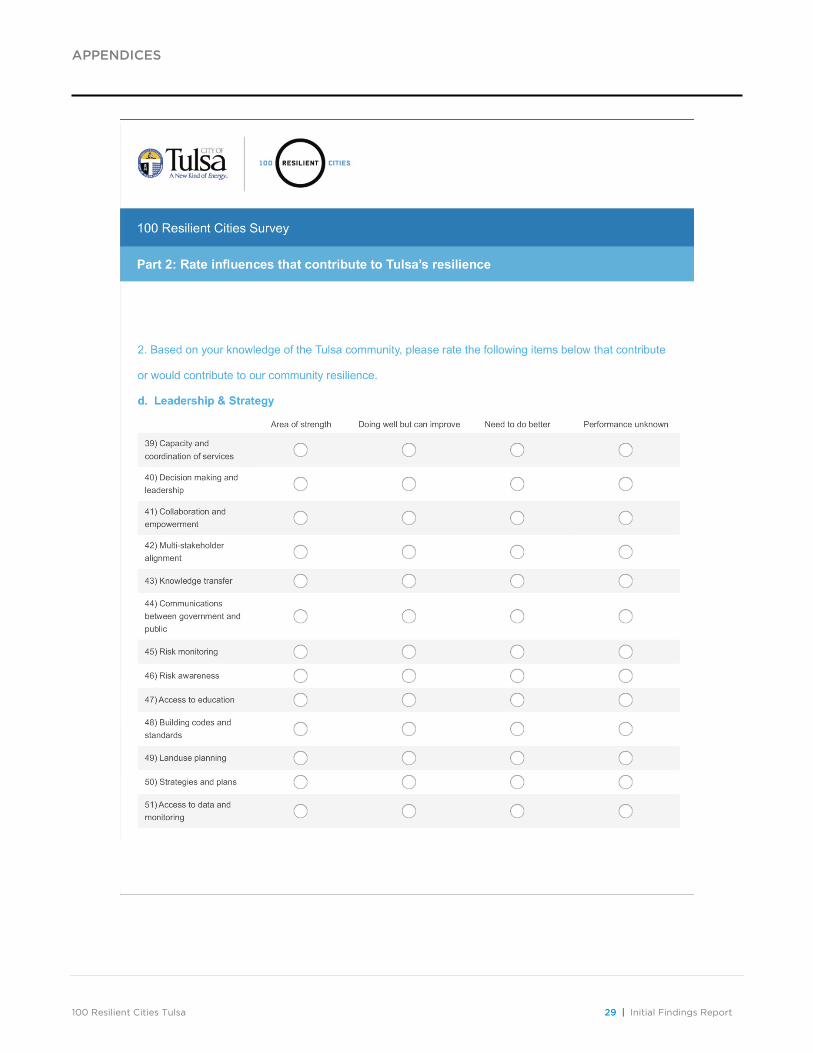
Part 2: Rating Tulsa’s CRF Resilience Indicators Survey respondents were asked to rate the City’s performance across the 50 indicators within the CRF, as well as a 51st indicator, “health awareness and education”. All indicators with over 50 percent of respondents per dimension are marked in bold and highlighted.
HEALTH & WELLBEING Total responses, rating 13 indicators, 500 respondents
Areas of Strength Needing to Do Better
Access to clean water 303 Health awareness and education 257
Access to energy and utilities 287 Public health 229
Access to medical facilities in an emergency 217
Access to food (grocery stores, farmer's markets, community gardens, etc.) 197
Access to financial banking needs 212 Affordable housing 158
Access to healthcare 156 Access to skills and training 154
ECONOMY & SOCIETY Total responses, rating 12 indicators, 467 respondents
Areas of Strength Needing to Do Better
Local identity and culture 133 Adequate deterrents to crime 310
Community participation 83 City budgets 301
Law enforcement 77 Corruption reduction 223
Business continuity 71
Policing to promote safety and security 205
Social support 62 Local economy 194
INFRASTRUCTURE & ENVIRONMENT Total responses, rating 13 indicators, 447 respondents
Areas of Strength Needing to Do Better
Flood risk management 198 Transport infrastructure 283
Emergency information 109 Transport network 271
Emergency response plans 88 Regional transport link 261
Communications technology 82 Alternative provision of services (infrastructure) 215
Environmental policy 46 Safeguards for critical infrastructure 215
LEADERSHIP & STRATEGY Total responses, rating 13 indicators, 429 respondents
Areas of Strength Needing to Do Better
Building codes and standards 66
Communication between government and public
247
Access to education 55 Decision making and leadership 209
Land use planning 41 Access to education 208
Strategies and plans 33
Collaboration and empowerment 195
Collaboration and empowerment 30 Knowledge transfer 176
DATA COLLECTION AND STAKEHOLDER ENGAGEMENT
100 Resilient Cities Tulsa 13 | Initial Findings Report
The range of responses to the 51 indicators was extremely varied, indicating moderate satisfaction in some areas (access to clean water, flood management risk) and other areas where a large majority of respondents see a need for improvement (transportation infrastructure, adequate deterrents to crime).
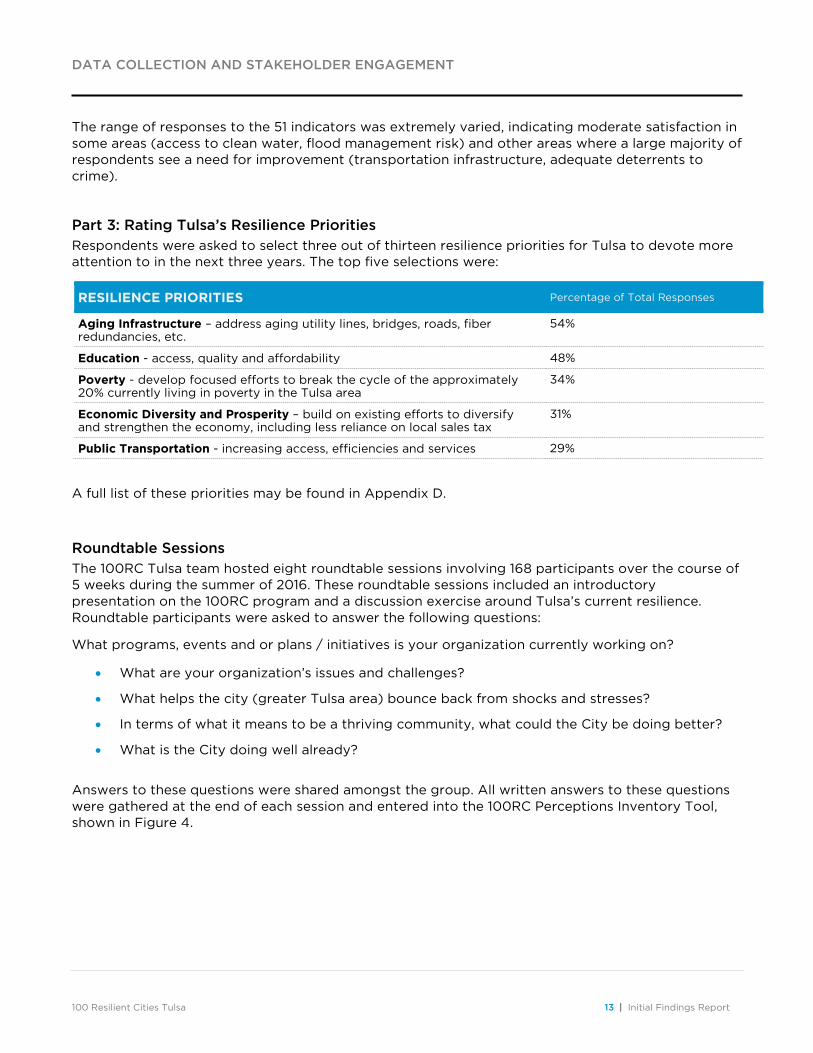
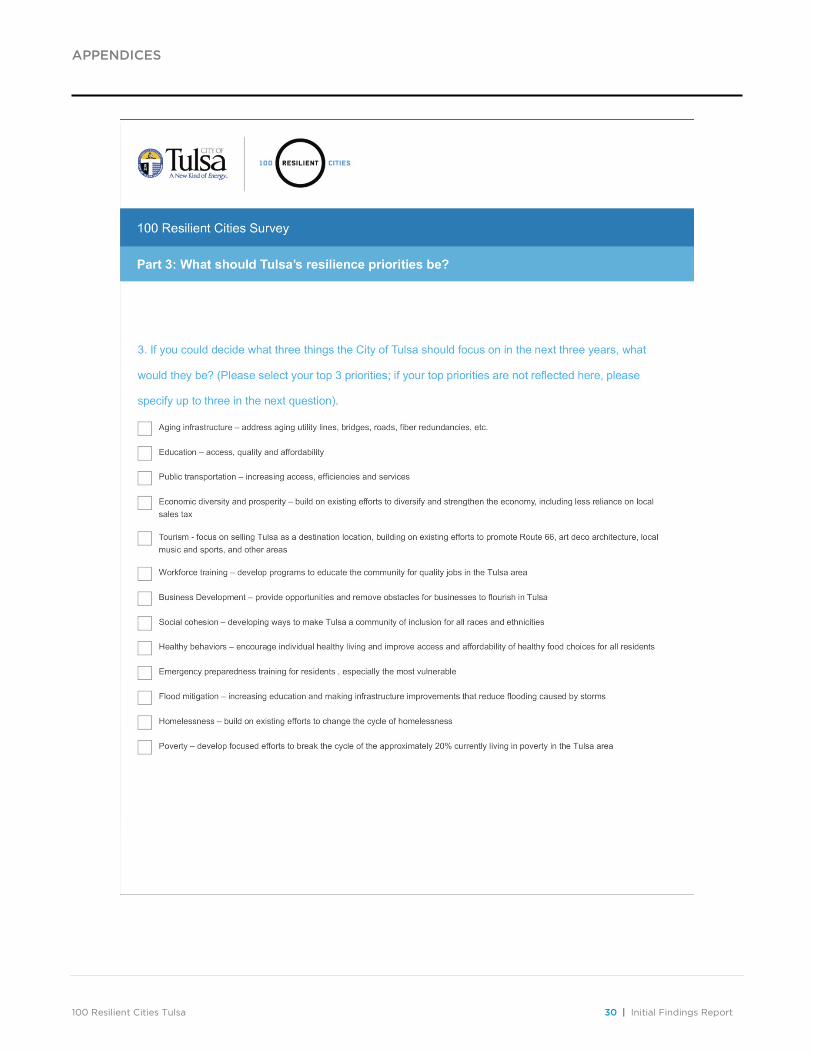
Part 3: Rating Tulsa’s Resilience Priorities Respondents were asked to select three out of thirteen resilience priorities for Tulsa to devote more attention to in the next three years. The top five selections were:
RESILIENCE PRIORITIES Percentage of Total Responses
Aging Infrastructure – address aging utility lines, bridges, roads, fiber redundancies, etc.
54%
Education - access, quality and affordability 48%
Poverty - develop focused efforts to break the cycle of the approximately 20% currently living in poverty in the Tulsa area
34%
Economic Diversity and Prosperity – build on existing efforts to diversify and strengthen the economy, including less reliance on local sales tax
31%
Public Transportation - increasing access, efficiencies and services 29%
A full list of these priorities may be found in Appendix D.
Roundtable Sessions The 100RC Tulsa team hosted eight roundtable sessions involving 168 participants over the course of 5 weeks during the summer of 2016. These roundtable sessions included an introductory presentation on the 100RC program and a discussion exercise around Tulsa’s current resilience. Roundtable participants were asked to answer the following questions:
What programs, events and or plans / initiatives is your organization currently working on?
• What are your organization’s issues and challenges?
• What helps the city (greater Tulsa area) bounce back from shocks and stresses?
• In terms of what it means to be a thriving community, what could the City be doing better?
• What is the City doing well already?
Answers to these questions were shared amongst the group. All written answers to these questions were gathered at the end of each session and entered into the 100RC Perceptions Inventory Tool, shown in Figure 4.
DATA COLLECTION AND STAKEHOLDER ENGAGEMENT
100 Resilient Cities Tulsa 14 | Initial Findings Report
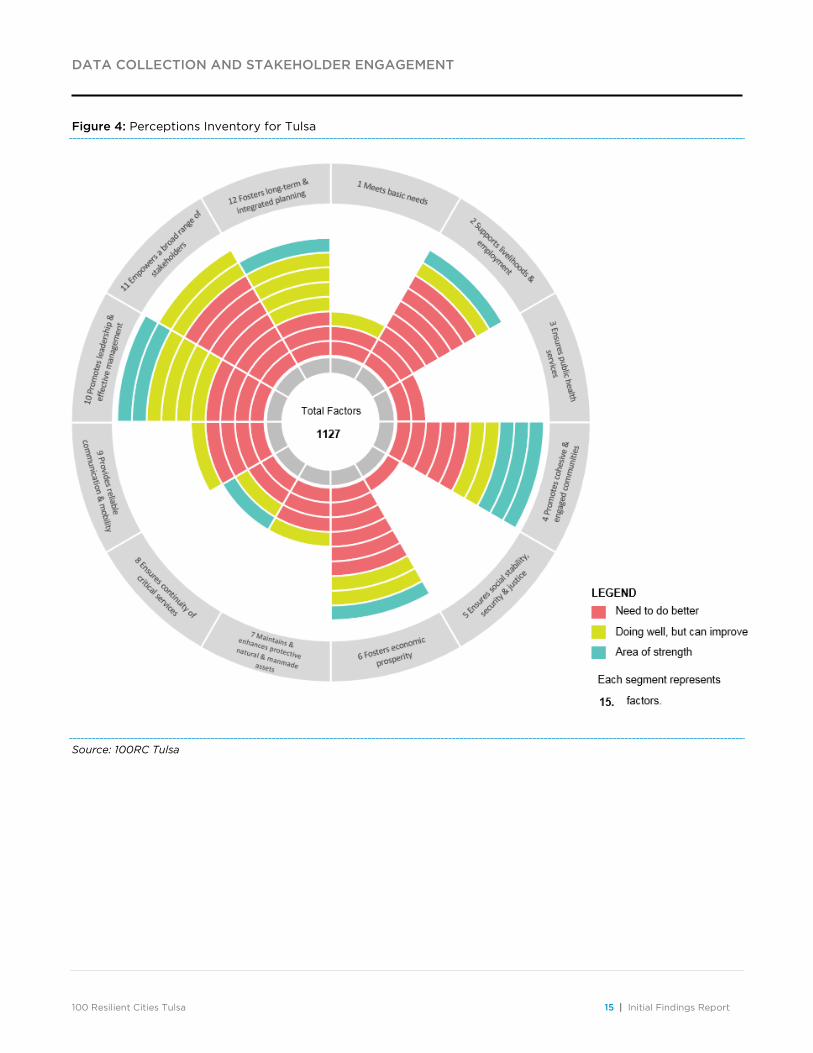
Perceptions Tool
While it is important to analyze the inventory of actions and interventions the City of Tulsa currently undertakes to improve city resilience, it is equally important to monitor and observe the degrees of success in which the City addresses its major concerns. The 100RC program employs a Perceptions tool that uses stakeholder perceptions as a metric for rating the city’s actions towards enhancing resilience. The RT3 used this tool to standardize and analyze stakeholder perceptions regarding city’s various strengths, weaknesses, and areas of resilience.
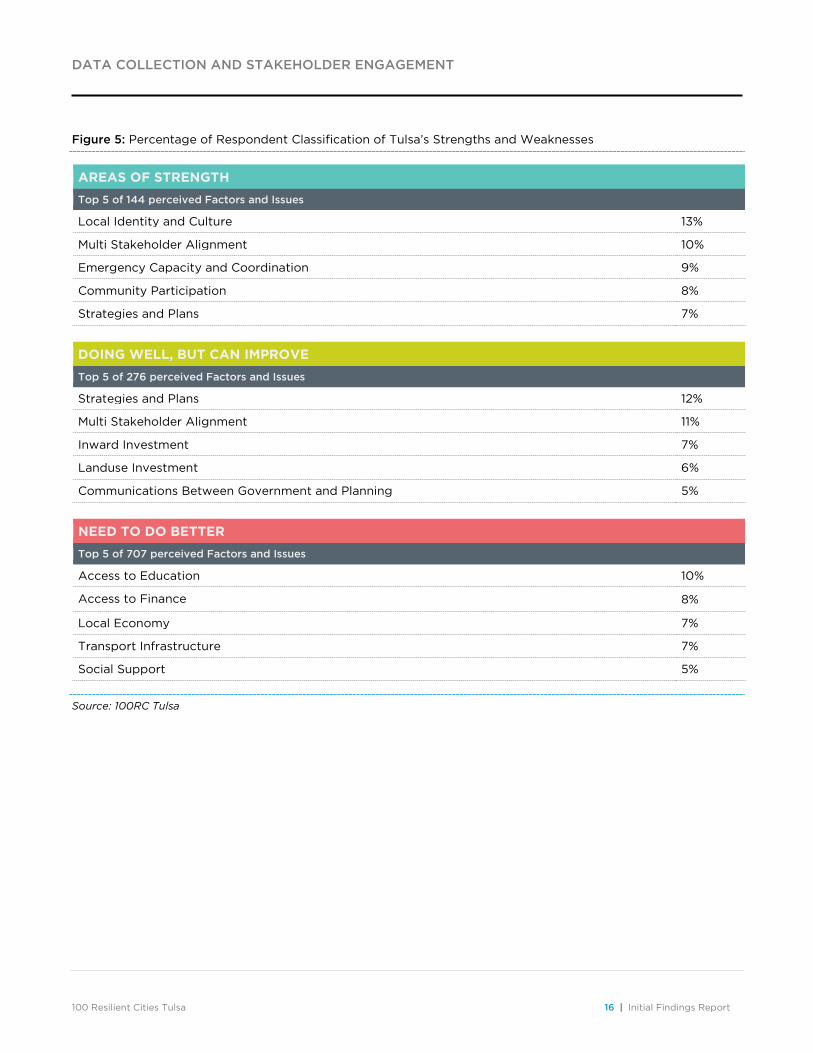
The team gathered data from the roundtables, inputting it into the perceptions tool. Those perceptions were then coded into one of the 50 indicators. Percentage of those classifying the factors and issues as either “Areas of Strength”, “Doing well but need to Improve”, and “Need to do Better” can be found in Figure 5. To date, there have been 1,127 individually-rated factors and issues from the stakeholders, divided into the following rated categories:
• Areas of Strength;
• Doing well but can improve; and
• Need to do better.
DATA COLLECTION AND STAKEHOLDER ENGAGEMENT
100 Resilient Cities Tulsa 15 | Initial Findings Report
Figure 4: Perceptions Inventory for Tulsa
Source: 100RC Tulsa
DATA COLLECTION AND STAKEHOLDER ENGAGEMENT
100 Resilient Cities Tulsa 16 | Initial Findings Report
Figure 5: Percentage of Respondent Classification of Tulsa’s Strengths and Weaknesses
AREAS OF STRENGTH
Top 5 of 144 perceived Factors and Issues
Local Identity and Culture 13%
Multi Stakeholder Alignment 10%
Emergency Capacity and Coordination 9%
Community Participation 8%
Strategies and Plans 7%
DOING WELL, BUT CAN IMPROVE
Top 5 of 276 perceived Factors and Issues
Strategies and Plans 12%
Multi Stakeholder Alignment 11%
Inward Investment 7%
Landuse Investment 6%
Communications Between Government and Planning 5%
NEED TO DO BETTER
Top 5 of 707 perceived Factors and Issues
Access to Education 10%
Access to Finance 8%
Local Economy 7%
Transport Infrastructure 7%
Social Support 5%
Source: 100RC Tulsa
CONCLUSIONS
100 Resilient Cities Tulsa 17 | Initial Findings Report
Conclusions
The City of Tulsa, led by the CRO and the RT3, has begun efforts to fully understand the complex challenges and potential approaches to its common shocks and stresses. The research and perception-gathering to date has provided a foundation for future work in 2017. As part of this foundational work, the CRO and RT3 have:
• Compiled and organized current Actions into the Actions Inventory Tool;
• Tabulated a list of key stakeholders from across several sectors;
• Developed and conducted a public Community Survey; and
• Facilitated a series of roundtable discussions with community stakeholders to gather additional key perceptions.
From the findings of these initiatives, the following preliminary priority areas identified are:
• Mobility and Transit: Indicators for this driver include transport networks, infrastructure,
regional transport links, communications technology, and emergency management. Of all
indicators, transportation received the highest number of responses for “needs improvement”. Over 60% of survey respondents agree that both transport infrastructure and
transport networks “need to do better.” Related to this, Tulsa’s rating of resilience priorities in the public survey indicated the top resilience priority was to address was “Aging
Infrastructure.” While INCOG is currently implementing the GO Plan, a regional bicycle and pedestrian master planning initiative, organizers of this and similar plans would benefit from coordinating with the City’s resilience team to ensure the promotion of multiple benefits and
Actions that truly improve resilience;
• Social Stability, Security and Justice: Indicators for this driver include deterrents to crime,
corruption reduction, policing to promote safety and security, and law enforcement. These
indicators received the highest number of respondents of any driver in the public survey. Additionally, this driver ranked the lowest in terms of number of programs listed in the City
Actions Inventory, and 66% of survey respondents said this area “needs to do better”. These survey responses on social stability and justice reinforce today’s common headlines and the
challenges surrounding law enforcement and community relations; it is therefore critical that the City continue to improve these indicators.
• Public Health: Over 46% of survey respondents noted that indicators such as access to
medical facilities and emergency health care “need to do better.” The Tulsa City Actions
Inventory did not note a significant presence of currently existing public health services actions. With the growing role of healthcare as an economic driver in communities around the
country, more research and analysis should be undertaken in this area.
The 100RC program strongly encourages robust engagement and perception gathering at the commencement of Phase I to ensure that a diverse set of opinions from a wide range of stakeholders is heard. This promotes a foundation on which a truly comprehensive Resilience Strategy can be built. As the new administration, the CRO and the RT3 continue efforts in 2017, their work should be informed by the work done to date.
APPENDICES
100 Resilient Cities Tulsa 18 | Initial Findings Report
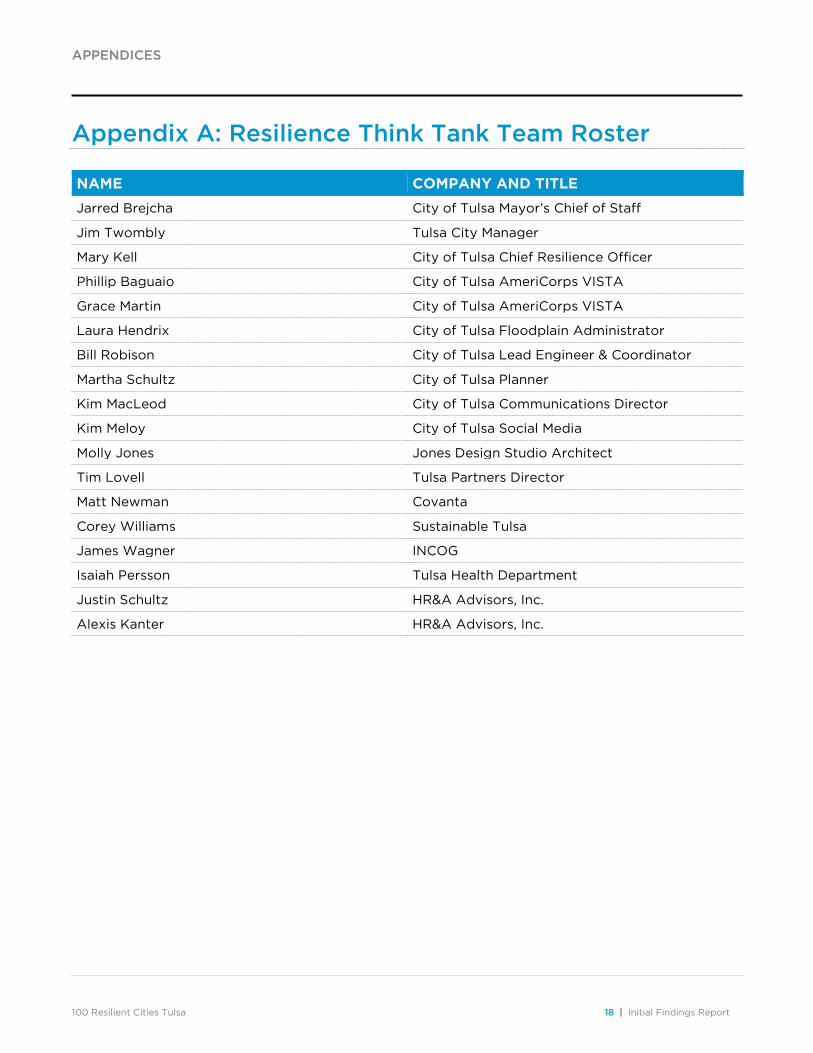
Appendix A: Resilience Think Tank Team Roster
NAME COMPANY AND TITLE
Jarred Brejcha City of Tulsa Mayor’s Chief of Staff
Jim Twombly Tulsa City Manager
Mary Kell City of Tulsa Chief Resilience Officer
Phillip Baguaio City of Tulsa AmeriCorps VISTA
Grace Martin City of Tulsa AmeriCorps VISTA
Laura Hendrix City of Tulsa Floodplain Administrator
Bill Robison City of Tulsa Lead Engineer & Coordinator
Martha Schultz City of Tulsa Planner
Kim MacLeod City of Tulsa Communications Director
Kim Meloy City of Tulsa Social Media
Molly Jones Jones Design Studio Architect
Tim Lovell Tulsa Partners Director
Matt Newman Covanta
Corey Williams Sustainable Tulsa
James Wagner INCOG
Isaiah Persson Tulsa Health Department
Justin Schultz HR&A Advisors, Inc.
Alexis Kanter HR&A Advisors, Inc.
APPENDICES
100 Resilient Cities Tulsa 19 | Initial Findings Report
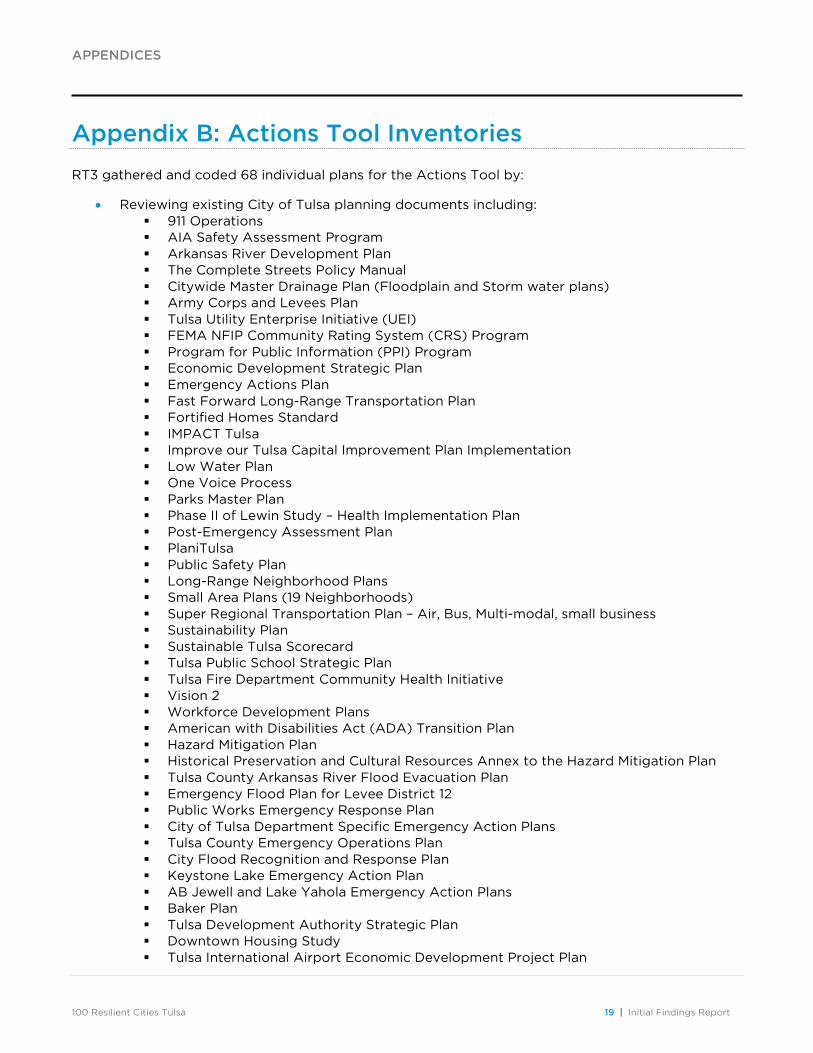
Appendix B: Actions Tool Inventories
RT3 gathered and coded 68 individual plans for the Actions Tool by:
• Reviewing existing City of Tulsa planning documents including: 911 Operations AIA Safety Assessment Program Arkansas River Development Plan The Complete Streets Policy Manual Citywide Master Drainage Plan (Floodplain and Storm water plans) Army Corps and Levees Plan Tulsa Utility Enterprise Initiative (UEI) FEMA NFIP Community Rating System (CRS) Program Program for Public Information (PPI) Program Economic Development Strategic Plan Emergency Actions Plan Fast Forward Long-Range Transportation Plan Fortified Homes Standard IMPACT Tulsa Improve our Tulsa Capital Improvement Plan Implementation Low Water Plan One Voice Process Parks Master Plan Phase II of Lewin Study – Health Implementation Plan Post-Emergency Assessment Plan PlaniTulsa Public Safety Plan Long-Range Neighborhood Plans Small Area Plans (19 Neighborhoods) Super Regional Transportation Plan – Air, Bus, Multi-modal, small business Sustainability Plan Sustainable Tulsa Scorecard Tulsa Public School Strategic Plan Tulsa Fire Department Community Health Initiative Vision 2 Workforce Development Plans American with Disabilities Act (ADA) Transition Plan Hazard Mitigation Plan Historical Preservation and Cultural Resources Annex to the Hazard Mitigation Plan Tulsa County Arkansas River Flood Evacuation Plan Emergency Flood Plan for Levee District 12 Public Works Emergency Response Plan City of Tulsa Department Specific Emergency Action Plans Tulsa County Emergency Operations Plan City Flood Recognition and Response Plan Keystone Lake Emergency Action Plan AB Jewell and Lake Yahola Emergency Action Plans Baker Plan Tulsa Development Authority Strategic Plan Downtown Housing Study Tulsa International Airport Economic Development Project Plan
APPENDICES
100 Resilient Cities Tulsa 20 | Initial Findings Report
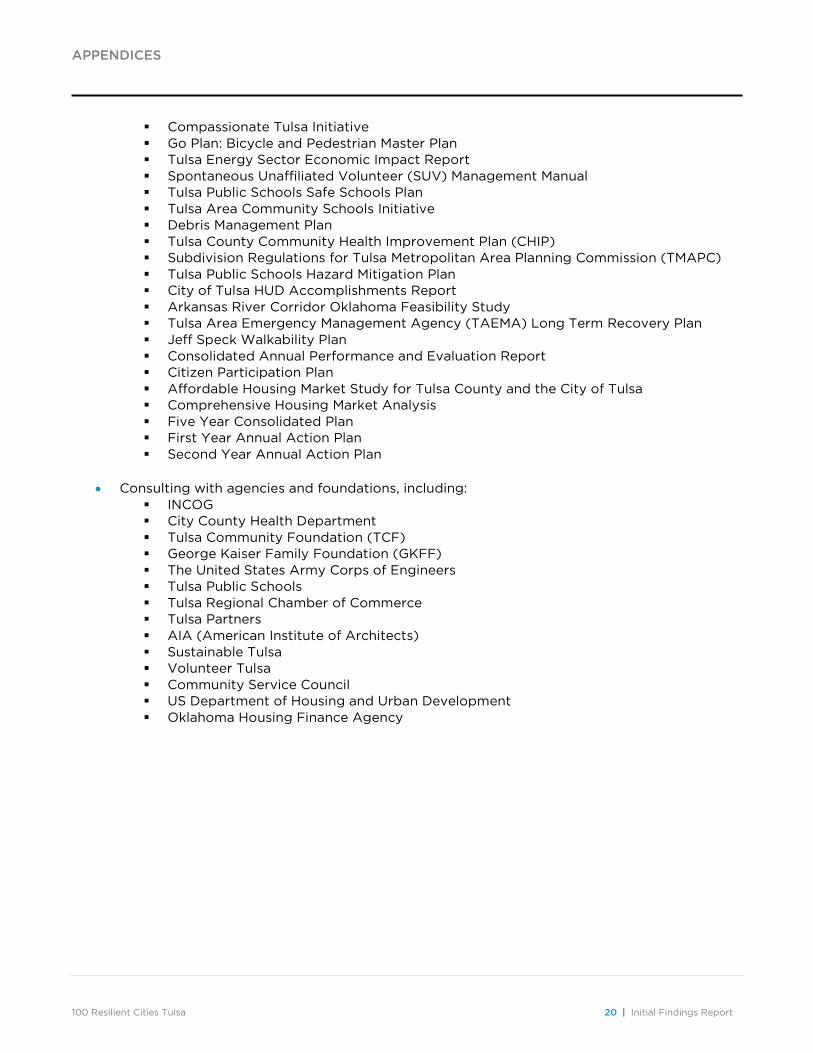
Compassionate Tulsa Initiative Go Plan: Bicycle and Pedestrian Master Plan Tulsa Energy Sector Economic Impact Report Spontaneous Unaffiliated Volunteer (SUV) Management Manual Tulsa Public Schools Safe Schools Plan Tulsa Area Community Schools Initiative Debris Management Plan Tulsa County Community Health Improvement Plan (CHIP) Subdivision Regulations for Tulsa Metropolitan Area Planning Commission (TMAPC) Tulsa Public Schools Hazard Mitigation Plan City of Tulsa HUD Accomplishments Report Arkansas River Corridor Oklahoma Feasibility Study Tulsa Area Emergency Management Agency (TAEMA) Long Term Recovery Plan Jeff Speck Walkability Plan Consolidated Annual Performance and Evaluation Report Citizen Participation Plan Affordable Housing Market Study for Tulsa County and the City of Tulsa Comprehensive Housing Market Analysis Five Year Consolidated Plan First Year Annual Action Plan Second Year Annual Action Plan
• Consulting with agencies and foundations, including:
INCOG City County Health Department Tulsa Community Foundation (TCF) George Kaiser Family Foundation (GKFF) The United States Army Corps of Engineers Tulsa Public Schools Tulsa Regional Chamber of Commerce Tulsa Partners AIA (American Institute of Architects) Sustainable Tulsa Volunteer Tulsa Community Service Council US Department of Housing and Urban Development Oklahoma Housing Finance Agency
APPENDICES
100 Resilient Cities Tulsa 21 | Initial Findings Report
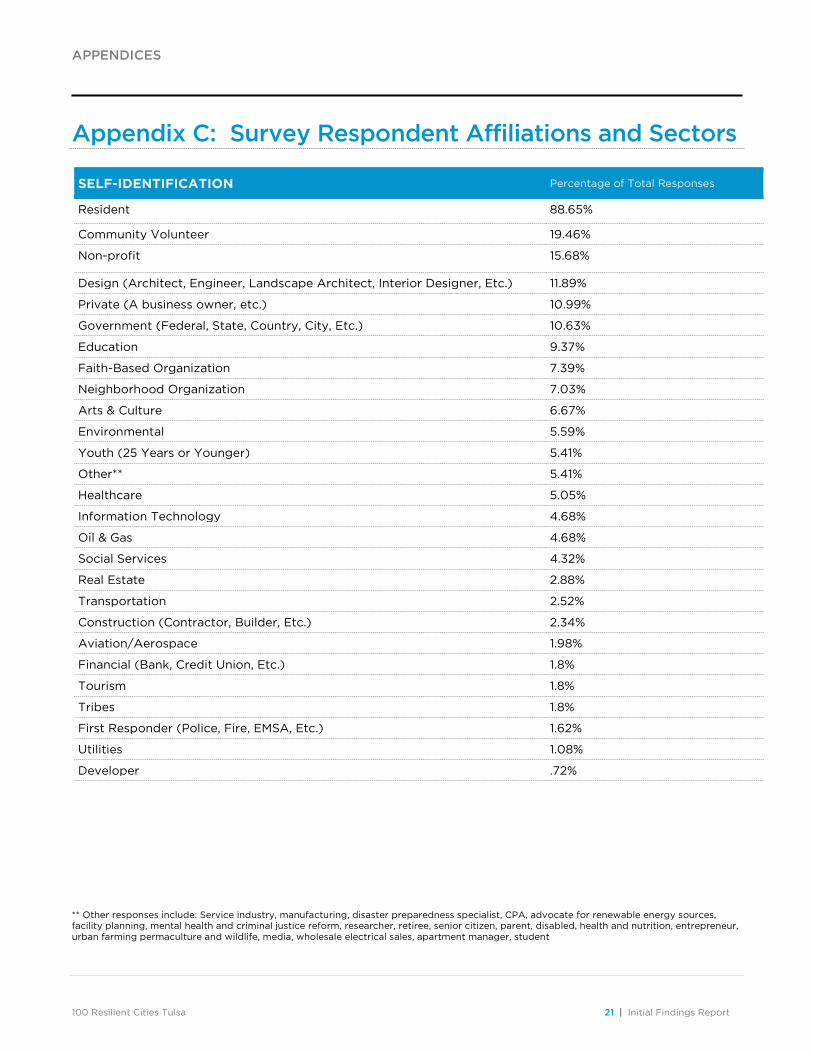
Appendix C: Survey Respondent Affiliations and Sectors
SELF-IDENTIFICATION Percentage of Total Responses
Resident 88.65%
Community Volunteer 19.46%
Non-profit 15.68%
Design (Architect, Engineer, Landscape Architect, Interior Designer, Etc.) 11.89%
Private (A business owner, etc.) 10.99%
Government (Federal, State, Country, City, Etc.) 10.63%
Education 9.37%
Faith-Based Organization 7.39%
Neighborhood Organization 7.03%
Arts & Culture 6.67%
Environmental 5.59%
Youth (25 Years or Younger) 5.41%
Other** 5.41%
Healthcare 5.05%
Information Technology 4.68%
Oil & Gas 4.68%
Social Services 4.32%
Real Estate 2.88%
Transportation 2.52%
Construction (Contractor, Builder, Etc.) 2.34%
Aviation/Aerospace 1.98%
Financial (Bank, Credit Union, Etc.) 1.8%
Tourism 1.8%
Tribes 1.8%
First Responder (Police, Fire, EMSA, Etc.) 1.62%
Utilities 1.08%
Developer .72%
** Other responses include: Service industry, manufacturing, disaster preparedness specialist, CPA, advocate for renewable energy sources, facility planning, mental health and criminal justice reform, researcher, retiree, senior citizen, parent, disabled, health and nutrition, entrepreneur, urban farming permaculture and wildlife, media, wholesale electrical sales, apartment manager, student
APPENDICES
100 Resilient Cities Tulsa 22 | Initial Findings Report
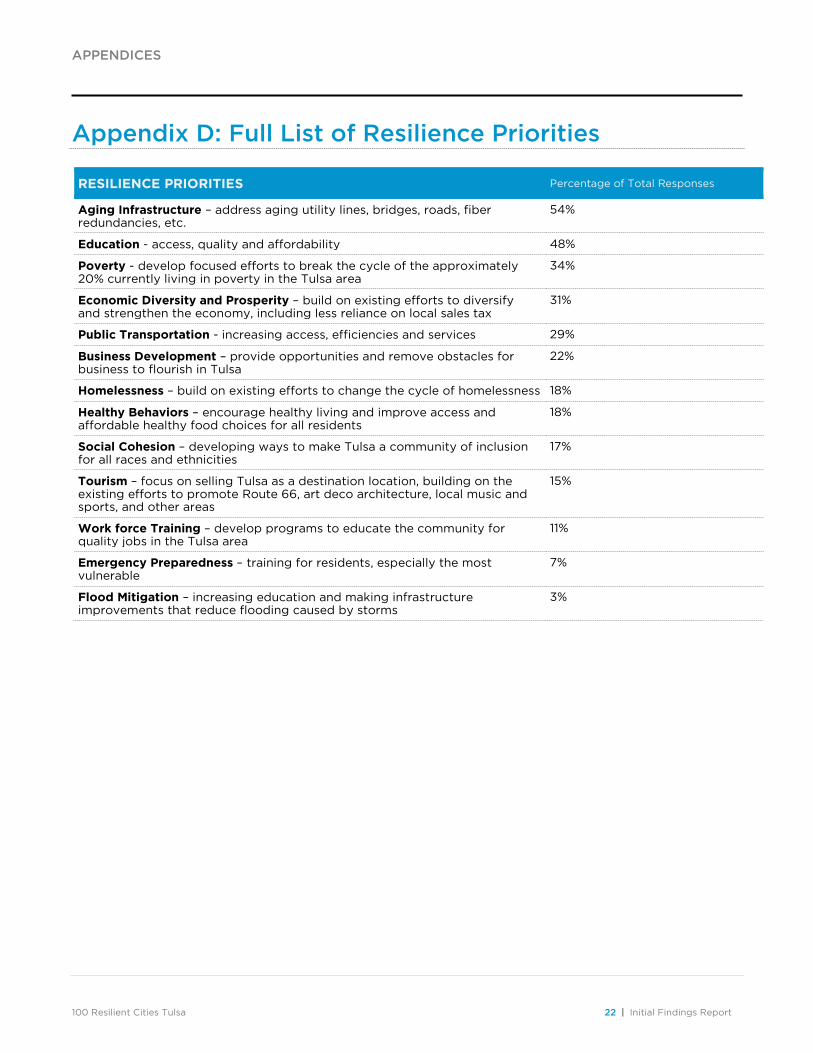
Appendix D: Full List of Resilience Priorities
RESILIENCE PRIORITIES Percentage of Total Responses
Aging Infrastructure – address aging utility lines, bridges, roads, fiber redundancies, etc.
54%
Education - access, quality and affordability 48%
Poverty - develop focused efforts to break the cycle of the approximately 20% currently living in poverty in the Tulsa area
34%
Economic Diversity and Prosperity – build on existing efforts to diversify and strengthen the economy, including less reliance on local sales tax
31%
Public Transportation - increasing access, efficiencies and services 29%
Business Development – provide opportunities and remove obstacles for business to flourish in Tulsa
22%
Homelessness – build on existing efforts to change the cycle of homelessness 18%
Healthy Behaviors – encourage healthy living and improve access and affordable healthy food choices for all residents
18%
Social Cohesion – developing ways to make Tulsa a community of inclusion for all races and ethnicities
17%
Tourism – focus on selling Tulsa as a destination location, building on the existing efforts to promote Route 66, art deco architecture, local music and sports, and other areas
15%
Work force Training – develop programs to educate the community for quality jobs in the Tulsa area
11%
Emergency Preparedness – training for residents, especially the most vulnerable
7%
Flood Mitigation – increasing education and making infrastructure improvements that reduce flooding caused by storms
3%
APPENDICES
100 Resilient Cities Tulsa 23 | Initial Findings Report
Appendix E: Community Resilience Survey
APPENDICES
100 Resilient Cities Tulsa 24 | Initial Findings Report
APPENDICES
100 Resilient Cities Tulsa 25 | Initial Findings Report
APPENDICES
100 Resilient Cities Tulsa 26 | Initial Findings Report
APPENDICES
100 Resilient Cities Tulsa 27 | Initial Findings Report
APPENDICES
100 Resilient Cities Tulsa 28 | Initial Findings Report
APPENDICES
100 Resilient Cities Tulsa 29 | Initial Findings Report
APPENDICES
100 Resilient Cities Tulsa 30 | Initial Findings Report
APPENDICES
100 Resilient Cities Tulsa 31 | Initial Findings Report
APPENDICES
100 Resilient Cities Tulsa 32 | Initial Findings Report
APPENDICES
100 Resilient Cities Tulsa 33 | Initial Findings Report
Appendix F: Survey Resident and Work Place Zip Codes
APPENDICES
100 Resilient Cities Tulsa 34 | Initial Findings Report
APPENDICES
100 Resilient Cities Tulsa 35 | Initial Findings Report
Appendix G: Survey One-Page Graphic
APPENDICES
100 Resilient Cities Tulsa 36 | Initial Findings Report
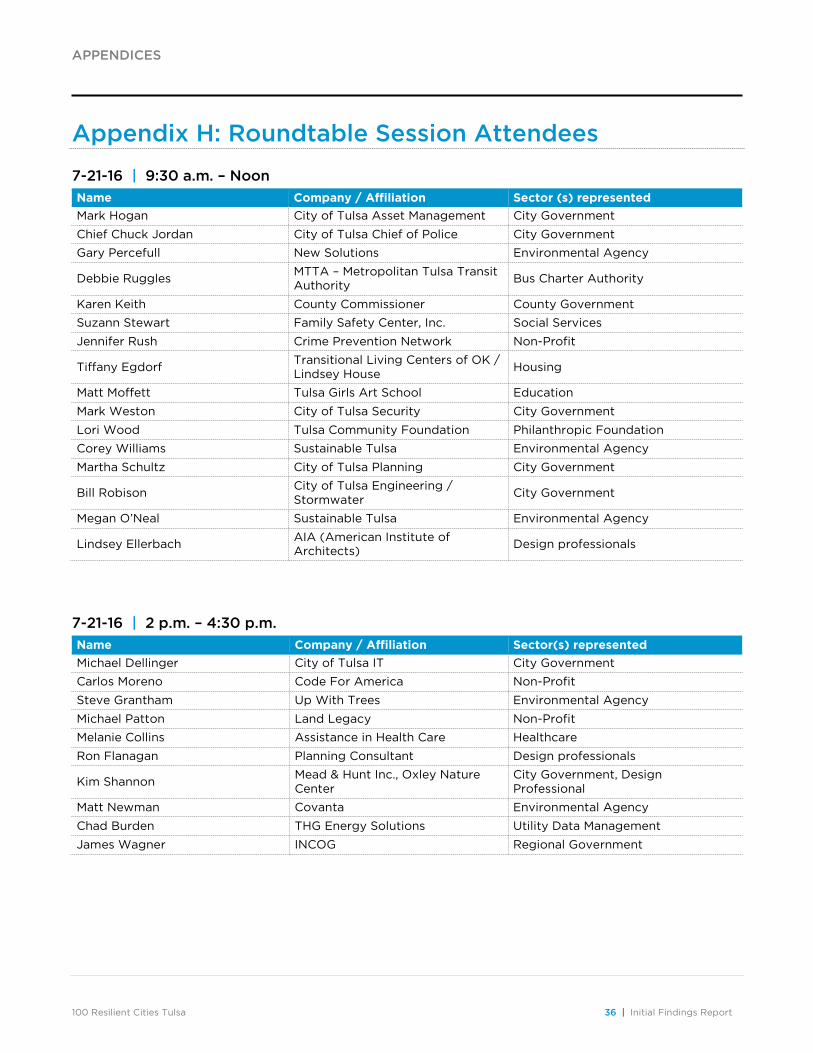
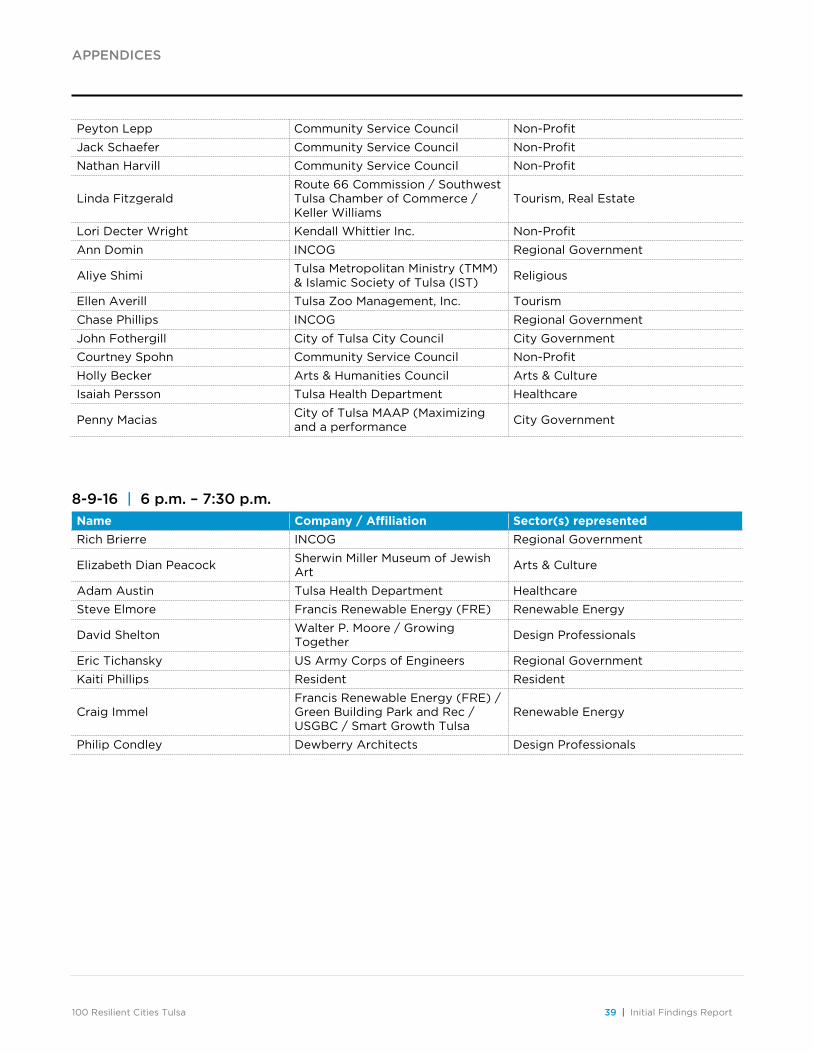
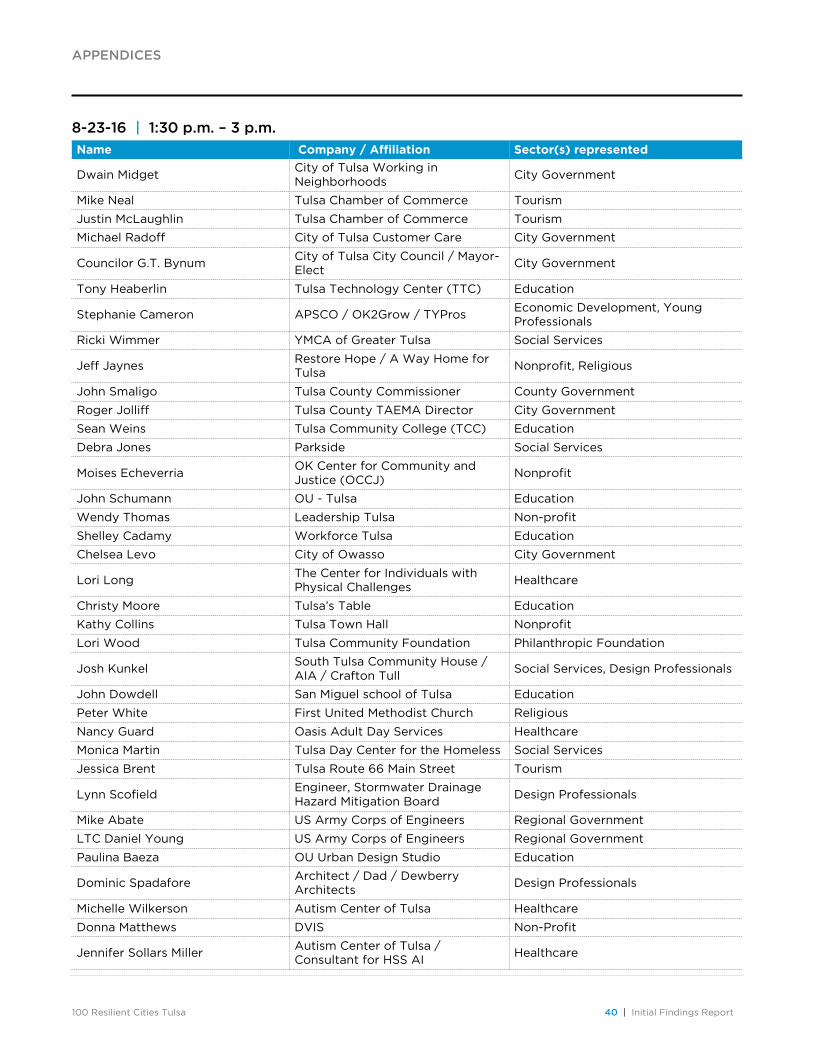
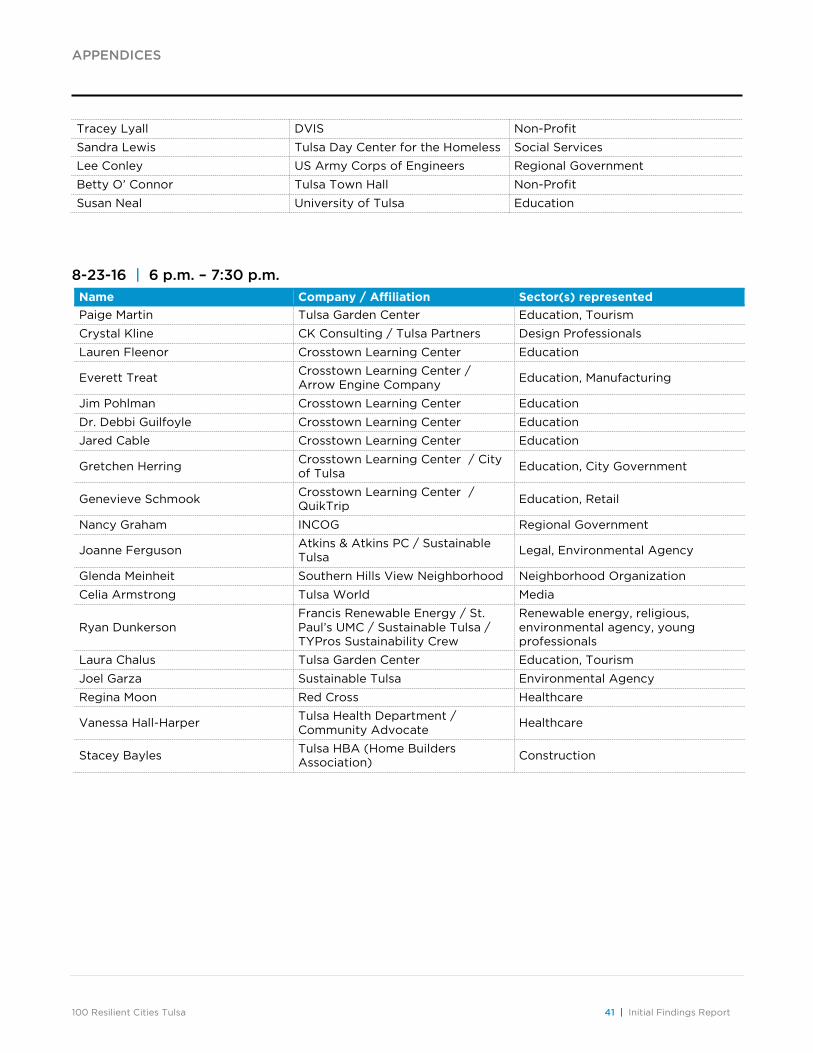
Appendix H: Roundtable Session Attendees
7-21-16 | 9:30 a.m. – Noon
Name Company / Affiliation Sector (s) represented
Mark Hogan City of Tulsa Asset Management City Government
Chief Chuck Jordan City of Tulsa Chief of Police City Government
Gary Percefull New Solutions Environmental Agency
Debbie Ruggles MTTA – Metropolitan Tulsa Transit Authority
Bus Charter Authority
Karen Keith County Commissioner County Government
Suzann Stewart Family Safety Center, Inc. Social Services
Jennifer Rush Crime Prevention Network Non-Profit
Tiffany Egdorf Transitional Living Centers of OK / Lindsey House
Housing
Matt Moffett Tulsa Girls Art School Education
Mark Weston City of Tulsa Security City Government
Lori Wood Tulsa Community Foundation Philanthropic Foundation
Corey Williams Sustainable Tulsa Environmental Agency
Martha Schultz City of Tulsa Planning City Government
Bill Robison City of Tulsa Engineering / Stormwater
City Government
Megan O’Neal Sustainable Tulsa Environmental Agency
Lindsey Ellerbach AIA (American Institute of Architects)
Design professionals
7-21-16 | 2 p.m. – 4:30 p.m.
Name Company / Affiliation Sector(s) represented
Michael Dellinger City of Tulsa IT City Government
Carlos Moreno Code For America Non-Profit
Steve Grantham Up With Trees Environmental Agency
Michael Patton Land Legacy Non-Profit
Melanie Collins Assistance in Health Care Healthcare
Ron Flanagan Planning Consultant Design professionals
Kim Shannon Mead & Hunt Inc., Oxley Nature Center
City Government, Design Professional
Matt Newman Covanta Environmental Agency
Chad Burden THG Energy Solutions Utility Data Management
James Wagner INCOG Regional Government
APPENDICES
100 Resilient Cities Tulsa 37 | Initial Findings Report
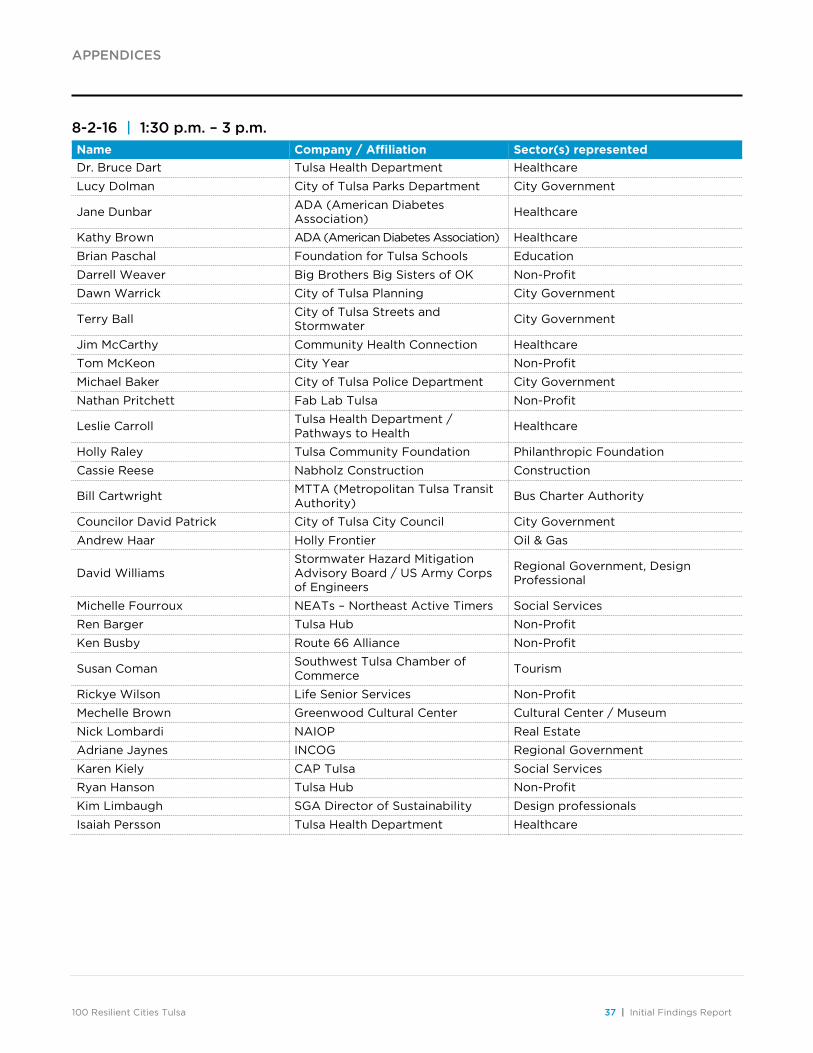
8-2-16 | 1:30 p.m. – 3 p.m.
Name Company / Affiliation Sector(s) represented
Dr. Bruce Dart Tulsa Health Department Healthcare
Lucy Dolman City of Tulsa Parks Department City Government
Jane Dunbar ADA (American Diabetes Association)
Healthcare
Kathy Brown ADA (American Diabetes Association) Healthcare
Brian Paschal Foundation for Tulsa Schools Education
Darrell Weaver Big Brothers Big Sisters of OK Non-Profit
Dawn Warrick City of Tulsa Planning City Government
Terry Ball City of Tulsa Streets and Stormwater
City Government
Jim McCarthy Community Health Connection Healthcare
Tom McKeon City Year Non-Profit
Michael Baker City of Tulsa Police Department City Government
Nathan Pritchett Fab Lab Tulsa Non-Profit
Leslie Carroll Tulsa Health Department / Pathways to Health
Healthcare
Holly Raley Tulsa Community Foundation Philanthropic Foundation
Cassie Reese Nabholz Construction Construction
Bill Cartwright MTTA (Metropolitan Tulsa Transit Authority)
Bus Charter Authority
Councilor David Patrick City of Tulsa City Council City Government
Andrew Haar Holly Frontier Oil & Gas
David Williams Stormwater Hazard Mitigation Advisory Board / US Army Corps of Engineers
Regional Government, Design Professional
Michelle Fourroux NEATs – Northeast Active Timers Social Services
Ren Barger Tulsa Hub Non-Profit
Ken Busby Route 66 Alliance Non-Profit
Susan Coman Southwest Tulsa Chamber of Commerce
Tourism
Rickye Wilson Life Senior Services Non-Profit
Mechelle Brown Greenwood Cultural Center Cultural Center / Museum
Nick Lombardi NAIOP Real Estate
Adriane Jaynes INCOG Regional Government
Karen Kiely CAP Tulsa Social Services
Ryan Hanson Tulsa Hub Non-Profit
Kim Limbaugh SGA Director of Sustainability Design professionals
Isaiah Persson Tulsa Health Department Healthcare
APPENDICES
100 Resilient Cities Tulsa 38 | Initial Findings Report
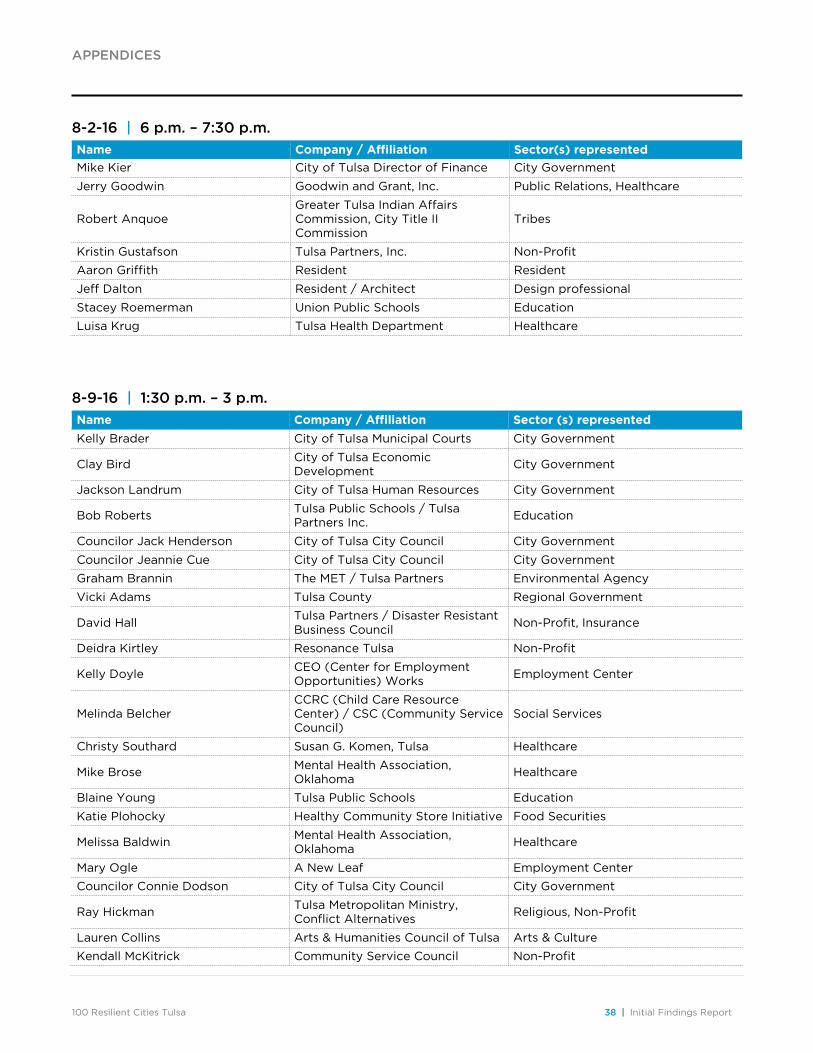
8-2-16 | 6 p.m. – 7:30 p.m.
Name Company / Affiliation Sector(s) represented
Mike Kier City of Tulsa Director of Finance City Government
Jerry Goodwin Goodwin and Grant, Inc. Public Relations, Healthcare
Robert Anquoe Greater Tulsa Indian Affairs Commission, City Title II Commission
Tribes
Kristin Gustafson Tulsa Partners, Inc. Non-Profit
Aaron Griffith Resident Resident
Jeff Dalton Resident / Architect Design professional
Stacey Roemerman Union Public Schools Education
Luisa Krug Tulsa Health Department Healthcare
8-9-16 | 1:30 p.m. – 3 p.m.
Name Company / Affiliation Sector (s) represented
Kelly Brader City of Tulsa Municipal Courts City Government
Clay Bird City of Tulsa Economic Development
City Government
Jackson Landrum City of Tulsa Human Resources City Government
Bob Roberts Tulsa Public Schools / Tulsa Partners Inc.
Education
Councilor Jack Henderson City of Tulsa City Council City Government
Councilor Jeannie Cue City of Tulsa City Council City Government
Graham Brannin The MET / Tulsa Partners Environmental Agency
Vicki Adams Tulsa County Regional Government
David Hall Tulsa Partners / Disaster Resistant Business Council
Non-Profit, Insurance
Deidra Kirtley Resonance Tulsa Non-Profit
Kelly Doyle CEO (Center for Employment Opportunities) Works
Employment Center
Melinda Belcher CCRC (Child Care Resource Center) / CSC (Community Service Council)
Social Services
Christy Southard Susan G. Komen, Tulsa Healthcare
Mike Brose Mental Health Association, Oklahoma
Healthcare
Blaine Young Tulsa Public Schools Education
Katie Plohocky Healthy Community Store Initiative Food Securities
Melissa Baldwin Mental Health Association, Oklahoma
Healthcare
Mary Ogle A New Leaf Employment Center
Councilor Connie Dodson City of Tulsa City Council City Government
Ray Hickman Tulsa Metropolitan Ministry, Conflict Alternatives
Religious, Non-Profit
Lauren Collins Arts & Humanities Council of Tulsa Arts & Culture
Kendall McKitrick Community Service Council Non-Profit
APPENDICES
100 Resilient Cities Tulsa 39 | Initial Findings Report
Peyton Lepp Community Service Council Non-Profit
Jack Schaefer Community Service Council Non-Profit
Nathan Harvill Community Service Council Non-Profit
Linda Fitzgerald Route 66 Commission / Southwest Tulsa Chamber of Commerce / Keller Williams
Tourism, Real Estate
Lori Decter Wright Kendall Whittier Inc. Non-Profit
Ann Domin INCOG Regional Government
Aliye Shimi Tulsa Metropolitan Ministry (TMM) & Islamic Society of Tulsa (IST)
Religious
Ellen Averill Tulsa Zoo Management, Inc. Tourism
Chase Phillips INCOG Regional Government
John Fothergill City of Tulsa City Council City Government
Courtney Spohn Community Service Council Non-Profit
Holly Becker Arts & Humanities Council Arts & Culture
Isaiah Persson Tulsa Health Department Healthcare
Penny Macias City of Tulsa MAAP (Maximizing and a performance
City Government
8-9-16 | 6 p.m. – 7:30 p.m.
Name Company / Affiliation Sector(s) represented
Rich Brierre INCOG Regional Government
Elizabeth Dian Peacock Sherwin Miller Museum of Jewish Art
Arts & Culture
Adam Austin Tulsa Health Department Healthcare
Steve Elmore Francis Renewable Energy (FRE) Renewable Energy
David Shelton Walter P. Moore / Growing Together
Design Professionals
Eric Tichansky US Army Corps of Engineers Regional Government
Kaiti Phillips Resident Resident
Craig Immel Francis Renewable Energy (FRE) / Green Building Park and Rec / USGBC / Smart Growth Tulsa
Renewable Energy
Philip Condley Dewberry Architects Design Professionals
APPENDICES
100 Resilient Cities Tulsa 40 | Initial Findings Report
8-23-16 | 1:30 p.m. – 3 p.m.
Name Company / Affiliation Sector(s) represented
Dwain Midget City of Tulsa Working in Neighborhoods
City Government
Mike Neal Tulsa Chamber of Commerce Tourism
Justin McLaughlin Tulsa Chamber of Commerce Tourism
Michael Radoff City of Tulsa Customer Care City Government
Councilor G.T. Bynum City of Tulsa City Council / Mayor-Elect
City Government
Tony Heaberlin Tulsa Technology Center (TTC) Education
Stephanie Cameron APSCO / OK2Grow / TYPros Economic Development, Young Professionals
Ricki Wimmer YMCA of Greater Tulsa Social Services
Jeff Jaynes Restore Hope / A Way Home for Tulsa
Nonprofit, Religious
John Smaligo Tulsa County Commissioner County Government
Roger Jolliff Tulsa County TAEMA Director City Government
Sean Weins Tulsa Community College (TCC) Education
Debra Jones Parkside Social Services
Moises Echeverria OK Center for Community and Justice (OCCJ)
Nonprofit
John Schumann OU - Tulsa Education
Wendy Thomas Leadership Tulsa Non-profit
Shelley Cadamy Workforce Tulsa Education
Chelsea Levo City of Owasso City Government
Lori Long The Center for Individuals with Physical Challenges
Healthcare
Christy Moore Tulsa’s Table Education
Kathy Collins Tulsa Town Hall Nonprofit
Lori Wood Tulsa Community Foundation Philanthropic Foundation
Josh Kunkel South Tulsa Community House / AIA / Crafton Tull
Social Services, Design Professionals
John Dowdell San Miguel school of Tulsa Education
Peter White First United Methodist Church Religious
Nancy Guard Oasis Adult Day Services Healthcare
Monica Martin Tulsa Day Center for the Homeless Social Services
Jessica Brent Tulsa Route 66 Main Street Tourism
Lynn Scofield Engineer, Stormwater Drainage Hazard Mitigation Board
Design Professionals
Mike Abate US Army Corps of Engineers Regional Government
LTC Daniel Young US Army Corps of Engineers Regional Government
Paulina Baeza OU Urban Design Studio Education
Dominic Spadafore Architect / Dad / Dewberry Architects
Design Professionals
Michelle Wilkerson Autism Center of Tulsa Healthcare
Donna Matthews DVIS Non-Profit
Jennifer Sollars Miller Autism Center of Tulsa / Consultant for HSS AI
Healthcare
APPENDICES
100 Resilient Cities Tulsa 41 | Initial Findings Report
Tracey Lyall DVIS Non-Profit
Sandra Lewis Tulsa Day Center for the Homeless Social Services
Lee Conley US Army Corps of Engineers Regional Government
Betty O’ Connor Tulsa Town Hall Non-Profit
Susan Neal University of Tulsa Education
8-23-16 | 6 p.m. – 7:30 p.m.
Name Company / Affiliation Sector(s) represented
Paige Martin Tulsa Garden Center Education, Tourism
Crystal Kline CK Consulting / Tulsa Partners Design Professionals
Lauren Fleenor Crosstown Learning Center Education
Everett Treat Crosstown Learning Center / Arrow Engine Company
Education, Manufacturing
Jim Pohlman Crosstown Learning Center Education
Dr. Debbi Guilfoyle Crosstown Learning Center Education
Jared Cable Crosstown Learning Center Education
Gretchen Herring Crosstown Learning Center / City of Tulsa
Education, City Government
Genevieve Schmook Crosstown Learning Center / QuikTrip
Education, Retail
Nancy Graham INCOG Regional Government
Joanne Ferguson Atkins & Atkins PC / Sustainable Tulsa
Legal, Environmental Agency
Glenda Meinheit Southern Hills View Neighborhood Neighborhood Organization
Celia Armstrong Tulsa World Media
Ryan Dunkerson Francis Renewable Energy / St. Paul’s UMC / Sustainable Tulsa / TYPros Sustainability Crew
Renewable energy, religious, environmental agency, young professionals
Laura Chalus Tulsa Garden Center Education, Tourism
Joel Garza Sustainable Tulsa Environmental Agency
Regina Moon Red Cross Healthcare
Vanessa Hall-Harper Tulsa Health Department / Community Advocate
Healthcare
Stacey Bayles Tulsa HBA (Home Builders Association)
Construction