Embed Size (px)
DESCRIPTION
i
Citation preview

Image Enhancement using Fuzzy Inference System
Thesis submitted in partial fulfillment of the requirements for the award of
degree of
Master of Engineering
In
Computer Science & Engineering
By:K. Venkateshwarlu
(800832021)
Under the supervision of:
Mrs. Anju Bala
Assistant Professor

COMPUTER SCIENCE AND ENGINEERING DEPARTMENT
THAPAR UNIVERSITY
PATIALA – 147004
June 2010

i

ii

Abstract
Present day applications require various kinds of images and pictures as sources of information
for interpretation and analysis. Whenever an image is converted from one form to another such
as, digitizing, scanning, transmitting, storing, etc., some of the degradation occurs at the output.
Hence, the output image has to undergo a process called image enhancement which consists of a
collection of techniques that seek to improve the visual appearance of an image. Image
enhancement is basically improving the interpretability or perception of information in images
for human viewers and providing 'better' input for other automated image processing techniques.
The fuzzy set theory is incorporated to handle uncertainties (arising from deficiencies of
information available from situation like the darkness may result from incomplete, imprecise,
and not fully reliable, vague). The fuzzy logic provides a mathematical frame work for
representation and processing of expert knowledge. The concept of if-then rules plays a role in
approximation of the variables likes cross over point. Also the Uncertainties within image
processing tasks are not always due to randomness but often due to vagueness and ambiguity. A
fuzzy technique enables us to manage these problems effectively.
Fuzzy inference system is the process of formulating the mapping from a given input to an
output using fuzzy logic. The process of fuzzy inference involves all of the pieces that are:
Membership Functions, Logical Operations, and If-Then Rules. In this thesis work a technique is
designed based on Fuzzy Inference System tool in MATLAB 7.5 (MATLAB is a software
package developed by Math Works). The proposed technique used fuzzy if – then rules are a
sophisticated bridge between human knowledge on the one side and the numerical framework of
the computers on the other side, simple and easy to understand. The proposed technique is able
to improve the contrast of the image. In this thesis work an algorithm is proposed and
implemented to enhance image using fuzzy technique. This algorithm is used to convert the
image properties into fuzzy data and fuzzy data into defuzzification.
iii

Table of Contents
Certificate ...................................................................................................................... i
Acknowledgement ........................................................................................................ ii
Abstract ....................................................................................................................... iii
Table of Contents ........................................................................................................ iv
List of Tables ............................................................................................................. viii
List of Figures .............................................................................................................. ix
Chapter 1:Introduction ................................................................................................ 1
1.1 Background and Motivation…………………………………………………………..1
1.2 Digital Image Processing ............................................................................................. 1
1.3 Image Enhancement ..................................................................................................... 2
1.4 Image Enhancement Techniques.................................................................................. 3
1.5 Fuzzy Rule-Based Approach ....................................................................................... 4
1.6 Fuzzy Image Processing............................................................................................... 4
1.7 The Advantages of Fuzzy Image Processing................................................................ 8
1.8 Filter.............................................................................................................................. 8
1.9 Fuzzy Filters................................................................................................................. 9
1.10 Fuzzy Interference System (FIS).............................................................................. 10
Chapter 2 Literature Survey......................................................................................... 12
2.1 Classification of images.............................................................................................. 12
iv

2.1.1 Intensity Images .................................................................................................12
2.1.2 Indexed Images ....................................................................................................... 12
2.1.3 Binary Images.......................................................................................................... 12
2.1.4 Grayscale Images..................................................................................................... 13
2.1.5 True color Images ................................................................................................... 14
2.2 Noise in an image ....................................................................................................... 15
2.2.1 Impulse noise in color images.................................................................................. 16
2.3 Creating an image Histogram..................................................................................... 18
2.4 The Origins of Digital Image Processing .................................................................. 19
2.5 Examples of Fields that Use Digital Image Processing.............................................. 19
2.6 Classification of image pixels..................................................................................... 19
2.7 The fields that Image Enhancement has contributed.................................................. 20
2.8 Spatial Domain methods ............................................................................................ 21
2.8.1 Creating Negative of an image................................................................. ………...22
2.8.2 Intensity Transformation.......................................................................................... 23
2.8.3 Histogram modification…………………………………....................................... 24
2.9 Frequency Domain Filtering Fundamentals .............................................................. 24
2.9.1 Gaussian Low Pass filters........................................................................................ 24
2.10 The Fuzzy set theory................................................................................................. 25
2.10.1 History of Fuzzy set theory.................................................................................... 26
2.11 Survey on Image Enhancement methods.................................................................. 27
v

2.12 MATLAB.................................................................................................................. 30
Chapter- 3........................................................................................................................ 32
Problem Statement............................................................................................................ 32
Chapter-4 ........................................................................................................................ 34
Design and Implementation.............................................................................................. 34
4.1 Fuzzy Inference System.............................................................................................. 35
4.2 Fuzzy Inference System Editor................................................................................... 35
4.3 The Membership Function Editor............................................................................... 36
4.4 The Rule Editor........................................................................................................... 37
4.5 The Rule Viewer......................................................................................................... 38
4.6 The Surface Viewer.................................................................................................... 38
4.7 Algorithm to enhance image using fuzzy technique…………………………………39
Chapter-5 ........................................................................................................................ 42
Testing & Results.............................................................................................................. 42
5.1 Evolution of FIS.......................................................................................................... 42
5.2 Input pixels to the FIS System.................................................................................... 45
5.3 Output pixels .............................................................................................................. 45
5.4 Image enhancement using Thresholding.................................................................... 46
5.5 Spatial Average Low pass filtering............................................................................. 47
5.6 Histogram Equalization.............................................................................................. 48
vi

5.7 Frequency Domain Image Filters................................................................................ 49
Chapter-6 ………………………………………………………………………………51
6.1 Conclusion.................................................................................................................. 51
6.2 Future Scope............................................................................................................... 52
References........................................................................................................................ 53
List of Papers Published/ Communicated.................................................................... 57

vii

List of Tables
Table 1.1: History of Fuzzy set theory........................................................................... 27
Table 5.1 Input pixels to the Fuzzy Inference System…………………………………...45
Table 5.2 Output Pixels of the Fuzzy Inference System…………………………………45

viii

List of Figures
Figure1.1 Digital image...................................................................................................... 2
Figure1.3.The main principles of Fuzzy Image Enhancement........................................... 4
Figure1.5.1. Fuzzy Image Processing................................................................................. 6
Figure 1.5.2 Example: Steps of fuzzification and Defuzzification
Process on image processing......................................................................... 7
Figure 2.1 Binary Image………………………………………………………………....13
Figure 2.2 Grayscale image ............................................................................................. 14
Figure 2.3 Color Image .................................................................................................... 15
Figure 2.4 Image Effected by impulse noise ................................................................... 17
Figure 2.5 Image Effected by Gaussian noise.................................................................. 17
Figure 2.6 Creating Histogram of an image ..................................................................... 18
Figure 2.7 Spatial domain of an image............................................................................. 21
Figure 2.8 Creating Negative of an image........................................................................ 23
Figure 2.9 The Intensity Transformation of image........................................................... 23
Figure 2.10 Representation of "dark gray-levels" with a fuzzy and crisp set................... 26
Figure 4.1 Fuzzy Inference Systems……………………………………………………..35
Figure 4.2 Fuzzy Inference System Editor………………………………………………35
Figure 4.3 Membership Function Editor…………………………………………………36
ix

Figure 4.4 Rule Editor……………………………………………………………………38
Figure 4.5 Rule Viewer………………………………………………………………......38
Figure 4.6 the Surface Viewer……..…………………………………………………….39
Figure 5.1 Output of the proposed method ……………………………………………..44
Figure 5.2 Output of image enhancement using Thresholding…………………………..46
Figure 5.3 Output of image using Spatial Average Filtering…………………………….47
Figure 5.4 Histogram Equalization………………………………………………………48
Figure 5.5 Output of the image using Gaussian Low- pass Filter……………………….49
Figure 5.6 Output of all the methods ……………………………………………………50

x

Chapter 1
Introduction
1.1 Background and Motivation
Whenever an image is converted from one form to another, such as, digitizing, scanning,transmitting, storing, etc., some degradation occurs at the output. Hence, the output imagehas to undergo a process called image enhancement. Fuzzy image processing is thecollection of all approaches that understand, represent and process the images, theirsegments and features as fuzzy sets. The representation and processing depend on theselected fuzzy technique and on the problem to be solved. The idea of fuzzy sets issimple and natural. For instance, we want to define a set of gray levels that share theproperty dark. In classical set theory, we have to determine a threshold, say the gray level100. All gray levels between 0 and 100 are element of this set; the others do not belong tothe set. But the darkness is a matter of degree. So, a fuzzy set can model this propertymuch better. The basis for fuzzy logic is the basis for human communication. Thisobservation underpins many of the other statements about fuzzy logic. Because fuzzylogic is built on the structures of qualitative description used in everyday language, fuzzylogic is easy to use. A filtering system needs to be capable of reasoning with vague anduncertain information; this suggests the use of fuzzy logic [1].
1.2 Digital Image Processing
An image may be defined as a two-dimensional function f(x, y), where x and y arespatial (plane) coordinates, and the amplitude of f at any pair of coordinates (x, y) iscalled the intensity or gray level of the image at that point. When x, y, and the amplitudevalues of f are all finite, discrete quantities, we call the image a digital image. The field of

1

digital image processing refers to processing digital images by means of a digitalcomputer. Note that a digital image is composed of a finite number of elements, each ofwhich has a particular location and value. These elements are referred to as pictureelements, image elements, pels, and pixels. Pixel is the term most widely used to denotethe elements of a digital image [3].
Fig1.1. Digital image [3].
1.3 Image Enhancement: The aim of image enhancement is to improve the
interpretability or perception of information in images for human viewers, or to provide`better' input for other automated image processing techniques. Image Enhancement (IE)transforms images to provide better representation of the subtle details. It is anindispensable tool for researchers in a wide variety of fields including (but not limited to)medical imaging, art studies, forensics and atmospheric sciences. It is applicationspecific: an IE technique suitable for one problem might be inadequate for another. Forexample forensic images or videos employ techniques that resolve the problem of lowresolution and motion blur while medical imaging benefits more from increased contrastand sharpness. To cater for such an ever increasing demand of digital imaging, softwarecompanies have released commercial softwares for users who want to edit and visuallyenhance the images.
Is the process of manipulating an image so that the result is more suitable than originalfor a specific application? The word specific is important here, because it establishes at

2

the outset that enhancement techniques are problem oriented. Thus, for example, amethod that is quite useful for enhancing X-ray images may not be the best approach forenhancing satellite images taken in the infrared band of the electromagnetic spectrum [3].
There is no general ―theory‖ of image enhancement. When an image is processed forvisual interpretation, the viewer is the ultimate judge of how well a particular methodworks.
1.4 Image Enhancement Techniques
The Image enhancement techniques can be divided into three broad categories:
1. Spatial domain methods, which operate directly on pixels, and
2. Frequency domain methods, which operate on the Fourier transform of an image.
3. Fuzzy domain, unfortunately, there is no general theory for determining what`good‘ image- enhancement is when it comes to human perception. If it looks good, it isgood! However, when image enhancement techniques are used as pre-processing toolsfor other image processing techniques, then quantitative measures can determine whichtechniques is most appropriate.
Fuzzy image enhancement is based on gray level mapping into a fuzzy plane, using amembership transformation function. The aim is to generate an image of higher contrastthan the original image by giving a larger weight to the gray levels that are closer to themean gray level of the image than to those that are farther from the mean. An image I ofsize M x N and L gray level scan be considered as an array of fuzzy singletons, eachhaving a value of membership denoting its degree of brightness relative to somebrightness levels
Figure1. 3. The main principles of Fuzzy Image Enhancement [4].
3

1.5 Fuzzy Rule-Based Approach
If we interpret the image features as linguistic variables, then we can use fuzzy if-then
rules to segment the image into different regions. A simple fuzzy segmentation rule may
seem as follows [3]:
IF the pixel is dark AND
Its neighborhood is also dark AND homogeneous
THEN it belongs to the background.
1.6 Fuzzy Image Processing
Fuzzy image processing is not a unique theory. It is a collection of different fuzzy
approaches to image processing. Nevertheless, the following definition can be regarded
as an attempt to determine the boundaries:
Fuzzy image processing is the collection of all approaches that understand, represent and
process the images, their segments and features as fuzzy sets. The representation and
processing depend on the selected fuzzy technique and on the problem to be solved [9].
Here is a list of general observations about fuzzy logic:
Fuzzy logic is conceptually easy to understand.
The mathematical concepts behind fuzzy reasoning are very simple. Fuzzy logic is a
more intuitive approach without the far-reaching complexity.
Fuzzy logic is flexible.
With any given system, it is easy to layer on more functionality without Starting again
from scratch.
Fuzzy logic is tolerant of imprecise data.
4

Everything is imprecise if you look closely enough, but more than that, most things are
imprecise even on careful inspection. Fuzzy reasoning builds this understanding into the
process rather than tacking it onto the end.
Fuzzy logic can model nonlinear functions of arbitrary complexity.
You can create a fuzzy system to match any set of input-output data. This process is
made particularly easy by adaptive techniques like Adaptive Neuro-Fuzzy Inference
Systems (ANFIS), which are available in Fuzzy Logic Toolbox.
Fuzzy logic can be built on top of the experience of experts.
In direct contrast to neural networks, which take training data and generate opaque,
impenetrable models, fuzzy logic lets you rely on the experience of people who already
understand your system.
Fuzzy logic can be blended with conventional control techniques.
Fuzzy systems don't necessarily replace conventional control methods. In many cases
fuzzy systems augment them and simplify their implementation.
Fuzzy logic is based on natural language.
The basis for fuzzy logic is the basis for human communication. This observation
underpins many of the other statements about fuzzy logic. Because fuzzy logic is built on
the structures of qualitative de]scription used in everyday language, fuzzy logic is easy to
use.
The last statement is perhaps the most important one and deserves more discussion.
Natural language, which is used by ordinary people on a daily basis, has been shaped by
thousands of years of human history to be convenient and efficient. Sentences written in
ordinary language represent a triumph of efficient communication [3].
5

Fuzzy image processing has three main stages: image fuzzification, modification ofmembership values, and, if necessary, image defuzzification.
Figure1.5.1 Fuzzy Image processing [5].
The fuzzification and defuzzification steps are due to the fact that we do not possessfuzzy hardware. Therefore, the coding of image data (fuzzification) and decoding of theresults (defuzzification) are steps that make possible to process images with fuzzytechniques. The main power of fuzzy image processing is in the middle step(modification of membership values, see Fig.2). After the image data are transformedfrom gray-level plane to the membership plane (fuzzification), appropriate fuzzytechniques modify the membership values. This can be a fuzzy clustering, a fuzzy rule-based approach, and a fuzzy integration approach and so on.

6

Fig.1.5.2. Example Steps of Fuzzification and Defuzzification process on image
Processing [5].
1.7 The Advantages of Fuzzy Image Processing
There are many reasons to use fuzzy technique. The most important of them are as
follows:
1. Fuzzy techniques are powerful tools for knowledge representation and processing.
2. Fuzzy techniques can manage the vagueness and ambiguity efficiently.
7

In many image processing applications, used expert knowledge to overcome the
difficulties (e.g. object recognition, scene analysis). Fuzzy set theory and fuzzy logic
offer us powerful tools to represent and process human knowledge in form of fuzzy if-
then rules. On the other side, many difficulties in image processing arise because the
data/tasks/results are uncertain. This uncertainty, however, is not always due to the
randomness but to the ambiguity and vagueness. Beside randomness which can be
managed by probability theory , distinguish between three other kinds of imperfection in
the image processing.
Grayness ambiguity
Geometrical fuzziness
Vague (complex/ill-defined) knowledge
These problems are fuzzy in the nature. The question whether a pixel should become
darker or brighter than it already is, the question where is the boundary between two
image segments, and the question what is a tree in a scene analysis problem, all of these
and other similar questions are examples for situations that a fuzzy approach can be the
more suitable way to manage the imperfection [3].
1.8 Filters
When the images are transmitted over channels, they are corrupted with impulse noise
due to noisy channels. This impulse noise consists of large positive and negative spikes.
The positive spikes have values much larger than the background and thus they appear as
bright spots, while the negative spikes have values smaller than the background and they
appear as darker spots. Both the spots for the positive and negative spikes are visible to
the human eye. Also, Gaussian type of noise affects the image. Thus, filtering for both
impulse noise and Gaussian noise is required before processing. There are lots of
classical and fuzzy filters in the literature to remove noise. The classical filter are the
mean filter, the weighted filter, the adaptive weighted filter, the adaptive Wiener filter,
the Gaussian filter, the median filter, the adaptive median filter, and the extended mean
filter.
8

The mean filter or the average filter helps in smoothing operations. It suppresses the
noise that is smaller in size or any other small fluctuations in the image. It involves in
calculating the average brightness values in some neighborhood m x n and replaces the
gray level with an average value. Smoothing or averaging operation blurs the image and
does not preserve the edges. These are not used in removing noise spikes. For a 3 x 3
neighborhood the convolution masks is used as
1/9
Adaptive weighted mean filter is similar to mean filter where the gray level is replaced by
a weighted average of the gray values. Weights are calculated from the gray-level
difference. If this difference exceeds a certain threshold, then the pixel is a noise pixel.
Adaptive Weiner filter replaces the center value of the pixel by sum of the local mean
value and a fraction of contrast, where this fraction depends on the local estimation of the
variance [6].
1.9 Fuzzy Filters
Fuzzy filters provide promising result in image-processing tasks that cope with some
drawbacks of classical filters. Fuzzy filter is capable of dealing with vague and uncertain
information. Sometimes, it is required to recover a heavily noise corrupted image where a
lot of uncertainties are present and in this case fuzzy set theory is very useful. Each pixel
in the image is represented by a membership function and different types of fuzzy rules
that considers the neighborhood information or other information to eliminate filter
removes the noise with blurry edges but fuzzy filters perform both the edge preservation
and smoothing [2].
Image and fuzzy set can be modeled in a similar way. Fuzzy set in a universe of X is
associated with a membership degree. Similarly, in the normalized image where the
image pixels ranging from {0, 1, 2,.. . 255} are normalized by 255, the values obtained
9

are in the interval [0 , 1]. Thus, it is a mapping from the image G to [0, 1]. In this way,
the image is considered as a fuzzy set and thus filters are designed [6].
1.10 Fuzzy Inference System (FIS)
Fuzzy inference is the process of formulating the mapping from a given input to an
output using fuzzy logic. The mapping then provides a basis from which decisions can be
made, or patterns discerned. The process of fuzzy inference involves all of the pieces that
are: Membership Functions, Logical Operations, and If-Then Rules. There are two types
of fuzzy inference systems that can be implemented in Fuzzy Logic Toolbox: Mamdani-
type and Sugeno-type. These two types of inference systems vary somewhat in the way
outputs are determined.
Fuzzy inference systems have been successfully applied in fields such as automatic
control, data classification, decision analysis, expert systems, and computer vision.
Because of its multidisciplinary nature, fuzzy inference systems are associated with a
number of names, such as fuzzy-rule-based systems, fuzzy expert systems, fuzzy
modeling, fuzzy associative memory, and fuzzy logic controllers, and simply (and
ambiguously) fuzzy systems.
Mamdani's fuzzy inference method is the most commonly seen fuzzy methodology.
Mamdani's method was among the first control systems built using fuzzy set theory. It
was proposed in 1975 by Ebrahim Mamdani [7] as an attempt to control a steam engine
and boiler combination by synthesizing a set of linguistic control rules obtained from
experienced human operators. Mamdani‘s effort was based on Lotfi Sade‘s 1973 paper
on fuzzy algorithms or complex systems and decision processes [8]. Although the
inference process described in the next few sections differs somewhat from the methods
described in the original paper, the basic idea is much the same.
Mamdani-type inference, as defined for Fuzzy Logic Toolbox, expects the output
membership functions to be fuzzy sets. After the aggregation process, there is a fuzzy set
10

for each output variable that needs defuzzification. It is possible, and in many cases muchmore efficient, to use a single spike as the output membership functions rather than adistributed fuzzy set. This type of output is sometimes known as a singleton outputmembership function, and it can be thought of as a pre-defuzzified fuzzy set. It enhancesthe efficiency of the defuzzification process because it greatly simplifies the computationrequired by the more general Mamdani method, which finds the centroid of a two-dimensional function. Rather than integrating across the two-dimensional function to findthe centroid, you use the weighted average of a few data points. Sugeno-type systemssupport this type of model. In general, Sugeno-type systems can be used to model anyinference system in which the output membership functions are either linear or constant.

11

Chapter-2
Literature Survey
2.1 Classification of images:
2.1.1 Intensity Images
An intensity image is a data matrix whose values have been scaled to represent
intensities. When the elements of an intensity image are of class unit 8, or class unit
16, they have integer values in the range [0, 255] and [0, 65535].respectively. If the
image is of class double, the values are floating-point numbers. Values of scaled, class
double intensity images are in the range [0, 1] by convention [10].
2.1.2 Indexed Images
Array of class logical, unit 8, Unit 16, single, or double whose pixel values are
directed indices into a color map. The color map is an m-by-3 array of class double.
For single or double arrays, integer values range from [1, p]. For logical, unit8, or unit
16 arrays, values range from [0, p-1]. An indexed image consists of an array and a
color map matrix. The pixel values in the array are directed indices into a color map.
By convention, this documentation uses the variable name X to refer to the array and
map to refer to the color map [10].
2.1.3 Binary Images
Binary images have a very specific meaning in MATLAB. In a binary image, each pixel
assumes one of only two discrete values: 1 or 0, interpreted as black and white,
respectively. A binary image is stored as a logical array. Thus, an array of 0s and 1s
whose values are of data class, say, unit8, is not considered a binary image in MATLAB
[10].
12

Figure 2.1 Binary image
2.1.4 Grayscale Images:
A grayscale image (also called gray-scale, gray scale, or gray-level) is a data matrix whosevalues represent intensities within some range. MATLAB stores a grayscale image as anindividual matrix, with each element of the matrix corresponding to one image pixel. Byconvention, this documentation uses the variable name I to refer to grayscale images. Arrayof class unit8, unit16, int16, single, or double whose pixel values. For single or doublearrays, values range from [0, 1]. For unit8, values range from [0, 255]. For unit16, valuesrange from [0, 65535]. For int16, values range from [-32768, 32767].

13

Figure 2.2 Grayscale image
2.1.5 True color Images
A true color image is an image in which each pixel is specified by three values one eachfor the red, blue, and green components of the pixel‘s color. MATLAB store true colorimages as an m-by-n-by-3 data array that defines red, green, and blue color componentsfor each individual pixel. True color images do not use a color map. The color of eachpixel is determined by the combination of the red, green, and blue intensities stored ineach color plane at the pixel‘s location. Graphics file formats store true color images as24-bit images, where the red, green, and blue components are 8 bits each. This yields apotential of 16 million colors. The precision with which a real-life image can bereplicated has led to the commonly used term true color image [10].
Example of color image

14

Figure 2.3 Color Image.
2.2 Noise in an images
The fundamental problem of image and signal processing is to effectively reduce noise
from a digital color image while keeping its features intact (e.g., edges, color component
distances, etc). The nature of the noise removal problem depends on the type of the noise
corrupting the image. The two most commonly occurring types of noise are i) Additive
noise (e.g. Gaussian and Impulse noise) and ii) Multiplicative noise (e.g. Speckle noise).
Impulse noise is usually characterized by some portion of image pixels that are corrupted,
leaving the remaining pixels unchanged. Examples of impulse noise are fixed-valued
impulse noise and randomly valued impulse noise. We talk about additive noise when a
value from a certain distribution is added to each image pixel, for example, a Gaussian
distribution. Multiplicative noise is generally more difficult to remove from images than
additive noise because the intensity of the noise varies with the signal intensity (e.g.,
speckle noise).In the literature several (fuzzy and non-fuzzy) filters have been studied for
impulse noise reduction. Impulse noise is caused by errors in the data transmission
generated in noisy sensors or communication channels, or by errors during the data
capture from digital cameras. Noise usually quantified by the percentage of pixels which
are corrupted. Corrupted pixels are either set to the maximum value or have single bits
15

flipped over. In some cases, single pixels are set alternatively to zero or to the maximumvalue. This is the most common form of impulse noise and is called salt and pepper noise.Noise smoothing and edge enhancement are inherently conflicting processes, sincesmoothing a region might destroy an edge, while sharpening edges might lead tounnecessary noise [11].
2.2.1Impulse noise in color images
A color image can be represented via several color models such as RGB, CMY, CMYK, HIS,
HSV and CIE L a* b*. Images, one for each primary color (Red, Green and Blue). Consider acolor image represented in the x-y plane, then the third coordinate z= 1, 2, 3 will represent the
color component of the image pixel at (x, y). Let f be the image function then f(x, y, 1) will
represent the Red component of pixel at (x, y). Similarly, f(x, y, 2) and f(x, y, 3) represent the
Green and Blue components respectively
Images corrupted with impulse noise contain pixels affected by some probability. Thisimplies that some of the pixels may not have a trace of any noise at all. Moreover, a pixelcan have either all or one or two of its components corrupted with impulse noise.Mathematical modeling of impulse noise in color images is as follows:
F (x, y, z) = ……………. (1)
Where, z= 1, 2, 3 represents red, green & blue components. The probabilities ‗s canhave equal or unequal values. In equation (1), f represents the final corrupted image,while N and I are the numbers of corrupted and uncorrupted pixels respectively [2].
.
16

Figure 2.4 Image Effected by impulse noise

Figure 2.5 Image affected by Gaussian noise
17

2.3 Creating an image Histogram
An image histogram is a chart that shows the distribution of intensities in an indexed orgrayscale image. You can use the information in a histogram to choose an appropriateenhancement operation. For example, if an image histogram shows that the range ofintensity values is small, you can use an intensity adjustment function to spread thevalues across a wider range .To create an image histogram, use the imhist function. Thisfunction creates a histogram plot by making n equally spaced bins, each representing arange of data values. It then calculates the number of pixels within each range [10].
Figure 2.6(a) Gray Scale ImageFigure 2.6 (b) Histogram of images.
Figure 2.6 Creating Histogram of an image

18

2.4 The Origins of Digital Image Processing
One of the first applications of digital images was in the newspaper industry, when
Pictures were first sent by submarine cable between London and New York.
Introduction of the Bart lane cable picture transmission system in the early 1920s
reduced the time required to transport a picture across the Atlantic from more than a
week to less than three hours. Specialized printing equipment coded pictures for cable
transmission and then reconstructed them at the receiving end. Some of the initial
problems in improving the visual quality of these early digital pictures were related to
the selection of printing procedures and the distribution of intensity levels. The printing
method used to obtain was abandoned toward the end of 1921 in favor of a technique
based on photographic reproduction made from tapes perforated at the telegraph
receiving terminal [3].
2.5 Examples of Fields that Use Digital Image Processing
Today there is almost no area of technical endeavor that is not impacted in some way by
digital image processing. The areas of application of digital image processing are so
varied that some form of organization is desirable in attempting t capture the breadth of
this field. One of the simplest ways to develop a basic understanding of the extent of
image processing applications is to categorize images according to their source (e.g.,
visual, X-ray, and so on). The principal energy source for images in use today is the
electromagnetic energy spectrum. Other important sources of energy include acoustic,
ultrasonic, and electronic. Synthetic images, used for modeling and visualization, are
generated by computer [3].
2.6 Classification of image pixels
Characterization of an image is generally accomplished in terms of primitive attributes
called features. Image features can be mainly dived into two categories:
19

i) "Natural" features, that are defined by the visual appearance of an image (e.g.
luminance of a region of pixels, gray scale of regions);
ii) "Artificial" features that come from image manipulation (e.g. histograms, spectral
graphs) [12].
2.7 The fields that Image Enhancement has contributed .
Some of the areas in which IE has wide application are noted below.
1. In forensics IE is used for identification, evidence gathering and surveillance. Images
obtained from fingerprint detection, security videos analysis and crime scene
investigations are enhanced to help in identification of culprits and protection of victims
[13].
2. In atmospheric sciences IE is used to reduce the effects of haze, fog, mist and
turbulent weather for meteorological observations. It helps in detecting shape and
structure of remote objects in environment sensing . Satellite images undergo image
restoration and enhancement to remove noise [14].
3. Astrophotography faces challenges due to light and noise pollution that can be
minimized by IE . For real time sharpening and contrast enhancement several cameras
have in-built IE functions. Moreover, numerous softwares allow editing such images to
provide better and vivid results [15].
4.In oceanography the study of images reveals interesting features of water flow,
sediment concentration, geomorphology and bathymetric patterns to name a few. These
features are more clearly observable in images that are digitally enhanced to overcome
the problem of moving targets, deficiency of light and obscure surroundings.
5. IE techniques when applied to pictures and videos help the visually impaired in
reading small print, using computers, television and face recognition . Several studies
20

have been conducted that highlight the need and value of using IE for the visuallyimpaired [16].
6. Medical imaging uses IE techniques for reducing noise and sharpening details toimprove the visual representation of the image. Since minute details play a critical role indiagnosis and treatment of disease, it is essential to highlight important features whiledisplaying medical images. This makes IE a necessary aiding tool for viewing anatomicareas in MRI, ultrasound and x-rays to name a few [17].
Image filters exist in three domains:
Spatial domain
Frequency domain and
Fuzzy domain. The study deals with fuzzy filters which offer several advantagesover classical filters even as they preserve the image structure. Moreover, fuzzy filtersare easy to realize by means of simple fuzzy rules that characterize a particular noise. Abrief review of well known fuzzy filters is presented in the following paragraphs.
2.8 Spatial Domain methods
The value of a pixel with coordinates (x, y) in the enhanced image is the result of
performing some operation on the pixels in the neighborhood of (x, y) in the input image,F. Neighborhoods can be any shape, but usually they are rectangular [3].

Figure 2.7 Spatial domain of an image.21

Image Processing in the spatial domain can be Expressed by: g (m, n) =T (f (m, n)).Where f (m, n) is the input image, g (m, n) is the processed Image and T is the operatordefining the modification process. The operator ‗T‘ is typically a single-valued andmonotone function that can operate on individual pixels or on selective value of the inputImage is used to compute the corresponding pixel value for the output Image. Within theinput image are used to compute the modified image at any given point. One can considerpoint processing as a special case of region processing where the region is composed of asingle pixel. The point-processing operator can also be expressed by: S=T(r), Where rand s are variables denoting the intensity level of f( m , n) and g( m ,n) at any point ( m,n). The following sections describe several point-and region-based image enhancementtechniques. The second article will also discuss spatial smoothing, which is anotherexample of region-based image processing, and compare its advantages and dies-advantages with transform domain methods.
The smallest possible neighborhood is of size 1 X 1. In this case g depends only on thevalue of f at a single point (x, y) and T [3].
2.8.1 Creating Negative of an Image
The most basic and simple operation in digital image processing is to compute thenegative of an image. The pixel gray values are inverted to compute the negative of animage. For example, if an image of size R x C, where R represents number of rows and Crepresents number of columns, is represented by me (r, c). The negative N(r, c) of imageI(r, c) can be computed as N(r, c) = 255- I(r, c) where 0≤ r ≥R and 0≤ c ≤C.
It can be seen that every pixel value from the original image is subtracted from the 255.The resultant image becomes negative of the original image. Negative images are usefulfor enhancing white or grey detail embedded in dark regions of an image [19].
22
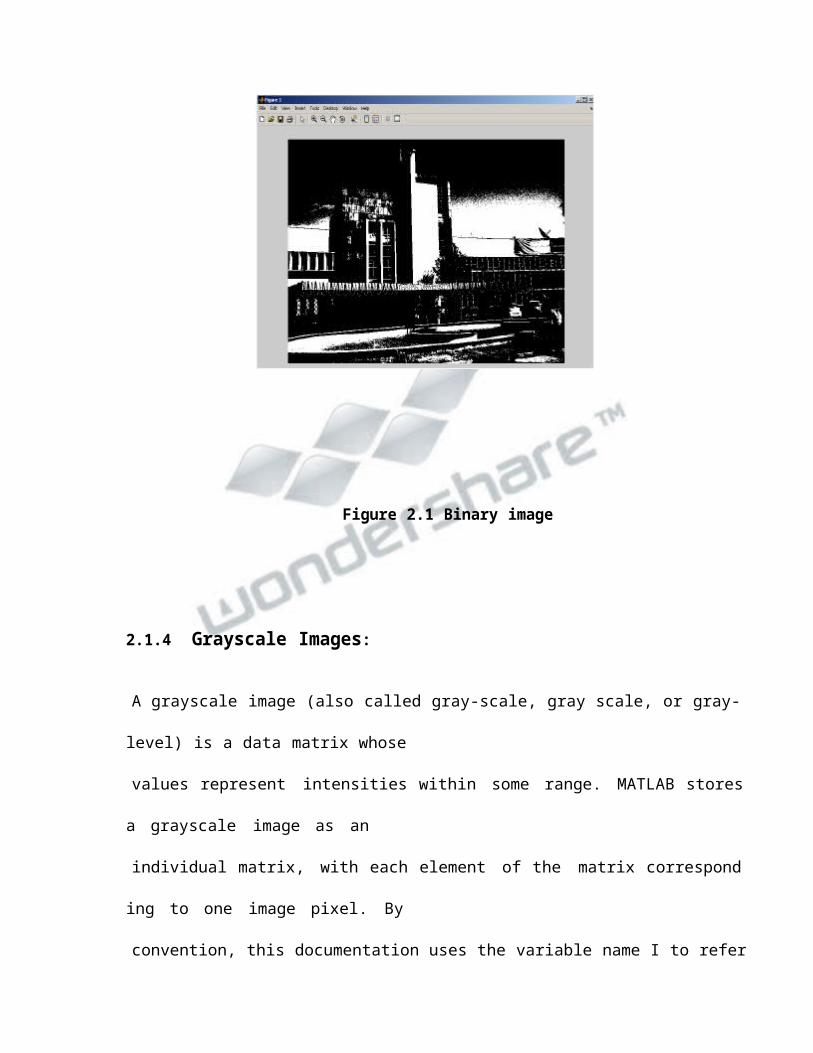
Figure 2.8 Creating Negative of an image [19].
2.8.2 Intensity Transformation
Intensity transformations are among the simplest of all image processing techniques. Thevalue of pixels, before and after processing, will be denoted by r and s, respectively. Anintensity transformation function of the form s=T(r) [18]. Where T is a transformationthat maps a pixel value r into a pixel value s. because we are dealing with digitalquantities, values of a transformation function typically are stored in a one-dimensionalarray and the mappings from r to s are implemented via table lookups. For an 8-bitenvironment, a lookup table containing the values of T will have 256 entries [19].

Figure 2.10 The Intensity Transformation of image [19].
23

2.8.3 Histogram modification
A histogram is a one-dimensional probability density function (PDF) of gray levels
present in an image. The histogram describes the global gray level distribution of pixels
within an image. Histogram-based enhancement techniques are devised to enhance an
image by modifying its histogram.
The histogram modification problem can be formulated as follows:
Given:
1) PDF of the input image (r)
2) PDF of the desired image (s)
Compute: A transformation function T, to modify gray values of the input image
to achieve the desired PDF [20].
2.9 Frequency Domain Filtering Fundamentals
Filtering in the frequency domain consists of modifying the Fourier transform of an
image and then computing the inverse transform to obtain the processed result. Thus,
given a digital image, f(x, y) of size, M X N, the basic filtering equation in which we are
interested has the form
G(x, y) =
Where is the Inverse Distributive Frequency Transformation, F( u , v) is the
Distributive Frequency Transformation of the input image f( x, y), H( u, v) is a filter
function and g( x, y ) is the filtered image [21].
2.9.1 Gaussian Low pass Filters
Gaussian low pass filters (GLPFs) of one dimension were introduced as an aid in
exploring some important relationships between the spatial and frequency domains. The
form of these filters in two dimensions is given by H (u, v) = .
24

Where D(u, v) is the distance from the center of the frequency rectangle. Here we do notuse a multiplying constant [3].
2.10 The Fuzzy set theory
Fuzzy set theory is the extension of conventional (crisp) set theory. It handles the conceptof partial truth (truth values between 1 (completely true) and 0 (completely false)). It wasintroduced by Prof. Lotfi A. Zadeh in 1965 as a mean to model the vagueness andambiguity in complex systems [3].
Definition Fuzzy set: A fuzzy set is a pair (A, m) where A is a set and m: A—> [0, 1].For each, x A m(x) is called the grade of membership of x in (A, m).
For a finite set A = {x1,...,xn}, the fuzzy set (A, m) is often denoted by {m(x1) / x1,...,m(xn)/ xn}.Let x A Then x is called not included in the fuzzy set (A, m) if m(x) = 0, x is calledfully included if m(x) = 1, and x is called fuzzy member if 0 < m(x) < 1.The set {x A |m(x)>0}is called the support of (A, m) and the set {x A | m(x)=1}is called its kernel.
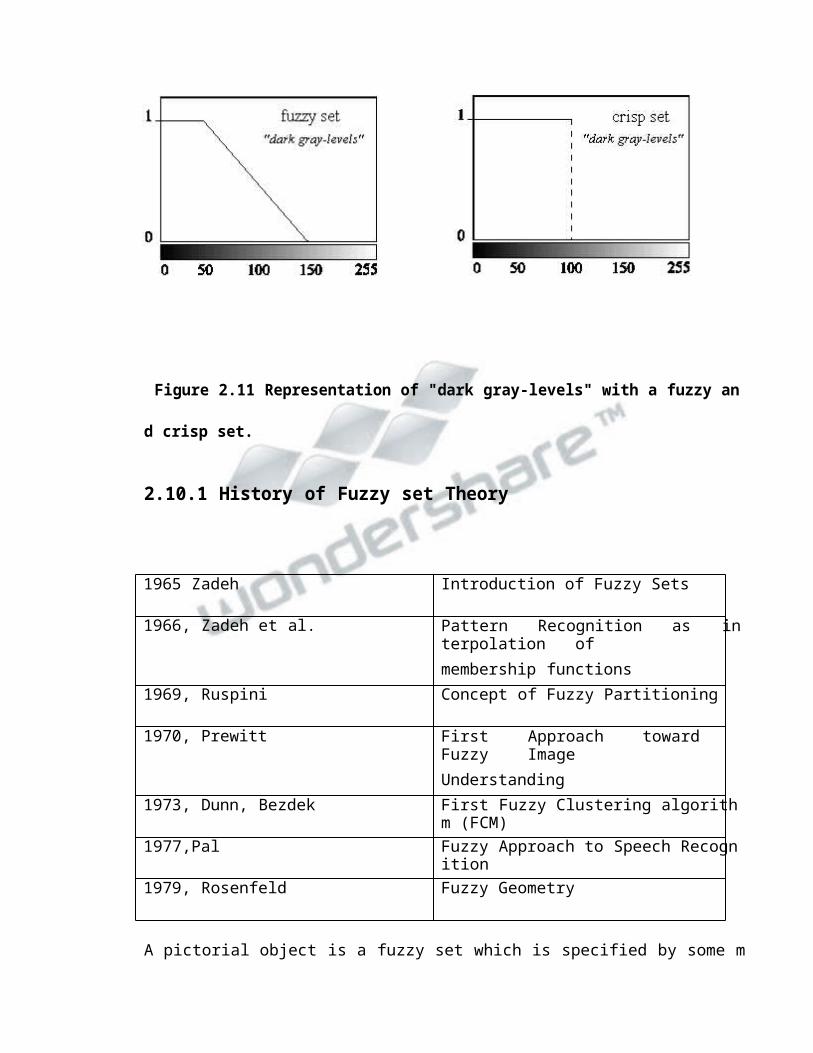
The idea of fuzzy sets is simple and natural. For instance, we want to define a set of graylevels that share the property dark. In classical set theory, we have to determine athreshold, say the gray level 100. All gray levels between 0 and 100 are element of thisset; the others do not belong to the set (right image in Fig.). But the darkness is a matterof degree. So, a fuzzy set can model this property much better. To define this set, we alsoneed two thresholds, say gray levels 50 and 150. All gray levels that are less than 50 arethe full member of the set, all gray levels that are greater than 150 are not the member ofthe set. The gray levels between 50 and 150, however, have a partial membership in theset (left image in the below Fig.).
25

Figure 2.11 Representation of "dark gray-levels" with a fuzzy and crisp set.
2.10.1 History of Fuzzy set Theory
A pictorial object is a fuzzy set which is specified by some membership function definedon all picture points. From this point of view, each image point participates in manymemberships. Some of this uncertainty is due to degradation, but some of it is
inherent…In fuzzy set terminology, making figure/ground distinctions is equivalent totransforming from membership functions to characteristic functions.― 1970, J.M.B.
1965 Zadeh Introduction of Fuzzy Sets
1966, Zadeh et al. Pattern Recognition as interpolation of
membership functions
1969, Ruspini Concept of Fuzzy Partitioning
1970, Prewitt First Approach toward Fuzzy Image
Understanding
1973, Dunn, Bezdek First Fuzzy Clustering algorithm (FCM)
1977,Pal Fuzzy Approach to Speech Recognition
1979, Rosenfeld Fuzzy Geometry

Prewitt.
26

Table 1: History of Fuzzy set theory
2.12 Survey on Image Enhancement methods
In the field of image noise reduction, several linear and nonlinear filtering methods have
been proposed. Linear filters are not able to effectively eliminate impulse noise as they
have a tendency to blur the edges of an image. On the other hand, nonlinear filters like
median filters are better suited for dealing with impulse noise. Several non-linear filters
based on classical and fuzzy techniques have emerged in the past few years. Recent
progress in fuzzy logic allows different possibilities for developing new image noise
reduction methods. The fuzzy median filter is a modification to the classical median
filter. The Fuzzy Inference Rules by Else action (FIRE) filters are a family of non-linear
operators that adopt fuzzy rules to remove noise from images. Russo introduced a multi-
pass fuzzy filter consisting of three cascaded blocks in [22]. Khriji and Gabbouj
developed a multi channel filter by combining fuzzy rational and median functions. This
filter preserves the edges and chromaticity of the image [23]. Wenbin presented a novel
idea of alpha trimmed mean and the similarity of pixels for the detection of impulse noise
based on a large difference between the noisy pixel and the noise free pixel [24].
In rank-order mean (ROM) is modified to devise a Least-Mean Square Design for
filtering out the fixed and non linear impulse noise [25]. Efforts are made in to reduce
blurring at the edges due to linear filtering. A signal adaptive median filtering algorithm27
1980-1986, Rosendfeld et al., Pal et al. Extension of Fuzzy Geometry, New
methods for enhancement / segmentation
End of 80s-90s Dave/
Krishnapuram/Bezdek Russo/
Krishnapuram
Different Fuzzy Clustering algorithms
Bloch et al. / Di Gesu / Sinha et al. / De
Baets / and many others
Rule-based Filters,
Fuzzy Morophology

is proposed in for the removal of impulse noise in which the notion of homogeneity level
is defined for pixel values based on their global and local statistical properties [26]. The
co-occurrence matrices are used to represent the correlations between a pixel and its
neighbors, and to derive the upper and lower bounds of the homogeneity level. The use of
non linear filters for both noise correction and image preservation is also suggested in
[27]. Median based filters are modified for detail-preservation images Mansoor et al.
introduce an iterative edge preserving filtering technique using the blur metric. Noisy
pixels have been categorized into edge and non edge pixels and different filtering
schemes are applied. Stefan et al. presented a fuzzy two-step color filter for the reduction
of impulse noise. This filter utilizes the fuzzy gradient values and fuzzy reasoning for the
detection of noisy pixels. Mansoor et al [28] developed a recursive filter images which
are highly corrupted by impulse noise. This filter estimates the noise level which is
required to obtain the filter parameters. All these filters were specifically designed to
reduce impulse noise [29].
The performance of the median filter in removing Gaussian noise is inadequate. This
drawback is overcome with some success by employing another nonlinear filter
technique which makes use of moving average filters (MAV). The concept behind a
standard moving average filter is to replace its central pixel by the average value of its
predefined neighborhood. One of the major issues in removing Gaussian noise is to
differentiate between noise and edges. Various attempts have been made in the past to
solve this problem. Fuzzy derivatives are used for task in [30]. The GOA filter was
designed for reducing Gaussian type noise by estimating a fuzzy gradient in each
direction so as to distinguish the local variation due to noise from that of an image
structure. Stefan et al [31]. Consider the fuzzy distance between color pairs as a weight to
perform the weighted average filtering for the removal of the Gaussian noise in color
images. Russo [32] proposes a method for Gaussian noise filtering that combines a
nonlinear algorithm for detail preserving and smoothing of noisy data, and a technique
for automatic parameter tuning based on noise estimation. A new filtering architecture
adopting multi parameter piecewise linear (PWI) functions is devised for the restoration
28

of the images corrupted by the Gaussian noise [33]. Xiaofen and Qigang [34] made use of
perceptual classification rules to separate noise from other relevant features of image.
In yet another interesting work [35], fuzzy smoothing of images for Gaussian as well as
Impulse noise is achieved by combining the output of several filters termed as hybrid
filters. Most of the methods presented in literature deal with gray scale images. It is
possible to extend these techniques to color images component wise i.e. each component
R, G, and B can be passed through a filter separately. Barring a few, most papers on noise
removal have dealt with the individual component of RGB color space separately. In the
case of Gaussian noise, where differentiating between noise and edges (i.e. finer details
of image) is difficult, dealing with each component introduces artifacts in the de-noised
image. Only a few research studies have actually explored the interaction between the
color components.
Noise reduction is an important area for image processing. Besides classical filters, there
are lots of fuzzy filters in the literature. Images can be corrupted with impulse noise,
Gaussian noise, or both. Depending on the type of noise, filters can be used. The fuzzy
filters are categorized into two subclasses [6]:
(a) Fuzzy-classical filters and
(b) Fuzzy filters.
(a) Fuzzy Classical filters are filters that use fuzzy logic and these are the
modification of the classical filters. Some of the fuzzy- classical filters are
(i) Fuzzy median filter: Fuzzy median filter is well known for removing impulse
noise. It is the fuzzy rank ordering of samples and is simply a replacement of
conventional median filter with fuzzy counterparts.
(ii) Fuzzy impulse noise detection and reduction method- this filter by Schulte
detects the impulse noise and any other noise in the image. It contains the noise-
detection step and filtering step to preserve the edges. Fuzzy detection step uses fuzzy
gradient values in eight directions with a 3 x 3 window, which indicates the degree of
central pixel as an impulse noise pixel. A fuzzy set is constructed based on the gradient
29

values which are represented by a membership function such as BIG, SMALL, BIG
POSITIVE, and BIG NEGATIVE. Then a fuzzy rule is applied to decide if the control
pixel as a noise pixel.
(b)Fuzzy Filters: These are filters that are totally dependent on fuzzy logic and they do
not have any connection with classical filters. A few fuzzy filters are discussed below.
(i) Gaussian noise reduction filter (GOA) - This filter is specially designed to remove
Gaussian noise. Averaging is done for a pixel using other neighborhood pixels and
simultaneously taking care of the other image structures such as edges. To achieve this,
two features are required. First, in order to distinguish between the variations due to noise
and the image structures, the filter uses gradient for all the eight directions. Second, the
membership functions are adapted accordingly to the noise level to perform fuzzy
smoothing. The filter is applied iteratively.
(ii) Histogram adaptive filter (HAF) – This type of filter removes high impulsive noise,
preserving edge information. In HAF, each input pixel is considered a fuzzy variable and
a square window of size 3X3 is sided over the entire image and the filter output is
associated with each center pixel in a window. Three fuzzy sets for dark, medium, and
bright are created and the membership functions for these fuzzy sets are calculated. Then
fuzzy inference rules based on the Takagi-Sugeno approach with a slight difference is
used in a final output decision process.
2.13 MATLAB: Dr Cleve Moler, Chief Scientist at Math Works, Inc., Originally
wrote MATLAB, to provide easy access to matrix software developed in the LINPACK
and EISPACK projects. The very first version was written in the late 1970s for use in
courses in matrix theory, linear algebra, and numerical analysis. MATLAB is therefore
built upon a foundation of sophisticated matrix software, in which the basic data element
is a matrix that does not require pre dimensioning. MATLAB is a product of The Math
works,Inc. and is an advanced interactive software package specially designed for
scientific and engineering computation. The MATLAB environment integrates graphic
30

illustations with precise numerical calculations, and is a powerful, easy-to-use, andcomprehensive tool for performing all kinds of computations and scientific datavisualization. MATLAB has proven to be a very flexible and usable tool for technicalcomputing. It integrates computation, visualization, and programming in an easy-to-useenvironment where problems and solutions are expressed in familiar mathematicalnotation. Typical use includes:
- Math and computation
-Algorithm development
-Modeling, simulation, and prototyping
-Data analysis, exploration, and visualization
-Scientific and engineering graphics
-Application development, including graphical user interface building.

31

Chapter- 3
Problem Statement
Whenever an image is converted from one form to another such as, digitizing, scanning,
transmitting, storing, etc., some of the degradation occurs at the output. Hence, the output
image has to undergo a process called image enhancement which consists of a collection
of techniques that seek to improve the visual appearance of an image. In the image if the
local region is somewhat smooth, then the new value of the pixel can be determined by
averaging neighboring pixel values. On the other hand, if the local region contains edges
a different type of enhancement method should be used. However, it is extremely hard, if
not impossible, to set the conditions under which a certain enhancement method should
be selected, since the local conditions can be evaluated only vaguely in some portions of
an image, therefore, an enhance method needs to be capable of reasoning with vague and
uncertain information; this suggests the use of fuzzy logic.
In this thesis work a technique is designed by using Fuzzy Inference System in MATLAB
7.5 (is the process of mapping from a given input to an output using fuzzy logic).
Objectives:
To study the existing enhancement methods in spatial, frequency domain and
fuzzy domain methods.
To design the technique using FIS (Fuzzy Inference System) to improve the
image contrast.
Implement it in MATLAB 7.5
Test the designed technique using some degraded, low contrasted images.
32

This designed technique is able to improve contrast of the image as compare toThresholding method, Histogram Equalization, Gaussian Low-pass Filter and SpatialAveraging Filter.
An algorithm is proposed and implemented to enhance image using fuzzytechnique. This algorithm is used to convert the image properties into fuzzy data andfuzzy data into defuzzification.

33

Chapter-4
Design and Implementation
Fuzzy inference system is the process of formulating the mapping from a given input toan output using fuzzy logic. The mapping then provides a basis from which decisions canbe made, or patterns discerned. The process of fuzzy inference involves all of the piecesthat are described in the previous sections: membership functions, fuzzy logic operators,and if-then rules. There are two types of fuzzy inference systems that can be implementedin the Fuzzy Logic Toolbox: Mamdani-type and Sugeno-type. These two types ofinference systems vary somewhat in the way outputs are determined. Fuzzy inferencesystems have been successfully applied in fields such as automatic control, dataclassification, decision analysis, expert systems, and computer vision. Because of itsmultidisciplinary nature, fuzzy inference systems are associated with a number of names,such as fuzzy-rule-based systems, fuzzy expert systems; the following are the steps whichare carried out in the sequence to get the desired output:
1) Read the original image.
2) Convert it into Gray Scale image if it is RGB image.
3) Add the noise to the image.
4) Calculate size of original image.
5) Perform morphological operation on image.
6) Apply fuzzy inference Engineering.
7) Normalization of pixel values.

34

8) Passing parameters to the FIS.
9) Compare the enhanced image with the other enhanced images.
4.1 Fuzzy Inference System
Fuzzy inference is the process of formulating the mapping from a given input to anoutput using fuzzy logic.
Figure 4.1 Fuzzy Inference Systems.
4.2 Fuzzy Inference System Editor:

Figure4.2. Fuzzy Inference System Editor.35

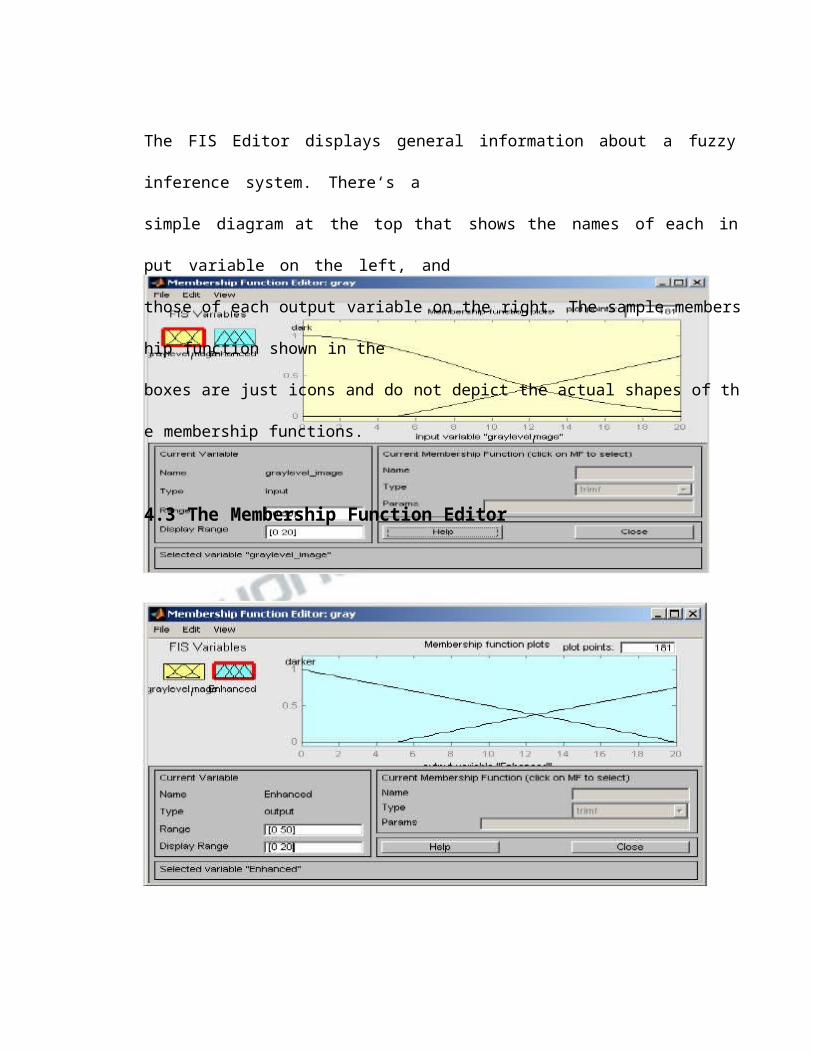
The FIS Editor displays general information about a fuzzy inference system. There‘s asimple diagram at the top that shows the names of each input variable on the left, andthose of each output variable on the right. The sample membership function shown in theboxes are just icons and do not depict the actual shapes of the membership functions.
4.3 The Membership Function Editor

Figure 4.3 The Membership Function Editor.36

4.4 The Rule Editor
Figure 4.4 Rule Editor
Constructing rules using the graphical Rule Editor interface is fairly self-evident. Basedon the descriptions of the input and output variables defined with the FIS Editor, the RuleEditor allows you to construct the rule statements automatically, by clicking on andselecting on the selecting one item in each input variable box, One item in each outputbox, and one connection item. Choosing none as one of the variable qualities willexclude that variable from a given rule. Choosing not under any variable name willnegate the associated quality. Rules may be changed, deleted, or added, by clicking onthe appropriate button. The Rule Editor also has some familiar landmarks, similar tothose in the FIS Editor and the Membership Function Editor, including the menu bar andthe status line. The Format pop-up menu is available from the Options pull down menufrom the top menu bar this is used to set the format for the display.

37

4.5 The Rule Viewer
Figure 4.5 The Rule Viewer.
The Rule Viewer displays a roadmap of the whole fuzzy inference process.
4.6 The Surface Viewer

Figure 4.6 The Surface Viewer.38
Upon opening the Surface Viewer, we are presented with a two-dimensional curve that
represents the mapping from service quality to tip amount. Since this is a one-input one-
output case, we can see the entire mapping in one plot. Two- input one-output systems
also work well, as they generate three-dimensional plots that MATLAB can adeptly
manage. When we move beyond three dimensions overall, we start to encounter trouble
displaying the results. Accordingly, the Surface Viewer is equipped with pop-up menus
that let you select any two inputs and any one output for plotting. Just below the pop-up
menus are two text input fields that let you determine how many x-axis and y-axis grid
lines you want to include. This allows you to keep the calculation time reasonable for
complex problems. To change the x-axis or y-axis grid after the surface is in view, simply
change the appropriate text field, and click on either X-grids or Y-grids, according to
which text field you changed, to redraw the plot.
4.7 Algorithm to enhance image using fuzzy technique.
The algorithm starts with the initialization of the image parameters; size, minimum, mid
and maximum gray level. The fuzzy rule-based approach is a powerful and universal
method for many tasks in the image processing.
The algorithm is described as bellow:
Step -1: Morphological processing
i) Read the image
ii) Convert it into Grayscale image if it is RGB image.
iii) Find the size of the image (M X N).
iv) Add the noise to the image (impulse noise).
v) Find the minimum, maximum gray level of the image also find the average gray
level of the image.
39

Step -2: Convert the image data into Fuzzy domain data
i) For x=0:M
For y=0: N
a) If gray_ value between zero and min
Then fdata=0;
b) Else if gray_ value between min and mid
Then fdata = (1/(mid-min) * min + (1/mid- min)* data;
c) If gray _ value between mid and max
Then fdata = (1/(max-mid) )* mid + (1/(max-mid))*data;
d) if gray_ level between max and 255
Then fdata=1;
Step -3 Membership Modifications
For x=0: M
For y=0: N
a) If gray _ value between 0 and min
fdata= 0; // if the pixel is dark then make it darker.
b) If gray _ value between min and mid. / / If the pixel gray then make it gray
for x=0:3
i) If fdata between 0 and 0.5
Then fdata=2*(fdata) ^2;
ii) Else if fdata between 0.5 and 1
Then fdata= 1-2*(1-fdata) ^2;
c) If gray _ value between mid and max // if the pixel is bright then make it
brighter
40

for x=0; 3i) If fdata between 0 and 0.5
Then fdata=2*(fdata) ^2;ii) If fdata between 0.5 and 1
Then fdata= 1- 2* (1-fdata) ^2;iii) If gray_ value between max and 255
Then fdata = 1;Step -4 DeffuzificationFor x=0: MFor y=0: Na) If gray _ value between 0 and min
Then enhanced_ data = gray _ value
b) If gray_ value between min and midThen enhanced_ data=-(mid – min) * fdata+ min
c) If gray _ value between mid and maxThen enhanced_data= ( max –mid) * fdata+mid;
Step -5 displaying the Enhanced image.
i) Show the original image.ii) Show the enhanced image.
41
Chapter-5
Testing & Results
5.1 Evolution of FIS:
After designing the system we store this file into MATLAB workplace as a .fis extension
We execute this file in MATLAB command prompt window. For executing this file weuse the fallowing below cammads:
>> evalfis (input, fismat) >> evalfis (input, fismat, numPts) >>[Output, IRR, ORR, ARR]= evalfis (input, fismat) >>[Output, IRR, ORR, ARR]= evalfis (input, fismat, numPts)
Descriptionevalfis has the following arguments:
Input: a number or a matrix specifying input values. If input is an M-by-Nmatrix, where N is number of input variables, then evalfis takes each row of inputas an input vector and returns the M-by-L matrix to the variable, output, whereeach row is an output vector and L is the number of output variables.
fismat: a FIS structure to be evaluated.
numPts: an optional argument that represents the number of sample points onwhich to evaluate the membership functions over the input or output range. If thisargument is not used, the default value of 101 points is used.

The range labels for evalfis are as follows:
42
Output: the output matrix of size M-by-L, where M represents the number of input
values specified previously, and L is the number of output variables for the FIS. The
optional range variables for evalfis are only calculated when the input argument is a row
vector, (only one set of inputs is applied).
These optional range variables are
IRR: the result of evaluating the input values through the membership functions.
This matrix is of the size numRules-by-N, where numRules is the number of rules, and N
is the number of input variables.
ORR: the result of evaluating the output values through the membership
functions. This matrix is of the size mumps-by-numerals*L, where numerals is the
number of rules, and L is the number of outputs. The first numRules columns of this
matrix correspond to the first output, the next numRules columns of this matrix
correspond to the second output, and so forth.
ARR: the numPts-by-L matrix of the aggregate values sampled at numPts along
the output range for each output
Create a M-file and save that file in MATLAB file, input the pixel value to the
function
>>grayfis(‗pout.tif‘, ‗outputimg‘)
Output= evalfis (input, fismat) store the values in another g(x, y) then do some
morphological operations and display the image.
43

Figure 5.1 Output of the proposed method.
Input one by one pixel to the FIS System by typing the below command on command
prompt of the tool MATLAB 7.5.0.
a=readfis('grayimg.fis');

output=evlfis(inptut, fismat)
44

5.2 Input pixels to the FIS System (8 x 8):
Table 5.1 input pixel to the FIS system.
97 98 99 101 101 99 98 97
98 101 102 102 102 99 98 95
97 102 106 106 106 101 98 95
97 107 109 113 110 105 95 91
98 108 112 120 117 110 98 95
101 109 114 121 122 119 108 106
105 112 117 123 128 123 113 110
108 117 122 128 130 128 121 120
124 124 124 125 125 124 124 124
124 125 125 125 125 124 124 123
123 125 126 126 126 125 124 124
124 126 126 126 126 126 124 123
124 126 126 127 127 126 124 123
125 126 126 127 127 127 126 126
126 126 127 127 127 127 126 126
126 127 127 127 127 127 126 126

5.3 Output pixels (8x8) :
Table 5.2 output pixels of the FIS system.45

5.4 Image enhancement using Thresholding.
Output of thresholding:
Figure 5.2 Output of image enhancement using Thresholding.
46

5.5 Spatial Average low pass filtering
Figure 5.3 Output of image using Spatial Average Filtering.

47

5.6 Histogram Equalization
Figure 5.4. Histogram Equalization.

48

5.7 Frequency Domain Image filters
1. Gaussian Low-pass Filter

Figure 5.5 Output of the image using Gaussian Low- pass Filter.
49

Figure 5.6 Output of all the methods.

50

Chapter -6
Conclusion and Future Scope
6.1 Conclusion
In this thesis work a technique is designed based on Fuzzy Inference System toolin MATLAB 7.5 (MATLAB is a software package developed by Math Works).Toenhance the pixels three membership functions are used. One can also use anyautomatic approaches for image enhancement to increase the image quality. Oneof the disadvantages of measure theory is the computational complexity if thenumber of elements is large.
The proposed technique used fuzzy if – then rules are a sophisticated bridgebetween human knowledge on the one side and the numerical framework of thecomputers on the other side, simple and easy to understand. To achieve a higherlevel of image quality considering the subjective perception and opinion of thehuman observers.
The proposed technique is able to overcome the draw backs of spatial domainmethods like thresholding and frequency domain methods like Gaussian low passfilter. The proposed technique is able to improve the contrast of the image. Theproposed technique is tested on different type of images, like degraded, lowcontrasted images.

51

6.2 Future Scope
In the future the existing systems can be modified by fuzzy set theory application.Modification of fuzzy rules can produce better results. Neuro-Fuzzy techniques can beused to enhance the images.

52

References
[1] Farzam Farbiz, Mohammad Bager Menhaj, Seyed A. Motamedi, and Martin
T.Hagan " A New Fuzzy Logic Filter for Image Enahcement" IEEE Transections
Systems, Man, and Cybernetics-part B: Cyberntics, Vol.30,NO.1, February 2000.
[2] Om Parkas Verma, Madasu Hanmandlu, Anil Singh Pariah and Vamp Krishna
Madasu " Fuzzy Filter for Noise Reduction in Color Images" ICGST-GVIP Journal,
Volume 9, September 2009, and ISSN:1687-398X.
[3] Rafael C.Gonzalez and Richard, E. Woods " Digital Image Processing‖ Third Edition-
2009.
[4] Aboul Ella Hassanien,Amr Badr " A Comparative Study on Digital Mamography
Enhancement Algorithms Based on Fuzzy Theory" Studies in Informatics and Control,
Vol.12,No.1, March 2003.
[5] Alper Pasha "Morphological image processing with fuzzy logic" Havaclilik ve uzay
teknolojilerl derglsl ocak 2006 cilt 2 sayi 3 ( 27-34).
[6] Tamalika Chaira, Ajoy kumar Raj " Fuzzy image Processing and Applications with
MATLAB" CRC Press 2010.
[7] Mamdani, E.H. and S. Assilian, "An experiment in linguistic synthesis with a fuzzy
logic controller," International Journal of Man-Machine Studies, Vol. 7, No. 1, pp. 1-13,
1975.
[8] Zadeh, L.A., "Outline of a new approach to the analysis of complex systems and
decision processes," IEEE Transactions on Systems, Man, and Cybernetics, Vol. 3, No.
1,pp. 28-44, Jan. 1973.
[9] Tizhoosh " Fuzzy Image Processing" Springer, 1997.
53

[10] www.mathworks.com
[11] Stefan Schulte, Valerie De Witte, and Etienn, E.Kerre. ―A Fuzzy noise reduction
method for color images" IEEE Transections on image processing, vol. 16.no.5, May
2007.
[12] C.Castiello, G.Castellano, L.Caponetti and A.M.Fanelli " Fuzzy Classification of
Image Pixels"
[13] K. Teddy, "Fingerprint Enhancement by Spectral Analysis Techniques," in 31st
Applied Imagery Pattern Recognition Workshop, Washington DC, WA, Oct 2002, pp.
16-18.
[14] D. W. Armitage, and J. P. Oakley, "Noise Levels in Colour Image Enhancement," in
Visual Inform. Eng., London, UK, July 2003, pp. 105-108.
[15] P. Fridman, "Radio Astronomy Image Enhancement in the Presence of Phase
Errors using Genetic Algorithms," in Int. Conf. on Image Process., Thessaloniki,
Greece, Oct 2001, pp. 612-615.
[16] T. Jinshan, K. Jeonghoon, and E. Peli, ―Image Enhancement in the JPEG Domain for
People with Vision Impairment,‖ IEEE Trans. Biomed. Eng., vol. 51, no. 11, pp.
2013-2023, Nov 2004.
[17] D. Y. Tsai, L. Yongbum, M. Sekiya, S. Sakaguchi, and I. Yamad, "A Method of
Medical Image Enhancement using Wavelet Analysis," in 6th Int. Conf. Signal Process.,
Beijing, China, Aug 2002, pp. 723-726.
[18] M Analoui " Radiographic image enhancement" Dentomaxillofacial Radiology
(2001) 30, 1-9.
[19] Raman Maini and Himanshu Aggarwal, "A Comprehensive Review of Image
Enhancement Techniques"Journal of Computing, Volume2. issue3, MARCH-2010,ISSN
2151-9617.
54

[20] William K.Pratt PixelSoft,Inc. Los Altos, California " Digital image processing"
Third Edition-2001.
[21] Anil K.Jain "Fundamentals of Digital Image processing" Prentice hall Information
and system sciences series Thomas Kailath, Series Editor-1989.
[22] F.Russo and G.Ramponi, " A noise smoother using cascaded FIRE filters", Proc. of
4th Intl. Conf. on Fuzzy Systems, Vol.1,pp. 351-358,1995.
[23] L. Khriji, M.Gabbouj, " A Class of Multichannel Image Processing Filters", IEICE
Trans.on Information and System, Vol. E82-D,No.12,pp.1589-1596,1999.
[24] W. Luo, " An Efficient Detail-Preserving Appraoch for Removing Impulse Noise
in Images", IEEE Signal Processing Letters, Vol. 13, NO. 7, July 2006.
[25] E.Abreu, M.Lightstone, S.Mitra, and K. Arakawa, " A new efficient approach for
the removal of impulse noise from highly corrupted images", IEEE Trans.on Image
Processing,Vol.5,pp.1012-1025,june 1996.
[26] G.Pok, J.Liu and A.S Nair, " selective removal of impulse noise based on
homogeneity level information", IEEE Trans. on Image Processing, Vol.12,pp.85-
92,Jan.2003.
[27] F.Russo, " A technique for image restoration based on recursive processing and
error correction", Proc. of IEEE Instrumentation and Measurement Technology
Conference, Vol.3,pp.1232-1236,2000.
[28] S.Schulte, V.De Witte, M.Nachtegael, D.Van der Weken, and E.E. Kerre, " Fuzzy
Two-Step Filter for Impulse Noise Reduction From Color Images",IEEE Trans. on Image
Processing, Vol.15,No.11, November 2006.
[29] S.M Roomi and I.M Lakshmi and V.A.Kumar, " A Recursive Gaussian Weighted
Filter for Impulse Noise Removal",GVIP Special Issue on Denoising, pp.21-25,2007.
55
[30] D.Van De Ville, M.Nachtegael,D.Van der Weken, E.E.Kerre, W.Philips, andI.Lemahie, "Noise Reduction by Fuzzy Image Filtering", IEEE Trans. on FuzzySystems, Vol.11,No. 4,pp. 429-436,2003.
[31] A.Taguchi, H.Takahima, and F.Russo,"Data Dependent Filtering using The FuzzyInference",Proceedings of IEEE Instrumentation and Measurement TechnologyConference, pp.752-756,1995.Method for Estimation and Filtering of Gaussian Noise inImages".IEEE Trans. on Instrumentation and Measurement, Vol.52,No.4,2003.
[33] F.Russo, " A Method Based on Piecewise Linear Models for Accurate Restorationof Images Corrupted by Gaussian Noise",IEEE Trans. on Instrumentation andMeasurement,Vol.55,No.6,2006.
[34] X.Zheng and Q.Gao,"Image NOise Removal Using Perceptual Edge Features",GVIP Special Issue on Denoising, pp.15-20,2007.
[35] H.S Kam and M.Hanmandlu, "An improved fuzzy enhancement by adaptiveparameter selection",Proc. of IEEE International Conference on Systems, Man &Cybernetics, Vol.2,pp.2001-2006,2003.

56

List of Papers Published/Communicated
Nitin Kumar Kansal , K.Venkateshwarlu, and Mrs. Anju Bala , ―An application ofFuzzy Technique for fingerprint image enhancement ― published in NationalConference on ―Next Generation Computing (NGC- 2010) ―March 20, 2010 atGurgaon Institute of Technology & Management ,Bilaspur - Tauru Road,Gurgaon ( Haryana ), India.
K.Venkateshwarlu, Nitin Kumar Kansal and Mrs. Anju Bala, "The Role of Fuzzytechniques for Image Enhancement‖ presented in Recent Trends inMathematical Sciences March 30-31, 2010 at Department of Mathematics,Osmania University, Hyderabad (Andhra Pradesh), India.

57