Embed Size (px)
Citation preview
112 - Central Plains
Summary of Total Expenditures by Function (All Funds)……………………….………...……………………….……………………..2
Total Expenditures by Function (All Funds)………….…………………………….…….. 3
Total Expenditures Amount per Pupil by Function (All Funds)……………….………………………….…………………..4
Summary of General and Supplemental General Fund Expenditures…………………………………5
Instruction Expenses…………………………………………………………………………………..………………………..6
Sources of Revenue and Proposed Budget for 2013-14…………………...………………………..………..7
Enrollment and Low Income Students…………………………………………………………………...……………..8
Mill Rates by Fund………………………………………………………………..…………...…………..………………………9
Assessed Valuation and Bonded Indebtedness…………………….……………………………………………..10
Average Salary…………………………………………………………………………………....………………………………….11
KSDE Website Information……………………………………………………………...…………………………………….12
Table of Contents
1

2
USD# 112
2011-2012 2012-2013 2013-2014
Actual Actual Budget
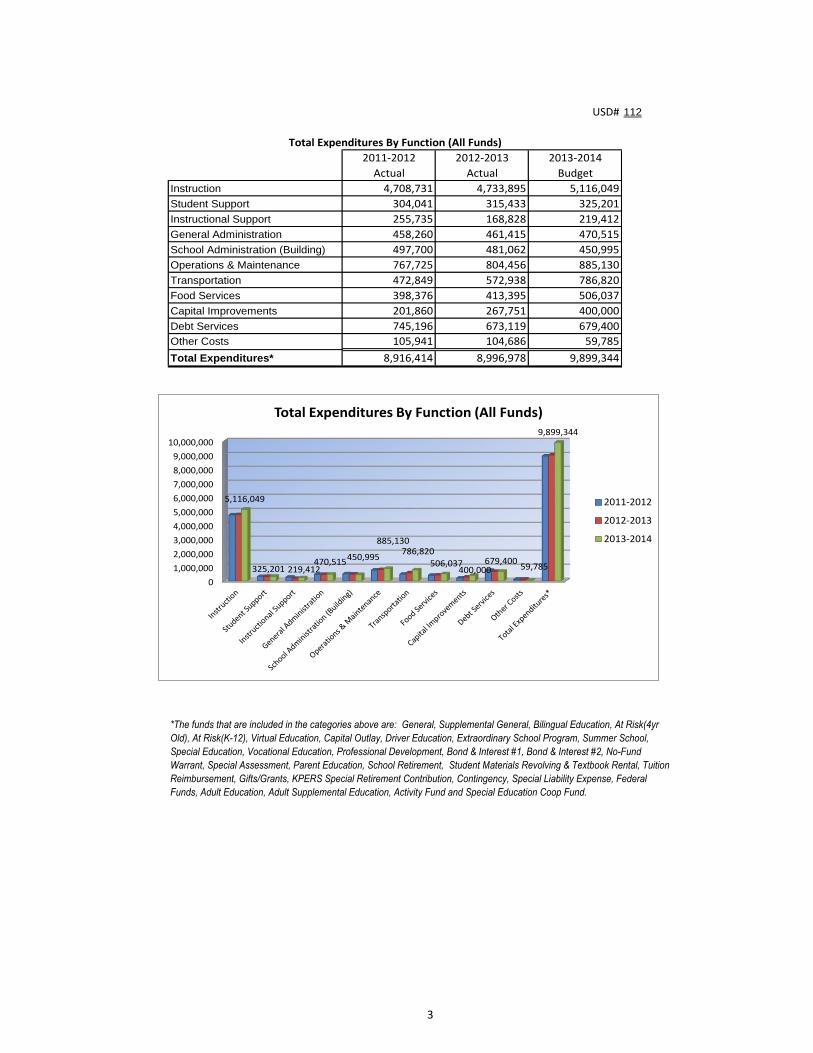
Instruction 4,708,731 4,733,895 5,116,049
Student Support 304,041 315,433 325,201
Instructional Support 255,735 168,828 219,412
General Administration 458,260 461,415 470,515
School Administration (Building) 497,700 481,062 450,995
Operations & Maintenance 767,725 804,456 885,130
Transportation 472,849 572,938 786,820
Food Services 398,376 413,395 506,037
Capital Improvements 201,860 267,751 400,000
Debt Services 745,196 673,119 679,400
Other Costs 105,941 104,686 59,785
Total Expenditures* 8,916,414 8,996,978 9,899,344
*The funds that are included in the categories above are: General, Supplemental General, Bilingual Education, At Risk(4yr
Old), At Risk(K-12), Virtual Education, Capital Outlay, Driver Education, Extraordinary School Program, Summer School,
Special Education, Vocational Education, Professional Development, Bond & Interest #1, Bond & Interest #2, No-Fund
Warrant, Special Assessment, Parent Education, School Retirement, Student Materials Revolving & Textbook Rental, Tuition
Reimbursement, Gifts/Grants, KPERS Special Retirement Contribution, Contingency, Special Liability Expense, Federal
Funds, Adult Education, Adult Supplemental Education, Activity Fund and Special Education Coop Fund.
Total Expenditures By Function (All Funds)
0
1,000,000
2,000,000
3,000,000
4,000,000
5,000,000
6,000,000
7,000,000
8,000,000
9,000,000
10,000,000
5,116,049
325,201 219,412470,515
450,995
885,130786,820
506,037400,000
679,40059,785
9,899,344
Total Expenditures By Function (All Funds)
2011-2012
2012-2013
2013-2014
3
USD# 112
2011-2012 2012-2013 2013-2014
Actual Actual Budget
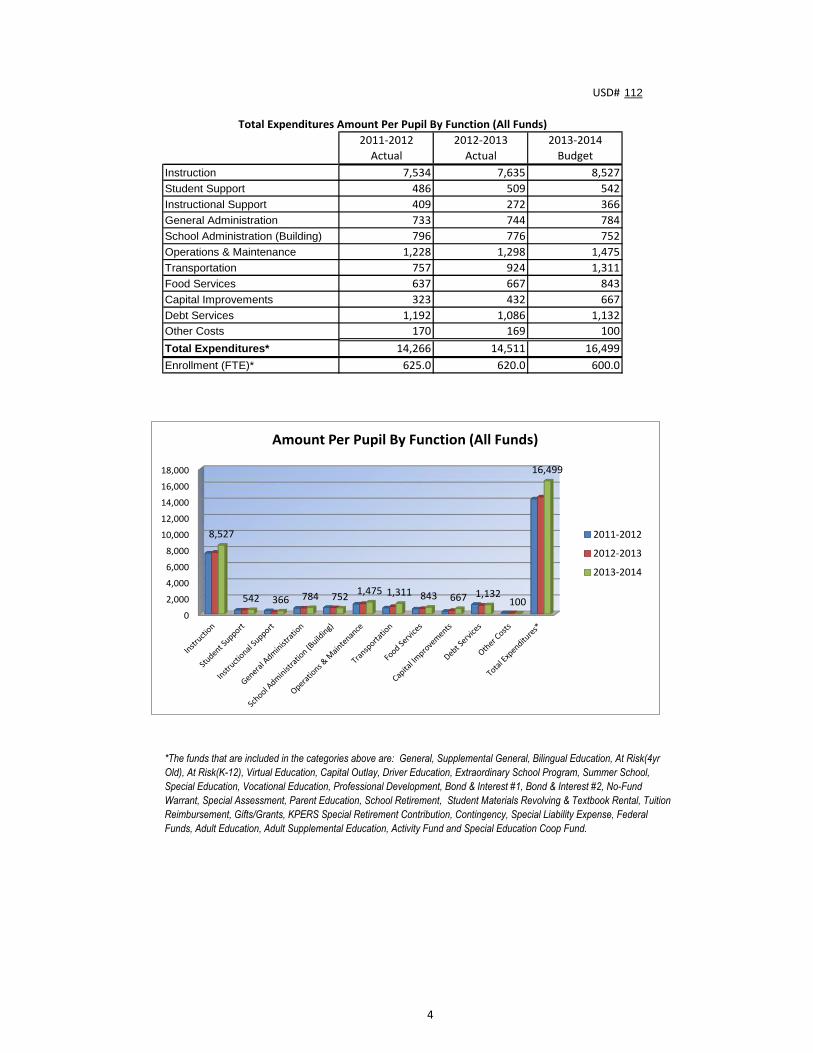
Instruction 7,534 7,635 8,527
Student Support 486 509 542
Instructional Support 409 272 366
General Administration 733 744 784
School Administration (Building) 796 776 752
Operations & Maintenance 1,228 1,298 1,475
Transportation 757 924 1,311
Food Services 637 667 843
Capital Improvements 323 432 667
Debt Services 1,192 1,086 1,132
Other Costs 170 169 100
Total Expenditures* 14,266 14,511 16,499
Enrollment (FTE)* 625.0 620.0 600.0
*The funds that are included in the categories above are: General, Supplemental General, Bilingual Education, At Risk(4yr
Old), At Risk(K-12), Virtual Education, Capital Outlay, Driver Education, Extraordinary School Program, Summer School,
Special Education, Vocational Education, Professional Development, Bond & Interest #1, Bond & Interest #2, No-Fund
Warrant, Special Assessment, Parent Education, School Retirement, Student Materials Revolving & Textbook Rental, Tuition
Reimbursement, Gifts/Grants, KPERS Special Retirement Contribution, Contingency, Special Liability Expense, Federal
Funds, Adult Education, Adult Supplemental Education, Activity Fund and Special Education Coop Fund.
Total Expenditures Amount Per Pupil By Function (All Funds)
0
2,000
4,000
6,000
8,000
10,000
12,000
14,000
16,000
18,000
8,527
542 366 784 7521,475 1,311 843 667 1,132
100
16,499
Amount Per Pupil By Function (All Funds)
2011-2012
2012-2013
2013-2014
4
USD# 112
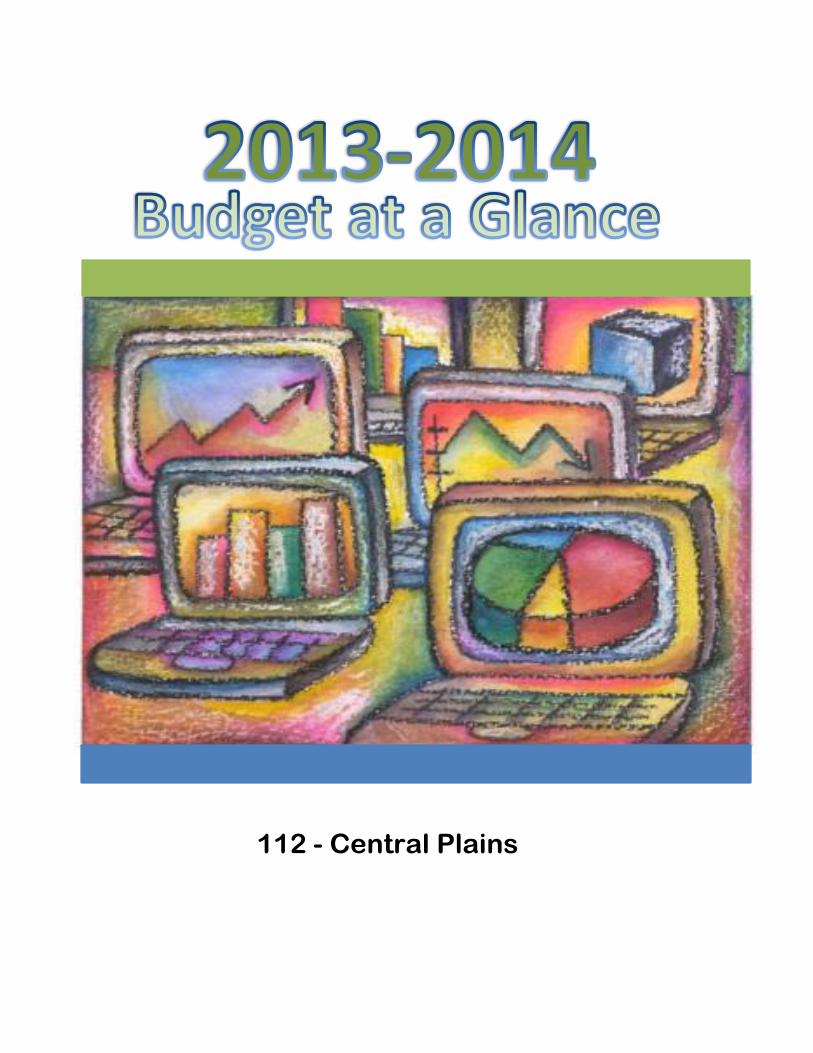
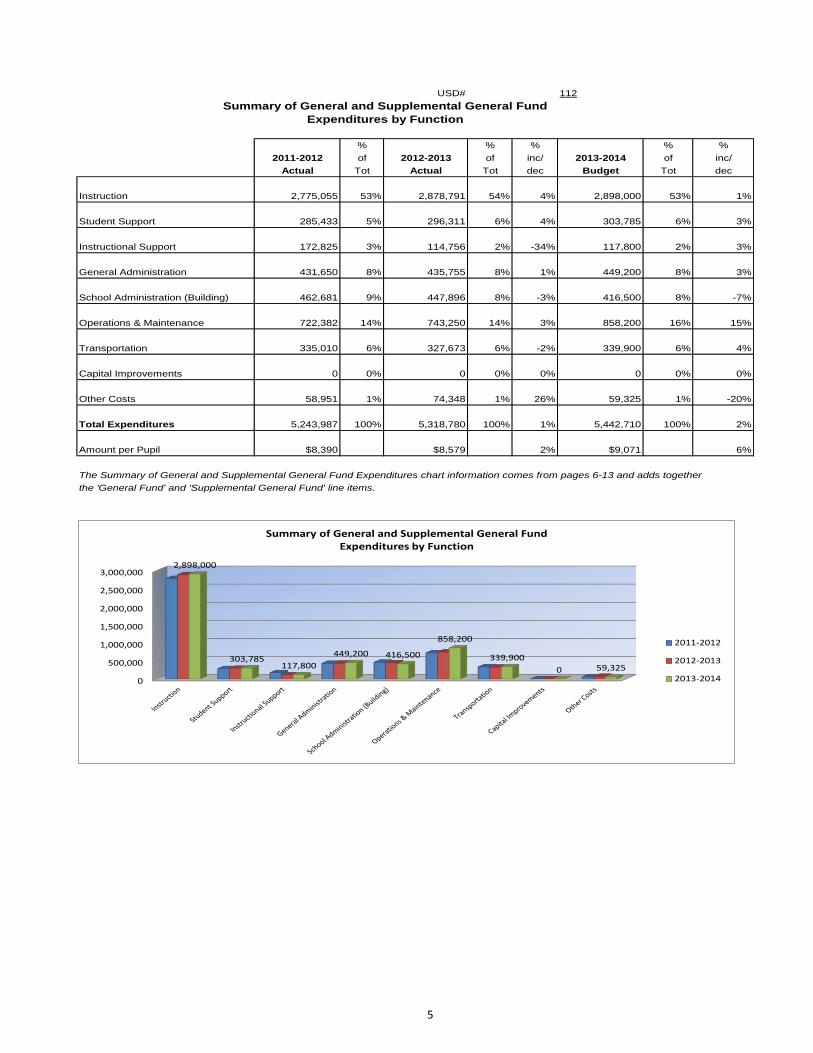
Summary of General and Supplemental General Fund
Expenditures by Function
% % % % %
2011-2012 of 2012-2013 of inc/ 2013-2014 of inc/
Actual Tot Actual Tot dec Budget Tot dec
Instruction 2,775,055 53% 2,878,791 54% 4% 2,898,000 53% 1%
Student Support 285,433 5% 296,311 6% 4% 303,785 6% 3%
Instructional Support 172,825 3% 114,756 2% -34% 117,800 2% 3%
General Administration 431,650 8% 435,755 8% 1% 449,200 8% 3%
School Administration (Building) 462,681 9% 447,896 8% -3% 416,500 8% -7%
Operations & Maintenance 722,382 14% 743,250 14% 3% 858,200 16% 15%
Transportation 335,010 6% 327,673 6% -2% 339,900 6% 4%
Capital Improvements 0 0% 0 0% 0% 0 0% 0%
Other Costs 58,951 1% 74,348 1% 26% 59,325 1% -20%
Total Expenditures 5,243,987 100% 5,318,780 100% 1% 5,442,710 100% 2%
Amount per Pupil $8,390 $8,579 2% $9,071 6%
The Summary of General and Supplemental General Fund Expenditures chart information comes from pages 6-13 and adds together
the 'General Fund' and 'Supplemental General Fund' line items.
0
500,000
1,000,000
1,500,000
2,000,000
2,500,000
3,000,0002,898,000
303,785117,800
449,200 416,500
858,200
339,900
0 59,325
Summary of General and Supplemental General FundExpenditures by Function
2011-2012
2012-2013
2013-2014
5
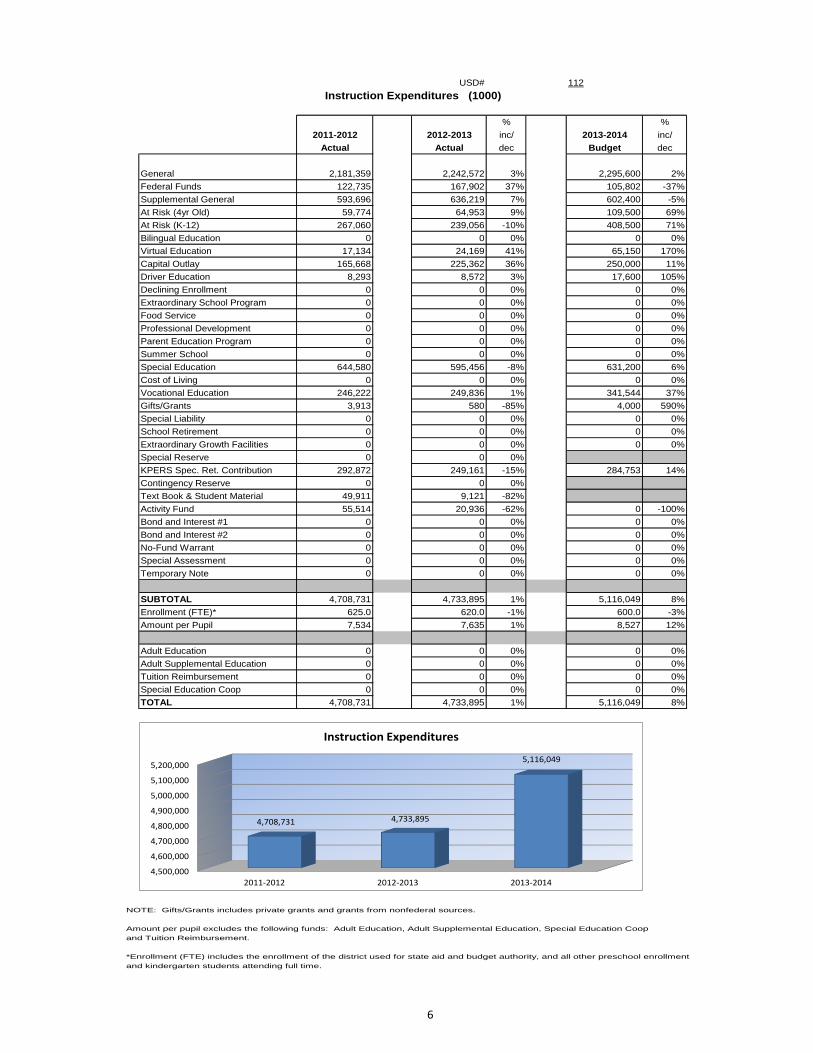
NOTE: Gifts/Grants includes private grants and grants from nonfederal sources.
Amount per pupil excludes the following funds: Adult Education, Adult Supplemental Education, Special Education Coop
and Tuition Reimbursement.
*Enrollment (FTE) includes the enrollment of the district used for state aid and budget authority, and all other preschool enrollment
and kindergarten students attending full time.
USD# 112
Instruction Expenditures (1000)
% %
2011-2012 2012-2013 inc/ 2013-2014 inc/
Actual Actual dec Budget dec
General 2,181,359 2,242,572 3% 2,295,600 2%
Federal Funds 122,735 167,902 37% 105,802 -37%
Supplemental General 593,696 636,219 7% 602,400 -5%
At Risk (4yr Old) 59,774 64,953 9% 109,500 69%
At Risk (K-12) 267,060 239,056 -10% 408,500 71%
Bilingual Education 0 0 0% 0 0%
Virtual Education 17,134 24,169 41% 65,150 170%
Capital Outlay 165,668 225,362 36% 250,000 11%
Driver Education 8,293 8,572 3% 17,600 105%
Declining Enrollment 0 0 0% 0 0%
Extraordinary School Program 0 0 0% 0 0%
Food Service 0 0 0% 0 0%
Professional Development 0 0 0% 0 0%
Parent Education Program 0 0 0% 0 0%
Summer School 0 0 0% 0 0%
Special Education 644,580 595,456 -8% 631,200 6%
Cost of Living 0 0 0% 0 0%
Vocational Education 246,222 249,836 1% 341,544 37%
Gifts/Grants 3,913 580 -85% 4,000 590%
Special Liability 0 0 0% 0 0%
School Retirement 0 0 0% 0 0%
Extraordinary Growth Facilities 0 0 0% 0 0%
Special Reserve 0 0 0%
KPERS Spec. Ret. Contribution 292,872 249,161 -15% 284,753 14%
Contingency Reserve 0 0 0%
Text Book & Student Material 49,911 9,121 -82%
Activity Fund 55,514 20,936 -62% 0 -100%
Bond and Interest #1 0 0 0% 0 0%
Bond and Interest #2 0 0 0% 0 0%
No-Fund Warrant 0 0 0% 0 0%
Special Assessment 0 0 0% 0 0%
Temporary Note 0 0 0% 0 0%
SUBTOTAL 4,708,731 4,733,895 1% 5,116,049 8%
Enrollment (FTE)* 625.0 620.0 -1% 600.0 -3%
Amount per Pupil 7,534 7,635 1% 8,527 12%
Adult Education 0 0 0% 0 0%
Adult Supplemental Education 0 0 0% 0 0%
Tuition Reimbursement 0 0 0% 0 0%
Special Education Coop 0 0 0% 0 0%
TOTAL 4,708,731 4,733,895 1% 5,116,049 8%
4,500,000
4,600,000
4,700,000
4,800,000
4,900,000
5,000,000
5,100,000
5,200,000
2011-2012 2012-2013 2013-2014
4,708,731 4,733,895
5,116,049
Instruction Expenditures
6
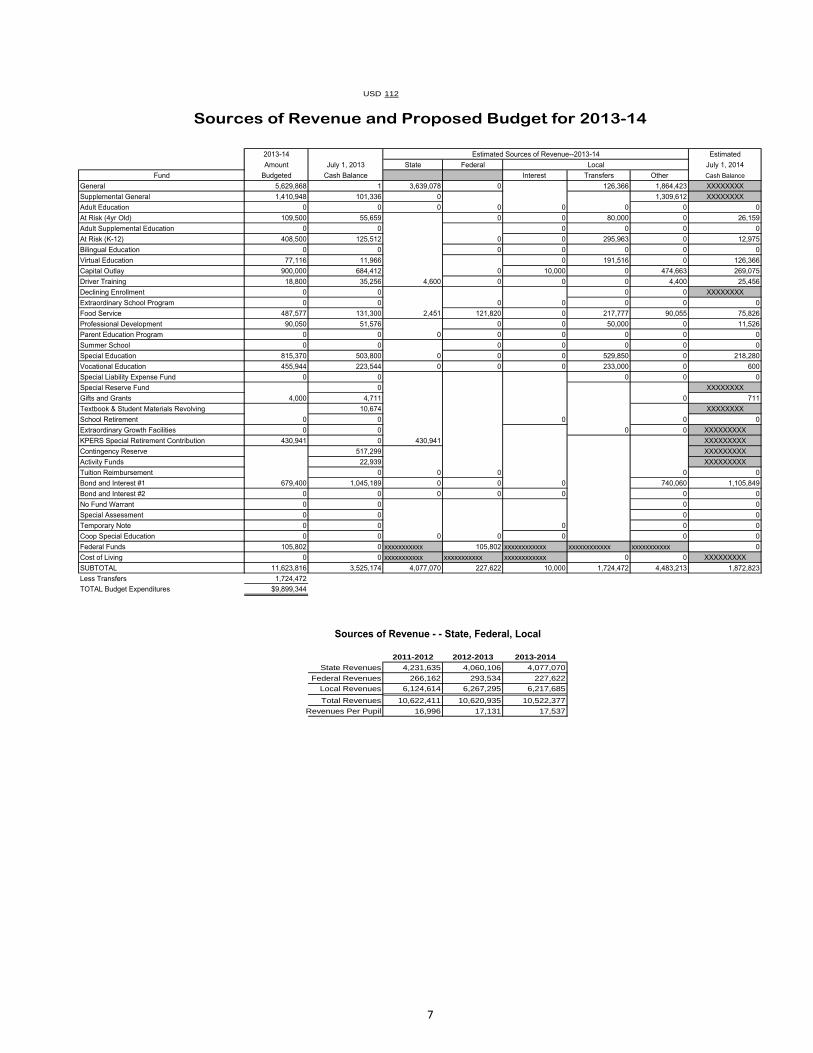
USD 112
2013-14 Estimated Sources of Revenue--2013-14 Estimated
Amount July 1, 2013 State Federal Local July 1, 2014
Fund Budgeted Cash Balance Interest Transfers Other Cash Balance
General 5,629,868 1 3,639,078 0 126,366 1,864,423 XXXXXXXX
Supplemental General 1,410,948 101,336 0 1,309,612 XXXXXXXX
Adult Education 0 0 0 0 0 0 0 0
At Risk (4yr Old) 109,500 55,659 0 0 80,000 0 26,159
Adult Supplemental Education 0 0 0 0 0 0
At Risk (K-12) 408,500 125,512 0 0 295,963 0 12,975
Bilingual Education 0 0 0 0 0 0 0
Virtual Education 77,116 11,966 0 191,516 0 126,366
Capital Outlay 900,000 684,412 0 10,000 0 474,663 269,075
Driver Training 18,800 35,256 4,600 0 0 0 4,400 25,456
Declining Enrollment 0 0 0 0 XXXXXXXX
Extraordinary School Program 0 0 0 0 0 0 0
Food Service 487,577 131,300 2,451 121,820 0 217,777 90,055 75,826
Professional Development 90,050 51,576 0 0 50,000 0 11,526
Parent Education Program 0 0 0 0 0 0 0 0
Summer School 0 0 0 0 0 0 0
Special Education 815,370 503,800 0 0 0 529,850 0 218,280
Vocational Education 455,944 223,544 0 0 0 233,000 0 600
Special Liability Expense Fund 0 0 0 0 0
Special Reserve Fund 0 XXXXXXXX
Gifts and Grants 4,000 4,711 0 711
Textbook & Student Materials Revolving 10,674 XXXXXXXX
School Retirement 0 0 0 0 0
Extraordinary Growth Facilities 0 0 0 0 XXXXXXXXX
KPERS Special Retirement Contribution 430,941 0 430,941 XXXXXXXXX
Contingency Reserve 517,299 XXXXXXXXX
Activity Funds 22,939 XXXXXXXXX
Tuition Reimbursement 0 0 0 0 0
Bond and Interest #1 679,400 1,045,189 0 0 0 740,060 1,105,849
Bond and Interest #2 0 0 0 0 0 0 0
No Fund Warrant 0 0 0 0
Special Assessment 0 0 0 0
Temporary Note 0 0 0 0 0
Coop Special Education 0 0 0 0 0 0 0
Federal Funds 105,802 0 xxxxxxxxxxx 105,802 xxxxxxxxxxxx xxxxxxxxxxxx xxxxxxxxxxx 0
Cost of Living 0 0 xxxxxxxxxxx xxxxxxxxxxx xxxxxxxxxxxx 0 0 XXXXXXXXX
SUBTOTAL 11,623,816 3,525,174 4,077,070 227,622 10,000 1,724,472 4,483,213 1,872,823
Less Transfers 1,724,472
TOTAL Budget Expenditures $9,899,344
2011-2012 2012-2013 2013-2014
State Revenues 4,231,635 4,060,106 4,077,070
Federal Revenues 266,162 293,534 227,622
Local Revenues 6,124,614 6,267,295 6,217,685
Total Revenues 10,622,411 10,620,935 10,522,377
Revenues Per Pupil 16,996 17,131 17,537
Sources of Revenue and Proposed Budget for 2013-14
Sources of Revenue - - State, Federal, Local
7
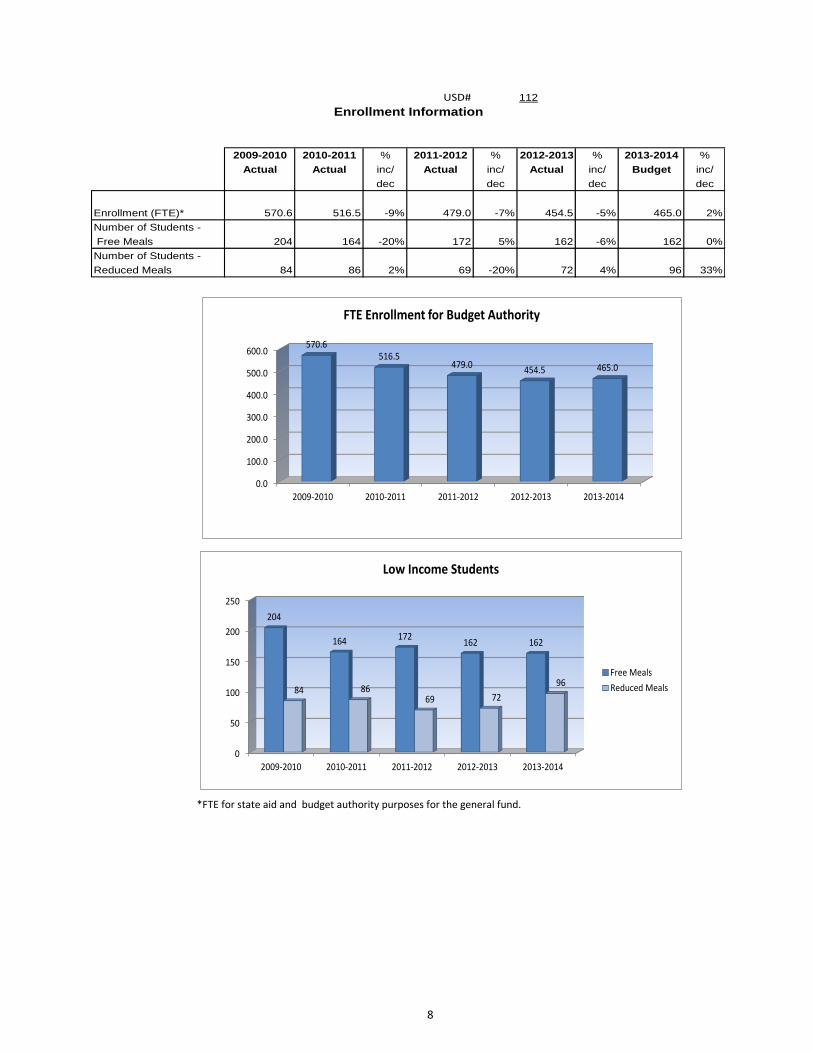
*FTE for state aid and budget authority purposes for the general fund.
0.0
100.0
200.0
300.0
400.0
500.0
600.0
2009-2010 2010-2011 2011-2012 2012-2013 2013-2014
570.6516.5
479.0454.5 465.0
FTE Enrollment for Budget Authority
0
50
100
150
200
250
2009-2010 2010-2011 2011-2012 2012-2013 2013-2014
204
164 172162 162
84 8669 72
96
Low Income Students
Free Meals
Reduced Meals
USD# 112
2009-2010 2010-2011 % 2011-2012 % 2012-2013 % 2013-2014 %
Actual Actual inc/ Actual inc/ Actual inc/ Budget inc/
dec dec dec dec
Enrollment (FTE)* 570.6 516.5 -9% 479.0 -7% 454.5 -5% 465.0 2%
Number of Students -
Free Meals 204 164 -20% 172 5% 162 -6% 162 0%
Number of Students -
Reduced Meals 84 86 2% 69 -20% 72 4% 96 33%
Enrollment Information
8
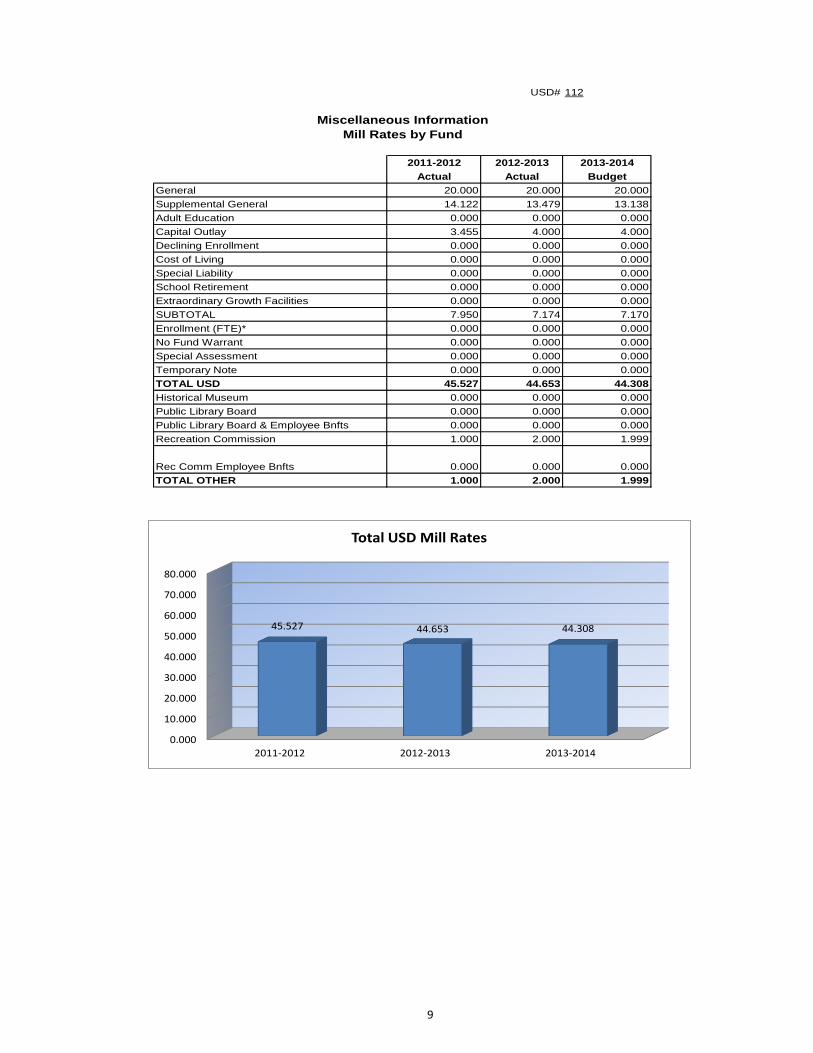
USD# 112
Miscellaneous Information
Mill Rates by Fund
2011-2012 2012-2013 2013-2014
Actual Actual Budget
General 20.000 20.000 20.000
Supplemental General 14.122 13.479 13.138
Adult Education 0.000 0.000 0.000
Capital Outlay 3.455 4.000 4.000
Declining Enrollment 0.000 0.000 0.000
Cost of Living 0.000 0.000 0.000
Special Liability 0.000 0.000 0.000
School Retirement 0.000 0.000 0.000
Extraordinary Growth Facilities 0.000 0.000 0.000
SUBTOTAL 7.950 7.174 7.170
Enrollment (FTE)* 0.000 0.000 0.000
No Fund Warrant 0.000 0.000 0.000
Special Assessment 0.000 0.000 0.000
Temporary Note 0.000 0.000 0.000
TOTAL USD 45.527 44.653 44.308
Historical Museum 0.000 0.000 0.000
Public Library Board 0.000 0.000 0.000
Public Library Board & Employee Bnfts 0.000 0.000 0.000
Recreation Commission 1.000 2.000 1.999
Rec Comm Employee Bnfts 0.000 0.000 0.000
TOTAL OTHER 1.000 2.000 1.999
0.000
10.000
20.000
30.000
40.000
50.000
60.000
70.000
80.000
2011-2012 2012-2013 2013-2014
45.527 44.653 44.308
Total USD Mill Rates
9
USD# 112
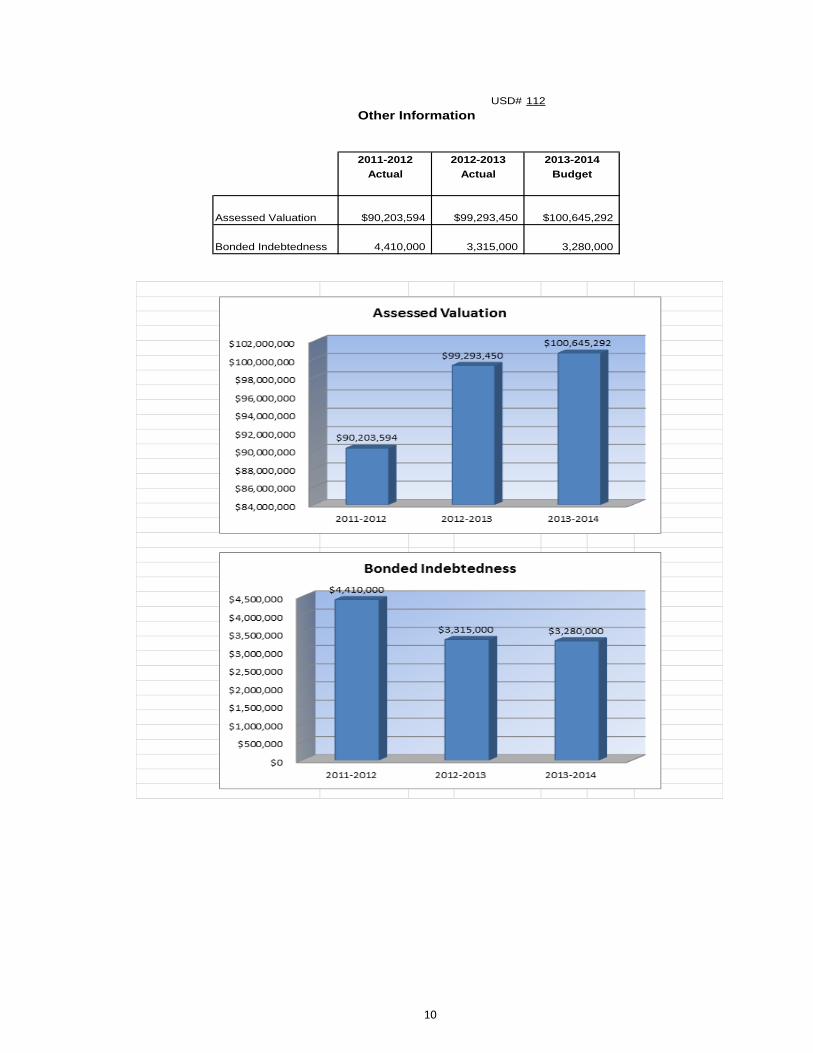
Other Information
2011-2012 2012-2013 2013-2014
Actual Actual Budget
Assessed Valuation $90,203,594 $99,293,450 $100,645,292
Bonded Indebtedness 4,410,000 3,315,000 3,280,000
10
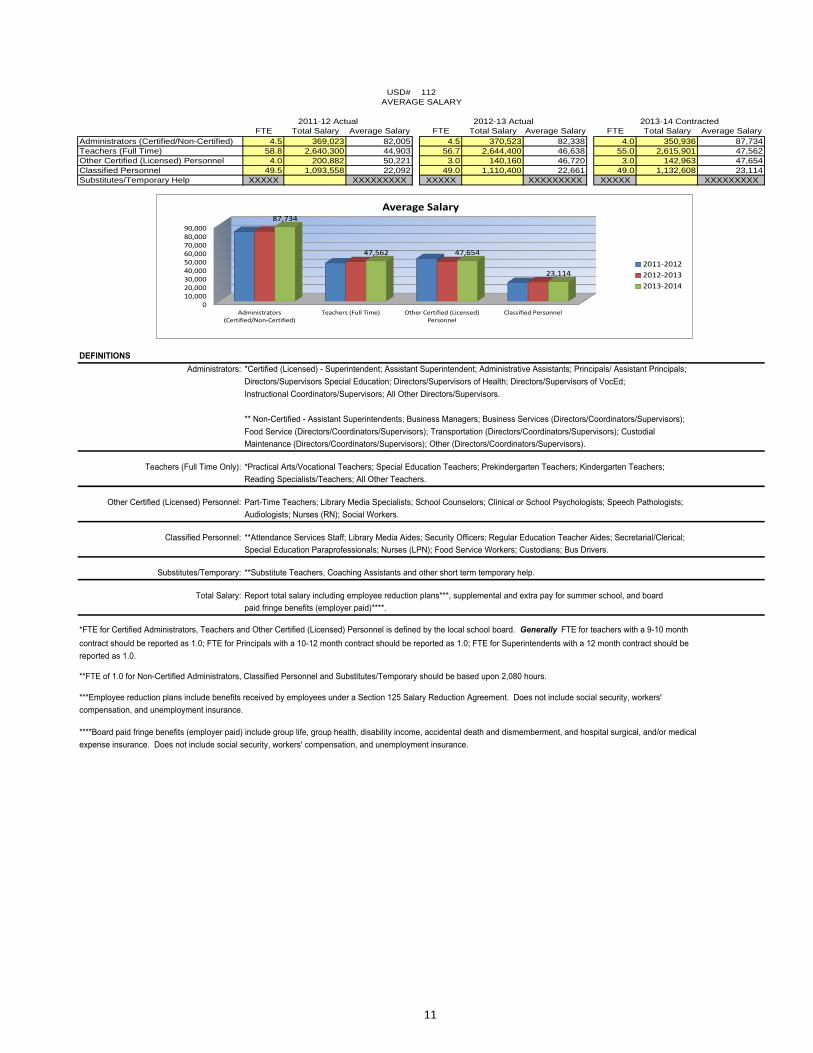
USD# 112
FTE Total Salary Average Salary FTE Total Salary Average Salary FTE Total Salary Average Salary
Administrators (Certified/Non-Certified) 4.5 369,023 82,005 4.5 370,523 82,338 4.0 350,936 87,734
Teachers (Full Time) 58.8 2,640,300 44,903 56.7 2,644,400 46,638 55.0 2,615,901 47,562
Other Certified (Licensed) Personnel 4.0 200,882 50,221 3.0 140,160 46,720 3.0 142,963 47,654
Classified Personnel 49.5 1,093,558 22,092 49.0 1,110,400 22,661 49.0 1,132,608 23,114
Substitutes/Temporary Help XXXXX XXXXXXXXX XXXXX XXXXXXXXX XXXXX XXXXXXXXX
DEFINITIONS
Administrators: *Certified (Licensed) - Superintendent; Assistant Superintendent; Administrative Assistants; Principals/ Assistant Principals;
Directors/Supervisors Special Education; Directors/Supervisors of Health; Directors/Supervisors of VocEd;
Instructional Coordinators/Supervisors; All Other Directors/Supervisors.
** Non-Certified - Assistant Superintendents; Business Managers; Business Services (Directors/Coordinators/Supervisors);
Food Service (Directors/Coordinators/Supervisors); Transportation (Directors/Coordinators/Supervisors); Custodial
Maintenance (Directors/Coordinators/Supervisors); Other (Directors/Coordinators/Supervisors).
Teachers (Full Time Only): *Practical Arts/Vocational Teachers; Special Education Teachers; Prekindergarten Teachers; Kindergarten Teachers;
Reading Specialists/Teachers; All Other Teachers.
Other Certified (Licensed) Personnel: Part-Time Teachers; Library Media Specialists; School Counselors; Clinical or School Psychologists; Speech Pathologists;
Audiologists; Nurses (RN); Social Workers.
Classified Personnel: **Attendance Services Staff; Library Media Aides; Security Officers; Regular Education Teacher Aides; Secretarial/Clerical;
Special Education Paraprofessionals; Nurses (LPN); Food Service Workers; Custodians; Bus Drivers.
Substitutes/Temporary: **Substitute Teachers, Coaching Assistants and other short term temporary help.
Total Salary: Report total salary including employee reduction plans***, supplemental and extra pay for summer school, and board
paid fringe benefits (employer paid)****.
*FTE for Certified Administrators, Teachers and Other Certified (Licensed) Personnel is defined by the local school board. Generally FTE for teachers with a 9-10 month
contract should be reported as 1.0; FTE for Principals with a 10-12 month contract should be reported as 1.0; FTE for Superintendents with a 12 month contract should be
reported as 1.0.
**FTE of 1.0 for Non-Certified Administrators, Classified Personnel and Substitutes/Temporary should be based upon 2,080 hours.
***Employee reduction plans include benefits received by employees under a Section 125 Salary Reduction Agreement. Does not include social security, workers'
compensation, and unemployment insurance.
****Board paid fringe benefits (employer paid) include group life, group health, disability income, accidental death and dismemberment, and hospital surgical, and/or medical
expense insurance. Does not include social security, workers' compensation, and unemployment insurance.
AVERAGE SALARY
2011-12 Actual 2012-13 Actual 2013-14 Contracted
010,00020,00030,00040,00050,00060,00070,00080,00090,000
Administrators(Certified/Non-Certified)
Teachers (Full Time) Other Certified (Licensed)Personnel
Classified Personnel
87,734
47,562 47,654
23,114
Average Salary
2011-2012
2012-2013
2013-2014
11
KSDE Website Information Available
K-12 Statistics (Building, District or State Totals)
http://svapp15586.ksde.org/k12/k12.aspx
• Attendance / Enrollment Reports
• Staff Reports
• Graduates / Dropouts Reports
• Crime / Violence Reports
School Finance Reports and Publications
• Certified Personnel
• Enrollment
• Dropouts
• Graduates
• Salary Reports
Kansas Building Report Card
• Attendance Rate
• Graduation Rate
• Dropout Rate
• School Violence
• Assessments
• Reading
• Mathematics
• Writing
• Graduates Passing Adv. Science Courses
• Graduates Passing Adv. Math Courses
http://www.ksde.org/Default.aspx?tabid=1870
http://svapp15586.ksde.org/rcard/
12