Embed Size (px)
Citation preview
Central Plains Water Annual Sustainability Report 2015
Central Plains Water Trust
Sustainability Report 2015-16

Central Plains Water Annual Sustainability Report 2015
� April 2017
Report prepared by
Liquid Earth Limited
145 Colombo Street
Christchurch 8841
Central Plains Water Trust
Annual Sustainability Report 2015-16

Table of Contents
Executive Summary ................................................................................................................................ 1
1. Scheme Background ....................................................................................................................... 3
1.1. History ..................................................................................................................................... 3
1.2. Scheme Development ............................................................................................................ 3
1.3. Water Sources ........................................................................................................................ 4
1.4. Regulatory Environment ......................................................................................................... 5
2. 2015/16 Annual Summary ............................................................................................................... 7
2.1. Climate .................................................................................................................................... 7
2.2. Construction Activities ............................................................................................................ 8
2.3. Scheme Operation .................................................................................................................. 8
3. On-Farm Monitoring ........................................................................................................................ 9
3.1. Environmental Management Strategy .................................................................................... 9
3.2. Irrigated Area and Types ...................................................................................................... 10
3.3. Land Use............................................................................................................................... 11
3.4. Irrigation Water Use .............................................................................................................. 12
3.5. Farm Environment Plans ...................................................................................................... 14
3.6. On-Farm Training ................................................................................................................. 14
4. Environmental Monitoring .............................................................................................................. 16
4.1. Environmental Baseline ........................................................................................................ 16
4.2. Environmental Monitoring ..................................................................................................... 17
4.3. Environmental Management ................................................................................................. 20
4.4. 2015-16 Monitoring Results .................................................................................................. 20
4.5. Environmental Mitigation and Enhancement ........................................................................ 21

Central Plains Water Limited Annual Sustainability Report 2015-16
1
Executive Summary
The Central Plains irrigation scheme (the Scheme) started operating in 2015, and by September
2018 will be supplying water to an area of approximately 47,000 hectares between the Waimakariri
and Rakaia Rivers.
Stage 1 of the Scheme was completed in September 2015, and provides irrigation water to an area
of approximately 23,000 hectares between the Rakaia and Selwyn rivers. Stage 1 incorporates a
17km long canal to supply water from the Rakaia River to 130km of underground pipes, which in
turn deliver water to 105 Scheme farms.
During the 2015-16 irrigation season, the Scheme supplied 91 million m3 of irrigation water to farms
in the Stage 1 area. To supply this water, 67 million m3 of water was taken from the Rakaia River
and 24 million m3 was stored water supplied by TrustPower from Lake Coleridge. This combination
of water supply provided 100% reliability to scheme farmers while having no effect on naturally
occurring discharge in the Rakaia River during periods of mid to low flows.
Development of the Scheme is integral to achieving outcomes set for the Selwyn Waihora Zone
under the Canterbury Water Management Strategy (CWMS). The Trustees have been advised that
concerning the leaching of nitrates and other pollutants into ground water, the Scheme will in time
have a positive effect, but that these will take a significant period of time to assess given that it its
likely to take approximately 30 years before water currently in the system is fully flushed away, and
approximately 70 years before the full effect of this occurs in Te Waihora.
Key Statistics for the 2015-16 Irrigation
Season
Total Volume of Water
Supplied91,092,984 m3
Volume of Direct Abstraction
from the Rakaia River
Volume of Water from
Storage
67,214,621 m3
23,878,363 m3
Number of days with no
restriction
Number of days with Partial
restriction
Number of days with full
restriction
Reliability of supply for water
users
152 days
84 days
18 days
100 %

Central Plains Water Limited Annual Sustainability Report 2015-16
2
The 2015-16 irrigation season was between 15 September 2015 to 16 April 2016, however full flow
of the Scheme water was not achieved until 1 January 2016. This report therefore does not cover a
full irrigation season, and the first full season will not occur until 2016-2017. During the 2015-16
part irrigation season, approximately 20% of total groundwater allocation held by farmers in
Scheme (approximately 19 Mm3) was permanently switched off. Of the remaining allocation,
approximately 60Mm3 (73%) remained unused.
The reduction in groundwater use is expected to increase over the next 3 to 5 years as the Scheme
develops, resulting in positive environmental benefits in terms of groundwater levels and flows in
lowland streams. The Trustees have been advised that when the full Scheme is in operation,
approximately half of the water currently taken from ground water sources will be replaced with
clean alpine surface water delivered by the Scheme.

Central Plains Water Limited Annual Sustainability Report 2015-16
3
1. Scheme Background 1.1. History
The Central Plains Water Trust (CPWT) was established jointly in 2003 by Christchurch City
Council (CCC) and Selwyn District Council (SDC) to implement the Central Plains Water
Enhancement Scheme (the Scheme) which would supply irrigation water to an area of up to 60,000
hectares between the Waimakariri and Rakaia Rivers.
In July 2012, the CPWT was granted resource consents from Environment Canterbury (ECan) and
SDC to take and use water for irrigation purposes as well as to construct and operate the Scheme.
Central Plains Water Limited (CPWL) was subsequently established to implement the Scheme, and
CPWT has licensed the use of the consents to CPWL. CPWL is responsible for constructing and
operating the Scheme, and for all consent compliance and reporting. For the purposes of this
document, CPWT and CPWL are referred to collectively as CPW.
1.2. Scheme Development
As illustrated on Figure 1, construction of the Scheme will occur in three stages. Stage 1 provides
irrigation water to an area of approximately 23,000 hectares between the Rakaia and Selwyn
rivers. Stage 2 supplies an irrigable area of approximately 20,000 hectares between the Selwyn
and Waimakariri rivers. Water for farms within the Stage 1 and Stage 2 areas will be supplied from
the Rakaia River via a 17km headrace that extends from the river intake as far as Leeches Road.
Stage 2 will be a fully piped network requiring no extension of the headrace. The Sheffield scheme,
comprising approximately 4,000 Ha, is physically disconnected from Stages 1 and 2 and will be
supplied utilising water from the Waimakariri and Kowai Rivers.
Construction of the Rakaia River intake and distribution network for Stage 1 was undertaken
between early 2014 and mid-2015, with the first irrigation water supplied on 1 September 2015.
These works required excavation of over 3.3 million cubic metres of material as well as the laying
of 560,000 m2 of HDPE liner and 815,000 m2 of geotextile fabric. Construction also involved
thirteen bridges spanning up to 28 metres (ten on-farm bridges and three public road bridges), 4
main offtake structures, and 8 smaller offtakes for individual farms adjacent to the canal.
During the early part of 2016 CPWL tendered the construction of Stage 2, and toward the end of
December 2016, secured funding for construction. CPW are now working toward a programme of
commencing Stage 2 construction in January 2017 with a target operational date of 1 September
2018. Construction of the Sheffield Scheme commenced in December 2016 with a target
operational date of 1 October 2017.

Central Plains Water Limited Annual Sustainability Report 2015-16
4
Figure 1. Layout of the CPW scheme
1.3. Water Sources
As described above, Stage 1 and Stage 2 of the Scheme derive water from the Rakaia River via an
intake constructed approximately 8 kilometres downstream of the Rakaia Gorge bridge.
Conditions of resource consents authorising the taking of water from the river are subject to
minimum flow conditions which require the rate of abstraction to progressively reduce as river flows
decline. Figure 2 illustrates the controls governing abstraction of water from the Rakaia River
under the Rakaia River Water Conservation Order (WCO). The WCO establishes a minimum flow
at Rakaia Gorge which varies depending on the month between 90 cubic metres per second
(cumecs) in September and 139 cumecs in December.
When flows are below the minimum flow, no water can be taken from the river. When flows are
higher than the minimum flow, water can be taken from the river by resource consents assigned to
5 allocation ‘Bands’ on a 1:1 basis. Under these allocation bands for every 2 cumecs of flow above
the minimum, 1 cumec can be taken from the river. Minimum flows increase from Band 1 to Band
5, decreasing the period of time water can be taken.

Central Plains Water Limited Annual Sustainability Report 2015-16
5
Figure 2. Schematic illustration of water allocation from the Rakaia River
The bulk of allocation held by CPW is assigned to Band 5. This band has the lowest reliability (i.e. it
is cut-off first as river flows fall) and allows water to be taken when flows are between 70 and 140
cumecs higher than the WCO minimum flow (so the full allocation of 70 cumecs can only be taken
when flows are at least 140 cumecs higher than the minimum flow). As a result, the full volume of
water allowed by the CPW consents can only be abstracted from the river around 63 percent of the
time (on average) during the irrigation season.
Irrigation requires a reliable supply of water during the growing season. Due to the frequency of
abstraction being cut-off, the original Scheme included provision for a large water storage dam in
the Waianiwaniwa valley. During consent hearings CPW withdrew the applications for construction
of this water storage and have subsequently entered into an agreement with TrustPower Ltd to
access water stored in Lake Coleridge. Under this agreement, water is released from Lake
Coleridge as river flows decline. This enables CPW to continue to take water from the river without
having any adverse effect on natural flows in the river. The use of stored water increases the
reliability of supply for Stage 1 and 2 to approximately 98 percent.
The Sheffield Scheme draws water from separate intakes from the Kowhai and Waimakariri Rivers
which are subject to similar low flow restrictions to the Rakaia River. In order to provide sufficient
water for reliable irrigation, a separate storage pond will be constructed for this scheme. Consents
for this storage pond were granted by ECan and SDC in 2016.
1.4. Regulatory Environment
The Canterbury Water Management Strategy (CWMS) is the outcome of an extensive process
undertaken by ECan to establish integrated water resource management involving collaborative
input from the community and stakeholder groups.
Under the CWMS the Canterbury Region is divided into nine geographic zones. Each zone is
overseen by a Zone Committee comprising community representatives. The Zone Committee is
responsible for developing strategies, targets and activities outlined in a Zone Implementation Plan
(ZIP) that outlines recommendations for short and long-term water management in each Zone.

Central Plains Water Limited Annual Sustainability Report 2015-16
6
The CPW scheme is located in the Selwyn Waihora Zone and forms an integral part of measures
outlined in the ZIP (also referred to as the “Solutions Package”) for this catchment adopted by the
Selwyn Waihora Zone Committee in October 2013. These measures anticipate that the Scheme
will provide additional recharge to the catchment from alpine rivers and reduce the volume of
groundwater used for irrigation. This is expected to result in increased volumes of water in aquifers
and flows in lowland streams, as well as dilution of nitrogen concentrations in Te Waihora (Lake
Ellesmere), thereby improving water quality and quantity across the wider Zone.
Recommendations in the Selwyn Waihora Solutions Package were formally adopted by ECan via
Variation 1 to the Land and Water Regional Plan (LWRP). This plan specifies objectives, policies
and rules for water and land management across the Canterbury Region. Updated provisions for
the Selwyn Waihora zone in the LWRP include:
• Prohibiting new takes in over-allocated water management zones and reducing the total
volume of water allocated within the zone;
• Revised surface water allocation limits to deliver ecological and cultural flows, particularly
in lowland streams;
• Introduction of a fixed allocation or “cap” on nitrogen losses in the catchment (including the
CPW scheme). Progressive reductions in cumulative nitrogen losses are required over
time;
• A requirement for all farming properties to prepare a farm environment plan (FEP) and
implement a range of good management practices;
• A reduction in legacy phosphorus in Te Waihora/Lake Ellesmere by 50 percent and
improved management of lake-level and opening.

Central Plains Water Limited Annual Sustainability Report 2015-16
7
2. 2015/16 Annual Summary 2.1. Climate
Between 1 July 2015 and 30 June 2016 653 mm of rainfall was recorded at NIWA weather station
4702 located about 4km west of Hororata. As illustrated on Figure 3, cumulative rainfall over this
12-month period was the 22nd lowest since records began in 1890, and the 3rd driest over the past
30 years (i.e. since 1985/86).
Figure 3. Historical Rainfall at Hororata, 1890-91 to 2015/16
Figure 4 shows a plot of rainfall and calculated soil moisture deficit generated from NIWA’s weather
station at Hororata (4702) for the 2015-16 irrigation season. These data indicate soil moisture
conditions can be classified as being severely dry for 76 days and extremely dry for eight days
during the 2015-16 irrigation season.
Overall, the 2015-16 irrigation season can be characterised as being dry to very dry across the
Central Plains area.
0
200
400
600
800
1000
1200
1890/91
1895/96
1900/01
1905/06
1910/11
1915/16
1920/21
1925/26
1930/31
1935/36
1940/41
1945/46
1950/51
1955/56
1960/61
1965/66
1970/71
1975/76
1980/81
1985/86
1990/91
1995/96
2000/01
2005/06
2010/11
2015/16
Ra
infa
ll (
mm
)

Central Plains Water Limited Annual Sustainability Report 2015-16
8
Figure 4. Rainfall and Soil Moisture at Hororata, 2015-16
2.2. Construction Activities
No construction activities were undertaken during the 2015-16 year.
2.3. Scheme Operation
Between 1 September 2015 and mid-May 2016 a total of 91,092,984 m3 of water was supplied by
the CPW scheme to 105 properties. This total comprised 67,214,621 m3 of run of river water from
the Rakaia River, with an additional 23,878,363 m3 (representing 26% of total volume supplied) of
stored water sourced from Lake Coleridge.
Over the course of the 2015-16 irrigation season, taking of run-of-river water from the Rakaia River
operated under no restriction for 152 days, partial restriction for 84 days, and full restriction for 18
days. With the use of stored water, water users were able to have full (100 percent) reliability of
supply for the 2015-16 season.

Central Plains Water Limited Annual Sustainability Report 2015-16
9
3. On-Farm Monitoring
Conditions of the CPW consents and provisions of the Land and Water Regional Plan require both
CPW and individual shareholder farmers to undertake an extensive range of environmental
monitoring, management and reporting activities.
3.1. Environmental Management Strategy
CPW have developed an Environmental Management Strategy (EMS) which establishes a range of
protocols, policies and procedures for operation and management of the Scheme to ensure it
achieves high environmental standards and sustainable outcomes and complies with all consent
and Regional Plan requirements.
The EMS outlines specific responsibilities for operation of the Scheme including:
• Ensuring that all water users implement on-farm environmental management requirements
related to achieving sustainable irrigation;
• Monitoring and reporting of environmental performance;
• Provision of education and training initiatives; and
• Funding and management of environmental initiatives, including those required by
resource consent conditions, such as Community Liaison Group (CLG), the CPW
Environmental Management Fund (EMF) and CPW Te Waihora Environmental
Management Fund (TWEMF)
To assist application of the EMS at an individual farm-scale, CPW requires water users to develop
and implement a Farm Environment Plan (FEP) which focusses on active management to ensure
all on-farm activities are undertaken with a high standard of environmental care. A FEP is required
to be developed and implemented on each CPW shareholder property supplied with water. Key
components of the FEPs include:
• Identification of environmental risks and potential adverse impacts associated with farming
activities
• Development and implementation of measures to avoid or minimise identified
environmental risks and implement good management practice farming methods
• Development and implementation of monitoring to inform good decision making on-farm
• Calculation and recording of nutrient loss rates and documentation of management
practices to maintain, and where required, reduce, losses over time
All FEPs will be audited by a qualified Farm Environment Plan Auditor on an annual basis to
provide an independent check that appropriate systems and practices are in place to minimise
environmental risks associated with agricultural land use within the scheme. Auditing is conducted
on-farm and is based on sighting of evidence to document and support how FEP objectives and
targets are being met. FEP audit results are reported to CPW, individual water users, and to ECan.

Central Plains Water Limited Annual Sustainability Report 2015-16
10
3.2. Irrigated Area and Types
Use of water under the Scheme is limited by resource consent conditions to a designated area of
60,000 hectares, within a command area of 100,000 hectares. Figure 5 below shows the irrigated
area and irrigation types for Stage 1 of the Scheme. Note that this plan shows the area covered by
CPW FEPs (26,647 ha) which is slightly larger than the Stage 1 water supply area (23,656 ha) as it
includes shareholder properties that are irrigated to varying extents using existing groundwater
consents.
Figure 5. Irrigated area and irrigation types for CPW Stage 1, 2015-16
The breakdown of irrigation system type within Stage 1 is shown in Figure 6 below. A majority of
land is irrigated using either centre pivot irrigators (74 percent of total irrigated area) or travelling
irrigators (21 percent of total irrigated area). It is noted a majority of travelling irrigators are used on
properties which were irrigated prior to CPW, while new irrigation development predominantly
utilises centre pivot irrigators.

Central Plains Water Limited Annual Sustainability Report 2015-16
11
Figure 6. Irrigation type in the CPW stage 1 area, 2015-16
In terms of irrigation management, during the 2015-16 irrigation season 61 percent of properties
within the Stage 1 area utilised soil moisture monitoring (using tapes or probes) to assist with
decision making regarding when to irrigate their farms, while the balance utilise some other form of
decision making tool. CPW is providing guidance to farmers regarding methods to assist with
measuring and managing soil moisture levels on their farms.
3.3. Land Use
In the Stage 1 area, a total of 23,565Ha (based on Nutrient Budgets) was irrigated using CPW
water1 during the 2015-16 season. This area comprises 16,784 Ha of existing irrigated land
(irrigated by a combination of CPWL water and groundwater), 906 ha of land irrigated using
existing groundwater consents and 6,781Ha of newly irrigated land (using CPW water only).
Figure 7 illustrates the split between existing and new irrigation in the Stage 1 area during 2015-16.
1 Note: this figure includes irrigation systems that use Groundwater and CPWL water

Central Plains Water Limited Annual Sustainability Report 2015-16
12
Figure 7. Breakdown of new and existing irrigation in the CPW Stage 1 area 2015-16
Error! Reference source not found. shows a breakdown of land use types in the CPW Stage 1
area during 2015-16 based on the categories defined in the OVERSEER nutrient budget model.
The data show that dairy and various combinations of dairy and beef grazing accounted for a
significant component of overall land use in the CPW Stage 1 area during 2015-16.
In terms of general land use types, it is noted that CPWL undertook a study of 40 farms across the In terms of general land use types, it is noted that CPWL undertook a study of 40 farms across the
Scheme area in 2014. Of these, 20 farms were existing dryland and 20 were irrigated via
groundwater. From a land use perspective, a key finding was that there are generally two farm
systems within the Scheme area: dairy, and a mixed system comprising a range of land use types.
The study indicated new irrigators in Stage 1 who have not converted to dairy typically favour a
mixed farming system which enables them to farm to market demand without the higher capital
investment required to establish a dairy operation.
3.4. Irrigation Water Use
The Scheme wide average application rate during the 1 September 2015 to 30th April 2016 was
2.81mm/ha over the irrigation season. No irrigator exceeded 5.18mm/ha based on their CPW take
only, however it is not always clear from the data available if all farms complied with limits relating
to maximum combined application rates (from CPWL and existing groundwater consents). In order
to provide improved information on irrigation application rates, CPW is in the process of developing
a methodology to more reliably determine compliance with combined volume limits as part of the
farm audit programme commencing in September 2016.
3.4.1. Groundwater Conversion to CPWL Scheme
One of the key benefits associated with the CPW scheme identified in the Selwyn Waihora zone
Solutions Package is a reduction in the volume of groundwater utilised for irrigation across the
Central Plains area, due to substitution with water derived from the Rakaia, Waimakariri and Kowai
Rivers (run-of-river and storage). The reduction in groundwater abstraction is expected to result in

Central Plains Water Limited Annual Sustainability Report 2015-16
13
positive benefits associated with an increase in groundwater storage and correspondingly higher
flows in lowland streams.
Within Stage 1 of the Scheme there are a total of 152 consented groundwater bores on 54
properties (an average of three per property). These groundwater bores have resource consents
authorising abstraction of a total annual volume of up to 97,207,658 cubic metres (97.2Mm3).
Information collected by CPW indicates that 30 of these bores, associated with a volume of
approximately 19Mm3, were not utilised at all during the 2015-16 year. Furthermore, abstraction
from 5 bores was reduced to stockwater use only, while use of a number of other bores was
discontinued during the year as management and configuration of irrigation infrastructure was
modified to utilise water from the Scheme.
Across the remaining groundwater consents it is clear that many of the remaining groundwater
consents were only partially utilised during the 2015-16 year. Water usage records indicate
abstraction of only approximately 21Mm3, equivalent to around 27 percent of total allocation for
these consents. This means that approximately 76Mm3 of allocated groundwater was not taken
during the 2015-16 irrigation season. Figure 8 illustrates the volume of groundwater usage
recorded during the 2015-16 year.
Figure 8. Groundwater usage by resource consents within the CPW Stage 1 area, 2015-16
Overall, during its first year of operation, nearly 19Mm3 of allocated groundwater was switched off,
and some Stage 1 shareholders have surrendered their consents to take groundwater for irrigation.
The actual reduction in usage is likely to be significantly higher than this figure, and CPW anticipate
that shareholder reliance on groundwater for irrigation will reduce further as Scheme develops and
shareholders become accustomed to the new operating systems. More accurate estimates of the
reduction in groundwater usage will be provided in future years, once modifications to on-farm

Central Plains Water Limited Annual Sustainability Report 2015-16
14
irrigation practice become established and more extensive monitoring information becomes
available.
3.5. Farm Environment Plans
A FEP is the key environmental management tool that helps farmers recognise on-farm
environmental risks and sets out a programme to manage those risks. FEPs are unique to a
property and reflect the type of farm operation, the local climate and soil type, and the goals of the
land user.
The Farm Environment Plan covers management areas such as:
• Irrigation Management, including efficient water use
• Nutrient Management
• Soil Management
• Environmental Hotspots Management (Offal, rubbish & silage pits)
• Collected Animal Effluent Management
• Livestock, Waterways & Riparian Management
• Biodiversity and Ecosystem Management
CPW irrigators were required to have a FEP in place before they were able to take water from the Scheme.
3.5.1. Stage 1 FEP Compliance Status
At the commencement of the first irrigation season for Stage 1, a total of 101 FEPs were in place
out of the 105 properties within the Stage 1 area, with four remaining outstanding. Irrigation water
was not provided to farms without an FEP in place. By the end of the 2015-16 season only two
FEPs were outstanding and these were from dryland farms that had not finished implementing their
on-farm irrigation infrastructure.
FEPs for the 105 farms within the CPW Stage 1 area relate to a total land area of 26,477 effective
hectares. The Scheme supplies CPW water to a total of 23,128 hectares of this total area, the
balance being non-CPW irrigated land and dryland that is included within Scheme FEP’s.
3.5.2. Nutrient Budgets and Nitrogen Allocation
While FEP’s were completed prior to the start of the irrigation season, nutrient budgets were not.
CPW has been working with farmers within the Stage 1 area to ensure nutrient budgets are
approved and the respective Nitrogen allocations will be made prior to the start of the 2016-17
irrigation season.
3.6. On-Farm Training
CPW irrigators are required to have a FEP in place before they are able to take water from the
scheme. To ensure all shareholders were in a position to receive scheme water at the
commencement of the 2015-16 season CPW embarked on a process to educate/inform
shareholders within the Stage 1 area of their requirements to develop and implement FEPs to

Central Plains Water Limited Annual Sustainability Report 2015-16
15
ensure they could use scheme water during early 2015. This process was rolled out initially via a
series of workshops in March 2015. CPW staff then carried out one-on-one meetings with farmers
to;
• ensure they all had been adequately informed on what is required for their FEPs
• provide a series of maps (consents, soil type, water ways, significant sites etc.) that could
be included in FEPs
• collect information to pre-populate the FEP templates that their respective Farm
consultants would use in preparation of the FEPs
As part of ongoing assistance for shareholders CPW are looking to offer training on methods
available to farmers to assist with managing soil moisture levels on their farms.

Central Plains Water Limited Annual Sustainability Report 2015-16
16
4. Environmental Monitoring
Requirements for monitoring of environmental effects resulting from operation of the Scheme are
specified in resource consent conditions for the take and use of water. Details of this monitoring
programme are outlined in a Ground and Surface Water Monitoring Plan (GSWMP) which consists
of two parts:
• Part I: an outline of the CPW monitoring programme (e.g. sites, parameters measured,
monitoring frequency etc.); and
• Part II: specification of trigger levels for the monitoring programme along with procedures
to be followed in the advent that trigger levels are exceeded.
Results and interpretation of environmental monitoring undertaken for the Scheme are provided in
the Annual Ground and Surface Water Monitoring Report which forms one component of the
overall resource consent compliance monitoring for the CPW scheme.
Development of the GSWMP and the subsequent monitoring process is overseen by the Ground
and Surface Water Expert Review Panel (GSWERP) which was established in 2013. This panel is
responsible for overseeing and directing the ground and surface water monitoring program
undertaken by CPW, as well as the response to trigger level exceedances and/or public
complaints. As required by CPW’s consents, GSWERP members include representatives form
SDC, ECan and Ngai Tahu alongside independent experts with knowledge and skills relating to
ground and surface water quality and quantity, land drainage and cultural values.
4.1. Environmental Baseline
Development of the Scheme is anticipated to result in significant changes to existing land use,
recharge and water abstraction patterns across the mid to upper sections of the Central Plains
area. These changes have the potential to alter the quantity and quality of water in receiving
environments (groundwater, rivers and streams, and Te Waihora/Lake Ellesmere). If not
appropriately managed, intensification of land use has the potential to increase groundwater
Nitrate-N concentrations to levels exceeding recommended health guidelines for safe drinking
water. In addition, given a significant portion of groundwater flowing through the Central Plains
aquifer system is ultimately discharged to lowland rivers and streams in the vicinity of Te
Waihora/Lake Ellesmere, changes to the quality and quantity of groundwater can also impact on
ecological and environmental values associated with these waterways as well as the lake itself.
Analysis of land use scenarios during the CWMS Selwyn Waihora Zone process indicated that
even if future land use were to remain unchanged (from 2011), groundwater nitrate concentrations
in the Central Plains area will continue to increase by approximately 30% over current levels over
the next 20 years. This is due to the lag effect between land use effects and the time taken to
observe changes in groundwater quality. As a consequence, consent conditions for the Scheme
require comparison of measured water quality against a ‘baseline’ that represents the likely state of
the environment in the absence of the Scheme. This baseline has to reflect the effects of both
historical land use as well as those resulting from land use external to the CPW scheme.
In terms of water quality, increased recharge from irrigation using water from alpine rivers, coupled
with a reduction in the volume of groundwater used for irrigation, are expected to result in an

Central Plains Water Limited Annual Sustainability Report 2015-16
17
overall increase in groundwater levels and flows in lowland streams. While such effects can have a
positive impact on environmental values associated with these waterways, increased groundwater
levels and stream flows can also result in negative impacts associated with land drainage and
higher water tables around the margins of Te Waihora/Lake Ellesmere.
4.2. Environmental Monitoring
Full details of the CPW environmental monitoring programme are contained in Part 1 of CPW’s
Ground and Surface Water Monitoring Plan (available at http://www.cpwl.co.nz/environmental-
management/ground-surface-water-monitoring-programme)
The monitoring programme consists of four components:
• 29 surface water quality monitoring sites (including sites
• 5 lake water quality monitoring sites (utilising data from the ECan water quality monitoring
network)
• 20 groundwater quality monitoring sites
• 12 groundwater level monitoring sites
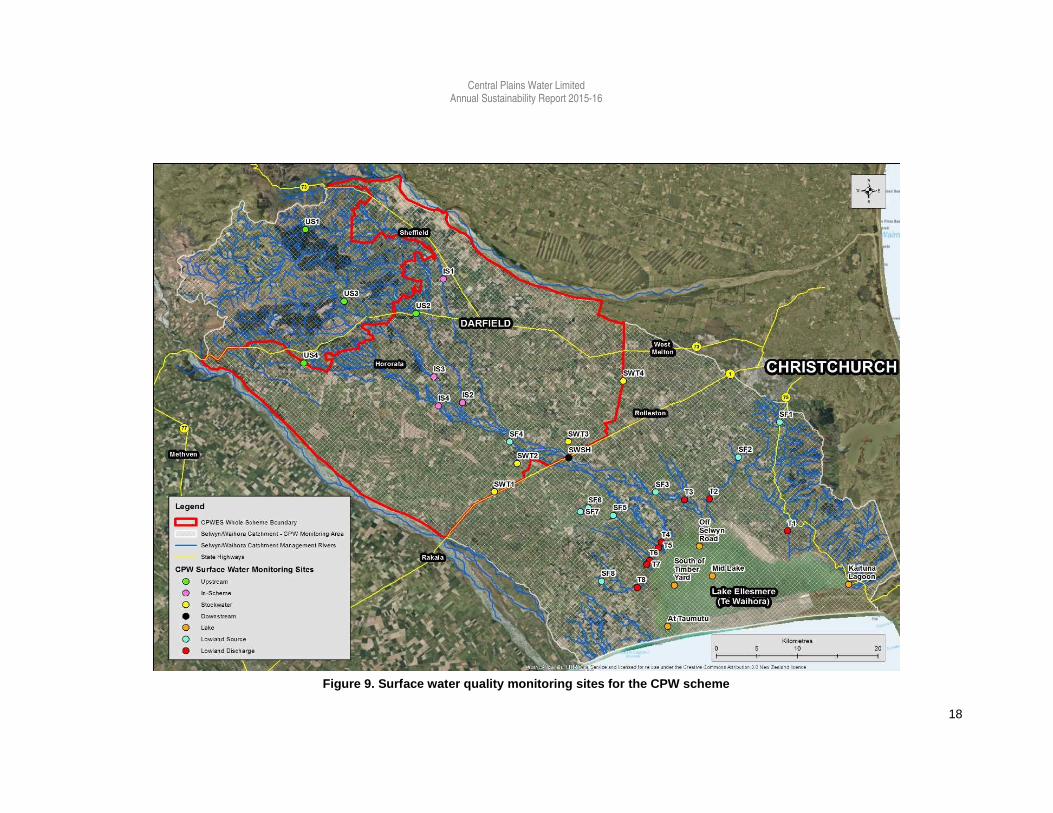
As illustrated on Figure 10, the surface water quality monitoring sites include:
• 4 sites upstream of the Scheme (US1 to US4)
• 4 sites within the Scheme area (IS1 to 4)
• 1 site on downstream boundary of the Scheme (SWSH)
• 8 sites in the headwaters of lowland streams (SF1 to SF6)
• 8 sites near the confluence of lowland stream and Te Waihora/Lake Ellesmere (T2 to T8)
• 4 sites in the SDC stockwater race system at the downstream boundary of the Scheme
The surface water quality sites are monitored on a monthly basis for a range of water quality
parameters including dissolved and particulate nutrients, indicator bacteria (E.Coli) and physical
parameters such as pH, temperature and dissolved oxygen concentrations.
The monitoring network also includes 5 sites located in Te Waihora/Lake Ellesmere, 4 around
the lake margins and one site in the middle of the lake. These sites are monitored on a monthly
basis by ECan for a range of parameters including total nutrients and Trophic Level Index (TLI3).
As shown on Figure 10, the CPW groundwater monitoring network comprises twenty water
quality sites (8 within the Stage 1 area, 10 in the Stage 2 area and 2 in the Sheffield scheme
area), as well as 12 lowland groundwater level sites downstream of the scheme area monitored
by ECan. Groundwater quality sites are sampled quarterly while water levels are monitored
monthly.
Central Plains Water Limited Annual Sustainability Report 2015-16
18
Figure 9. Surface water quality monitoring sites for the CPW scheme

Central Plains Water Limited Annual Sustainability Report 2015-16
19
Figure 10. Groundwater quality and level monitoring sites for the CPW scheme

Central Plains Water Limited Annual Sustainability Report 2015-16
20
4.3. Environmental Management
Part II of the CPW Ground and Surface Water Monitoring Plan establishes trigger levels for
nominated parameters including:
• Nitrate-Nitrogen concentrations at surface water sites
• Trophic Level Index (TLI3), Total Phosphorus and Chlorophyll-a at lake monitoring sites
• Nitrate-Nitrogen and E. Coli concentrations at groundwater monitoring sites
• High groundwater levels in lowland groundwater level monitoring sites
The nominated trigger levels were established based on relevant water quality standards
established in the LWRP or, in the case of groundwater levels, the range of historical
measurements. Once a nominated trigger level is exceeded, the GSWMP establishes a procedure
which must be followed to firstly identify if the monitoring results represents a departure from
‘background’ concentrations or levels and, if it does, steps which must be followed investigate and
mitigate the potential cause. This assessment and response process is overseen by the
GSWERP.
4.4. 2015-16 Monitoring Results
Results from the CPW environmental monitoring programme are summarised in the Annual
Ground and Surface Water Monitoring Report 2015/16.
Results of monitoring indicate that a total of seven surface water monitoring sites exceeded trigger
levels established for Nitrate-Nitrogen. All sites exceeding the trigger levels were located either
within areas of the Scheme which are yet to be developed, or in lowland streams around the
margins of Te Waihora/Lake Ellesmere where elevated nitrate concentration have been previously
observed. Sites exceeding the CPW surface water nitrate trigger levels therefore reflect
background nitrate concentrations caused by historical land use patterns, rather than effects
associated with development of the Scheme.
Similarly, Total Phosphorus concentrations exceeded the CPW trigger level at the Mid Lake
monitoring site. Again, this exceedance is consistent with historical monitoring results2 so is
interpreted to reflect the background water quality state of Te Waihora/Lake Ellesmere, rather than
effects resulting from the Scheme.
Due to the short monitoring record to date it is not possible to assess groundwater nitrate
concentrations in terms of the quality trigger levels established in the GSWMP. These trigger
levels are expressed in terms of a 5-year annual average Nitrate-Nitrogen concentration of 7.65
mg/L3, and the CPW monitoring has only been in place for approximately three years to date.
2 The measured Total Phosphorus concentration during 2015-16 is equivalent to, or slightly lower
than concentrations recorded over the preceding two years, prior to commencement of CPW operations.
3 The groundwater nitrate trigger level is adopted from the ECan Land and Water Regional Plan.
Central Plains Water Limited Annual Sustainability Report 2015-16
21
However, a number of monitoring bores both in the CPW Stage 1 and Stage 2 areas exhibit annual
median nitrate concentrations exceeding this figure reflecting the effects of land use prior to
commencement of Scheme operations. In addition, a number of other monitoring sites exhibit on
ongoing increase background nitrate concentrations which, if it continues, will exceed the 7.65
mg/L trigger level at some time in the future irrespective of Scheme development.
In terms of microbial contaminants, only one groundwater monitoring site showed positive detection
of indicator bacteria (E.Coli). This exceedance was limited to a single sample, with subsequent
samples from this site free from microbial contaminants, suggesting that the contamination
observed may have been related to a localised event and/or a sampling error.
Due to two consecutive years of low rainfall, groundwater levels were generally low to very low in
the Central Plains area throughout the 2015-16 year. As a result, no CPW high groundwater level
triggers were exceeded. It is however noted that groundwater levels in several bores within the
Stage 1 area of the CPW scheme recovered significantly during the 2015-16 year. This recovery
likely reflects the positive benefits of the Scheme associated with reduced groundwater abstraction
and introduction of alpine water from the Rakaia River.
The 2015-16 Annual Ground and Surface Water Monitoring Report 2015/16 produced by CPW was
approved by the GSWERP in October 2016 as providing a valid interpretation of monitoring results
for the 2015-16 year.
4.5. Environmental Mitigation and Enhancement
In addition to an extensive environmental monitoring programme, part of the mitigation package
offered by CPW during the resource consent Hearings process involves the establishment an
Environmental Management Fund (EMF) and a Te Waihora Environmental Management Fund
(TWEMF).
The EMF and TWEMF were established during the 2015-16 irrigation season. Contributions to
these funds are provide by Scheme Shareholders. Due to the staged nature of Scheme
development, annual contributions to these funds will increase as the area under irrigation
increases. An independent Environmental Management Fund Committee (EMFC) is responsible for
managing, and allocating distributions from the EMF which may be allocated to a range of
environmental initiatives within the Selwyn Waihora catchment. By contrast, the TWEMF fund is
provided directly to Ngai Tahu who manage allocation and annual reporting of fund expenditure.