Embed Size (px)
Citation preview

12
Condition Monitoring of Railway Track Using In-Service Vehicle
Hitoshi Tsunashima1, Yasukuni Naganuma2, Akira Matsumoto3, Takeshi Mizuma3 and Hirotaka Mori3
1Nihon University 2Central Japan Railway Company
3National Traffic Safety and Environment Laboratory Japan
1. Introduction
Condition monitoring of railway tracks, vehicles are essential in ensuring the safety of
railways (Goodall et al., 2006, Buruni et al., 2007). In the field of road traffic, research is
proceeding to acquire detailed traffic flow information and reflect it in traffic control by
using cars that are regarded as “probes” with an information-obtaining function and having
them transmit real-time traffic information such as traffic jams and travel times to traffic
control station.
Monitoring of such parameters are not necessary in railways that are operated according to
time tables. However, in-service vehicles equipped with simple sensors and GPS may serve
as probes to detect and analyze real-time vehicle vibration and signaling systems while
running. So called “probe vehicles” (see Fig. 1) (Kojima et al., 2005, 2006) may also
dramatically change the current style of rail maintenance and thus contribute to establishing
safe transport systems.
The probe vehicles can change the current maintenance style to focus on locations regarded
as essential maintenance areas, utilizing data acquired by real-time monitoring of actual
vibration together with positional information obtained by GPS. Monitoring based on
information obtained by in-service vehicles may enable the detection of maintenance
problem at an early stage (Hayashi et al., 2006), thus contributing to the revitalization of
local railways by making maintenance tasks more efficient.
The aim of this chapter is to summarize the track-condition-monitoring system based on vehicle measurements for conventional and high speed railway. Section 2 describes the track-condition-monitoring system for conventional railway. In this application, track irregularities are estimated from the vertical and lateral acceleration of the car body. The roll angle of the car body, calculated using a rate gyroscope, is used to distinguish line irregularities from level irregularities. Rail corrugation is detected from cabin noise with spectral peak calculation. A GPS system and a map-matching algorithm are used to pinpoint the location of faults on tracks. Field test using a in-service vehicle was carried out to
www.intechopen.com

Reliability and Safety in Railway
334
evaluate the developed system. In section 3, track-condition-monitoring system for high speed railway, shinkansen, called RAIDARSS 3 is introduced. Finally, conclusions are given in Section 4.
Sensors
Data base
Prove vehicle
Service vehicle
Prove vehicle
Signal processing GPS
Track circuit receiver
Data fusion
system
Microphone
Accelerometer
Track fault
ATS receiver
Sensors
Data base
Prove vehicle
Service vehicle
Prove vehicle
Sensors
Data base
Prove vehicle
Service vehicle
Prove vehicle
Signal processing GPS
Track circuit receiver
Data fusion
system
Microphone
Accelerometer
Track fault
ATS receiver
Signal processing GPS
Track circuit receiver
Data fusion
system
Microphone
Accelerometer
Track fault
ATS receiver
Fig. 1. Condition monitoring of railway by probe vehicle system
2. Condition monitoring of conventional railway track
2.1 Detection of track faults from cabin vibration
2.1.1 Cabin vibration due to track faults
Several kinds of track faults can be detected by measuring the acceleration of bogies (Waston et al., 2006, 2007, 2007). However, if track faults can be detected in-cabin, condition monitoring of track irregularities will be much easier. As the distinctive signal of track faults are hidden in natural frequency of car-body vibration, signal processing is necessary for the acceleration measured in-cabin to detect track faults.
Track faults include corrugation, that is a phenomenon in which cyclic wear patterns are formed on rail heads with wavelengths of a few centimeters to 10 to 20cm as shown in Fig.2 (Matsumoto et al. 2002). Corrugation in tight curves poses particularly serious problems. Corrugation growth causes considerable noise and vibration and leads to rail damages, so it has become an important issue in track maintenance.
Figure 3 shows measurement result from a curved section of track with significant corrugation using sensors on a in-service vehicle. This is the measurement result for travelling a curve with a radius of 202m at a constant speed of 38km/h. The vertical acceleration of the left axle-box, i.e. the inner-rail side, is shown in Figure 3(a). This is a classic characteristic of corrugation in tight curves and confirms the occurrence of corrugation on an inner-side rail.
Figure 3(b) shows the vertical accelerations of the vehicle body measured on the floor of the cabin. Vertical acceleration of a car body measured on the cabin floor is greatly influenced
www.intechopen.com

Condition Monitoring of Railway Track Using In-Service Vehicle
335
by low-frequency vibration of the car body, and no significant difference is observed in measurement signal by the presence or absence of corrugation in tracks. Thus, it is difficult to detect corrugation by methods using measurement signals directly such as threshold processing, and therefore signal processing is required for detecting corrugation from the acceleration of car bodies.
Fig. 2. Example of rail corrugation
-400
-200
0
200
400
0 2 4 6 8 10
Inner
axle
bo
x a
cc.
[m/s
2]
Time [s] (a) Vertical acceleration of left axle-box
-0.3-0.2-0.10.00.10.20.3
0 2 4 6 8 10
Veh
icle
bod
y a
cc.
[m/s
2]
Time [s] (b) Vertical acceleration of car body
Fig. 3. Measurement results of curved section with corrugation
www.intechopen.com
Reliability and Safety in Railway
336
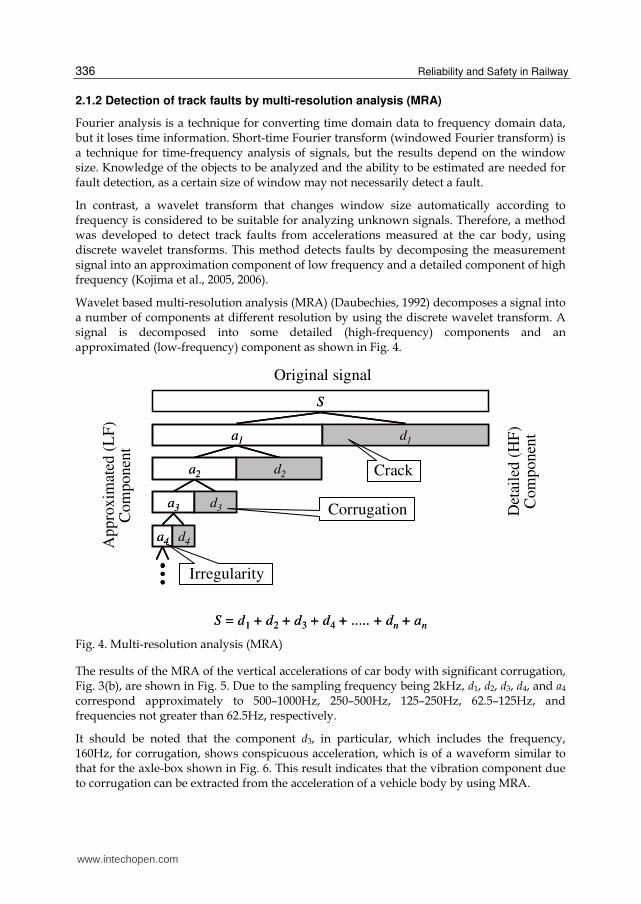
2.1.2 Detection of track faults by multi-resolution analysis (MRA)
Fourier analysis is a technique for converting time domain data to frequency domain data, but it loses time information. Short-time Fourier transform (windowed Fourier transform) is a technique for time-frequency analysis of signals, but the results depend on the window size. Knowledge of the objects to be analyzed and the ability to be estimated are needed for fault detection, as a certain size of window may not necessarily detect a fault.
In contrast, a wavelet transform that changes window size automatically according to frequency is considered to be suitable for analyzing unknown signals. Therefore, a method was developed to detect track faults from accelerations measured at the car body, using discrete wavelet transforms. This method detects faults by decomposing the measurement signal into an approximation component of low frequency and a detailed component of high frequency (Kojima et al., 2005, 2006).
Wavelet based multi-resolution analysis (MRA) (Daubechies, 1992) decomposes a signal into a number of components at different resolution by using the discrete wavelet transform. A signal is decomposed into some detailed (high-frequency) components and an approximated (low-frequency) component as shown in Fig. 4.
S
a1 d1
a2 d2
a3 d3
a4 d4
S = d1 + d2 + d3 + d4 + ..... + dn + anS = d1 + d2 + d3 + d4 + ..... + dn + an
S
a1 d1
a2 d2
a3 d3
a4 d4
Original signal
Det
aile
d (
HF
)C
om
po
nen
t
Ap
pro
xim
ated
(L
F)
Com
po
nen
t
Crack
Corrugation
Irregularity
Fig. 4. Multi-resolution analysis (MRA)
The results of the MRA of the vertical accelerations of car body with significant corrugation, Fig. 3(b), are shown in Fig. 5. Due to the sampling frequency being 2kHz, d1, d2, d3, d4, and a4 correspond approximately to 500–1000Hz, 250–500Hz, 125–250Hz, 62.5–125Hz, and frequencies not greater than 62.5Hz, respectively.
It should be noted that the component d3, in particular, which includes the frequency, 160Hz, for corrugation, shows conspicuous acceleration, which is of a waveform similar to that for the axle-box shown in Fig. 6. This result indicates that the vibration component due to corrugation can be extracted from the acceleration of a vehicle body by using MRA.
www.intechopen.com

Condition Monitoring of Railway Track Using In-Service Vehicle
337
-0.3-0.2-0.10.00.10.20.3
0 2 4 6 8 10
S [
m/s
2]
Time [s]
-0.3-0.2-0.10.00.10.20.3
0 2 4 6 8 10
a4 [
m/s
2]
Time [s]
-0.04
-0.02
0.00
0.02
0.04
0 2 4 6 8 10
d4 [
m/s
2]
Time [s]
-0.04
-0.02
0.00
0.02
0.04
0 2 4 6 8 10
d3 [
m/s
2]
Time [s]
-0.04
-0.02
0.00
0.02
0.04
0 2 4 6 8 10
d2 [
m/s
2]
Time [s]
-0.04
-0.02
0.00
0.02
0.04
0 2 4 6 8 10
d1 [
m/s
2]
Time [s]
Fig. 5. MRA of acceleration of vehicle body with corrugation
-400
-200
0
200
400
0 5 10 15 20 25
Time [s]
Ax
leb
ox a
cc. [m
/s2]
-400
-200
0
200
400
0 5 10 15 20 25
Time [s]
Ax
leb
ox a
cc. [m
/s2]
(a) Vertical acceleration of axle-box
-0.04
-0.02
0
0.02
0.04
0 5 10 15 20 25
Time [s]
d3
[m/s
2]
-0.04
-0.02
0
0.02
0.04
0 5 10 15 20 25
Time [s]
d3
[m/s
2]
(b) Signal d3 extracted from vertical acceleration of car body
Fig. 6. Extraction of signal due to corrugation
www.intechopen.com

Reliability and Safety in Railway
338
Figure 7 shows the calculation results of vertical acceleration of car-body and bogie. In this calculation, vertical acceleration of car body and bogie are calculated using 5 degree-of-freedom vehicle model as shown in the left side of Fig. 7. Three types of track faults (corrugation, 1-2s, irregularity, 4-6s, crack, 8s) are considered. It should be noted that only the effect of irregularity can be seen on the vertical acceleration of car-body.
Figure 8 shows the calculated results of MRA. We can see that the corrugation can be detected in 1-2s in the d3 component which include the frequency of 167Hz due to the corrugation. It can be seen that a crack of a rail can be detected as a impulsive signal in d1, d2, d3, d4, particular in d2. The irregularities of track appear in the lower frequency ranges, i.e. d5-d10. These results show that condition monitoring of track irregularities from car body accelerations is possible using MRA.
k1zW2 zW1k1 c1c1
k2c2
mB
zB
2a
mT, IT
zT
v
kCkC cCcCzR1zR2
mW mW
0 2 4 6 8 10-1.0
-0.5
0.0
0.5
1.0
Time [s]
Body
Acc
elera
tion [
m/s
2]
Vertical acceleration of car body
0 2 4 6 8 10-4
-2
0
2
4
Time [s]
Bo
gie
Acce
lera
tio
n [
m/s
2]
CrackIrregularity
Irregularity
Corrugation
Vertical acceleration of bogie
Fig. 7. Vertical acceleration of car body and bogie due to track faults
2.1.3 Detection of track irregularities from car body acceleration
The previous section shows that the MRA is effective for detecting track faults from car body accelerations. However, irregularities of track can be detected from the acceleration of car body directly without using MRA. Simulation studies were carried out using multi-body dynamics code, SIMPACK, to find the possibility of detecting track irregularities from car body vibration directly.
Figure 9 shows the SIMPACK model used for simulation study. The right side of Figure 10 shows vertical acceleration, lateral acceleration and roll angle of car body while the vehicle is travelling with 72km/h on track with irregularities in the vertical direction, the lateral direction and the roll direction, respectively. It can be seen that the car body acceleration and roll angle can be used for detection of track faults.
www.intechopen.com

Condition Monitoring of Railway Track Using In-Service Vehicle
339
d1
(500~1000)
[Hz]
0 2 4 6 8 10-1
0
1
x
0 2 4 6 8 10-0.1
0
0.1
a 10
0 2 4 6 8 10-1
0
1
d1
0
0 2 4 6 8 10-0.5
0
0.5
d9
0 2 4 6 8 10-0.5
0
0.5
d8
0 2 4 6 8 10-0.2
0
0.2
d7
0 2 4 6 8 10-0.1
0
0.1
d6
0 2 4 6 8 10-0.05
0
0.05
d5
0 2 4 6 8 10-0.02
0
0.02
d4
0 2 4 6 8 10-0.05
0
0.05
d3
0 2 4 6 8 10-0.05
0
0.05
d2
0 2 4 6 8 10-0.02
0
0.02
d1
Time [s]
Signal
d2
(250 – 500)
d3
(125 – 250)
d4
(62.5 - 125)
d5
(31.3 - 62.5)
d6
(15.6 - 31.3)
d7
(7.81 - 15.6)
d8
(3.91 - 7.81)
d9
(1.95 -3.91)
d10
(0.977 - 1.95)
a10
(0 - 0.977)
Corrugation
Crack
Irregularity
d1
(500~1000)
[Hz]
0 2 4 6 8 10-1
0
1
x
0 2 4 6 8 10-0.1
0
0.1
a 10
0 2 4 6 8 10-1
0
1
d1
0
0 2 4 6 8 10-0.5
0
0.5
d9
0 2 4 6 8 10-0.5
0
0.5
d8
0 2 4 6 8 10-0.2
0
0.2
d7
0 2 4 6 8 10-0.1
0
0.1
d6
0 2 4 6 8 10-0.05
0
0.05
d5
0 2 4 6 8 10-0.02
0
0.02
d4
0 2 4 6 8 10-0.05
0
0.05
d3
0 2 4 6 8 10-0.05
0
0.05
d2
0 2 4 6 8 10-0.02
0
0.02
d1
Time [s]
Signal
d2
(250 – 500)
d3
(125 – 250)
d4
(62.5 - 125)
d5
(31.3 - 62.5)
d6
(15.6 - 31.3)
d7
(7.81 - 15.6)
d8
(3.91 - 7.81)
d9
(1.95 -3.91)
d10
(0.977 - 1.95)
a10
(0 - 0.977)
Corrugation
Crack
Irregularity
Fig. 8. Decomposition of vertical acceleration of car body by MRA
Fig. 9. Full vehicle model
www.intechopen.com

Reliability and Safety in Railway
340
(a) Track irregularities (b) Vibration of car body
Fig. 10. Vibration of car body due to track irregularities
2.1.4 Detection of corrugation from cabin noise
Some measures should be taken to ensure accurate measurement of high-frequency vibration components using an accelerometer, e. g., it should be attached tightly to the cabin floor. A method was therefore invented to detect corrugation using cabin noise that is uniquely generated when trains run on rails with corrugation.
In this method, spectra are obtained using a short-time Fourier transform of cabin noise data. Peak heights of specific frequencies in the spectra together with the corresponding frequencies are calculated in real-time, and their time-related changes are evaluated as shown in Fig. 11.
Fig. 11. Detection of corrugation from cabin noise
Corrugation can be detected by simpler measurement with this method using a microphone in the cabin. It was also confirmed that the extent of corrugation can also be diagnosed by this method, in an experiment using a commercial railway line.
www.intechopen.com

Condition Monitoring of Railway Track Using In-Service Vehicle
341
Figure 12 presents the results of corrugation detection by cabin noise. Figure 12(a) depicts the noise level of a relatively small corrugation section (hatched part) with a wave height of 0.1 to 0.2mm, indicating that the corrugation section could not be specified by cabin noise. In contrast, spectral peak values (Fig. 12(b)) were elevated in the corrugation section, suggesting that early stage corrugation could not be detected by noise level alone but could be detected successfully by spectral peak.
-0.6-0.4-0.20.00.20.40.6
0 5 10 15 20
Inte
rior
nois
e [V
]
Time [s] (a) Cabin noise level
0.000
0.005
0.010
0.015
0.020
0 5 10 15 20
Pea
k h
eig
ht
[V]
Time [s]
(b) Spectral peak of cabin noise
Fig. 12. Cabin noise measured at in-service vehicle and its spectral peak
2.2 Onboard sensing system
A portable onboard sensing system was developed for an in-service vehicle to enable simple diagnosis of tracks on a commercial line (Tsunashima et al., 2008). Figure 13 depicts components of the sensing system developed. It consists of a microphone for detecting corrugation, accelerometers for detecting track irregularity, a rate gyroscope, a GPS receiver for detecting position, a computer for analysis, and an analog input terminal for inputting signals from each sensor to the computer. The signal output from each sensor is converted into a digital signal by the analog input terminal and input into the computer.
TrackDiagnostics
Software
Track
DiagnosticsSoftware
MapMatching
Software
Map
MatchingSoftware
HDDHDD
GPS Receiver
Notebook Computer
AnalogInput
Terminal
Analog
InputTerminal
Accelero-meter
Accelero-
meter
Rate gyroRate gyro
Track Condition
Dist., Velocity
USB
USB
MicrophoneMicrophone
Accelerometer Rate gyro
Microphone
Analog I/O terminal
Fig. 13. Portable onboard sensing system
www.intechopen.com

Reliability and Safety in Railway
342
Position information acquired by a GPS receiver is also input into the computer. The computer not only estimates current position and velocity based on the position information from the GPS receiver and acceleration signal from the acceleration sensor, but it also estimates track condition by processing the signal from each sensor and displays it in time sequence in the present position on a screen. Data obtained by signal processing is also recorded on a hard disk drive and utilized for detailed diagnosis of track status by off-line analysis.
2.3 Field test
A method for estimating car body vibration from track displacements has been created as an index for controlling track irregularities. This method estimates riding comfort by calculating car-body vibration and evaluates track condition more effectively by obtaining response characteristics of the car body from field tests (Fig. 14). Figure 15 shows the real time monitoring of track condition in the field test.
GPS
Fig. 14. Field test
Train location
Detected faults
Cabin noise
Peek height of noise spectral
Vertical acc.
Lateral acc.
Roll rate
Vehicle speed
Fig. 15. Real time condition monitoring of track
www.intechopen.com
Condition Monitoring of Railway Track Using In-Service Vehicle
343
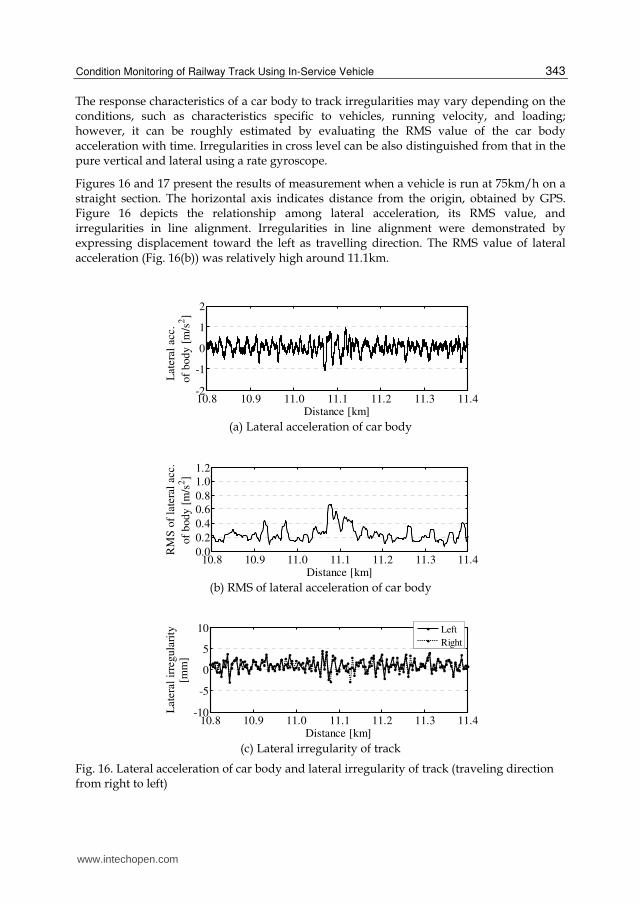
The response characteristics of a car body to track irregularities may vary depending on the conditions, such as characteristics specific to vehicles, running velocity, and loading; however, it can be roughly estimated by evaluating the RMS value of the car body acceleration with time. Irregularities in cross level can be also distinguished from that in the pure vertical and lateral using a rate gyroscope.
Figures 16 and 17 present the results of measurement when a vehicle is run at 75km/h on a straight section. The horizontal axis indicates distance from the origin, obtained by GPS. Figure 16 depicts the relationship among lateral acceleration, its RMS value, and irregularities in line alignment. Irregularities in line alignment were demonstrated by expressing displacement toward the left as travelling direction. The RMS value of lateral acceleration (Fig. 16(b)) was relatively high around 11.1km.
10.8 10.9 11.0 11.1 11.2 11.3 11.4-2
-1
0
1
2
Late
ral
acc
.
of
body [
m/s
2]
Distance [km] (a) Lateral acceleration of car body
10.8 10.9 11.0 11.1 11.2 11.3 11.40.0
0.2
0.4
0.6
0.8
1.0
1.2
RM
S o
f la
tera
l acc
.
of
body [
m/s
2]
Distance [km] (b) RMS of lateral acceleration of car body
10.8 10.9 11.0 11.1 11.2 11.3 11.4-10
-5
0
5
10
Late
ral
irre
gula
rity
[mm
]
Distance [km]
Left
Right
(c) Lateral irregularity of track
Fig. 16. Lateral acceleration of car body and lateral irregularity of track (traveling direction from right to left)
www.intechopen.com

Reliability and Safety in Railway
344
Figure 17 depicts the relationship among roll angle, its RMS value, and irregularities in alignment of level. The roll angle is obtained by integrating the roll rate measured by a rate gyroscope. The RMS value of the roll angle was high around 11.1km (Fig. 17(b)), which corresponded to a location with great irregularity in the alignment of level (Fig.17(c)). It is also near the peak of lateral acceleration RMS (Fig. 17(b)). Based on these findings, it is considered that track irregularities and positions can be detected by using the RMS of normal track as standard and setting a threshold.
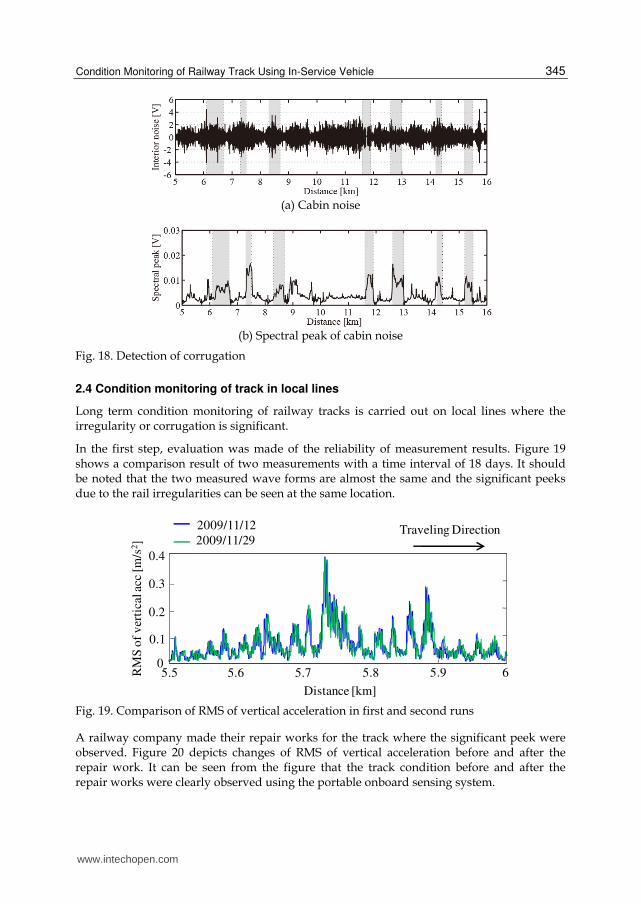
Figure 18 show the result of corrugation detection. Gray parts of the figure indicate the areas where the corrugation is observed. It is shown that the corrugations are successfully detected by the proposed method from cabin noise.
10.8 10.9 11.0 11.1 11.2 11.3 11.4-15
-10
-5
0
5x 10
-3
Ro
ll a
ng
leo
f b
od
y [
rad
]
Distance [km] (a) Roll angle of car body
10.8 10.9 11.0 11.1 11.2 11.3 11.40.0
0.2
0.4
0.6
0.8
RM
S o
f ro
ll a
ng
leo
f b
od
y [
rad
]
Distance [km] (b) RMS of roll angle of car body
10.8 10.9 11.0 11.1 11.2 11.3 11.4-10
-5
0
5
10
Irre
gu
lari
ty
of
cro
ss l
ev
el [
mm
]
Distance [km] (c) Irregularity of cross level of track
Fig. 17. Roll angle of car body and irregularity of cross level of track (traveling direction from right to left)
www.intechopen.com
Condition Monitoring of Railway Track Using In-Service Vehicle
345
(a) Cabin noise
(b) Spectral peak of cabin noise
Fig. 18. Detection of corrugation
2.4 Condition monitoring of track in local lines
Long term condition monitoring of railway tracks is carried out on local lines where the irregularity or corrugation is significant.
In the first step, evaluation was made of the reliability of measurement results. Figure 19 shows a comparison result of two measurements with a time interval of 18 days. It should be noted that the two measured wave forms are almost the same and the significant peeks due to the rail irregularities can be seen at the same location.
0
0.1
0.2
0.3
0.4
5.5 5.6 5.7 5.8 5.9 6RM
S o
f v
erti
cal a
cc[m
/s2]
Traveling Direction2009/11/12
2009/11/29
Distance [km]
Fig. 19. Comparison of RMS of vertical acceleration in first and second runs
A railway company made their repair works for the track where the significant peek were observed. Figure 20 depicts changes of RMS of vertical acceleration before and after the repair work. It can be seen from the figure that the track condition before and after the repair works were clearly observed using the portable onboard sensing system.
www.intechopen.com

Reliability and Safety in Railway
346
2009/12/12膅before repair works䐢
2010/1/13 膅after repair works 䐢
0
0.4
0.1
0.2
0.3
-1 0 1 2 3 4 5 6 7RM
S o
f v
ert
ical
acc
[m/s
2]
Distance [km]
Traveling Direction
Fig. 20. Changes of RMS of vertical acceleration before and after repair work
Corrugation condition monitoring on another commercial line was also carried out. Eight measurements in two years were collected and evaluated. Figure 21 and 22 show the change of corrugation condition evaluated by the spectral peek from cabin noise.
0
0.01
0.02
0.03
0.04
0.05
10 11 12 13 14 15
Sp
ectr
al P
eak
[V
]
Traveling Direction
10 11 12 13 14 150
20
40
60
80
100
Velo
cit
y [
km
/h]
2010/10/20
2010/12/22
2010/5/21
2011/6/21
R=312mR=170mR=300m
Distance [km]
Fig. 21. Spectral peak of cabin noise
0
0.01
0.02
0.03
0.04
0.05
Sp
ectr
al P
eak
[V]
Time [month]
0 1512963 2118 24
R=170m R=300m R=312m
Fig. 22. Change of maximum spectral peak in two years operation
www.intechopen.com

Condition Monitoring of Railway Track Using In-Service Vehicle
347
3. Condition monitoring of high-speed railway track
3.1 Overview
To enhance the safety and reliability of high-speed transportation, one of the most important tasks is to examine infrastructure frequently and accurately. On the shinkansen lines, catenary and track infrastructure is examined by multiple inspection trains in business hours in the daytime. The multiple inspection train called ‘Dr. Yellow’ runs on the Tokaido & Sanyo shinkansen, and ‘East-i’ runs Tōhoku, Jōetsu, Nagano, Yamagata & Akita shinkansen. The newest Kyushu Shinkansen carries a track recording device on some operating trains for cost reduction purpose.
In this way, every shinkansen track is examined every 10 days. In order to confirm the safety in the period of the interval of track inspection, car body acceleration of commercial trains has been measured every day since the inauguration of service on the Tokaido shinkansen line in 1964. Track condition monitoring that only references car body accelerations become difficult because the recent shinkansen vehicle is equipped with high-performance suspension and is therefore not as responsive to track irregularity. To solve this problem, a new device which is able to measure track irregularity was developed.
3.2 RAIDARSS-3: Track condition monitoring system on Tokaido shinkansen
In 2009, a new track condition monitoring device that is able to measure vertical track irregularity using double integration of the axle-box acceleration, was developed. The new devices called RAIDARSS-3 (see Fig. 23,) are now installed on six N700 series shinkansen train sets in order to check the track condition several times a day. If the measured accelerations or track irregularities exceed the predetermined target values, these measured values and locations are automatically reported to the train control centre and track maintenance depots. Table 1 shows the main features of RAIDARSS-3.
The inertial measurement is more suitable for track condition monitoring by commercial trains than the 3-points method because it doesn’t require a special car body structure or bogies.
Accelerometer (Axle-box)
Processing unit
Accelerometer
(Car-body)Opposite train sensor
Processing unit Control Center
Track maintenance depot
Managing sections
Automatic Reporting
Accelerometer
(Axle-box)
Fig. 23. RAIDARSS-3: Track condition monitoring system for Tokaido shinkansen
www.intechopen.com

Reliability and Safety in Railway
348
Automatic reporting Exceeded values and locations are automatically reported to the train control center and track maintenance depots.
Wheel diameter adjustment Wheel diameters are automatically revised by wheel pulse and position information from train.
Opposite train sensing Opposite trains are detected by optical sensors
Data acquisition All data are automatically transmitted to a server via LCX(Leaky Coaxial) Cable.
50 runs of operation data are stored on 2GB memory card.
Settings Setting change and data transmission are available via LCX cable.
Table 1. Main features of RAIDARSS-3
3.3 Former inertial measurement system
Inertial measurement is based on a simple law where double integration of the acceleration indicates a position on an accelerometer. For example, the vertical position of a wheel can be found by using double integration of the axle-box acceleration. The result provides the longitudinal level due to the wheel being continuously in contact with the rail (see Fig. 24). On the other hand, for the measurement of the track alignment, the change of the clearance laterally existing between the wheel flange and the rail needs to be taken into account and thus needs to be measured by means of sensors.
The conventional inertial system uses an analogue integral circuit. If an input signal has a slight offset, the output of an analogue integrator is completely saturated in the vicinity of the power supply voltage, and therefore cannot function as an integrator. To avoid saturation, a high-pass filter is added before the integrator. The cut-off frequency of the high-pass filter varies with vehicle speed to maintain the cut-off wavelength at a fixed value (ex. 120 m) over the distance domain.
Unfortunately, the high-pass filter distorts the output waveform so that the output signal does not agree with the track profile on the ground. It is caused by a nonlinear phase shift of the analogue high-pass filter. Another issue is that the measured waveforms of alternate directions are largely different. The distortion can be corrected by reversing the phase of the output signal. But a smarter solution to wave distortion is to introduce digital processing.
Track longitudinal
level
Locus of
the axle box
=
Accelerometer
Rail
Wheel
Acceleration
=
Fig. 24. Inertial track measurement in longitudinal level
www.intechopen.com

Condition Monitoring of Railway Track Using In-Service Vehicle
349
3.4 Digital processing for RAIDARSS-3
As with saturation in an analogue integrator, an offset of the input data gains in number of
bits by digital integral calculus, the bit width of the processor will shorten immediately. To avoid this problem, as in analogue devices, a digital high-pass filter is necessary before the
integrator. But it is difficult to solve by changing the many coefficients of the high-order digital HPF according to the vehicle speed in real time.
To overcome the difficulty, RAIDARSS-3 uses the 10 m versine characteristic to stabilize the double integration (see Fig. 25).
-40
-20
0
20
0.01 0.1 1-60
-40
-20
0
20
0.1 1 10
-100
-80
-60
-40
-20
0
0.1 1 10
(c) Integration and mid-chord offset composite calculation
Frequency (Hz)
40km/h
160km/h× =
(b) Mid-chord offset
(10 m versine)
Spatial frequency (1/m)
(a) Double integration
Frequency (Hz)
Gain (dB) Gain (dB) Gain (dB)
0
Fig. 25. Digital inertial processing for RAIDARSS-3
The 10 m versine method is expressed by
x ξ-5 +x ξ+5ξ =x ξ -
2y , (1)
where y ξ is measured 10m versine signal and x ξ is original track profile on the ground.
From Eq. (1), a transfer function for a 10m versine measurement on the z-plane yields Eq. (2).
-5 -1010
1 1H z = - +z - z
2 2, (2)
In this equation, the sampling distance is 1.0m and an output delay of 5m to satisfy the law of causality.
Furthermore,
2-5 -10 -5
10
1 1H z =- 1-2 z +z =- 1-z
2 2, (3)
Equation 3 shows that a characteristic of the 10m versine consists of two difference filters and one multiplier. Figure 26 shows a block diagram of the 10m versine method, and Fig. 27 shows the characteristics of a difference filter.
www.intechopen.com

Reliability and Safety in Railway
350
Z-5 Z-5
- -
2
1Original
track profile10m
versine
Difference filter Difference filter
Fig. 26. Brock diagram of 10 m versine method
0
0.5
1
1.5
2
2.5
0 0.2 0.4 0.6 0.8 1
Spatial frequency (1/m)
Gain
522 cosH
Fig. 27. Frequency responce of difference filter
As shown in Fig. 27, because the difference filter, which is divided from a 10m versine characteristic, exhibits a high-pass characteristic and the DC (0Hz) gain is zero, allowing this filter to utilize integration stabilization. Since the difference filter operates by taking the difference between the input signal and its delayed signal, the processing load is very light. Furthermore, a variable frequency filter can easily be used by changing the delay corresponding to the vehicle speed. With a sampling frequency of 1.0Hz, the characteristics of the 10m versine method in the time domain yields Eq. (4).
2-L
10
1H z =- 1-z
2 (4)
where L = 5/v, and v is the vehicle speed (m/s).
The transfer function for the simplest digital integrator on the z-plane is
I -1
1H z =
1-z, (5)
Using Eqs.(4) and (5), the digital inertial processing is expressed as
2-L
DI 10 I -1
1 1-zH z =H ×H =-
2 1-z
, (6)
This digital inertial measurement technique is called the ''Frequency variable difference filter''. Figure 28 shows a block diagram of this processing technique. This system, mainly composed of adders with a single multiplier, can maintain quite low CPU loading condition.
www.intechopen.com

Condition Monitoring of Railway Track Using In-Service Vehicle
351
10m versine longitudinal level obtained by RAIDARSS-3 is shown in Fig. 29. For comparison, measurement signals from an existing track geometry car in Dr. Yellow are shown in the figure. There are the good correspondences between the signals.
Fig. 28. Block diagram of frequency variable difference filter
-8
-4
0
4
8
-8
-4
0
4
8
255 km/h
57 km/h
RAIDARSS-3 Track geometry car
Lo
ngitu
din
al le
ve
l (m
m)
100m
-8
-4
0
4
8
-8
-4
0
4
8
255 km/h
57 km/h
RAIDARSS-3RAIDARSS-3 Track geometry carTrack geometry car
Lo
ngitu
din
al le
ve
l (m
m)
100m
Fig. 29. Comparison between RAIDARSS-3 and Dr. Yellow
3.5 Cant and twist
Track cant is calculated from the vertical track profile of right and left rail. This method is suitable for track monitoring by a commercial vehicle because an expensive gyro is not necessary. Figure 30 shows an operation flow to calculate cant.
www.intechopen.com

Reliability and Safety in Railway
352
10 m versine
Longitudinal level(Right)
10 m versine
Longitudinal level
(Left)
Vertical track profile
(Right)
Vertical track profile
(Left)
Inverse filter
Inverse filter
Cant+
-
10 m versine
Longitudinal level
(Right)
10 m versine
Longitudinal level
(Left)
CantInverse filter
+
-
(a)
(b)
10 m versine
Longitudinal level(Right)
10 m versine
Longitudinal level
(Left)
Vertical track profile
(Right)
Vertical track profile
(Left)
Inverse filter
Inverse filter
Cant+
-
10 m versine
Longitudinal level(Right)
10 m versine
Longitudinal level
(Left)
Vertical track profile
(Right)
Vertical track profile
(Left)
Inverse filter
Inverse filter
Cant+
-
10 m versine
Longitudinal level
(Right)
10 m versine
Longitudinal level
(Left)
CantInverse filter
+
-
10 m versine
Longitudinal level
(Right)
10 m versine
Longitudinal level
(Left)
CantInverse filter
+
-
(a)
(b)
Fig. 30. Calculation flow for cant
Since RAIDARSS calculates a 10m versine of longitudinal level directly, an inverse filter shown in the Fig. 31 is used to get vertical track profile from 10m versine. Fig. 30(b), that is equivalent to Fig. 30(a), is used for effective calculation.
0.01
0.1
1
10
100
0.001 0.01 0.1 1
Spatial frequency (1/m)
Ga
in
Inverse filter
10 m versine
Comprehensive
100 m
6 m
0.01
0.1
1
10
100
0.001 0.01 0.1 1
Spatial frequency (1/m)
Ga
in
Inverse filter
10 m versine
Comprehensive
100 m
6 m
Fig. 31. Inverse filter for track profile restoreation
Cant calculated from RAIDARSS is compared with the signals from an existing Dr. Yellow in Fig. 32. There are the good correspondences between the signals. Both agree well, and the standard deviation of the difference of both is 0.28mm. Track twist shown in Fig. 33 is calculated by means of a difference of cant between 2.5 m, and the standard deviation of the difference with the Doctor Yellow is 0.14 mm. Even if an expensive gyro is not used, track cant and twist are obtained with high precision.
-6
-3
0
3
6RAIDARSS-3
Track geometry car
100m
Ca
nt
(mm
)
-6
-3
0
3
6RAIDARSS-3RAIDARSS-3
Track geometry carTrack geometry car
100m
Ca
nt
(mm
)
Fig. 32. Cant calculated from RAIDARSS-3
www.intechopen.com

Condition Monitoring of Railway Track Using In-Service Vehicle
353
-6
-3
0
3
6
Tw
ist
(mm
)
100mRAIDARSS-3
Track geometry car-6
-3
0
3
6
Tw
ist
(mm
)
100mRAIDARSS-3RAIDARSS-3
Track geometry carTrack geometry car
Fig. 33. Twist calculated from RAIDARSS-3
82360 82380 82400
–5
0
5
82200 82300 82400
–5
0
5
Lo
ng
itu
din
al l
eve
l (m
m)
Lo
ng
itu
din
al l
eve
l (m
m)
20 m
4 m
Track Irregularity growth during 22 days
22 signals from N700 commercial trains
After tamping work
Fig. 34. Repeatability of RAIDARSS-3 for 3 weeks
www.intechopen.com

Reliability and Safety in Railway
354
3.6 Practical use of RAIDARSS-3
RAIDARSS-3 is installed in six N700 train sets already working on Tokaido shinkansen, and car-body accelerations and longitudinal levels are checked several times every day. The repeatability for 3 weeks is shown in Fig. 34.
In spite of the varied train sets and running speed, good correspondence was obtained
among 22 different signals, which indicates good repeatability of the device. It can be seen
that rapid track geometry degradation occurs in this section. Although the growth rate of
the track irregularity is small every day, the good repeatability of the device can identify
even the slight change of the track. RAIDARSS-3 will contribute to the track safety of the
Tokaido Shinkansen in the future.
4. Conclusions
Two types of track-condition-monitoring system for conventional and high-speed railway are summarized in this chapter. The development of a portable condition monitoring system for track which is easily integrated on in-service vehicles is introduced. In this system, irregularities of the rail are estimated from vertical and lateral acceleration of car body. A roll angle of car body, which is calculated using a rate gyroscope, is used to distinguish irregularity of line from irregularity of level. Rail corrugation can be detected from cabin noise with spectral peek calculation. A GPS system and map matching algorithm localizes the fault on track.
A field test was conducted using a commercial line in cooperation with a railway operating company. Track irregularity was detected by vertical and lateral acceleration measured while the vehicle was running, and corrugation was detected by spectral peaks of cabin noise. Track condition was displayed on a route map in real time together with information of the location based on the position information obtained by GPS. The field results in local lines showed that the long term condition monitoring of railway track using the developed probe system gives us useful information for condition-based-maintenance.
For condition monitoring of high-speed railway track, a new device for measuring vertical track irregularity using double integration of the axle-box acceleration, RAIDARSS-3, is introduced. RAIDARSS-3 is installed in six N700 train sets already working on Tokaido shinkansen, and car-body accelerations and longitudinal levels are checked several times every day. It will contribute to the track safety of the Tokaido Shinkansen in the future.
5. Acknowledgment
This study was supported by the Program for Promoting Fundamental Transport Technology Research from the Japan Railway Construction, Transport and Technology Agency (JRTT) and Adaptable and Seamless Technology Transfer Program through Target-driven R&D, Japan Science and Technology Agency.
6. References
Buruni, S., Goodall, R. M., Mei, T. X. and Tsunashima, H. (2007). Control and monitoring for
railway vehicle dynamics, Vehicle System Dynamics, Vol. 45, No. 7-8, , pp.765-771
www.intechopen.com

Condition Monitoring of Railway Track Using In-Service Vehicle
355
Daubechies, I. (1992), Ten Lectures on Wavelets, CBMS-NSF Regional Conference Series in
Applied Mathematics, Society for Industrial and Applied Mathematics, (61)
Goodall, R. M. and Roberts, C. (2006). Concept and Techniques for Railway Condition
Monitoring, The International Conference on Railway Condition Monitoring 2006, pp. 90-95
Hayashi, H., Kojima, T., Tsunashima, H. and Marumo, Y. (2006), Real Time Fault
Detection of Railway Vehicles and Tracks, Railway Condition Monitoring 2006,
pp. 20-25
Kojima, T., Tsunashima, H. and Matsumoto, A. (2005), Fault detection of railway track by
multi-resolution analysis, International Conference on Wavelet Analysis and Its
Applications
Kojima, T., Tsunashima, H. and Matsumoto, A. (2006), Fault detection of railway track by
multi-resolution analysis, Computer in Railway X, WIT Press, pp. 955-964
Matsumoto, A., Sato, Y., Ono, H., Tanimoto, M., Oka, Y., and Miyauchi E. (2002), Formation
mechanism and countermeasures of rail corrugation on curved track, Wear, 253(1),
pp. 178-184
Naganuma, Y. & Sato, Y. (1999). Practical Use of TRASC on Track State Confirming Cars, Proceedings of World Congress on Railway Research 1999 (WCRR '99)
Naganuma, Y. & Sato, Y. (2000). Track state control with use of real time digital data
processing, International Journal of Heavy Vehicle Systems 2000, Vol. 7, No. 1, pp. 82-
95.
Naganuma, Y., Kobayashi, M., Nakagawa, M.and Okumura, T. (2008), Condition
Monitoring of Shinkansen Tracks using Commercial Trains, International Conference
on Railway Condition Monitoring 2008
Naganuma, Y.; Kobayashi, M.; Nakagawa, M. and Okumura, T. (2010). Inertial
Measurement Processing Techniques foe Track Condition Monitoring on
Shinkansen Commercial Trains, Journal of Mechanical Systems foe Transportation and
Logistics, Vol. 3, No. 1
Otake, T.; Naganuma, Y. and Sato, Y. (1997). Rectification of Distorted Track Irregularity
Record Obtained by Inertia Method, Proceedings of the 6th International Conference of
the IHHA
Takeshita, K. (1997). Track Irregularity Inspection Method by Commercial Railway Vehicle,
QR of RTRI, Vol. 38, No. 1, pp. 6-12.
Tsunashima, H., Kojima, T., Marumo, Y., Matsumoto, A. and Mizuma, T. (2008), Condition
Monitoring of Railway Track and Driver Using In-Service Vehicle, International
Conference on Railway Condition Monitoring 2008
Waston, P. F., Ling, C. S., Goodman, C. J., Roberts, C., Li, P. and Goodall, R. M. (2007),
Monitoring lateral track irregularity from in-service railway vehicles, Proceedings of
the Institution of Mechanical Engineers, Part F, Journal of Rail and Rapid Transit, Vol.
221, No. F1, pp. 89-100
Waston, P. F., Ling, C. S., Roberts, C., Goodman, C. J., Li, P. and Goodall, R. M. (2007),
Monitoring vertical track irregularity from in-service railway vehicles, Proceedings
of the Institution of Mechanical Engineers, Part F, Journal of Rail and Rapid Transit, Vol.
221, No. F1, pp. 75-88
www.intechopen.com
Reliability and Safety in Railway
356
Waston, P. F., Roberts, C., Goodman, C. J. and Ling, C. S. (2006), Condition monitoring
of railway track using in-service trains, Railway Condition Monitoring 2006, pp.
26-31
www.intechopen.com
Reliability and Safety in RailwayEdited by Dr. Xavier Perpinya
ISBN 978-953-51-0451-3Hard cover, 418 pagesPublisher InTechPublished online 30, March, 2012Published in print edition March, 2012
InTech EuropeUniversity Campus STeP Ri Slavka Krautzeka 83/A 51000 Rijeka, Croatia Phone: +385 (51) 770 447 Fax: +385 (51) 686 166www.intechopen.com
InTech ChinaUnit 405, Office Block, Hotel Equatorial Shanghai No.65, Yan An Road (West), Shanghai, 200040, China
Phone: +86-21-62489820 Fax: +86-21-62489821
In railway applications, performance studies are fundamental to increase the lifetime of railway systems. Oneof their main goals is verifying whether their working conditions are reliable and safety. This task not only takesinto account the analysis of the whole traction chain, but also requires ensuring that the railway infrastructureis properly working. Therefore, several tests for detecting any dysfunctions on their proper operation havebeen developed. This book covers this topic, introducing the reader to railway traction fundamentals, providingsome ideas on safety and reliability issues, and experimental approaches to detect any of these dysfunctions.The objective of the book is to serve as a valuable reference for students, educators, scientists, facultymembers, researchers, and engineers.
How to referenceIn order to correctly reference this scholarly work, feel free to copy and paste the following:
Hitoshi Tsunashima, Yasukuni Naganuma, Akira Matsumoto, Takeshi Mizuma and Hirotaka Mori (2012).Condition Monitoring of Railway Track Using In-Service Vehicle, Reliability and Safety in Railway, Dr. XavierPerpinya (Ed.), ISBN: 978-953-51-0451-3, InTech, Available from: http://www.intechopen.com/books/reliability-and-safety-in-railway/condition-monitoring-of-railway-track-using-in-service-vehicle