Embed Size (px)
Citation preview

131
12. LA PESQUERÍA DE LANGOSTA EN NICARAGUA
Lic. Renaldy Barnutty Navarro27
Introducción
La pesquería del recurso langosta Panulirus argus del Caribe de Nicaragua representa el rubro económico más importante del sector pesquero en el país alcanzando en los últimos 5 años un promedio de 1 373 toneladas de colas desembarcadas por año, equivalentes a $EE.UU.39 millones. Al mismo tiempo, la pesquería representa una importante fuente de empleo para los grupos sociales más deprimidos de la zona del Caribe de Nicaragua. Esta pesquería cuenta con dos sectores, industrial y artisanal, cuyas características difieren significativamente en cuanto a las inversiones, los modos operacionales y las fracciones del stock que se explotan. En este conglomerado se generan conflictos debido a problemas de acceso, derechos históricos a la pesca, competencias étnicas y sociales, desplazamientos por diferenciales de acceso a financiamiento y a mercados. La pesquería, sin embargo, ha estado sujeta a grandes cambios en su explotación debido a sucesos políticos-históricos que han afectado en forma disimilar las inversiones de las operaciones de pesca, el procesamiento y el mercado de la especie.
Nicaragua se ha caracterizado por dar seguimiento al proceso de explotación de esta pesquería a través de la obtención de información y análisis, los que han llevado a que exista un conocimiento formal de la dinámica poblacional de esta especie en la zona asi como también del estado de explotación de dicho recurso.
Descripción de la Pesquería
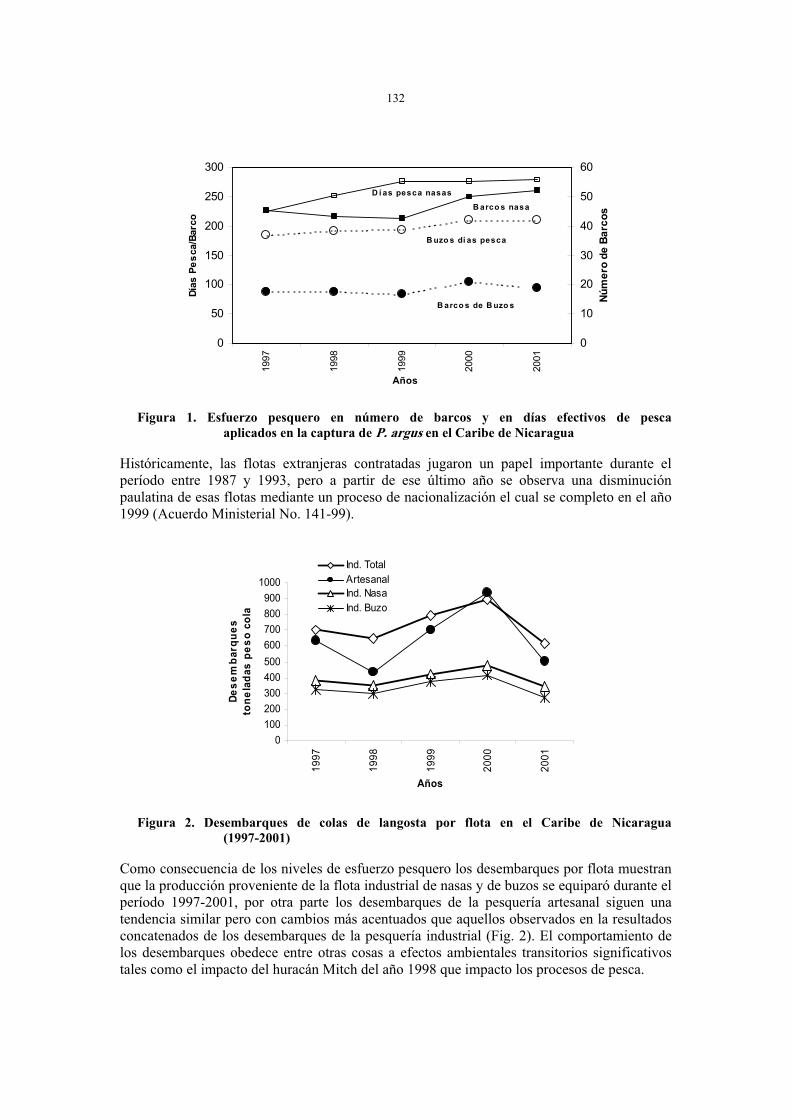
La descripción de la pesquería y sus principales características se encuentran en Martínez (2001) y en Barnutty y Pérez (2001). Un análisis del desarrollo del esfuerzo pesquero entre los años 1996 y 2001 muestra que la pesquería industrial de nasas ha experimentado un incremento importante de 45 a 52 embarcaciones, mientras que la pesquería industrial por buceo sigue un proceso más bien estabilizado con alrededor de 18 embarcaciones (Fig. 1). Este ultimo proceso obedece a la implementación del Acuerdo Ministerial n° 020-98 el cual restringe el ingreso de nuevas embarcaciones a la pesquería de langosta mediante el sistema de buceo. Cabe destacar sin embargo, que la capacidad de pesca de estas flotas, medida en días efectivos de pesca, ha seguido un proceso de incremento sostenido muy significativo y paralelo en ambas flotas.
Conjuntamente a las operaciones industriales existe una pesquería artesanal no regulada y de libre acceso, la cual en los últimos años ha experimentado una expansión significativa que ha dado como resultado que los desembarques provenientes de esta pesquería correspondan en la actualidad a más de un 50 por ciento de los desembarques totales. No se tienen estadísticas históricas confiables del desarrollo de la pesquería artesanal, sin embargo, según una encuesta realizada en el año 2001 muestra que existen alrededor de 786 embarcaciones y 1813 pescadores.
27 Centro de Investigaciónes Pesqueras y Acuicolas (CIPA), Apartado 2020, Managua, E-mail: [email protected].
132
Figura 1. Esfuerzo pesquero en número de barcos y en días efectivos de pesca aplicados en la captura de P. argus en el Caribe de Nicaragua
Históricamente, las flotas extranjeras contratadas jugaron un papel importante durante el período entre 1987 y 1993, pero a partir de ese último año se observa una disminución paulatina de esas flotas mediante un proceso de nacionalización el cual se completo en el año 1999 (Acuerdo Ministerial No. 141-99).
Figura 2. Desembarques de colas de langosta por flota en el Caribe de Nicaragua (1997-2001)
Como consecuencia de los niveles de esfuerzo pesquero los desembarques por flota muestran que la producción proveniente de la flota industrial de nasas y de buzos se equiparó durante el período 1997-2001, por otra parte los desembarques de la pesquería artesanal siguen una tendencia similar pero con cambios más acentuados que aquellos observados en la resultados concatenados de los desembarques de la pesquería industrial (Fig. 2). El comportamiento de los desembarques obedece entre otras cosas a efectos ambientales transitorios significativos tales como el impacto del huracán Mitch del año 1998 que impacto los procesos de pesca.
0
50
100
150
200
250
300
1997
1998
1999
2000
2001
Años
Día
s P
es
ca/B
arc
o
0
10
20
30
40
50
60
Nú
me
ro d
e B
arc
os
B arco s de B uzo s
B uzo s dí as pesca
B arco s nasa
D í as pesca nasas
0
100
200
300
400
500
600
700
800
900
1000
19
97
19
98
19
99
20
00
20
01
Años
De
se
mb
arq
ue
s
ton
ela
da
s p
es
o c
ola
Ind. Total
Artesanal
Ind. Nasa
Ind. Buzo

133
Regulaciones de la Administración Pesquera
En el año 1999 mediante el Acuerdo Ministerial N° 035-99 se estableció la definición de cuotas anuales de pesca bajo el concepto de ser biológicamente aceptables, es decir, siguiendo un criterio de mortalidad de pesca de referencia que considera una optimización de la biomasa generada por recluta, un estado del reclutamiento de acuerdo a condiciones denso dependientes y del ambiente, y del estado contemporáneo de explotación de la especie. En base a estas cuotas anuales biológicamente aceptables el estado define el número de licencias que podrán participar en la temporada de pesca correspondiente, con lo cual se regula la participación de las flotas industriales.
Según el Acuerdo Ministerial N° 253-2002, se establece una veda total en la pesquería con el propósito de proteger a las hembras ovigeras y el reclutamiento de juveniles durante el período más intenso de estos dos procesos biológicos. Esta temporada corresponde al período comprendido entre los meses de mayo y junio de cada año.
En la actualidad no se ha podido establecer para esta pesquería un sistema efectivo de vigilancia y control que garantice la implementación más estricta de las regulaciones de administración establecidas. Un aspecto importante a resaltar es la carencia de medidas de control de la capacidad de pesca de la flota artesanal, lo cual implica la existencia de un proceso de libre acceso sin restricciones a la cantidad de esfuerzo pesquero que la flota artesanal pueda implementar en el proceso extractivo.
Biología
En el 2001 la industria langostera nicaragüense sugirió la necesidad de establecer procedimientos inequívocos acerca de la determinación de los tamaños mínimos capturados. Para ello se sugirió la utilización del ancho del segundo anillo de la cola como una manera menos sesgada para la inclusión de animales sobre el tamaño mínimo de captura, lo anterior debido a la dificultad de que los pescadores pudieran medir adecuadamente la longitud de cola de los individuos vivos que estaban siendo capturados. Al mismo tiempo la industria tenía dudas acerca de que el tamaño mínimo de 135 mm de longitud cola correspondiera al peso mínimo de 5 onzas (142 g) previamente establecido para este recurso. Con el objetivo de dar respuesta a las preguntas anteriores, se obtuvieron nuevas relaciones morfometricas de las colas, siendo estas las siguientes (ver tablas 1 y 2).
Tabla 1. Relaciones del largo, peso y ancho del segundo anillo de la cola de la langosta Panulirus argos del mar Caribe de Nicaragua
Sexos Relaciones Ecuaciones calculadas CorrelaciónR
2
Longitud cola-peso cola Y= 0,00001756X2,56575966 0,8884
Longitud cola-ancho anillo Y=0,3161X + 6,8663 0,8994
Hembras
Ancho anillo-peso cola Y= 0,0001X2,7746 0,8948
Longitud cola-peso cola Y= 0,000111X2,6640961 0,9129
Longitud cola-ancho anillo Y= 0,3176X + 7,0701 0,9109
Machos
Ancho anillo-peso cola Y= 0,00006X2,8977432 0,9261
Longitud cola-peso cola Y= 0,00001389X2,61612149 0,8877
Longitud cola-ancho anillo Y= 0,3172X + 6,9308 0,9049
Combinadas
Ancho anillo-peso cola Y= 0,00008021X2,84006767 0,9004

134
Tabla 2. Equivalencias del largo, peso y ancho del segundo anillo de la cola de la langosta P. argos del mar Caribe de Nicaragua
Sexos Equivalencias Largo cola
(mm)
Peso cola(onzas)
Peso cola(g)
Ancho del segundo anillo de
la coda (mm)
Longitud cola-peso cola 135 5,13 145
Longitud cola-ancho anillo 135 49,54
Hembras
Ancho anillo-peso cola 5 142 48,9
Longitud cola-peso cola 135 5,26 149
Longitud cola-ancho anillo 135 49,95
Machos
Ancho anillo-peso cola 5 142 49
Longitud cola-peso cola 135 5,2 147
Longitud cola-ancho anillo 135 49,75
Combinados
Ancho anillo-peso cola 5 142 49
El algoritmo para la evaluación del recurso langosta tiene requerimientos estrictos acerca del proceso de crecimiento de la especie. En Nicaragua, Castaño y Cadima (1993) estimaron los parámetros de la curva de crecimiento según Von Bertalanffy mediante progresión de clases mensuales de longitud cefalotoracica correspondientes al período de junio 1989 y julio de 1990. Debido a la necesidad de tener una curva de crecimiento basados en longitud de cola, se recalcularon los parámetros de la ecuación de crecimiento utilizando información anual de frecuencias de longitudes de cola correspondientes al período 1989-2000. Los resultados obtenidos mediante la aplicación de análisis de progresión modal (Sparre y Venema, 1989) son (tabla 3):
Tabla 3. Parámetros de crecimiento y de mortalidad natural de P. argus en Nicaragua
Sexos Llong cola,
mm)
K año-1 t0
(año)
Valor de Phi prima para
L y K
M
Hembras 261 0.2 -0.30 4.14 0.40
Machos 269 0.22 -0.31 4.21 0.41
Combinados 276 0.24 -0.34 4.22 0.35
Utilizando los nuevos parámetros de crecimiento se re-evaluo la tasa de mortalidad natural con la formula empírica de Pauly (1983) dando como resultado valores anuales de M de 0,40 y 0,41 para hembras y machos, respectivamente (Tabla 3).
Datos Disponibles y Desarrollos Rrecientes
Datos colectados desde 1997 a la fecha pertinentes a la evaluación y administración de la pesquería son los siguientes:
Datos Estadísticos
Desembarques mensuales por categoría comercial Esfuerzo por tipo de flota industrial

135
Exportaciones en valor y cantidad por mercado Datos económicos de los procesos de pesca Encuestas de catastro
Datos Biológicos en Plantas y Abordo
Muestreo de frecuencias de longitud de cola Composición por sexo Estado de madurez sexual Rendimientos por zonas de pesca
Datos Ambientales
Precipitaciones Temperatura superficial del mar en la zona costera
La consecución de esta información ha sido dificultada en numerosas oportunidades debido a faltas logísticas y de inversiones oportunas para la realización de los trabajos de campo. Sin embargo, el grueso de la información ha sido obtenida con consistencia pudiéndose afirmar que el banco de datos para la evaluación de esta pesquería es todavía suficiente. Existen necesidades de incorporar datos ambientales más precisos y específicos para elucidar varianzas de los estimados del reclutamiento y al mismo tiempo se requiere de forma urgente evaluar en forma permanente las capturas de langostas bajo la talla comercial las cuales no son registradas en las plantas procesadoras.
El acceso a datos económico-financieros no es del todo expedito debido a cuestiones operacionales confidenciales de las plantas y flotas. Para ello se requiere establecer un mecanismo oficial que asegure la confidencialidad de la información asegurando asi una manera eficiente del uso de la misma en los análisis.
Estado del Recurso Langosta a Nivel Nacional
La pesquería de langosta en Nicaragua ha experimentado cambios notables en los patrones de explotación con una inclusión en los últimos años cada vez más significativa de edades juveniles de 2 y 3 años en los desembarques.
El impacto de estos cambios y del aumento del esfuerzo de pesca ha dado como resultado que la talla promedio anual de la langosta desembarcada presente una tendencia decreciente muy significativa (Fig. 3) y que es objeto de preocupación por una posible sobreexplotación por crecimiento el cual genera un desaprovechamiento excesivo de las biomasas potenciales del recurso.

136
Figura 3. Talla promedio (y) anual de P. argus por años biológicos (x) en el Caribe de Nicaragua
La determinación de la abundancia y estado de explotación del recurso langosta de Nicaragua se ha realizado mediante la aplicación de modelos de cohortes calibrados (Ehrhardt y Legault, 1996) los cuales utilizan la información biológica y pesquera que se hace mención más ariba. Como resultado de las evaluaciones realizadas en mayo del 2002 se observa que la mortalidad por pesca por años biológicos (junio-mayo) se ha incrementado significativamente a partir de la temporada de pesca 1996-1997 (Fig. 4). En la misma figura se aprecia que la mortalidad por pesca (F) de las temporadas 1990/1991 a la 1996/1997 se mantuvieron a niveles estables alrededor de 0,4 por año. Cabe destacar que dicha mortalidad por pesca es ligeramente superior a la tasa de mortalidad natural anual de 0,35 adoptada en los análisis.
Figura 4. Mortalidad por pesca por años biológicos
156
157
158
159
160
161
162
163
164
165
Año biológico
0.30
0.35
0.40
0.45
0.50
0.55
90
/91
91
/92
92
/93
93
/94
94
/95
95
/96
96
/97
97
/98
98
/99
99
/00
00
/01
01
/02
Años biológicos
Mo
rta
lid
ad
po
r
pe
sc
a p
on
de
rad
a
F

137
La máxima tasa de mortalidad por pesca estimada corresponde a la temporada 2000/2001 cuando alcanzo el valor de 0,53, y la tasa de mortalidad para la temporada 2001/2002 ha bajado a 0,50. Esta disminución pueda deberse a las capturas más bajas experimentadas durante esta última estación como consecuencia de una disminución aparente de las disponibilidades del recurso a nivel regional.
Las tendencias de la abundancia indican que hubo un proceso de incremento entre la temporada 1990-1991 y la del 1996-1997 (Fig. 5) el cual obedece a un incremento significativo en el reclutamiento durante aquellas temporadas.
Figura 5. Abundancias de P. argus del Caribe de Nicaragua, 1990-2002
A partir de la temporada 1996/1997 se observa que el stock de langosta en Nicaragua ha experimentado fluctuaciones considerables en la abundancia las cuales decrecen por debajo de los 8 millones de libras cola (3 636 toneladas) en la temporada 1998-1999 sobrepasando los 12 millones de libras cola (5 454 toneladas) en la temporada 1999-2000 y volviendo a decrecer por debajo de los 8 millones de libras cola en la temporada 2001-2002.
La disminución de la abundancia correspondiente a la temporada 1998/1999 se podría justificar en parte por el impacto del huracán Mitch que afectó a la región de la plataforma continental Nicaragüense-Hondureña con desbastadores efectos.
Los desembarques están significativamente influenciados por los niveles de reclutamiento a la pesquería, lo cual es similar a las conclusiones de Powers (1982) quien menciona que los desembarques de langosta en la pesquería de Florida son altamente dependientes del reclutamiento ya que las variaciones en dichos desembarques corresponden en gran medida a las variaciones del reclutamiento. Teniendo en consideración lo anterior, se ha determinado que en el caso de Nicaragua existe una relación multivariable significativa entre el reclutamiento en la temporada t, los desovantes en la temporada t-2 y el inverso de la pluviosidad (como un índice relativo de la fuerza de surgencia sobre la plataforma continental nicaragüense) al tiempo del desove (Fig. 6).
0
2,000,000
4,000,000
6,000,000
8,000,000
10,000,000
12,000,000
14,000,000
90
/91
91
/92
92
/93
93
/94
94
/95
95
/96
96
/97
97
/98
98
/99
99
/00
00
/01
01
/02
Biomasas por años bilógicos
(Lb
. p
es
o c
ola
)

138
Figura 6. Relación entre desovantes y reclutas en la pesquería de langosta de Nicaragua
La ecuación funcional que relaciona las variantes anteriores esta dada por:
donde a = 1,568424; b = 8,9721E-08 y c = 3,026459
La ecuación anterior ha sido utilizada en las estimaciones de proyección de las capturas futuras que podrían realizare en la pesquería.
A partir de la temporada 2001/2002 el gobierno de Nicaragua adoptó la definición de una cuota anual que sea biológicamente aceptable o dinámicamente sostenible (Decreto Ministerial N° 100-2001 «Lineamientos de Políticas para el uso Sostenible de los Recursos Pesqueros y Acuícolas»). Esta captura o cuota anual biológicamente aceptable esta basada en tres posibles proyecciones del reclutamiento:
Función densodependiente y ambiental. Función regresional de reclutamientos desfasados en un año. Promedio de los reclutamientos en los últimos 10 años.
y una mortalidad por pesca referencial de F = 0.1 y la historia de la explotación de las cohortes que componen la abundancia base para la temporada siguiente.
En la Figura 7 se presentan los desembarques de las temporadas de pesca en el período 1996/1997 al 2001/2002, asi como los límites inferiores y superiores de las capturas biológicamente aceptables (CBA) proyectadas para las temporadas 2001/2002 y 2002/2003.
)/1(2
2exp lluviacbD
tttaDR
0
1000000
2000000
3000000
4000000
5000000
6000000
7000000
0 5000000 10000000 15000000 20000000 25000000
Desovantes (3 años y mas)
Re
clu
tas
(h
as
ta 2
añ
os
)

139
Figura 7. Desembarques de colas de langosta y proyecciones de CBA mínimos y máximos para los períodos 96/97-02/03
Se observa que los desembarques de la última temporada (2001/2002) están ligeramente por debajo del límite inferior de la captura proyectada. Esto se debió a una caída en las biomasas poblacionales en dicha temporada. La disminución en desembarques en la temporada 2001/2002 corresponde a un 27,2 por ciento de los desembarques en la temporada anterior.
Aspectos socioeconómicos de la actividad
La pesquería de langosta se desarrolla en la región del Caribe que es la más extensa de Nicaragua (47 % de la superficie del país y contiene solamente el 9 % de la población total). En la Tabla 4 se puede observar un calculo de la población en número vinculada directamente a la actividad pesquera de la langosta.
La etnia Miskita en el norte de la región utiliza fundamentalmente el buceo como método de pesca. En tanto en el sur, el sistema de pesca tradicional ha sido el de nasas.
Tabla 4. Generación de empleos en la actividad langostera en 2001
ACTIVIDAD
No total de personal de mar, industrial y artesanal 4 878
Industrial 2 188
Atención a operación de Flota 60
Tripulación M/Ns Industriales langosteras (nasas) 448
Tripulación M/Ns Industriales langosteras (buceo) 280
Buzos y cayuq. M/Ns Industriales langosteras 1 400
Artesanal 2 690
Empleos directos
Pescadores y buzos 2 690
No de personal de servicios 600 Empleos indirectos Comercio, acopio, reparaciones, etc. 600
Los costos de operación y el punto de equilibrio actual por día de pesca para la pesca artesanal se puede observar en la Tabla 5.
0
500,000
1,000,000
1,500,000
2,000,000
2,500,000
3,000,000
3,500,000
4,000,000
96
/97
97
/98
98
/99
00
/01
01
/02
Periodo biologico
De
se
mb
arq
ue
s
(Lb
pe
so
co
la)
Desem
CBA Min
CBA Max

140
Tabla 5. Estimación de los costos de operación y punto de equilibrio por día de pesca para la flota artesanal del Caribe de Nicaragua
Concepto Rango en $EE.UU.
Combustible 13,45 21,52
Lubricante 2,41 3,61
Otros (50 % de combustible y lubricante, incluye carnada, reglas, sogas e imprevistos)
7,93 12,57
Total 23,79 37,7
Punto de equilibrio (en Lb por día de pesca) asumiendo que el acopio paga a $EE.UU.9,20 por Lb
2,59 4,1
En la Tabla 6 se presentan los costos de operación y el punto de equilibrio por día de pesca para la flota industrial.
Tabla 6. Resumen de costos de operación de barcos industriales dedicados a la pesca de langosta del Caribe de Nicaragua*
CONCEPTOS BARCOS TIPO
C. ISLAND/3000 nasas
P. cab./29 buzos
Bluef./20 buzos
Precio promedio en planta ($EE.UU./Lb)
10,25 10,25 10,25
Costo por día de pesca ($EE.UU.)
437,82 606,41 515,82
Punto de equilibrio en Lb/día de pesca
43 59 50
* No se incluye pago a tripulación porque ellos ganan por producción. Tampoco se incluye pago a buzos por la misma causa.
En la Tabla 7 se presenta una estimación de los ingresos percibidos por pescadores y armadores en la pesquería artesanal e industrial de la langosta del Caribe de Nicaragua, según los desembarques registrados del año 1997 al 2001.

141
Tabla 7. Estimación de los ingresos percibidos por los pescadores, buzos, armadores y acopiadores en la actividad pesquera de la langosta del Caribe de Nicaragua
Años Artesanal Industrial
nasas buzos Total
FACa)
nasas buzos
Gran Total
Desembarques en miles de libras
1997 900 488 1 388 8 831 715 2 942
1998 606 352 958 5 762 662 2 386
1999 1 003 524 1 527 17 930 815 3 289
2000 1 345 709 2 053 9 1 059 911 4 032
2001 655 447 1 102 3 755 597 2 457
Pagos al pescador, acopiador o armadorb)
Pago al pescador 7,00 7,00 3,00
Pago al acopiador o al armador
10,25 10,25 10,25 10,25 10,25
Diferencia para acopiador o armadorc)
3,25 3,25 7,25
Estimación de ingresos percibidos por pescadores artesanales y buzos (miles $EE.UU.)
1997 6 301 3 419 9 719 2 146 11 865
1998 4 241 2 463 6 704 1 987 8 691
1999 7 022 3 667 10 689 2 444 13 133
2000 9 412 4 961 14 373 2 733 17 106
2001 4 583 3 130 7 714 1 702 9 505
Estimación de ingresos percibidos por armadores industriales (miles $EE.UU.)
1997 81 8 513 5 186 13 780
1998 48 7 807 4 802 12 658
1999 176 9 537 5 906 15 618
2000 97 10 851 6 605 17 553
2001 33 7 734 4 330 12 098
Estimación de ingresos percibidos por acopiadores (miles $EE.UU.)
1997 2 925 1 587 4 513
1998 1 969 1 144 3 112
1999 3 260 1 702 4 963
2000 4 370 2 303 6 673
2001 2 128 1 453 3 581 a) Langosta como fauna de acompañamiento del camarón. b) El acopio paga al pescador artesanal y al buzo industrial, el precio promedio/lb indicado; la planta paga al acopiador o al armador el precio promedio/lb indicado. c) Diferencia a favor del acopiador o el armador.
Conclusiones
Los resultados de los análisis son indicativos de que la pesquería de langosta en Nicaragua esta siendo explotada más allá de los niveles razonables que pudieran generar desembarques a niveles óptimos de abundancia del stock. Esto es una consecuencia debida fundamentalmente a la excesiva captura de individuos menores de la talla mínima de 135 mm de longitud de

142
cola, o 5 onzas (142 g) de peso de cola, los cuales pueden llegar a representar entre 20 y 30 por ciento de las capturas. La incorporación de individuos bajo la talla mínima es un proceso histórico reciente muy significativo y alarmante el cual no ha sido debidamente controlado por el Estado y las implicancias del mismo tienen connotaciones muy negativas concerniente al manejo racional de este recurso.
Por otra parte, existe una fluctuación de la abundancia que podría ser de un orden decadal en donde los niveles máximos ya fueron alcanzados en temporadas anteriores y pudiera existir la posibilidad de que el recurso se encontrara en un proceso de tendencia decreciente de las abundancias. Al mismo tiempo se observa que las tendencias del esfuerzo de pesca, medidos en días de pesca, ha aumentado linealmente en el tiempo aun cuando el número de barcos en las flotas se ha mantenido a niveles estabilizados según regulación. Lo anterior implica que la capacidad de pesca existente puede estar significativamente sobre dimensionada si es que en efecto el stock ha entrado en un período decreciente de abundancia.
Considerando el proceso de aumento de la capacidad de pesca en la pesquería y la disminución de la abundancia, se considera como preocupante que la mortalidad de pesca (F) haya alcanzado niveles de 0,53 por año, cuando dicha mortalidad no debería exceder a aquella correspondiente a la mortalidad natural de la especie (M = 0,35 por año) si es que se desea alcanzar niveles máximos de producción biológica de la especie.
Cabe destacar que los desembarques en la última temporada de pesca disminuyeron en un 27 por ciento con respecto al año anterior, lo cual pudiera deberse a efectos regionales del reclutamiento de la especie.
La preocupación del Estado por mejorar la administración de la pesquería se ve reflejada en una serie de nuevas implementaciones de políticas y estrategias de manejo. Entre estas se encuentra la adopción de una cuota anual de pesca que se define mediante las características de cambio del reclutamiento, de la explotación de las cohortes y de los cambios del ambiente, lo cual representa una adopción de proyecciones de captura en forma dinámica y en concordancia con los procesos naturales del recurso y de su explotación. También se ha implementado una veda total la cual viene a proteger en forma significativa la explotación del recurso durante los períodos de máximo reclutamiento y desove.
Por ultimo, existe un marco de referencia legal importante mediante el Decreto Ministerial No. 100-2001, el cual da los lineamientos de política para el uso sostenible de los recursos pesqueros del país. Con este marco es posible incrementar en forma eficiente los nuevos mecanismos de manejo pesquero que la pesquería pudiera requerir.
Problemas y Recomendaciones en la Pesquería de Langosta Espinosa en el Caribe de Nicaragua
Problemas
Falta de presupuesto para la realización periódica de los trabajos de campo (muestreos biológicos a bordo y en plantas de proceso) La pesca artesanal continua siendo de libre acceso lo cuál esta provocando un incremento descontrolado del esfuerzo de pesca, en la actualidad los artesanales están desembarcando alrededor de un 50 por ciento del total capturado. Falta de control en lo relacionado con la captura de individuos menores de la talla mínima legal y de hembras en estado de reproducción.

143
No se cumple la regulación relacionada con el número de nasas o trampas que debería usar cada embarcación. Falta de cumplimiento del Acuerdo Ministerial que prohíbe el ingreso de más embarcaciones a la pesca por buceo. Falta de educación de los pescadores artesanales e industriales en lo relacionado con la biología del recurso.
Recomendaciones
Solicitar el apoyo monetario de la empresa privada para poder realizar de manera periódica los muestreos biológicos y de la recolección de toda la información necesaria para evaluar el estado de explotación del recurso. Regular el acceso a la pesca artesanal mediante un sistema de licencias o permisos. Se podría implementar un cobro por permiso que ayudaría al Centro de Investigaciones Pesqueras en la realización periódica de los trabajos de campo. Aplicación de un sistema de recolección de datos relacionados con el esfuerzo pesquero artesanal. Reducir paulatinamente la pesca industrial de buceo y no permitir el ingreso de más embarcaciones. Aplicar métodos indirectos de regulación del esfuerzo de pesca tales como la aplicación de vedas permanentes o temporales en áreas previamente identificadas con mayor abundancia de pre-reclutas y reclutas, para esto se deberá de estructurar un sistema robusto de vigilancia para hacer cumplir las regulaciones. Fortalecer la aplicación del sistema de cuotas anuales globales de captura mediante la aplicación de modelos de pronóstico de captura. Brindar capacitación y educación ambiental a pescadores, en cooperativas y comunidades pesqueras con el fin de dar a conocer la importancia de respetar las regulaciones pesqueras establecidas.
Referencias
Barnutty, R. 2000. Aplicación de un modelo de análisis de cohortes a la pesquería de langosta espinosa Panulirus argus del mar Caribe de Nicaragua. Inf. Tec. CIPA.
Barnutty, R. 2001. Evaluación del estado actual de explotación del recurso langosta del mar Caribe de Nicaragua y cálculo de la cuota biológicamente aceptable para el período biológico junio 2001-mayo 2002. CIPA agosto 2001.
Barnutty, R. y Pérez Moreno, M. 2001. Informe nacional de Nicaragua. FAO Fisheries
Report No. 619: 252-254.
Castaño O. y Cadima, E. 1,993. Biología y evaluación de la langosta espinosa (Panulirus
argus) Simposium sobre evaluación y manejo de las pesquerías de crustáceos en Nicaragua 6 y 7 de diciembre de 1993.
Ehrhardt, N.M.; Barnutty, R.; Velásquez, L. y Gutiérrez, R. (en prensa). Algoritmo para la estimación de cuotas globales anuales para las pesquerías de langosta y camarón de Nicaragua.

144
Ehrhardt, N.M. y Legault, C.M. 1996. Crustacean stock assessment techniques incorporating uncertainty. pp. 111-131 In: Report of the WECAFC Ad Hoc Shrimp and Groundfish Working Group of the Guianas-Brazil continental shelf and CEFRAMP Shrimp and Groundfish Subproject Specification Workshop. Port Spain, Trinidad and Tobago. 8-12 January 1996. FAO Fisheries Report No. 544. Supplement.
Martínez, C.S. 2001. Informe de Nicaragua sobre la langosta del Caribe. FAO Fisheries
Report No. 619: 238-251.
Pauly, D. 1983. Length-converted catch curves. A powerful tool for fisheries research in the tropics. (Part I). ICLARM Fishbyte 1 (2): 9-13.
Sparre, P. y Venema, S.C. 1995. Introducción to tropical fish stock assessment. Part 1. Manual. FAO Fisheries Technical Paper No. 306.1, Rev. 1: 376 p.
ORGANIGRAMA PARA LA TOMA DE DECISIONES RELACIONADAS CON LOS ASPECTOS DEL SECTOR PESCA EN NICARAGUA
Ministerio de Fomento Industria y Fomento MIFIC (Ministro)
(Toma de decisiones)
Dirección General de Recursos Naturales
(Toma de decisiones)
Dirección de Políticas y Normas
Administración Nacional de la Pesca y Acuacultura ADPESCA
(Toma de decisiones)
Centro de Investigaciones Pesqueras y Acuícolas CIPA

145
13. REPORT ON THE LOBSTER FISHERIES OF SAINT LUCIA
Williana Joseph28
Description of the Fisheries
The Caribbean spiny lobster, Panulirus argus (Latreille, 1804) fishery is one of the most important in the nearshore of St. Lucia, second only to the conch fishery in terms of landings (see also Joseph, 2001). However, its socio-economic importance is more wide scale than the conch fishery in which only 20 fishers participate compared to several hundreds in the lobster fishery (Joseph, unpublished).
P. argus is the most abundant and commercially important of the three Panulirus species (P.
argus, P. guttatus and P. laevicanda). However, P. guttatus is protected from commercial exploitation since it rarely attains the legal size limit of 95 mm CL (carapace length)29. The majority of Caribbean lobster landings come from traps set in depths in excess of 30 m (Luckhurst and Auil-Marshalleck, 1995). Previously lobsters were fished with trammels nets, which are now banned from the island fishery, however, they are still used illegally on a small scale. Caribbean spiny lobsters are also fished with spear guns by recreational fishers, although this practice is also illegal.
0
5
10
15
20
25
30
35
40
91 92 93 94 95 96 97 98 99 00 01
Years
Pro
du
cti
on
(t)
0
200
400
600
800
1,000
1,200
1,400
Valu
e $
EC
'000
Production (t) Value $EC '000
Note: 1 US$ = $2.67 EC Prices range from EC$ 12-20 /lb or US$ 10-16 /kg Source: Department of Fisheries
Figure 1. Annual production and value of spiny lobster in St. Lucia, 1991-2001
Despite some annual variability in the transition in terms of time, the fishing year in Saint Lucia is divided into two seasons: a “high” season which extends from December to May, when significant landings of offshore migratory pelagics occur and a “low” season which extends from June to November, when large quantities of demersal species are landed. The fishery for lobster sustains important artisanal fisheries during the “low” fishing season, June to February.
28 Ministry of Agriculture, Forestry and Fisheries, Pointe Seraphine, Castries, E-mail: [email protected]. 29 CL mid dorsal distance from the anterior edge of the cephalothorax (between the supraorbital rostal spines) to the posterior edge of the cephalothorax.

146
Yield has increased significantly over the past; although the extent of the increase is not reliably known. Fig. 1 gives an indication of the annual production of P. argus between 1991 and 2001 giving an average annual production of 20 tonnes during this period.
To a great extent lobster catches are under-recorded since they tend to be concealed from data collectors, but recent improvements in the data collection system and the implementation of education and awareness programmes in fishing communities, with a main thrust on the importance and need for obtaining reliable fisheries data, will hopefully address this limitation.
Mahon (1990), estimated an annual yield of 1 039 toneladas of lobster resources for the Lesser Antilles region, with Saint Lucia having an annual yield of 26 tonnes based on yield estimates of 0.05 tonnes km2 of shelf area. He cautioned the use of this estimate in developing management strategies for this fishery since it is an approximation, but instead, suggested that the value should only be used as a guide in more refined estimation of yields.
From as early as July, during the closed season (1 May-31 August), lobsters caught tend to be stockpiled in holding traps in shallower waters close to shore until the start of the open season. This practice of “stockpiling” is also done during the fishing season until fishers have sufficient lobsters to sell to the middlemen, hotels and restaurants, who are the main purchasers. Despite, it being illegal to harvest berried and undersized lobsters, some fishers keep them in traps as attractants and in the case of berried lobsters until they have spawned, which possibly leads to a high rate of mortality of undersized and berried lobsters (Joseph, 2000).
Management Regulations/Strategies
Fishing in Saint Lucia is still largely open access, and so by extension is the lobster fishery, therefore, the potential effort that can be applied to this fishery is high. The lobster fishery is closed from 1 May to 31 August.
The Department of Fisheries, recognizing the need to reduce effort in the near shore fishery implemented a limited entry system for the pot fishery (the main gear used for lobsters) for 2000. Funding for implementing this management regime was provided by the European Union as part of the Sustainable Fisheries Development Project. The main objectives for implementation of such a management measure were to address the problem of over-fishing plaguing this fishery, due to the continued use of illegal mesh sizes for fish pots, the open-access nature of the fishery, the recurrent problems of theft of gear and catch, incidental ghost fishing and declining catches. A collaborative approach for developing conditions for the management regime was used (Department of Fisheries, 1999).
In 1999, prior to its implementation, consultations were held with resource users, mainly pot fishers, funded by the British Department for International Development through the Organization of Eastern Caribbean States-Natural Resource Management Unit (OECS-NRMU)30 (Department of Fisheries, 1999). The benefit of such an approach is that the resource users are directly involved in the identification of a strategy for sustainable use, resulting in greater compliance when implemented. Consequently, this management regime was first implemented in 2000, in the southern half of the island, where the largest pot fishing
30 Now OECS Environmental Sustainable Development Unit (OECS-ESDU).

147
communities exist and the following year, it was implemented nationally. The following list of requirements and conditions were mandatory in order for fishers to qualify to engage in the fishery:
Fishing vessels must be registered and licensed. Only full time traditional pot fishers will be licensed to engage in this fishery. Pot fishers must have at least 15 pots. Pots and buoys must be clearly marked with identification tags, i.e. PVC tags with vessel identification number on it to allow for effective enforcement. (Funding covered the cost of supplying PVC for the first year only). All pots must have degradable panels and must not be constructed with mesh smaller than 1 1/4 in (3.2 cm). No undersized lobsters should be kept in holding pots. Pot fishery licenses must be presented during any sale or trade in lobsters.
Further, the Department also adopted a policy of discouraging and denying new entrants to fishing access to pot fishing.
Table 1. Number of pots and vessels issued with permits in two consecutive fishing periods when a limited entry system was implemented
2000-2001 2001-2002
Community Number of pots tagged
Numberof vessels
Number of pots tagged
Number of vessels
Denney 160 4 150 10
Laborie 655 17 102 6
Micoud 200 6 155 6
Praslin 420 10 141 6
River Doree 130 3 50 2
Savannes Bay 460 11 20 1
Vieux Fort 410 11 82 4
Banannes - 133 12
Castries - 47 3
Gros Islet - 74 6
Total 2 435 62 964 56
Average No of pots/vessel 39 17
In the first year of its implementation, the response of pot fishers was encouraging, since they believed that the new management regime would solve the chronic problem of pot theft. However, the level of surveillance and enforcement needed to ensure that access was truly restrictive was not realized; but some level of success in enforcement was achieved. In addition, a system was put in place to verify that persons selling lobster were authorized individuals but given that in its inception the permit system for fishers and middlemen was confined to the south of the island in the first year, this system was challenging to manage. The response from key purchasers was encouraging since they supported the initiative by requesting all persons trading in lobsters to produce identification cards and valid permits.

148
The following year, although the limited entry system was implemented island-wide, there was a lot of resistance from fishers of the southern part of the island mainly due to unwillingness of fishers to cover the cost of the gear identification (ID) tags combined with their experiences of the previous year regarding surveillance. The ID tags are critical for enforcement. This is clearly illustrated in Table 1 since the number of pots and vessels participating in the system decreased drastically in the second year compared to the first year, because pot fishers had to clearly mark their pots and the Department could only license fishers that complied with all the conditions.
In the third year of its implementation, fishers’ response was very poor such that the Department decided to place the limited-entry system on hold whilst exploring other management options. Nonetheless, the information gathered during this short period would guide future management decisions on the pot fishery.
Biology
From September 1996 to April 1999, as part of a subproject jointly funded Government of Saint Lucia and CARICOM Fisheries Resource Assessment and Management Program (CFRAMP), a total of 6469 lobsters, P. argus were sampled at two sites, River Doree in the southwest and Savannes Bay in the southeast, from commercial Antillean Z-traps deployed off the southwest and southeast coasts of Saint Lucia in areas fished by commercial trap fishers, at depths ranging from 5 to 50 m. Traps were set 0.5-1.0 n.mile offshore during the latter period of the fishing season due to strong currents, but at the beginning of the season traps were set up to 2.75 n.miles offshore.
The first component of the subproject, biological data collection programme, involved sampling lobsters landed at the two landing sites during the open season, 1 September to 30 April. Carapace lengths (CL) were measured to the nearest mm with steel vernier calipers. In addition, observations on sex, weight, presence of a spermatophoric mass (tar spot) and associated conditions (intact or eroded) were recorded for females (Anon., 1996a).
The second component of the subproject, the maturity study, involved year-round sampling at sea by fishers, under regular supervision by staff of the Department of Fisheries from the above-mentioned two sites in the south. Data on carapace length, sex and weight were obtained for all lobsters. However, females were further examined for the presence of eggs (ovigerous) or spermatophoric mass (deposition of spermatophores on the sternum). Eggs were described as orange (freshly laid) or brown (ready to hatch) and spermatophores were described as intact (pre-fertilization) or eroded (post-fertilization) (Anon, 1996a). Caribbean spiny lobsters sampled at sea were tagged by perforation of a hole in the telson to avoid double sampling, particularly during the closed season. P. argus less than 95 mm were returned after observation however, during the closed season, all lobsters were returned. In addition, effort data collected included estimation of depths where traps were set, number of traps hauled, soak time and estimated total catch. At least four sampling trips were conducted each month and all lobsters caught in the traps were sampled.
During the closed season, depending on weather conditions, mainly sea current state, traps were moved closer to shore to prevent high pot loss. In 1998 during the closed season, traps were set in a sheltered bay in the southeast, seaward of the second largest mangrove forest, in depths ranging from 2.5 to 5 m in an effort to obtain data on juveniles. Fishers at this site occasionally set their traps at greater depths, but they use shallower depths for storage of traps for “stock piling”. All data collected were processed with Trip Interview Program (TIP)

149
software. Data collected were analyzed by fisheries biologist, Williana Joseph, whilst pursuing an MSc. Below is a summary of some her findings.
Size Composition
Joseph (2001) reveals that populations of P. argus exploited in the waters south of Saint Lucia comprised a high proportion of small lobsters, 90-110 mm CL size class. This may be a result of the selectivity of the gear, however, it may also be due to high exploitation levels; the majority of larger individuals have been removed from the population and the fishery is basically dependent on individuals in these size classes. Further, the mean CL of lobsters landed in the southwest was much lower than the mean CL of lobsters landed on the southeast and at both sites, there was a decrease in mean CL to below the minimum legal size, concomitant with an increase in the number of under-sized Caribbean spiny lobsters landed as the fishing season progressed.
In the southwestern site, on average, 44 percent of the landings were of under-sized31 lobsters, whilst on the southeastern site, on average 20 percent of the landings were undersized. Results of the maturity study, however, indicated that the mean CL of lobster in the southeastern fishing area was lower than the southwestern fishing area (both sexes combined), and the average proportion of undersized lobsters was higher in the southeast (62%) than the southwest (45%). A decrease in CL as the fishing period progressed confirms this trend observed in landings during the fishing season for both sites.
The main factors that influence the size composition of the landings are the availability of spiny lobsters of different size classes, selectivity of the gear and adherence to management measures. On the other hand, the main factors that influence size composition of the catch are the availability of individuals of different size classes and the selectivity of the gear. At the southwestern site, the occurrence of undersized lobsters in the landings was considerable, particularly, towards the end of the fishing period possibly due to disregard by fishers of the minimum size regulation. Although undersized lobsters in the maturity study in the southeast were high, the landings did not reflect this trend. One could then reasonably conclude that the fishers in the southeast either adhere more to the fisheries regulations by not landing high proportions of undersized lobsters or effectively concealed such landings.
Joseph (2001) concluded that the high proportion of under-sized lobster found in the landings in the southwest and in the maturity study in both areas has serious implications to the long term sustainability of the population such as: increased mortality of juveniles; decreased yield and potential economic returns compared to if the lobsters were allowed to remain longer in the fishery; the effect on spawning biomass if the undersized lobsters caught are below the size of sexual maturity. In addition, this trend also indicates a strong recruitment of juveniles into the population despite the high mortality of the undersized lobsters.
Basically, three factors can contribute to a decrease in mean carapace length during the fishing season - the arrival of new recruits, the migration of larger berried lobsters offshore to spawn in more favourable environments and the avoidance of the gear by larger berried females. Also an increase in the monthly mean size could be as a result of growth, movement of larger lobsters to this area. Generally, the results of the maturity study showed a decrease in mean carapace length and an increase in the proportion of undersized lobster in the catch towards the end of the fishing season, thus it is reasonable to conclude that the end of the
31 Under-sized refers to lobster of less than 95 mm CL.

150
fishing season, January to April coincided with the period of recruitment into the fishery (arrival of new recruits into the fishery).
These findings have serious implications for the management of the spiny lobster fishery in Saint Lucia, since management strategies are general implemented to reduce mortality of undersized lobsters, as defined by the Management Plan, by possibly implementing measures, which would allow in the first instance, the proportion of undersized lobsters retained by the gear to be greatly reduced. Second, to strictly enforce the regulations to limit the landing of undersized lobsters and third, to consider a closed season that includes the months January to April, when the proportion of undersized spiny lobsters in the catch is quite high. Such an extended closed season would be effective in allowing the undersized lobsters to grow to larger sizes, which would then contribute to higher yields.
Seasonality of Reproduction
Analyses of reproductive activity of Caribbean spiny lobsters at two sites in Saint Lucia (Joseph, 2001) strongly suggest a year round activity, which supports traditional ecological knowledge, since fishers encounter breeding or berried females all year round. However, peak periods of breeding were also identified, which were dissimilar at the two sites.
The analysis also revealed annual variability in reproductive activity of P. argus based on the presence of berried females, which was more pronounced in southeast than the southwest. A similar trend in breeding activity was obtained with peak breeding periods being February, August-December and an absence of breeding females, in March to July. A different picture of reproductive activity in the southwestern area emerged with at least 20 percent of females being berried all year round, but with an extended period of high activity from March to July. Similar year round trend for breeding was found at this site.
Joseph (2001) states that based on the evidence, trends in reproductive activity are dissimilar at the two sites, and if two different populations are assumed, then it may be appropriate to consider that periods of peak reproductive activity for P. argus are in February and August to December for the southeast, whilst in the southwest, reproductive activity is year round, with a peak from March to July. Joseph (2001) further states that this evidence has serious implications for management, particularly, in the timing of the closed season, since the main objectives of implementation of seasonal closures in fisheries are to protect the breeding adults and prevent disturbance at a crucial time in their life cycle. Thus, for effective management, seasonal closure should at least coincide with the peak periods of spawning or breeding activity. However, results from this analysis indicate the contrary, that is, the current closed season (May-August) coincides with a period when very few or no berried spiny lobsters were encountered in the catches (maturity study) in the southeast. In order to protect the breeding adults in the southeast, management would have to consider revision of the closed season to August-December, which coincides with the periods of peak reproductive activity for the southeast. This is in contrast to the results from the southwest (Joseph, 2001), which suggest both year round breeding and spawning for female P. argus,with peaks in January, and from March to August when more than 20 percent of the females are berried.
The year round breeding and spawning of P. argus is in keeping with the studies of reproductive activity of P. argus in the Caribbean (Peacock, 1974; FAO, 1968; Munro, 1974; Feliciano, 1958). This continuous reproduction is due to the stable environments of the tropics (Cushing, 1975). The prolonged peak period of activity (berried females) occurred within part

151
of the legal closed season and therefore affords some protection to spawning individuals during this critical time in their life history.
Joseph (2001) proposes a possible explanation for the dissimilarity in reproductive activity observed at the two sites: the southeast and southwest are different habitats for the same population of P. argus. The southeast fishing area is in close proximity of a nursery habitat (mangrove forest) and it has a shallower depth profile than the southwest. This, combined with results from the maturity study, which found high proportions of undersized lobsters in the catch at this site and low incidence of breeding and berried females, all support the possibility of the southeast area being mainly a juvenile habitat.
Conversely, evidence from the study indicates that the southwest is a breeding habitat due to its greater depths, combined with considerable high proportions of breeding and berried females that were found all year round.
Joseph (2001) recommends further research to validate the period of reproductivity and to determine true causes for the differences in reproductive activity at these sites.
Size at First Maturity
Berried lobsters were observed in all class ranges between 71 and 145 mm CL. The size at first maturity for the southwest was undetermined due to low sample numbers and unrepresented size classes. Using the size that corresponded to 50 percent of berried lobsters in the peak spawning periods, the size at first of maturity in the southeast was 102 mm CL. This size at first maturity is higher than values reported for the region, which ranged from 45-90 mm CL. For heavily fished populations such as in Saint Lucia the size at first maturity should be much lower, which would support results of research conducted on heavily fished populations (Joseph, 2001).
If 102 mm is considered as the size of sexual maturity of P. argus in the southwest, then the present legal size limit (95 mm) is below it and thus a large proportion of immature lobster are not allowed to spawn at least once before capture. The fishery could then be seriously affected if exploitation levels led to a significant reduction in the population of the egg-producing individuals. In such a situation, the theoretically simple solution for management is increasing the size limit to above the size of sexual maturity. Implementing such a measure would be challenging.
However, several authors (Chittleborough, 1974, 1976; Peacock; 1974; Kanciruk and Herrnkind, 1976; Aiken, 1977; Gregory et al., 1982; MacDonald, 1982) have adopted the approach of determining size at first maturity from mated, but non-berried lobsters combined with berried females and proposed that it is best for providing management advice. Consequently, in the same southwest area Joseph (2001) also applied that criterion and found that the size at first maturità at which 50 percent of the individuals were breeding (mating = mature) to be 65 mm CL. This value is within the range of sizes obtained for the size at first maturity of P. argus in the region.
Closer examination of the two data sets revealed that mated females were between 42 and 165 mm and berried females between 71 and 145 mm. Therefore, 65 mm is the better estimate of the size of maturity of female P. argus in the southwest. It is well below the legal minimum size (95 mm), which thus affords considerable protection to females and allows for sufficient reproduction to replenish the (population) stocks.

152
During this workshop the size at first maturity was also estimated using a maximum likelihood model with data from the maturity study. The size at which at least 50 percent female lobster would have mated at least once was estimated to be 90-95 mm CL.
0
0.1
0.2
0.3
0.4
0.5
0.6
0.7
0.8
0.9
1
1.1
32.5
42.5
52.5
62.5
72.5
82.5
92.5
102.5
112.5
122.5
132.5
142.5
152.5
Mid -Size Classes (mm)
Pro
po
rtio
n o
f lo
bs
ters
Rejects Tar Spot Prop. Tar Spot Cum. p (sigmoid)
Figure 2. Plots of proportion of female spiny lobsters with tarspot at various mid-size (CL) class intervals. Mid-size class at which 50 percent were found with tar spot is 92.5 mm and 40 percent is 82.5 mm
Available Data and Recent Developments
In addition to several years of catch data and annual length frequencies during the open season, Table 2 gives an indication of available lobster data. After 1998, the collection of maturity data was terminated. The Department was awaiting the results of the two studies in order to guide and develop a monitoring regime for spiny lobsters in Saint Lucia.
Recent developments include implementation of a limited entry system for the pot fishery for two consecutive fishing periods, followed by open access in 2002. However, although management policy discouraged new entrants into the fishery, lack of surveillance and enforcement negates the effectiveness of such a policy (see above).

153
Table 2. Summary of data collected on spiny lobsters, 1996-1998
Biological data on spiny lobster landed Maturity data on spiny lobster collected at sea
Carapace length (mm) Carapace length (mm)
Sex Sex
Weight (g) Weight (g)
Presence of spermatophoric mass Presence of spermatophoric mass
Condition (intact or eroded) Condition (intact or eroded)
Presence of eggs (ovigerous)
Status of eggs (orange or brown)
Effort data (depth, number of pots hauled, soaked time, total catch) and location
Two surveys were conducted to obtain fisher’s and purchaser’s perceptions of the status of lobster fishery, the timing of the fishing period, management measures and awareness of these measures, product preference and preferred time of purchase. Preliminary analyses of the data have been conducted, however results of the survey have not been finalized.
Catch Rates
Data from the maturity study (Joseph, 2001) were used to give preliminary estimates of catch rates, since previously this could not be determined from information gathered from the landings due to the practice of stockpiling by fishers. Increased catch rates occurred at different times for the two sites under consideration. In the southwest an increase in catch rates at the end of the season (December-April) corresponded to an increase in the occurrence of juvenile lobsters. In contrast, increased catch rates observed for the southeast occurred at the beginning of the fishing period (August-December).
Joseph (2001) reports that greater effort was deployed in the southeast than the southwest and during the first three months of the fishing season, effort in the southeast was almost three times more than in the southwest. Trends in catches followed a similar pattern with high catches during the first three months of the fishing period and low catches thereafter. There was a general trend of increased effort immediately preceding and during the first three to four months of the fishing season (July-December) at both sites. This increased effort, however, did not necessarily result in increased catch. A decrease in catch and effort was also found during the second half of the fishing season. The mean catch (or catch rate) was considerable greater in the southwest (0.94 kg/trap) than the southeast (0.58 kg/trap). Annual variability in catch rates was observed and indicated higher catch rates from November to April of each year for the southwestern area compared to the southeastern area, where greater catch rates were observed from August to December.
Joseph (2001) identified the following issues that impact on the lobster fishery based on the current fisheries policies, knowledge of the fishery, fishing practices, current management action plan and the results of her study in an effort to rationalize the continued exploitation of the spiny lobster resource and ensure its sustainability. She advised that these issues are critical and must be adequately addressed for the sustainability of the spiny lobster fishery:

154
High incidence of undersized P. argus in the landings means that fishers are not adhering to the minimum size regulation.
A high proportion of lobsters captured is undersized, which indicates that the current mesh size is not large enough to allow for the escape of undersized lobsters. Also, if these undersized lobsters are retained in the traps as attractants then they would still be subjected to a higher level of mortality than would be normally expected in the wild, as a result of injury, starvation and predation.
A high proportion of undersized lobsters is captured towards the end of the fishing season, which may indicate movement of new recruits into the fishing area.
The practice of confinement of berried females in traps until they have spawned and the removal of eggs have serious implications for the future of the resource whether recruitment is local or regional.
Lack of enforcement of the regulations at sea. Enforcement is a very difficult and expensive task, since most times fishing takes place in isolated areas and potential perpetrators would not be breaking the law in the presence of the enforcement team.
Continued increased fishing pressure on the already overexploited inshore resources due to the increase in artisanal fishers. In the low period of fishing for offshore pelagic species many fishers resort to inshore resources to service their financial commitments due to the unavailability of alternative employment. A survey carried out in 1990 revealed that of the 92.5 percent full time fishers, 62.7 percent were not engaged in alternative employment as a result of lack of alternative employment opportunities (Tabor, 1990). In addition, a lack of occupational mobility of fishers was observed by Murray and d’Auvergne (1994) and Mc Goodwin (1989). If this were still true, then any increase in the fleet would, in effect, translate to an increase fishing pressure on the already over-exploited inshore resources.
The current management plan proposed the development of a fishery for P. guttatus, imposing a minimum size limit and a closed season, but biological information on the population is critical to allow for its sensibly exploitation. The following questions need to be answered with some measure of certainty before one could rationalize the exploitation of this population: What is the standing crop and sustainable yield? What level of fishing can it support? The current mesh size excludes P. guttatus from the catch, will a new gear be introduced for this fishery or would the present gear be modified by decreasing the mesh size to allow for its capture?
Lack of information on the current levels of effort employed or catch rates to determine optimum fishing levels. Fishers have complained that more traps are needed to sustain the level of catches. Therefore, at what level of effort are these catches being maintained?
How to limit entry into a subcomponent of a non-selective gear fishery without limiting entry to the entire pot fishery causing socio-economic hardship to the already economically-marginalized coastal communities? Pot fishing has been a

155
major component of the fishing industry, in addition to it being carried out all year round from small landing sites by fishers who cannot muster the capital to invest in other fisheries and experienced fishers who can no longer go offshore to fish. It also supplements the income of offshore pelagic fishers during the “low” season.
An issue that has surfaced in recent times, as a result of conch harvesters from the north of the island expanding their operation to the south is that lobster fishers from the south have reported reduction in catches coinciding with the increased activity of the conch harvesters. The lightly exploited conch population in this area previously provided a refuge for juvenile lobsters. Therefore, is substrate the limiting factor? If this is the case then management could consider setting up puerulus collectors to enhance the population biomass.
The beginning of the fishing season for lobsters does not coincide with the beginning of the pot fishing season, therefore fishers practice “stockpiling”of lobsters before the beginning of the lobster fishing season. This practice leads first, to excessive mortality and malnourishment and translates to loss of potential earnings by fishers. Second, it extends the actual fishing season by at least two months. So in reality there is a foreshortened closed season. In assessment of the resource, management will have to include this extension in order to obtain an accurate picture of the performance of the fishery. Incidence of illegal landings during this period has been noted but the extent and scale are unknown. Poaching has also evolved with this practice resulting in increased pot theft and loss of investment by fishers. Therefore fishers may be faced with a situation of having to make a choice between loss of investment and flaunting the law.
Peak periods of spawning in the southeast were in February, and September to December, which is during the fishing season, therefore spawning individuals are not protected during this critical time in their life cycle and the effects of fishing on the population during this time. In the southwest, although breeding and spawning were year round, peak periods of spawning were found in January, and March to July. Therefore, peak periods of spawning span the end of the fishing season and the closed season. The current closed season therefore affords some level of protection to the spawning population. Changing the closed season to coincide with the pot-fishing season would not result in any further protection of the spawning stock than the current closed season. However, it may reduce pot theft, high mortality of adults and juveniles that occur during stock piling and protect new recruits into the fishery during the period of high incidence of juveniles at the fishing grounds.
To effectively manage any fishery, and to assess the effectiveness of management measures, the collection of appropriate data is essential. However, although a data collection system was first implement in 1989, little, if any, reliable information has been collected on the lobster fishery prior to this three-year study, to assess its status and to determine the effectiveness of management measures. The need to devise, incorporate and sustain data collection on the lobster fishery is vital for the long-term management and for achieving sustainability of the resources.
The size at first maturity estimated for the P. argus population in the southwest is 65 mm CL and that is below the minimum legal size, which is the ideal for management. However, from a fishery perspective, has the size limit been set too

156
high above the size at first maturity? What is the ideal minimum size that would ensure adequate recruitment and allow fishers to economically exploit them? If the size limit is set too high then protection may be too great, resulting in unnecessary enforcement, reduction of catch and loss of earnings by fishers.
Inadequate knowledge of existing habitats of spiny lobsters and migration patterns within the island’s EEZ.
Lack of scientific and economic information to rationalize and support implementation of difficult management strategies to ensure the sustainability of the fishery.
Lack of information on circulation and currents patterns in the Caribbean with regards to the supply of larvae, their distribution and settlement is one of the major issues to be considered in management of this resource (Mahon, 1993) in order to guide the development and implementation of management strategies regionally or nationally.
Status of the National Spiny Lobster Resource
Caribbean spiny lobster populations are heavily exploited and increased exploitation has been observed over the past five years. Concerns in this regard have been expressed by both management and fishers, however efforts by management to curtail or keep the level of effort constant have not been successful due to both financial and technical resource limitations and failure of pot fishers to unanimously sustain the limited entry system. Local studies have given strong indications of issues that urgently need to be considered with regard to implementing key management measures. Given the socio-economic significance of the lobster fishery, the Government has to continue regulating the fishery.
Social and Economic Status and Importance of the Fisheries
Fishing, although still artisanal in nature, is an important social and economic activity in Saint Lucia and supplies fish for the increasing tourism industry, local consumption and more recently, the export market. The main fisheries of the island are large migratory pelagics (tunas, dolphin, wahoo, bill fishes and shark), small coastal pelagics (jacks and flying fish), molluscs (conch), demersal fish (snapper and other reef species) and crustaceans (spiny lobster).
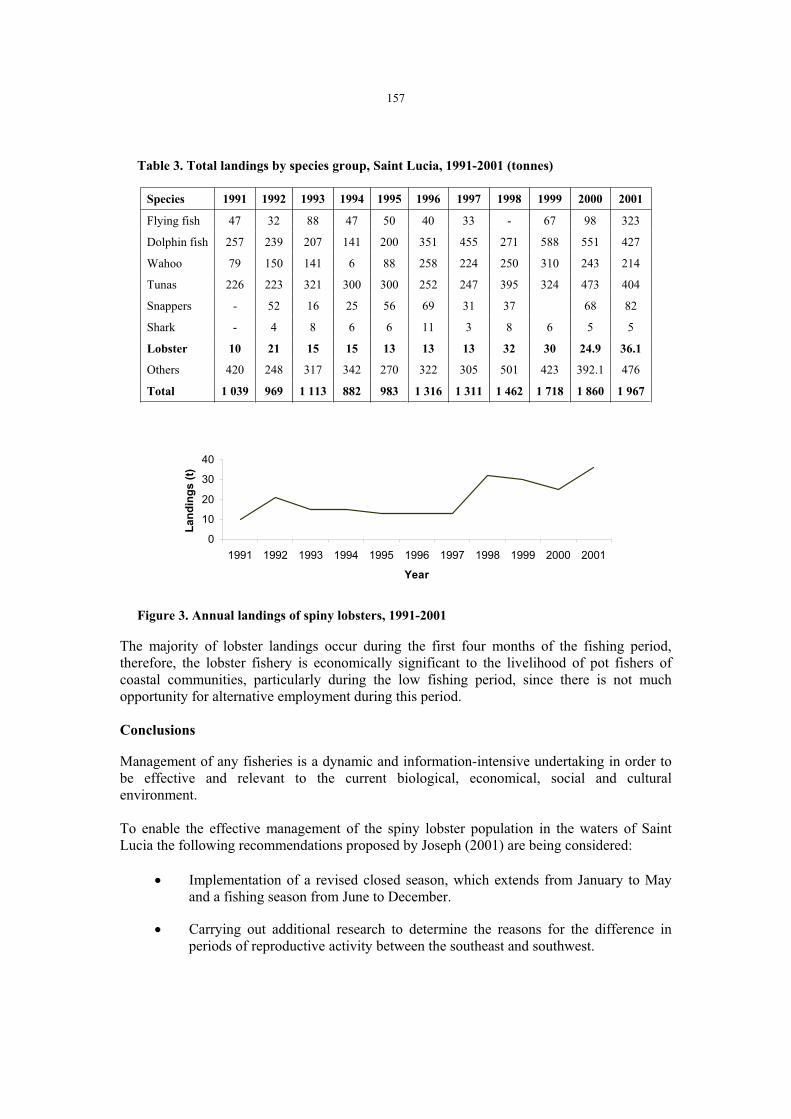
Table 3 indicates a steady increase in overall landings during the eleven-year period (1991-2001); however, although there was an overall increase in lobster landings during the same period, landings increased by almost 100 percent in 1998 but decreased in 1999 and 2000, followed by an increase in 2001 (Fig. 3).
157
Table 3. Total landings by species group, Saint Lucia, 1991-2001 (tonnes)
Species 1991 1992 1993 1994 1995 1996 1997 1998 1999 2000 2001
Flying fish 47 32 88 47 50 40 33 - 67 98 323
Dolphin fish 257 239 207 141 200 351 455 271 588 551 427
Wahoo 79 150 141 6 88 258 224 250 310 243 214
Tunas 226 223 321 300 300 252 247 395 324 473 404
Snappers - 52 16 25 56 69 31 37 68 82
Shark - 4 8 6 6 11 3 8 6 5 5
Lobster 10 21 15 15 13 13 13 32 30 24.9 36.1
Others 420 248 317 342 270 322 305 501 423 392.1 476
Total 1 039 969 1 113 882 983 1 316 1 311 1 462 1 718 1 860 1 967
0
10
20
30
40
1991 1992 1993 1994 1995 1996 1997 1998 1999 2000 2001
Year
Lan
din
gs (
t)
Figure 3. Annual landings of spiny lobsters, 1991-2001
The majority of lobster landings occur during the first four months of the fishing period, therefore, the lobster fishery is economically significant to the livelihood of pot fishers of coastal communities, particularly during the low fishing period, since there is not much opportunity for alternative employment during this period.
Conclusions
Management of any fisheries is a dynamic and information-intensive undertaking in order to be effective and relevant to the current biological, economical, social and cultural environment.
To enable the effective management of the spiny lobster population in the waters of Saint Lucia the following recommendations proposed by Joseph (2001) are being considered:
Implementation of a revised closed season, which extends from January to May and a fishing season from June to December.
Carrying out additional research to determine the reasons for the difference in periods of reproductive activity between the southeast and southwest.

158
Conducting further research in situ to determine and verify the size at first maturity using other indicators such as the presence of developed ovaries or the presence of ovigerous setae, because two significantly different values were obtained. It is critical that the accurate size at first maturity be determined for the effective management of the resource. If the accurate size at first maturity is 102 mm then the minimum size is set below the size at first maturity which could lead to recruitment overfishing. On the other hand, if the size at first maturity is 65 mm then it would be possible to consider decreasing the minimum size limit to say 80 mm (from 95 mm), which is still above the size at first maturity-the ideal case for the effective management of the resource.
Continue to collect length frequency and tar spot data during the fishing season. During this workshop a reference point was developed as an indicator, at least in the short term, for managing the lobster resources. This reference point is: At least 40 percent of females within the 85-90 mm CL should be reproductive. If during monitoring this value falls below 40 percent then it becomes critical for management to implement stock recovery measures.
Implementation of a mechanism for limiting entry to the near shore fisheries resources, because of the non-selective nature of traps and the multi-species nature of the near shore fisheries and by extension the potential for over exploitation. Reducing effort on the spiny lobster resources can only be addressed within management of the entire near shore fishery. A possible mechanism could be licensing the existing fleet and immediately imposing a moratorium on new entrants into this fishery, then gradually reducing the number of license holders. However, the most acceptable method for restricting the number of users would be determined through consultation with fishers. In addition, conditions should stipulate a limit on the number of traps, and specifications for type of traps allowed, since limiting the number of entrants into this fishery would not necessarily limit the fishing pressure. Restrictions on fishing in the near shore area on the southeast coast since findings of the study confirmed that it is a nursery habitat for juvenile spiny lobsters.
Implementing measures to reduce the retention of undersized lobster in the catch such as: modification of the design and size of the escape gap or vent that would retain other economically valuable species, but not undersized lobsters; increasing the mesh size of traps. It is critical that serious consideration be given to this issue in the short term since current practices of fishing communities do not decrease the fishing mortality on spiny lobsters below the legal size limit. In addition, implementing awareness programmes informing both the public and the fishers of the benefits of adhering to the minimum size regulations.
Economic and fiscal incentives which would encourage fishing cooperatives and potential fishers to invest in semi-industrial vessels which would exploit off shore resources.. These vessels from the onset would be restricted from harvesting the near shore resources. In addition, disincentives should be implemented to discourage new entrants exploiting the near shore resource. (With the Government’s current policy for the fishing sector, a continued increase in the number of artisanal vessels should be expected.)

159
Improvement of the data collection system to incorporate adequate data collection on the spiny lobster fishery to allow for detailed, and continued assessment and monitoring of the resource.
Conducting further assessment of the fishery to determine exploitation levels, fishing mortality and age of the exploited population to refine management options so as to ensure the long-term sustainability of the fishery.
Revision of the management plan to integrate the management of the entire near shore resources as a single entity, rather than management of the near shore resources on a species by species basis. This is in keeping with the fact that most of the resources are exploited with the same gear and are considered over-exploited.
Regional Recommendation
The Caribbean region should continue to adopt a collaborative approach to management of the lobster resources due to the long planktonic life of spiny lobster larvae and the close proximity of the islands significant interchange of larvae between them that may occur. Therefore, all countries that exploit this resource should be included at regional forums such as this.
FAO and CFRAMP continue to collaborate in assisting countries to effectively manage spiny lobster resources of CARIFORUM countries.
References
Aiken, K.A. 1977. Jamaica spiny lobster investigations. Symposium on progress in marine research in the Caribbean and adjacent regions II, July, 1976, FAO Fishery Report.200. 11-22.
Aiken, D.E. & Waddy, S.L. 1980. Reproductive Biology. pp. 215-276 In: J.S. Cobb and B.F. Phillips (eds), The Biology and Management of Lobsters, Vol. I: Physiology and Behaviour. Academic Press, New York.
Anon. 1996a. Maturity Study for Spiny Lobsters in Saint Lucia: Project proposal and
Implementation Plan. CARICOM Fisheries Resource Assessment and Management Unit. Belize City.
Anon. 1996b. Logical Framework Approach. NORAD, 42 p.
Chittleborough, R.G. 1974. Western rock lobster reared to maturity. Australian Journal of
Marine and Freshwater Research. 27: 499-519.
Cushing, D. 1979. Fisheries Resources of the Sea and their Management. Oxford University Press. Oxford. 87 p.
Department of Fisheries. 1999. Report on the implementation of pot fishery licence in St. Lucia. (Unpublished)

160
FAO. 1968. Report to the Government of Belize on investigations into marine fishery management, research, and development policy for spiny lobster fisheries. Based on the work of W. H. L. Allsopp. FAO Development Programme Technical Assistant Report 2481. 95 p.
Feliciano, C. 1958. The lobster fishery of Puerto Rico. Proceedings of the Gulf and
Caribbean Fisheries Institute 10: 147-156.
Gregory, D.R.; Labisky, F. & Combs, C.L. 1982. Reproductive Dynamics of the Lobster Panulirus argus in South Florida Transactions of the American Fisheries Society. 111: 575.
Joseph, W.B. 1990. Assessment of the status of the Caribbean spiny lobster (Panulirus argus,Latrielle, 1804) fishery in St. Lucia and proposals for sustainable management. a Dissertation submitted in partial fulfilment of the requirements for the Degree of Masters of Science in Fisheries Science in the University of Hull.
Joseph, W.B. 2001. Saint Lucia country report. FAO Fisheries Report No. 619: 255-257.
Kanciruk, P. & Herrnkind, W.F. 1976. Autumnal reproduction in Panulirus argus atBimini, Bahamas. Bulletin of Marine Science, 26: 417-432.
Luckhurst, B. & Auil-Marshalleck, 1995. Subproject Initiation Mission report and Background Review for Spiny Lobster and Conch. CFRAMP Research Document No. 17. 54 p.
MacDonald, C.D. 1982. Catch Composition and reproduction of the spiny lobster Panulirus
versicolor at Palau. Transactions of the American Fisheries Society. 111. 694-9.
Mahon, R. 1990. Fishery Management Options for Lesser Antilles Countries. FAO Fisheries
Technical Paper No. 313. FAO. Rome.126 p.
Mahon, R. 1993. 1993. Marine Fishery Resources of the Antilles: Lesser Antilles, Puerto Rico and Hispanola, Jamaica, Cuba. FAO Fisheries Technical Paper. No. 326, FAO. Rome. 235 p.
McGoodwin, J.R. 1984. Study on the socioeconomic and cultural aspects of the fishing industry in St. Lucia. FAO Project Report GCP/STL/004/NOR. 118 p.
Munro, J.L. 1974. The biology, ecology, exploitation, and management of the reef fishes. Part V. 1 Scientific Report of the ODA/UWI Fisheries Ecology Research Project. 1969 1973. University of the West Indies. Zoology Department Research Report: 3. 1-57.
Murray, P.A. and d’Auvergne, C. 1994. The Fisheries of St. Lucia: some socio-economic considerations. Proceedings of the Gulf and Caribbean Fisheries Institute 43. 216-219.
Peacock, N.A. 1974. A Study of the Spiny lobster Fishery of Antigua and Barbuda. Proceedings of the Gulf and Caribbean Fisheries Institute 26: 117-130.
Tabor. C. 1990. The Bioeconomic Effects of Low Catches of Pelagic Fishes in 1989 in Grenada, St. Lucia and St. Vincent and the Grenadines. FAO Project Report (FAO:
TCP/RLA/8963) FAO. Barbados.

161
Walters, H.D.; Murray, P.A. & Pierre, W. 1990. Preliminary Study on the Economic and
Social Aspects of Small-Scale Fisheries in Saint Lucia. Prepared for Session of WECAFC Committee for the Development and Management of Fisheries in the Lesser Antilles. WECAFC/LA/90/3/C. St. Vincent.
SAINT LUCIA - FISHERIES MANAGEMENT DECISION MAKING MECHANISM
The numbers 1, 2 and 3 represent the paths of various decisions. For example, certain decisions are made by the Chief Fisheries Officer (CFO), whilst other decisions with national implications must be made by the Cabinet of Ministers.
Department of Fisheriesdevelops recommendations based on policy, FMP and analyses
Permanent Secretary (CFO) Draft recommendations submitted (Amended) Legislation gives CFO authority
Fishers and other Stakeholders Draft recommendations discussed comments incorporated
Minister (Parl. Sec.) Draft recommendations amended and finalized. Legislation gives Minister authority
Cabinet of Ministers
Final draft submitted to Cabinet (amended) Legislation gives Cabinet the authority
123
123
123
3
23

162
14. NATIONAL REPORT ON THE SPINY LOBSTER FISHERY OF THE TURKS AND CAICOS ISLANDS
Wesley Clerveaux 32, Rafael Puga and Paul Medley
Description of Fishery
The Turks and Caicos Islands (TCI) are a group of calcareous islands located at the southern end of the Bahamian archipelago in the Atlantic Ocean bisected by three shallow water banks: Caicos Bank, Turks Bank and Mouchoir Bank.
Industrial fishing for the spiny lobster (Panulirus argus) is based on the Caicos Bank the largest of the three areas of shallow water banks, with an area of approximately 6 500 km2. A small number of vessels periodically engage in subsistence level artisanal fishing in the Turks Bank, whereas the Mouchoir Bank is neglected because of its proximity to landing sites.
Economically, the spiny lobster fishery is the most important marine resource in the Turks and Caicos Islands and has played an integral part in the community for generations. Evidence of commercial exploitation (catch data) exists only from 1957, with corresponding effort as boat-days commencing from 1966.
The fishery shows high annual variations in landings (Fig. 1), probably related to changes in recruitment and stock size as Medley and Ninnes (1997) and Bethel et al. (2000) suggested. On the other hand, the variation observed is perhaps mainly due to the dynamics of the fleet related to the high cost of the fishing effort, which displays strong direct relationship between catch and effort (Fig 2).
Figure 1. Annual reported (data collected at landing sites) and total catches (comprising of landing and local consumption data) of the Turks and Caicos spiny lobster (Panulirus argus) fishery
32 Ministry of Natural Resources, South Base, Grand Turk, E-mail: [email protected].
0
1000
2000
3000
4000
5000
6000
7000
8000
1957
1960
1963
1966
1969
1972
1975
1978
1981
1984
1987
1990
1993
1996
1999
Catc
h (
ton
s)
reported total

163
Figure 2. Scatter plot showing a strong correlation of catch to effort for the spiny lobster fishery of the Turks and Caicos Islands, suggesting effort has a large influence in the fluctuation in landings experienced in the fishery
Nevertheless, cpue remains relatively stable around 58 kg/boat-day from 1985 to 2001 (Fig. 3), while fishing effort fluctuations cyclically with variability coefficients for the same period of 33.6 percent, 28.7 percent, and 17.7 percent for catch, effort and cpue respectively.
Figure 3. Annual variations in effort and cpue for the spiny lobster (Panulirus argus) fishery of the Turks and Caicos Islands
Size Composition of Catch
Analysis of size composition data of lobsters randomly sampled (at landing sites prior to processing) for the period 1989-1998 suggest that approximately 41.3 percent of the landings in numbers are comprised of undersized lobsters (Fig. 4). These numbers of undersized lobsters convert to 22.1 percent of the catch in weight, which is assumed to have been rejected by the processing plants and is possibly sold for local consumption. This assumption is further corroborated by the differences in size composition sampled compared to that of size composition processed and export by the processing plants (Fig. 5). This figure matches quite well with the difference between reported and total estimated catch (Fig. 1) calculated to be 21.6 percent for the same period of available size composition data (1989-1998). The current
0
1000
2000
3000
4000
5000
6000
7000
8000
0 2000 4000 6000 8000 10000
Effort (boat-days)
To
tal
Ca
tch
(to
ns
)
0
1000
2000
3000
4000
5000
6000
7000
8000
9000
10000
1957
1960
1963
1966
1969
1972
1975
1978
1981
1984
1987
1990
1993
1996
1999
Eff
ort
(b
oat-
days)
0
20
40
60
80
100
120
140
160
180
cp
ue (k
g/b
oat-d
ay)
Effort cpue

164
situation could be worse, taking into account that the difference between reported and total estimated catch is 37.7 percent for the period 1999-2001.
Figure 4. Mean size composition of catch in numbers of spiny lobster (Panulirus argus) for the period 1989-1998 in the fishery of the Turks and Caicos Islands. The vertical line shows minimum legal size of 83 mm
Figure 5. Relative length frequency distributions from sampling data of catch prior to processing and from export size categories for the period 1990-1994. The difference of 43.3 percent, which converts to 22.1 percent of the catch in weight, is believed to be sold for local consumption
Status of National Spiny Lobster Resource
Bio-Economic Status of Stock
A recent local consumption survey of tourist as well as the resident population was used in conjunction with annual statistics of tourism arrivals and local population in TCI to estimate
0
20000
40000
60000
80000
100000
40 50 60 70 80 90 100 110 120 130 140 150 160 170 180
Carapace length (m m)
Nu
mb
er o
f lo
bs
ters
in
th
e c
atc
h
0.00
0.02
0.04
0.06
0.08
0.10
0.12
0.14
0.16
45
-50
55
-60
65
-70
75
-80
85
-90
95
-10
0
10
5-1
10
11
5-1
20
12
5-1
30
13
5-1
40
14
5-1
50
15
5-1
60
16
5-1
70
17
5+
Carapace le ngth (m m )
Re
lati
ve
fre
qu
en
cy
plants
sampling

165
total consumption for the period 1957-2001 and summed with recorded landed catch to produce total catch estimates.
The time series of total catch and reported effort was then used to fit a dynamic version of the Schaefer (1954) surplus production model to estimate population parameters (Table 1) as carrying capacity (K), intrinsic growth rate (r) and catchability coefficient (q).
Table 1. Bio-economic parameters of the spiny lobster fishery of the Turks and Caicos Islands with 95 percent confidence intervals
Description Parameter Estimate Unit
Carrying capacity K 10 083 907 Pounds
Intrinsic growth rate r 0.335 Year –1
Catchability coefficient Q 3.220E-05
Price of species P 4.30 $US/pound
Cost of effort C 683.4 $US/boat day
Fleet dynamics parameters 4.647E-04
Additionally, the parameters from fitting of the Schaefer dynamic model (Fig. 6) and economic data obtained from stratified questionnaires that were presented to the fishers and processing plant managers was used to develop the Gordon-Schaefer dynamic bio-economic model.
Figure 6. Schaefer dynamic model fitted to the observed and estimated cpue data of the spiny lobster fishery of the Turks and Caicos Islands
The bio-economic model illustrates an open-access fishery, which in fact is the current system of operation but limited to nationals. Because of the high cost of the fishery, effort at the Maximum Economic Yield (fMEY) is much lower than effort at the Maximum Sustainable Yield (fMSY), while effort at the Bio-economic Equilibrium (fBE) and fMSY are closer. At the present, the fishery is near the Maximum Sustainable Yield (MSY) level, but the current fishing effort is higher than fMEY.
0
20
40
60
80
100
120
140
160
180
200
1956 1961 1966 1971 1976 1981 1986 1991 1996 2001
Years
CP
UE
(k
g/b
oa
t-d
ay
s)
cpue estimated cpue observed

166
The high cost resultant from elevated effort levels has reduced the current rent derived from the fishery to an extremely low level of US$773 295, which translates to approximately US$1.97 per kg of lobster (Table 7) compared to the estimated optimum potential of approximately US$1,092,803 (US$3.61/kg lobster) at the MEY level.
Figure 7. Static and dynamic trajectories of catch of the spiny lobster fishery of the Turks and Caicos Islands. Empty dots represent observed catch at effort data, the vertical lines represent effort levels at MEY, MSY and BE respectively from left to right
0
100000
200000
300000
400000
500000
600000
700000
800000
0 2000 4000 6000 8000 10000Effort (boat days)
Ca
tch
(k
g)
Dynamic model Observed CatchStatic model Current Catch
0
1000000
2000000
3000000
4000000
5000000
0 2000 4000 6000 8000 10000
Effort (boat days)
Bio
mass (
kg
)
Dynamic Biomass Static biomass
Observed Biomass Current situation

167
Figure 8. Static and dynamic trajectories of revenues for the spiny lobster fishery of the Turks and Caicos Islands. The vertical lines represent effort levels at MEY, MSY and BE respectively from left to right
Figure 9. Static and dynamic trajectories of profit for the Turks and Ciacos spiny lobster fishery. Although biologically the fishery is still sustainable, the high level of effort within the fishery dissipates the rent among the fishers, as such the fishery is operating a level higher than the MEY
-1200000
-700000
-200000
300000
800000
1300000
1800000
2300000
0 2000 4000 6000 8000 10000
Effort (boat days)
Re
nt
(US
$)
Dynamic model rent Static model rent MEY rent
Current rent MSY rent
0
1000000
2000000
3000000
4000000
5000000
6000000
7000000
0 2000 4000 6000 8000 10000
Effort (boat days)
Re
ve
nu
es
an
d C
os
ts (
US
$)
Dynamic model revenue Dynamic model cost
Current revenue Current cost
Static model revenue

168
Figure 10. Static and dynamic trajectories of biomass of the spiny lobster fishery of theTurks and Caicos Islands
Figures 7-10 show variations in catch, revenues, costs, profits and biomass resulting from the application of the static (broken lines) and dynamic (solid lines) versions of the Gordon-Schaefer model, as a function of fishing effort. Filled dots represent the current situation (1999-2001) for each variable. Vertical lines from left to right show reference points for Maximum Economic Yield (MEY), Maximum Sustainable Yield (MSY) and Bio-economic Equilibrium (BE).
0
1000000
2000000
3000000
4000000
5000000
0 2000 4000 6000 8000 10000
Effort (boat days)
Bio
mass (
kg
)
Dynamic Biomass Static biomass
Observed Biomass Current situation

169
Table 2. Reference points and current values for some fishery indicators
Unit
Catch MEY 302 329Catch MSY 379 563Catch BE 375 931Current catch 392 436
Kg
Effort MEY 2 852
Effort MSY 5 195
Effort BE 5 703
Current effort 4 279
Boat days
Effort MEY 119
Effort MSY 216
Effort BE 238
Current effort 198
Boats
Revenue MEY 2 888 919Revenue MSY 3 626 936
Revenue BE 3 592 231
Current revenue 3 751 693
$US
Cost MEY 1 796 116
Cost MSY 3 272 151
Cost BE 3 592 231
Current cost 2 978 397
$US
Profit MEY 1 092 803
Profit MSY 354785
Profit BE 0
Current profit 773 295Current profit/kg 1.97
$US
Biomass MEY 3 292 348Biomass MSY 2 268 879Biomass BE
Current biomass 2 430 277
Pounds
The model suggest that the current catch levels (Table 7) are still within sustainable levels, however the fishery has the potential of becoming unsustainable, surpassing the fMSY limit reference point given the current trend of increase in effective fishing effort. Should the fishery continue under the open-access system, the model predicts that the country could begin to experience negative economic results within the next five to eight years.
Figures 11-13 show projections for catch, revenues, and biomass under open-access system (solid lines) for the period 1956-2002 and with the effort reduction from 2003 to 2020. Horizontal lines represent the MEY level for each variable.
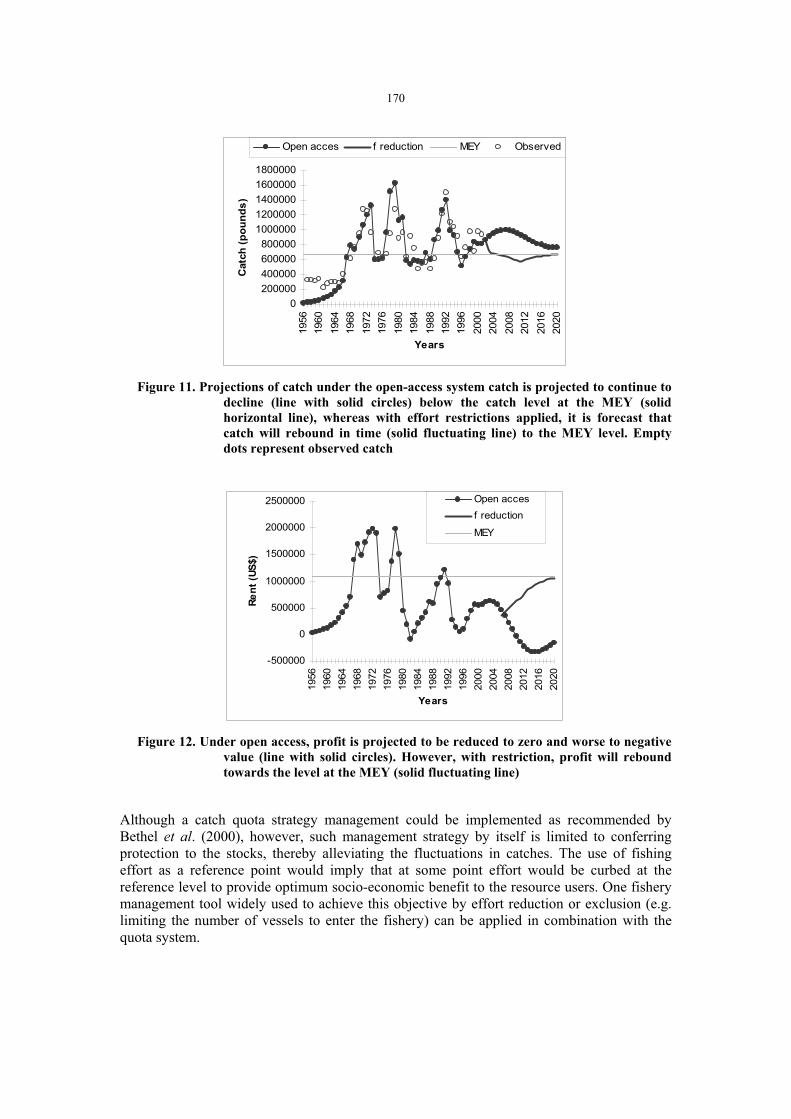
170
0
200000
400000
600000
800000
1000000
1200000
1400000
1600000
1800000
1956
1960
1964
1968
1972
1976
1980
1984
1988
1992
1996
2000
2004
2008
2012
2016
2020
Years
Catc
h (
po
un
ds
)
Open acces f reduction MEY Observed
Figure 11. Projections of catch under the open-access system catch is projected to continue to decline (line with solid circles) below the catch level at the MEY (solid horizontal line), whereas with effort restrictions applied, it is forecast that catch will rebound in time (solid fluctuating line) to the MEY level. Empty dots represent observed catch
-500000
0
500000
1000000
1500000
2000000
2500000
1956
1960
1964
1968
1972
1976
1980
1984
1988
1992
1996
2000
2004
2008
2012
2016
2020
Years
Re
nt
(US
$)
Open acces
f reduction
MEY
Figure 12. Under open access, profit is projected to be reduced to zero and worse to negative value (line with solid circles). However, with restriction, profit will rebound towards the level at the MEY (solid fluctuating line)
Although a catch quota strategy management could be implemented as recommended by Bethel et al. (2000), however, such management strategy by itself is limited to conferring protection to the stocks, thereby alleviating the fluctuations in catches. The use of fishing effort as a reference point would imply that at some point effort would be curbed at the reference level to provide optimum socio-economic benefit to the resource users. One fishery management tool widely used to achieve this objective by effort reduction or exclusion (e.g. limiting the number of vessels to enter the fishery) can be applied in combination with the quota system.

171
0
2000000
4000000
6000000
8000000
10000000
12000000
1956
1960
1964
1968
1972
1976
1980
1984
1988
1992
1996
2000
2004
2008
2012
2016
2020
Years
Bio
mas
s (
po
un
ds
)
Open acces
f reduction
MEY
Figure 13. It is also projected that biomass will continue to be low under open access (line with solid circles), whereas with effort restriction, biomass will rebound to a sustainable level at the MEY (solid fluctuating line)
Depending on the possibilities, the priorities and the common objectives for users and managers, a gradual restriction in the number of licenses could be implemented to decrease the number of boats from the current level of 198 to a sustainable level of 119 over a proposed 10-year period.
Austin (1986) aptly pointed out that limiting the number of licenses itself may not prevent biological overfishing because only the apparent effort has been managed and this in fact may have negligible impact on stock protection and management. Nevertheless, if used in conjunction with attempts to limit effective effort such as technological improvements (e.g. boat size), limiting the number of licenses can assist in achieving biological and economic objectives.
Social and Economic Status and Importance of Fisheries
In terms of production, employment, exports and government revenue, the fishing industry (lobster and conch fishery) remains an important sector in the Turks and Caicos Islands. Annual value of production (including domestic consumption) is estimated at about US$4 million or about 10 percent of the country’s GDP (Clerveaux, 2002).
The fishing industry despite its declining contribution to the economy still remains an integral part of the lives of the people of the Turks and Caicos Islands, providing direct employment for approximately 8 percent of the country’s labour force in the harvesting (370 fishers) and processing (80 processing workers) sector. Bennett et al. (2000) and Bennett and Clerveaux (2001) recognized the fishing industry as a major employer largely replacing a national welfare system providing employment not only for the established full-time fishers, but also for a large number of part-time fishers who derive a small but significant income from fishing.

172
Table 3. Performance of the fisheries sector of the Turks and Caicos Islands, 1990-1999. (The Gross Domestic Production, GDP, estimates are inclusive of spiny lobster as well as queen conch fisheries)
Year GDP U.S. Import (kg) Value (US$)
1990 5.1 89 413 1 590 525
1991 6.5 134 965 2 830 648
1992 6.8 199 829 3 994 107
1993 5.7 123 727 2 108 962
1994 4.6 94 624 2 085 583
1995 4 87 682 1 833 820
1996 2.5 51 282 793 390
1997 - 83 857 977 180
1998 2.6 73 035 1 090 870
1999 2.1 81 361 1 318 755
2000 99 619 1 810 590
Sum 1 119 394 20 434 430
Sources: Caribbean Development Bank estimates from Department of Environment & Coastal Recources (TCI Gov.).
The importance of the fishing industry, in particular the lobster fishery, which generates the greatest economic return is further accentuated on the lesser developed Caicos Islands, principally the Island of South Caicos. Here, the fishing industry is highly influential and acts as the core, providing economic stability maintaining the structure and cohesion of the community (Whitmarsh, 1998). Clerveaux (2002) discovered that over 75 percent of the working population on the Island of South Caicos is directly or indirectly dependent on the fishing industry (e.g. processing plant workers, fuel station, bars, clubs, shops and restaurant owners), which is most emphatically expressed during the closed season for the lobster industry.
Conclusion and Recomendations
GIVEN the lack of systematic information on size composition from sampling programmes, it is very important to reconstruct a long, historical and continuous time series of annual results of export size categories from the processing plants. It will allow modelling the population dynamics with more detailed methods. At least from now on, this data should be recorded from all the plants.
Some fishery independent indexes should be collected, as the juvenile abundance in nursery areas, and adult abundance in the fishing areas. Also the length composition and other biological data of landed lobsters must be systematically collected.
It is also important to improve compliance of the minimum legal size to avoid growth overfishing. Despite the advances made in research, monitoring and stock status assessment, effective management of the Turks and Caicos spiny lobster fishery may not be achieved until a clearly

173
stated policy for the management of the resource is formulated or revamped by the decision makers in collaboration with the resources users.
Such undertaking would foster amicable management goals, which do not produce conflict between political and environmental goals with consideration of the resource users. In addition, a formulated policy for the management of the fishery would direct future research of identifying other possible indicators and reference, target and limit reference points such as expected yield at the MEY, earnings per fisher, minimum income, employment, increase in GDP and rent of the fishery.
References
Austin, C.B. 1986. How to measure the potential advantages of limited entry. Proc. Gulf
Carib. Fish. Inst. 39: 12-22.
Bethel, G.; Cruz, R.; Deleveaux, V. ; Harper, D.; Luckhurst, B.; Joseph, W.; Medley, P. & Muller, R. 2001. Lobster assessment report. Region 4: Bahamas, Bermuda, North Cuba, St. Lucia, Turks and Caicos Islands and the United States of America. FAO
Fisheries Report No. 619: 91-114.
Bennett, E.; Neiland, A.; Anang, E.; Bannerman, P.; Atiq Rahman, A.; Huq, S.; Bhuiya,S.; Day, M. & Clerveaux, W. 2001. Towards a better understanding of conflict management in tropical fisheries: Evidence from Ghana, Bangladesh and the Caribbean. Marine Policy 25 (5): 365-376.
Bennett, E & Clerveaux, W. 2001. Size matters: Fisheries and social capital on the Turks and Caicos Islands. Proc. Gulf Carib. Fish. Inst. 54: (in press).
Clerveaux, V. 2002. The impact of tourism growth on the fishing industry in the Turks and Caicos Islands. In fulfillment of the M.A.; University of West Indies, Jamaica.
Caddy, J.F. & Mahon, R. 1995. Reference points for fisheries management. FAO Fisheries
Technical Paper No. 347. 83 p.
Medley, P.A.H. & Ninnes, C.H. 1997. A recruitment index and population model for spiny lobster (Panulirus argus) using catch and effort data. Canadian Journal of Fisheries
and Aquatic Sciences 54: 1414-1421.
Puga, R.; de León, M.E.; González-Yáñez, A.A. & Baisre, J.A. (in press). Aplicación de un modelo dinámico de biomasa en la evaluación de la pesquería de langosta en Cuba. Revista Cubana de Investigaciones Pesqueras.
Schaefer, M.B. 1954. Some aspects of the dynamics of populations important to the management of commercial marine fisheries. Bull. Inter-Amer. Trop. Tuna Comm. 1: 27-56.
Seijo, J.C. & Caddy, J.F. 2000. Uncertainty in bio-economic reference points and indicators of marine fisheries. Mar. Freshwater Res. 51: 477-83.
Seijo, J.C., Defeo, O. & Salas, S. 1998. Fisheries bio-economics. Theory, modelling and management. FAO Fisheries Technical Paper. No. 368. 108 p.

174
Smith, V. L. 1969. On models of commercial fishing. Journal of Politic Economics 77: 181-198.
Sparre, P. J. & Willman, R. 1992. Software for bio-economic analysis of fisheries. BEAM 4. Analytical bio-economic simulation on space-structured multi-species and multi-fleet fisheries. Description of model. FAO Computerized Information Series
(Fisheries). No. 3. Vol 1: 86 p.
175
15. LA PESQUERÍA DE LA LANGOSTA EN VENEZUELA
Gabriel J. Gómez G.33
Antecedentes
A pesar de la importancia del recurso langosta en Venezuela, los estudios dirigidos al mismo son escasos; estos han abordado aspectos de la biología, producción y pesquería. Se citan los trabajos de Cobo et al. (1972), Ginez et al. (1978), Ginez y Rodríguez (1979), Hauschild y Weil (1983), Soriano (1984), Hauschild y Laughlin (1985), González (1987), Posada et al.
(1989, 1996), Iriarte (1999), Yallonardo et al. (2001), Losada-Tosteson y Posada (2001) y finalmente, la Fundación Científica Los Roques (1989), que además de los tópicos señalados abordaron aspectos ambientales y socioeconómicos. Los estudios mencionados están referidos al Archipiélago los Roques. Mientras que otros trabajos relacionados con el ámbito biológico y pesquero de la langosta fueron realizados por García (1985) y Gómez et al. (1999), en el archipiélago Los Testigos. Por otro lado Andrade de Pasquier, et al. (2001), reporta evaluaciones preliminares de la pesqueria que indican un nivel avanzado de mortalidad de pesca del recurso.
Descripción de la Pesquería
La langosta espinosa Panulirus argus, en Venezuela, representa un recurso de significativa importancia pesquera y comercial, su pesca, exclusivamente artesanal data de muchos años y se ha ido intensificando en el tiempo; fundamentalmente en dos áreas, el Parque Nacional Archipiélago Los Roques (PNALR), ubicado entre los 11° 48’ y 11° 58’ de latitud norte y 66° 32’ y 66° 52’ de longitud oeste, de donde proviene aproximadamente la mitad (48 %) de la captura nacional de este crustáceo y el Archipiélago Los Testigos, ubicado al noreste de la Isla de Margarita y al norte de la Península de Paria, entre los 11° 20’ 24’’ y 11° 24’ 53’’ de latitud norte y los 63° 08’ 24’’ y 63° 02’ 24’’ de longitud oeste, que aporta entre un 41 por ciento del total, mientras que el otro 10 percent es aportado por los estados Zulia (8 %) y Sucre (3 %). Al parecer en los estados Falcón y Aragua existe una importante pesquería de langosta que escapa del control oficial.
Las estadísticas de producción pesquera nacional (1985-1999), indican que en promedio la langosta aporta 445 toneladas por año de peso total, lo cual representa un 5,48 por ciento de la producción total nacional de crustáceos y un 0,14 por ciento de la producción marítima nacional. No obstante a ello, el recurso mantiene su importancia por cuanto además de los empleos directos e indirectos que genera, representa un aporte importante de divisas para el país.
La actividad pesquera de la langosta es realizada por tres categorías de embarcaciones: Peñeros (7-9 m). Lanchas o Tres Puños (10-12 m), en menor grado. Lanchas hieleras (13-18 m), que se dedican al transporte y comercialización de la langosta viva. Los artes de pesca utilizados son: el filete o tren de enmalle (prohibido desde 1994), buceo a pulmón libre y nasas.
33 Laboratorio de pesca artisanal, Apartado Postal 236, Cumana, Venezuela, E-mail: [email protected] o [email protected].

176
La serie histórica de datos de captura, caracterizada por un período de fluctuaciones entre 1985 y 1991, muestra un incremento significativo de producción total de langosta a partir de 1992 (370 toneladas), manteniéndose alrededor de 697 toneladas (promedio anual) entre 1993 y 1999, con oscilaciones entre 611 y 940 toneladas.
Medidas para el Manejo
La administración de los recursos pesqueros es realizada por el Ministerio de Agricultura y Tierra (MAT) a través del Instituto Nacional de Pesca y Acuicultura (INAPESCA).
La resolución de pesca que regula la explotación del recurso langosta, signada como MAC-113, data del 20 de abril de 1990, y contempla los siguientes aspectos:
Temporada de veda (1ro de mayo al 31 de octubre). Permisos de pesca son anuales e intransferibles (desde 1994 no se otorgan permisos a nuevos pescadores). Los permisos se otorgan a nombre del patrón de pesca y la embarcación: se establece la temporada de pesca, área de pesca y arte usado (1 tipo por patrón). Se permitían 200 nasas por patrón (1972-1993), pero desde 1994 solamente 100 nasas. (Para el Archipiélago Los Roques actualmente se permiten hasta 200 nasas/patrón). Talla mínima de captura permitida 120 mm de LCF desde 1994 (100 mm de LCF hasta 1993). Peso mínimo de captura 1 kg total/ejemplar. Se prohíbe la captura de hembras ovadas. Se prohíbe la captura con señuelos. Se exigen registro de capturas en los centros de acopio del recurso (Funcionarios del gobierno). Se exige el marcaje de las nasas permitidas para la pesca (al inicio de la temporada de pesca y al final de la misma). Se controla el transporte de langosta (Guías certificadas de movilización) a transportistas autorizados.
Los controles establecidos requieren de mayor rigurosidad para su cumplimiento, lo que implica un mayor apoyo logístico por parte del sector gubernamental. A pesar los esfuerzos que se hacen al respecto, existe un porcentaje significativo del producto no reflejado en las estadísticas nacionales; este ha sido estimado entre 10 y 12 por ciento (Andrade, 1998); probablemente esta cifra sea superior.
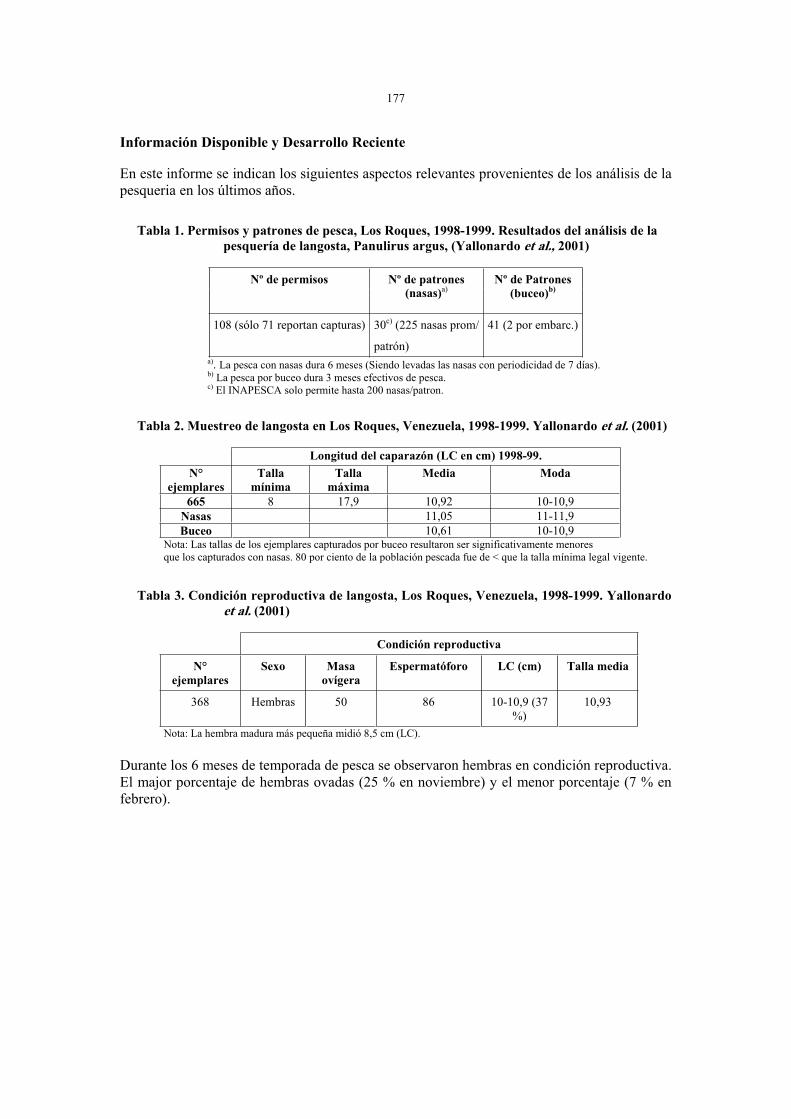
177
Información Disponible y Desarrollo Reciente
En este informe se indican los siguientes aspectos relevantes provenientes de los análisis de la pesqueria en los últimos años.
Tabla 1. Permisos y patrones de pesca, Los Roques, 1998-1999. Resultados del análisis de la pesquería de langosta, Panulirus argus, (Yallonardo et al., 2001)
Nº de permisos Nº de patrones (nasas)a)
Nº de Patrones (buceo)b)
108 (sólo 71 reportan capturas) 30c) (225 nasas prom/
patrón)
41 (2 por embarc.)
a). La pesca con nasas dura 6 meses (Siendo levadas las nasas con periodicidad de 7 días). b) La pesca por buceo dura 3 meses efectivos de pesca. c) El INAPESCA solo permite hasta 200 nasas/patron.
Tabla 2. Muestreo de langosta en Los Roques, Venezuela, 1998-1999. Yallonardo et al. (2001)
Longitud del caparazón (LC en cm) 1998-99.
N°ejemplares
Talla mínima
Talla máxima
Media Moda
665 8 17,9 10,92 10-10,9 Nasas 11,05 11-11,9 Buceo 10,61 10-10,9
Nota: Las tallas de los ejemplares capturados por buceo resultaron ser significativamente menores que los capturados con nasas. 80 por ciento de la población pescada fue de < que la talla mínima legal vigente.
Tabla 3. Condición reproductiva de langosta, Los Roques, Venezuela, 1998-1999. Yallonardo et al. (2001)
Condición reproductiva
N° ejemplares
Sexo Masa ovígera
Espermatóforo LC (cm) Talla media
368 Hembras 50 86 10-10,9 (37 %)
10,93
Nota: La hembra madura más pequeña midió 8,5 cm (LC).
Durante los 6 meses de temporada de pesca se observaron hembras en condición reproductiva. El major porcentaje de hembras ovadas (25 % en noviembre) y el menor porcentaje (7 % en febrero).
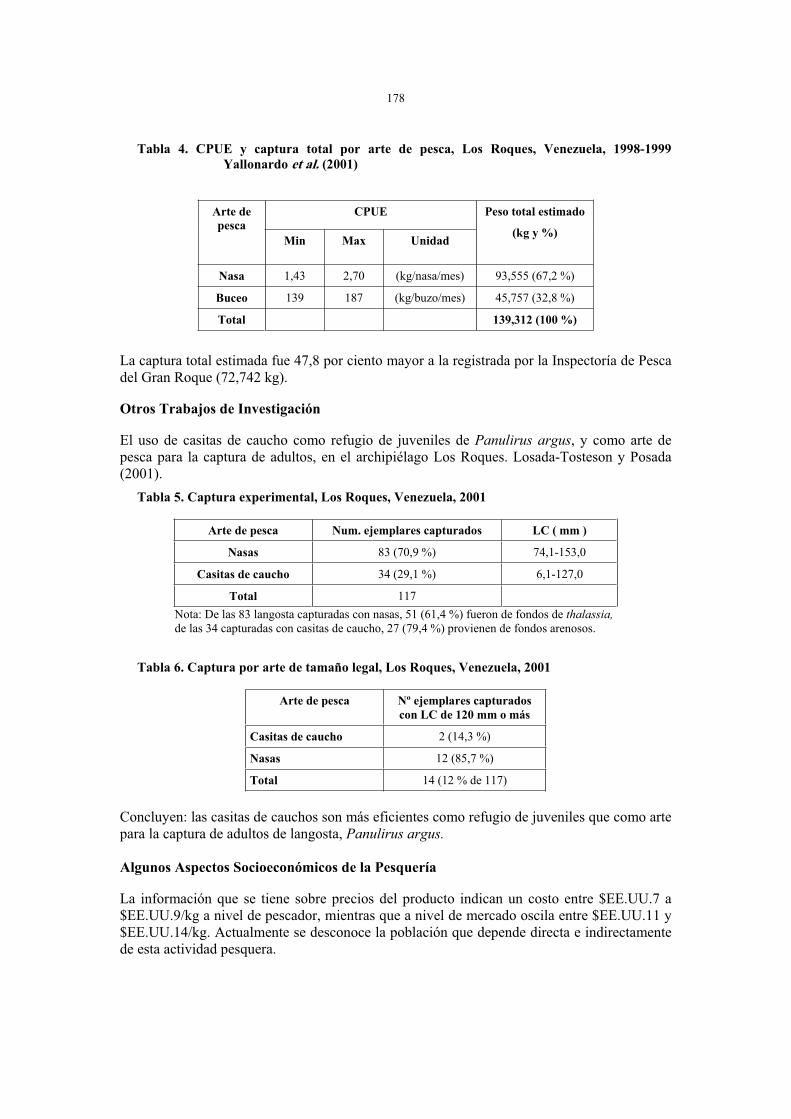
178
Tabla 4. CPUE y captura total por arte de pesca, Los Roques, Venezuela, 1998-1999 Yallonardo et al. (2001)
La captura total estimada fue 47,8 por ciento mayor a la registrada por la Inspectoría de Pesca del Gran Roque (72,742 kg).
Otros Trabajos de Investigación
El uso de casitas de caucho como refugio de juveniles de Panulirus argus, y como arte de pesca para la captura de adultos, en el archipiélago Los Roques. Losada-Tosteson y Posada (2001).
Tabla 5. Captura experimental, Los Roques, Venezuela, 2001
Arte de pesca Num. ejemplares capturados LC ( mm )
Nasas 83 (70,9 %) 74,1-153,0
Casitas de caucho 34 (29,1 %) 6,1-127,0
Total 117
Nota: De las 83 langosta capturadas con nasas, 51 (61,4 %) fueron de fondos de thalassia,
de las 34 capturadas con casitas de caucho, 27 (79,4 %) provienen de fondos arenosos.
Tabla 6. Captura por arte de tamaño legal, Los Roques, Venezuela, 2001
Arte de pesca Nº ejemplares capturados con LC de 120 mm o más
Casitas de caucho 2 (14,3 %)
Nasas 12 (85,7 %)
Total 14 (12 % de 117)
Concluyen: las casitas de cauchos son más eficientes como refugio de juveniles que como arte para la captura de adultos de langosta, Panulirus argus.
Algunos Aspectos Socioeconómicos de la Pesquería
La información que se tiene sobre precios del producto indican un costo entre $EE.UU.7 a $EE.UU.9/kg a nivel de pescador, mientras que a nivel de mercado oscila entre $EE.UU.11 y $EE.UU.14/kg. Actualmente se desconoce la población que depende directa e indirectamente de esta actividad pesquera.
CPUEArte de pesca
Min Max Unidad
Peso total estimado
(kg y %)
Nasa 1,43 2,70 (kg/nasa/mes) 93,555 (67,2 %)
Buceo 139 187 (kg/buzo/mes) 45,757 (32,8 %)
Total 139,312 (100 %)

179
Tabla 7. Costo de la unidad e insumos de pesca
Lanchas y nasas Costo
(Bolivar)
Vida util (Años)
Depreciación lineal (Bolivar)
Lancha 12 m de eslora 32 000 000 20 1 600 000
Motor (220 HP) 18 000 000 12 1 500 000
Peñero 8 m de eslora 3 000 000 15 200 000
Motor (75 HP) 5 000 000 1 1/2 2 600 000
Nasas
Rollo de Alambre 480 000
12 nasas /rollo 52 000 (c/u) incluyendo otros
materiales
Temporada de pesca
1$EE.UU. = 1 400 Bolivares.
Aspectos Socioeconomicos (temporada de pesca en Los Roques, 1998-99)
Sistema de repartición de utilidades, pesca con nasas
El 50 por ciento corresponde al dueño de las nasas (se deduce el costo de la depreciación de las mismas). El otro 50 por ciento se distribuye así:
2 partes dueño de la embarcación (se deducen costos de mantenimiento, de depreciación de la embarcación y motor, así com costo de permiso de pesca); 1 parte al patrón; 1 parte por cada marino.
Sistema de repartición de utilidades, pesca por buceo
2 partes corresponden al dueño de la embarcación (se deducen costos de mantenimiento, de depreciación de la embarcación y motor y costo de permiso de pesca).1 parte para el patrón; 1 parte para cada buzo o marino.
Ingreso economico estimado (1998-99)
Pesca con Nasas: Ingreso bruto por UEP = 15 592 500 Bs ($EE.UU.10 753).
Pesca por Buceo: Ingreso bruto por UEP = 5 580 121 Bs ($EE.UU.3 848).
Nota: Generalmente los patrones son dueños de las nasas y embarcaciones por lo que en la relación ganancia o utilidad es: 5:1 (pesca con nasas) y 3:1 (por buceo).
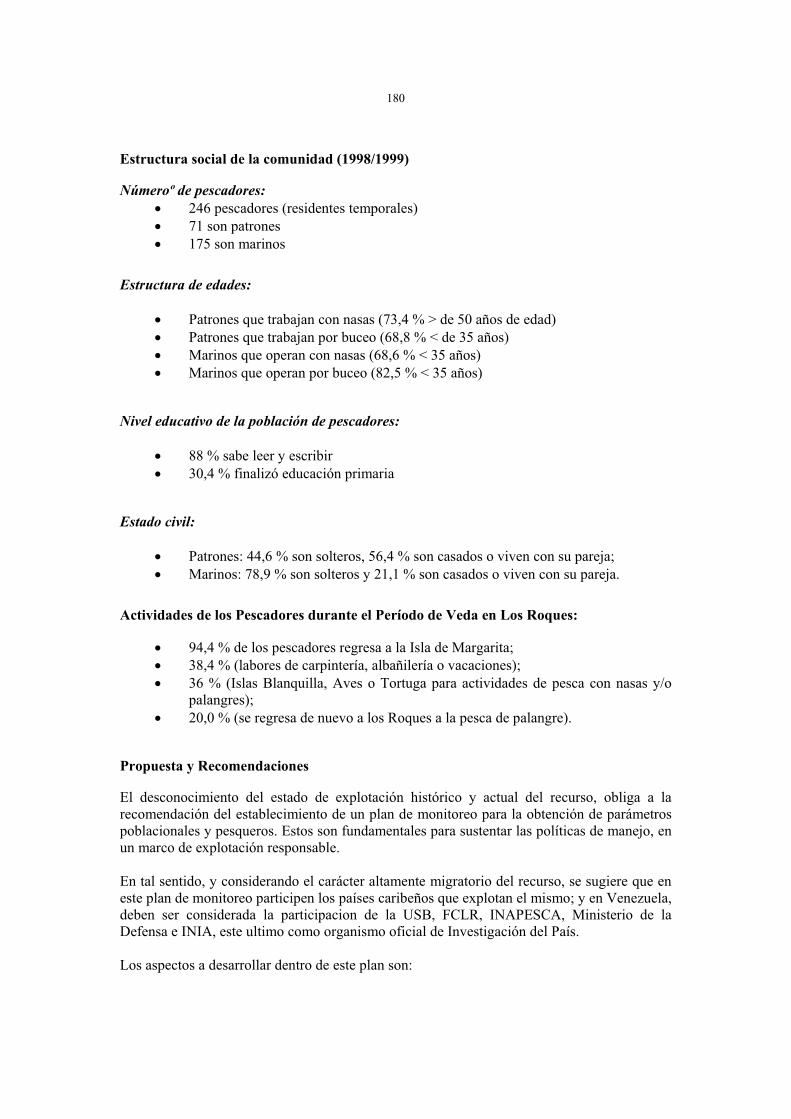
180
Estructura social de la comunidad (1998/1999)
Númeroº de pescadores:
246 pescadores (residentes temporales) 71 son patrones 175 son marinos
Estructura de edades:
Patrones que trabajan con nasas (73,4 % > de 50 años de edad) Patrones que trabajan por buceo (68,8 % < de 35 años) Marinos que operan con nasas (68,6 % < 35 años) Marinos que operan por buceo (82,5 % < 35 años)
Nivel educativo de la población de pescadores:
88 % sabe leer y escribir 30,4 % finalizó educación primaria
Estado civil:
Patrones: 44,6 % son solteros, 56,4 % son casados o viven con su pareja; Marinos: 78,9 % son solteros y 21,1 % son casados o viven con su pareja.
Actividades de los Pescadores durante el Período de Veda en Los Roques:
94,4 % de los pescadores regresa a la Isla de Margarita; 38,4 % (labores de carpintería, albañilería o vacaciones); 36 % (Islas Blanquilla, Aves o Tortuga para actividades de pesca con nasas y/o palangres);20,0 % (se regresa de nuevo a los Roques a la pesca de palangre).
Propuesta y Recomendaciones
El desconocimiento del estado de explotación histórico y actual del recurso, obliga a la recomendación del establecimiento de un plan de monitoreo para la obtención de parámetros poblacionales y pesqueros. Estos son fundamentales para sustentar las políticas de manejo, en un marco de explotación responsable.
En tal sentido, y considerando el carácter altamente migratorio del recurso, se sugiere que en este plan de monitoreo participen los países caribeños que explotan el mismo; y en Venezuela, deben ser considerada la participacion de la USB, FCLR, INAPESCA, Ministerio de la Defensa e INIA, este ultimo como organismo oficial de Investigación del País.
Los aspectos a desarrollar dentro de este plan son:
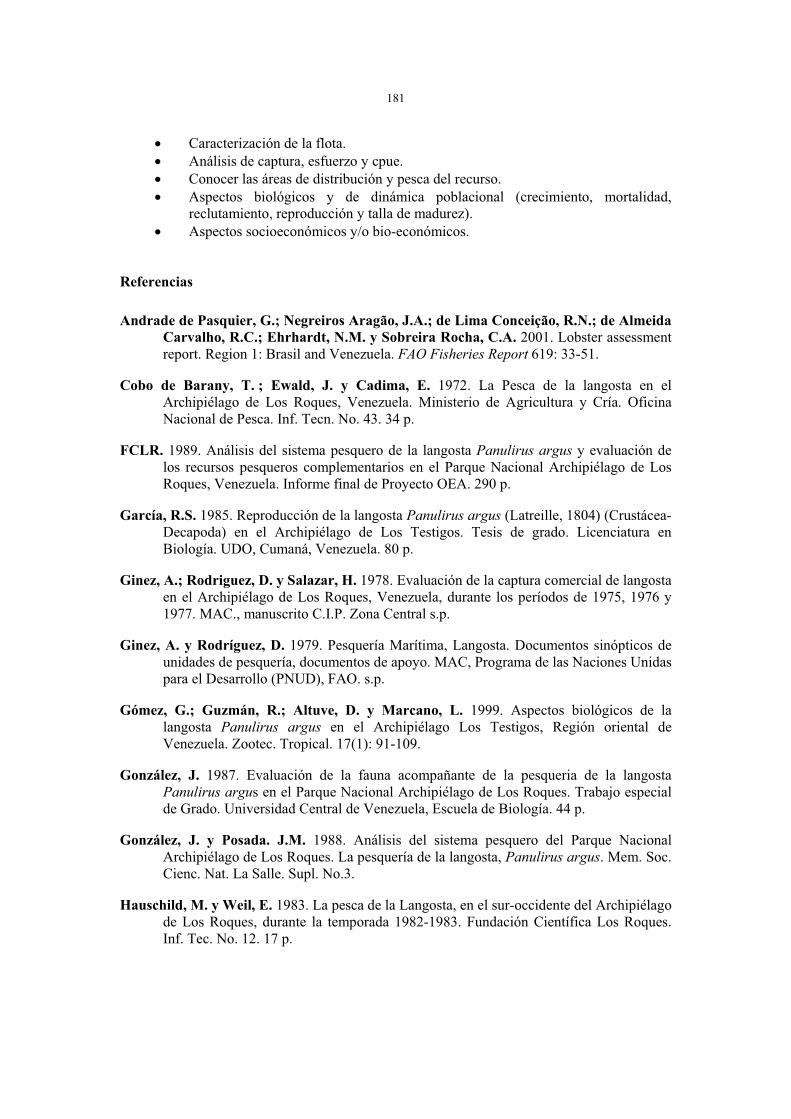
181
Caracterización de la flota. Análisis de captura, esfuerzo y cpue. Conocer las áreas de distribución y pesca del recurso. Aspectos biológicos y de dinámica poblacional (crecimiento, mortalidad, reclutamiento, reproducción y talla de madurez). Aspectos socioeconómicos y/o bio-económicos.
Referencias
Andrade de Pasquier, G.; Negreiros Aragão, J.A.; de Lima Conceição, R.N.; de Almeida Carvalho, R.C.; Ehrhardt, N.M. y Sobreira Rocha, C.A. 2001. Lobster assessment report. Region 1: Brasil and Venezuela. FAO Fisheries Report 619: 33-51.
Cobo de Barany, T. ; Ewald, J. y Cadima, E. 1972. La Pesca de la langosta en el Archipiélago de Los Roques, Venezuela. Ministerio de Agricultura y Cría. Oficina Nacional de Pesca. Inf. Tecn. No. 43. 34 p.
FCLR. 1989. Análisis del sistema pesquero de la langosta Panulirus argus y evaluación de los recursos pesqueros complementarios en el Parque Nacional Archipiélago de Los Roques, Venezuela. Informe final de Proyecto OEA. 290 p.
García, R.S. 1985. Reproducción de la langosta Panulirus argus (Latreille, 1804) (Crustácea-Decapoda) en el Archipiélago de Los Testigos. Tesis de grado. Licenciatura en Biología. UDO, Cumaná, Venezuela. 80 p.
Ginez, A.; Rodriguez, D. y Salazar, H. 1978. Evaluación de la captura comercial de langosta en el Archipiélago de Los Roques, Venezuela, durante los períodos de 1975, 1976 y 1977. MAC., manuscrito C.I.P. Zona Central s.p.
Ginez, A. y Rodríguez, D. 1979. Pesquería Marítima, Langosta. Documentos sinópticos de unidades de pesquería, documentos de apoyo. MAC, Programa de las Naciones Unidas para el Desarrollo (PNUD), FAO. s.p.
Gómez, G.; Guzmán, R.; Altuve, D. y Marcano, L. 1999. Aspectos biológicos de la langosta Panulirus argus en el Archipiélago Los Testigos, Región oriental de Venezuela. Zootec. Tropical. 17(1): 91-109.
González, J. 1987. Evaluación de la fauna acompañante de la pesqueria de la langosta Panulirus argus en el Parque Nacional Archipiélago de Los Roques. Trabajo especial de Grado. Universidad Central de Venezuela, Escuela de Biología. 44 p.
González, J. y Posada. J.M. 1988. Análisis del sistema pesquero del Parque Nacional Archipiélago de Los Roques. La pesquería de la langosta, Panulirus argus. Mem. Soc. Cienc. Nat. La Salle. Supl. No.3.
Hauschild, M. y Weil, E. 1983. La pesca de la Langosta, en el sur-occidente del Archipiélago de Los Roques, durante la temporada 1982-1983. Fundación Científica Los Roques. Inf. Tec. No. 12. 17 p.

182
Hauschild, M. y Laughlin, R. 1985. Análisis de la Pesquería de Langosta, Panulirus argus
en el Parque Nacional Archipiélago de Los Roques, durante la temporada 1983-1984. Fundación Científica Los Roques. Inf. Tec. No. 14. 31 p.
Losada-Tosteson, V. y Posada, J.M. 2001. Using tyres as shelters for the protection of juvenile spiny lobsters, Panulirus argus, or as a fishing gear for adults. Marine and
Freshwater Research 52(8): 1445-1450.
Losada-Tosteson, V., Posada, J.M. y Losada, F. 2001. Size and reproductive status of fished spotted spiny lobster, Panulirus guttatus, in Morrocoy National Park, Venezuela: a preliminary report. Marine and Freshwater Research 52(8): 1599-1603.
Soriano, M. 1984. Biología y pesquería de la langosta Panulirus argus (Latreille). Tesis de Licenciatura en Biología, U.C.V. 2-4 p.
Yallonardo, M.; Posada, J.M. y Schweizer, D.M. 2001. Current status of the spiny lobster, Panulirus argus, fishery in the Los Roques Archipelago National Park, Venezuela. Marine and Freshwater Research 52(8): 1615-1622.